Embed Size (px)
Citation preview

Advancing Tax Administration June 19, 2014
An IRS-TPC Research Conference:
Advancing Tax Administration
Advancing Tax Administration June 19, 2014
Welcome
Eric Toder Institute Fellow: Urban Institute, and
Co-Director: Urban-Brookings Tax Policy
Center
Rosemary Marcuss Director: IRS Office of Research, Analysis,
and Statistics
John A. Koskinen Commissioner of Internal Revenue

Advancing Tax Administration June 19, 2014
Session 1: Taxpayer Compliance Costs and Tax Administration
Moderator:
Brenda Schafer
IRS, RAS, Office of Research
Improving Form 1098T: How a Revised Form
Could Increase Take-Up, Improve Compliance
and Lower Taxpayer Burden
Deena Ackerman
Office of Tax Analysis, US Treasury
Convenience Is Necessary for Pension
Participation by the Poor
Valrie Chambers
Texas A & M University – Corpus Christi
The Compliance Costs of IRS Post-Filing
Processes
Ronald Hodge
IRS, RAS, Office of Research
Discussant: Robert Weinberger
Aspen Institute Initiative on Financial Security

Improving Form 1098T How a Revised Form could Increase Take-Up,
Improve Compliance, and Lower Taxpayer Burden
Deena Ackerman
Julie-Anne Cronin
Nick Turner
Office of Tax Analysis, US Treasury
The views and opinions expressed are those of the authors and do not necessarily represent official Treasury positions or policy. Comments are welcome, as are suggestions for improvements, and should be directed to the authors.

Form 1098T is… • Filed annually by nearly all post-secondary
education institutions for most students.
• Used by IRS to verify education spending for education related tax benefits.
– main or only source of information about student status,
expenses and scholarships.
• Used by taxpayers to fill out Form 8863.
• Falls short of its potential.
– Improvements could make this form more useful. 5

Education Benefits and 1098Ts (Average of 2010 and 2011 returns) 26% of returns claiming AOTC have no Form 1098T.
0.0
5.0
10.0
15.0
20.0
AOTC
Retu
rns (
mill
ions
)
With 1098-T No 1098-T
37% of returns1 with 1098T claim no benefit.
0
5
10
15
20
1098T
Retu
rns (
mill
ions
)
Claims Benefit No Claim
1 Returns in income range for tuition deduction 6

Return Characteristics By Presence of Form 1098T
Characteristic With Benefit No
1098T
With Benefit With
1098T
No Benefit With
1098T
Student is Dependent 23% 48% 51%
Average AGI (2011 dollars) $33,610 $53,136 $39,625
Average balance due/refund (2011 dollars) -$3,651 -$3,172 -$2,866
Fraction w/ joint filing status 24% 50% 44%
Fraction w/ paid tax preparation 54% 52% 53%
Fraction of all returns with 1098T 63% 37%
Fraction of all returns with AOTC, LLC or
TD
26% 74%
7
Note: The first two columns includes all returns with credits, regardless of income. The third column excludes returns with incomes in excess of the income limits for the tuition deduction.

Information Reported on Form 1098T Summary Statistics (2011)
Box Mean of Non-Zero
Values
Percent with Non-Zero
Value
1. Payments Received $5,203 19.1
2. Payments Billed $23,650 76.1
3. Change in Reporting Method 2.4
4. Prior year adjustments to Box 1 or Box 2 $1,284 7.2
5. Scholarships or Grants $5,664 49.2
6. Prior year adjustments to Box 5 $1,349 1.5
8. At least half time student 80.7
9. Graduate Student 13.7
10. Insurance Contract Refund $3,215 0.1
8

Challenges and Solutions • Challenge 1: Not all students receive a 1098T.
• Challenge 2: Expenses cannot be determined using 1098T.
• Challenge 3: Incomplete reporting of scholarships
• Challenge 4: Cannot identify full-time students
• Solutions: Expand reporting, collect what IRS and taxpayers need for filing and administration
9

0
200
400
600
800
Cou
nt (1
000s
)
0 30000 60000 90000 120000 150000 180000AGI ($2011)
Claims Benefit, has 1098-T Claims Benefit, no 1098-T
Does not claim Benefit, has 1098-T
AOTC Claims with and without a 1098T in 2010 and 2011
10

Challenge 1: Not all students receive a Form 1098T • Solution: Expand reporting to include most students.
– Imposes little risk of noncompliance: • Full scholarship students
• Group billing students
• US students abroad
– Consider options for those remaining: • Non degree students
• Institutional noncompliance
Universal reporting would allow the IRS to identify all students, and by extension non-students.
11

Challenge 2: Expenses cannot be determined using Form 1098T • Solution A: Require reporting of tuition paid and not tuition
billed (eliminate Box 2)
– Moves reporting closer to the definition of qualifying expense for all credits.
– FY2015 Administration Budget Proposal
• Solution B: Consider options for limiting expenses not known by the school
– Present more information to students, cap expenses
Would make Form 8863 worksheets simpler, since taxpayers would have better information. 12

Challenge 3: Scholarship reporting is incomplete, rules imprecise Schools only report scholarships that they “administer and process.”
• Solution A: define administered and processed to be any scholarship paid via the school and
• Solution B: impose new reporting requirement on all organizations that provide scholarships directly to the student
– New burden on scholarship providers
– May improve accuracy of taxpayer claims.
– FY2015 Administration Budget Proposal 13

Challenge 4: Cannot identify full-time students Child related benefits extend through 23 for full-time dependent students, but this is not reported.
• Solution: Expand checkboxes to include…
– full-time, part-time in addition to at least half-time, and
– indicator that student attended for required 5 month
May improve IRS’ ability to confirm child dependency status and eligibility for benefits that rely on this.
14

An improved 1098T could simplify a complex worksheet (Form 8863) • Example 1 – clearer wording
– Line 24 on current 8863:
Was the student enrolled at least half-time for at least one academic period that began in 2013 at an eligible educational institution in a program leading towards a postsecondary degree, certificate, or other recognized postsecondary education credential? (see instructions)
– Improved Line 24:
Is Box 8 checked?
15

An improved 1098T could simplify a complex worksheet (Form 8863) (cont) • Example 2 – new worksheet guides taxpayer toward
right allocation of expenses.
– Nearly all required information is available on 1098T(s).
– Simple questions based on this information can help identify taxpayers who may want to include scholarship funds in income in order to maximize tax credits.
16

17
Line 1 Payments for qualified tuition and fees <Box 1 of 1098T>
Line 2 Expenses for course related materials <provided by taxpayer>
Line 3 Payments for qualified tuition and related expenses before scholarships <Add lines 1 and 2>
Line 4 Scholarships <Box 5 of 1098T>
Line 6 Payments for qualified tuition and related expenses net of scholarships <Line 3 minus Line 4>
Line 7 Check only one box
a. Line 6 is greater than or equal to $4,000, □STOP STOP
Enter $4,000 on line 27 of Form 8863.
Do not include any scholarships in the
student’s gross income.
b. Line 6 is less than $4,000 and line 4 is zero □STOP STOP
Enter line 6 on line 27 of Form 8863
c. Line 6 is less than $4,000 and line 4 is not zero □STOP STOP
You may benefit from including some of
the student’s scholarships in the student’s
gross income. See instructions.
FIGURE 2: EXAMPLE OF A WORKSHEET FOR EXPENSES QUALIFYING FOR AOTC

Conclusions
• 1098T is the main 3rd party report about student status, student expenses, scholarship income. It helps students claim tax benefits.
• Four main changes to advance goals:
– universal reporting, reporting of expense paid, not billed, reporting of all grants, identifications of full-time students.
• Changes could enable IRS to:
– offer outreach and guidance to students
– develop effective compliance initiatives
18

Questions?
19

The Saver’s Credit: Money v. Convenience
VALRIE CHAMBERS

The Saver’s Credit
• Low-income taxpayers can increase their tax refund by saving: 1. As an
exclusion/deduction and 2. By using the Savers Credit (IRC Sec. 25B).
• Taxpayers must be >18 & not a full time student or dependent on another’s return.
• Credit can be claimed for previous tax year if funded by April 15th, (using Form 8888).
• Normal Example: Tax subsidy for saving => (10-15% FIT savings from exclusion/deduction + 50% savings from credit) => $1 IRA costs taxpayer 35₵ in liquidity.
• Extreme Example: Tax subsidy for saving => (65% above, + up to 45% EIC could result in, essentially, a free IRA with no loss to liquidity).

“More Is Better”
• http://www.youtube.com/watch?v=48-tcRiBNj4
• So, how many people take the saver’s credit?
• 2007 tax year: approx. 65.6% had a small enough AGI to qualify, but
• Only 4.1% filed for the savers credit.
• 2010: approx. 78.9% qualified, and 5.4% filed for the savers credit, for just over $1 billion in credit on more than 6.1 million averaging $204 for joint filers, $165 for heads of household and $122 for single filers (IRS 2012).
• Why don’t more people take the saver’s credit?
• A1: They can’t afford to save
• A2: They don’t know about the saver’s credit

Field Experiment • Educate eligible taxpayers about pension deductions and Savers Credit.
• Control for the amount and plans that taxpayers have for refunds.
• Hypothesis: Counseled taxpayers due a refund will significantly increase their
retirement savings.
• Especially if their refund contains a windfall component.
• RQ: Ask qualifying taxpayers who do not increase their retirement savings,
“why not?”

Results
After education, the number choosing to save is:
A: 6% of those eligible for the Saver’s Credit (3/51)
Why?
A1: I’m a bad teacher.
A2: In utility, low- to middle-income taxpayer time is worth more than (generally) several hundred dollars per hour.
A3: Setting up a savings account is too inconvenient.

Field Experiment Results
Table 1: Results of VITA Counseling Field Test
*Validated by subsequent SOI statistics
*Five taxpayers went through two stages of counseling, but only three increased funding for pensions.
Number Percent
Taxpayers Approached 83 100%
Less: Taxpayers ineligible for tax break (32) (39%)
Eligible Taxpayers Approached 51 61%
Less: Increased/Opened (New)Pension Savings Account* (3) (4%)
Eligible Taxpayers Declining Additional Pension Funding 48 57% (100%)
Reasons Taxpayers Did Not Want Additional Pensions:
1. Happy with Savings/ Pension Maximized 12 14% (25%)
2. Inconvenient 11 13% (23%)
3. Destitute/Large Bills 10 12% (21%)
4. Non-specific Reasons 5 6% (11%)
5. Owed Tax/No Tax Liability 3 4% (7%)
6. Miscellaneous Reasons for No Counseling @ 1 Answer Each 7 8% (2% ea)

Classroom Experiment • With business students: education level > general population
• Extreme scenario, where saving actually pays
• Control group, hypothetically choose: more money ($1,370) or less ($270)?
• Treatment group, choose: more money with a 15 minute diversion or less with no diversion?
• Students received extra credit “up to…” about 2.5% of their grade.
• Hypothesis: Control and Treatment group members will choose more $.


Classroom Experiment Results Table 2: Effect of Convenience on Students*
* Difference in total is significant at p<.05.
2012 Control (No Box)
Box 1 Box 2 Total
Day 3 21 24
Night 0 22 22
Totals 3 43 46
2012 Treatment (Grey box)
Box 1 Box 2 Total Box 2 w/ Initials
Day 15 12 27 8
Night 9 14 23 6
No Time 0 1 1 1
Totals 24 26 50 15

Discussion • Field Experiment: 11/83 (13%) cited the lack of convenience for not
saving; 12 (14%) of the low-income taxpayers had enough savings.
• Student Experiment: Only 30% of the treatment group (v. 93% of control group) chose the higher refund and did the 15-minute paperwork to legitimately get the extra-credit, indicating that like in the field experiment,
•Even minor inconveniences matter.

Discussion • Consistent with Freakonomics, people may act (predictably?) irrational.
• When self-control is exerted, people feel depleted and their next choice is a convenient one.
• They also shorten their time horizon: time slows down (Echo Wen Wan and Nidhi Agrawal, 2011).
• A series of mental accounting studies show that MDs budget yearly, MBAs monthly, and taxicab drivers budget on a day-to-day basis. (“One Day at a Time” effect.)
• Taken together, perhaps being poor and/or having taxes prepared is stressful, so people want to get as far away as fast as they can (minutes v. days).
• Also explains the popularity of refund anticipation loans in their day.
• This is important for CPAs with poorer clients and for public policy makers, because using the tax system to motivate poorer people may be less efficient than generally thought.

The Stress of Being Poor • People in scarcity are more myopic and less able to make good choices
due to “limited bandwidth,” which presents as both diminished intellectual capacity and depletion of self-control.
• Education is of limited use, but simplifying yields high returns. Convenience arguably simplifies.
• With less pension sponsorship, poorer taxpayers have both a greater need for private pension savings and a reduced ability to save.
• Effective tax policies for retirement savings should: include accounts that are easy to set up, funded in times of financial excess (if any), and be funded at small, frequent interim deadlines.
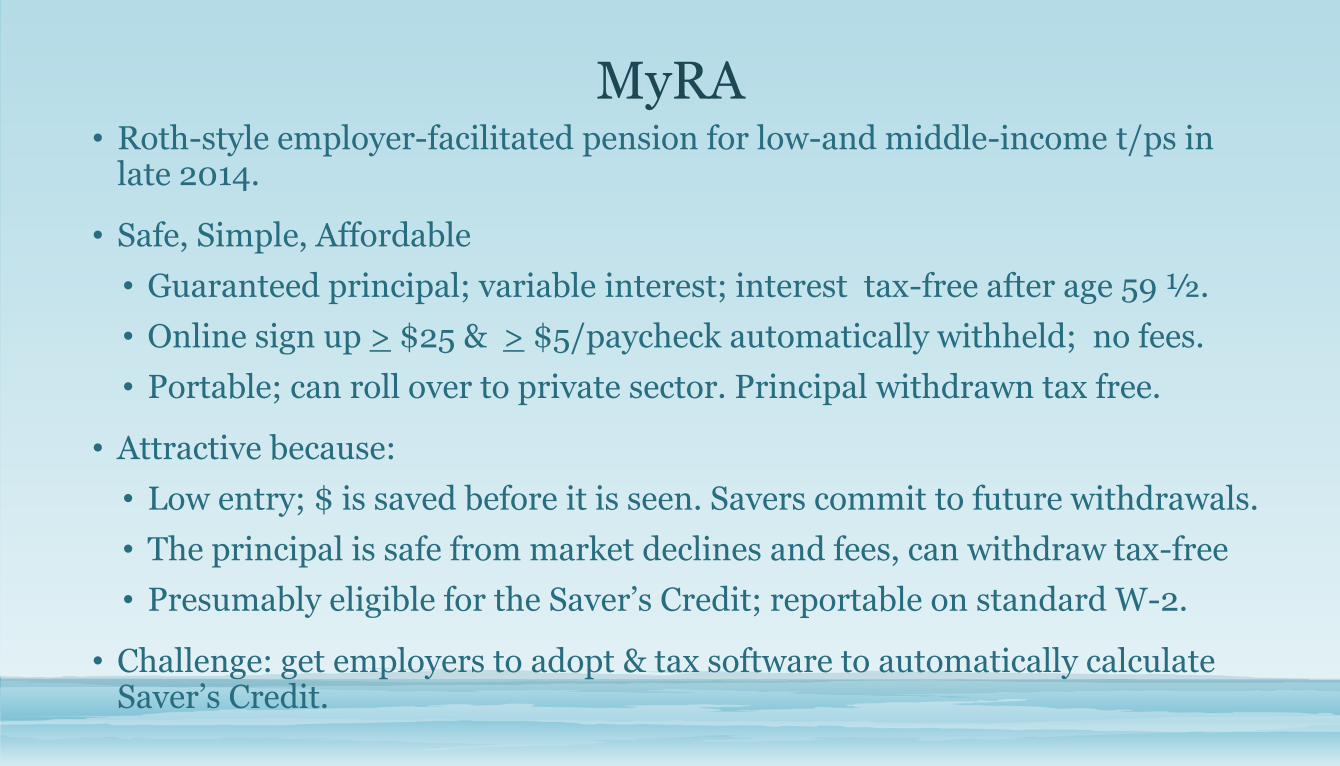
MyRA • Roth-style employer-facilitated pension for low-and middle-income t/ps in
late 2014.
• Safe, Simple, Affordable
• Guaranteed principal; variable interest; interest tax-free after age 59 ½.
• Online sign up > $25 & > $5/paycheck automatically withheld; no fees.
• Portable; can roll over to private sector. Principal withdrawn tax free.
• Attractive because:
• Low entry; $ is saved before it is seen. Savers commit to future withdrawals.
• The principal is safe from market declines and fees, can withdraw tax-free
• Presumably eligible for the Saver’s Credit; reportable on standard W-2.
• Challenge: get employers to adopt & tax software to automatically calculate Saver’s Credit.

Further Research Questions
• Is it general financial stress (e.g. of being poorer) or specific financial stress (doing taxes) or an interaction effect that causes such short-term thinking?
• What can be done to mitigate short-term thinking?
• Priming before the process?
• Framing the question: would you rather have the largest take-home refund now or the largest wealth/asset base now?

Other Discussion Points
• It is possible that the education on the Savers Credits and pension deductions increased savings for a subsequent year.
• The IRA deduction requires an account - which is a deterrent to the unbanked.
• While an employee who funds pensions through payroll withholdings is eligible for the Savers Credit, the employer generally establishes the account.

Conclusion
• How hard will low-income taxpayers work to increase their tax refund?
• Not very hard.
• How hard will students work for extra credit? Only as hard as they must.
• Even minor inconveniences matter. This is important in designing tax and pension reform.
• Effective tax policies for retirement savings should:
• Include accounts that are easy to set up,
• Be funded in times of financial excess (if any), and
• Be funded at small, frequent interim deadlines.

The content of this presentation is the opinion of the writer(s) and does not necessarily represent the opinion of the Internal Revenue Service
The Compliance Costs of IRS Post-Filing Processes

The content of this presentation is the opinion of the writer(s) and does not necessarily represent the opinion of the Internal Revenue Service
The Compliance Costs of IRS Post-Filing Processes
Ronald Hodge, II
John Guyton

The content of this presentation is the opinion of the writer(s) and does not necessarily represent the opinion of the Internal Revenue Service
Overview
• Tax Administration Costs
• Better measurement of tax administration costs will improve our understanding of
factors that influence a tax system and its outputs
• Taxpayer Compliance Costs
• Considerably larger than the budget of the tax administrator (Slemrod and Yitzhaki,
2002)
• Typically discussed in terms of pre-filing and filing activities
• Must also consider costs incurred after a tax return has been filed
• Impractical to measure these costs directly, so they must be estimated
The Compliance Cost of IRS Post-Filing Processes 38

The content of this presentation is the opinion of the writer(s) and does not necessarily represent the opinion of the Internal Revenue Service
Approach • Gather data on the time and money spent resolving post-filing issues
• Amended returns, Examination, Appeals or Collection
• Link survey responses to IRS administrative data on post-filing processes
• Develop taxpayer-level model of post-filing costs
• Apply model to a full year post-filing population to estimate associated
compliance costs
The Compliance Cost of IRS Post-Filing Processes 39

The content of this presentation is the opinion of the writer(s) and does not necessarily represent the opinion of the Internal Revenue Service
Survey • Individual taxpayers who resolved a Tax Year 2008, 2009 or 2010 post-filing
issue during calendar year 2011
• Represents variation in post-filing issue types and cycle times
• Accounts for ~83% of the individual income taxpayer post-filing issue resolutions in
calendar year 2011
• Stratified random sample of 13,000 taxpayers
• (1) Post-filing issue resolution
• Issue type (Examination, Collection, Appeals or Amended Returns)
• Issue complexity
• (2) Original tax return characteristics
• Return complexity and preparation method
The Compliance Cost of IRS Post-Filing Processes 40

The content of this presentation is the opinion of the writer(s) and does not necessarily represent the opinion of the Internal Revenue Service
Model Development • Log-linear micro-simulation model of taxpayer post-filing compliance costs
• Monetized time for each survey respondent using income information reported
on the respondent’s tax return
• Total compliance cost is equal to the monetized time and money spent resolving
post-filing issues
• Dependent variable is the log of total compliance costs
• Independent variables represent:
• At-filing characteristics
• Post-filing characteristics
• Collection-related resolutions
The Compliance Cost of IRS Post-Filing Processes 41

The content of this presentation is the opinion of the writer(s) and does not necessarily represent the opinion of the Internal Revenue Service
Variable Estimate T Statistic
Intercept 1.3569 5.4900
Log Income 0.1800 7.6100
Medium Complexity Indicator 0.2067 4.2800
High Complexity Indicator 0.6103 8.3300
Paid Indicator 0.2097 2.8400
Software Indicator -0.1301 -1.6400
Power of Attorney (At Filing) 1.3225 8.1300
Power of Attorney (Post-Filing) 1.0271 10.9900
No Post-Filing Tax Assessed Indicator 0.4698 2.7500
Log Post-Filing Tax Assessments 0.0452 2.1100
Automated Underreporter Indicator 0.1525 2.3600
Log Administrative Costs - Examination 0.1886 10.6100
Log Administrative Costs - Appeals 0.2095 2.9400
Amended Tax Return 0.3808 4.8800
Balance Due Indicator 0.9324 3.4800
Account Full Paid -0.9732 -3.6900
Installment Agreement Indicator 0.8103 3.1400
Offer in Compromise Indicator 1.3370 4.5000
Collection Due Process Indicator 0.7938 1.9500
Currently Not Collectible - Hardship Indicator 0.0558 0.2700
Lien Release Indicator 0.2934 0.8600
At-Filing Return
Characteristics
Post-Filing
Characteristics
Collection
Resolutions
Adj. R2 = 0.424
Post-Filing Compliance Cost Coefficients
The Compliance Cost of IRS Post-Filing Processes 42

The content of this presentation is the opinion of the writer(s) and does not necessarily represent the opinion of the Internal Revenue Service
Post-Filing Compliance Costs – By Originating Function
The Compliance Cost of IRS Post-Filing Processes 43
Post-Filing Compliance Cost Estimates (CY 2011 Full Population)
Case Type Population Average
Compliance Cost
Median
Compliance
Cost
Total Compliance
Costs
AUR 3,867,000 $225 $90 $870,000,000
Amended 1,168,000 $440 $125 $514,000,000
Collection 5,845,000 $470 $155 $2,747,000,000
Correspondence
Examination 823,000 $500 $155 $412,000,000
Field Examination 137,000 $4,670 $915 $640,000,000
Office Examination 137,000 $2,105 $455 $288,000,000
Total 11,977,000 $455 $130 $5,450,000,000

The content of this presentation is the opinion of the writer(s) and does not necessarily represent the opinion of the Internal Revenue Service
Individual Taxpayer Post-Filing Compliance Costs by Enforcement Function - 2011
The Compliance Cost of IRS Post-Filing Processes 44
Collection
67%
Examination
20%
Appeals
1%
Automated
Underreporter
12%

The content of this presentation is the opinion of the writer(s) and does not necessarily represent the opinion of the Internal Revenue Service
Fiscal Year 2011 Enforcement Revenue by Function – All Taxpayer Types
The Compliance Cost of IRS Post-Filing Processes 45
Collection,
$31,100,000,000
(57%)
Examination,
$12,400,000,000
(22%)
Appeals,
$6,500,000,000 (12%)
Automated
Underreporter,
$5,200,000,000 (9%)

The content of this presentation is the opinion of the writer(s) and does not necessarily represent the opinion of the Internal Revenue Service
Pre-Filing, Filing and Post-Filing Compliance Costs for Taxpayers with Post-Filing Activity
The Compliance Cost of IRS Post-Filing Processes 46
Population
Average
Compliance Cost
Median Compliance
Cost
Total Compliance
Cost
Total 11,977,000 $455 $130 $5,450,000,000
Estimates of Post-Filing Compliance Costs
for Taxpayers Resolving a Post-Filing Issue in 2011
Estimates of Pre-Filing & Filing Compliance Costs
for Taxpayers Resolving a Post-Filing Issue in 2011
Population Average
Compliance Cost
Median Compliance
Cost
Total Compliance
Cost
Total 11,977,000 $615 $230 $7,366,000,000

The content of this presentation is the opinion of the writer(s) and does not necessarily represent the opinion of the Internal Revenue Service
Pre-Filing, Filing and Post-Filing Compliance Costs for Taxpayers with Post-Filing Activity
The Compliance Cost of IRS Post-Filing Processes 47
Comparison of Pre-filing/Filing and Post-Filing Compliance Costs [Select Case Types]
Initial Post-Filing Case Type Average Pre-filing and Filing
Compliance Cost
Average Post-Filing
Compliance Cost
Automated Underreporter $455 $225
Correspondence Examination $600 $500
Office Examination $1,125 $2,105
Field Examination $3,705 $4,670
Amended Return $880 $440

The content of this presentation is the opinion of the writer(s) and does not necessarily represent the opinion of the Internal Revenue Service
Total Compliance Costs for Taxpayers with Post-Filing Activity - 2011
The Compliance Cost of IRS Post-Filing Processes 48
Pre-Filing and Filing
57%
Amended Returns
3%Automated
Underreporter
5%
Examination
8%
Appeals
Less than 1%
Collection
27%

The content of this presentation is the opinion of the writer(s) and does not necessarily represent the opinion of the Internal Revenue Service
Individual Income Tax Compliance Costs and Total Revenue Collected – Enforcement versus Non-Enforcement
The Compliance Cost of IRS Post-Filing Processes 49
Activity
Allocation of
Compliance Costs (in
Billions)
Allocation of Compliance
Costs
Pre-Filing and Filing TY 2010 and Amended
Returns CY2011 $53.4 + $0.4 = $53.8 91%
Post-Filing Enforcement CY 2011 $5.2 9%
Total (TY 2010/CY 2011) $59.0 100%

The content of this presentation is the opinion of the writer(s) and does not necessarily represent the opinion of the Internal Revenue Service
Individual Income Tax Compliance Costs and Total Revenue Collected – Enforcement versus Non-Enforcement
The Compliance Cost of IRS Post-Filing Processes 50
Revenue Source Revenue (in
Billions) Allocation of Revenue
Voluntary Compliance and Non-Enforcement
Revenue $1,944 97%
Enforcement Revenue (2) $55 3%
Total Net Revenue (1) $1,999 100%

The content of this presentation is the opinion of the writer(s) and does not necessarily represent the opinion of the Internal Revenue Service
The Path Forward of Post-Filing Compliance Cost Modeling
• Enhance what-if modeling capability and planning support
• Extend post-filing compliance cost modeling
• Other taxpayer types
• Other tax types
• Increased integration of compliance cost modeling with other aspects of tax
administration research:
• Taxpayer needs
• Compliance outcomes
• Enforcement treatments
• Administrative costs
• Revenue collection
The Compliance Cost of IRS Post-Filing Processes 51

Taxpayer Compliance Costs and Tax Administration
IRS-TPC Research Conference Session 1 Comments
Robert Weinberger June 19, 2014

Papers
1. Improving Form 1098T (Education Benefits)
2. Increasing Pension Participation of the Poor
3. Measuring Post-Filing Compliance Costs
53

1. Education Benefits Hard to understand and compare, let alone optimize
1. Hope Scholarship Tax Credit 2. Lifetime Learning Credit 3. American Opportunity Tax Credit 4. Tuition & Fees Deduction 5. Scholarship/Fellowship Exclusion 6. Extended Dependent Exemption 7. Expanded EITC Eligibility 8. Education Savings Accounts 9. Deduction for Interest on Education Loans
54

Education Benefits
• 1098T: student status, expenses, scholarships
• Many who get the form don’t claim benefits; many who claim benefits don’t get the form
• More info needed to determine eligibility, ease compliance, and optimize benefits
• Revision would improve outreach, utilization, and enforcement
55

Education Benefits
• Paper is well written, clear, convincing • Focused on mechanics of compliance • Also might consider broadening scope
– Policy objectives – Reform proposals – Measuring non-compliance – Measuring underutilization – Role of assisted preparation – Software optimizing tools
56

2. Poor Pension Participation
• Asks Why don’t the poor save (more)?
• Examines several hypotheses
• Rejects as “acute oversimplification” that they can’t afford to
• Instead finds “convenience” is key
• Conclusions more suggestive than definitive
57

Poor Pension Participation Some issues -- • Premise: Taxpayers expect a refund amount and are
more likely to save for retirement if it’s higher • Hypothesis: Counseled taxpayers will significantly
increase savings • Study design, sample size • Setting: VITA, credit union • Comparability: low-income TPs and students
58

Poor Pension Participation
Multiple factors: • Knowledge • Trust • Available money • Emotional ability • Adequate incentives • Program, product design -> Convenience
59

60

3. Post-Filing Compliance Costs
• Paper builds well on earlier research
• Uses logical categorization, segmentation
– Return complexity, prep method, issue complexity
– IRS treatment: exam, appeals, collection
• Defensible survey, modeling, analysis
• Assertions appropriately qualified
• Addresses issues—How representative? etc.
61

Post-Filing Compliance Costs Key takeaways:
• 11.4M of 145M filers resolve issues later (<8%) – Across all taxpayers, pre-filing/filing costs average $373 and post-
filing costs average $400
– For post-filers, 60% of costs are pre-file/filing ($640)
– 45% of post-filers have collection issues; = 61% of their compliance costs
• Overall compliance costs split 91%/9% between pre-filing, filing, and amending returns and post-filing enforcement
62

Post-Filing Compliance Costs
Suggestions --
• Explain monetization methodology
• Validate with CPAs, national preparers
• Correlate with NRP, DIF: Where is the greatest bang for the buck?
• Break out EITC
63
Advancing Tax Administration June 19, 2014
Session 1: Taxpayer Compliance Costs and Tax Administration
Moderator:
Brenda Schafer
IRS, RAS, Office of Research
Improving Form 1098T: How a Revised Form
Could Increase Take-Up, Improve Compliance
and Lower Taxpayer Burden
Deena Ackerman
Office of Tax Analysis, US Treasury
Convenience Is Necessary for Pension
Participation by the Poor
Valrie Chambers
Texas A & M University – Corpus Christi
The Compliance Costs of IRS Post-Filing
Processes
Ronald Hodge
IRS, RAS, Office of Research
Discussant: Robert Weinberger
Aspen Institute Initiative on Financial Security