Embed Size (px)
Citation preview

NEUROENGINEERINGORIGINAL RESEARCH ARTICLE
published: 20 December 2011doi: 10.3389/fneng.2011.00016
An investigation on the role of spike latency in an artificialolfactory system
Eugenio Martinelli 1†, Davide Polese1†, Francesca Dini 1, Roberto Paolesse2, Daniel Filippini 3,
Ingemar Lundström3 and Corrado Di Natale1*
1 Department of Electronic Engineering, University of Rome Tor Vergata, Roma, Italy2 Department of Chemical Science and Technology, University of Rome Tor Vergata, Roma, Italy3 Division of Applied Physics, Department of Physics, Chemistry and Biology, Linköping University, Linköping, Sweden
Edited by:
Ramon Huerta, University ofCalifornia, USA
Reviewed by:
Jordi Fonollosa, Universitat deBarcelona, SpainAlex Vergara, University of California,USA
*Correspondence:
Corrado Di Natale, Department ofElectronic Engineering, University ofRome Tor Vergata, Via del Politecnico1, 00133 Roma, Italy.e-mail: [email protected]†Eugenio Martinelli and Davide Polesehave contributed equally to this work.
Experimental studies have shown that the reactions to external stimuli may appear onlyfew hundreds of milliseconds after the physical interaction of the stimulus with the properreceptor.This behavior suggests that neurons transmit the largest meaningful part of theirsignal in the first spikes, and than that the spike latency is a good descriptor of the informa-tion content in biological neural networks. In this paper this property has been investigatedin an artificial sensorial system where a single layer of spiking neurons is trained withthe data generated by an artificial olfactory platform based on a large array of chemicalsensors. The capability to discriminate between distinct chemicals and mixtures of themwas studied with spiking neural networks endowed with and without lateral inhibitionsand considering as output feature of the network both the spikes latency and the averagefiring rate. Results show that the average firing rate of the output spikes sequences showsthe best separation among the experienced vapors, however the latency code is able ina shorter time to correctly discriminate all the tested volatile compounds. This behavior isqualitatively similar to those recently found in natural olfaction, and noteworthy it providespractical suggestions to tail the measurement conditions of artificial olfactory systemsdefining for each specific case a proper measurement time.
Keywords: spike latency, spiking neural networks, artificial olfactory systems, color indicators
INTRODUCTIONThe processing of signals from sensorial inputs is an importantfunction in all living beings. In most multicellular animals thisprocess is carried out by the nervous system that is formed bya dense network of specialized cells called neurons. Experimen-tally gained evidences about the functionalities of the nervoussystem led to the design of mathematical models with the twofoldpurpose to elucidate the physiological processes and also to arti-ficially reproduce the natural functions. During the years, thesemodels, broadly called artificial neural networks, have progres-sively extended the similarity with Nature including functionsand structures as those became known by physiological investi-gations. To this regard, neural networks involving spiking neu-ron units raise the level of biological similarity (Maass, 1997,1999), incorporating the spatio-temporal computation (Fersterand Spruston, 1995). Although the behavior of individual neu-rons is well characterized by phenomenological models (Gerstnerand Kistler, 2002), it is not yet completely clear how the informa-tion is distributed in the spike patterns and which code neuronsuse to transmit this information. To this end, behavioral stud-ies show that the reaction times of several animals to externalstimuli can be surprisingly short (Rieke et al., 1996). Moreover,recent findings evidences that neurons in the cortex can per-form very fast analog computations. For example, humans cananalyze and identify visual inputs in less than 100 ms. Then, con-sidering that this process involves at least 10–15 synaptic steps
from the retina to the temporal hemisphere, less than 10 ms is theremaining time for the neuron processing (Thorpe et al., 1996).These evidences are not compatible with the analysis performedwith standard descriptors like firing rate (Michael and Johnson,2003) but they are compatible with alternative descriptors, suchas spike latencies. This does not mean that the rate coding is notused, instead that when fast processing is needed, latency codingschemes are preferred (Maass, 1999). Spike latency is defined asthe time interval between the application of the stimulus and thefirst spike.
The importance of the processing of this feature is found inmore brains zones like the visual or auditory area (Heil, 2004;Gollisch and Meister, 2008). The very fast discrimination andrecognition of odors shown by several animals to particular stimulisuggests that this feature can play a significant role also in olfaction(Galizia and Menzel, 2000; Uchida and Mainen, 2003). This con-jecture is supported by the recent observation that raise the level ofbiological similarity latency patterns of olfactory glomeruli con-tain a quantity of information that is sufficient for higher braincenters to identify odors and their concentrations (Junek et al.,2010).
The features of spike encoding attracts also researchers inves-tigating artificial senses as a step toward the implementation ofbiological computational paradigms.
The studies on artificial senses are rather advanced for “physi-cal” senses such as sight and hearing, while the artificial analog of
Frontiers in Neuroengineering www.frontiersin.org December 2011 | Volume 4 | Article 16 | 1

Martinelli et al. Latency in artificial olfaction
those senses involving chemistry, such as olfaction and taste, arestill rather primitive.
Artificial olfaction stemmed at the end of the eighties fromthe observation that solid-state gas sensors and olfactory recep-tors (in amphibians, insects, and mammals) are characterized bya wide receptive field (Sicard and Holley, 1984; Malnic et al., 1999;Hallem et al., 2004). This conjecture evolved in the electronic noseconcept that is defined as an ensemble of partially specific chemi-cal sensors complemented by some pattern recognition algorithm(Persaud and Dodds, 1982; Gardner and Bartlett, 1994).
Besides the combinatorial sensitivity of receptors olfactionreveals a complex structure that is supposed to play a relevantpart in odor recognition (Firestein, 2001). Olfaction is based onfew hundreds of different receptor classes expressed by millionsof olfactory neurons organized in the olfactory epithelium at theinterface with the external environment. The large redundancy ofthe epithelium, namely many olfactory neurons carrying the samereceptors, is used by the convergence of olfactory neurons signalsinto structures called glomeruli that are organized in the olfactorybulb. Many experimental evidences support the common opin-ion that each olfactory neuron expresses only one type of receptorand that each glomerulus receives signals from olfactory neuronscarrying the same type of receptor (Imai et al., 2006).
The features of spike encoding attracts also researchers investi-gating artificial olfaction as a step toward the implementation ofbiological computational paradigms (Martinelli et al., 2006; Chenet al., 2011). In these works integrate and fire models were opti-mized with the purpose of increasing odor recognition. A morecomplex approach was made by Koickal et al. (2007) who imple-mented in a chip a bio-inspired signal processing of the sensorsignals and indicated with simulated data the potential impact ofspike latency in odor identification. Noteworthy, all these stud-ies were concerned with arrays of few sensor units (where eachsensor actually plays the role of an artificial glomerulus). The dis-crimination content of the latency coding in natural olfaction isthen a very interesting aspect that could also produce remark-able advantages in artificial olfaction. Eventually, the applicationof this concept could indeed allow reducing the measurement timewith a consequent minor exposure of the sensors to the samplesand probably a reduced rate of poisoning of the sensor surface.On the other hand, the exploitation of latency requires the useof a sensor system incorporating the main features of the naturalolfaction. These are the very large number of individual sensors,the glomeruli layer and the spike encoding and processing of thesensor signals. The difficulties to design and assemble large sensorarrays are brilliantly solved by optical sensors. Several years ago itwas demonstrated that an image sensor (such as a CCD camera)could conveniently measure, at once, the optical changes occur-ring in a large number of fluorescent indicators deposited on thetips in a bundle of optical fibers (Dickinson et al., 1999).
The basic property of an image sensor is the segmentation of awhole scene into a number of elementary units, called pixels. Eachpixel corresponds to one photo detector measuring the light inten-sity shining from a section of the whole scene. Eventually, when animage sensor captures a sensitive surface coated by a continuouslayer of chemical indicators, the sensing layer is segmented intoa number of elementary units corresponding to the pixels of the
image. Then, since it is possible to evaluate the optical propertiesof single pixels, each pixel of the image may correspond to anindividual sensor. To this end, even low-resolution images mayresult in thousands of independent sensing units, then under thehypotheses that different types of indicators are optically different(this trivially means that each indicator has a different color) it ispossible to cluster the camera evaluation of the color of individualpixels in abstract classes each containing pixels carrying the samechemical indicator (Di Natale et al., 2008).
In this paper, a spiking neural network, mimicking the firstsignal elaboration of the glomerular layer spikes sequences, hasbeen studied with data generated by an artificial olfactory platformbased on the principle described above.
The platform is formed by an artificial epithelium composedof a layer of chemical indicators. The concept is illustrated inFigures 1 and 2. The sensing layer is illuminated by a program-mable computer screen and imaged by a digital camera (Filippiniet al., 2006). Each single pixel composing the image is then consid-ered as an independent sensor characterized by a proper optical setof features given by the chemical reporters spotted on its area (DiNatale et al., 2008). Then, by exploiting their optical signature, thepixels can be unsupervisedly grouped in classes giving rise to ananalog of the Olfactory Receptors Neurons–Glomerulus relation-ship (Korsching, 2002). This platform can then efficiently mimicthe dynamics between signals of single receptors and how theseare transformed by the convergence into the glomeruli. Hardwaredevelopment is limited to the receptor units (the color indicators)while glomeruli are a software implementation. Post-glomeruliprocessing can be easily accomplished via software and results canbe strongly connected to the physical and chemical properties ofthe interaction of volatile compounds with the receptor layer.
In this way, it is possible to define a processing architecture thatdescribes the pixels as artificial olfactory receptor neurons and theconvergence classes as a unit, where the mean signals of the afferentartificial olfactory receptor neurons are the output signals of artifi-cial glomeruli. This architecture that preserves many features of itsbiological counterpart offers also interesting practical advantagessuch as the largest signal to noise ratio of glomeruli with respectto the signals of individual sensors and a very large tolerance tosingle sensors fault events.
Glomeruli output signals are encoded into spike sequences andthen utilized as input to a spiking neural network. The latency ofthe first two spikes of the neurons of the spiking neural network hasbeen considered as the network output, and the application of theprincipal component analysis (PCA) to these quantities revealedthe capability of latencies to discriminate between different volatilecompounds.
MATERIALS AND METHODSA spiking neural network has been applied to process the dataproduced by the artificial olfactory platform described above. Thescheme of the whole system is shown in Figure 3. In order tofeed the spiking neural network in a way similar to natural sys-tems, the glomerular units besides to average all the signals fromtheir afferent artificial olfactory neurons (corresponding to theindividual pixels of the image sensor) have to encode the ana-log signals into spikes. The spiking network is formed by a single
Frontiers in Neuroengineering www.frontiersin.org December 2011 | Volume 4 | Article 16 | 2

Martinelli et al. Latency in artificial olfaction
FIGURE 1 | Schematics of the architecture of the Artificial olfactory
system. The pixels defining the indicator spots, forming the artificialepithelium, converge, according to their optical signatures to the units of aconvergence layer mimicking the role of the olfactory bulb. According to this
analogy the units in this layer can be considered as artificial glomeruli. In thislayer the average of the signals of the afferent pixels is calculated and thenencoded as a spike sequence that is utilized as the input to the processingspiking neural network.
FIGURE 2 | Picture of the artificial epithelium, differently colored spots
are the indicators characterized by different hues. The colorlessbackground is coated by the supporting polymer.
layer. Each neuron of the network receives the excitatory inputsfrom the glomeruli and it is contemporaneously inhibited by thetwo adjacent neurons.
ARTIFICIAL EPITHELIUMThe sensing layer was formed by eight molecular indica-tors. Six of them were metal complexes of the (5,10,15,20-tetraphenylporphyrin),namely (5,10,15,20-tetraphenylporphyrin)palladium [PdTPP], (5,10,15,20-tetraphenylporphyrin)rhodium[RhTPP], (5,10,15,20-tetraphenylporphyrin)zinc [ZnTPP], (5,10,15,20-tetraphenylporphyrin)molybdenum [MoTPP], (5,10,15,20-
tetraphenylporphyrin)iron [FeTPP], (5,10,15,20-tetraphenylporphyrin)manganese [MnTPP], a Silicon (phthalocyanine) [SiPC],and finally a pH indicator known as Nile Blue (NB). The sens-ing molecules were dispersed in a membrane based on plasticizedpoly(vinyl chloride) (PVC; membrane composition in weight:33% PVC, 66% bisethylhexyl sebacate and 1% indicator). Thesensing layer was prepared onto a 25-mm diameter transparentsubstrate, a Thermanox plastic coverslip provided by Nunc. Thepolymer membrane was at first casted onto the coverslip to fullycoat the surface. Then each indicator-polymer membrane wasrandomly spotted in several replicas, in a number variable from6 to 11, above the polymeric coating, to obtain the appearanceshown in Figure 2. The polymer layer has the main function tosupport the sensing molecules avoiding the formation of indi-cator aggregations, maintaining the molecules in a semi-solventcondition.
MEASUREMENT SETUPAbsorbance properties of the sensing spots were measured accord-ing to the computer screen photo-assisted technique (CSPT) wherea computer screen is used as light source and a digital camerais used as a detector (Filippini et al., 2003). It was shown thatsuch an arrangement, even if based on low-cost components, hasenough sensitivity to capture the changes of the optical prop-erties occurring in layers of metalloporphyrins when these areexposed to volatile compounds (Filippini et al., 2006) with a sen-sitivity comparable with that exhibited by solid-state sensors suchas quartz microbalances (Di Natale et al., 2010). Experiments werecarried out with a computer screen (Philips 170S4) and a webcam(Philips SPC650NC/97). The camera was operated at a resolutionof 160 × 120 pixels, the signal intensities were given in cameraunits according to the 8-bit analog to digital conversion of thelight intensity embedded in the camera driver. The arrangement
Frontiers in Neuroengineering www.frontiersin.org December 2011 | Volume 4 | Article 16 | 3

Martinelli et al. Latency in artificial olfaction
FIGURE 3 | Conceptual scheme of the CSPT setup. (A) Both the screen and the camera are connected to the same computer where all the measurementsare controlled and data are recorded. (B) The sensing layer is enclosed in a gas-tight and transparent cell where vapors can be passed. The cell is leaned overthe surface of a LCD screen.
of the experimental setup is shown in Figure 3. The plastic sub-strate was placed in a sealed cell with transparent windows inorder to be probed by light. Organic vapors diluted in a nitrogenflow were passed through the cell. The tested volatile organic com-pounds (VOCs) were two alcohols (ethanol and butanol) and threeamines (trimethylamine, triethylamine, and butylamine). Mix-tures of ethanol and butanol, trimethylamine and triethylamine,and trimethylamine and ethanol have also been tested. Besidestrimethylamine, all compounds are liquid at standard pressureand temperature, then the gas samples were obtained dilutingthe saturated pressure at room temperature in a pure nitrogengas flow. Mass flow controllers regulated the dilution factor andthe total flow during the measurements. The same dilution factor(5%) was applied for all the compounds, due to the different phasechange parameters, the concentration of the different compoundscovered an interval from 1100 ppm for butylamine to 9000 ppmfor ethanol. Trimethylamine was measured from a certified bottlewhere it was diluted in pure nitrogen gas at the concentration of500 ppm. Each vapor was measured in triplicate. For each vaporthe sensing layer was exposed for 400 s and then kept 1100 s underpure nitrogen gas flow to purge the indicators and to restore theinitial conditions.
These compounds are moderate Lewis acids and bases that areknown to elicit color change in porphyrins and acid-base indi-cators. The opposite behavior of amines and alcohols provides asignificant test where the straightforward discrimination of aminesfrom alcohols is complemented by the recognition of the subtle dif-ferences between compounds inside each family. Binary mixtureswere also tested to study the interference of compounds belongingto the same family or to different families. In order to evaluate alsothe reproducibility of the sensor system each vapor and mixturewas measured in triplicate.
The reaction to gas was probed with a pure green light illumi-nation. As known from previous investigations, the wavelengthscontained in this color are suitable to appreciate the spectralchanges occurring in all the indicators. Hence the sensing layerwas illuminated with a pure green light, obtained with the RGBcode: [0 255 0]. As a consequence, the intensity of the camera
green channel of each pixel was the sensors output signal. Duringthe exposure to gas, the camera took a still image each 5 s.
GLOMERULI LAYER DEFINITION AND ANALOG-TO-SPIKINGCONVERSIONAs previously mentioned, CSPT gives the opportunity to introducean elegant and simple methodology to reproduce the connec-tion between the olfactory receptors and the glomeruli. Underthe hypothesis that the indicators are characterized by differentcolors, it is possible comparing the color measured in each pixel toassign pixels to classes whose elements are pixels carrying similarindicators. In this way, the physical pixels are the artificial olfactoryneurons and the abstract classes are the olfactory glomeruli. CSPToffers a powerful method for color measuring, it is based on theformation of a fingerprint obtained exposing the sample to a setof colors achieved blending the RGB values regulating the LCDscreen color, and measuring the resulting appearance of the samplein the three channels (red, green, and blue) of the digital cam-era. This method was demonstrated to be able to discriminatebetween subtle color changes in colorimetric tests (Filippini andLundström, 2006). For the scope of glomeruli definition the sens-ing layer was illuminated by the computer screen programmed todisplay a rainbow of 50 colors from purple to red. The layer wasimaged by the webcam encoding the color in an 8-bit scale sepa-rated in the red, green, and blue channels. The signals from the red,green, and blue channels were concatenated, in this order, to forma fingerprint vector. As a result, the color of pixels was encodedin a fingerprint vector composed by 50 illumination colors × 3camera color channels. Figure 4 shows the collected fingerprints.In the ideal case of a perfectly homogeneous distribution of theindicators and a uniform screen illumination, only nine differ-ent fingerprints (corresponding to the eight indicators and thepolymer substrate) should be visible in Figure 4. Actually, the fin-gerprints are almost continuously distributed evidencing a highlevel of non-homogeneity in sensing spot formation. The cluster-ing of the fingerprints of Figure 4 is in principle a straightforwardsupervised operation. Indeed, the position of each spot is knownand indicators can be easily identified by their color. However,
Frontiers in Neuroengineering www.frontiersin.org December 2011 | Volume 4 | Article 16 | 4

Martinelli et al. Latency in artificial olfaction
FIGURE 4 | Computer screen photo-assisted technique fingerprints
of all the pixels imaged in Figure 2. The fingerprints are formedconcatenating the red, green, and blue channels levels read by thecamera under the exposure to a rainbow of 50 colors from purple to
pure red. The fingerprints are differently colored according to theindicator imaged in the corresponding pixel. Straightforwardly, thelargest signals are obtained for the pixels were the pure supportingpolymer is imaged.
it is interesting to incorporate in the artificial platform architec-ture an automatic procedure clustering together pixels imagingthe same kind of indicators. This gives rise to an elegant mimicof natural olfactory neurons where pixels are the olfactory neu-rons, and the indicators are the olfactory receptor. The receptoritself provides both the chemical sensitivity and the criteria tothe convergence to the relevant glomeruli. The efficiency of CSPTto capture colors allows using automatic clustering with a negli-gible amount of misclassifications. From a biomimetic point ofview, clustering of similar pixels provides the same class member-ship disregarding the arrangement of spots, i.e., the distributionof a given type of olfactory receptor neurons in the epithelium.From a practical point of view this allows for instance a promptreplacement of the artificial epithelium and even a simple commu-nication of signals between different sensing units (Polese et al.,2011).
The fingerprints of Figure 4 can be conveniently clustered intoan arbitrary number of classes by means of any unsupervised clas-sification algorithm. Here a simple K-nearest neighbor (KNN)algorithm has been chosen (Duda et al., 2000). According to thepractical implementation of the artificial epithelium, shown inFigure 2, the indicators cover only a portion of the sensing layer.The rest of the area is coated with the supporting polymer andits color is clearly different from the color of the indicators, thisis quite visible in Figure 2 where the polymer-coated pixels areclearly separated from the dyed pixels. In order to limit the analy-sis to the pixels carrying information about the indicators, thepolymer-coated pixels were segregated applying a two classes KNNclassifier. Here the obvious choice of two classes was made possi-ble by the straightforward difference between the fingerprints ofdyed and non-dyed pixels. However, the number of classes is a free
parameter of unsupervised classifiers, and the number of classeshas to be chosen according to the specific conditions of each appli-cation. In this case, the number of classes can be chosen in orderto abide the biological paradigm according to which in a singleglomerulus only olfactory neurons expressing the same recep-tor converge. This means that in the artificial system the classesdefined by KNN have to contain only pixels carrying the same(or very similar) indicators. In order to fulfill this requirement,a number of classes greater than the actual number of indicatorsis necessary and here, 13 classes have been considered. This num-ber, empirically chosen, is large enough to avoid misclassifications,and at the same time, it is sufficiently small to guarantee that eachclass collects a sufficient number of artificial olfactory neuronsadequate to provide, through the signal averaging, a significantincrease of the signal to noise ratio. Besides averaging the incom-ing pixel signals, glomeruli are requested to encode the signal intospikes in order to be processed by the spiking neural network.Here, an “integrate and fire” (I/F) algorithm was used (Gerstnerand Kistler, 2002). The algorithm is conveniently described by theequivalent electronic circuit shown in Figure 5. The inter-spiketime is determined by the magnitude of the analog input signaland the circuit time constant, that is given by the product of thetwo algorithm parameters: R and C, according to the followingequation:
u (t ) = R · I (t ) − C · R · du (t )
dt(1)
I (t ) is the input signal and u(t ), the voltage across the capac-itance. The circuit generates a spike anytime the voltage u(t )reaches the threshold value (Vthreshold in Figure 5). The critical
Frontiers in Neuroengineering www.frontiersin.org December 2011 | Volume 4 | Article 16 | 5
Martinelli et al. Latency in artificial olfaction
FIGURE 5 |The I/F algorithm implemented in the glomeruli units is
represented through its electronic equivalent circuit. The average signalof the pixels pertaining to the glomerulus is represented by the inputcurrent i (t ) and the output voltage is the encoded spiking sequence. Circuitelements, including the operational amplifier, are ideal and their values areinternal parameters of the algorithm.
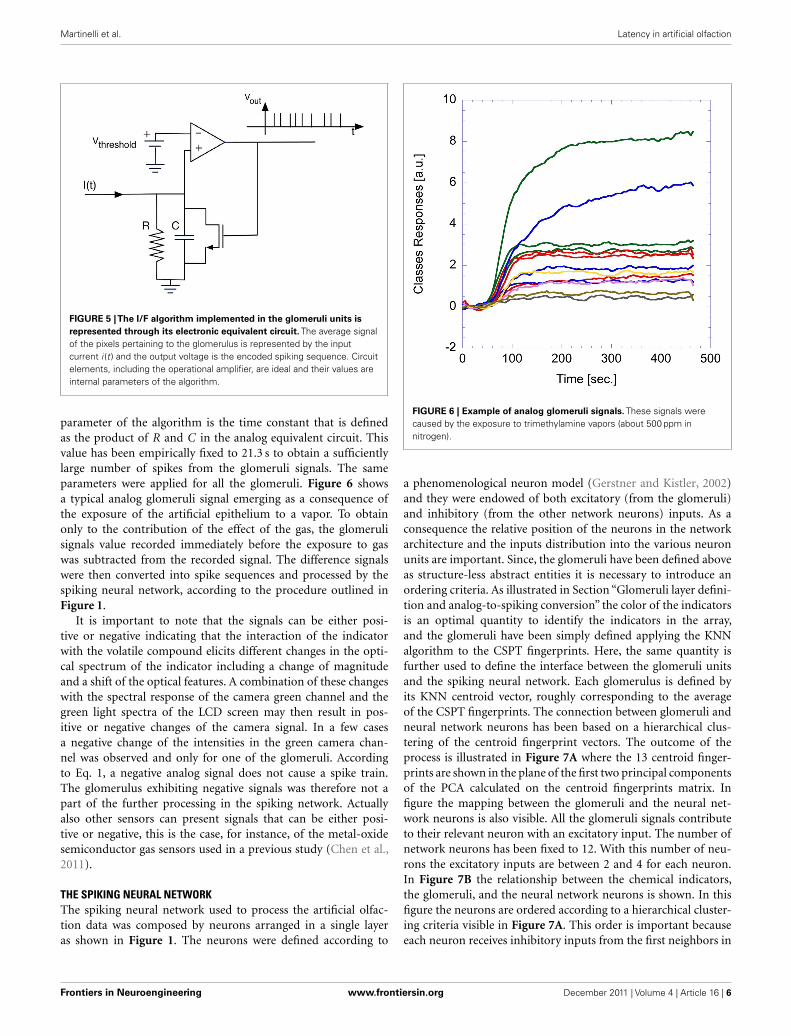
parameter of the algorithm is the time constant that is definedas the product of R and C in the analog equivalent circuit. Thisvalue has been empirically fixed to 21.3 s to obtain a sufficientlylarge number of spikes from the glomeruli signals. The sameparameters were applied for all the glomeruli. Figure 6 showsa typical analog glomeruli signal emerging as a consequence ofthe exposure of the artificial epithelium to a vapor. To obtainonly to the contribution of the effect of the gas, the glomerulisignals value recorded immediately before the exposure to gaswas subtracted from the recorded signal. The difference signalswere then converted into spike sequences and processed by thespiking neural network, according to the procedure outlined inFigure 1.
It is important to note that the signals can be either posi-tive or negative indicating that the interaction of the indicatorwith the volatile compound elicits different changes in the opti-cal spectrum of the indicator including a change of magnitudeand a shift of the optical features. A combination of these changeswith the spectral response of the camera green channel and thegreen light spectra of the LCD screen may then result in pos-itive or negative changes of the camera signal. In a few casesa negative change of the intensities in the green camera chan-nel was observed and only for one of the glomeruli. Accordingto Eq. 1, a negative analog signal does not cause a spike train.The glomerulus exhibiting negative signals was therefore not apart of the further processing in the spiking network. Actuallyalso other sensors can present signals that can be either posi-tive or negative, this is the case, for instance, of the metal-oxidesemiconductor gas sensors used in a previous study (Chen et al.,2011).
THE SPIKING NEURAL NETWORKThe spiking neural network used to process the artificial olfac-tion data was composed by neurons arranged in a single layeras shown in Figure 1. The neurons were defined according to
FIGURE 6 | Example of analog glomeruli signals. These signals werecaused by the exposure to trimethylamine vapors (about 500 ppm innitrogen).
a phenomenological neuron model (Gerstner and Kistler, 2002)and they were endowed of both excitatory (from the glomeruli)and inhibitory (from the other network neurons) inputs. As aconsequence the relative position of the neurons in the networkarchitecture and the inputs distribution into the various neuronunits are important. Since, the glomeruli have been defined aboveas structure-less abstract entities it is necessary to introduce anordering criteria. As illustrated in Section “Glomeruli layer defini-tion and analog-to-spiking conversion” the color of the indicatorsis an optimal quantity to identify the indicators in the array,and the glomeruli have been simply defined applying the KNNalgorithm to the CSPT fingerprints. Here, the same quantity isfurther used to define the interface between the glomeruli unitsand the spiking neural network. Each glomerulus is defined byits KNN centroid vector, roughly corresponding to the averageof the CSPT fingerprints. The connection between glomeruli andneural network neurons has been based on a hierarchical clus-tering of the centroid fingerprint vectors. The outcome of theprocess is illustrated in Figure 7A where the 13 centroid finger-prints are shown in the plane of the first two principal componentsof the PCA calculated on the centroid fingerprints matrix. Infigure the mapping between the glomeruli and the neural net-work neurons is also visible. All the glomeruli signals contributeto their relevant neuron with an excitatory input. The number ofnetwork neurons has been fixed to 12. With this number of neu-rons the excitatory inputs are between 2 and 4 for each neuron.In Figure 7B the relationship between the chemical indicators,the glomeruli, and the neural network neurons is shown. In thisfigure the neurons are ordered according to a hierarchical cluster-ing criteria visible in Figure 7A. This order is important becauseeach neuron receives inhibitory inputs from the first neighbors in
Frontiers in Neuroengineering www.frontiersin.org December 2011 | Volume 4 | Article 16 | 6

Martinelli et al. Latency in artificial olfaction
the list shown in Figure 7B. Finally it is worth the remark thatsince the chemical sensitivity of the indicator and its color arenot correlated, no chemotopic feature is expected to be found inthe neural network structure. According to the phenomenolog-ical neuron model, the neuron state is controlled by the actionpotential (AP):
APj (t ) =∑
i∈input
wij · kernel (t − tn) · H (t − tn)
+∑tm
Refractory (t − tn) · H (t − tn) (2)
FIGURE 7 | (A) Scores plot of the first two principal components of thePCA of the matrix of the centroid fingerprints as defined by the applicationof the KNN to the fingerprints matrix. Closed regions show themembership of glomeruli to the network neurons. (B) Relationshipbetween chemical indicators, glomeruli, and neural network neuronsexcitatory inputs. Glomeruli signals contribute as excitatory inputs to thespiking neural network neurons. The arrows between the network neuronsindicate the inhibitory signals.
where H (t–t m) is the Heaviside function. When a pre-synapticspike occurs at the time t = t n, it produces an AP variation pro-portional to the kernel function through the pre-synaptic weight(w ij). Once the AP reaches the threshold (θ) at the time t = t m
the neuron fires and the AP is reset to zero by the refrac-tory function. The expression of the learning, the kernel andthe refractory functions are shown in Table 1. The excitatoryweights are trained with a Hebbian learning rule where thechange, δw in the upgrade coefficient, w, observes the followingequation:
δw = η ·[∑
ti
win +∑
t0
wout +∑ti ,t0
w (t0 − ti)
](3)
where w in is the discrete increment of the input weight corre-sponding to one input spike, wout is the discrete decrement of theinput weight corresponding to one output spike, and w(t 0–ti) isthe learning function, t i and t 0 are the input and output firingtime and η is the learning rate.
The initial values of the synaptic weights of the excitatoryinput are randomly generated in the range (0, 1) and the APswere initially set to zero. For the inhibitory connections, twoconfigurations of synaptic coefficients have been considered inthe analysis. In the first configuration, the coefficients have beenrandomly generated in the range (−3, −0.5) and in the secondcase the contribution of the inhibition has been removed settingall the inhibitory synaptic weights to zero. In both cases thesecoefficients have been maintained constant during the followingnetwork training. The neural network was unsupervisedly trainedpresenting 100 times, in a randomized order, the spiking sequencesencoding the artificial glomerular responses to the tested vapors.In order to evaluate the performance of the complete artificialolfactory system (composed by the physical layer of receptors,the abstract glomeruli layer, and the spiking neural network) todiscriminate the tested volatile compounds, the output of the net-work have been described by two features describing the shorttime response and the long time response of to the applied stim-ulus, respectively. The short time response is considered by thelatencies of the first two spikes of each neuron, while the longtime response is explained by the neurons firing rate averaged inthe time window corresponding to the application of the stim-ulus. To study the contribution of the spiking neural network
Table 1 | List of the functions describing the phenomenological
neuron model used in the spiking neural network.
Learning function if Δt ≤ 0 W(Δt) = η · exp(Δt/tsyn)
×[A+(1 − Δt/τ̃+)
+A− · (1 − Δt/τ̃−)]f Δt > 0 W(Δt) = η · [−A+ · Δt/τ̃+ − A− · Δt/τ̃−
]Kernel function 1
1− τmτs
· [exp(−ti/τs) − exp(−ti/τm)]Refractory
function
−ϑ exp(−t r/τ)
The different τ’s appearing in the definitions are time constants, A± are constant
parameters and θ is the neuron threshold.
Frontiers in Neuroengineering www.frontiersin.org December 2011 | Volume 4 | Article 16 | 7
Martinelli et al. Latency in artificial olfaction
to the overall discrimination capabilities of the whole olfactorysystem, two additional features describing the glomeruli signalshave also been considered. Also in this case a short time and along time response have been examined. The first feature wascalculated as the analog glomeruli signals at the time when theslowest neuron of the spiking network fires its second spike, whilethe long time response is simply the maximum signal showed byglomeruli during the stimuli application. Figure 8 illustrates thedefinition of these features. In correspondence to the exposureto each volatile compound and for each feature, a vector com-posed by the ordered sequence of features was arranged. The wholeset of experiment resulted then in matrices whose elements werethe above illustrated features. The matrices were then analyzedwith (PCA; Joliiffee, 2002). The main advantage of PCA, in thiscase, is the possibility to plot in the principal components planethe multidimensional datasets, in this way a simple and effec-tive evaluation of the discrimination capability of each featurecan immediately be obtained by a simple visual inspection of theplots.
RESULTS AND DISCUSSIONIt is important to remark that this paper does not intend to providea faithful replica of the olfactory circuits but rather it is centeredon the study of the information content of the spiking sequenceand in particular of the spikes latency coding. Then the com-plexity of the network was kept as low as possible adopting anarchitecture with a single layer of spiking neurons. Two differenttopologies characterized by the presence and the absence of lateralinhibitions were taken into consideration. The object of the paper
FIGURE 8 | Illustration of the features used to describe both the
spiking neural network and the glomeruli layer response to vapors. Thetime at which DR is calculated corresponds to the time when the slowestneuron fires its second spike. The average firing rate is calculated in thetime interval T*.
was the investigation of the vapor recognition properties of thespike latency. The latency time of the first spike indicated a limitedgas discrimination while a significant improvement was obtainedconsidering as the measurement descriptor the latency times of thefirst two spikes fired by each neuron of the network (i.e., T1 andT2 in Figure 8). All glomeruli generates their first two spikes in lessthan 120 s providing about 65% of reduction of measuring timewith respect to the standard measurement protocol where the endof measure occurs when the analog signals reach their steady-statevalues.
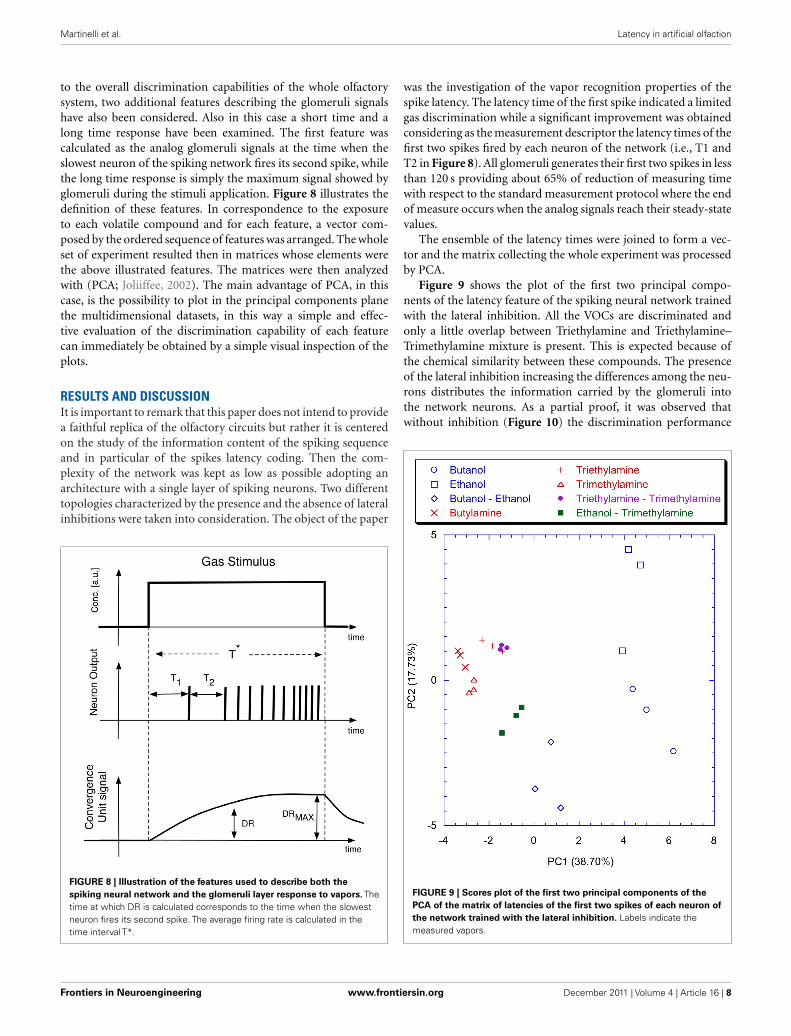
The ensemble of the latency times were joined to form a vec-tor and the matrix collecting the whole experiment was processedby PCA.
Figure 9 shows the plot of the first two principal compo-nents of the latency feature of the spiking neural network trainedwith the lateral inhibition. All the VOCs are discriminated andonly a little overlap between Triethylamine and Triethylamine–Trimethylamine mixture is present. This is expected because ofthe chemical similarity between these compounds. The presenceof the lateral inhibition increasing the differences among the neu-rons distributes the information carried by the glomeruli intothe network neurons. As a partial proof, it was observed thatwithout inhibition (Figure 10) the discrimination performance
FIGURE 9 | Scores plot of the first two principal components of the
PCA of the matrix of latencies of the first two spikes of each neuron of
the network trained with the lateral inhibition. Labels indicate themeasured vapors.
Frontiers in Neuroengineering www.frontiersin.org December 2011 | Volume 4 | Article 16 | 8

Martinelli et al. Latency in artificial olfaction
FIGURE 10 | Scores plot of the first two principal components of the
PCA of the matrix of latencies of the first two spikes of the neurons of
the network trained without the lateral inhibition. Labels indicate themeasured vapors.
was reduced to the basic, and somewhat chemically straightfor-ward, separation between alcohols and amines. Furthermore, ifa certain separation among alcohols can actually be observedthe amines are completely overlapped in Figure 10. This resultis somewhat unexpected because the response of the individ-ual receptors to amines is much larger with than to alcohols.This suggests that the absence of inhibition makes the networkunable to capture the differences among different gases whena large response is obtained for the chemical indicators. It isinteresting to note that a larger analog signal corresponds to anincrease of the spike rate from the convergence layer. The satu-ration effect could only be related to the frequency response ofthe network and the I/F algorithm. It could probably be avoidedby a careful choice of the parameters. Nonetheless it is interestingto observe that inhibition prevents the occurrence of the satura-tion effects maintaining unaltered the olfactory system propertiesin the whole range of signals even for a non-optimized choice ofparameters.
To point out the contribution of the spiking neural network,the classification properties of the analog glomeruli signals wasconsidered. In Figure 11 the plot of the first two principal com-ponents of the PCA of the matrix of the glomeruli analog signalsis shown. To consider the short time response, the glomeruli sig-nal was considered at the time when the slowest neuron of thespiking neural network, trained with lateral inhibition, fires its sec-ond spike. According to Figure 11 the discrimination of volatile
FIGURE 11 | Scores plot of the first two principal components of the
PCA of the matrix of the analog signals of the glomeruli evaluated at
the time when the slowest neuron fires the second spike. The networkwas trained with the lateral inhibition and for each measure presentation,the coefficient updating procedure was stopped when the slowest neuronfires the second spike. Labels indicate the measured vapors.
compounds appears worse with respect to that obtained with thespike latencies of the network with inhibition. Another interestingdetail to note is that the explained variance of the first two prin-cipal components of the PCA of the latencies matrices (Figures 9and 10) are significantly less with respect to the first two prin-cipal components of the PCA of the matrix collecting the analogglomeruli signals (Figure 11). This result indicates that the spikingnetwork performs a faster separation of the different sources ofinformation; furthermore, in presence of lateral inhibition thedifferences among neurons responses are more prominent andthen the signal decorrelation becomes more evident. However,in the experiment described here the contribution to the classi-fication of the principal components of order higher than two isnegligible. It is also important to note that for the network withinhibition, the odor recognition property does not change signif-icantly considering further latencies related to spikes beyond thesecond spike (data not shown). The classification improves butnot dramatically when the average firing rate is considered (seeFigure 12). These results are qualitatively similar to that obtainedusing the maximum glomerular signal (see Figure 13) suggestingthat when the sensors reach the dynamic equilibrium with thegas, the classification is completely explained in the input dataand the contribution of the network processing becomes negli-gible. It is interesting to note that for the average firing rate the
Frontiers in Neuroengineering www.frontiersin.org December 2011 | Volume 4 | Article 16 | 9

Martinelli et al. Latency in artificial olfaction
FIGURE 12 | Scores plot of the first two principal components of the
PCA of the matrix of the average firing rate of the neurons of the
network trained with the lateral inhibition. Labels indicate the measuredvapors.
variance explained by the first two principal components is morethan 95% confirming the large correlation of the neurons firingrates. This result also suggests that the lateral inhibition mainlyinfluences the distribution of the information content carried bythe neuron in the initial part of the signal while in the last part itscontribution is related to a sort of a scale factor of the glomerulisignals. As further confirmation of this hypothesis, no decrease ofperformance is observed removing the inhibition using the firingrate as the input (data not shown). This result leads to believethat the lateral inhibition, in this network structure, affects sig-nificantly only the information contained in the initial part of thespike sequences. In order to show the importance of the initial partof the response, the network was also trained stopping the learn-ing procedure immediately after the second spike of the slowestneuron is fired. Surprisingly, the results of the PCA calculated withthe latencies of the first two spikes and the firing rate are qualita-tively similar. This result indicates that the very initial part of theresponse is of outmost importance and then only this portion ofthe response could be used in reducing dramatically the compu-tational and the experimental time. Noteworthy, the length of theinitial part is dynamically determined by the network as the timenecessary to get two spikes from all the neurons and then this timecan be variable according to the magnitude and the dynamics ofthe receptor responses. Ultimately, for a given set of receptors thistime depends on the kind of vapor. The reduction of measurementtime using only the first portion of sensor response was attempted
FIGURE 13 | Scores plot of the first two principal components of the
PCA calculated on the matrix of the maximum analog signals of the
glomeruli. Labels indicate the measured vapors.
in the past as by using the dynamic properties of sensors (Davideet al., 1995; Di Natale et al., 1995; Eklöv et al., 1997; Nakamotoet al., 1997; Gutierrez-Osuna et al., 1999; Muezzinoglu et al., 2009).In these studies the measurement time was generally determinedaccording to a previous knowledge about the dynamics of thesensors. In the present case the duration of the measurement isdetermined by the network processing the global set of receptorshierarchically arranged in glomeruli-like structures and the lengthof time necessary for a single measurement is variable for eachsample but always less than 35% of the time necessary for the ana-log signal to reach the steady-state. It is important to remark thatthe dynamic responses of the chemical reporters in the sensinglayer are also affected by their spatial arrangement with respect tothe inlet and the outlet of the cell where the sensor layer is accom-modated. As a consequence, also the latency pattern of the networkis dependent by the position of the chemical indicators giving afurther degree of freedom for the system design and optimization.Furthermore, considering that the indicators are immersed in asupporting polymer layer, the latency pattern depends also on thediffusion of volatile compounds through the polymer. This featurewas demonstrated to lead to a sort of artificial olfactory mucosa(Dini et al., 2009) mimicking the separation of volatile compoundscharacterized by different alkyl chain lengths and steric effects(Kent et al., 1996). The possibility to use the latency as features fordiscrimination tasks can open a different approach to chemicalsensing. Actually exploiting these descriptors it would be possibleto define the gas exposure as the time necessary to obtain the
Frontiers in Neuroengineering www.frontiersin.org December 2011 | Volume 4 | Article 16 | 10

Martinelli et al. Latency in artificial olfaction
occurrence of the first spikes at the network output. This strat-egy would offer some interesting aspects. The first is relatedto the measurement time that it should be not fixed but itshould adapt itself on the gas under measure. Moreover thisapproach should guarantee a short measurement time withrespect to the standard protocol counteracting the aging andpoisoning of the devices that is probably the main cause ofthe chemical sensor drift (Martinelli et al., 2011). It is impor-tant to remark, that these results have been derived from anexperiment aimed at measuring a limited set of volatile com-pounds. However, since the test compounds (amines and alco-hols) are good representative of donor and acceptor molecules,they elicit a sufficiently range of responses. The findings hereoutlined may substantially be corroborated by more extensivemeasurements with a larger number of repetitions to studythe relationship between the network property and the sensorsreproducibility.
CONCLUSIONAn artificial olfactory system based on a large array of opto-chemical sensors coupled with a bio-inspired signal processingarchitecture is shown. The processing strategy took into consid-eration a convergence layer that mimics the role of glomeruli andencodes the signals of the sensors into sequences of spikes to beprocessed by a spiking neural network. The aim of this work wasto investigate the possibility to use the spike latency of the net-work outputs as a useful descriptor for the odor recognition. Theresults show that the first two spikes of neural network neuronscontain enough information to discriminate the different vaporsconfirming the experimental evidences obtained on animals. Ithas also been put in evidence the fundamental role of the lateralinhibition in the information processing of the very initial partof sensor signals and how it is possible to exploit the character-istics of the latency coding to define an adaptive gas exposurestrategy.
REFERENCESChen, H. T., Ng, K. T., Bermak, A.,
Law, M. K., and Martinez, D. (2011).Spike latency coding in biologi-cally inspired microelectronic nose.IEEE Trans. Biomed. Circuits Syst. 5,160–168.
Davide, F., Di Natale, C., D’Amico,A., Hierlemann, A., Mitrovics, J.,Schweizer, M., Weimar, U., Göpel,W., Marco, S., and Pardo, A.(1995). Dynamic calibration ofQMB polymer-coated sensors byWiener kernel estimation. Sens.Actuators B Chem.27, 275–285.
Di Natale, C., Marco, S., Davide, F.,and D’Amico, A. (1995). Sensorarray calibration time reduction bydynamic modeling. Sens. Actuators BChem. 24, 578–583.
Di Natale, C., Martinelli, E., Paolesse, R.,D’Amico,A., Filippini, D., and Lund-ström, I. (2008). An experimen-tal biomimetic platform for artifi-cial olfaction. PLoS ONE 3, e3139.doi:10.1371/journal.pone.0003139
Di Natale, C., Santonico, M., Paolesse,R., Filippini, D., D’Amico, A., andLundstrom, I. (2010). Evaluation ofthe performance of sensors based onoptical imaging of a chemically sen-sitive layer. Anal. Bioanal. Chem. 397,613–621.
Dickinson, T., Michael, K., Kauer, J.,and Walt, D. (1999). Convergent selfencoded bead sensor arrays in thedesign of an artificial nose. Anal.Chem. 71, 2192–2198.
Dini, F., Martinelli, E., Pomarico, G.,Paolesse, R., Monti, D., Filippini,D., D’Amico, A., Lundstrom, I.,and Di Natale, C. (2009). Chemi-cal sensitivity of self-assembled por-phyrin nano-aggregates. Nanotech-nology 20, 055502.
Duda, R., Hart, P., and Stork, D. (2000).Pattern Classification. New York:John Wiley and Sons.
Eklöv, T., Mårtensson, P., and Lund-ström, I. (1997). Enhanced selec-tivity of MOSFET gas sensors bysystematical analysis of transientparameters. Anal. Chim. Acta 353,291–300.
Ferster, D., and Spruston, N. (1995).Cracking the neuronal code. Science270, 756–757.
Filippini, D., Alimelli, A., Di Natale, C.,Paolesse, R., D’Amico, A., and Lund-strom, I. (2006). Chemical sensingwith familiar devices. Angew. Chem.Int. Ed. Engl. 45, 3800–3803.
Filippini, D., and Lundström, I. (2006).Preferential color substances andoptimized illuminations for com-puter screen photo-assisted clas-sification. Anal. Chim. Acta 557,240–241.
Filippini, D., Svensson, X., and Lund-strom, I. (2003). Computer screen asa programmable light source for vis-ible absorption characterization of(bio)chemical assays. Chem. Com-mun. 9, 240–241.
Firestein, S. (2001). How the olfactorysystem makes sense of scents. Nature413, 211–218.
Galizia, G., and Menzel, R. (2000).Odour perception in honeybees:coding information in glomerularpatterns. Curr. Opin. Neurobiol. 10,504–510.
Gardner, J., and Bartlett, P. (1994).A brief history of electronicnoses. Sens. Actuators B Chem. 18,211–220.
Gerstner, W., and Kistler, W. M. (2002).Spiking Neuron Models: Single Neu-rons, Populations, Plasticity. Cam-bridge: Cambridge University Press.
Gollisch, T., and Meister, M. (2008).Rapid neural coding in the retinawith relative spike latencies. Science319, 1108–1111.
Gutierrez-Osuna, R., Nagle, H. T., andSchiffman, S. S. (1999). Transientresponse analysis of an electronicnose using multi-exponential mod-els. Sens. Actuators B Chem. 61,170–182.
Hallem, E., Ho, M., and Carlson, J.(2004). The molecular basis of odorcoding in the Drosophila antenna.Cell 117, 965–979.
Heil, P. (2004). First-spike latency ofauditory neurons revisited. Curr.Opin. Neurobiol. 14, 461–467.
Imai, T., Suzuki, M., and Sakano, H.(2006). Odorant receptor derivedcAMP dignals direct axonal target-ing. Science 314, 657–661.
Joliiffee, I. (2002). Principal ComponentAnalysis, 2nd Edn. Berlin: Springer.
Junek, S., Kludt, E., Wolf, F., and Schild,D. (2010). Olfactory coding withpatterns of response latencies. Neu-ron 67, 872–884.
Kent, P. F., Mozell, M. M., Murphy, S.J., and Hornung, D. E. (1996). J.Neurosci. 16, 345–353.
Koickal, T. J., Hamilton, A., Tan, S.L., Covington, J. A., Gardner, J. W.,Pearce, T. C. (2007). AnalogVLSI cir-cuit implementation of an adaptiveneuromorphic olfaction chip. IEEETrans. Circuits Syst. 54, 60–73.
Korsching, S. (2002). Olfactory mapsand odor images. Curr. Opin. Neu-robiol. 12, 387–392.
Maass, W. (1997). The Third Genera-tion of Neural Network Models. Graz:Technische Universität.
Maass, W. (1999). “Computing withspiking neurons,” in Pulsed NeuralNetworks, eds W. Maass and C.
M. Bishop (Cambridge: MIT press),55–85.
Malnic, B., Hirono, J., Sato, T., and Buck,L. (1999). Combinatorial receptorcodes for odors. Cell 96, 713–723.
Martinelli, E., D’Amico, A., and DiNatale, C. (2006). Spike Encodingof artificial olfactory sensor sig-nals. Sens. Actuators B Chem. 119,234–238.
Martinelli, E., Santonico, M., Pennazza,G., Paolesse, R., D’Amico, A., andDi Natale, C. (2011). Short time gasdelivery pattern improves long-termsensor reproducibility. Sens. Actua-tors B Chem. 156, 753–759.
Michael, L., and Johnson, B. (2003).Olfactory coding in the mammalianolfactory bulb. Brain Res. Rev. 42,23–32.
Muezzinoglu, M., Vergara, A., Huerta,R., Rulkov, N., Rabinovich, M.,Selverston, A., and Abarbanel, H.(2009). Acceleration of chemo-sensory information processingusing transient features. Sens.Actuators B Chem. 134, 507–512.
Nakamoto, T., Okazaki, N., and Mori-izumi, T. (1997). High speed activegas/odor sensing system using adap-tive control theory. Sens. Actuators BChem. 41, 183–188.
Persaud, K., and Dodds, G. (1982).Analysis of discrimination mecha-nisms in the mammalian olfactorysystem using a model nose. Nature299, 352–355.
Polese, D., Magna, G., Dini, F., Mar-tinelli, E., Paolesse, R., D’Amico,A., Filippini, D., Lundström, I., andDi Natale, C. (2011). Facile sen-sors replacement in optical gas sen-sors array, Proc. of Eurosensors XXV,Athens (4–6/9/2011) to appear inProcedia Engineering.
Frontiers in Neuroengineering www.frontiersin.org December 2011 | Volume 4 | Article 16 | 11

Martinelli et al. Latency in artificial olfaction
Rieke, F., Warland, D., de Ruyter, R.,van Steveninck, R., and Bialek, W.(1996). Spike-Exploring the NeuralCode, Cambridge: MIT press.
Sicard, G., and Holley, A. (1984).Receptor cell responses to odor-ants: similarities and differencesamong odorants. Brain Res. 292,283–296.
Thorpe, S., Fize, D., and Marlot, C.(1996). Speed of processing in the
human visual system. Nature 381,520–522.
Uchida, N., and Mainen, Z. (2003).Speed and accuracy of olfactory dis-crimination in the rat. Nat. Neurosci.6, 1224–1229.
Conflict of Interest Statement: Theauthors declare that the research wasconducted in the absence of anycommercial or financial relationships
that could be construed as a potentialconflict of interest.
Received: 19 September 2011; paperpending published: 28 October 2011;accepted: 28 November 2011; publishedonline: 20 December 2011.Citation: Martinelli E, Polese D, Dini F,Paolesse R, Filippini D, Lundström I andDi Natale C (2011) An investigation onthe role of spike latency in an artificial
olfactory system. Front. Neuroeng. 4:16.doi: 10.3389/fneng.2011.00016Copyright © 2011 Martinelli, Polese,Dini, Paolesse, Filippini, Lundströmand Di Natale. This is an open-accessarticle distributed under the terms ofthe Creative Commons Attribution NonCommercial License, which permits non-commercial use, distribution, and repro-duction in other forums, provided theoriginal authors and source are credited.
Frontiers in Neuroengineering www.frontiersin.org December 2011 | Volume 4 | Article 16 | 12