Embed Size (px)
Citation preview
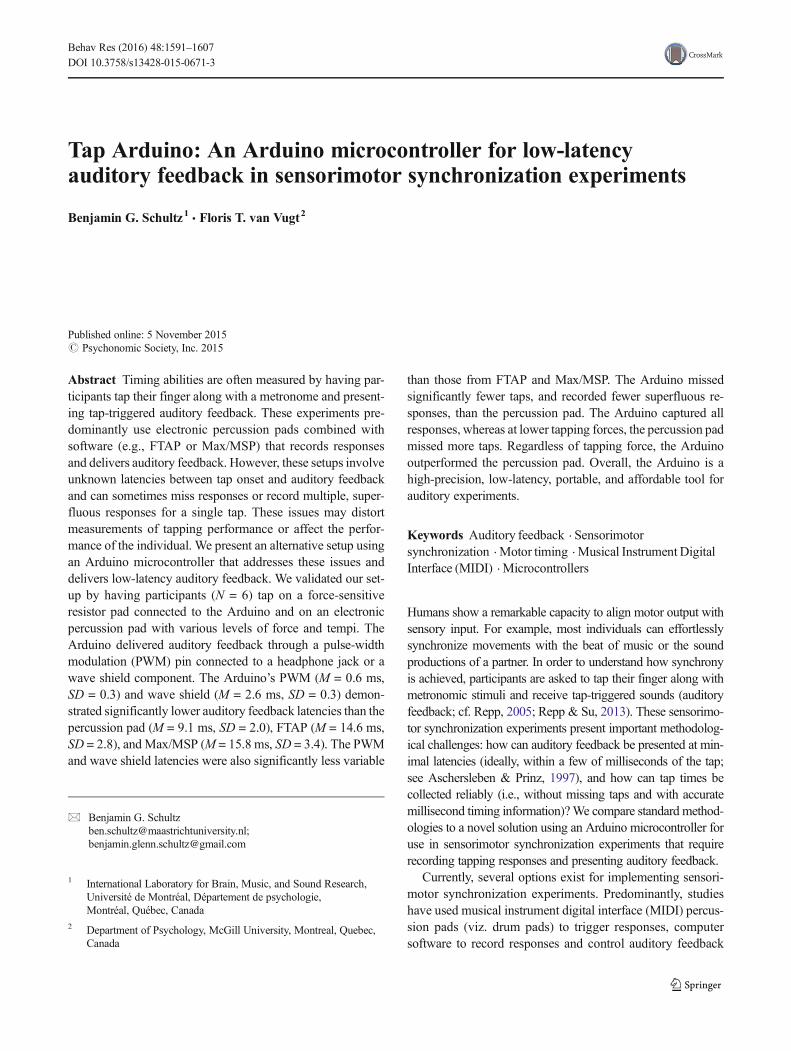
Tap Arduino: An Arduino microcontroller for low-latencyauditory feedback in sensorimotor synchronization experiments
Benjamin G. Schultz1 & Floris T. van Vugt2
Published online: 5 November 2015# Psychonomic Society, Inc. 2015
Abstract Timing abilities are often measured by having par-ticipants tap their finger along with a metronome and present-ing tap-triggered auditory feedback. These experiments pre-dominantly use electronic percussion pads combined withsoftware (e.g., FTAP or Max/MSP) that records responsesand delivers auditory feedback. However, these setups involveunknown latencies between tap onset and auditory feedbackand can sometimes miss responses or record multiple, super-fluous responses for a single tap. These issues may distortmeasurements of tapping performance or affect the perfor-mance of the individual. We present an alternative setup usingan Arduino microcontroller that addresses these issues anddelivers low-latency auditory feedback. We validated our set-up by having participants (N = 6) tap on a force-sensitiveresistor pad connected to the Arduino and on an electronicpercussion pad with various levels of force and tempi. TheArduino delivered auditory feedback through a pulse-widthmodulation (PWM) pin connected to a headphone jack or awave shield component. The Arduino’s PWM (M = 0.6 ms,SD = 0.3) and wave shield (M = 2.6 ms, SD = 0.3) demon-strated significantly lower auditory feedback latencies than thepercussion pad (M = 9.1 ms, SD = 2.0), FTAP (M = 14.6 ms,SD = 2.8), and Max/MSP (M = 15.8 ms, SD = 3.4). The PWMand wave shield latencies were also significantly less variable
than those from FTAP and Max/MSP. The Arduino missedsignificantly fewer taps, and recorded fewer superfluous re-sponses, than the percussion pad. The Arduino captured allresponses, whereas at lower tapping forces, the percussion padmissed more taps. Regardless of tapping force, the Arduinooutperformed the percussion pad. Overall, the Arduino is ahigh-precision, low-latency, portable, and affordable tool forauditory experiments.
Keywords Auditory feedback . Sensorimotorsynchronization .Motor timing .Musical Instrument DigitalInterface (MIDI) . Microcontrollers
Humans show a remarkable capacity to align motor output withsensory input. For example, most individuals can effortlesslysynchronize movements with the beat of music or the soundproductions of a partner. In order to understand how synchronyis achieved, participants are asked to tap their finger along withmetronomic stimuli and receive tap-triggered sounds (auditoryfeedback; cf. Repp, 2005; Repp & Su, 2013). These sensorimo-tor synchronization experiments present important methodolog-ical challenges: how can auditory feedback be presented at min-imal latencies (ideally, within a few of milliseconds of the tap;see Aschersleben & Prinz, 1997), and how can tap times becollected reliably (i.e., without missing taps and with accuratemillisecond timing information)?We compare standard method-ologies to a novel solution using an Arduino microcontroller foruse in sensorimotor synchronization experiments that requirerecording tapping responses and presenting auditory feedback.
Currently, several options exist for implementing sensori-motor synchronization experiments. Predominantly, studieshave used musical instrument digital interface (MIDI) percus-sion pads (viz. drum pads) to trigger responses, computersoftware to record responses and control auditory feedback
* Benjamin G. [email protected];[email protected]
1 International Laboratory for Brain, Music, and Sound Research,Université de Montréal, Département de psychologie,Montréal, Québec, Canada
2 Department of Psychology, McGill University, Montreal, Quebec,Canada
Behav Res (2016) 48:1591–1607DOI 10.3758/s13428-015-0671-3
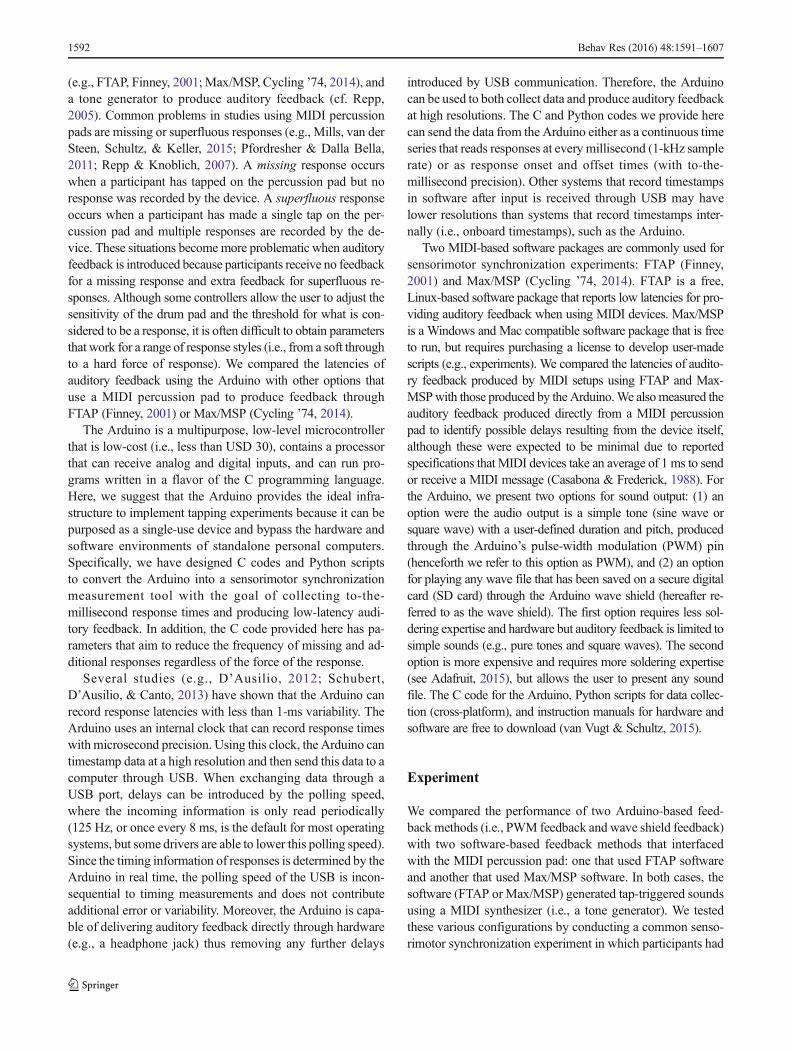
(e.g., FTAP, Finney, 2001; Max/MSP, Cycling ’74, 2014), anda tone generator to produce auditory feedback (cf. Repp,2005). Common problems in studies using MIDI percussionpads are missing or superfluous responses (e.g., Mills, van derSteen, Schultz, & Keller, 2015; Pfordresher & Dalla Bella,2011; Repp & Knoblich, 2007). A missing response occurswhen a participant has tapped on the percussion pad but noresponse was recorded by the device. A superfluous responseoccurs when a participant has made a single tap on the per-cussion pad and multiple responses are recorded by the de-vice. These situations become more problematic when auditoryfeedback is introduced because participants receive no feedbackfor a missing response and extra feedback for superfluous re-sponses. Although some controllers allow the user to adjust thesensitivity of the drum pad and the threshold for what is con-sidered to be a response, it is often difficult to obtain parametersthat work for a range of response styles (i.e., from a soft throughto a hard force of response). We compared the latencies ofauditory feedback using the Arduino with other options thatuse a MIDI percussion pad to produce feedback throughFTAP (Finney, 2001) or Max/MSP (Cycling ’74, 2014).
The Arduino is a multipurpose, low-level microcontrollerthat is low-cost (i.e., less than USD 30), contains a processorthat can receive analog and digital inputs, and can run pro-grams written in a flavor of the C programming language.Here, we suggest that the Arduino provides the ideal infra-structure to implement tapping experiments because it can bepurposed as a single-use device and bypass the hardware andsoftware environments of standalone personal computers.Specifically, we have designed C codes and Python scriptsto convert the Arduino into a sensorimotor synchronizationmeasurement tool with the goal of collecting to-the-millisecond response times and producing low-latency audi-tory feedback. In addition, the C code provided here has pa-rameters that aim to reduce the frequency of missing and ad-ditional responses regardless of the force of the response.
Several studies (e.g., D’Ausilio, 2012; Schubert,D’Ausilio, & Canto, 2013) have shown that the Arduino canrecord response latencies with less than 1-ms variability. TheArduino uses an internal clock that can record response timeswith microsecond precision. Using this clock, the Arduino cantimestamp data at a high resolution and then send this data to acomputer through USB. When exchanging data through aUSB port, delays can be introduced by the polling speed,where the incoming information is only read periodically(125 Hz, or once every 8 ms, is the default for most operatingsystems, but some drivers are able to lower this polling speed).Since the timing information of responses is determined by theArduino in real time, the polling speed of the USB is incon-sequential to timing measurements and does not contributeadditional error or variability. Moreover, the Arduino is capa-ble of delivering auditory feedback directly through hardware(e.g., a headphone jack) thus removing any further delays
introduced by USB communication. Therefore, the Arduinocan be used to both collect data and produce auditory feedbackat high resolutions. The C and Python codes we provide herecan send the data from the Arduino either as a continuous timeseries that reads responses at every millisecond (1-kHz samplerate) or as response onset and offset times (with to-the-millisecond precision). Other systems that record timestampsin software after input is received through USB may havelower resolutions than systems that record timestamps inter-nally (i.e., onboard timestamps), such as the Arduino.
Two MIDI-based software packages are commonly used forsensorimotor synchronization experiments: FTAP (Finney,2001) and Max/MSP (Cycling ’74, 2014). FTAP is a free,Linux-based software package that reports low latencies for pro-viding auditory feedback when using MIDI devices. Max/MSPis a Windows and Mac compatible software package that is freeto run, but requires purchasing a license to develop user-madescripts (e.g., experiments). We compared the latencies of audito-ry feedback produced by MIDI setups using FTAP and Max-MSPwith those produced by the Arduino.We alsomeasured theauditory feedback produced directly from a MIDI percussionpad to identify possible delays resulting from the device itself,although these were expected to be minimal due to reportedspecifications that MIDI devices take an average of 1 ms to sendor receive a MIDI message (Casabona & Frederick, 1988). Forthe Arduino, we present two options for sound output: (1) anoption were the audio output is a simple tone (sine wave orsquare wave) with a user-defined duration and pitch, producedthrough the Arduino’s pulse-width modulation (PWM) pin(henceforth we refer to this option as PWM), and (2) an optionfor playing any wave file that has been saved on a secure digitalcard (SD card) through the Arduino wave shield (hereafter re-ferred to as the wave shield). The first option requires less sol-dering expertise and hardware but auditory feedback is limited tosimple sounds (e.g., pure tones and square waves). The secondoption is more expensive and requires more soldering expertise(see Adafruit, 2015), but allows the user to present any soundfile. The C code for the Arduino, Python scripts for data collec-tion (cross-platform), and instruction manuals for hardware andsoftware are free to download (van Vugt & Schultz, 2015).
Experiment
We compared the performance of two Arduino-based feed-backmethods (i.e., PWM feedback and wave shield feedback)with two software-based feedback methods that interfacedwith the MIDI percussion pad: one that used FTAP softwareand another that used Max/MSP software. In both cases, thesoftware (FTAP or Max/MSP) generated tap-triggered soundsusing a MIDI synthesizer (i.e., a tone generator). We testedthese various configurations by conducting a common senso-rimotor synchronization experiment in which participants had
1592 Behav Res (2016) 48:1591–1607
to synchronize their responses to metronome clicks that oc-curred at periodic time intervals (cf. Repp, 2005). In order toestablish the veridical onset times of responses and auditoryfeedback in each setup, we recorded data from the variousdevices simultaneously in a synchronized manner using anana log inpu t box (AIB; B ioSemi , Ams te rdam,The Netherlands). The AIB recorded voltage readings froma force sensitive resistor (FSR) on which participants tappedand a vibration sensor (i.e., a piezo element) that measuredtap-related vibrations. Participants did not hear auditory feed-back for responses, but auditory feedback from the variousdevices (the Arduino, MIDI percussion pad, and MIDI soundmodule) was recorded by the AIB. The behavioral results ofparticipants (e.g., synchrony with the metronome) are irrele-vant to the aim of testing equipment performance and, there-fore, are not reported.
Design and hypotheses
The dependent variable was the asynchrony between the re-sponse onset (i.e., taps, as measured by the FSR) and the audioonset (i.e., auditory feedback) recorded from each device. Thisasynchrony measured the latency of the auditory feedback foreach source. Five sources of auditory feedback were measured:Arduino PWM,Arduinowave shield, percussion pad, FTAP, andMax/MSP. These sources of feedback could not all be measuredsimultaneously. Therefore, five conditions were used to measurevarious combinations of feedback sources, as shown in Table 1.In three conditions (see rows 1 to 3 in Table 1), participantstapped on an FSR that was placed on a drum pad of the percus-sion controller. In two conditions (see rows 4 and 5), participantsonly tapped on the drum pad of the percussion controller. Thiswas done to ensure that the presence of the FSR did not hinderthe percussion pad in terms of feedback latencies, missed re-sponses, or superfluous responses; we compared the asyn-chronies of the onsets recorded by the piezo vibration sensorand the percussion pad audio onsets in the FSR present andabsent conditions (see Table 1) to test whether the presence ofthe FSR increased the percussion pad audio latency. For missedand superfluous responses, we compared the responses recordedby the percussion pad in the FSR absent conditions with the
responses recorded by the Arduino in the FSR presentconditions.
Because individuals may differ in their tapping style andtapping force, we had six participants respond under threetypes of tapping force instructions: soft, moderate, and hard.To examine whether different tapping speeds affected feed-back latency, number of missed taps, and number of doubletaps, a fast (240 beats per minute; bpm) and a slow (120 bpm)metronome rate were presented. Participants completed allconditions in a fully within-subjects design. We hypothesizedthat the Arduino conditions (PWM and wave shield) woulddemonstrate significantly lower latencies than the percussionpad, FTAP, andMax/MSP. Similarly, we hypothesized that theArduino conditions would demonstrate significantly lower la-tency variability than the percussion pad, FTAP, and Max/MSP. Finally, we hypothesized that the Arduino would missfewer valid responses and produce fewer superfluous re-sponses than the percussion pad.
Method
Participants
The participants (N = 6) were four volunteers from theUniversité de Montréal and Concordia University, as well asthe two experimenters. The participants had a mean age of28.17 years (SD = 3.19, range = 23–32 years) and consistedof three females and three males.
Materials
Four computers were used for testing. The first computer(Intel Pentium 4, 3.00 GHz, running Windows XP) was usedto record voltages and auditory signals though ActiView soft-ware (BioSemi, Amsterdam, The Netherlands). The secondcomputer (Intel Xeon 5120, 1.86 GHz, running WindowsXP) was used to present metronome stimuli (premade .wavfiles) and record the data from the Arduino via Python (v2.7).The third computer (Intel Core i7-2670QM, 2.2 GHz, runningLinux Ubuntu v3.2.0-23 using the real-time kernel) was usedto run FTAP. The fourth computer (MacBook Pro, Intel Core 2Duo, 2.6GHz, running OS X v10.9.5) was used to produceauditory feedback throughMax/MSP. Responses were record-ed using a square FSR (3.81 cm, Interlink FSR 406) connectedto an Arduino UNO R3 (see Fig. 1). The Arduino waspowered via USB and also transmitted timing informationthough the serial USB port. In the PWM condition, theArduino auditory feedback was delivered through aSparkfun TRRS 3.5-mm jack breakout (BOB-11570; seeFig. 1), commonly known as a headphone jack (i.e., standardheadphone or speakers could be connected to present thesounds to participants in an experimental setup). In the wave
Table 1 Arrangement of feedback conditions
Response Device(s) Arduino Software FSR Presence
FSR and percussion pad PWM FTAP Present
FSR and percussion pad Wave shield FTAP Present
FSR and percussion pad Wave shield Max/MSP Present
Percussion pad None FTAP Absent
Percussion pad None Max/MSP Absent
Each row represents one measurement condition in our experiment
Behav Res (2016) 48:1591–1607 1593
shield condition, the Arduino auditory feedback was deliveredby the headphone jack of an Adafruit Wave Shield version 1.1placed above the Arduino, with the FSR arranged in the sameway as Fig. 1.
The auditory signal from each source was connectedto the 32-pin Sub-D port (similar to a parallel port) ofthe AIB at a sampling rate of 2048 Hz1 (see Fig. 2).Voltage changes caused by applying pressure to theFSR were simultaneously recorded by the AIB to syn-chronize participants’ responses with the auditory feed-back. The AIB has an analog-digital converter for eachchannel allowing the signals to be recorded synchronous-ly. The FSR was placed on the bottom right drum pad ofa Roland Handsonic HPD15 MIDI percussion pad.Voltages from the piezo vibration sensor placed on thesame drum pad were obtained as a secondary measure ofresponse onset time to test if the FSR increased the la-tencies of the percussion pad.2 The audio output of the
percussion pad was connected to the AIB to test thelatency of audio being produced by the percussion paditself. For the FTAP setup (see red boxes and arrows inFig. 2), the MIDI signal from the percussion pad wasconnected to the PC through an M-Audio MIDIsport 2× 2 (Anniversary Edition) USB-MIDI Interface. FTAPreceived the percussion pad MIDI signal via USB andsent the MIDI signal to the USB–MIDI interface, whichthen sent the MIDI signal to a Yamaha TX81Z MIDIsynthesizer (i.e., tone generator) to produce the audio.The audio output from the tone generator was connectedto the AIB to test the latency of audio being produced byFTAP. The conditions with Max/MSP were arranged inthe same way as those with FTAP, using the tone gener-ator to produce the audio, but with Max/MSP recordingresponses and controlling the auditory feedback (see thered boxes and arrows in Fig. 2).
Stimuli
The audio produced by the PWM and wave shield were1046.5-Hz square waves of 20-ms duration. The audio pro-duced by the percussion pad was the R13 snare drum, and the
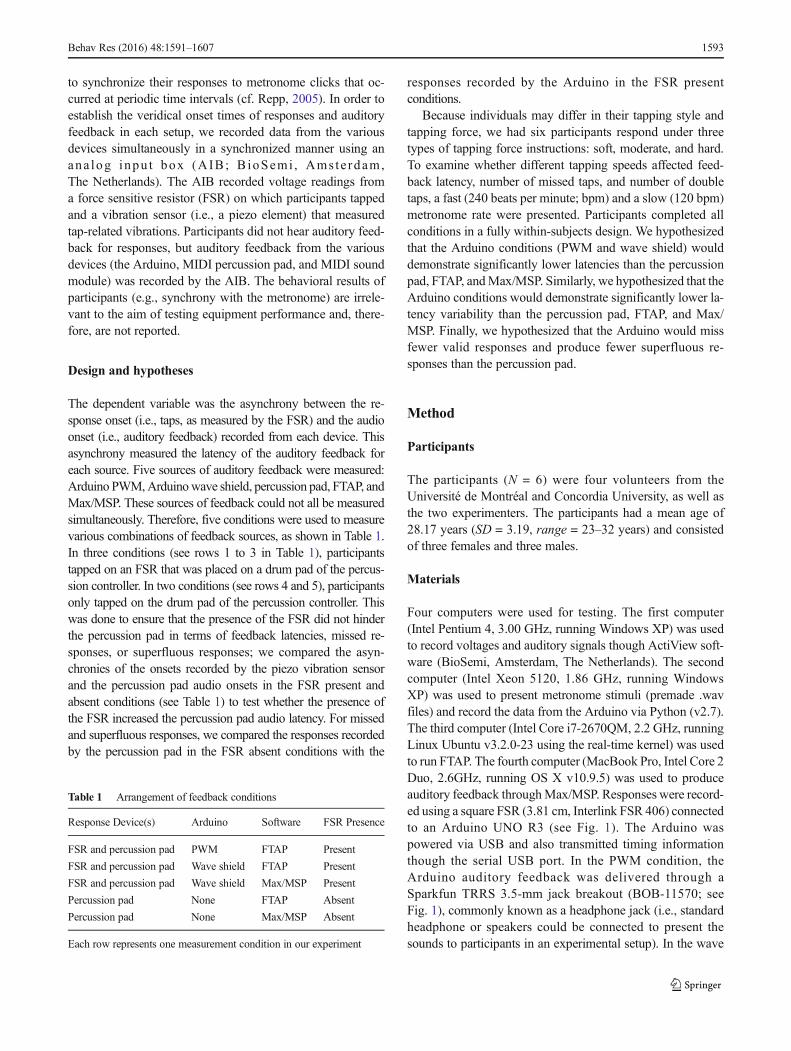
Fig. 1 Schematic wiring diagram for the Arduino PWM setup. Thecomponent numbers correspond to the (1) Arduino UNO, (2) breadboard,(3) square force-sensitive resistor (FSR), and (4) headphone jack(3.5 mm). Electric wires are indicated by black (grounds), red (power),green (FSR signals), and purple (audio signals). Both resistors are 10 kΩ.Headphone jack arrangements may vary, but the two purple wires connectto the tip and ring 1 headphone inputs (left and right audio), and theground (black) wire connects to the ring 2 headphone input (see thedatasheet of the headphone jack for input specifications). The wiring ofthe FSR is identical in the PWM andwave shield setups, and the wiring ofthe headphone jack is not necessary for the wave shield setup. This wiringdiagram will allow prospective users to precisely reproduce our setupfrom the hardware components. The figure was created using the Fritzingsoftware (Knörig, Wettach, & Cohen, 2009)
1 Note that 2048 Hz is not an acceptable sample rate for reproducinghigh-quality audio, but in this case we were simply using it to detect theonsets of auditory signals. The sampling rate is above the Nyquist fre-quency (double the frequency of interest) for the resolution at which werecorded responses (1000 Hz, i.e., to the millisecond), allowing us todetect asynchronies on the order of just below 0.5 ms.
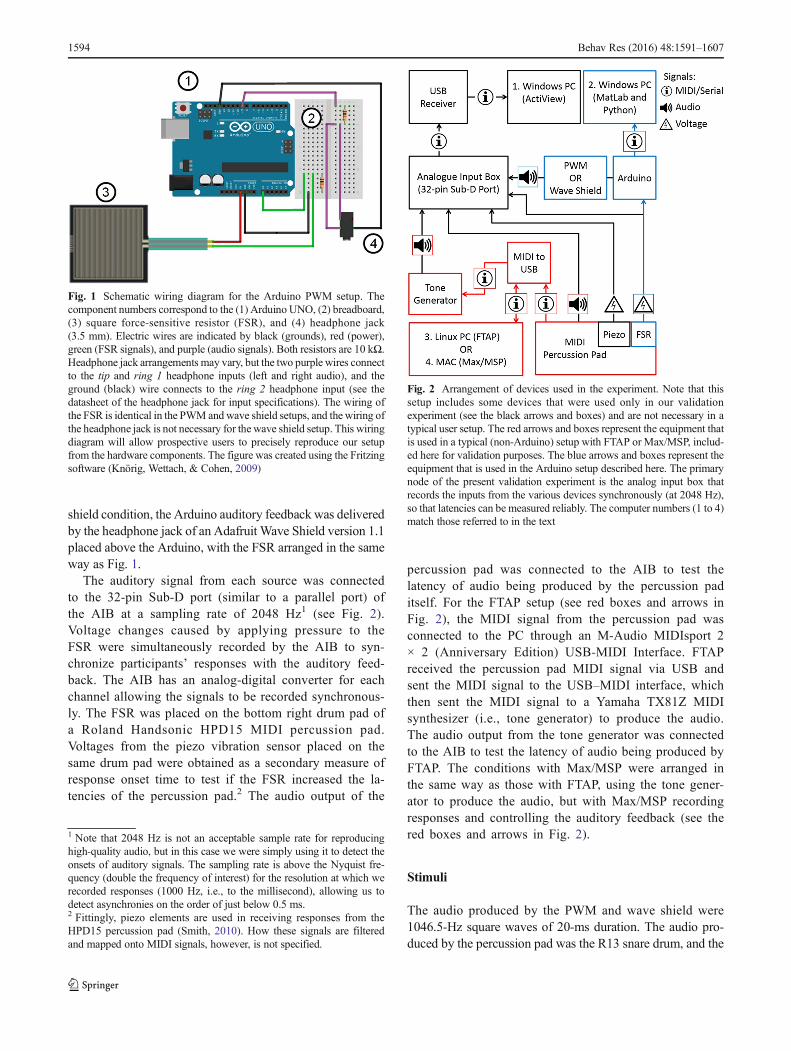
Fig. 2 Arrangement of devices used in the experiment. Note that thissetup includes some devices that were used only in our validationexperiment (see the black arrows and boxes) and are not necessary in atypical user setup. The red arrows and boxes represent the equipment thatis used in a typical (non-Arduino) setup with FTAP or Max/MSP, includ-ed here for validation purposes. The blue arrows and boxes represent theequipment that is used in the Arduino setup described here. The primarynode of the present validation experiment is the analog input box thatrecords the inputs from the various devices synchronously (at 2048 Hz),so that latencies can be measured reliably. The computer numbers (1 to 4)match those referred to in the text
2 Fittingly, piezo elements are used in receiving responses from theHPD15 percussion pad (Smith, 2010). How these signals are filteredand mapped onto MIDI signals, however, is not specified.
1594 Behav Res (2016) 48:1591–1607
audio produced by the synthesizer was the noise shot.3 Thepercussion pad pitch was set to 1046.5 Hz, all effects andreverb were turned off, the trigger mode was set to BShot^(short duration), the velocity curve was set to BFixed16^(maximum volume for every trigger), pad sensitivity was setto 16 (maximum), the pad threshold was set to 1 (minimum),and mask time was set to 64 ms. In FTAP and Max/MSP, theMIDI frequency was set to MIDI note C6 (frequency =1046.5 Hz), duration was set to 20 ms, and MIDI velocitywas set to 127 (maximum).
Software
The C codes presented here perform a series of functions (vanVugt & Schultz, 2015). The Arduino’s analog–digital converter(ADC) interprets FSR voltage changes as 10-bit integers rangingfrom 0 to 1023. First the Arduino reads the time stamp (in mil-liseconds) and the FSR voltage. If the FSR voltage is above ourspecified BON^ threshold (20 in 10-bit Arduino units; user de-finable), then the auditory feedback is played. Another sound isnot produced until the FSR voltage decreases below our BOFF^threshold (10; user definable) for a user-specified amount of time(40 ms), and until a user-specified time after the onset (40 ms).These values were chosen to prevent double taps from arisingwhen responding on the FSR and were arrived at (prior toconducting the experiment) from trial and error of attemptingto induce auditory feedback without superfluous feedback ormissed feedback. Lower voltage thresholds could be implement-ed in the Arduino code to increase the sensitivity, but the valuesused here indicated an optimal trade-off between high sensitivityand a low incidence of false alarms. When the offset is detected,the time stamp of onset, time stamp of offset, and the maximumFSR value are sent to the serial port in binary. The Python coderuns on a separate PC and provides a graphical user interface(GUI) that collects data from the Arduino (through the USB)for further analysis (van Vugt & Schultz, 2015). In particular,the Python code reads binary data from the serial USB port andtransforms the data into integers. These values are printed to atext file. The Python script records data until it is commanded toterminate (via closing the program, a set time value, or uponcompletion of a sound file). Note that it is not necessary to usethis Python GUI to collect data from the Arduino: Users canwrite a custom script in any programming language that is capa-ble of reading binary input from a serial USB port.
Our schematics and scripts are available online (van Vugt& Schultz, 2015), including detailed documentation, makingthis option accessible to those without much technical back-ground. This repository shall be updated on the basis of sug-gestions from the community, and with the addition of scriptsused in various experiments. The authors are willing to receiveany questions about the hardware configuration and scripts toaid other researchers in using Arduino devices.
Procedure
Prior to any conditions that featured FTAP, the FTAP loop testwas performed (see Finney, 2001). The FTAP loop consistentlyreported a 0.49-ms delay between output scheduling calls andthat MIDI messages, on average, were sent and received withinjust over a millisecond (M = 1.01ms, SD = 1.03ms, range = 0 to3 ms). Informed consent was obtained (CERAS-2014-15-/02-D). Participants were instructed to tap on the FSR that wasplaced on top of the percussion pad, or to tap in the center ofthe bottom right drum of the percussion pad. At the beginning ofeach trial, participants were instructed to tap with a soft, moder-ate, or hard force through text on a computer screen. Theseconditions were performed for all tempi (fast, slow) in a random-ized order within each block, for five blocks. This procedure wasrepeated for all five feedback conditions (see Table 1; ordercounterbalanced across participants). At the end of the trial, par-ticipants were asked whether they had produced any double tapsor hadmissed any responses after the first eightmetronome ticks.If they responded Byes,^ the trial was repeated. Otherwise, theyproceeded to the next trial. Participants were unable to monitorwhether auditory feedbackwas being generated from any source.There were 48metronome ticks per trial and, therefore, each trialhad a 12-s (fast tempo) or 24-s (slow tempo) duration.Experiment sessions did not exceed 90 min. Participants werequestioned regarding which tapping force was closest to theirnatural tapping force, and all six indicated that themoderate forcewas most natural.
Results
Onset extraction
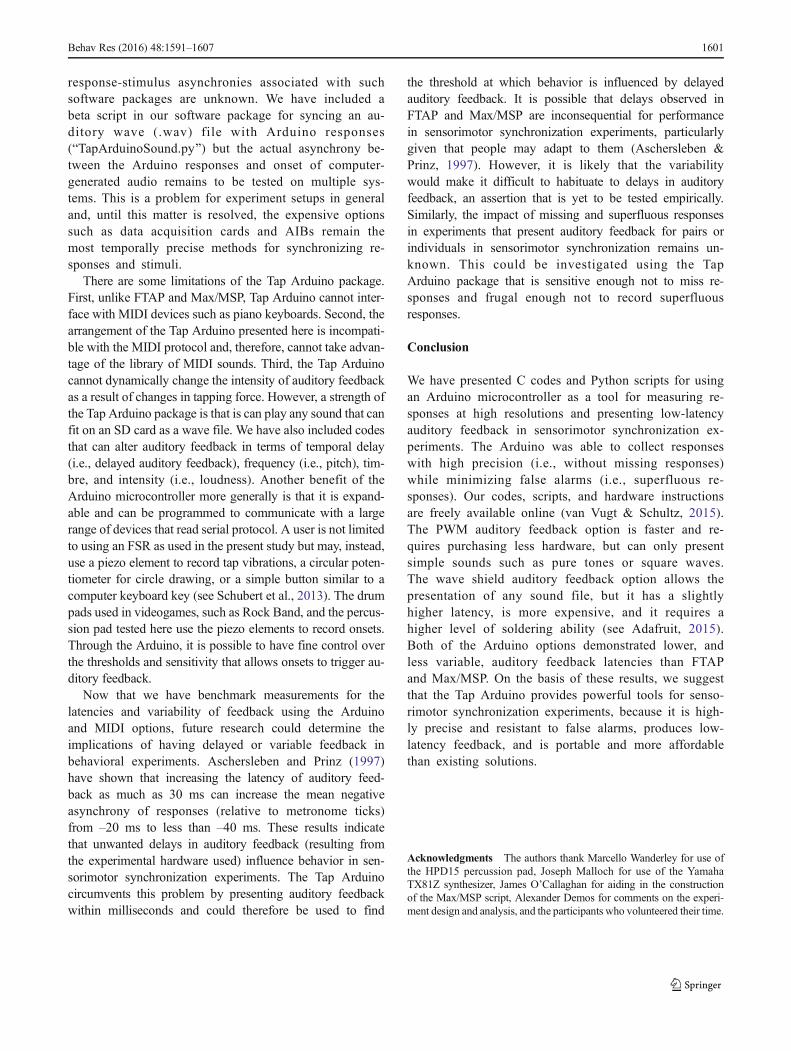
Onsets of voltages and audio signal were detected from thetraces recorded by the AIB using a custom-made MATLABscript. Onsets were detected as values that surpassed an am-plitude threshold. The onset time was then established as thepreceding point in time when the standard deviation (using tensample windows) returned to baseline standard deviationlevels (four times the median standard deviation of the trial).Detected audio onset times are shown in Appendix A. Missedresponses were determined by examining the data output fromthe Arduino, FTAP, and Max/MSP and comparing them with
3 We initially intended to use a square or sine wave of the same frequency(1046.5 Hz) for the MIDI patches on the percussion pad and tone gener-ator, for comparability. Upon inspection of the audio signal, it wasdeemed that the attack times for the square- and sine-wave MIDI patcheswere slower, with less discernible onsets than some other patches. Anonexhaustive test of the available patches indicated that these twoMIDI patches produced the fastest attack times and the most easily dis-cernible onsets and offsets.
Behav Res (2016) 48:1591–1607 1595
the number of expected responses (because participants wereinstructed to repeat the trial if any responses were missed).Only responses after the first eight metronome ticks were con-sidered (i.e., 40 responses were expected per trial) and super-fluous responses were first removed. Superfluous responseswere measured as any response that occurred within 125 ms(half of the smallest interonset interval of the metronome) ofanother response.
Statistical analysis
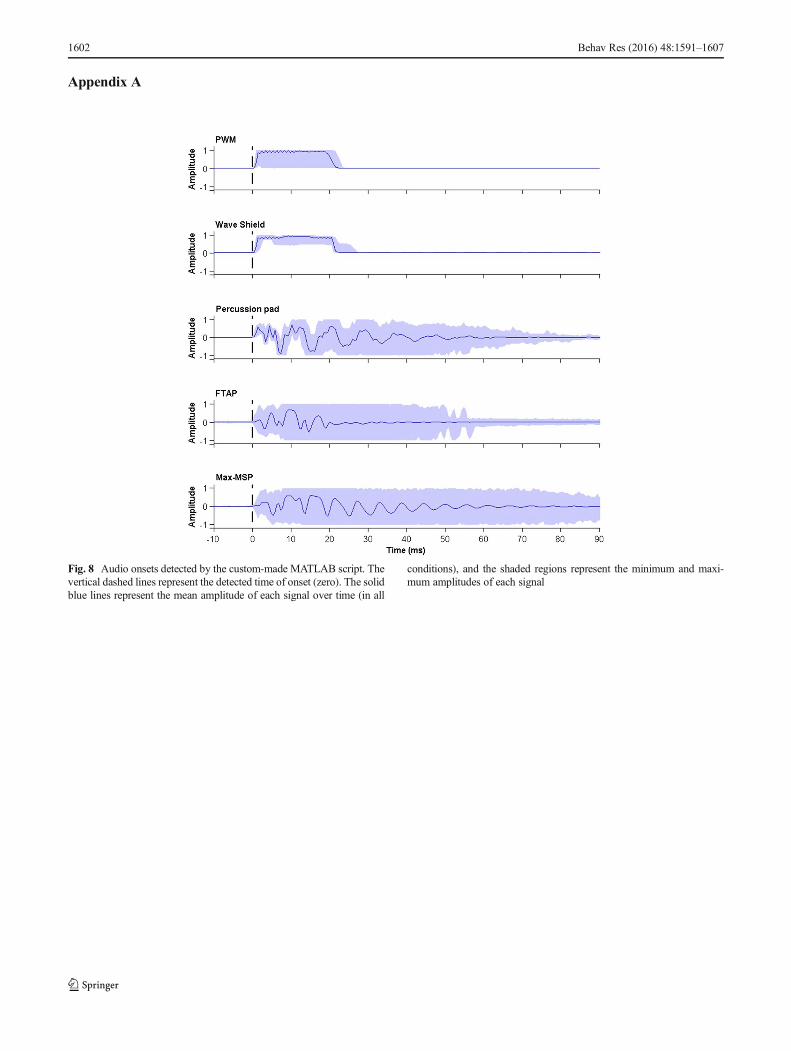
As a result of missed responses, there were unequal numbers ofdata points for the asynchronies in different auditory feedbackconditions. To deal with the problem of unequal data points, wefit a linear mixed-effects model (LMEM) that was able to copewith missing data, inhomogeneity of dependent variable vari-ance across factor levels, and unbalanced designs. The LMEMwas fit to the data with the fixed factors Signal (five levels:Arduino PWM, Arduino wave shield, percussion pad audio,FTAP, Max/MSP), Force (soft, medium, hard), and Tempo(fast, slow), and the random factors Participant (six levels)and Trial (five levels), where trial was nested within participant(i.e., we used the maximal random-effects structure justified bythe experimental design, following Barr, Levy, Scheepers, &Tily, 2013). We further allowed unequal variances across thelevels of the signal factor, which was decided on the basis ofvisual observation that the residuals were heterogeneous for thevarious signals, and also because some dependent variables(e.g., missed responses for the Arduino) had a standard devia-tion of zero. The model was fit using the lme function of thenlme library (Pinheiro, Bates, DebRoy, Sarkar, & RDevelopment Core Team, 2015) for the R package of statisticalcomputing (R Development Core Team, 2013), and unequalvariance was implemented using the varIdent model formulaterm. Pair-wise contrasts were computed using generalized lin-ear hypothesis testing for Tukey contrasts (corrected p valuesare reported), using the glht function in the multcomp library(Hothorn, Bretz, & Westfall, 2008). The LMEM was used toanalyze all of our dependent variables (see Appendix B for theLMEM tables, and Appendix C for examples of the R code).
Classical null-hypothesis testing statistics are not designed tofind evidence for the absence of a difference between conditions.Therefore, we calculated the Bayes factor to test that the FSR didnot affect the performance (latency and variability) of the per-cussion pad in conditions in which the FSR was present ascompared to when it was absent (see Table 1). To include con-ditions in which the FSR was absent, the asynchrony betweenthe piezo vibration sensor onset and the audio onset of the per-cussion pad was compared between the FSR-present and -absentconditions. The Bayes factor quantifies the strength of evidencein favor of the null hypothesis (when less than 1) or in favor ofthe alternative hypothesis (when greater than 1; Rouder,Speckman, Sun, Morey, & Iverson, 2009). The Bayes factor
was computed using the BayesFactor function in theBayesFactor library (Morey, Rouder, & Jamil, 2009).
FSR-aligned audio mean asynchrony
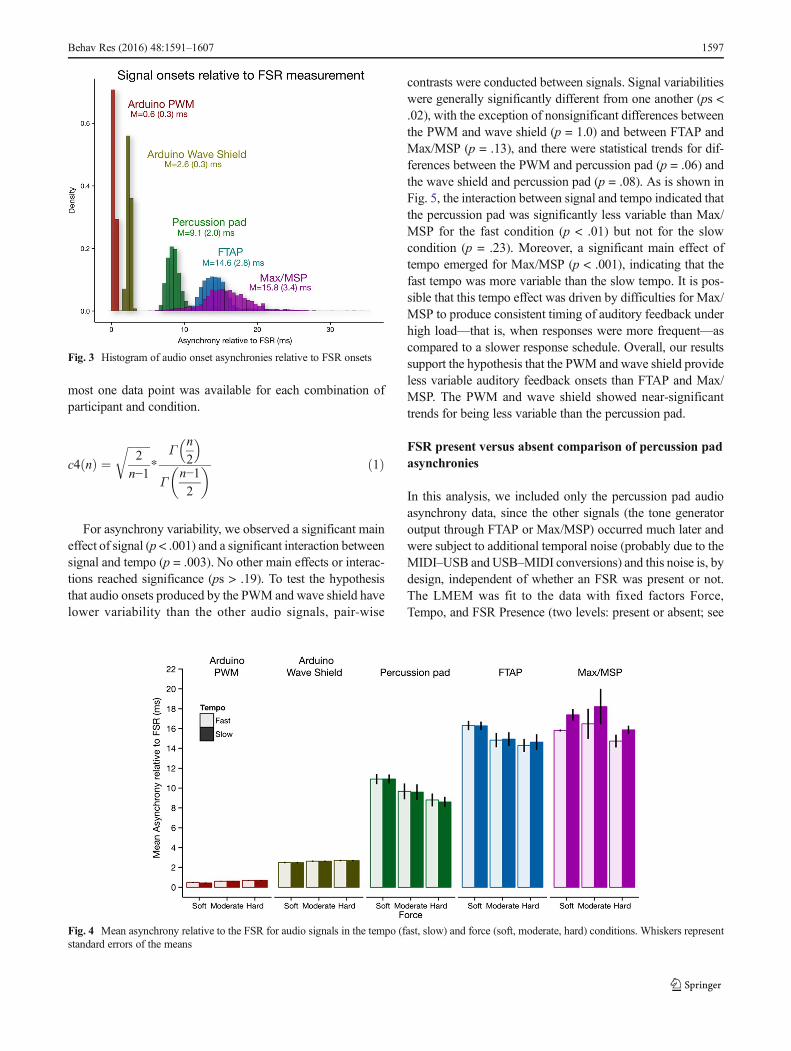
For asynchronies, we found significant main effects of signaland force (ps < .001), and no significant main effect of tempo(p = .11). All interactions reached significance (ps < .001). Totest the hypothesis that audio onsets produced by the PWMand wave shield have lower latencies than other audio signals,pair-wise contrasts were conducted between signals. All sig-nals were significantly different from one another (ps < .001)in the following order, from lowest to highest asynchrony:PWM, wave shield, percussion pad, FTAP, and Max/MSP(see Fig. 3). Pair-wise contrasts investigating the three-wayinteraction between signal, force, and tempo confirmed thatthe PWM, wave shield, and percussion pad were significantlydifferent from each other and from FTAP andMax/MSP underall conditions. However, in some conditions FTAP and Max/MSP were not significantly different (e.g., soft × fast condi-tion, p = 1.0), likely due to the high variability of the onsettimings for these audio signals (see Fig. 3).
For the PWM and wave shield signals, there were signifi-cant differences between all force conditions (ps < .001), in-dicating that the asynchrony increased as force increased (seeFig. 4). For the percussion pad, FTAP, and Max/MSP signals,significant differences emerged between force conditions (ps< .02), but the asynchrony decreased as force increased. ThePWM only demonstrated a significant difference betweentempi for the soft force condition (p < .001), in which asyn-chrony was greater for the fast than for the slow tempo. Thewave shield did not demonstrate significant differences be-tween tempi for any force condition (ps > .83). The percussionpad and FTAP only demonstrated significant differences be-tween tempi for the hard force (ps < .001); asynchronies forthe fast tempo were greater than those for the slow tempo forthe percussion pad, and the reverse trend was observed forFTAP. For Max/MSP, asynchronies were significantly greaterfor the slow than for the fast tempo for all force conditions (ps< .001).
FSR-aligned audio asynchrony variability
To compare the variability of the feedback signals, we com-puted the standard deviation of the asynchronies for each par-ticipant, signal, tempo, and force. These standard deviationestimates were corrected for biases arising from differencesin the numbers of underlying data points using the c4 coeffi-cient [see Eq. 1, where n = sample size, Γ = gamma function,Γ(n) = (n – 1)!; see Cureton, 1968]. These variability estimateswere then subjected to an LMEM with the same design asabove, with asynchrony variability as the dependent variable.Trial was no longer included as a random effect, because at
1596 Behav Res (2016) 48:1591–1607
most one data point was available for each combination ofparticipant and condition.
c4 nð Þ ¼ffiffiffiffiffiffiffiffi
2
n−1
r
*Γ
n2
� �
Γn−12
� � ð1Þ
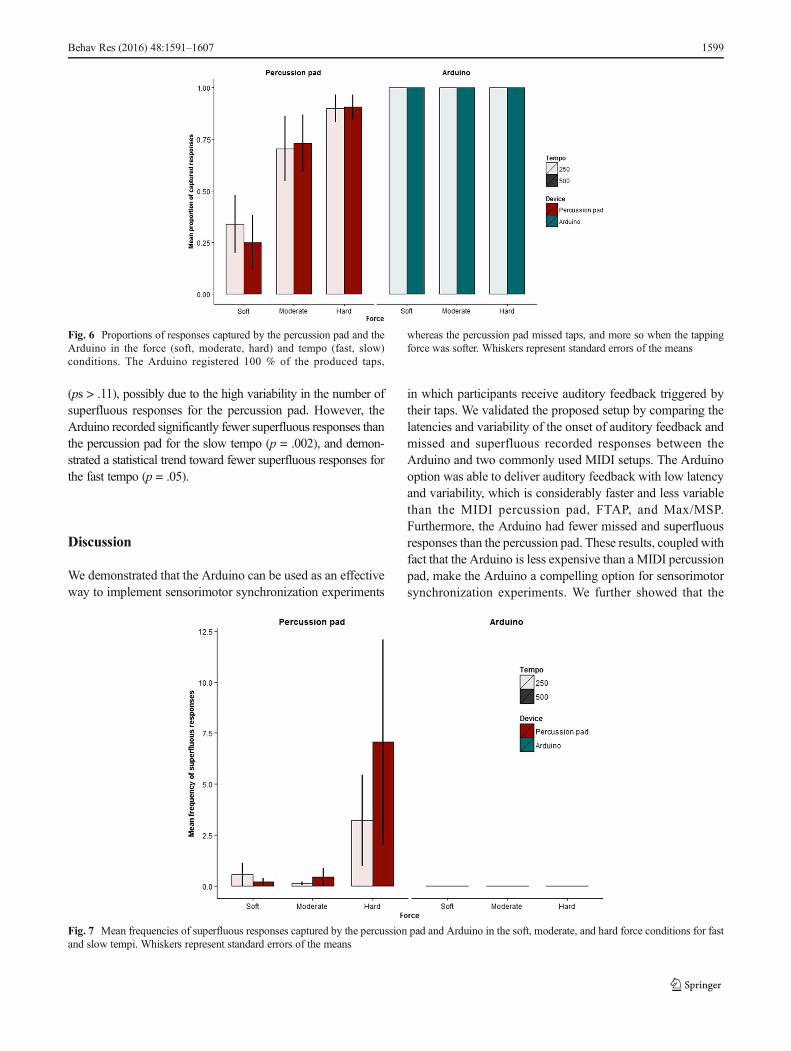
For asynchrony variability, we observed a significant maineffect of signal (p < .001) and a significant interaction betweensignal and tempo (p = .003). No other main effects or interac-tions reached significance (ps > .19). To test the hypothesisthat audio onsets produced by the PWM and wave shield havelower variability than the other audio signals, pair-wise
contrasts were conducted between signals. Signal variabilitieswere generally significantly different from one another (ps <.02), with the exception of nonsignificant differences betweenthe PWM and wave shield (p = 1.0) and between FTAP andMax/MSP (p = .13), and there were statistical trends for dif-ferences between the PWM and percussion pad (p = .06) andthe wave shield and percussion pad (p = .08). As is shown inFig. 5, the interaction between signal and tempo indicated thatthe percussion pad was significantly less variable than Max/MSP for the fast condition (p < .01) but not for the slowcondition (p = .23). Moreover, a significant main effect oftempo emerged for Max/MSP (p < .001), indicating that thefast tempo was more variable than the slow tempo. It is pos-sible that this tempo effect was driven by difficulties for Max/MSP to produce consistent timing of auditory feedback underhigh load—that is, when responses were more frequent—ascompared to a slower response schedule. Overall, our resultssupport the hypothesis that the PWM and wave shield provideless variable auditory feedback onsets than FTAP and Max/MSP. The PWM and wave shield showed near-significanttrends for being less variable than the percussion pad.
FSR present versus absent comparison of percussion padasynchronies
In this analysis, we included only the percussion pad audioasynchrony data, since the other signals (the tone generatoroutput through FTAP or Max/MSP) occurred much later andwere subject to additional temporal noise (probably due to theMIDI–USB and USB–MIDI conversions) and this noise is, bydesign, independent of whether an FSR was present or not.The LMEM was fit to the data with fixed factors Force,Tempo, and FSR Presence (two levels: present or absent; see
Fig. 4 Mean asynchrony relative to the FSR for audio signals in the tempo (fast, slow) and force (soft, moderate, hard) conditions. Whiskers representstandard errors of the means
Fig. 3 Histogram of audio onset asynchronies relative to FSR onsets
Behav Res (2016) 48:1591–1607 1597
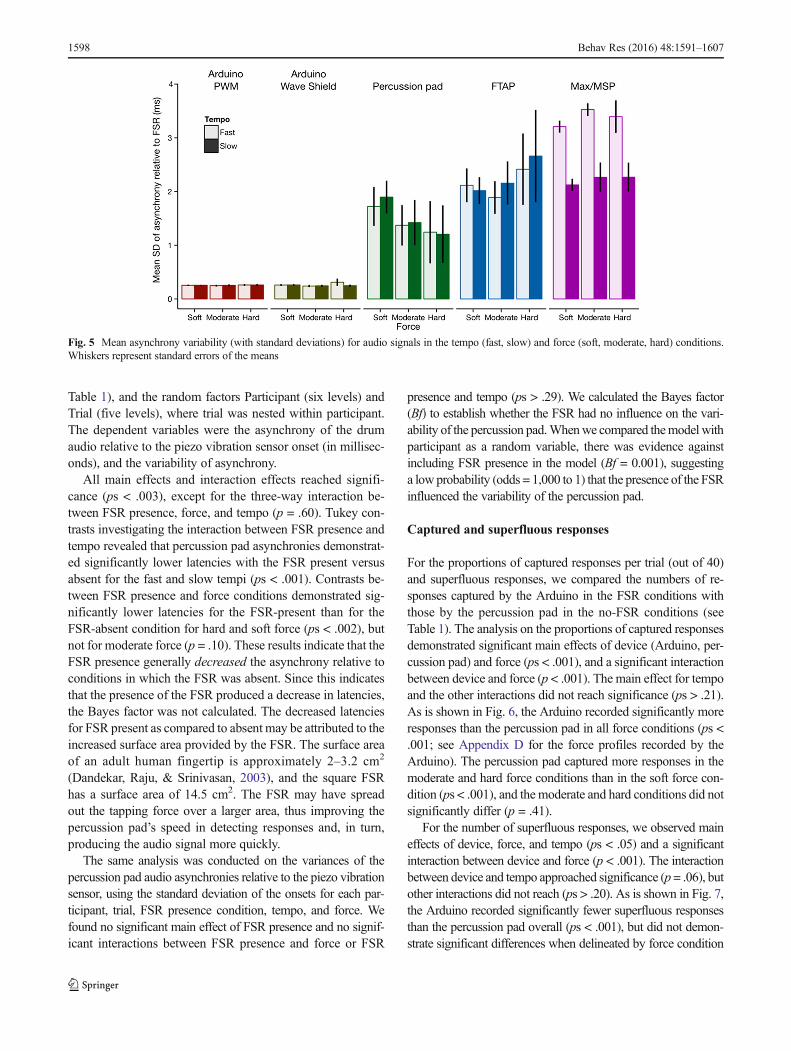
Table 1), and the random factors Participant (six levels) andTrial (five levels), where trial was nested within participant.The dependent variables were the asynchrony of the drumaudio relative to the piezo vibration sensor onset (in millisec-onds), and the variability of asynchrony.
All main effects and interaction effects reached signifi-cance (ps < .003), except for the three-way interaction be-tween FSR presence, force, and tempo (p = .60). Tukey con-trasts investigating the interaction between FSR presence andtempo revealed that percussion pad asynchronies demonstrat-ed significantly lower latencies with the FSR present versusabsent for the fast and slow tempi (ps < .001). Contrasts be-tween FSR presence and force conditions demonstrated sig-nificantly lower latencies for the FSR-present than for theFSR-absent condition for hard and soft force (ps < .002), butnot for moderate force (p = .10). These results indicate that theFSR presence generally decreased the asynchrony relative toconditions in which the FSR was absent. Since this indicatesthat the presence of the FSR produced a decrease in latencies,the Bayes factor was not calculated. The decreased latenciesfor FSR present as compared to absent may be attributed to theincreased surface area provided by the FSR. The surface areaof an adult human fingertip is approximately 2–3.2 cm2
(Dandekar, Raju, & Srinivasan, 2003), and the square FSRhas a surface area of 14.5 cm2. The FSR may have spreadout the tapping force over a larger area, thus improving thepercussion pad’s speed in detecting responses and, in turn,producing the audio signal more quickly.
The same analysis was conducted on the variances of thepercussion pad audio asynchronies relative to the piezo vibrationsensor, using the standard deviation of the onsets for each par-ticipant, trial, FSR presence condition, tempo, and force. Wefound no significant main effect of FSR presence and no signif-icant interactions between FSR presence and force or FSR
presence and tempo (ps > .29). We calculated the Bayes factor(Bf) to establish whether the FSR had no influence on the vari-ability of the percussion pad.Whenwe compared themodel withparticipant as a random variable, there was evidence againstincluding FSR presence in the model (Bf = 0.001), suggestinga low probability (odds = 1,000 to 1) that the presence of the FSRinfluenced the variability of the percussion pad.
Captured and superfluous responses
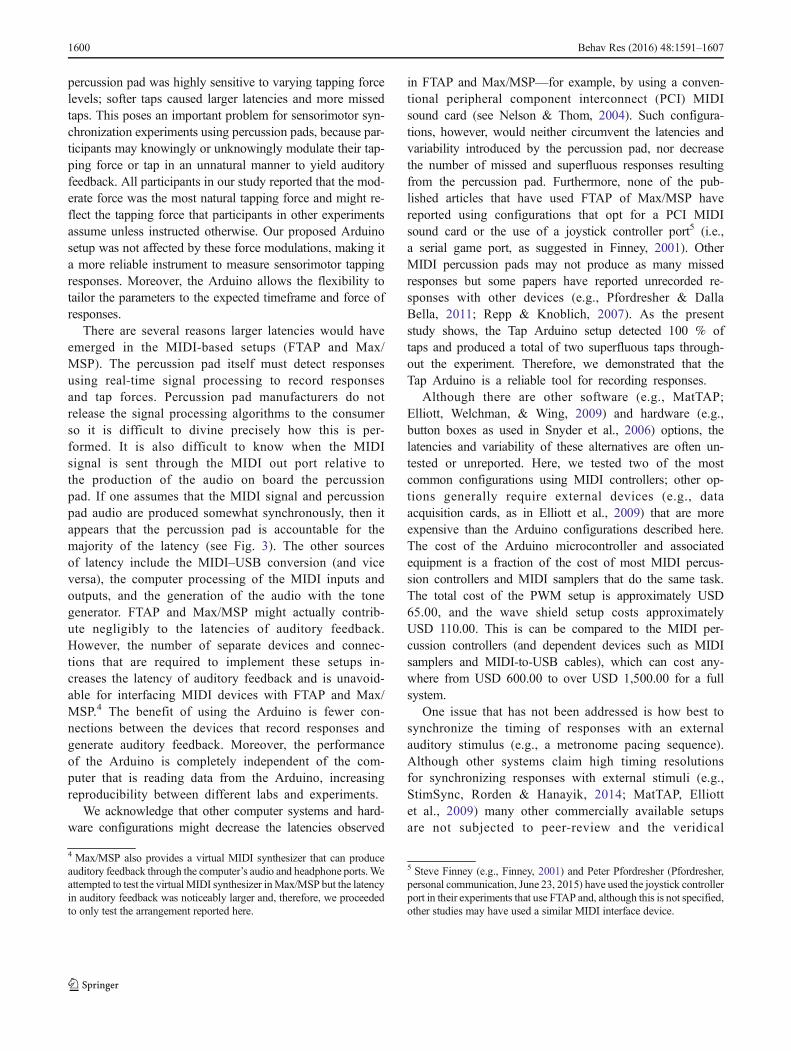
For the proportions of captured responses per trial (out of 40)and superfluous responses, we compared the numbers of re-sponses captured by the Arduino in the FSR conditions withthose by the percussion pad in the no-FSR conditions (seeTable 1). The analysis on the proportions of captured responsesdemonstrated significant main effects of device (Arduino, per-cussion pad) and force (ps < .001), and a significant interactionbetween device and force (p < .001). The main effect for tempoand the other interactions did not reach significance (ps > .21).As is shown in Fig. 6, the Arduino recorded significantly moreresponses than the percussion pad in all force conditions (ps <.001; see Appendix D for the force profiles recorded by theArduino). The percussion pad captured more responses in themoderate and hard force conditions than in the soft force con-dition (ps < .001), and the moderate and hard conditions did notsignificantly differ (p = .41).
For the number of superfluous responses, we observed maineffects of device, force, and tempo (ps < .05) and a significantinteraction between device and force (p < .001). The interactionbetween device and tempo approached significance (p= .06), butother interactions did not reach (ps > .20). As is shown in Fig. 7,the Arduino recorded significantly fewer superfluous responsesthan the percussion pad overall (ps < .001), but did not demon-strate significant differences when delineated by force condition
Fig. 5 Mean asynchrony variability (with standard deviations) for audio signals in the tempo (fast, slow) and force (soft, moderate, hard) conditions.Whiskers represent standard errors of the means
1598 Behav Res (2016) 48:1591–1607
(ps > .11), possibly due to the high variability in the number ofsuperfluous responses for the percussion pad. However, theArduino recorded significantly fewer superfluous responses thanthe percussion pad for the slow tempo (p = .002), and demon-strated a statistical trend toward fewer superfluous responses forthe fast tempo (p = .05).
Discussion
We demonstrated that the Arduino can be used as an effectiveway to implement sensorimotor synchronization experiments
in which participants receive auditory feedback triggered bytheir taps. We validated the proposed setup by comparing thelatencies and variability of the onset of auditory feedback andmissed and superfluous recorded responses between theArduino and two commonly used MIDI setups. The Arduinooption was able to deliver auditory feedback with low latencyand variability, which is considerably faster and less variablethan the MIDI percussion pad, FTAP, and Max/MSP.Furthermore, the Arduino had fewer missed and superfluousresponses than the percussion pad. These results, coupled withfact that the Arduino is less expensive than a MIDI percussionpad, make the Arduino a compelling option for sensorimotorsynchronization experiments. We further showed that the
Fig. 7 Mean frequencies of superfluous responses captured by the percussion pad and Arduino in the soft, moderate, and hard force conditions for fastand slow tempi. Whiskers represent standard errors of the means
Fig. 6 Proportions of responses captured by the percussion pad and theArduino in the force (soft, moderate, hard) and tempo (fast, slow)conditions. The Arduino registered 100 % of the produced taps,
whereas the percussion pad missed taps, and more so when the tappingforce was softer. Whiskers represent standard errors of the means
Behav Res (2016) 48:1591–1607 1599
percussion pad was highly sensitive to varying tapping forcelevels; softer taps caused larger latencies and more missedtaps. This poses an important problem for sensorimotor syn-chronization experiments using percussion pads, because par-ticipants may knowingly or unknowingly modulate their tap-ping force or tap in an unnatural manner to yield auditoryfeedback. All participants in our study reported that the mod-erate force was the most natural tapping force and might re-flect the tapping force that participants in other experimentsassume unless instructed otherwise. Our proposed Arduinosetup was not affected by these force modulations, making ita more reliable instrument to measure sensorimotor tappingresponses. Moreover, the Arduino allows the flexibility totailor the parameters to the expected timeframe and force ofresponses.
There are several reasons larger latencies would haveemerged in the MIDI-based setups (FTAP and Max/MSP). The percussion pad itself must detect responsesusing real-time signal processing to record responsesand tap forces. Percussion pad manufacturers do notrelease the signal processing algorithms to the consumerso it is difficult to divine precisely how this is per-formed. It is also difficult to know when the MIDIsignal is sent through the MIDI out port relative tothe production of the audio on board the percussionpad. If one assumes that the MIDI signal and percussionpad audio are produced somewhat synchronously, then itappears that the percussion pad is accountable for themajority of the latency (see Fig. 3). The other sourcesof latency include the MIDI–USB conversion (and viceversa), the computer processing of the MIDI inputs andoutputs, and the generation of the audio with the tonegenerator. FTAP and Max/MSP might actually contrib-ute negligibly to the latencies of auditory feedback.However, the number of separate devices and connec-tions that are required to implement these setups in-creases the latency of auditory feedback and is unavoid-able for interfacing MIDI devices with FTAP and Max/MSP.4 The benefit of using the Arduino is fewer con-nections between the devices that record responses andgenerate auditory feedback. Moreover, the performanceof the Arduino is completely independent of the com-puter that is reading data from the Arduino, increasingreproducibility between different labs and experiments.
We acknowledge that other computer systems and hard-ware configurations might decrease the latencies observed
in FTAP and Max/MSP—for example, by using a conven-tional peripheral component interconnect (PCI) MIDIsound card (see Nelson & Thom, 2004). Such configura-tions, however, would neither circumvent the latencies andvariability introduced by the percussion pad, nor decreasethe number of missed and superfluous responses resultingfrom the percussion pad. Furthermore, none of the pub-lished articles that have used FTAP of Max/MSP havereported using configurations that opt for a PCI MIDIsound card or the use of a joystick controller port5 (i.e.,a serial game port, as suggested in Finney, 2001). OtherMIDI percussion pads may not produce as many missedresponses but some papers have reported unrecorded re-sponses with other devices (e.g., Pfordresher & DallaBella, 2011; Repp & Knoblich, 2007). As the presentstudy shows, the Tap Arduino setup detected 100 % oftaps and produced a total of two superfluous taps through-out the experiment. Therefore, we demonstrated that theTap Arduino is a reliable tool for recording responses.
Although there are other software (e.g., MatTAP;Elliott, Welchman, & Wing, 2009) and hardware (e.g.,button boxes as used in Snyder et al., 2006) options, thelatencies and variability of these alternatives are often un-tested or unreported. Here, we tested two of the mostcommon configurations using MIDI controllers; other op-tions generally require external devices (e.g., dataacquisition cards, as in Elliott et al., 2009) that are moreexpensive than the Arduino configurations described here.The cost of the Arduino microcontroller and associatedequipment is a fraction of the cost of most MIDI percus-sion controllers and MIDI samplers that do the same task.The total cost of the PWM setup is approximately USD65.00, and the wave shield setup costs approximatelyUSD 110.00. This is can be compared to the MIDI per-cussion controllers (and dependent devices such as MIDIsamplers and MIDI-to-USB cables), which can cost any-where from USD 600.00 to over USD 1,500.00 for a fullsystem.
One issue that has not been addressed is how best tosynchronize the timing of responses with an externalauditory stimulus (e.g., a metronome pacing sequence).Although other systems claim high timing resolutionsfor synchronizing responses with external stimuli (e.g.,StimSync, Rorden & Hanayik, 2014; MatTAP, Elliottet al., 2009) many other commercially available setupsare not subjected to peer-review and the veridical
4 Max/MSP also provides a virtual MIDI synthesizer that can produceauditory feedback through the computer’s audio and headphone ports.Weattempted to test the virtual MIDI synthesizer inMax/MSP but the latencyin auditory feedback was noticeably larger and, therefore, we proceededto only test the arrangement reported here.
5 Steve Finney (e.g., Finney, 2001) and Peter Pfordresher (Pfordresher,personal communication, June 23, 2015) have used the joystick controllerport in their experiments that use FTAP and, although this is not specified,other studies may have used a similar MIDI interface device.
1600 Behav Res (2016) 48:1591–1607
response-stimulus asynchronies associated with suchsoftware packages are unknown. We have included abeta script in our software package for syncing an au-ditory wave (.wav) file with Arduino responses(BTapArduinoSound.py^) but the actual asynchrony be-tween the Arduino responses and onset of computer-generated audio remains to be tested on multiple sys-tems. This is a problem for experiment setups in generaland, until this matter is resolved, the expensive optionssuch as data acquisition cards and AIBs remain themost temporally precise methods for synchronizing re-sponses and stimuli.
There are some limitations of the Tap Arduino package.First, unlike FTAP and Max/MSP, Tap Arduino cannot inter-face with MIDI devices such as piano keyboards. Second, thearrangement of the Tap Arduino presented here is incompati-ble with the MIDI protocol and, therefore, cannot take advan-tage of the library of MIDI sounds. Third, the Tap Arduinocannot dynamically change the intensity of auditory feedbackas a result of changes in tapping force. However, a strength ofthe Tap Arduino package is that is can play any sound that canfit on an SD card as a wave file. We have also included codesthat can alter auditory feedback in terms of temporal delay(i.e., delayed auditory feedback), frequency (i.e., pitch), tim-bre, and intensity (i.e., loudness). Another benefit of theArduino microcontroller more generally is that it is expand-able and can be programmed to communicate with a largerange of devices that read serial protocol. A user is not limitedto using an FSR as used in the present study but may, instead,use a piezo element to record tap vibrations, a circular poten-tiometer for circle drawing, or a simple button similar to acomputer keyboard key (see Schubert et al., 2013). The drumpads used in videogames, such as Rock Band, and the percus-sion pad tested here use the piezo elements to record onsets.Through the Arduino, it is possible to have fine control overthe thresholds and sensitivity that allows onsets to trigger au-ditory feedback.
Now that we have benchmark measurements for thelatencies and variability of feedback using the Arduinoand MIDI options, future research could determine theimplications of having delayed or variable feedback inbehavioral experiments. Aschersleben and Prinz (1997)have shown that increasing the latency of auditory feed-back as much as 30 ms can increase the mean negativeasynchrony of responses (relative to metronome ticks)from –20 ms to less than –40 ms. These results indicatethat unwanted delays in auditory feedback (resulting fromthe experimental hardware used) influence behavior in sen-sorimotor synchronization experiments. The Tap Arduinocircumvents this problem by presenting auditory feedbackwithin milliseconds and could therefore be used to find
the threshold at which behavior is influenced by delayedauditory feedback. It is possible that delays observed inFTAP and Max/MSP are inconsequential for performancein sensorimotor synchronization experiments, particularlygiven that people may adapt to them (Aschersleben &Prinz, 1997). However, it is likely that the variabilitywould make it difficult to habituate to delays in auditoryfeedback, an assertion that is yet to be tested empirically.Similarly, the impact of missing and superfluous responsesin experiments that present auditory feedback for pairs orindividuals in sensorimotor synchronization remains un-known. This could be investigated using the TapArduino package that is sensitive enough not to miss re-sponses and frugal enough not to record superfluousresponses.
Conclusion
We have presented C codes and Python scripts for usingan Arduino microcontroller as a tool for measuring re-sponses at high resolutions and presenting low-latencyauditory feedback in sensorimotor synchronization ex-periments. The Arduino was able to collect responseswith high precision (i.e., without missing responses)while minimizing false alarms (i.e., superfluous re-sponses). Our codes, scripts, and hardware instructionsare freely available online (van Vugt & Schultz, 2015).The PWM auditory feedback option is faster and re-quires purchasing less hardware, but can only presentsimple sounds such as pure tones or square waves.The wave shield auditory feedback option allows thepresentation of any sound file, but it has a slightlyhigher latency, is more expensive, and it requires ahigher level of soldering ability (see Adafruit, 2015).Both of the Arduino options demonstrated lower, andless variable, auditory feedback latencies than FTAPand Max/MSP. On the basis of these results, we suggestthat the Tap Arduino provides powerful tools for senso-rimotor synchronization experiments, because it is high-ly precise and resistant to false alarms, produces low-latency feedback, and is portable and more affordablethan existing solutions.
Acknowledgments The authors thank Marcello Wanderley for use ofthe HPD15 percussion pad, Joseph Malloch for use of the YamahaTX81Z synthesizer, James O’Callaghan for aiding in the constructionof the Max/MSP script, Alexander Demos for comments on the experi-ment design and analysis, and the participants who volunteered their time.
Behav Res (2016) 48:1591–1607 1601
Appendix A
Fig. 8 Audio onsets detected by the custom-made MATLAB script. Thevertical dashed lines represent the detected time of onset (zero). The solidblue lines represent the mean amplitude of each signal over time (in all
conditions), and the shaded regions represent the minimum and maxi-mum amplitudes of each signal
1602 Behav Res (2016) 48:1591–1607
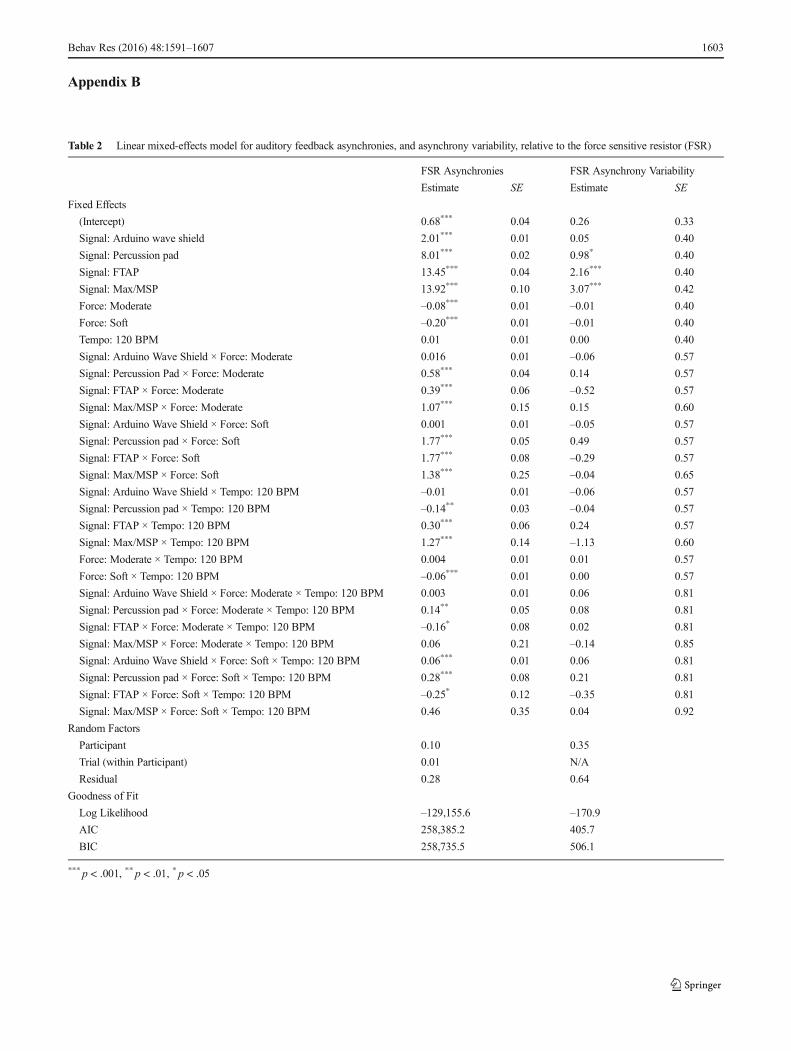
Table 2 Linear mixed-effects model for auditory feedback asynchronies, and asynchrony variability, relative to the force sensitive resistor (FSR)
FSR Asynchronies FSR Asynchrony Variability
Estimate SE Estimate SE
Fixed Effects
(Intercept) 0.68*** 0.04 0.26 0.33
Signal: Arduino wave shield 2.01*** 0.01 0.05 0.40
Signal: Percussion pad 8.01*** 0.02 0.98* 0.40
Signal: FTAP 13.45*** 0.04 2.16*** 0.40
Signal: Max/MSP 13.92*** 0.10 3.07*** 0.42
Force: Moderate –0.08*** 0.01 –0.01 0.40
Force: Soft –0.20*** 0.01 –0.01 0.40
Tempo: 120 BPM 0.01 0.01 0.00 0.40
Signal: Arduino Wave Shield × Force: Moderate 0.016 0.01 –0.06 0.57
Signal: Percussion Pad × Force: Moderate 0.58*** 0.04 0.14 0.57
Signal: FTAP × Force: Moderate 0.39*** 0.06 –0.52 0.57
Signal: Max/MSP × Force: Moderate 1.07*** 0.15 0.15 0.60
Signal: Arduino Wave Shield × Force: Soft 0.001 0.01 –0.05 0.57
Signal: Percussion pad × Force: Soft 1.77*** 0.05 0.49 0.57
Signal: FTAP × Force: Soft 1.77*** 0.08 –0.29 0.57
Signal: Max/MSP × Force: Soft 1.38*** 0.25 –0.04 0.65
Signal: Arduino Wave Shield × Tempo: 120 BPM –0.01 0.01 –0.06 0.57
Signal: Percussion pad × Tempo: 120 BPM –0.14** 0.03 –0.04 0.57
Signal: FTAP × Tempo: 120 BPM 0.30*** 0.06 0.24 0.57
Signal: Max/MSP × Tempo: 120 BPM 1.27*** 0.14 –1.13 0.60
Force: Moderate × Tempo: 120 BPM 0.004 0.01 0.01 0.57
Force: Soft × Tempo: 120 BPM –0.06*** 0.01 0.00 0.57
Signal: Arduino Wave Shield × Force: Moderate × Tempo: 120 BPM 0.003 0.01 0.06 0.81
Signal: Percussion pad × Force: Moderate × Tempo: 120 BPM 0.14** 0.05 0.08 0.81
Signal: FTAP × Force: Moderate × Tempo: 120 BPM –0.16* 0.08 0.02 0.81
Signal: Max/MSP × Force: Moderate × Tempo: 120 BPM 0.06 0.21 –0.14 0.85
Signal: Arduino Wave Shield × Force: Soft × Tempo: 120 BPM 0.06*** 0.01 0.06 0.81
Signal: Percussion pad × Force: Soft × Tempo: 120 BPM 0.28*** 0.08 0.21 0.81
Signal: FTAP × Force: Soft × Tempo: 120 BPM –0.25* 0.12 –0.35 0.81
Signal: Max/MSP × Force: Soft × Tempo: 120 BPM 0.46 0.35 0.04 0.92
Random Factors
Participant 0.10 0.35
Trial (within Participant) 0.01 N/A
Residual 0.28 0.64
Goodness of Fit
Log Likelihood –129,155.6 –170.9
AIC 258,385.2 405.7
BIC 258,735.5 506.1
*** p < .001, ** p < .01, * p < .05
Appendix B
Behav Res (2016) 48:1591–1607 1603
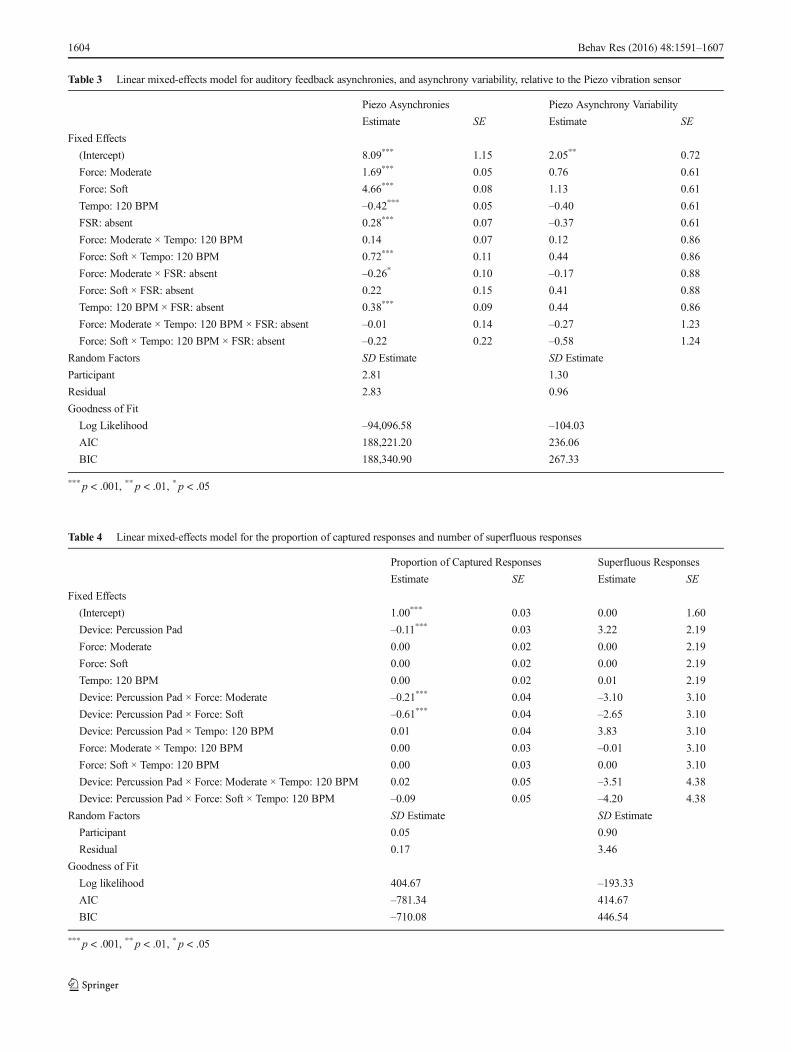
Table 3 Linear mixed-effects model for auditory feedback asynchronies, and asynchrony variability, relative to the Piezo vibration sensor
Piezo Asynchronies Piezo Asynchrony Variability
Estimate SE Estimate SE
Fixed Effects
(Intercept) 8.09*** 1.15 2.05** 0.72
Force: Moderate 1.69*** 0.05 0.76 0.61
Force: Soft 4.66*** 0.08 1.13 0.61
Tempo: 120 BPM –0.42*** 0.05 –0.40 0.61
FSR: absent 0.28*** 0.07 –0.37 0.61
Force: Moderate × Tempo: 120 BPM 0.14 0.07 0.12 0.86
Force: Soft × Tempo: 120 BPM 0.72*** 0.11 0.44 0.86
Force: Moderate × FSR: absent –0.26* 0.10 –0.17 0.88
Force: Soft × FSR: absent 0.22 0.15 0.41 0.88
Tempo: 120 BPM × FSR: absent 0.38*** 0.09 0.44 0.86
Force: Moderate × Tempo: 120 BPM × FSR: absent –0.01 0.14 –0.27 1.23
Force: Soft × Tempo: 120 BPM × FSR: absent –0.22 0.22 –0.58 1.24
Random Factors SD Estimate SD Estimate
Participant 2.81 1.30
Residual 2.83 0.96
Goodness of Fit
Log Likelihood –94,096.58 –104.03
AIC 188,221.20 236.06
BIC 188,340.90 267.33
*** p < .001, ** p < .01, * p < .05
Table 4 Linear mixed-effects model for the proportion of captured responses and number of superfluous responses
Proportion of Captured Responses Superfluous Responses
Estimate SE Estimate SE
Fixed Effects
(Intercept) 1.00*** 0.03 0.00 1.60
Device: Percussion Pad –0.11*** 0.03 3.22 2.19
Force: Moderate 0.00 0.02 0.00 2.19
Force: Soft 0.00 0.02 0.00 2.19
Tempo: 120 BPM 0.00 0.02 0.01 2.19
Device: Percussion Pad × Force: Moderate –0.21*** 0.04 –3.10 3.10
Device: Percussion Pad × Force: Soft –0.61*** 0.04 –2.65 3.10
Device: Percussion Pad × Tempo: 120 BPM 0.01 0.04 3.83 3.10
Force: Moderate × Tempo: 120 BPM 0.00 0.03 –0.01 3.10
Force: Soft × Tempo: 120 BPM 0.00 0.03 0.00 3.10
Device: Percussion Pad × Force: Moderate × Tempo: 120 BPM 0.02 0.05 –3.51 4.38
Device: Percussion Pad × Force: Soft × Tempo: 120 BPM –0.09 0.05 –4.20 4.38
Random Factors SD Estimate SD Estimate
Participant 0.05 0.90
Residual 0.17 3.46
Goodness of Fit
Log likelihood 404.67 –193.33
AIC –781.34 414.67
BIC –710.08 446.54
*** p < .001, ** p < .01, * p < .05
1604 Behav Res (2016) 48:1591–1607
Appendix C: R code for linear mixed-effects model
# Linear mixed-effects modelfsr.lme <- lme(Asynchrony ~ Signal*Force*Tempo, ran-
dom = ~1|Participant/Trial, data = fsr_data,method = "ML", weights = varIdent(form =~1|Signal))
# Check estimates and coefficients summary(fsr.lme)# View main effects and interactions# (note: this function is NOT an analysis of variance but is# an analogous function for LMEM) anova(fsr.lme)# Example: Planned comparisons for main effect of Signalsummary(glht(fsr.lme,
linfct = mcp(Signal = "Tukey")))# Above, "Signal" can be replaced by "Force" or "Tempo" toobtain planned comparisons#Example: Interactions betweenSignal and Force fsr_dataSigFor<- factor(interaction(fsrdataSignal,fsr_data$Force))
fsr.tmp.lme <- lme(Asynchrony ~SigFor*Tempo, random= ~1|Participant/Trial,
data = fsr_data, method = "ML", weights =varIdent(form = ~1|Signal))
summary(glht(fsr.tmp.lme,linfct = mcp(SigFor = "Tukey")))# Above, "Signal" and "Force" can be swapped with "Tempo"to obtain planned comparisons# Three-way inte rac t ionsfsr_da taSig forTemp <-interaction(fsrdataSignal,fsr_dataForce, fsrdataTempo)fsr.comb.lme <- lme(Asynchrony~SigForTemp, random =
~1|Participant/Trial,data = fsr_data, method = "ML",weights = varIdent(form = ~1|Signal))summary(glht(fsr.comb.lme,linfct =mcp(SigForTemp = "Tukey")))
# Linear mixed-effects modelfsr.lme <- lme(Asynchrony ~ Signal*Force*Tempo, random = ~1|Participant/Trial,
data = fsr_data, method = "ML", weights = varIdent(form = ~1|Signal))
# Check estimates and coefficientssummary(fsr.lme)
# View main effects and interactions# (note: this function is NOT an analysis of variance but is# an analogous function for LMEM)anova(fsr.lme)
# Example: Planned comparisons for main effect of Signalsummary(glht(fsr.lme,
linfct = mcp(Signal = "Tukey")))# Above, "Signal" can be replaced by "Force" or "Tempo" to obtain planned comparisons
# Example: Interactions between Signal and Forcefsr_data$SigFor <- factor(interaction(fsrdata$Signal,fsr_data$Force))
fsr.tmp.lme <- lme(Asynchrony ~SigFor*Tempo, random = ~1|Participant/Trial,data = fsr_data, method = "ML", weights = varIdent(form = ~1|Signal))
summary(glht(fsr.tmp.lme,linfct = mcp(SigFor = "Tukey")))# Above, "Signal" and "Force" can be swapped with "Tempo" to obtain planned comparisons
# Three-way interactionsfsr_data$SigforTemp <- interaction(fsrdata$Signal,fsr_data$Force, fsrdata$Tempo)
fsr.comb.lme <- lme(Asynchrony~SigForTemp, random = ~1|Participant/Trial,data = fsr_data, method = "ML", weights = varIdent(form = ~1|Signal))
summary(glht(fsr.comb.lme,linfct = mcp(SigForTemp = "Tukey")))
Behav Res (2016) 48:1591–1607 1605
Appendix D
Arduino force analysis
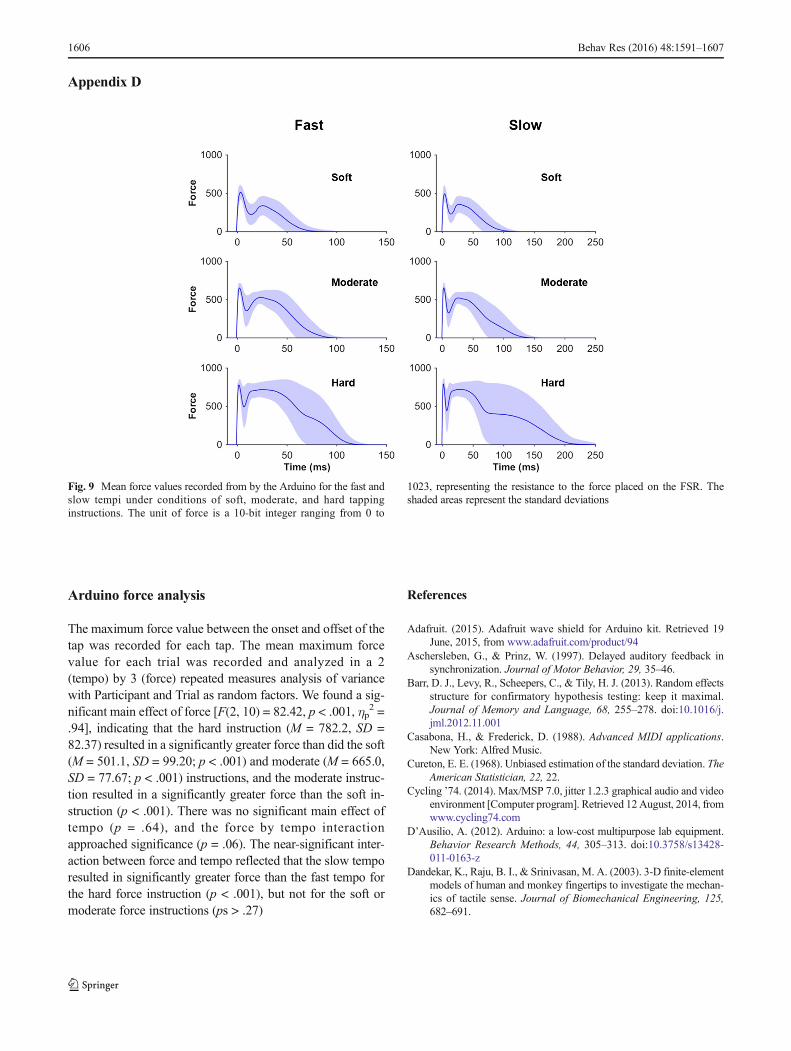
The maximum force value between the onset and offset of thetap was recorded for each tap. The mean maximum forcevalue for each trial was recorded and analyzed in a 2(tempo) by 3 (force) repeated measures analysis of variancewith Participant and Trial as random factors. We found a sig-nificant main effect of force [F(2, 10) = 82.42, p < .001, ηp
2 =.94], indicating that the hard instruction (M = 782.2, SD =82.37) resulted in a significantly greater force than did the soft(M = 501.1, SD = 99.20; p < .001) and moderate (M = 665.0,SD = 77.67; p < .001) instructions, and the moderate instruc-tion resulted in a significantly greater force than the soft in-struction (p < .001). There was no significant main effect oftempo (p = .64), and the force by tempo interactionapproached significance (p = .06). The near-significant inter-action between force and tempo reflected that the slow temporesulted in significantly greater force than the fast tempo forthe hard force instruction (p < .001), but not for the soft ormoderate force instructions (ps > .27)
References
Adafruit. (2015). Adafruit wave shield for Arduino kit. Retrieved 19June, 2015, from www.adafruit.com/product/94
Aschersleben, G., & Prinz, W. (1997). Delayed auditory feedback insynchronization. Journal of Motor Behavior, 29, 35–46.
Barr, D. J., Levy, R., Scheepers, C., & Tily, H. J. (2013). Random effectsstructure for confirmatory hypothesis testing: keep it maximal.Journal of Memory and Language, 68, 255–278. doi:10.1016/j.jml.2012.11.001
Casabona, H., & Frederick, D. (1988). Advanced MIDI applications.New York: Alfred Music.
Cureton, E. E. (1968). Unbiased estimation of the standard deviation. TheAmerican Statistician, 22, 22.
Cycling ’74. (2014). Max/MSP 7.0, jitter 1.2.3 graphical audio and videoenvironment [Computer program]. Retrieved 12August, 2014, fromwww.cycling74.com
D’Ausilio, A. (2012). Arduino: a low-cost multipurpose lab equipment.Behavior Research Methods, 44, 305–313. doi:10.3758/s13428-011-0163-z
Dandekar, K., Raju, B. I., & Srinivasan, M. A. (2003). 3-D finite-elementmodels of human and monkey fingertips to investigate the mechan-ics of tactile sense. Journal of Biomechanical Engineering, 125,682–691.
Fig. 9 Mean force values recorded from by the Arduino for the fast andslow tempi under conditions of soft, moderate, and hard tappinginstructions. The unit of force is a 10-bit integer ranging from 0 to
1023, representing the resistance to the force placed on the FSR. Theshaded areas represent the standard deviations
1606 Behav Res (2016) 48:1591–1607
Development Core Team, R. (2013). R: A language and environment forstatistical computing. Vienna: R Foundation for StatisticalComputing. Retrieved from www.R-project.org/
Elliott, M. T., Welchman, A. E., & Wing, A. M. (2009). MatTAP: aMATLAB toolbox for the control and analysis of movement syn-chronisation experiments. Journal of Neuroscience Methods, 177,250–257.
Finney, S. A. (2001). FTAP: a Linux-based program for tapping andmusic experiments. Behavior Research Methods, Instruments, &Computers, 33, 65–72.
Hothorn, T., Bretz, F., & Westfall, P. (2008). Simultaneous inference ingeneral parametric models. Biometrical Journal, 50, 346–363.
Knörig, A., Wettach, R., & Cohen, J. (2009). Fritzing: A tool for advanc-ing electronic prototyping for designers. In Proceedings of the 3rdInternational Conference on Tangible and Embedded Interaction(pp. 351–358). New York: ACM Press.
Mills, P. F., van der Steen, M. C., Schultz, B. G., & Keller, P. E. (2015).Individual differences in temporal anticipation and adaptation dur-ing sensorimotor synchronization. Timing & Time Perception, 3,13–31. doi:10.1163/22134468-03002040
Morey, R. D., Rouder, J. N., & Jamil, T. (2009). BayesFactor: An Rpackage for Bayesian data analysis (R package version 09.10-2).Retrieved from http://bayesfactorpcl.r-forge.r-project.org/
Nelson, M., & Thom, B. (2004). A survey of real-time MIDI perfor-mance. In Proceedings of the 2004 conference on New interfacesfor musical expression (pp. 35–38). Singapore: National Universityof Singapore.
Pfordresher, P. Q., & Dalla Bella, S. (2011). Delayed auditory feedbackand movement. Journal of Experimental Psychology: HumanPerception and Performance, 37, 566–579.
Pinheiro, J., Bates, D., DebRoy, S., Sarkar, D., & R Development CoreTeam. (2015). nlme: Linear and nonlinear mixed effects models (R
package version 3.1-120). Retrieved from http://CRAN.R-project.org/package=nlme
Repp, B. H. (2005). Sensorimotor synchronization: a review of the tap-ping literature. Psychonomic Bulletin & Review, 12, 969–992. doi:10.3758/BF03206433
Repp, B. H., & Knoblich, G. (2007). Toward a psychophysics ofagency: detecting gain and loss of control over auditory ac-tion effects. Journal of Experimental Psychology: HumanPerception and Performance, 33, 469–482. doi:10.1037/0096-1523.33.2.469
Repp, B. H., & Su, Y. H. (2013). Sensorimotor synchronization: a reviewof recent research (2006–2012). Psychonomic Bulletin & Review,20, 403–452. doi:10.3758/s13423-012-0371-2
Rorden, C., & Hanayik, T. (2014). StimSync: open-source hardware forbehavioral and MRI experiments. Journal of NeuroscienceMethods, 227, 90–99.
Rouder, J. N., Speckman, P. L., Sun, D., Morey, R. D., & Iverson, G.(2009). Bayesian t tests for accepting and rejecting the null hypoth-esis. Psychonomic Bulletin & Review, 16, 225–237. doi:10.3758/PBR.16.2.225
Schubert, T. W., D’Ausilio, A., & Canto, R. (2013). Using Arduino mi-crocontroller boards to measure response latencies. BehaviorResearch Methods, 45, 1332–1346.
Smith, F. (2010, November 20). Inside a drum synth/Radioscopy of aHandsonic HPD-15 [Blog post]. Retrieved February 21, 2015, fromhttp://francksmith.blogspot.ca/2010/11/inside-drum-synth-radioscopy-of.html
Snyder, J. S., Hannon, E. E., Large, E. W., & Christiansen, M. H. (2006).Synchronization and continuation tapping to complexmeters.MusicPerception, 24, 135–146.
van Vugt, F., & Schultz, B. G. (2015). Taparduino v1.01. Zenodo, 16178.doi:10.5281/zenodo.16178
Behav Res (2016) 48:1591–1607 1607