Embed Size (px)
Citation preview
AN INVESTIGATION ON THE EFFECTS OF USING
INTERACTIVE DIGITAL VIDEO IN A PHYSICS CLASSROOM
ON STUDENT LEARNING AND ATTITUDES
by
LAWRENCE TODD ESCALADA
B.S., Kansas State University, 1988
B.S., Kansas State University, 1989
--------------------------------------------------
A THESIS
submitted in partial fulfillment of the
requirements for the degree
MASTER OF SCIENCE
Department of Physics
College of Arts and Sciences
KANSAS STATE UNIVERSITY
Manhattan, Kansas
1995
Approved by:
Major Professor:
i
TABLE OF CONTENTS
CHAPTER PAGE LIST OF FIGURES iii LIST OF TABLES v ACKNOWLEDGMENTS vii 1. INTRODUCTION 1 1.1 Status of High School Physics Classrooms 2 1.2 The Use of Technology in Physics Classrooms 6 1.3 Interactive Digital Video 8 1.4 Interactive Digital Video Tools 10 *Video Analyzer Computer Program 10 *Visual Space-Time Computer Program 11 1.5 Interactive Digital Video Activities 12 *Activity #1: "Visual Space-Time Diagrams and Motion" 14 *Activity #2: "Visual Space-Time Diagrams, Collisions, and 14 Frames of Reference" *Activity #3: "Video-Captured Collisions and Momentum 15 Conservation" *Activity #4: "The Ball Drop and Frames of Reference" 15 *Activity #5: "The Human Cannonball" 15 1.6 Purpose of the Study 16 2. REVIEW OF LITERATURE 17 2.1 Video as a Laboratory Probe 17 2.2 Video-Based Laboratory and Video Processing 18 2.3 The Effect of Technology on Learning 20 2.4 Teachers' Perspectives of Integrating Technology into 23 the Classroom 2.5 Concepts of Physics: An Example of Integrating Technology 26 With Scientific Inquiry 2.6 Teacher's Role in Interactive Video 28 2.7 Reference Frames 30 2.8 Measuring Student Computer Attitudes 32 2.9 Summary 35
ii
3. METHODOLOGY 36 3.1 Interactive Digital Video Environment 36 3.2 Measuring Instruments 37 *Computer Attitude Scale 37 *Interactive Digital Video Activity Evaluation 38 *Final Exam 39 3.3 Scoring 39 *Computer Attitude Scale 39 *Interactive Digital Video Activity Evaluation 40 *Final Exam 40 3.4 Experimental Designs 41 3.5 Subjects 42 4. RESULTS AND DISCUSSION 45 4.1 Computer Attitude Scale (CAS) 45 4.2 Interactive Digital Video Activity Evaluation 50 *Activity #1: "Visual Space-Time Diagrams and Motion" 50 *Activity #2: "Visual Space-Time Diagrams, Collisions, and 52 Frames of Reference" *Activity #3: "Video-Captured Collisions and Momentum 54 Conservation *Activity #4: "The Ball Drop and Frames of Reference" 55 *Activity #5: "The Human Cannonball" 57 4.3 Final Exam 64 5. CONCLUSION 69 5.1 Student Computer Attitudes 69 5.2 Student Perceptions 70 5.3 Student Gains in Learning 70 5.4 Overall Results 71 5.5 Required Investiments for the Effective Use of Interactive Digital 73 Video in the Physics Classroom 6. REFERENCES 75 APPENDIX A: COMPUTER ATTIUDE SCALE (CAS) INSTRUMENTS 81 A.1 Pre-test CAS 81 A.2 Post-test CAS 85
iii
APPENDIX B: INTERACTIVE DIGITAL VIDEO ACTIVITY EVALUATIONS 87 B.1 Activity #1: "Visual Space-Time Diagrams and Motion" 87 B.2 Activity #2: "Visual Space-Time Diagrams, Collisions, and 88 Frames of Reference" B.3 Activity #3: "Video-Captured Collisions and Momentum 89 Conservation" B.4 Activity #4: "The Ball Drop and Frames of Reference" 90 B.5 Activity #5: "The Human Cannonball" 91 APPENDIX C: ACTIVITY-RELATED FINAL EXAM MULTIPLE- 92 CHOICE QUESTIONS C.1 Activity #1: "Visual Space-Time Diagrams and Motion" 92 C.2 Activity #2: "Visual Space-Time Diagrams, Collisions, and 92 Frames of Reference" C.3 Activiity #3: "Video-Captured Collisions and Momentum 93 Conservation" C.4 Activity #4: "The Ball Drop and Frames of Reference" 94 C.5 Activity #5: "The Human Cannonball" 95 APPENDIX D: EQUIPMENT AND MATERIALS USED FOR ACTIVITIES 96 D.1 Video Input Source (e.g., camera, camcorder) 96 D.2 Computer Programs and Computer Requirements 96 D.3 Intel's ActionMedia II Board 96 D.4 Materials 97 APPENDIX E: SAMPLE COMPONENTS OF ACTIVITIES 98 E.1 Introduction from Activity #5: "The Human Cannonball" 98 E.2 Visual Space-Time Diagrams, Questions, and Video 99 Measurements from Activity #2: "Visual Space-Time Diagrams, Collisions, and Frames of Reference" E.3 Application Questions from Activity #4: "The Ball Drop and 100 Frames of Reference" E.4 Relative Position Exercises from Activity#5: "The Human 100 "Cannonball"
1
CHAPTER 1
INTRODUCTION
Demonstrations and laboratory experiences have always been considered essentials for
the reinforcement and understanding of physics concepts. Visualization of phenomena through
such techniques as demonstrations, simulations, models, real-time graphs, and video is an
important component of learning physics, and these techniques can contribute to students'
understanding of physic concepts by attaching mental images to these concepts.
"Demonstrations not only allow the students to see first hand how things behave, but also
provide them with visual associations that they may capture, and preserve the essence of
physical phenomena more effectively than do verbal descriptions." (Cadmus, 1990).
Laboratory experiences provide students with the important experience of meeting
"nature as it is, rather than in idealized form" (Hershey, 1990), and with the opportunity to
develop their skills in scientific investigation and inquiry. Laboratory experiences that utilize
"hands-on" inquiry have been considered one of the most effective methods for learning about
science and developing the higher order thinking skills necessary to "do science" (Shymansky,
Kyle, & Alport, 1983; Hoffer, Radke, & Lord, 1992). The Shymansky group found that
students in such courses generally had better attitudes towards learning about science and
scientists; better higher-level intellectual skills such as critical and analytical thinking, problem
solving, creativity, and process skills; as well as, a better understanding of scientific concepts
when compared to students in courses that do not utilize "hands-on" inquiry.
These enhanced attitudes and skills along with a better understanding of science are the
goals the 1994 Draft of the National Science Education Standards strives for each student
enrolled in a science curriculum (National Research Council, 1994). The Standards take the
learning of science to an even higher level by describing the learning of science as an "active"
process. "Active" process described by the Standards implies physical and mental activity, in
2
other words "hands-on" and "minds-on" activity. "Science teaching must involve students in
inquiry-oriented investigations in which they interact with the teacher and peers; they establish
connections between their current knowledge of science and the scientific knowledge found in
many sources; they apply science content to new problems; they engage in problem solving,
planning, decision making, group discussions; and they experience assessments that are
consistent with the active approach to learning." (National Research Council, 1994)
Laboratory experiences that utilize various forms of visualization techniques would
provide excellent opportunities for students not only to develop the understanding and
reinforcement of physics concepts, but also to develop scientific investigation and inquiry skills
at the same time. Incorporating visualization techniques into the laboratory experience would
provide an excellent opportunity for students to become involved in the "active process" of
learning science as described by the Standards.
1. 1 STATUS OF HIGH SCHOOL PHYSICS CLASSROOMS
Ironically while the 1994 Draft of the National Science Standards recommends teaching
science with a focus on scientific inquiry and investigation, the use of inquiry-base learning in
science seems to have decreased. The use of inquiry-based learning has gradually diminished
over the last two decades in favor of text-based teaching strategies (Hoffer et al., 1992).
Preference of the text-based teaching strategies over inquiry-based teaching strategies could be
the result of teachers believing that students do not seem to learn as much in the inquiry
programs as in the more traditional, textbook-based programs (Shymansky et al., 1983). While
it is true that effective inquiry-based teaching strategies require more time than traditional
teaching strategies which reduces the amount time used to cover the content, one questions
whether or not the inquiry-based programs were evaluated on their effectiveness in developing
student investigation and inquiry skills as well as their effectiveness in developing student
understanding of the content. Or were the inquiry-based programs evaluated only on their
effectiveness in developing student understanding of the content? The issue of an instructor's
3
preference in using traditional teaching strategies over inquiry teaching strategies would also
question this explanation. Teaching science by traditional methods is definitely less difficult and
less time consuming than teaching science through inquiry.
The amount of time of time devoted to laboratory work could be an indication of the
amount of time devoted to traditional methods of teaching (e.g., lecture and recitation).
According to the American Institute of Physics Report on Physics in the High Schools Part II:
Findings From the 1989-1990 Nationwide Survey of Secondary School Teachers in Physics,
the amount of time devoted to laboratory work in the regular first year physics class has been
pretty consistent through the years at 66 minutes/week in 1987 and 64 minutes/week in 1990
(Neuschatz & Alpert, 1994). A difference in the amount of time devoted to laboratory work in
1990 exists when comparing the time for an introductory high school physics class and the time
for a high school Advanced Placement physics class. For an introductory high school physics
class, the amount of time devoted to laboratory work was 66 minutes/week and for a high
school Advanced Placement physics class, the amount of time devoted to laboratory work was
54 minutes/week (Neuschatz & Alpert, 1994).
The amount of time spent in the high school physics laboratory, as indicated in the AIP's
Report on Physics in the High Schools Part II, does not seem sufficient for the effective
development of students' skills in scientific investigation and inquiry. Scientific
investigation and inquiry require a considerable amount of time not only for the students but also
for the instructor in order for it to be effective. The students need time to engage in scientific
investigation and inquiry to develop these skills. The instructor needs time to prepare for the
activity and to evaluate student learning during and after the activity. The amount of time
required for the set-up and completion of laboratory activities could be another deterrent in
preventing teachers from engaging their students in the inquiry process. One hour a week just
does not seem adequate to develop student skills in scientific investigation and inquiry.
The amount of time devoted to laboratory work in the physics classroom is influenced
by the particular unit that is taught and the availability of equipment and materials for teaching
4
that unit. For example, one would believe that the amount of time spent on laboratory work
would be considerable when covering such topics as mechanics and electricity, but the amount
of time spent on laboratory work would not be considerable when covering such topics as
modern physics. On a limited budget, the amount of materials and equipment available for
teaching mechanics and electricity is quite abundant, while the amount of materials and
equipment available for teaching modern physics is scarce. The availability of equipment and
materials that are necessary for laboratory work on a particular unit has an incredible impact on
the amount of time spent on scientific inquiry and investigation.
According to the AIP's Report on Physics in the High Schools Part II, forty seven
percent of the teachers suggested the improvement of lab facilities and funding when asked for
their suggestions for steps that could be taken to expand physics enrollment and improve
physics programs (Neuschatz & Alpert, 1994). The surprising result was that the above
proposal was by far the most popular one and the least popular proposal was to raise
graduation requirements in science. One would expect in order to expand physics
enrollment in general would require the raising of graduation requirements in science. The focus
of the physics teachers surveyed seemed to be on improving existing physics programs rather
than expanding them.
When one considers the median equipment budget available per physic teacher, the
popular recommendation of improving lab facilities was not at all surprising. According to the
same AIP Report on Physics in the High Schools Part II, the median equipment budget
available per physics teacher for 1989-1990 in the public school was $500 and in the private
school was $1000 (Neuschatz & Alpert, 1994). One just has to look in any current scientific
supply catalogs for the prices of physics supplies and equipment to see that $500-1000 will not
go far in purchasing new supplies and equipment for the classroom. The decline of inquiry in
science classrooms could be partially attributed to materials and equipment being either too
expensive or too difficult for the teacher to secure and to maintain.
5
Another possible reason for the decreasing use of inquiry in the teaching of science is
the lack of training in inquiry for science teachers. When teachers were asked in the AIP's
1989-90 Nationwide Survey of High School Physics Teachers what they felt unprepared to
teach, recent developments was consistently on the top of the list with lab techniques in coming
second for all teaching experience levels (Neuschatz & Alpert, 1994). Basic physics was
consistently at the bottom of the list with applications to everyday life coming in second to the
bottom for all teaching experience levels. The numbers of physics teachers who felt unprepared
to teach a particular component of the course decreased with teaching experience.
The results are not so surprising when one considers that the essential physics
knowledge and applications are normally acquired in its most concentrated form during one's
undergraduate physics education. Laboratory skills, on the other hand, tend to be covered in
less depth in undergraduate training. Instead, they are often "learned by experience", and are
likely to improve with experience as teachers learn what works for their students.
Hoffer, Radke, & Lord (1992) give another explanation for the decline of inquiry in the
science classroom. Although scientific inquiry is potentially a powerful method, it may have
arrived on the educational scene too early to gain widespread adoption. They cite as evidence
that easy-to use analysis tools for recording, organizing, extracting, and analyzing information
were not available to classrooms 10-20 years ago. Since the computer is recognized as an
excellent tool for facilitating inquiry activities in science, the advent of widespread computer use
in classrooms and the availability of "user friendly" database applications, simulations, and
multimedia applications for personal computers might indicate that inquiry's time has finally
come.
Ineffective inquiry-based programs, the current state of high school lab facilities, lack of
time in the school day, lack of teacher training in scientific inquiry, and the lack of proper
analysis tools could all contribute to the decline of inquiry-based learning in the physics
classroom. With the guidance of National Science Education Standards and such related
works, the availability and affordability of "user-friendly" technology, and the availability of
6
effective inquiry-based programs, the "active" process of learning science can take place in the
physics classroom where it belongs.
1. 2 THE USE OF TECHNOLOGY IN PHYSICS CLASSROOMS
The use of computers in scientific inquiry and in the learning of science content can be
an effective tool in the "active process" of learning science. The 1994 Draft of the National
Science Education Standards recommends that conducting effective scientific inquiry requires
students to have easy and frequent opportunities to use a wide range of equipment including
computers and computer applications, materials, and other resources for supporting
experimentation and investigation in the classroom (National Research Council, 1994).
The use of computers in physics courses has increased substantially in the last five years.
Computers can be very helpful in laboratory situations for data analysis and data collection
through interfacing devices as well as situations were concepts can be reinforced by various
forms of drill, practice, and tutorial work. Computers can also be used to simulate certain
experiments that would otherwise require expensive equipment (e.g., Millikan oil drop
experiment) or would expose students to unnecessary hazards (e.g., counting experiments with
radioactive samples). Computers that utilized a variety of visualization techniques (e.g.,
simulations, models, real-time graphs, and video) in the laboratory environment could provide
opportunities to reinforce the learning of physics concepts and to develop student skills in
scientific investigation and inquiry.
"The use of microcomputers to collect analog data about a physical system, to convert
that data to digital input, and then transform that data into a real-time graph provides science
educators with a powerful tool." (Nakhleh, 1994) Programs that provide this function of real-
time data input and conversion are known as microcomputer-based laboratory tools (MBL).
Brasell (1987) and Thornton & Sokoloff (1990) found that students using real-time
graphs with MBL significantly improved their kinematics graphing skills and they understanding
7
of the qualitative aspects of motion they observed as compared to students using delay-time
graphing (kinematics graphs produced after the motion of an object).
Beichner (1990) analyzed the effect of MBL on student learning in a high school and
college physics classroom by comparing the understanding of kinematics between those
students who were taught by demonstrations and computer simulations of videotaped images
and those students who were taught by microcomputer-based laboratory techniques. Beichner
found those students taught by demonstrations and computer simulations did not achieve as well
as those students taught by MBL techniques. Beichner 's results also suggested that direct
personal control of the computer and/or the experience of producing the graph produced the
enhanced MBL learning.
Using student analysis of videodisc-recorded images, Brungardt & Zollman (1993)
found no significant learning difference between using real-time and delay time analysis for
understanding of kinematics graphs. However, their results imply real-time analysis may result in
increased student motivation, discussion, and less confusion between velocity versus time and
acceleration versus time graphs than delay-time students.
Workshop Physics, an activity-based introductory college physics course where there
is no formal lectures, is an excellent example of a program that incorporates computer
technology into real experiences where students can develop their inquiry skills (Laws, 1991).
Workshop Physics integrates various computer applications in a computer network to be used
by students in activities where they observe phenomena, analyze data, and develop verbal and
mathematical models to explain their observations. The computer applications used in
Workshop Physics include: various microcomputer-based laboratory tools to collect data and
display graphs of data in real time, dynamics spreadsheets and graphs for data analysis and
numerical problem solving, computer simulation programs for phenomena not conducive to
direct observation, and video analysis tools used to analyze the motion of objects (Laws, 1995).
When analyzing the effect of Workshop Physics on student learning when comparing
students' performance before and after the course, Laws found dramatic improvements in
8
student conceptual learning in the topics of kinematics, dynamics, latent heat, and electricity
(Laws, 1995). These improvements in student learning resulted after discussion, observations,
and predictions were integrated into the program. Laws also found that student attitudes were
more positive about the mastery of computer applications than any other aspect of the
Workshop Physics course (Laws, 1991).
1. 3 INTERACTIVE DIGITAL VIDEO
The computer-based video technology used in Workshop Physics was utilized to
collect and analyze two-dimensional motion data recorded on videodisc and student-generated
videotapes (Laws, 1991). The interactive video technology used to collect motion data from
student-generated videotapes incorporates a comparable data-collection method that is used by
MBL. However, the interactive video system has two advantages over MBL: it analyzes two-
dimensional motion and students can watch the graphs and the video of the event at the same
time (Chaudhury & Zollman, 1994).
For many years, the computer visualization technique of interactive video was limited to
the videodisc that allowed physics students to collect data from the motion of laboratory or
"real-world" events. The random-access videodisc played a prominent role in interactive-video
teaching by providing students with already captured video for collecting data. These video
sequences often represent interesting physical phenomena that are not easily simulated in the
laboratory. Several techniques and videodiscs for this type of data collection and interaction
have been developed (Zollman & Fuller, 1994).
However, recent advances and decrease costs in multimedia computing and digital
video equipment have resulted in the increased availability of interactive multimedia equipment
and in improvements in displaying video on a computer monitor. The capture capabilities of
computer digital video systems now allow the teacher and students to capture their own video
of experiments they themselves performed by storing the video on their computer's hard drive.
The students may then analyze these videos in a variety of ways, such as by using the standard
9
techniques developed by the Kansas State University Physics Education Group (Zollman &
Fuller, 1994) and refined by Wilson (1992) and Laws (1992). These methods involve treating
the video as a set of digitized individual frames. Because the video is stored as digital
information on the hard drive, various image-analysis and image-processing techniques can be
used repeatedly on the video files with no loss of quality (Chaudhury & Zollman, 1994).
Another advantage of using digitized video is that once a video sequence has been
captured as a file, this file can be copied to any computer that has a playback board. This
would be advantageous in those classrooms that do not possess multiple copies of the
necessary video equipment, but possess several computers. One computer with the required
video equipment would be used to capture the video. While the other computers would be
equipped with playback boards to replay and analyze video.
Interactive digital video has the following capabilities:
(1) It provides random access, still frame, step frame, and slow play capabilities
found in standard videodisc technology.
(2) It provides the capability of collecting two-dimensional spatial and temporal data
about any object on the screen.
(3) It provides the capability to process or change the sequence of images and play
the revised video.
(4) Most importantly, it gives the control of the learning situation to the teacher and
students. This enables students to answer their own inquiries and do so at a pace
that is comfortable for them.
By developing a variety of techniques for the use of interactive video, the KSU Physics
Education Group and others have offered teachers many ways to use this powerful visualization
medium in the teaching of physics. The KSU Physics Education Group has focused on using
this type of interactive digital video as a laboratory tool for investigation and inquiry.
"Interactive video provides a means by which students can collect, analyze, and model data
from observable events which occur outside the classroom. More often students collect data in

10
the same manner used by a researcher who analyzes the recorded events." (Zollman & Fuller,
1994) Real-time capture combined with the ability to digitally manipulate images could offer
students and teachers a better way to visualize, analyze, and understand physical phenomena.
"Showing the connection between physics and events outside the classroom helps
students perceive the relevance of physics to their lives and how physical laws help them to
understand nature" (Zollman & Fuller, 1994). Interactive digital video can be used to engage
students in the "active" process of learning science as described by the National Science
Education Standards.
1. 4 INTERACTIVE DIGITAL VIDEO TOOLS
The KSU Physics Education Group has developed tools and materials specifically for
the use of interactive digital video in the physics classroom. The interactive digital video
materials were developed and constructed around two Windows-based, interactive computer
programs, Video Analyzer and Visual Space-Time. Both programs utilize a Windows
framework to be "user friendly".
Video Analyzer Computer Program
The first program, Video Analyzer uses Intel's ActionMedia II package to capture
video from a video camera to the hard drive of a computer. The program offers several
playback options including continuous playback, frame increment, and random frame selection
using a "slider" control. The mouse can be used to position the cursor anywhere within the
frame, to leave a mark at that location, and to write the corresponding image coordinates to a
file in a format readable by most spreadsheet programs. This allows the user to trace the path of
moving objects on the video screen and to perform calculations and graphical analyses of these
paths using the generated coordinate file. The program can also be used to trace the motion of
complex objects.
11
Visual Space-Time Computer Program
The second program, Visual Space-Time, does not capture video, but uses the
ActionMedia II file format to analyze the linear motion of objects. The program allows the user
to identify and label the objects of interest and to mark their positions at a particular frame or
period of time. These marks will be used to locate the objects in all future frames. The
program allows the user to block out a rectangular section of the video that encloses these
marks that represent the objects at a particular frame. When the two objects have been
digitized, the program will extract the same rectangular section from each frame and place them
next to one another either beside or beneath the window in which the video is simultaneously
being displayed. Two colored points appear in each rectangle to indicate the location of each
object at that time. The trails of color dots that result from the accumulation of these rectangles
represent the visual space-time diagram (VSTD). The visual space-time diagram illustrates a
distance versus time graph where the distance coordinates are along the horizontal axis and the
time coordinates are along the vertical axis. After constructing a visual space-time diagram for
the laboratory reference frame, the user can view the visual space-time diagram corresponding
to the same interaction observed from the frame of reference of either object, or the center of
mass reference frame.
"By observing how the perspective of an event changes from one reference frame to
another, students can learn an important lesson about the relationship between reference frames
and observation" (Chaudhury & Zollman, 1994). Another advantage of visual space-time
diagrams is that the students are able to see one single stable image that represents the entire
motion of objects captured in the video.
1. 5 INTERACTIVE DIGITAL VIDEO ACTIVITIES
The KSU Physics Education Group has developed materials for a set of five activities
that incorporate interactive digital video in the physics classroom. The objectives of these
interactive digital video activities are the following:
12
(1) Students will incorporate the Video Analyzer and Visual Space-Time computer
programs for the capture, playback, and analysis of digital video into five
activities where they will investigate and apply the concept of frames of reference
in various real-life situations.
(2) Students will qualitatively and quantitatively analyze the motion of dynamics carts,
colliding carts, falling objects, and projectiles viewed in various reference
frames by using a video camera, a digitizing board, and computer programs for the
capture and playback of the video.
The target audience for these materials are middle school and high school physical
science students (9th-12th). The activities were developed for students ranging from the
introductory level of physical science in the middle school to the advanced level of physics in the
high school.
The ultimate goal of the interactive digital video materials is to enable those students
who traditionally avoid physics to move from concrete, everyday experiences to more abstract
ideas and models of physics. It is hoped that some of these techniques will allow for the
introduction of these abstract ideas and models of physics at an earlier stage in the students'
academic careers than is possible at the present.
The basic experimental apparatus used in the activities are: a video camera, a PC
computer with a video digitizing board, dynamics carts and tracks, and a ballistic cart accessory
with a drop rod mechanism. The apparatus are likely to be available to a high school physics
teacher.
Some of the experiments were inspired by the segments in Ivy & Hume's Frame Of
Reference film that analyze the motion of a vertically dropped ball from different reference
frames (Ivy & Hume, 1960). In the interactive digital activities, the video camera is placed in
reference frames that are fixed relative to the earth by placing the camera on a stationary tripod.
The video camera is placed in moving reference frames by mounting the camera on an easily
moved dynamics cart that is placed on a track. When the video camera is mounted to the cart,
13
the cart is capable of independent motion or coupled motion when connected to an identical
cart resting on a parallel track. The reference frame of the video camera can be easily switched
by simply relocating the camera. In these reference frames, one can record the motion of a
moving cart, colliding carts, a ball as it is dropped a short distance, and a ball fired as a
projectile.
The activities were designed to engage students in scientific inquiry by providing them
with opportunities to explore and apply the concept of reference frames in various story-line
real-life problems. Each activity begins with a short introduction to the story-line problem.
These problems which are modeled by the activities cover various topics. The first activity,
"Visual Space-Time Diagrams and Motion", focuses on linear motion. The second activity,
"Visual Space-Time Diagrams, Collisions, and Frames of Reference", deals with elastic and
inelastic collisions. The third activity, "Video-Captured Collisions and Momentum
Conservation", covers momentum conservation. The fourth activity, "The Ball Drop and
Frames of Reference", focuses on falling objects. The last activity, "The Human Cannonball",
concentrates on projectile motion.
The students investigate the relationships between reference frames and the concepts
associated with each topic by capturing the video of experiments they perform and by using one
or both of the interactive computer programs to analyze the motion of the objects used in the
activity. The students also complete various instructional exercises to develop and reinforce
their understanding of this relationship between reference frames and the concepts associated
with each topic.
14
Activity #1: "Visual Space-Time Diagrams and Motion"
In the first activity, the procedures of video analysis are introduced by using captured
video to analyze the motion of a dynamics cart on a track. The video camera is mounted on a
stationary tripod at a fixed distance from the cart and track. In the first part of the activity, the
students capture video, play back video, and describe qualitatively the motion of the cart by
analyzing visual space-time diagrams (VSTD). In the second part of the activity, the velocity
and acceleration of the cart are calculated at both ends of the track by making quantitative
measurements from the captured video. The velocity and acceleration values of the same cart at
one end of the track are compared with the velocity and accelerations values of the cart at the
other end of the track. A number of application qualitative questions and application problems
are assigned throughout the activity. Both interactive computer programs are used in the
analysis.
Activity #2: "Visual Space-Time Diagrams, Collisions, and Frames of Reference"
By using the captured video from a stationary camera, students qualitatively analyze
elastic and inelastic collisions between two dynamics carts viewed in various reference frames.
In the second activity, the video camera is mounted on a stationary tripod at a fixed distance
from the carts and track. Using the computer programs to play back the video and draw visual
space-time diagrams, the students qualitatively describe the motion of the carts. Velocities of
both carts before and after an elastic collision are calculated by making quantitative captured
video measurements. The velocities of the carts before the elastic collision are compared with
the velocities of the carts after the elastic collision. A number of qualitative application questions
are assigned throughout the activity. The same video files used in the second activity are used to
complete the third activity.
15
Activity #3: "Video-Captured Collisions and Momentum Conservation"
Using both computer programs, the students continue to analyze collisions captured on
video from the second activity. By making quantitative measurements, the velocities of both
carts before and after each collision can be calculated. These velocities and the carts' masses
are used to calculate the momentum of each cart before and after the collision. The total
momentum of both carts before and after the collision are calculated to determine whether or
not momentum is conserved for the different types of collisions. A number of application
problems are assigned throughout the activity.
Activity #4: "The Ball Drop and Frames of Reference"
In the fourth activity, students qualitatively analyze the motion of a falling object dropped
from various reference frames. The motion of the object that is dropped from a moving cart is
compared with the motion of the cart itself. The ballistic cart apparatus and the drop rod is
mounted to a dynamics cart on a track, while the camera is mounted to an identical cart on a
parallel track. Video Analyzer is used to trace the path of the falling object in different set-ups.
The motion of the falling object is qualitatively described by using Visual Space-Time to draw
visual space-time diagrams. A number of application questions are assigned throughout the
activity.
Activity #5: "The Human Cannonball"
The students qualitatively analyze the motion of a projectile in various reference frames.
In this final activity, the video camera and projectile launcher are mounted on a dynamics cart.
The target for the projectile consist of a modified net mounted on an identical cart. Video
Analyzer is used to trace the path of the projectile in different configurations of motion. A
number of relative position exercises (RP EXER) are assigned where students place stickers
that represent objects in positions relative to one another when certain events occur.
16
The interactive materials were designed to provide high school physics teachers with
effective exploration and application activities that incorporated existing resources and the latest
"user friendly" technology to bring the "active" process of learning science in the physics
classroom.
1. 6 PURPOSE OF THE STUDY
This study investigates the effects of using interactive digital video materials in an
introductory college physics classroom on student learning and attitudes. The study analyzes
students' perceptions of the materials' effectiveness of using various instructional techniques
(e.g., using the captured video to trace an object's motion, drawing visual space-time diagrams,
and discussion) in learning of the physics concepts. The study also examined student attitudes
toward computers and the relationship these attitudes have with demographic variables (age,
computer experience, and education) that were collected. The students were also asked to rate
the difficulty of each activity and the activities in general to determine whether or not there was a
relationship between perceived difficulty and student attitudes toward computers.
Student comprehension and application of the physics concepts involved with the
activities were assessed and the relationship between student performance on these assessments
and student computer attitudes were also examined.
17
CHAPTER 2
REVIEW OF LITERATURE
The bulk of this study documents and examines the incorporation of interactive digital
video materials into the physics classroom as a means for students to understand and reinforce
physics concepts as well as to develop investigation and inquiry skills. A number of reports and
previous studies are directly or indirectly related to this present study.
2. 1 VIDEO AS A LABORATORY PROBE
Until recently, the use of interactive video in a laboratory type environment to analyze
student videos has not been attempted. While students can, in principle, collect data on
videotape and analyze the motion of an object, they have not had access to good single frame
viewing and step forward/reverse functions, on low-cost VCR's (Zollman & Fuller, 1994).
The ability to use a computer to capture a still picture from a videotape has been
available for several years. Beichner (1989,1990) and Winters (1993) utilized this capability in
different ways. Beichner's students captured a series of stills from paused videodisc or
videotape then used computer software to collect distance-time data from these stills. Winters
developed a unique combination of high speed stroboscopic flash lamps with still capture. In a
dark room, flash units, controlled by a computer, fire in rapid succession. The images created
by the flashes are captured as one single digitized image. Winter's students have used this
technique to investigate very rapid motion such as the movement of the end of a towel which is
"snapped" (Winters, 1993).
Another approach to collecting digital data from an analog video signal was developed
several years ago by three groups working independently (Dengler et al., 1993; Keshishoglow
& Siegmann, 1989; Huggins, 1988). Their approach was to use a video camera as a "probe"
by collecting data about one bright point on the screen as an event occurred in front of the
18
camera. This technique, which requires a computer equipped with special board, allows
students to collect two-dimensional position-time data. Data analysis programs provide the
students with a variety of derived quantities such as velocity and acceleration. However, the
specialized computer boards needed for this approach have not been widely available. Thus,
this approach to video-based laboratory has been limited to a few institutions.
2. 2 VIDEO-BASED LABORATORY AND VIDEO PROCESSING
The use of video-based laboratory tools or VBL (Rubin, 1993) has increased in recent
years with the introduction of low-cost video digitizing boards. VBL enables a user to connect
any video source-camera, VCR, or videodisc player and digitize the incoming analog signal.
The resulting digital data can be stored on a computer disk. Thus, digital video has the
advantage that the entire video scene can be stored directly on the hard disk of a computer in
digital form. This technique is relatively new and, at present, no industry standard exists for the
format of the video or the hardware on which it is played. The most popular forms in use are
QuickTime, Video for Windows, and Digital Video Interactive (DVI). The most recent
version of DVI is Intel's ActionMedia II. They differ in the hardware used, the compression
techniques which enable one to store video on a hard drive, and the type of computer platform
used. QuickTime, DVI, and Video for Windows are available for both Macintosh and MS-
DOS computers.
Digital video has the same playback features found in standard videodisc technology.
Because the video is digital, computer graphics images and video images are mixed together
naturally. By placing the mouse pointer on any location on the screen, the user can easily collect
two-dimensional spatial data about any object or part of an object on the video screen. The
user can also collect temporal data about the object or part of any object on the video screen
by knowing the number of frames from the beginning of the video.
It is quite easy for the students to complete an experiment, collect the data on video,
and collect numerical information from a variety of points on the screen. In the simplest case,
19
one can collect data, import it into an analysis program such as a spreadsheet and do standard
analyses (Laws, 1991). Wagner (1994) demonstrated how QuickTime can analyze the video
motion of automobile collisions from the Physics and Automobile Collisions Videodisc
(Zollman, 1984) by pasting the motion data in Excel and analyzing the resulting graphs.
For more complex motion, such as that of an extended body, one can create simplified
models of the object and use the mouse pointer to draw these models on top of video images.
Thus, digital video enables students to go from observing the real physical event to observing a
simplified model of the event. This type of visualization technique can contribute to students'
understanding of physical concepts by attaching mental images to these events.
Because the video is digital, all of the image processing techniques used for computer
graphics images are now available for video images. "These techniques, often called synthetic
video processing, enable the user to combine successive video frames and to playback video
frames video from perspectives and in modes different from those used during recording"
(Zollman & Fuller, 1994). The KSU Physics Education Group experimented with this method
by developing the Video Analyzer and Visual Space-Time computer programs. The system
used by KSU Physics Education Group only runs on ActionMedia II and a MS-DOS
computer.
The digital video formats have made video-based laboratories, video image processing,
and synthetic video processing all available to the physics teacher with a personal computer.
"Because these processes provide students with a visual means to answer, "What if ? "
questions, digital video may help students better understand the abstract concepts of physics in
terms of their own concrete experiences." (Zollman and Fuller, 1994)
Since the KSU Physics Education Group began work on interactive digital video, the
growth of options for digital video has dramatically increased. New hardware and software-
only approaches have been introduced by companies such as IBM, Apple, Microsoft, Silicon
Graphics, and Sun Microsystem. While these companies have not agreed on common file
formats or compression algorithms, they share the common goal of using video stored digitally
20
on a hard disk. Thus, all of the techniques described here should lend themselves to
implementation on any available digital-video system (Chaudhury & Zollman, 1994).
While it is possible in principle to program these techniques for computers supporting
software-only video, sever limitations exist in resolution (space and time are poor), compression
of video frames (it is limited, so video will occupy a large amount of hard-drive space), and
image processing (it will be slow). However, it is encouraging to know that the developments in
the area of hard disks are expected to provide greater storage capacities along with faster
access (Malhotra & Erickson, 1994). It is hoped developments in the other areas will result in
improvements as well.
2. 3 THE EFFECT OF TECHNOLOGY ON LEARNING
"Any visual media delivery system capable of supporting learner interactivity while at the
same time facilitating interconnectivity of images and symbols has the potential to become an
extremely powerful educational tool" (Dede, 1987) because of the symbolic and connotative
aspects of semantic learning (Bourne et al., 1986). Interactive computer environments are
emerging that appear to be capable of doing just that.
"Learning is a complex phenomenon influenced by academic ability, learning style,
learning environment, content, delivery method, and attitude toward the course content and the
instructional strategy." (Billings & Cobb, 1992) Current research about the use of multimedia
computer instruction investigates the relationship of these variables in order to understand the
emerging role of this technology in optimizing learning.
From the results of a literature review on computer-based learning technologies, Blissett
& Atkins (1993) found most of these applications were designed for the acquisition of factual
data or for training in particular procedures. "Relatively few of the applications studied appear
to have been developed to improve higher-order intellectual skills such as problem solving, or
the acquisition of academic conceptual knowledge." (Blissett & Atkins, 1993) Their results
21
suggest that the effective design of multimedia computer applications is problematic, particularly
in relation to the match or mismatch between learning styles and learning tasks.
Hannafin & Colamaio (1987) and Astin (1994) found multimedia computer applications
to be useful and effective for certain types of learning, but unnecessary or even ineffective for
others. They suggest that any type of computer-based instruction should appeal to a variety of
learning styles. The instructor should anticipate and the instruction should accommodate
learning style preferences (ways in which students prefer to perceive and to process new
information) in order for effective learning to take place.
Some perceive the growth of emerging instructional technologies as a challenge to
create more effective software. Often this challenge is based on the flawed assumption that
better technology is analogous with better instruction. A symptom of this assumption is a
tendency to focus design on the technical characteristics of new media. This perspective views
technology as central to the learning process instead of the student (Hooper & Hannafin, 1988).
What is needed is a more reasonable perspective on the role of technology in
supporting learning, and not simply a rationale for adapting learners to technology. Both
perspectives are important, but neither should exist alone. "Interactive video is neither the first
nor the only technology to progress in the absence of a strong foundation, but it has revised the
perceptions of many as to the upper limits of teaching technology. A commitment must be made
to ensure that technology and learners interact in ways that benefit and optimize the capabilities
of both." (Hannifan & Phillips, 1987) These comments indicate the importance of identifying
and understanding how technology facilitates or inhibits processing. The knowledge of how
interactive multimedia technologies affects student learning must be transformed into strategies
for delivering effective instruction in this multimedia environment (Austin, 1994).
Hooper & Hannafin (1988) recommend a number of empirically derived design
guidelines for emerging interactive technologies. Each guideline is based upon research and
theory in learning, instruction, and/or media development. The guidelines are the following:
(1) Integrate strategies that facilitate meaningful learning.
22
(2) Relate instructional content to students' prior experience. When students relate
new knowledge to existing knowledge and experiences, student learning is made
easier and comprehension of the new material is improved (Jonassen, 1988).
(3) Utilize orienting activities that help prepare learners for instruction by retrieving
relevant information from long term memory to be encoded with new
information.
Orienting activities are "mediators through which new information is presented to the
learner" (Hannafin & Hughes, 1986). They are designed in order to provide students with a
framework on which learning can be organized. Examples of orienting activities
include: pre-tests, behavior objectives, overviews, demonstrations, questions, and problems.
One can relay behavioral objectives through the use of thought-provoking questions and real-life
problems that help acquaint the learner with a specific task.
Orienting activities should enhance the learning of specific information and support higher level
learning tasks. The affective orienting activity is designed to heighten arousal and thus increase
motivation. These activities have the effect of both gaining attention and providing clues to the
students on what they are about to learn.
One of the goals of education is to produce independent learners capable of managing
their own learning environments; learner productivity improves with independence (Reigeluth &
Stein, 1983). Interactive video instruction appears to promote the goal of the independent
learner by allowing the learners control of their learning environment. The importance of learner
control in interactive video instruction is that it allows students who are at different levels of
academic and computer skills to learn at a pace that is comfortable for them (Zollman & Fuller,
1994).
However, many students are not successful when given the opportunity to control their
own learning environment. Learner control is often ineffective because many learners are unable
to determine how much instruction is adequate. Research findings on computer-based
instruction suggest that learners perform better when given adequate guidance and advice upon
23
which to base an individual decision versus either total external or learner control (Hannafin,
1984). One type of coaching which may be provided in the design of computer-based
instruction is the inclusion of orienting activities (Hannafin & Hughes, 1986). The required
procedures may be fairly well known in a controlled computer-based learning environment, but
"the selection and application of such steps to novel situations during controlled instruction is
uniquely important." (Hannafin & Colamaio, 1987)
Research has shown that in order for effective learning to take place in a computer-
based interactive video environment, the instruction must be designed to accommodate various
student learning styles as well as various student academic and computer abilities. In order for
effective learning of science to take place in a computer-based environment, inquiry must be
integrated into this environment. "Inquiry is a critical component of a science program at all
grade levels and every domain of science, and designers of curricula and programs must be sure
that the approach to content and to the teaching and assessment strategies reflect the acquisition
of scientific understanding through inquiry." (National Research Council, 1994)
A commitment must be made by individuals or groups of individuals who design and
develop computer-based instruction for science programs to ensure that students interact with
modern technology and scientific inquiry in ways that benefit and optimize the capabilities of all
three.
2. 4 TEACHERS' PERSPECTIVES OF INTEGRATING TECHNOLOGY
INTO THE CLASSROOM
Hoffer, Radke, & Lord (1992) suggested that the decline of inquiry-based learning in
the science classroom over the last two decades was due to the non-availability of computers
and computer applications. Recent technological advances have resulted in a substantial
increase of computers and computer applications used in the educational environment.
However, a wide gap exists between the current level of computer technology and the reality of
its implementation in the educational environment (Woodrow, 1992). Woodrow believes that
24
one major reason for this disparity has been the limited capabilities of many school computers.
Most recent computer applications require computers of considerable speed and memory
capacity. Until recently, school access to such computers has been limited. However, even in
those environments where adequate computer equipment has been available, it has frequently
not been used to its highest potential. Woodrow believes that clear demonstrations of
techniques and practices that can encourage teachers to implement existing computer
technologies is lacking in the literature. "Most teachers need specialized guidance in the
methods of using high technology in their preparation for teaching before they are sufficiently
confident with that technology to consider incorporating computers in their teaching strategies."
(Woodrow, 1992)
Ronen, Langley, & Ganiel (1992) believe, in spite of personal and objective difficulties,
many physics teachers would like to improve the quality of their lessons by integrating modern
computer technologies into their classes.
Several recent studies (Sheingold & Hadley, 1990; Dwyer et al., 1990) have identified
the characteristics and beliefs of teachers who are successful users of technologies. Teaching
with technology seems to influence teaching style toward an increasingly student-centered and
active learning orientation. At the same time, teachers with progressive beliefs about teaching
tend to be drawn toward using technology.
Honey & Moeller (1990) provide additional information about the distinct differences
between teachers who do and do not use technology. Teachers with a high level of technology
implementation were fairly similar, and tended to concentrate on instilling a sense of curiosity
and desire to learn in their students. They reduced the amount of time spent on content and
devoted more time to an inquiry-base approach which helped students develop critical thinking.
These teachers use technology within a process-oriented approach to enable students to reach
well defined curricular objectives. They believed that allowing students to explore and to use
computer applications resulted in increased learning since the students enjoyed finding creative
ways to master the curricular objectives. In other words, those teachers who are more likely to
25
use scientific inquiry in their classes are the same teachers who are more likely to use technology
in their classes.
Honey & Moeller found teachers with a low level of technology implementation were
more heterogeneous. Beliefs within this group ranged from process-centered to more traditional
approaches to teaching. One group of teachers in this group advocated traditional practices,
maintained very structured classrooms with high levels of discipline, emphasized content rather
than process, closely followed texts, and used class lectures as the major means of teaching.
They felt using technology in the classroom was disruptive. When these teachers used
technology, its purpose was to reinforce basic skills or to increase motivation rather than to
improve the curriculum. It is no surprise that these type of teachers would prefer to use
traditional methods of teaching science rather than scientific inquiry.
Honey & Moeller found process-centered teachers, who were also "low
implementors", tended to fall into one of two groups. One group was reluctant to use
technology because of personal anxieties. Many in this group stated that their initial experience
with technology had been a negative one, and because they had not seen appropriate examples
in their curriculum, they lacked ideas on how to incorporate technology into their curriculum.
The other group stated that the lack of equipment and materials in their schools prevented their
use of technology.
Woodrow (1992) concluded that teachers need specialized guidance in the methods of
using modern technology in their teacher preparation before they are sufficiently confident with
that technology to consider incorporating computers in their teaching strategies. To encourage
physics teachers to incorporate computers and computer applications or to incorporate
scientific investigation and inquiry in the classroom, clear demonstrations of effective techniques
and practices that is now available must be made.
26
2. 5 CONCEPTS OF PHYSICS: AN EXAMPLE OF INTEGRATING
TECHNOLOGY WITH SCIENTIFIC INQUIRY
One such program that demonstrates effective techniques and practices that implement
scientific inquiry with technology is a new math and science teacher preparation program
created at Kansas State University (Zollman, 1994). The premise of the program is that in
order to have students who will become interested in and excited by science, teachers must be
prepared to be competent to teach science and to understand the methods appropriate to the
teaching of science. This interest in science has to be instilled in students before they reach the
upper grades of their secondary education, because by then it may be too late for students to
fully develop an appreciation and understanding of science, its methods, and its applications.
Teachers in the early grades who enjoy science and feel comfortable teaching are necessary for
students to become interested in and excited by science.
The science and education faculty of Kansas State University have created a science
and mathematics teaching specialty within the program for preparing future elementary school
teachers. The program involves courses in mathematics, physics, chemistry, biology, and earth
science as well as courses on how to teach these subjects.
The program goals are to create teachers who have adequate knowledge in science so
that they can feel confident in their ability to teach science, who are aware of appropriate
methods for teaching science to young children, and who use modern teaching materials and
technology in their classrooms. To meet these goals, KSU has developed courses that
introduce a limited number of topics in more depth than a typical introductory survey course and
which emphasize hands-on learning and the use of modern technology in teaching and learning.
The program's concentration on inquiry and technology follow the recommendations made by
the 1994 Draft of the National Science Education Standards (National Research Council,
1994).
The focus of the physics component of the new program is the course, Concepts of
Physics, for future elementary school teachers (Zollman, 1990). This course provides
27
experiences in physics which are appropriate to the future elementary teachers and which
provide a model for appropriate ways to teach science in any classroom. The instructional
method for the course was based on the learning cycle developed by Karplus (1977). The
instructional method utilizes an open laboratory environment for "hands-on" exploration and
application activities as well as a discussion format for the introduction of new concepts. The
discussion component of the course is used to illustrate the relationships among the various
activities of the exploration and help the students understand a model or theory that explains
their observations during the exploration.
The central feature of the Concepts of Physics course is the activities that students
perform. The learning cycle allows the focus to be on the activities and concentrates the
students' attention on the importance of these activities as methods of teaching science.
Students frequently report on course evaluations that they succeeded in learning physics only
because they completed the activities. This attitude is exactly the attitude the authors of the
program want to convey to the students.
Workshop Physics uses a similar activity-based approach to teaching introductory
college physics (Laws, 1991). Recently in a talk given at Kansas State University, Laws
concluded that "activity-based environments coupled with interactive discussions, and
homework are superior to traditional methods for enhancing conceptual development,
experimental techniques, and scientific literacy." (Laws, 1995)
Recently, digital video was used to expand the use of video in the exploration and
application activities in the Concepts of Physics course. Students placed video cameras in
reference frames that were moving or fixed relative to the Earth. In these reference frames the
students used digital video to record and analyze the motion of a ball as it was dropped a short
distance. The ball and dropping mechanisms were mounted on a cart so they could also be
fixed or moving with respect to the Earth. Students, using digital video, were able to see that
the motion of the ball was straight down when both the camera and ball were fixed relative to
28
the Earth. Many of the students were surprised that the same motion occurred when both the
camera and the ball were moving at identical horizontal velocities.
Students are unlikely to have had a similar powerful visualization experience of
reference frames using some other multimedia. Not only does digital video provides the student
with a powerful visualization experience, but it also provides an opportunity for students to
analyze an experiment that they have completed themselves. "Any event that students can
record on video can be measured. Thus, students gain control of video recording,
experimentation, and analysis." (Zollman, 1994)
The study of the physics component of the science teacher preparation program
developed at KSU is related to the present research for several reasons:
(1) It is a good example of how a program can demonstrate effective techniques and
practices that implement technology with scientific inquiry.
(2) The interactive digital video activities that focus on the exploration and application of
the concept frames of reference in various situations reflect
learning cycle framework found in the Concepts of Physics course.
(3) The students enrolled in the Concepts of Physics course were used to evaluate the
effectiveness of the interactive digital video materials and activities found in this
study.
2. 6 TEACHER'S ROLE IN INTERACTIVE DIGITAL VIDEO
Blisset & Atkins (1993) suggest to colleagues who are trying to integrate computer-
based technologies into conventional classrooms that the intellectual, academic roles of the
teacher will remain as important as ever. "Fears that a technology-enhanced learning
environment will mean the downgrading of teachers to technical managers look premature."
(Blisset & Atkins, 1993)
Blissett & Atkins designed a detailed case study of interactive videodisc in use of
groups of 12-13 year old students. The activities in this study had been designed for use by
29
groups of three to four students working without the teacher. This could have been a cost-
effective rationale for the use of the new technologies, and might enable individuals in small
groups to break out from the normal constraints on learning that arise in whole class teaching of
students.
The students were encouraged to work through the activities as a group and discuss
with another solutions the problems. These discussions had several advantages. The first
advantage was that talking about the task helped some students to clarify what it was they had
to do. Stimulated by comments "What are we doing?" or "I don't get it.", peer explanation
tended to follow and, providing it was accurate, was quite effective in guiding understanding.
The second advantage was that talking about a problem sometimes helped a group to
see how to solve it. This agrees with existing literature on problem solving which suggest that
restating the problem in one's own terms is a good step to solving it (Kahney, 1986). "Linked
to this point is the further observation that, with some observations, the resources of the group
were greater than the resources of any one individual student. The combined pool of ideas and
alternative strategies seemed to enhance the quality of the answer." (Blissett & Atkins, 1993)
The third advantage of the group discussions was that they forced students to articulate
and defend their understanding of the problem or the mathematical concepts. "Explaining to
others in such a way that they can make sense of it, is a good way of testing the coherence of
one's own understanding and may in itself lead to a deeper processing of the material and more
abstraction in thinking." (Blissett & Atkins, 1993)
But Blissett & Atkins found two disadvantages to the group discussions in terms of
learning effectiveness. First, the group work required students to have certain kinds of
social/communication skills. Students who did not possess these skills may have been
disadvantaged in terms of participation and learning benefit whatever their ability.
The second disadvantage observed in this study was when in the process of answering
an application question, the impatience of the group to go on and enter a guess overrode
thoughtful problem solving. "Clearly, an anecdotal observation is an insufficient basis for
30
anything more than speculation, but the speculation nevertheless is that group work, especially
when combined with highly interactive multimedia applications, may not provide the personal
"space" for thinking deeply that some types of learning required" (Blissett & Atkins, 1993).
Blissett & Atkins found when group interaction results in below optimal learning and the
effect of the group's dynamics is to cancel out the metacognitive features built into the program,
then there is no obvious way for the group to improve the level of its learning. At the end of the
study, they felt that the full potential of interactive video would not be realized without a teacher
available who could undertake the following roles:
(1) Provide guidance and further explanation on the nature of the task when the
groups gets stuck or worse, misunderstands what they have to do.
(2) Individualize the learning experience through assessment of the learning that is
occurring followed by interventions designed to link and relate, or extend and
consolidate, in response to particular students or groups.
(3) Help the group to review its problem solving strategies and direct them towards
more powerful ones.
2. 7 REFERENCE FRAMES
According to the AIP's Report on Physics in the High Schools Part II, the greatest
amount of class time was spent on the unit of mechanics across all physics courses (Neuschatz
& Alpert, 1994). The units of electricity & magnetism and optics & waves lag behind
mechanics in second and third across all high school physics courses in the same survey. In a
regular first-year physics course, the amount of class time devoted to mechanics was 35% in
1987 and 37% in 1990. The amount of class time devoted to mechanics in an introductory
physics course was 40% in 1990 and the amount of class time devoted to mechanics in an
advanced placement physics course was 39% in 1990 (Neuschatz & Alpert, 1994).
In the unit of mechanics at the high school physics level, the emphasis is on motion and
forces. While reference frames normally acts as the introductory concept in the unit of
31
mechanics, students often lack a high level of abstract and conceptual understanding of
reference frames. "Students understand the simple examples of reference frames that utilize
some kind of ball/person/train illustrations, but they very seldom develop a higher level of
conceptual understanding of reference frames." (Bowden et al., 1992).
"Concepts are always learned and understood in context." (Huffman & Heller, 1995)
Bowden's group also believe that student conceptual understanding of reference frames is
contextual. Whether a student is able to show understanding of frames of reference in dealing
with the ball/cart/ground relationship in terms of velocity and displacement depends on the
context in which the phenomenon occurs. "Teachers must not only seek to have students
develop an understanding of, say, frames of reference; they must specify the type of
phenomenon in which that understanding is desired." (Bowden et al., 1992) Thus, the
advantage of incorporating a real-life storyline approach to the interactive video activities is that
the type of phenomenon in the understanding of reference frames is desired is already clearly
defined for the student.
"The capacity to get the correct numerical solution has low correlation with the capacity
to demonstrate qualitative understanding of the concepts in different contexts." (Bowden et al.,
1992) "When a student answers a test question, it is difficult to determine the extent to which it
measuring their understanding of the concept and the extent to which it measuring their familiarity
with the context." (Huffman & Heller, 1995) Teachers should reflect on the need to develop
problem situations that require not only quantitative solutions, but also qualitative explanations
that can be used to assess student understanding of the concepts. Questions should require
students to explain the problem situation in ways that reveal their understanding of the underlying
principles. Questions should probe student understanding of an underlying concept such as
frames of reference without specific reference to it in the problem descriptions. "However, just
as quantitative problem solving can mask lack of understanding of underlying concepts so too,
can qualitative questions that can be adequately answered by reproduction of rote-learned
definitions or procedures. The detailed content of the problem situation should be novel with its
32
explanation being dependent on understanding of the targeted underlying concepts." (Bowden et
al., 1992)
The interactive video activities were developed in such a way as to provide students
with opportunities to develop their understanding of frames of reference by providing them with
the technological tools to visualize the concept of frames of reference and to qualitatively and
quantitatively analyze related measurements.
2. 8 MEASURING STUDENT COMPUTER ATTITUDES
In this age of rapidly increasing technological advances, the role of computers and
computer applications in facilitating student learning of science is becoming more important than
ever. Teachers who plan to incorporate computer technologies in their classroom must be
aware of their own and their students perception of competence and comfort in using
computers. As more individuals are learning about computers and computer applications, it is
becoming evident that not all individuals are comfortable in doing so (Marcoulides, 1989).
When students are first exposed to computers and computer applications, many respond
enthusiastically and quickly master the skills necessary for the effective application of computers.
For many students, however, the experience is unpleasant. These individuals exhibit anxiety
when required to learn about or to use computers (Loyd & Gressard, 19842).
If the variables that influence individual attitudes toward computers can be determined,
instructional programs could focus on these variables and strengthen individual computer skills
as well as their confidence in using computer. Individuals can leave these programs feeling
comfortable and competent using computers in the classroom which would optimize the learning
environment.
Kulik, Kulik, & Bangert-Downs (1985) encourage the evaluation of computer-based
education in terms of attitude towards computers, student attitude toward instruction and
subject matter and also amount of time needed for instruction. An instrument which would
33
measure computer attitudes could aid in the evaluation of new programs or in the identification
of potential problems in implementing curriculum changes (Loyd & Gressard, 19841).
The Attitudes Toward Computer Technologies (ACT) instrument was developed by
Delcourt & Kinzie (1993). ACT is a Likert-type questionnaire that measures perceived
usefulness of and comfort/anxiety with computer technologies. The ACT along with another
instrument, Self-Efficacy for Computer Technologies (SCT), was developed and initially
validated for use with teacher education students and practicing teachers. The SCT instrument
measures perceived self-efficacy for computer technologies (word processing, electronic mail,
and CD-ROM data bases). Perceived self-efficacy reflects an individual's confidence in his or
her ability to perform the behavior required to produce specific outcomes and is thought to
directly impact the choice to engage in a task, as well as the effort that will be expended and the
persistence that will be exhibited (Bandura, 1977). In fact, high correlations are often reported
between self-efficacy and subsequent performance (Bandura & Adams, 1977). In a review of
the literature, Delcourt & Kinzie did not find any instruments that measured attitudes and self-
efficacy with regards to computer technologies in teacher education. Consequently, they
developed the ACT and SCT instruments to make it possible to assess the relationship between
attitudes and self-efficacy for computer technologies.
To develop appropriate instruments, Delcourt & Kinzie followed procedures based on
those advanced by Gable (1986). General categories were identified for each proposed
instrument. Following an analysis of scales developed by Delcourt & Lewis (1987), Murphy,
Coover, & Owen (1988), and Loyd & Gressard (1984)1; a number of items were selected and
revised with author permission. A total of 19 items were developed for the attitude instrument,
11 measuring Usefulness (i.e. "Communicating with others over a computer network can help
me to be a more effective teacher.") and 8 measuring Comfort/Anxiety (i.e. "I feel comfortable
about my ability to work with computer technologies."). These items were equally balanced
between positively and negatively phrased statements, as recommended by Likert (1932).
34
A Likert scale with a 4-point response format was chosen for both instruments utilizing
descriptors ranging from Strongly Disagree (1) to Strongly Agree (4).
The ACT instrument was administered to 328 undergraduate and graduate students
enrolled in education courses at six universities across the country. Demographic information
collected for this sample included age, sex, and current level of education. Participants were
also asked about their use of, and prior course work involving computer technologies (word
processing programs, electronic mail, CD-ROM data base systems). The mean age for the
sample was 25 years. Responses were received from 67 males and 259 females. Most of
these individuals were enrolled in undergraduate degree programs (n = 207). The remaining
participants were graduate degree students (n = 97).
Data from these administrations were used to perform a Principal Component Analysis
(PCA) and to examine the internal consistency reliability of each instrument. The Principle
Component Analysis of the 19-item ACT instrument identified three empirical factors which
explained 52.3% of the variance among the ACT items. The first factor reflects comfort/anxiety
about computer technologies with 8 items associated with this factor. The second factor reflects
perceived usefulness of computer technologies (positively phrased, specific content) with 5
items associated with this factor. The third factor reflects perceived usefulness of computer
technologies (negatively phrased, general content) with 6 items associated with this factor.
Alpha (internal consistency) reliability for the entire ACT instrument was fairly high (.89); as
were the reliability values obtained for the two conceptual factors (Comfort/Anxiety, .90;
Perceived Combined Usefulness, .83). According to Gable (1986), reliability figures of above
.70 are acceptable levels for an attitude measure.
Exploratory hierarchical regression analyses were undertaken to investigate the
relationships between demographic variables, experiences in using computer technologies,
attitudes, and feelings of self-efficacy. Attitudes proved to be statistically significant predictors
of self-efficacy for all three types of computer technologies (Word Processing, Electronic Mail,
35
and CD-ROM). These outcomes point to the importance of considering attitudes as a unique
contributor in the prediction of self-efficacy.
2.9 SUMMARY
The reports and previous studies reviewed in this chapter reveal a broad range of topics
that are directly or indirectly related to the present study of documenting and examining the
integration of interactive digital video materials into the physics classroom. However, the
literature that specifically examines the effects of interactive digital video on student learning and
attitudes in the physics classroom is very limited due to the integration of digital video into a
specific learning environment and relatively recent developments made in digital video
technology. Hence, the majority of the reports and studies covered in this chapter focus on
certain aspects of the present study.
36
CHAPTER 3
METHODOLOGY
3. 1 INTERACTIVE DIGITAL VIDEO ENVIRONMENT
The students involved in the digital video evaluation were students enrolled in the
Concepts of Physics course during the Fall Semester at Kansas State University. Each student
could complete and evaluate up to three of the five digital video activities for extra-credit.
When the students signed up for their first activity, they were asked to complete an initial
computer attitude survey and to provide demographic information about themselves (e.g.,
gender, age, educational experience, and computer experience).
The students were allowed up to 2 hours to complete a given video activity. During the
scheduled time, three students would work as a group in a "lab studio" setting. The "lab studio"
was an ordinary classroom setting where the students were given all the necessary materials and
equipment to record and analyze their own video of each reference frame experiment. The
equipment required to complete each activity was set up for the students, and they were given
all necessary resources to complete it.
The students were encouraged by a proctor to work as a group and to participate in
group discussions about aspects of the activity. The proctor took the role of a technical
consultant and of a facilitator during each activity. The proctor would assist the students with
equipment problems or clarifying procedures. Thus, the proctor did not provide instruction but
helped the students learn. The students were not given any "corrective" feedback in the
comprehension of the concepts in the hope they would discover the results on their own.
After completing each activity, the students completed an evaluation of it..
At the end of the semester, the students completed a second computer attitude
inventory scale and rated the difficulty and the effectiveness of each activity in helping
37
them learn the physics concepts. All the students in Concepts of Physics class completed a
final exam which included questions that were specifically developed to assess student
understanding and application of the concepts addressed in the video activities.
3. 2 MEASURING INSTRUMENTS
Computer Attitude Scale
The Attitudes Toward Computer Technologies (ACT) instrument was used to
measure student perceived usefulness of and comfort/anxiety with computer technologies
(Delcourt & Kinzie, 1993). Modifications to the ACT instrument made it more applicable to
digital video. This modification was only slight changes in the wording of several items. In
addition, references to existing teachers were changed to future teachers and references to
computer technologies were changed to computer applications. This Computer Attitude Scale
(CAS) assessed student attitudes toward computer applications which were described as
computer software, computer interface equipment, computer-video equipment, and computer
networks. Thus, computer applications included computer software and video equipment which
were used in the interactive digital video activities.
A total of 18 slightly modified item statements were used for the CAS instrument, 10
measuring perceived usefulness of computer applications (e.g. "Communicating with others over
a computer network can help me to be a more effective teacher.") and eight measuring
perceived Comfort/Anxiety of computer applications (e.g. "I feel comfortable about my ability
to work with computer applications."). Those items associated with perceived comfort/anxiety
levels were categorized as factor I items. The factor I items consisted of four positively phrased
statements and four negatively phrased statements.
Those items in the original ACT instrument that were positively phrased, general in
content, and associated with perceived usefulness of computer applications were
38
categorized as factor II items. The original ACT instrument contained five factor II items.
Those items in the original ACT instrument that were negatively phrased, general in content, and
associated with perceived usefulness of computer applications were categorized as factor III
items. The original ACT instrument contained six factor II items. One factor III item was
eliminated so that the number of factor III items would match the number of factor II items in the
CAS instrument.
Because the factor II and III scores measure perceived usefulness of computers, the
student scores for factor II and III were combined into one score for the CAS instrument by
averaging the two scores. The combined factor II and III score would be referred as factor IIc
scores for the CAS instrument.
The CAS instrument utilized a 5-point response format instead of a 4-point response
format that was used by the ACT instrument to give students more of choice in their responses.
Jones & Clark (1994) had used a computer attitude scale with items similar to the ACT that
had a 5-point response format. They had found their computer attitude scale to be reliable and
internally consistent.
The students were asked to rate their level of agreement or disagreement with the
statements found in CAS. A neutral descriptor was added to the CAS instrument to take into
account those students who neither disagree or agree with a particular item statement. The
students were advised that the scale was assessing their beliefs, feelings, and behaviors in
relation to computers and that there were no wrong or right answers.
Interactive Digital Video Activity Evaluation
After completing an activity, the students were asked to complete an activity evaluation
form. On the evaluation form, the students were asked to:
(1) rate the difficulty of using the computer applications to complete the activity.
(2) rate how well the group members worked together in completing the activity.
39
(3) rate the effectiveness of various instructional techniques used in the activity in helping
them learn the each activity's physics concepts (e.g., capturing the video of the
experiment, playing back the video, drawing visual space-time diagrams, discussion).
(4) write comments on any aspect of each activity they liked or disliked.
Each activity evaluation utilized a 5-point response format where students were asked to rate
the level of difficulty, cooperation, or effectiveness for each item.
Final Exam
The final exam, consisting of 75 multiple choice questions, contained 14 questions that
were used to assess the student's mastery of the concepts found in the interactive digital
activities. These questions assessed student understanding and application of the physics
concepts found in the activities which included: reference frames, motion, elastic and inelastic
collisions, conservation of momentum, free fall motion, and projectile motion. These fourteen
final exam questions consisted of :
(1) four questions associated with the concepts found in the first activity.
(2) two questions associated with concepts found in the second activity.
(3) three questions associated with concepts found in the third activity.
(4) four questions associated with concepts found in the fourth activity.
(5) one question associated with physics concepts found in the fifth activity.
3. 3 SCORING
Computer Attitude Scale
Student responses for the 18-item Likert statements were allocated numerical values
where strongly disagree was scored 1, disagree was scored 2, neutral was scored 3, agree was
scored 4, and strongly disagree was scored 5 for positively phrased items. For negatively
phrased items, the scoring was reversed where strongly agree was scored 1, agree was scored
2, neutral was scored 3, disagree was scored 4, and strongly disagree was scored 5. The
individual scores for each factor were summed to yield a total score. The student scores for
40
factor I (8 items) ranged from 8-40. The student scores for factor IIc (the average of both sets
of 5 items) ranged from 5-25.
The neutral score for factor I was 24 and the neutral score for factor IIc was 15. Any
individual score greater than the neutral score would indicate positive attitudes toward using
computers with high scores associated with feelings of comfort about the prospect of using
computer applications (factor I) and perceiving computer applications as being valuable for
performing a variety of tasks (factor IIc). Any score that is less than the neutral score would
indicate negative attitudes toward using computers with the lower scores associated with
feelings of anxiety about the prospect of using computer applications (factor I) and perceiving
computer applications as not being valuable for performing a variety of tasks (factor IIc).
Interactive Digital Video Activity Evaluation
For each activity, the students were asked to rate:
(1) the difficulty of using the computer applications (Ease-of-use) to complete the activity.
(2) how well the group members worked together (cooperation) in completing the activity.
(3) the effectiveness of the instructional techniques used in the activity in helping the
students learn the physics concepts (e.g., capturing the video of the experiment,
playing back the video, drawing visual space-time diagrams, discussion).
The difficulty of using the computer applications to complete the activity was scored
from 1 to 5 where 1 was difficult and 5 was easy. The cooperation of the group members
working together to complete the activity was scored from 1 to 5 where 1 was not very well
and 5 was very well. The effectiveness of the instructional techniques used in the activity was
scored from 1 to 5 where 1 was most effective and 5 was least effective in helping the students
learn the concepts.
Final Exam
Every correct response to each final exam multiple-choice question was worth 2 points,
while an incorrect response was worth 0 points. The students' range of scores could vary for:
(1) the four questions associated with the first activity from 0-8.
41
(2) the two questions associated with the second activity from 0-4.
(3) the three questions associated with the third activity from 0-6.
(4) the four questions associated with the fourth activity from 0-8.
(5) the one question associated with the fifth activity from 0-2.
(6) the 75 questions that made up the final exam from 0-150.
3 . 4 EXPERIMENTAL DESIGNS
A one group pre-test and post-test design was used when comparing initial student
computer attitude scale scores with final student computer attitude scale scores. T-tests for
related samples were calculated for student pre-test and post-test factor I scores and for
student pre-test and post-test factor IIc scores. An One-Way ANOVA (analysis of variance)
and a stepwise multiple regression were calculated for factor I and IIc scores across age and
computer experience levels.
A one group post-test design was used when comparing student ratings of difficulty and
of the activity across computer experience levels. One-way ANOVA's were calculated for
comparing student difficulty rating scores and for comparing student activity rating scores across
computer experience levels.
A non-equivalent control group design was used when comparing activity related final
exam scores of students who participated in the activities with those who did not.
ANCOVA's (analysis of covariance) were calculated for comparing scores on activity related
final exam questions using the final exam score as a covariate.
Microsoft Excel Version 4.0 was used to enter the data into spreadsheets, to
calculate frequency distributions, to calculate t-tests, and to make graphs. The Norusis SPSS-X
Statistical Package Release 3.0 was used to perform the more complex statistical tests (e.g.,
ANOVA, ANCOVA, and stepwise multiple regression) involved with this study.
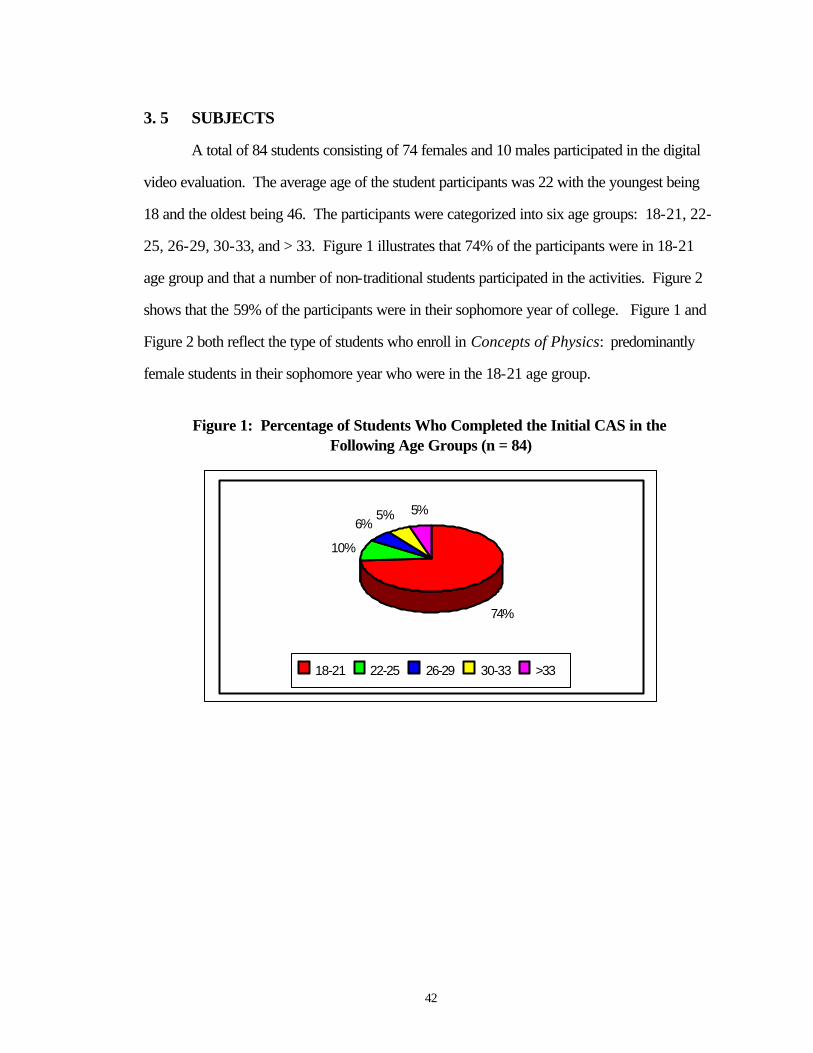
42
3. 5 SUBJECTS
A total of 84 students consisting of 74 females and 10 males participated in the digital
video evaluation. The average age of the student participants was 22 with the youngest being
18 and the oldest being 46. The participants were categorized into six age groups: 18-21, 22-
25, 26-29, 30-33, and > 33. Figure 1 illustrates that 74% of the participants were in 18-21
age group and that a number of non-traditional students participated in the activities. Figure 2
shows that the 59% of the participants were in their sophomore year of college. Figure 1 and
Figure 2 both reflect the type of students who enroll in Concepts of Physics: predominantly
female students in their sophomore year who were in the 18-21 age group.
Figure 1: Percentage of Students Who Completed the Initial CAS in the
Following Age Groups (n = 84)
74%
10%
6%5% 5%
18-21 22-25 26-29 30-33 >33
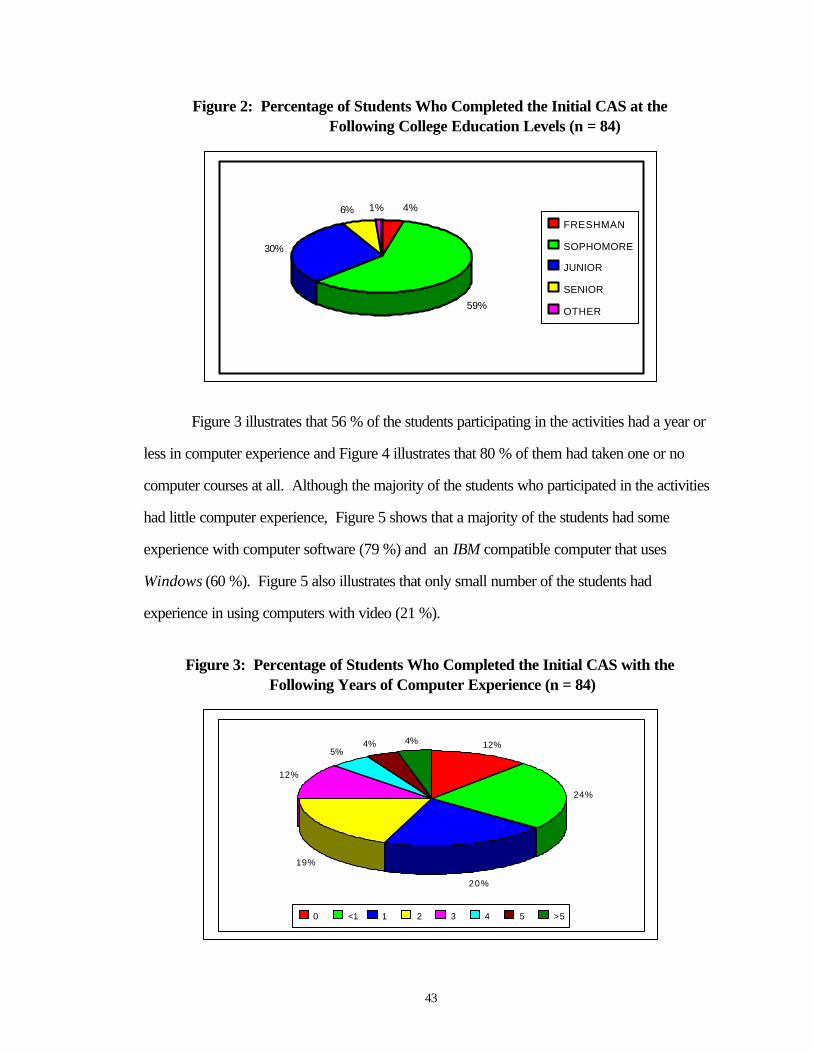
43
Figure 2: Percentage of Students Who Completed the Initial CAS at the Following College Education Levels (n = 84)
59%
30%
6% 1% 4%
FRESHMAN
SOPHOMORE
JUNIOR
SENIOR
OTHER
Figure 3 illustrates that 56 % of the students participating in the activities had a year or
less in computer experience and Figure 4 illustrates that 80 % of them had taken one or no
computer courses at all. Although the majority of the students who participated in the activities
had little computer experience, Figure 5 shows that a majority of the students had some
experience with computer software (79 %) and an IBM compatible computer that uses
Windows (60 %). Figure 5 also illustrates that only small number of the students had
experience in using computers with video (21 %).
Figure 3: Percentage of Students Who Completed the Initial CAS with the Following Years of Computer Experience (n = 84)
12%
24%
20%
19%
12%
5%4% 4%
0 <1 1 2 3 4 5 >5
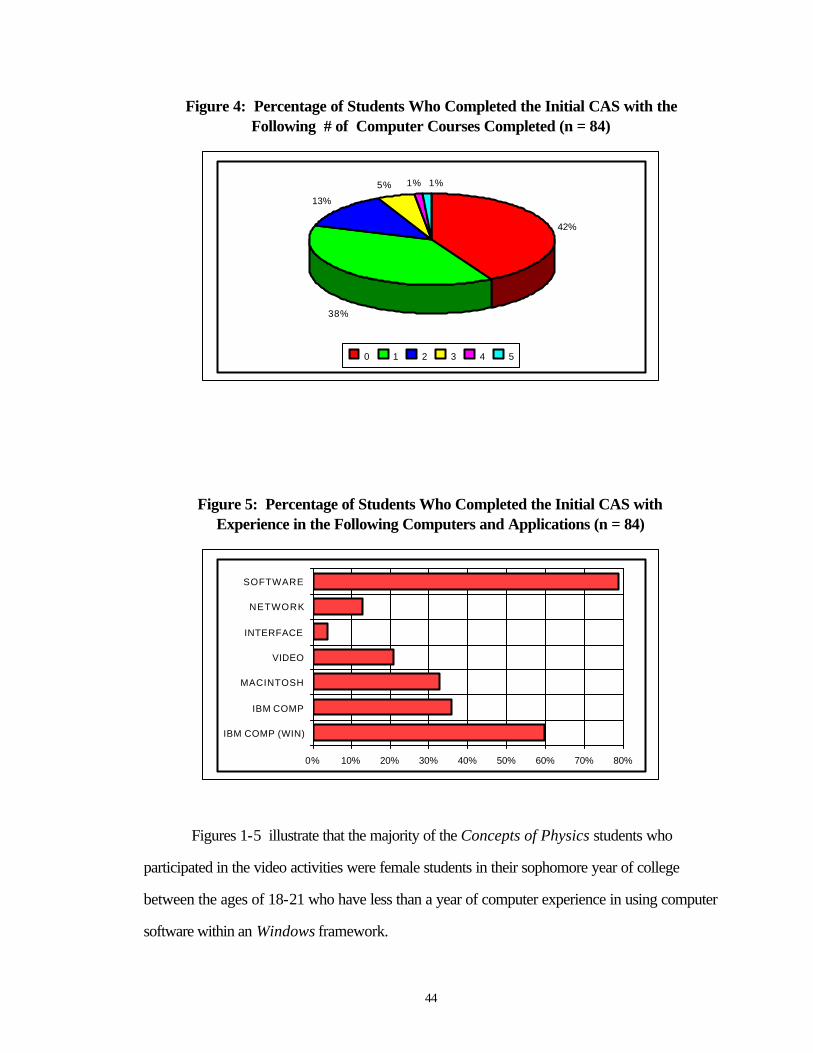
44
Figure 4: Percentage of Students Who Completed the Initial CAS with the Following # of Computer Courses Completed (n = 84)
42%
38%
13%
5% 1% 1%
0 1 2 3 4 5
Figure 5: Percentage of Students Who Completed the Initial CAS with Experience in the Following Computers and Applications (n = 84)
0% 10% 20% 30% 40% 50% 60% 70% 80%
IBM COMP (WIN)
IBM COMP
MACINTOSH
VIDEO
INTERFACE
NETWORK
SOFTWARE
Figures 1-5 illustrate that the majority of the Concepts of Physics students who
participated in the video activities were female students in their sophomore year of college
between the ages of 18-21 who have less than a year of computer experience in using computer
software within an Windows framework.
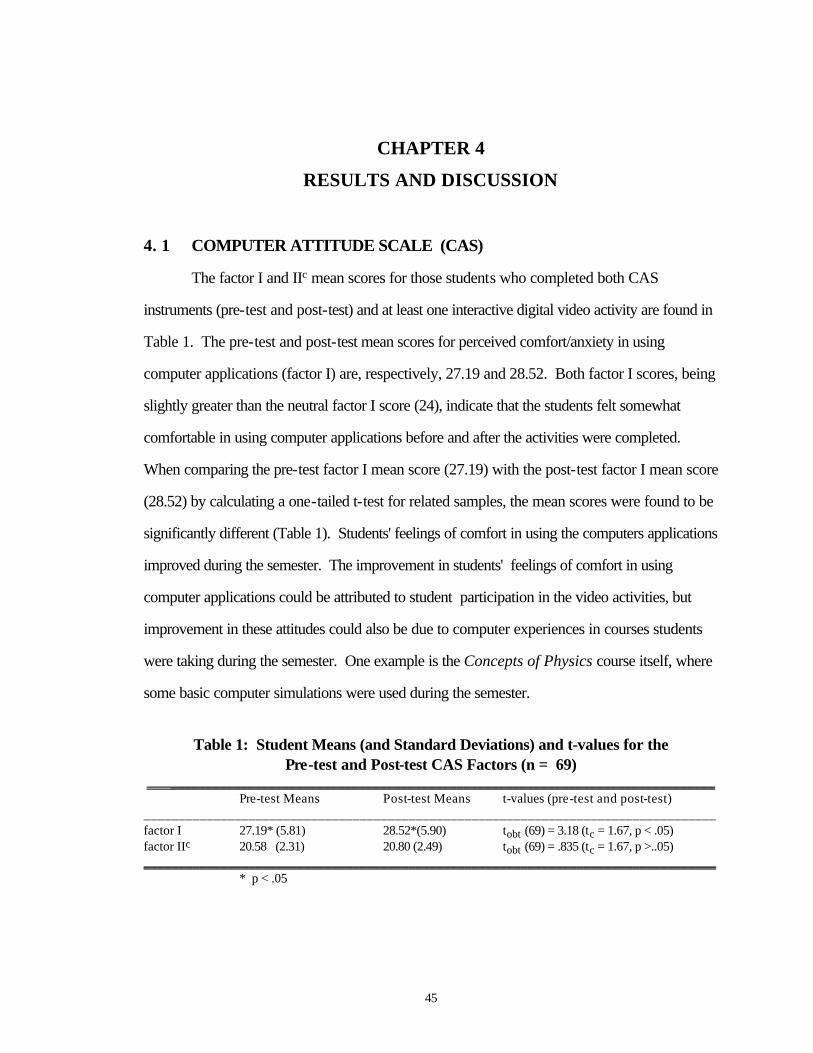
45
CHAPTER 4
RESULTS AND DISCUSSION
4. 1 COMPUTER ATTITUDE SCALE (CAS)
The factor I and IIc mean scores for those students who completed both CAS
instruments (pre-test and post-test) and at least one interactive digital video activity are found in
Table 1. The pre-test and post-test mean scores for perceived comfort/anxiety in using
computer applications (factor I) are, respectively, 27.19 and 28.52. Both factor I scores, being
slightly greater than the neutral factor I score (24), indicate that the students felt somewhat
comfortable in using computer applications before and after the activities were completed.
When comparing the pre-test factor I mean score (27.19) with the post-test factor I mean score
(28.52) by calculating a one-tailed t-test for related samples, the mean scores were found to be
significantly different (Table 1). Students' feelings of comfort in using the computers applications
improved during the semester. The improvement in students' feelings of comfort in using
computer applications could be attributed to student participation in the video activities, but
improvement in these attitudes could also be due to computer experiences in courses students
were taking during the semester. One example is the Concepts of Physics course itself, where
some basic computer simulations were used during the semester.
Table 1: Student Means (and Standard Deviations) and t-values for the
Pre-test and Post-test CAS Factors (n = 69) ______________________________________________________________________________ Pre-test Means Post-test Means t-values (pre-test and post-test) __________________________________________________________________________________ factor I 27.19* (5.81) 28.52*(5.90) tobt (69) = 3.18 (tc = 1.67, p < .05) factor IIc 20.58 (2.31) 20.80 (2.49) tobt (69) = .835 (tc = 1.67, p >..05) __________________________________________________________________________________ * p < .05
46
The results of experience and familiarity with computer applications producing positive
changes in students' attitudes of comfort in the use of computer applications (factor I scores)
agrees with prior research done on the subject. Previous studies (Loyd & Gressard, 19842;
Kulik, Kulik, & Bangert-Downs,1985; Billings & Cobb, 1992; and Dyck & Smither, 1994)
have shown that student attitudes toward computer-assisted instruction tend to become more
positive with familiarity and experience with computers.
Table 1 reveals that the pre-test and post-test mean scores for perceived general
usefulness of computer applications (factor IIc) are, respectively, 20.58 and 20.80. Both factor
IIc mean scores, being greater than the neutral factor IIc score (15), indicate that the students
perceived computer applications to be fairly useful before and after completing the video
activities. When comparing the pre-test factor IIc mean score with the post-test factor IIc mean
score by calculating a one-tailed t-test for related samples, the scores were not found to be
significantly different (Table 1). Students' perception of computer application usefulness did not
change as a result of participating in the video activities. This result is surprising because based
on the students' quality of experience in computer applications which is illustrated in Figure 4
(very little experience in video, interface, and network computer applications), one would
believe exposure to these types of computer applications would result in higher perceptions of
computer application usefulness. However this was not the case, students' perception of
computer application usefulness remained the same.
The results of controlling student pre-test CAS factor I mean scores for computer
experience and age are found in Table 2. Computer experience was categorized into three
levels: 0-1, 2-3, and >3. These levels were determined by adding the student's number of
years of computer experience to the number of computer courses they completed. Age was
classified into 5 levels: 18-21, 22-25, 26-29, 30-33, and >33. The range of student pre-test
factor I scores varied from 10 which is associated with the
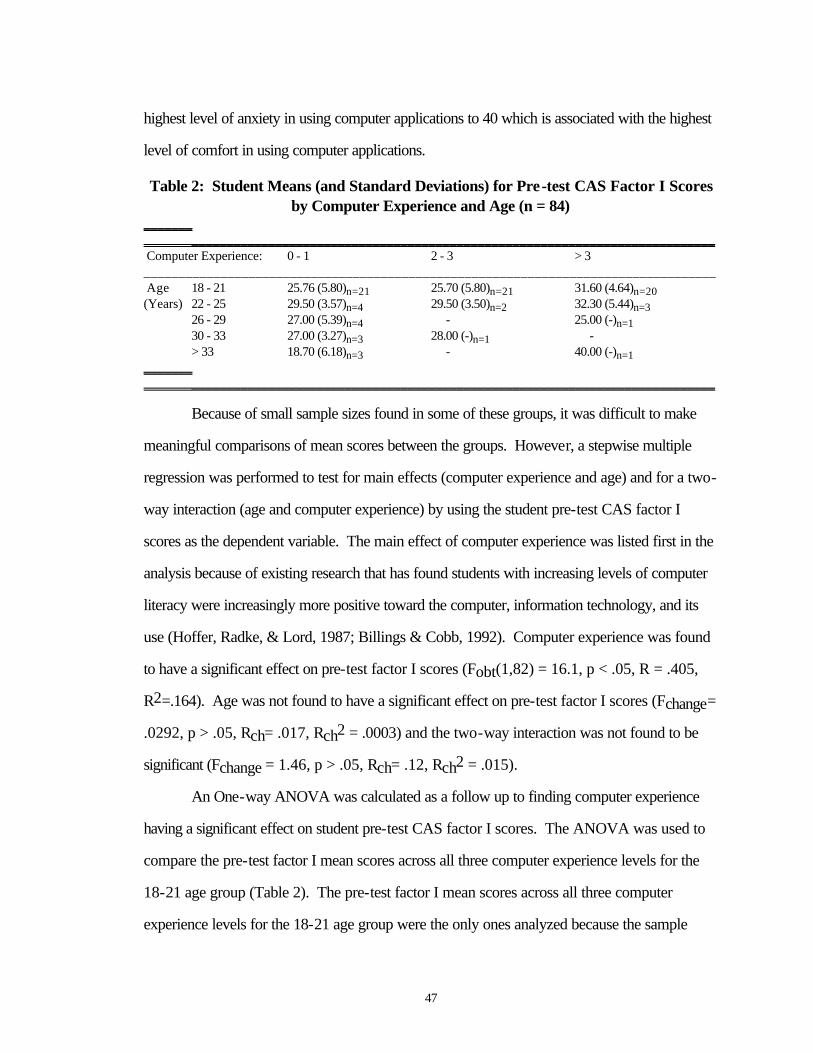
47
highest level of anxiety in using computer applications to 40 which is associated with the highest
level of comfort in using computer applications.
Table 2: Student Means (and Standard Deviations) for Pre-test CAS Factor I Scores by Computer Experience and Age (n = 84)
_______ ___________________________________________________________________________ Computer Experience: 0 - 1 2 - 3 > 3 __________________________________________________________________________________ Age 18 - 21 25.76 (5.80)n=21 25.70 (5.80)n=21 31.60 (4.64)n=20 (Years) 22 - 25 29.50 (3.57)n=4 29.50 (3.50)n=2 32.30 (5.44)n=3 26 - 29 27.00 (5.39)n=4 - 25.00 (-)n=1 30 - 33 27.00 (3.27)n=3 28.00 (-)n=1 - > 33 18.70 (6.18)n=3 - 40.00 (-)n=1 _______ ___________________________________________________________________________
Because of small sample sizes found in some of these groups, it was difficult to make
meaningful comparisons of mean scores between the groups. However, a stepwise multiple
regression was performed to test for main effects (computer experience and age) and for a two-
way interaction (age and computer experience) by using the student pre-test CAS factor I
scores as the dependent variable. The main effect of computer experience was listed first in the
analysis because of existing research that has found students with increasing levels of computer
literacy were increasingly more positive toward the computer, information technology, and its
use (Hoffer, Radke, & Lord, 1987; Billings & Cobb, 1992). Computer experience was found
to have a significant effect on pre-test factor I scores (Fobt(1,82) = 16.1, p < .05, R = .405,
R2=.164). Age was not found to have a significant effect on pre-test factor I scores (Fchange=
.0292, p > .05, Rch= .017, Rch2 = .0003) and the two-way interaction was not found to be
significant (Fchange = 1.46, p > .05, Rch= .12, Rch2 = .015).
An One-way ANOVA was calculated as a follow up to finding computer experience
having a significant effect on student pre-test CAS factor I scores. The ANOVA was used to
compare the pre-test factor I mean scores across all three computer experience levels for the
18-21 age group (Table 2). The pre-test factor I mean scores across all three computer
experience levels for the 18-21 age group were the only ones analyzed because the sample
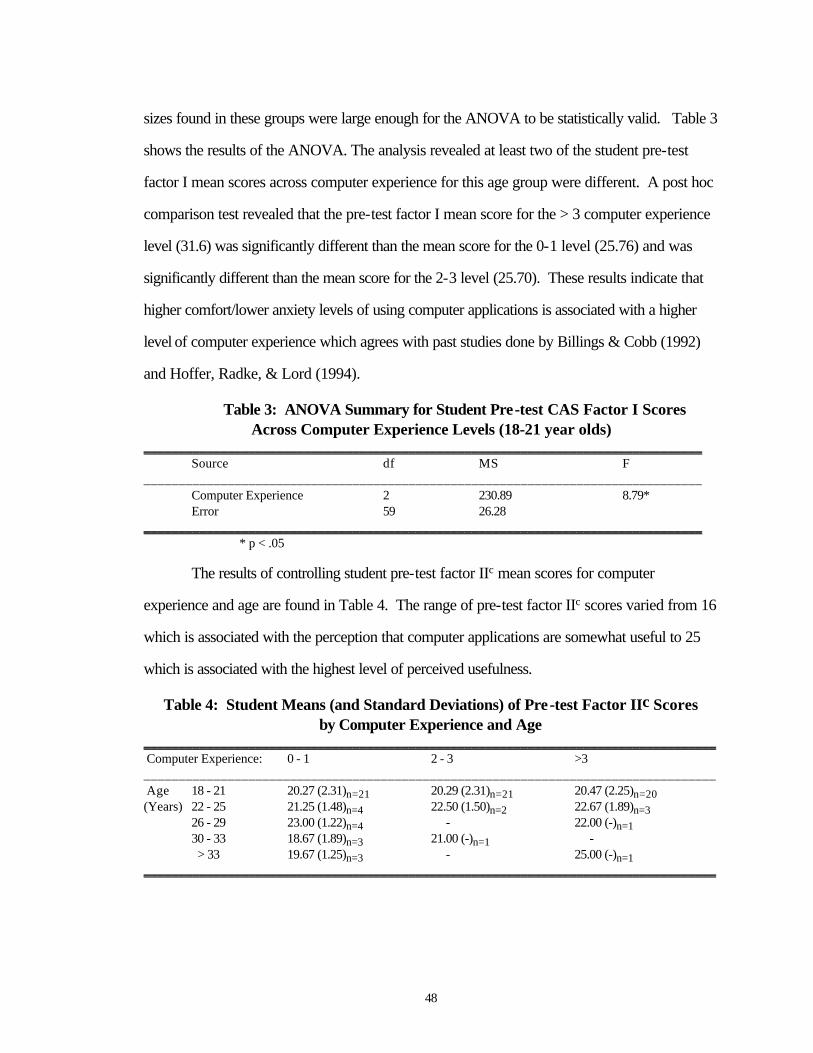
48
sizes found in these groups were large enough for the ANOVA to be statistically valid. Table 3
shows the results of the ANOVA. The analysis revealed at least two of the student pre-test
factor I mean scores across computer experience for this age group were different. A post hoc
comparison test revealed that the pre-test factor I mean score for the > 3 computer experience
level (31.6) was significantly different than the mean score for the 0-1 level (25.76) and was
significantly different than the mean score for the 2-3 level (25.70). These results indicate that
higher comfort/lower anxiety levels of using computer applications is associated with a higher
level of computer experience which agrees with past studies done by Billings & Cobb (1992)
and Hoffer, Radke, & Lord (1994).
Table 3: ANOVA Summary for Student Pre-test CAS Factor I Scores Across Computer Experience Levels (18-21 year olds)
________________________________________________________________________________ Source df MS F ________________________________________________________________________________ Computer Experience 2 230.89 8.79* Error 59 26.28 ________________________________________________________________________________ * p < .05
The results of controlling student pre-test factor IIc mean scores for computer
experience and age are found in Table 4. The range of pre-test factor IIc scores varied from 16
which is associated with the perception that computer applications are somewhat useful to 25
which is associated with the highest level of perceived usefulness.
Table 4: Student Means (and Standard Deviations) of Pre-test Factor IIc Scores by Computer Experience and Age
__________________________________________________________________________________ Computer Experience: 0 - 1 2 - 3 >3 __________________________________________________________________________________ Age 18 - 21 20.27 (2.31)n=21 20.29 (2.31)n=21 20.47 (2.25)n=20 (Years) 22 - 25 21.25 (1.48)n=4 22.50 (1.50)n=2 22.67 (1.89)n=3 26 - 29 23.00 (1.22)n=4 - 22.00 (-)n=1 30 - 33 18.67 (1.89)n=3 21.00 (-)n=1 - > 33 19.67 (1.25)n=3 - 25.00 (-)n=1 __________________________________________________________________________________
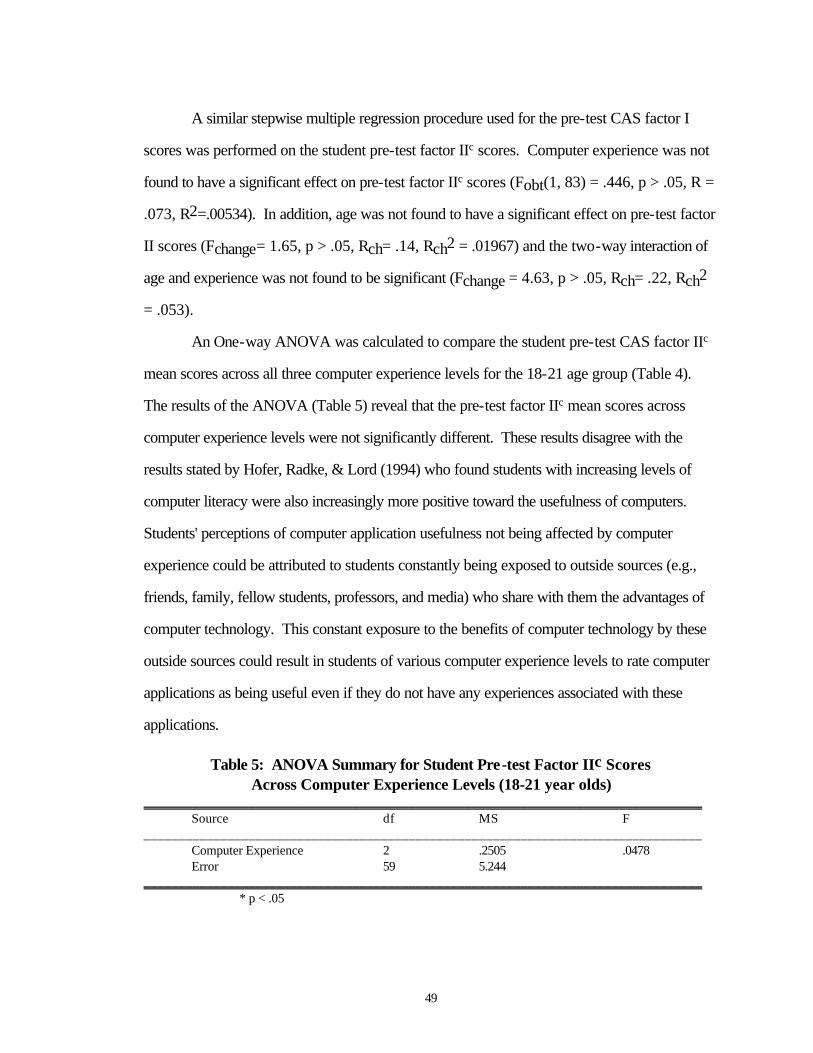
49
A similar stepwise multiple regression procedure used for the pre-test CAS factor I
scores was performed on the student pre-test factor IIc scores. Computer experience was not
found to have a significant effect on pre-test factor IIc scores (Fobt(1, 83) = .446, p > .05, R =
.073, R2=.00534). In addition, age was not found to have a significant effect on pre-test factor
II scores (Fchange= 1.65, p > .05, Rch= .14, Rch2 = .01967) and the two-way interaction of
age and experience was not found to be significant (Fchange = 4.63, p > .05, Rch= .22, Rch2
= .053).
An One-way ANOVA was calculated to compare the student pre-test CAS factor IIc
mean scores across all three computer experience levels for the 18-21 age group (Table 4).
The results of the ANOVA (Table 5) reveal that the pre-test factor IIc mean scores across
computer experience levels were not significantly different. These results disagree with the
results stated by Hofer, Radke, & Lord (1994) who found students with increasing levels of
computer literacy were also increasingly more positive toward the usefulness of computers.
Students' perceptions of computer application usefulness not being affected by computer
experience could be attributed to students constantly being exposed to outside sources (e.g.,
friends, family, fellow students, professors, and media) who share with them the advantages of
computer technology. This constant exposure to the benefits of computer technology by these
outside sources could result in students of various computer experience levels to rate computer
applications as being useful even if they do not have any experiences associated with these
applications.
Table 5: ANOVA Summary for Student Pre-test Factor IIc Scores Across Computer Experience Levels (18-21 year olds)
________________________________________________________________________________ Source df MS F ________________________________________________________________________________ Computer Experience 2 .2505 .0478 Error 59 5.244 ________________________________________________________________________________ * p < .05
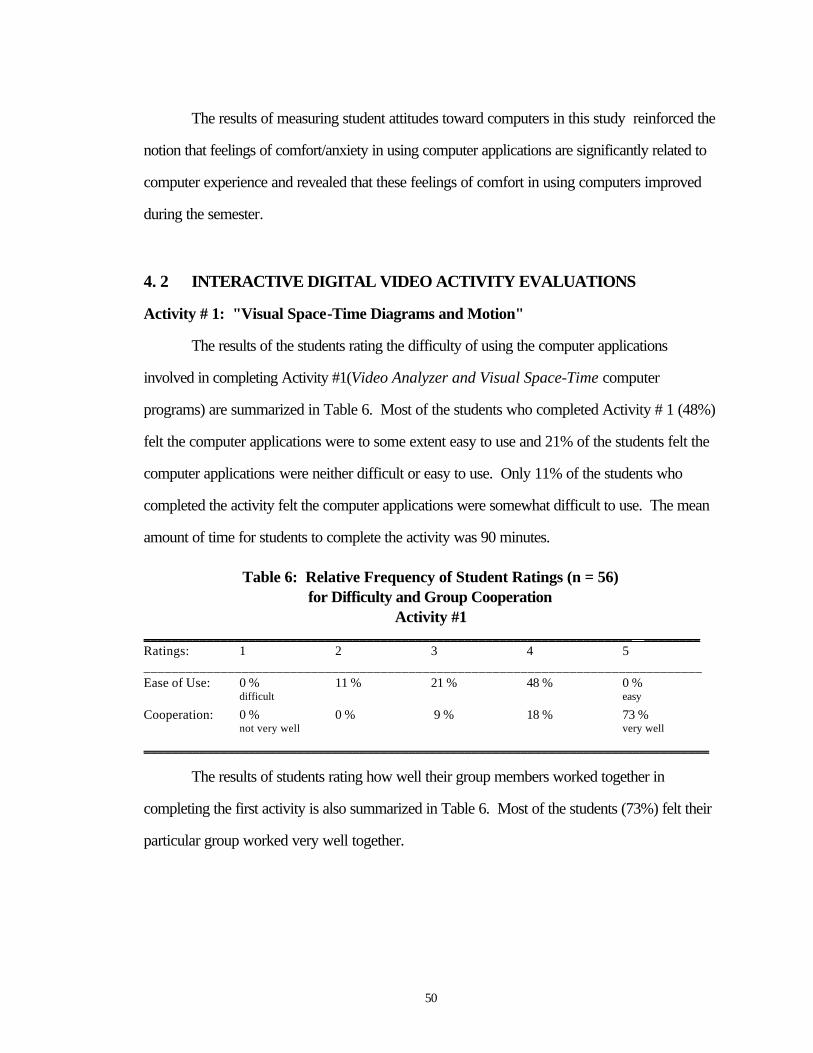
50
The results of measuring student attitudes toward computers in this study reinforced the
notion that feelings of comfort/anxiety in using computer applications are significantly related to
computer experience and revealed that these feelings of comfort in using computers improved
during the semester. 4. 2 INTERACTIVE DIGITAL VIDEO ACTIVITY EVALUATIONS
Activity # 1: "Visual Space-Time Diagrams and Motion"
The results of the students rating the difficulty of using the computer applications
involved in completing Activity #1(Video Analyzer and Visual Space-Time computer
programs) are summarized in Table 6. Most of the students who completed Activity # 1 (48%)
felt the computer applications were to some extent easy to use and 21% of the students felt the
computer applications were neither difficult or easy to use. Only 11% of the students who
completed the activity felt the computer applications were somewhat difficult to use. The mean
amount of time for students to complete the activity was 90 minutes.
Table 6: Relative Frequency of Student Ratings (n = 56) for Difficulty and Group Cooperation
Activity #1 ______________________________________________________________________ ________ Ratings: 1 2 3 4 5 ________________________________________________________________________________ Ease of Use: 0 % 11 % 21 % 48 % 0 % difficult easy Cooperation: 0 % 0 % 9 % 18 % 73 % not very well very well _________________________________________________________________________________
The results of students rating how well their group members worked together in
completing the first activity is also summarized in Table 6. Most of the students (73%) felt their
particular group worked very well together.
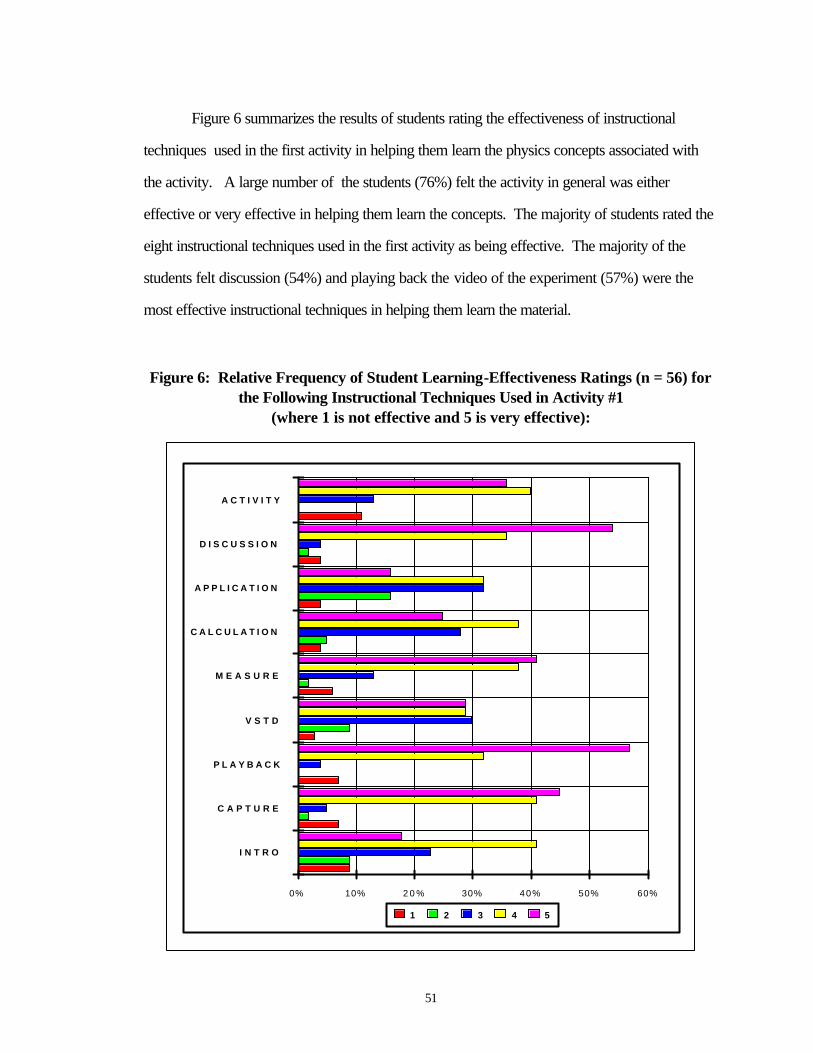
51
Figure 6 summarizes the results of students rating the effectiveness of instructional
techniques used in the first activity in helping them learn the physics concepts associated with
the activity. A large number of the students (76%) felt the activity in general was either
effective or very effective in helping them learn the concepts. The majority of students rated the
eight instructional techniques used in the first activity as being effective. The majority of the
students felt discussion (54%) and playing back the video of the experiment (57%) were the
most effective instructional techniques in helping them learn the material.
Figure 6: Relative Frequency of Student Learning-Effectiveness Ratings (n = 56) for the Following Instructional Techniques Used in Activity #1
(where 1 is not effective and 5 is very effective):
0% 10% 2 0 % 30% 40% 50% 60%
I N T R O
C A P T U R E
P L A Y B A C K
V S T D
M E A S U R E
C A L C U L A T I O N
A P P L I C A T I O N
D I S C U S S I O N
A C T I V I T Y
1 2 3 4 5
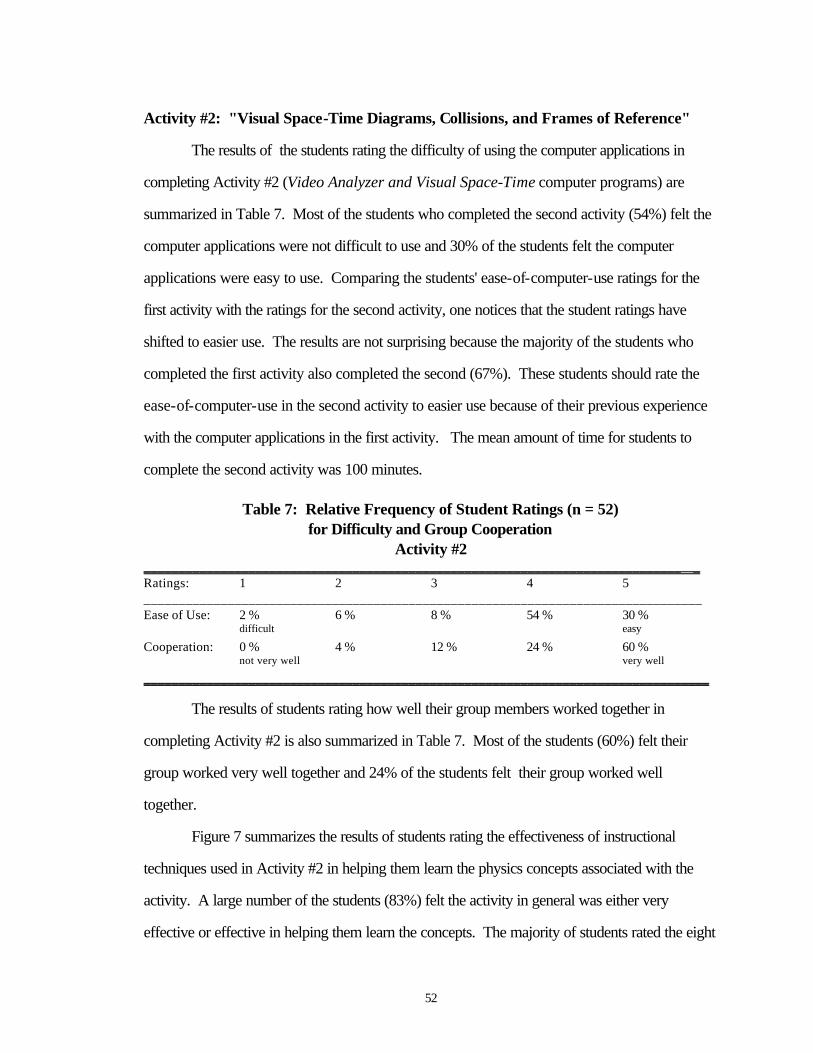
52
Activity #2: "Visual Space-Time Diagrams, Collisions, and Frames of Reference"
The results of the students rating the difficulty of using the computer applications in
completing Activity #2 (Video Analyzer and Visual Space-Time computer programs) are
summarized in Table 7. Most of the students who completed the second activity (54%) felt the
computer applications were not difficult to use and 30% of the students felt the computer
applications were easy to use. Comparing the students' ease-of-computer-use ratings for the
first activity with the ratings for the second activity, one notices that the student ratings have
shifted to easier use. The results are not surprising because the majority of the students who
completed the first activity also completed the second (67%). These students should rate the
ease-of-computer-use in the second activity to easier use because of their previous experience
with the computer applications in the first activity. The mean amount of time for students to
complete the second activity was 100 minutes.
Table 7: Relative Frequency of Student Ratings (n = 52) for Difficulty and Group Cooperation
Activity #2 _____________________________________________________________________________ _ Ratings: 1 2 3 4 5 ________________________________________________________________________________ Ease of Use: 2 % 6 % 8 % 54 % 30 % difficult easy Cooperation: 0 % 4 % 12 % 24 % 60 % not very well very well _________________________________________________________________________________
The results of students rating how well their group members worked together in
completing Activity #2 is also summarized in Table 7. Most of the students (60%) felt their
group worked very well together and 24% of the students felt their group worked well
together.
Figure 7 summarizes the results of students rating the effectiveness of instructional
techniques used in Activity #2 in helping them learn the physics concepts associated with the
activity. A large number of the students (83%) felt the activity in general was either very
effective or effective in helping them learn the concepts. The majority of students rated the eight
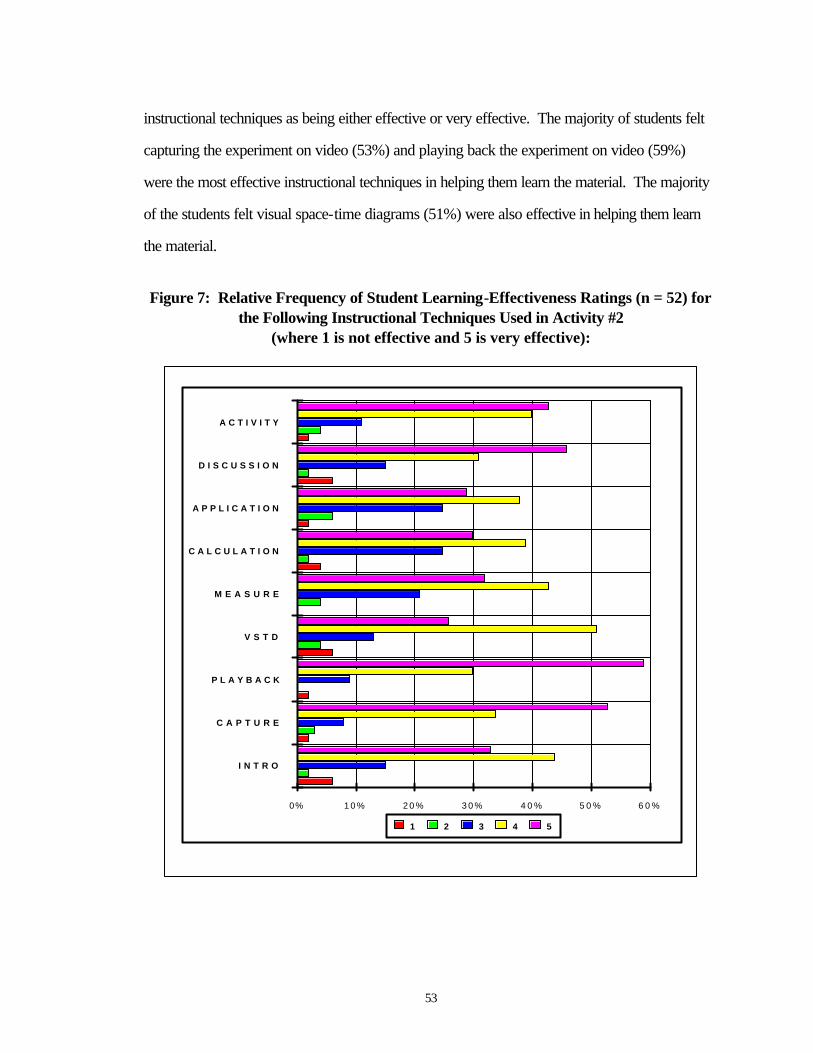
53
instructional techniques as being either effective or very effective. The majority of students felt
capturing the experiment on video (53%) and playing back the experiment on video (59%)
were the most effective instructional techniques in helping them learn the material. The majority
of the students felt visual space-time diagrams (51%) were also effective in helping them learn
the material.
Figure 7: Relative Frequency of Student Learning-Effectiveness Ratings (n = 52) for
the Following Instructional Techniques Used in Activity #2 (where 1 is not effective and 5 is very effective):
0% 1 0 % 2 0 % 3 0 % 4 0 % 5 0 % 6 0 %
I N T R O
C A P T U R E
P L A Y B A C K
V S T D
M E A S U R E
C A L C U L A T I O N
A P P L I C A T I O N
D I S C U S S I O N
A C T I V I T Y
1 2 3 4 5
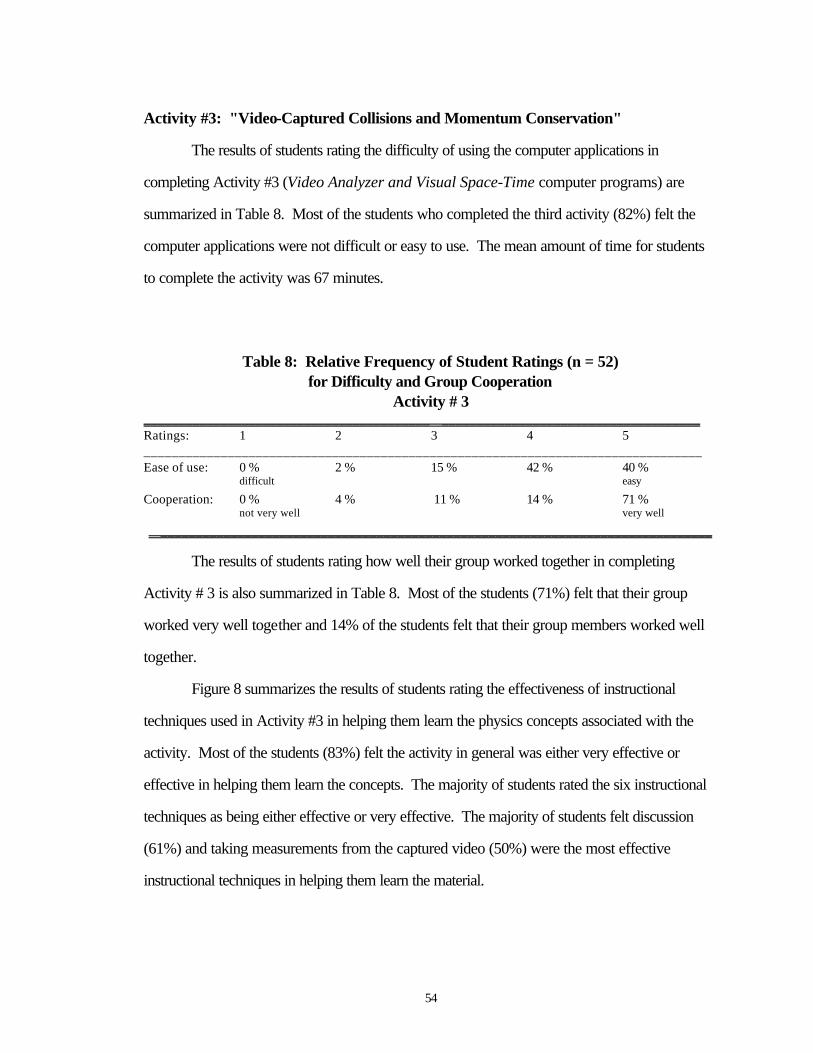
54
Activity #3: "Video-Captured Collisions and Momentum Conservation"
The results of students rating the difficulty of using the computer applications in
completing Activity #3 (Video Analyzer and Visual Space-Time computer programs) are
summarized in Table 8. Most of the students who completed the third activity (82%) felt the
computer applications were not difficult or easy to use. The mean amount of time for students
to complete the activity was 67 minutes.
Table 8: Relative Frequency of Student Ratings (n = 52) for Difficulty and Group Cooperation
Activity # 3 _________________________________________ _____________________________________ Ratings: 1 2 3 4 5 ________________________________________________________________________________ Ease of use: 0 % 2 % 15 % 42 % 40 % difficult easy Cooperation: 0 % 4 % 11 % 14 % 71 % not very well very well _______________________________________________________________________________
The results of students rating how well their group worked together in completing
Activity # 3 is also summarized in Table 8. Most of the students (71%) felt that their group
worked very well together and 14% of the students felt that their group members worked well
together.
Figure 8 summarizes the results of students rating the effectiveness of instructional
techniques used in Activity #3 in helping them learn the physics concepts associated with the
activity. Most of the students (83%) felt the activity in general was either very effective or
effective in helping them learn the concepts. The majority of students rated the six instructional
techniques as being either effective or very effective. The majority of students felt discussion
(61%) and taking measurements from the captured video (50%) were the most effective
instructional techniques in helping them learn the material.
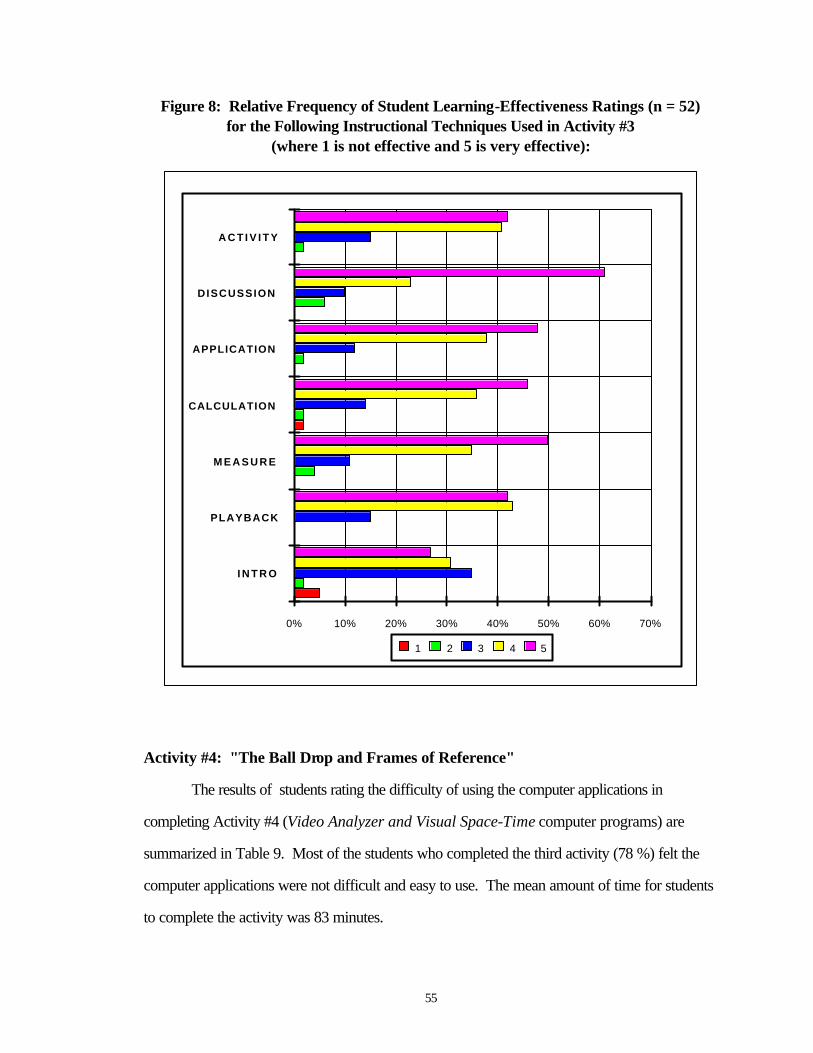
55
Figure 8: Relative Frequency of Student Learning-Effectiveness Ratings (n = 52) for the Following Instructional Techniques Used in Activity #3
(where 1 is not effective and 5 is very effective):
0% 10% 20% 30% 40% 50% 60% 70%
I N T R O
PLAYBACK
M E A S U R E
CALCULATION
APPLICATION
DISCUSSION
A C T I V I T Y
1 2 3 4 5
Activity #4: "The Ball Drop and Frames of Reference"
The results of students rating the difficulty of using the computer applications in
completing Activity #4 (Video Analyzer and Visual Space-Time computer programs) are
summarized in Table 9. Most of the students who completed the third activity (78 %) felt the
computer applications were not difficult and easy to use. The mean amount of time for students
to complete the activity was 83 minutes.
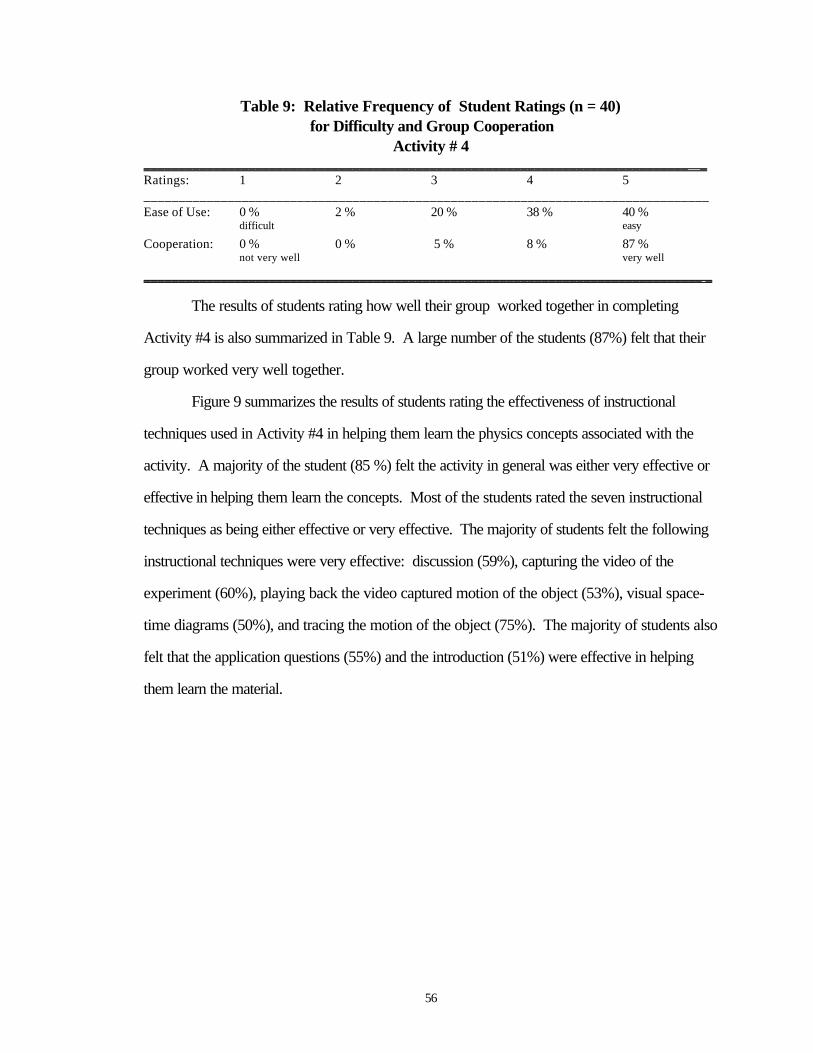
56
Table 9: Relative Frequency of Student Ratings (n = 40) for Difficulty and Group Cooperation
Activity # 4 ______________________________________________________________________________ _ Ratings: 1 2 3 4 5 _________________________________________________________________________________ Ease of Use: 0 % 2 % 20 % 38 % 40 % difficult easy
Cooperation: 0 % 0 % 5 % 8 % 87 % not very well very well ________________________________________________________________________________ _
The results of students rating how well their group worked together in completing
Activity #4 is also summarized in Table 9. A large number of the students (87%) felt that their
group worked very well together.
Figure 9 summarizes the results of students rating the effectiveness of instructional
techniques used in Activity #4 in helping them learn the physics concepts associated with the
activity. A majority of the student (85 %) felt the activity in general was either very effective or
effective in helping them learn the concepts. Most of the students rated the seven instructional
techniques as being either effective or very effective. The majority of students felt the following
instructional techniques were very effective: discussion (59%), capturing the video of the
experiment (60%), playing back the video captured motion of the object (53%), visual space-
time diagrams (50%), and tracing the motion of the object (75%). The majority of students also
felt that the application questions (55%) and the introduction (51%) were effective in helping
them learn the material.
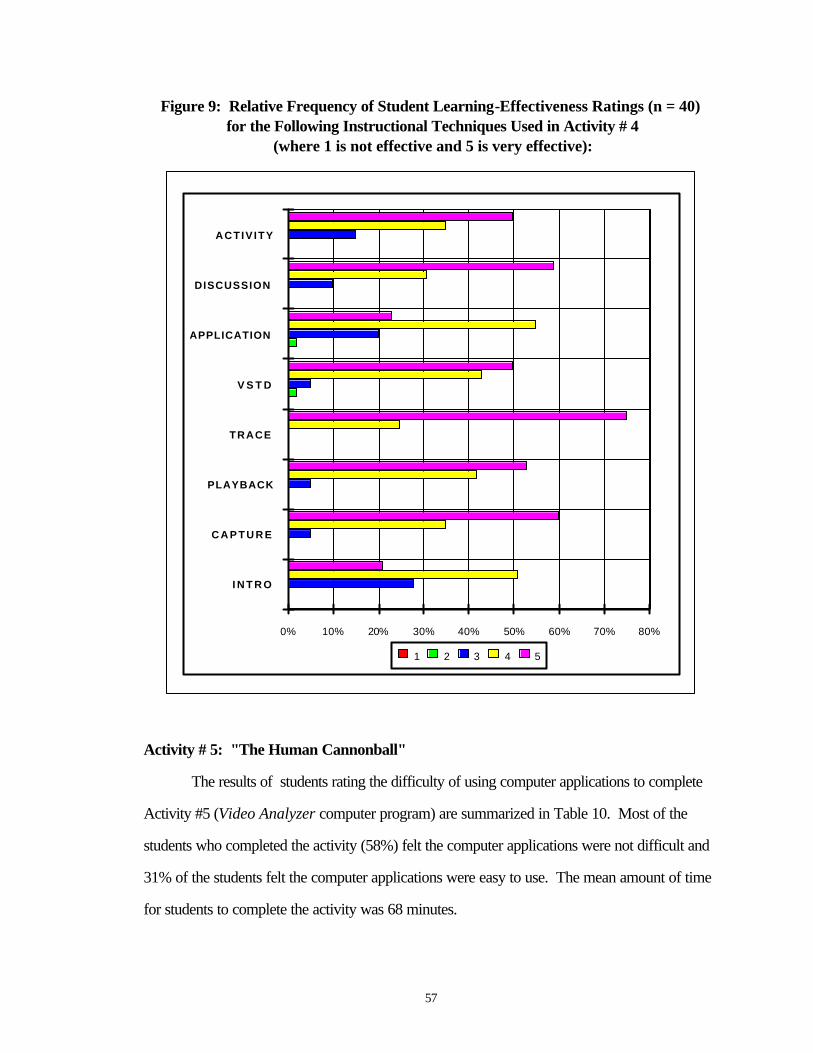
57
Figure 9: Relative Frequency of Student Learning-Effectiveness Ratings (n = 40) for the Following Instructional Techniques Used in Activity # 4
(where 1 is not effective and 5 is very effective):
0% 10% 20% 30% 40% 50% 60% 70% 80%
I N T R O
C A P T U R E
PLAYBACK
TRACE
V S T D
APPLICATION
DISCUSSION
ACTIV ITY
1 2 3 4 5
Activity # 5: "The Human Cannonball"
The results of students rating the difficulty of using computer applications to complete
Activity #5 (Video Analyzer computer program) are summarized in Table 10. Most of the
students who completed the activity (58%) felt the computer applications were not difficult and
31% of the students felt the computer applications were easy to use. The mean amount of time
for students to complete the activity was 68 minutes.
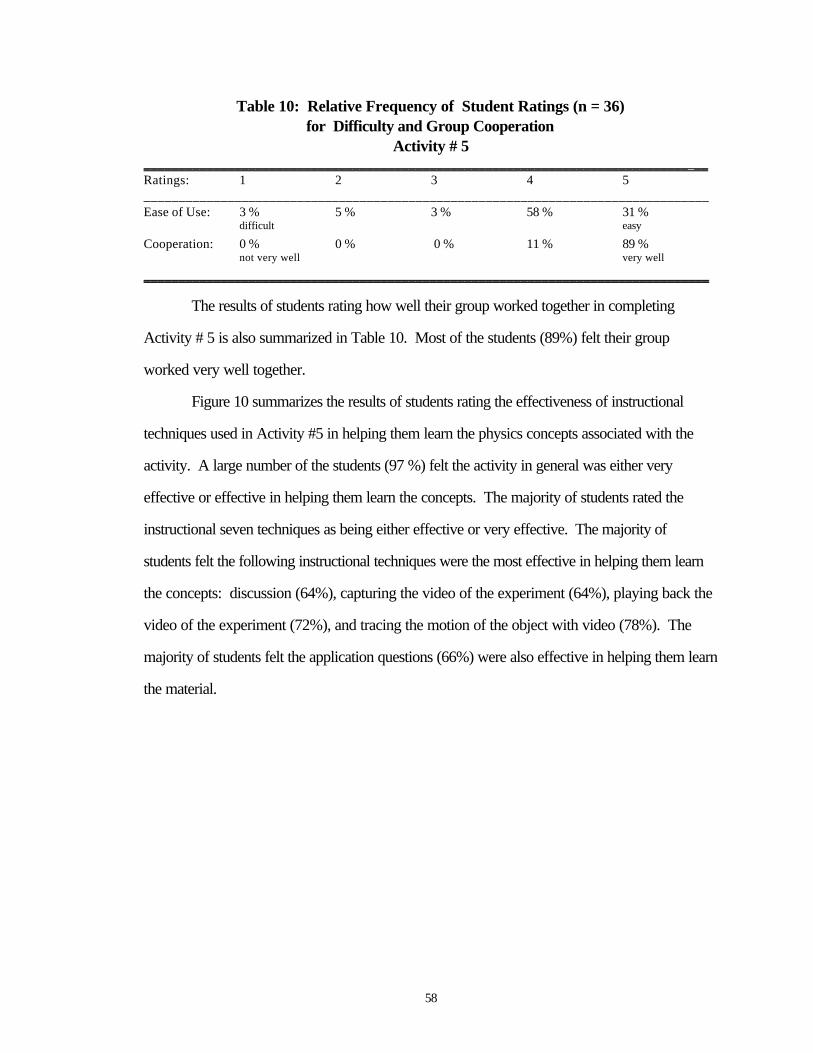
58
Table 10: Relative Frequency of Student Ratings (n = 36) for Difficulty and Group Cooperation
Activity # 5 ______________________________________________________________________________ __ Ratings: 1 2 3 4 5 _________________________________________________________________________________ Ease of Use: 3 % 5 % 3 % 58 % 31 % difficult easy Cooperation: 0 % 0 % 0 % 11 % 89 % not very well very well _________________________________________________________________________________
The results of students rating how well their group worked together in completing
Activity # 5 is also summarized in Table 10. Most of the students (89%) felt their group
worked very well together.
Figure 10 summarizes the results of students rating the effectiveness of instructional
techniques used in Activity #5 in helping them learn the physics concepts associated with the
activity. A large number of the students (97 %) felt the activity in general was either very
effective or effective in helping them learn the concepts. The majority of students rated the
instructional seven techniques as being either effective or very effective. The majority of
students felt the following instructional techniques were the most effective in helping them learn
the concepts: discussion (64%), capturing the video of the experiment (64%), playing back the
video of the experiment (72%), and tracing the motion of the object with video (78%). The
majority of students felt the application questions (66%) were also effective in helping them learn
the material.
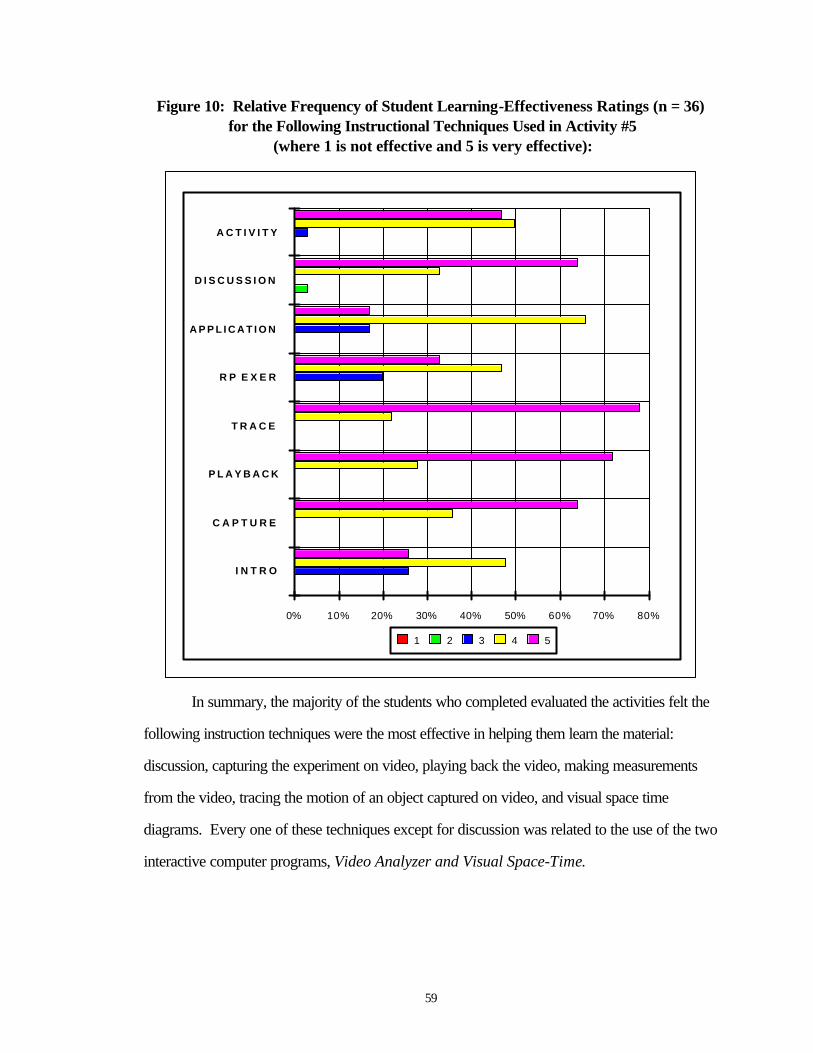
59
Figure 10: Relative Frequency of Student Learning-Effectiveness Ratings (n = 36) for the Following Instructional Techniques Used in Activity #5
(where 1 is not effective and 5 is very effective):
0% 10% 20% 30% 40% 50% 60% 70% 80%
I N T R O
C A P T U R E
P L A Y B A C K
T R A C E
R P E X E R
A P P L I C A T I O N
D I S C U S S I O N
A C T I V I T Y
1 2 3 4 5
In summary, the majority of the students who completed evaluated the activities felt the
following instruction techniques were the most effective in helping them learn the material:
discussion, capturing the experiment on video, playing back the video, making measurements
from the video, tracing the motion of an object captured on video, and visual space time
diagrams. Every one of these techniques except for discussion was related to the use of the two
interactive computer programs, Video Analyzer and Visual Space-Time.
60
The students who evaluated the interactive digital video materials gave the activities very
high marks for their general effectiveness in helping them learn the physics concepts and very
high marks in the ease of using the computer applications (Video Analyzer and Visual Space-
Time computer programs). Some of the positive comments the students made about the video
materials were: "The computer programs were very easy to use and very effective in helping me
understand the concepts." "Being able to trace the motion of the objects helped me understand
the concepts associated with the activities." "The activities and how to use the materials were
self-explanatory. "The visual computer images of the object helped me understand the concepts
of motion and reference frames better." "The activities were very challenging and I improved
with experience in using the computer applications." "The concepts covered in the activities
went beyond what was covered in class." Some students felt the materials provided them with
better concrete images for them to identify with the concepts. They believed the activities
helped them focus on the topic at hand and to learn the material. One student's comment, "I
could apply what I did each time to everyday life.", provides evidence that digital video can
illustrate the connection between physics and events outside the classroom which can help
students perceive the relevance of physics to their lives (Zollman & Fuller, 1994).
Negative comments made by the students about the video materials indicate that some
of the students felt the activities were too time consuming and repetitive. The average amount of
time for the students to complete one activity was about 90 minutes. Students who are used to
an hourly schedule of classes and not accustomed to activities that require the time to explore
and investigate physics concepts effectively might feel the activities were too time consuming.
Laws, reported from her findings of using Workshop Physics that a small percentage of
students dislike the active approach of learning physics and complain that this approach takes
too much time (Laws, 1991).
Some students felt that the activities provided too much background information. In
each activity, specific directions on how to use the computer applications and enough
information about the concepts were given to account for those students who had not
61
completed previous activities and who had forgotten the physics concepts. It would be
understandable why some students would feel the materials were repetitive especially after
completing three activities by the end of the semester.
Some students felt the activities were interesting, but felt they could have received as
much practice from the traditional approach of reading and working problems. Even after
completing a number of activities, some students felt confused and frustrated with using the
computer programs. Some students felt rushed by their group members and as a result didn't
fully understand what was going on. However, the student ratings of the difficulty in using the
computer applications and of group cooperation for each activity (Tables 6 -10) reveal that
these students represent a small fraction of the total number of students who completed each
activity.
After looking at these comments made by the students concerning the video materials,
one wonders whether these comments being positive or negative depends on the students'
background in using computers. Are the students' ratings of an activity's effectiveness and/or
difficulty influenced by the students' computer experience? To address that question, student
mean activity ratings were controlled for computer experience. Student mean activity ratings
across computer experience levels are summarized on Table 11. The mean activity's
effectiveness ratings ranged from 3.76 for Activity #1 (0-1 level of computer experience) to
4.64 for Activity #5 (>3 level of computer experience). Those students who completed the first
activity gave the activity the lowest effectiveness rating (3.91) while those students who
completed the fifth activity gave the activity the highest effectiveness rating (4.44). In general,
the students rated each activity as being effective in helping them learn material.
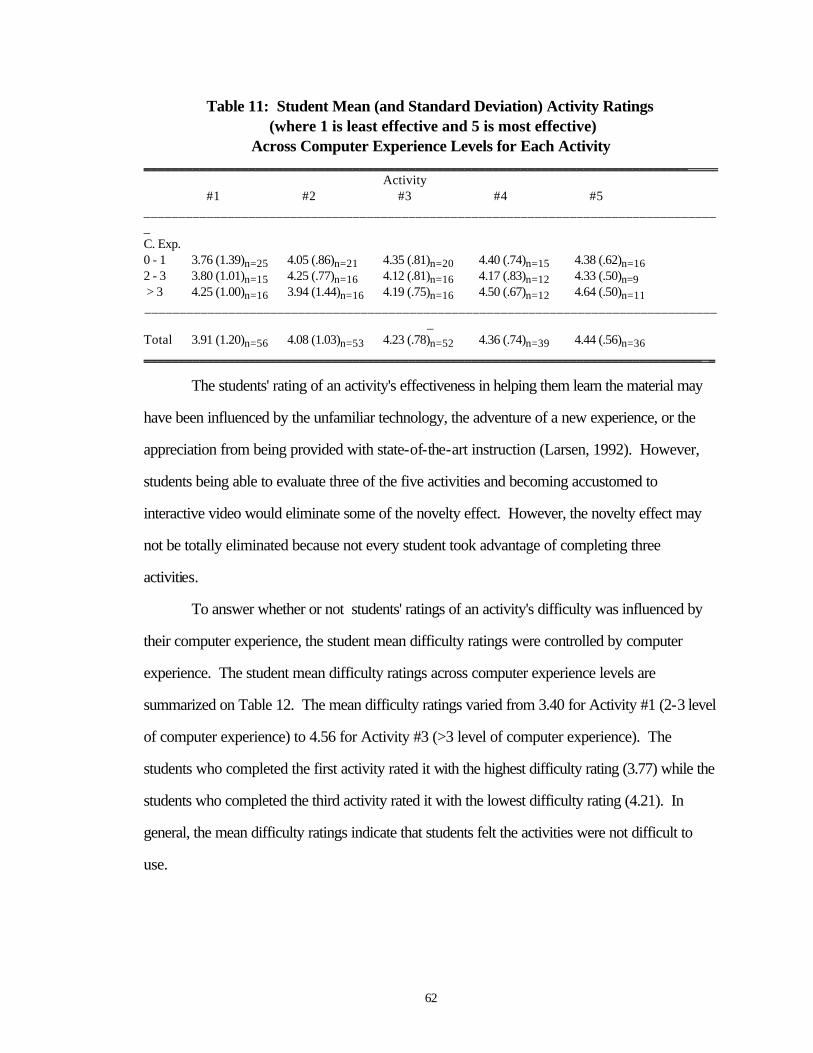
62
Table 11: Student Mean (and Standard Deviation) Activity Ratings (where 1 is least effective and 5 is most effective)
Across Computer Experience Levels for Each Activity ______________________________________________________________________________ Activity #1 #2 #3 #4 #5 ___________________________________________________________________________________ C. Exp. 0 - 1 3.76 (1.39)n=25 4.05 (.86)n=21 4.35 (.81)n=20 4.40 (.74)n=15 4.38 (.62)n=16 2 - 3 3.80 (1.01)n=15 4.25 (.77)n=16 4.12 (.81)n=16 4.17 (.83)n=12 4.33 (.50)n=9 > 3 4.25 (1.00)n=16 3.94 (1.44)n=16 4.19 (.75)n=16 4.50 (.67)n=12 4.64 (.50)n=11 __________________________________________________________________________________
_ Total 3.91 (1.20)n=56 4.08 (1.03)n=53 4.23 (.78)n=52 4.36 (.74)n=39 4.44 (.56)n=36 ________________________________________________________________________________ _
The students' rating of an activity's effectiveness in helping them learn the material may
have been influenced by the unfamiliar technology, the adventure of a new experience, or the
appreciation from being provided with state-of-the-art instruction (Larsen, 1992). However,
students being able to evaluate three of the five activities and becoming accustomed to
interactive video would eliminate some of the novelty effect. However, the novelty effect may
not be totally eliminated because not every student took advantage of completing three
activities.
To answer whether or not students' ratings of an activity's difficulty was influenced by
their computer experience, the student mean difficulty ratings were controlled by computer
experience. The student mean difficulty ratings across computer experience levels are
summarized on Table 12. The mean difficulty ratings varied from 3.40 for Activity #1 (2-3 level
of computer experience) to 4.56 for Activity #3 (>3 level of computer experience). The
students who completed the first activity rated it with the highest difficulty rating (3.77) while the
students who completed the third activity rated it with the lowest difficulty rating (4.21). In
general, the mean difficulty ratings indicate that students felt the activities were not difficult to
use.
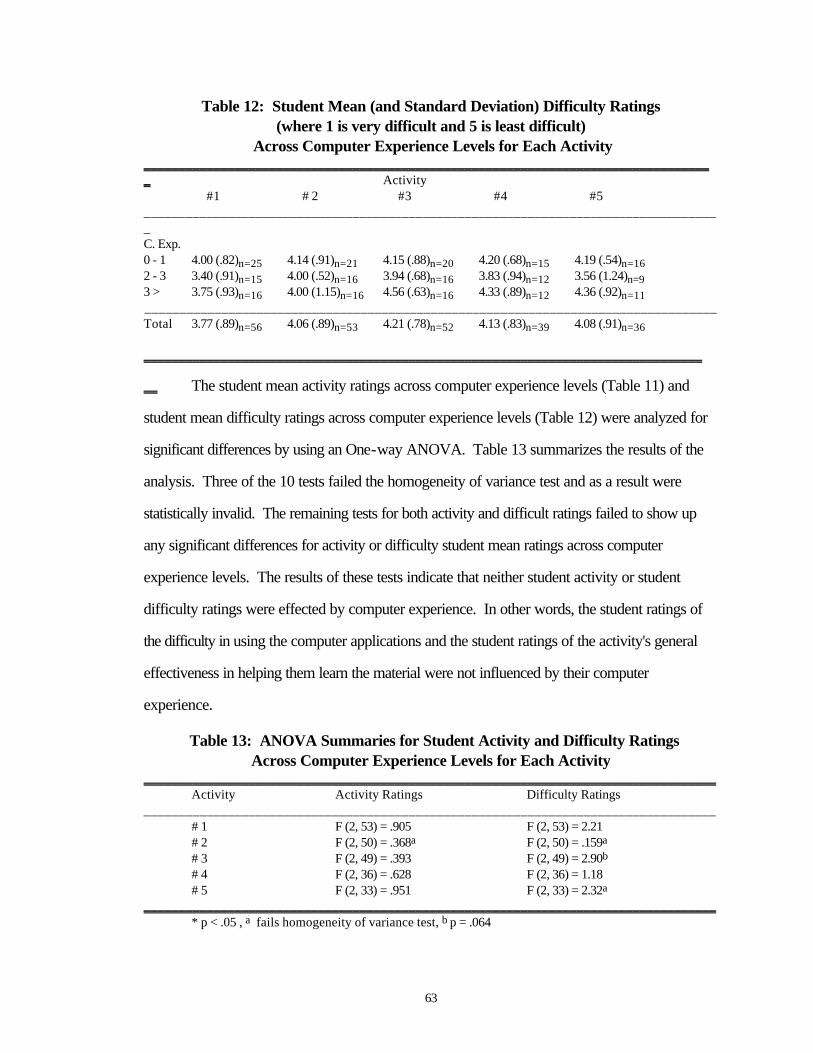
63
Table 12: Student Mean (and Standard Deviation) Difficulty Ratings (where 1 is very difficult and 5 is least difficult)
Across Computer Experience Levels for Each Activity _________________________________________________________________________________ _ Activity #1 # 2 #3 #4 #5 ___________________________________________________________________________________ C. Exp. 0 - 1 4.00 (.82)n=25 4.14 (.91)n=21 4.15 (.88)n=20 4.20 (.68)n=15 4.19 (.54)n=16 2 - 3 3.40 (.91)n=15 4.00 (.52)n=16 3.94 (.68)n=16 3.83 (.94)n=12 3.56 (1.24)n=9 3 > 3.75 (.93)n=16 4.00 (1.15)n=16 4.56 (.63)n=16 4.33 (.89)n=12 4.36 (.92)n=11 __________________________________________________________________________________ Total 3.77 (.89)n=56 4.06 (.89)n=53 4.21 (.78)n=52 4.13 (.83)n=39 4.08 (.91)n=36
________________________________________________________________________________
__ The student mean activity ratings across computer experience levels (Table 11) and
student mean difficulty ratings across computer experience levels (Table 12) were analyzed for
significant differences by using an One-way ANOVA. Table 13 summarizes the results of the
analysis. Three of the 10 tests failed the homogeneity of variance test and as a result were
statistically invalid. The remaining tests for both activity and difficult ratings failed to show up
any significant differences for activity or difficulty student mean ratings across computer
experience levels. The results of these tests indicate that neither student activity or student
difficulty ratings were effected by computer experience. In other words, the student ratings of
the difficulty in using the computer applications and the student ratings of the activity's general
effectiveness in helping them learn the material were not influenced by their computer
experience.
Table 13: ANOVA Summaries for Student Activity and Difficulty Ratings Across Computer Experience Levels for Each Activity
__________________________________________________________________________________ Activity Activity Ratings Difficulty Ratings __________________________________________________________________________________ # 1 F (2, 53) = .905 F (2, 53) = 2.21 # 2 F (2, 50) = .368a F (2, 50) = .159a # 3 F (2, 49) = .393 F (2, 49) = 2.90b # 4 F (2, 36) = .628 F (2, 36) = 1.18 # 5 F (2, 33) = .951 F (2, 33) = 2.32a __________________________________________________________________________________ * p < .05 , a fails homogeneity of variance test, b p = .064
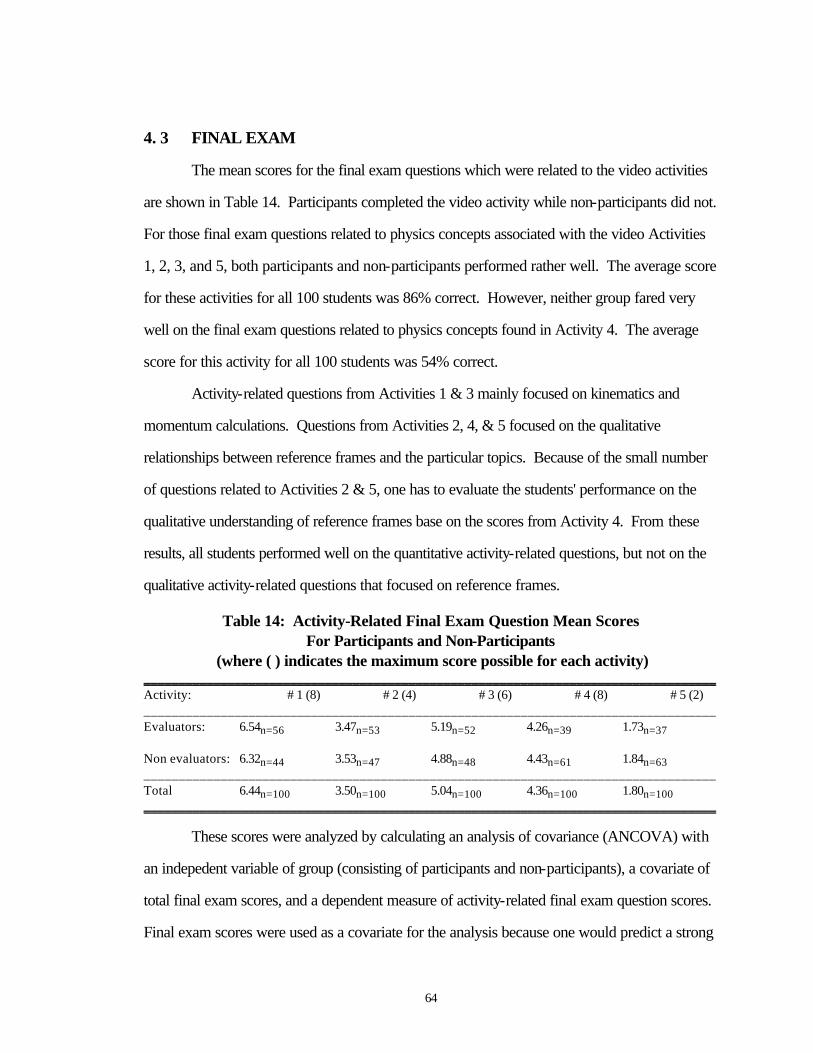
64
4. 3 FINAL EXAM
The mean scores for the final exam questions which were related to the video activities
are shown in Table 14. Participants completed the video activity while non-participants did not.
For those final exam questions related to physics concepts associated with the video Activities
1, 2, 3, and 5, both participants and non-participants performed rather well. The average score
for these activities for all 100 students was 86% correct. However, neither group fared very
well on the final exam questions related to physics concepts found in Activity 4. The average
score for this activity for all 100 students was 54% correct.
Activity-related questions from Activities 1 & 3 mainly focused on kinematics and
momentum calculations. Questions from Activities 2, 4, & 5 focused on the qualitative
relationships between reference frames and the particular topics. Because of the small number
of questions related to Activities 2 & 5, one has to evaluate the students' performance on the
qualitative understanding of reference frames base on the scores from Activity 4. From these
results, all students performed well on the quantitative activity-related questions, but not on the
qualitative activity-related questions that focused on reference frames.
Table 14: Activity-Related Final Exam Question Mean Scores For Participants and Non-Participants
(where ( ) indicates the maximum score possible for each activity) __________________________________________________________________________________ Activity: # 1 (8) # 2 (4) # 3 (6) # 4 (8) # 5 (2) __________________________________________________________________________________ Evaluators: 6.54n=56 3.47n=53 5.19n=52 4.26n=39 1.73n=37 Non evaluators: 6.32n=44 3.53n=47 4.88n=48 4.43n=61 1.84n=63 __________________________________________________________________________________ Total 6.44n=100 3.50n=100 5.04n=100 4.36n=100 1.80n=100 __________________________________________________________________________________
These scores were analyzed by calculating an analysis of covariance (ANCOVA) with
an indepedent variable of group (consisting of participants and non-participants), a covariate of
total final exam scores, and a dependent measure of activity-related final exam question scores.
Final exam scores were used as a covariate for the analysis because one would predict a strong
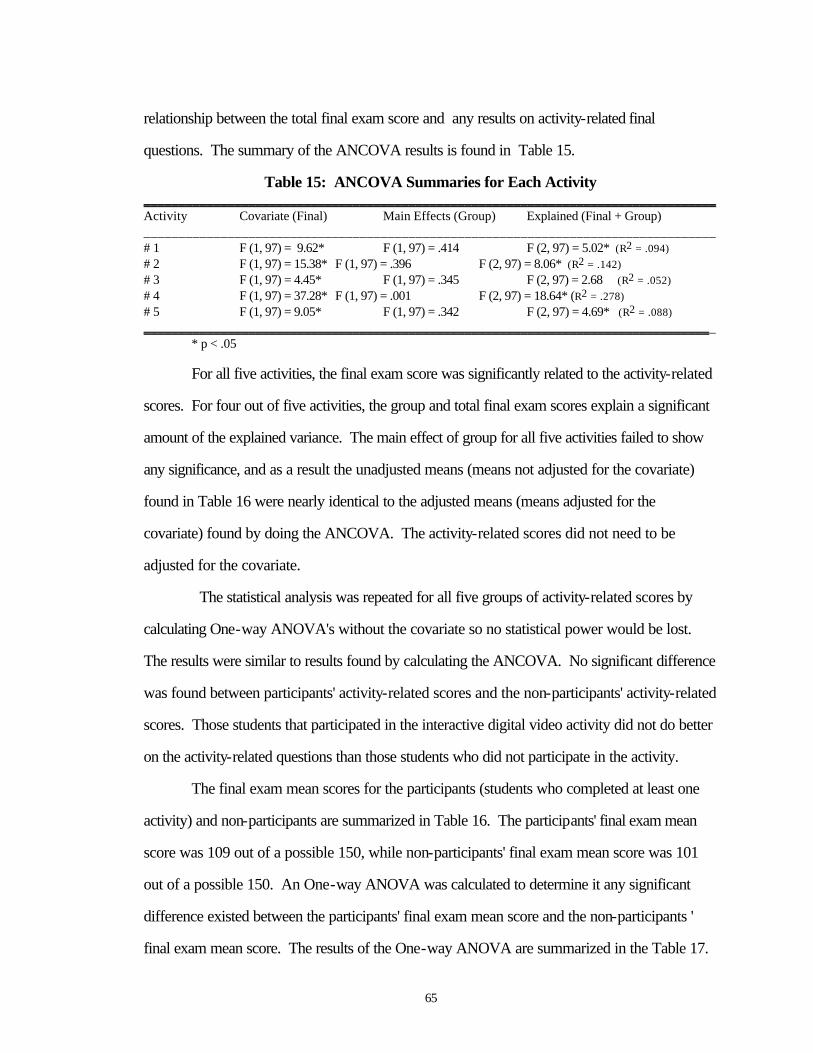
65
relationship between the total final exam score and any results on activity-related final
questions. The summary of the ANCOVA results is found in Table 15.
Table 15: ANCOVA Summaries for Each Activity __________________________________________________________________________________ Activity Covariate (Final) Main Effects (Group) Explained (Final + Group) __________________________________________________________________________________ # 1 F (1, 97) = 9.62* F (1, 97) = .414 F (2, 97) = 5.02* (R2 = .094) # 2 F (1, 97) = 15.38* F (1, 97) = .396 F (2, 97) = 8.06* (R2 = .142) # 3 F (1, 97) = 4.45* F (1, 97) = .345 F (2, 97) = 2.68 (R2 = .052) # 4 F (1, 97) = 37.28* F (1, 97) = .001 F (2, 97) = 18.64* (R2 = .278) # 5 F (1, 97) = 9.05* F (1, 97) = .342 F (2, 97) = 4.69* (R2 = .088) __________________________________________________________________________________ * p < .05
For all five activities, the final exam score was significantly related to the activity-related
scores. For four out of five activities, the group and total final exam scores explain a significant
amount of the explained variance. The main effect of group for all five activities failed to show
any significance, and as a result the unadjusted means (means not adjusted for the covariate)
found in Table 16 were nearly identical to the adjusted means (means adjusted for the
covariate) found by doing the ANCOVA. The activity-related scores did not need to be
adjusted for the covariate.
The statistical analysis was repeated for all five groups of activity-related scores by
calculating One-way ANOVA's without the covariate so no statistical power would be lost.
The results were similar to results found by calculating the ANCOVA. No significant difference
was found between participants' activity-related scores and the non-participants' activity-related
scores. Those students that participated in the interactive digital video activity did not do better
on the activity-related questions than those students who did not participate in the activity.
The final exam mean scores for the participants (students who completed at least one
activity) and non-participants are summarized in Table 16. The participants' final exam mean
score was 109 out of a possible 150, while non-participants' final exam mean score was 101
out of a possible 150. An One-way ANOVA was calculated to determine it any significant
difference existed between the participants' final exam mean score and the non-participants '
final exam mean score. The results of the One-way ANOVA are summarized in the Table 17.
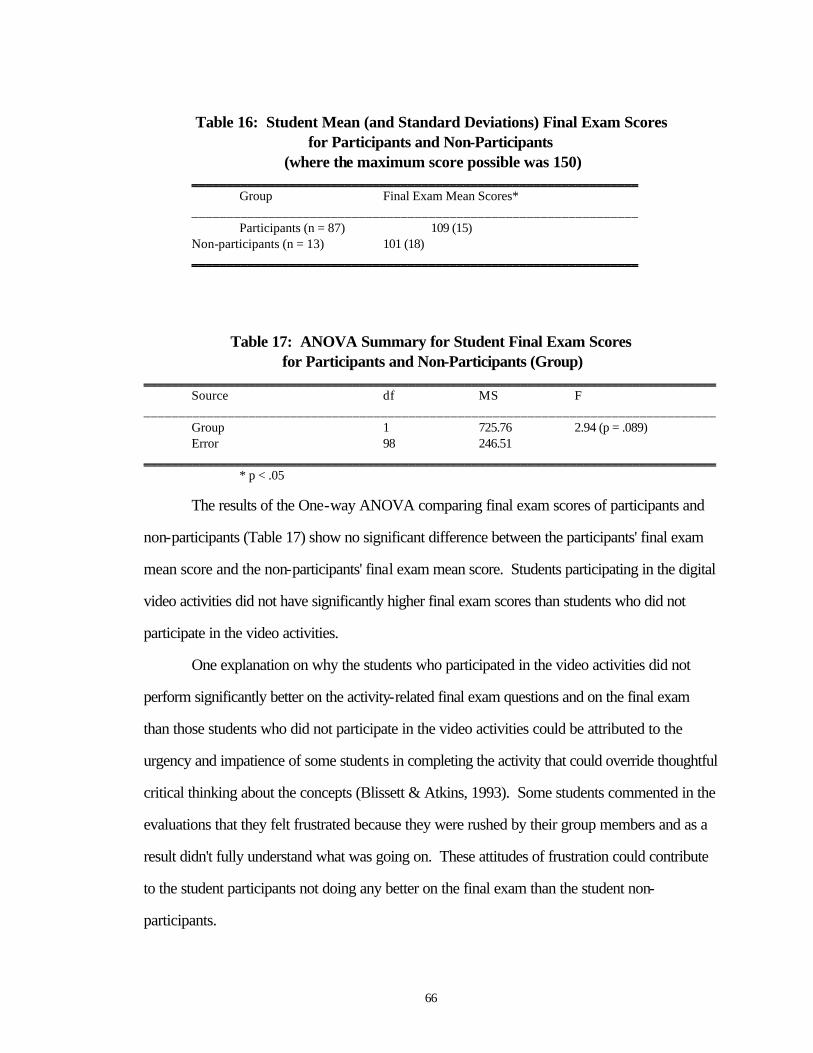
66
Table 16: Student Mean (and Standard Deviations) Final Exam Scores
for Participants and Non-Participants (where the maximum score possible was 150)
________________________________________________________________ Group Final Exam Mean Scores* ________________________________________________________________ Participants (n = 87) 109 (15) Non-participants (n = 13) 101 (18) ________________________________________________________________
Table 17: ANOVA Summary for Student Final Exam Scores for Participants and Non-Participants (Group)
__________________________________________________________________________________ Source df MS F __________________________________________________________________________________ Group 1 725.76 2.94 (p = .089) Error 98 246.51 __________________________________________________________________________________ * p < .05
The results of the One-way ANOVA comparing final exam scores of participants and
non-participants (Table 17) show no significant difference between the participants' final exam
mean score and the non-participants' final exam mean score. Students participating in the digital
video activities did not have significantly higher final exam scores than students who did not
participate in the video activities.
One explanation on why the students who participated in the video activities did not
perform significantly better on the activity-related final exam questions and on the final exam
than those students who did not participate in the video activities could be attributed to the
urgency and impatience of some students in completing the activity that could override thoughtful
critical thinking about the concepts (Blissett & Atkins, 1993). Some students commented in the
evaluations that they felt frustrated because they were rushed by their group members and as a
result didn't fully understand what was going on. These attitudes of frustration could contribute
to the student participants not doing any better on the final exam than the student non-
participants.
67
A second explanation could be the amount of time between the video activities and the
final exam. Students completed the first video activity in the third week of September and they
completed the last activity in the third week of November. Students completed the final exam in
the second week of December. The amount of time between the activities and final exam, one
to three months depending on the activity, was long enough to "cancel" out any reinforced and
enhanced understanding of the physics concepts the participants gained by completing the
activities.
Another possibility is that the activities were completed by the students in a clinical
setting outside the curriculum, that is, with no instruction (Nakhleh, 1994). Because a
component of the evaluation was to determine if the materials were designed well enough for
independent use, traditional instruction was minimal. After the students completed the activity,
the proctor did not provide the students "corrective" feedback on their performance. Our
tentative conclusion is that the activities were easy for the students to use and that the students
perceived the activities as positive learning experiences. However, long term gains would
require more instruction to be necessary.
The study showing no differences in activity-related final exam question scores and final
exam scores between participants and non-participants could be a perfect example of how
important it is for teachers to provide instruction and feedback to students for effective learning
to take place in a technology-enhanced learning environment. As the students were completing
the activities, it was observed that the majority of students did really well on the quantitative
aspects of the activities (e.g., making measurements from video, performing calculations, and
working problems). But some students had difficulty with the qualitative aspects of the
activities, in particular describing the motion of an object by using the visual-space-time
diagrams. This was a perfect example of how important it would be for an instructor to provide
the students with "corrective" feedback to clear up any misconceptions held by the students.
The statement, "Fears that a technology-enhanced learning environment will mean the

68
downgrading of teachers to technical managers look premature.", made by Blissett and Atkins
(1993) appears to be very applicable in this case.
69
CHAPTER 5
CONCLUSION
In this study, the results of investigating the effect of using interactive digital video
materials in an introductory college physics classroom on student learning and attitudes were
presented. The study examined student attitudes toward computers and the relationships these
attitudes have with demographic information that were collected from the students. The study
also presented students' perceptions of the effectiveness of using various instruction techniques
in learning physics concepts related to reference frames. The study examined the relationship
between student attitudes toward computers and the relationship these attitudes have with
students' perceptions on the effectiveness of the activities in general and the difficulty of each
activity. Students' understanding of the physics concepts associated with the materials were
assessed and the scores on these assessments from students who completed the activities were
compared with the scores on these assessments from students who did not complete the
activities.
5. 1 STUDENT COMPUTER ATTITUDES
The study found:
(1) Students' initial feelings of comfort/anxiety in using computer applications were
significantly related to the students' computer experience but students' initial
feelings of computer application usefulness was not significantly related to
students' computer experience.
(2) Students' feelings of comfort in using computer applications significantly
improved as a result of participating in the interactive digital video activities but
students' feelings of computer application usefulness did not significantly
improve as a result of participating in the video activities.
70
5. 2 STUDENT PERCEPTIONS
In regards to students' perceptions of the video activities, the study found:
(1) The majority of participants felt the activities were either
effective or very effective in helping them learn the physics concepts related to
reference frames.
(2) The majority of participants felt the computer applications (Video Analyzer and
Visual Space-Time) utilized in the activities were not difficult to use.
(3) The majority of participants felt the capabilities provided by the interactive digital
video process (capturing video, playing back video, drawing visual space-time
diagrams, and tracing the motion of an object with the video) in addition to
discussion were very effective in helping them learn the physics concepts related
to reference frames.
(4) The participants' ratings of the effectiveness of each activity in helping them
learn the physics concepts and the ratings of difficulty in using the computer
applications were not significantly effected by the participants' computer
experience.
5. 3 STUDENT GAINS IN LEARNING
The study measured the students' relative long-term gains in learning by using the
activity-related questions on the final exam and found:
(1) No significant differences in activity-related question scores between those
students who participated in the video activities and those students who did
not participate in the activities.
(2) No significant differences in final exam scores between those students who
participated in the video activities and those who did not participate in the
activities.
71
5. 4 OVERALL RESULTS
The intended audience for the video activities were high school physics students with
various mathematical, science, and computer backgrounds. The Concepts of Physics students
were used in this investigation to determine the appropriateness of the video materials for
students who do not have strong backgrounds in these areas and for students who traditionally
avoid physics.
The results of the study are encouraging in that the study demonstrates how easy-to-use
visualization techniques can be incorporated effectively in student exploration and investigation
activities. The majority of students felt the computer applications associated with the digital
video activities (Video Analyzer and Visual Space-Time) were easy to use and the students'
attitudes of comfort/anxiety in using these computer applications improved with experience. The
majority of students enjoyed using the instructional techniques associated with interactive digital
video and felt the activities were very effective in helping them learn the material.
Some of the comments made by the students illustrate the effect of integrating
interactive digital video into inquiry-based activities on their attitudes and learning. "Being able
to trace the paths of moving objects helped me better understand the concepts." "The programs
helped me understand the concepts." "Seeing a record of the experiment was a big plus as far
as understanding the concepts was concerned." "It was good to have time set aside and just do
the activities. It helped me focus my attention to learn." "The programs were easy to use and
made it easier to understand the concepts."
These comments seem to reflect that the goal of students becoming involved in the
"active process" of learning science set out by the 1994 Draft of the National Science Education
Standards (National Research Council, 1994) was met by students completing the video
activities. The use of video activities in this study demonstrates how activities based on real-life
experiences can be used to spark students' natural curiosity, to make learning physics relevant
for the students, and to enable students to move from concrete, everyday experiences to more
abstract ideas and models of physics.
72
The use of video activities in this study models how technology and scientific inquiry can
be integrated into a learning environment where students are given a better way to visualize,
explore, investigate, analyze, and understand physics concepts.
The results of the study are discouraging in that based on students' performance on the
final exam, students who participated in the video evaluation did not do any better than those
students who did not participate in the video evaluation. These performance results could be
partially attributed to students feeling rushed to complete the activities and to using a multiple-
choice test as an assessment tool. Those students who participated in the video activities not
doing any better on the final exam than those students who did not participate in the activities
could also be attributed to the lack of instruction and the lack of "corrective" feedback given to
the students who completed the video activities. If students held misconceptions about the
physics concepts when they completed the activity, it would be likely they would still hold these
misconceptions at the end of the semester without any "corrective" feedback given to them by
the instructor.
The comparison of final exam scores between those students who completed the video
activities and those students who did not complete the activities showing no significant
differences between the two groups may not be important for reflecting the ineffectiveness of the
interactive digital video materials in helping the students learn the material, but instead may be
important for reflecting the critical role of the instructor in providing instruction, feedback, and
guidance for effective student learning to take place in a technology-enhanced physics
classroom.
Further investigation needs to incorporate the use of instruction, guidance, and
"corrective" feedback in the video materials and activities evaluation process so that a better
comparison of students' final exam scores who completed the activities and of students' final
exam scores who did not complete the activities can be made. A better assessment tool than a
multiple-choice test would be valuable to fully explore the students' understanding of the physics
concepts.
73
5. 5 REQUIRED INVESTMENTS FOR THE EFFECTIVE USE OF INTERACTIVE DIGITAL VIDEO IN THE PHYSICS CLASSROOM
The materials and equipment incorporated in the interactive digital video activities were
specifically used because most of the materials and equipment would already be a part of the
existing resources contained in the high school physics classroom or high school. The
camcorder used to record the motion of an object could be found in the media center of most
high schools. The computer used to run the interactive video computer programs would be
likely to be found in a high school computer laboratory. Most of the dynamics equipment and
materials would likely to be found in current physics labs today. If the high school physics
laboratory had air tracks and gliders instead of dynamics carts and tracks, most of the digital
activities could be adapted to using air tracks and gliders.
The only real investments on equipment and materials required for the high school
physics instructor to incorporate the digital video materials in their classroom would have to be
made on the Pasco ballistic cart accessory and on the ActionMedia II display adapter with
capture option because the two computer programs, Video Analyzer and Visual Space-Time,
could be made available upon request. The ballistic cart accessory could be purchased for a
modest price, but the ActionMedia II board would require an investment of about $1000. The
cost of the board by far would be the biggest obstacle in preventing high school physics
teachers from incorporating interactive digital video in their classroom, especially when one
considers the median equipment budget available per physics teacher in 1989-1990 was about
$500-1000 (Neuschatz & Alpert, 1994). It is hoped with increased interest and availability of
multimedia equipment in addition to recent developments in multimedia technology, the cost will
decrease over the next few years. However when one considers the many possibilities for the
use of interactive digital video (with the video activities only being a small fraction illustrated) in
utilizing a variety of visualization techniques, the initial investment could result in many positive
74
student outcomes including the reinforcement of student learning of physics concepts and the
development of student skills in scientific investigation and inquiry.
Another investment required of high school physics teachers in order to implement
interactive digital video materials effectively in their classroom would be the amount of time
spent on the activities. The amount of time devoted to exploration and investigation of the
physics concepts in the high school physics classroom needs to be more the one hour/week as
indicated in the 1989-1990 AIP High School Physics Teacher Survey (Neuschatz & Alpert,
1994) as being the amount of time in a physics classroom spent doing laboratory work. It took
students on average about 90 minutes to complete each activity. Scientific inquiry and
investigation require a considerable amount of time not only for the students but also for the
instructor in order for it be effective. Any type of activity that integrates current computer
technology with scientific inquiry and investigation is worth the amount of time spent on it,
especially if the students become involved in the "active process" of learning physics.
The results of the study demonstrate that interactive digital video materials can provide
physics teachers with effective exploration and application activities that incorporate existing
resources and the latest "user-friendly" technology to bring the "active" process of learning
physics in their classroom. However, a commitment of resources and time must be made by
physics teachers in order for the interactive digital video materials to effectively develop their
students' understanding and reinforcement of physics concepts as well as their scientific inquiry
skills.
75
REFERENCES
Austin, M. B. (1994). A comparison of three interactive media formats in an RTV/DVI computer-mediated lesson. Computers in Education, 22(4), 319-333. Bain, A., Houghton, S., Sah, F. B., & Carroll, A. (1992). An evaluation of the application of
interactive video for teaching social problem-solving to early adolescents. Journal of Computer-Based Instruction, 19(3), 92-99.
Bandura, A. (1977). Self-efficacy: toward a unifying theory of behavior change. Psychological Review, 84, 191-215. Bandura, A., & Adams, N. E. (1977). Analysis of self-efficacy theory of behavior change. Cognitive Therapy and Research, 1, 287-310. Barron, A. E. (1993). Optical media in education. The Computing Teacher, 8(5), 6-10. Becher, H. J. (1989). Mathematics and science uses of computers in American schools. Journal of Computers in Mathematics and Science Teaching, 10(4), 19-25. Beichner, R. J. (1990). The effect of simultaneous motion presentation and graph generation in a kinematics lab. The Physics Teacher, 27, 803-815. Beichner, R. J. (1989). Applications of Macintosh microcomputers in introductory physics. The Physics Teacher, 27(5), 348-353. Billings, D. M., & Cobb, K. L. (1992). Effects of learning style preferences, attitudes and GPA on learner achievement using computer assisted interactive videodisc instruction. Journal of Computer-Based Instruction, 19(1), 12-16. Blissett, G., & Atkins, M. (1993). Are they thinking? Are they learning? A study of the use of interactive video. Computers in Education, 21(1/2), 31-39. Bourne, L., Dominowski, R., Loftus, E., & Healy, A. (1986). Cognitive Processes (2nd ed.). Englewood Cliffs, NJ: Prentice Hall. Bowden, J., Dall'Alba, G., Martin, E., Laurillard, D., Masters, G., Ramsden, P.,
Stephanou, A., & Walsh, E. (1992). Displacement, velocity, and frames of reference: phenomenographic studies of students' understanding and some implications for teaching and assessment. American Journal of Physics, 60(3), 262-269.
76
Brassell, H. (1987). The effect of real-time laboratory graphing on learning graphic representations of distance and velocity. Journal of Research in Science Teaching, 24, 385-395. Brungardt, J. B. & Zollman, D. A. (1993). The influence of interactive videodisc
instruction using real-time analysis on kinematics graphing skills of high school physics students. Journal of Research in Science Teaching to be published.
Cadmus, R. R. Jr. (1990). A video technique to facilitate the visualization of Physical Phenomena. American Journal of Physics, 58(4), 397-399. Chaudhury, S. R., & Zollman, D. A. (1994). Image processing enhances the value of digital video in physics instruction. Computers in Physics Education, 8(5), 518-523. Coller, A. M., Gale, M. T., & Harris, T. A. (1994). Effects of gender role identity and experience on computer attitude components. Journal of Educational Computing Research, 10(2), 129-137. Dede, C. (1987). Empowering environments, hypermedia and microworlds. The Computing Teacher, 15(3), 20-24. Delcourt, M. A. B., & Kinzie, M. B. (1993). Computer technologies in teacher education: the measurement of attitudes and self-efficacy. Journal of Research and Development in Education, 27(1), 35-41. Delcourt, M. A. B., & Lewis, L. (1987, February). Measuring Adult's Attitudes Toward Computers: An Initial Investigation. In the proceedings of the Lifelong Learning Research Conference, University of Maryland. Dengler, R., Luchner, K., & Zollman, D. A. (1993). Computer-video method evaluates real-motion data in real time for student. Computers in Physics, 7(4), 393-399. Dwyer, D., Ringstaff, C., Sandholz, J., & Apple Computer. (1990). Teachers Beliefs and Practices, Part II: Support for Change. A.C.O.T. Report # Apple Computer, Inc. Dyck, J. L., & Smither, J. A. (1994). Age differences in computer experience, gender, and
education. Journal of Educational Computing Research, 10(3), 239-248. Escalada, L. T., Grabhorn, R., & Zollman, D. A. (1994)1. Interactive Digital Video Activities, not yet published, 1-58.
77
Escalada, L. T., Grabhorn, R., & Zollman, D. A. (1994)2. Interactive Digital Video Activities Teacher's Manual, not yet published, 1-19. Gable, R. K. (1986). Instrument Development in the Affective Domain. Boston, MA: Kluwer-Nijhoff Hannafin, M. J. (1984). Guidelines for using locus of instructional control in the design of
computer assisted instruction. Journal of Instructional Development, 7(3), 6-10. Hannafin, M. J., & Colamio, M. A. E. (1987). The effects of variations in lesson control and
practice on learning from interactive video. Educational Communication & Technology Journal, 35(4), 203-212.
Hannafin, M. J., & Phillips, T. L. (1987). Perspectives in the design of interactive video:
beyond tape versus disc. Journal of Research & Development in Education, 21(1), 44-58.
Hannafin, M. J., & Hughes, C.W. (1986) A framework for incorporating orienting activities in
computer-based interactive video. Instructional Science, 15, 239-255. Hersey, T. (1990). Teacher's Guide to Advanced Placement Courses in Physics: Physics B
and Physics C. New York, NY: Advanced Placement Program, The College Board. Hoffer, T., Radke, J., & Lord, R. (1992). Qualitative/quantitative study of the effectiveness of computer-assisted interactive video instruction: the hyperiodic table of elements. Journal of Computers in Mathematics & Science Teaching, 11(1), 3-12. Honey, M. & Moeller, B. (1990). Teachers' beliefs and technology integration: different values, different understandings. Technical Report No. 6, Center for Technology in Education, NY; ERIC Document Reproduction Service No. ED 326203. Hooper, S., & Hannafin, M. J. (1988). Learning the ROPES of instructional design: guidelines for emerging interactive technologies. Educational Technology, 28(7), 14-7. Huffman, D., & Heller, P. (1995), What Does the Force Concept Inventory Actually Measure? The Physics Teacher, 33, 138-143. Huggins, E. (1988). A private communication to D. A. Zollman.
78
Ivy, D., Hume, J. P. (1960). Frames of Reference Film (16 mm, black & white, 28 min.) produced by Physical Science Study Committee, Cambridge, MA. Distributed by Central Scientific, Frankling Park, IL. Jantan, J. (1994). Difference and similarities in teachers' information exploration strategies for
lesson planning using the physics InfoMall, a large database on CD-ROM. Doctor Dissertation at Kansas State University, 1994.
Jonassen, D. (1988). Designing structured hypertext and structuring access to hypertext. Educational Technology, 28(11), 17-20. Jones, T., & Clarke, V. A. (1994). A computer attitude scale for secondary students. Computers in Education, 22(4), 315-318. Kahney, H. (1986). Problem Solving: A Cognitive Approach. Open University Press, Milton Keynes. Karplus, R. (1977). Science teaching and development of reasoning. Journal of Research in
Science Teaching, 14(2), 169-175. Keshishoglow, E. & Siegmann, P. (1989). Experiments in two-dimension using a video camera and microcomputer. American Journal of Physics, 57,179. Kolb, D. A. (1984). Experimental Learning: Experiment as the Source of Learning and Development. Englewood Cliffs, NJ: Prentice Hall. Kulik, J., Kulik, C., & Bangert-Downs, R. (1985). Effectiveness of computer-based learning tools. Computers in Human Behavior, 1, 59-74. Larsen, R. E. (1992). Relationship of learning style to the effectiveness and acceptance of
interactive video instruction. Journal of Computer-Based Instruction, 19(1), 17- 21. Laws, P. W. (1995, March). Physics Without Lectures. Talk presented at the Department of
Physics Colloquium at Kansas State University. Laws, P. W. (1992). Computer-based video analysis of physical phenomena. AAPT Announcer, 22(4), 58. Laws, P. W. (1991). Calculus-based physics without lectures. Physics Today, 24, 24-31. Likert, R. (1932). A technique for the measurement of attitudes. Archives of Psychology,
140, 1-55.
79
Loyd, B. H., & Gressard, C. (1984)1. Reliability and factorial validity of computer attitude scales. Educational and Psychological Measurement, 44(2),501-505. Loyd, B. H., & Gressard, C. (1984)2. The effects of sex, age, and experience on computer attitude components. Association for Educational Data Systems, 18(2), 67-77. Malhotra, Y., & Erickson, R. E. (1994). Interactive educational multimedia: coping with the need for increasing data storage. Educational Technology, 34(4), 38-45. Marcoulides, G. A. (1989). Measuring computer anxiety: the computer anxiety scale. Educational and Psychological Measurement, 49(3), 733-739. Murphy, C. A., Coover, D., & Owen, S. (1988, April). Assessment of Computer Self- Efficacy: Instrument Development and Validation. Paper presented at the annual meeting of the National Council on Measurement in Education, San Francisco. Nakhleh, M. B. (1994). A review of microcomputer-based labs: how have they
affected science learning? Journal of Computers in Mathematics & Science Teaching, 13(4), 368-380.
National Research Council. (1994, November). Draft of the National Science Education Standards. USA: National Academy Press. Neuschatz, M., & Alpert, L. (1994). AIP Report on physics in the high schools II: findings
from the 1989-90 nationwide survey of secondary school teachers of physics. College Park, MD: American Institute of Physics.
Reigeluth, C. M., & Stein, F. S. (1983). Instructional Design Theories and Models: An Overview of Their Current Status. Hillsdale, NJ: Lawrence Erlbaum Associates. Ronen, M., Langley, D., & Ganiel, U. (1992). Integrating computer simulations into high
school physics teaching. Journal of Computers in Mathematics & Science Teaching, 11(3/4), 319-329.
Rubin, A. (1993). Communication Association of Computing Machinery, 36(5), 64. Schanse, W., Kolvoord, R. A., & Morrow, J. (1993). Image processing for teaching: making it happen in the classroom. AAPT Announcer, 23, 45. Sheingold, K. & Hadley, M. (1990). Accomplished Teachers: Integrating Computers into
Classroom Practice. Center for Technology in Education, Bank Street College of Education.
80
Shymansky, J., Kyle, W., & Alport, J. (1983). The effects of new science curricula on student performance. Journal of Research in Science Teaching, 20(5), 387-404. Skinner, M. E. (1988). Attitudes of computer-assisted instruction: an essential variable for
successful implementation. Educational Technology, 28(2), 7-15. Thornton, R. K., & Sokoloff, D. R. (1990). Learning motion concepts using real-time microcomputer-based laboratory tools. American Journal of Physics, 58, 858-867. Tovar, M., & Coldevin, G. (1992). Effects of orienting activities and instructional control on learning facts and procedures from interactive video. Journal of Educational Computing Research, 8(4), 507-519. Wagner, D. L. (1994). Using digitized video for motion analysis. The Physics Teacher, 32,
240-243. Wiburg, K. (1994). Integrating technologies into schools: why has it been so slow? The Computing Teacher, 21(5), 6-8. Wilson, J. M., & Radish, E. F. (1992). The comprehensive unified physics learning
environment, part I: background and system operation. Computers in Physics, 6(2), 202-209.
Winters, L., Lee, N., Allen, S., & Smith, E. (1993). Does the tip of a snapped towel travel faster than sound? The Physics Teacher, 31(6), 376. Woodrow, J. E. J. (1992). Computer-generated learning resources. Journal of Computers in
Mathematics & Science Teaching, 11(1), 199-216. Zollman, D. A. (1994, Fall). Fall, 1994 Semester Final Exam for Concepts of Physics course. Not Published, 1-7. Zollman, D. A. (1994). Preparing future science teachers: the physics component of a new programme. Journal of Physics Education, 29, 271-275. Zollman, D. A. (1990). Learning cycles in a large enrollment class. The Physics Teacher, 28, 20-25. Zollman, D. A. (1984). Physics and Automobile Collisions Videodisc. New York: Wiley.
Distributed by Ztek Co. Zollman, D. A., & Fuller, R. G. (1994). Teaching and learning physics with interactive video. Physics Today, 47(4), 41-47.
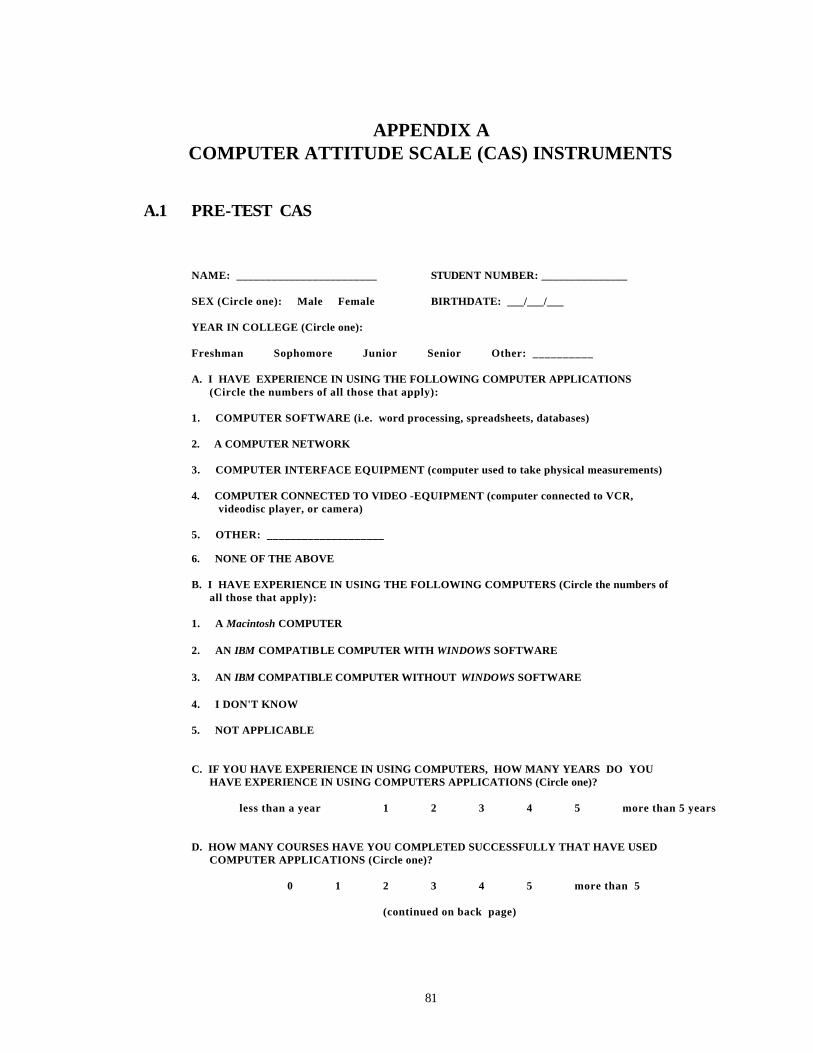
81
APPENDIX A
COMPUTER ATTITUDE SCALE (CAS) INSTRUMENTS A.1 PRE-TEST CAS NAME: ________________________ STUDENT NUMBER: _______________ SEX (Circle one): Male Female BIRTHDATE: ___/___/___ YEAR IN COLLEGE (Circle one): Freshman Sophomore Junior Senior Other: __________ A. I HAVE EXPERIENCE IN USING THE FOLLOWING COMPUTER APPLICATIONS (Circle the numbers of all those that apply): 1. COMPUTER SOFTWARE (i.e. word processing, spreadsheets, databases) 2. A COMPUTER NETWORK 3. COMPUTER INTERFACE EQUIPMENT (computer used to take physical measurements) 4. COMPUTER CONNECTED TO VIDEO -EQUIPMENT (computer connected to VCR, videodisc player, or camera) 5. OTHER: ____________________
6. NONE OF THE ABOVE B. I HAVE EXPERIENCE IN USING THE FOLLOWING COMPUTERS (Circle the numbers of all those that apply): 1. A Macintosh COMPUTER 2. AN IBM COMPATIBLE COMPUTER WITH WINDOWS SOFTWARE 3. AN IBM COMPATIBLE COMPUTER WITHOUT WINDOWS SOFTWARE 4. I DON'T KNOW 5. NOT APPLICABLE C. IF YOU HAVE EXPERIENCE IN USING COMPUTERS, HOW MANY YEARS DO YOU HAVE EXPERIENCE IN USING COMPUTERS APPLICATIONS (Circle one)? less than a year 1 2 3 4 5 more than 5 years D. HOW MANY COURSES HAVE YOU COMPLETED SUCCESSFULLY THAT HAVE USED COMPUTER APPLICATIONS (Circle one)? 0 1 2 3 4 5 more than 5 (continued on back page)
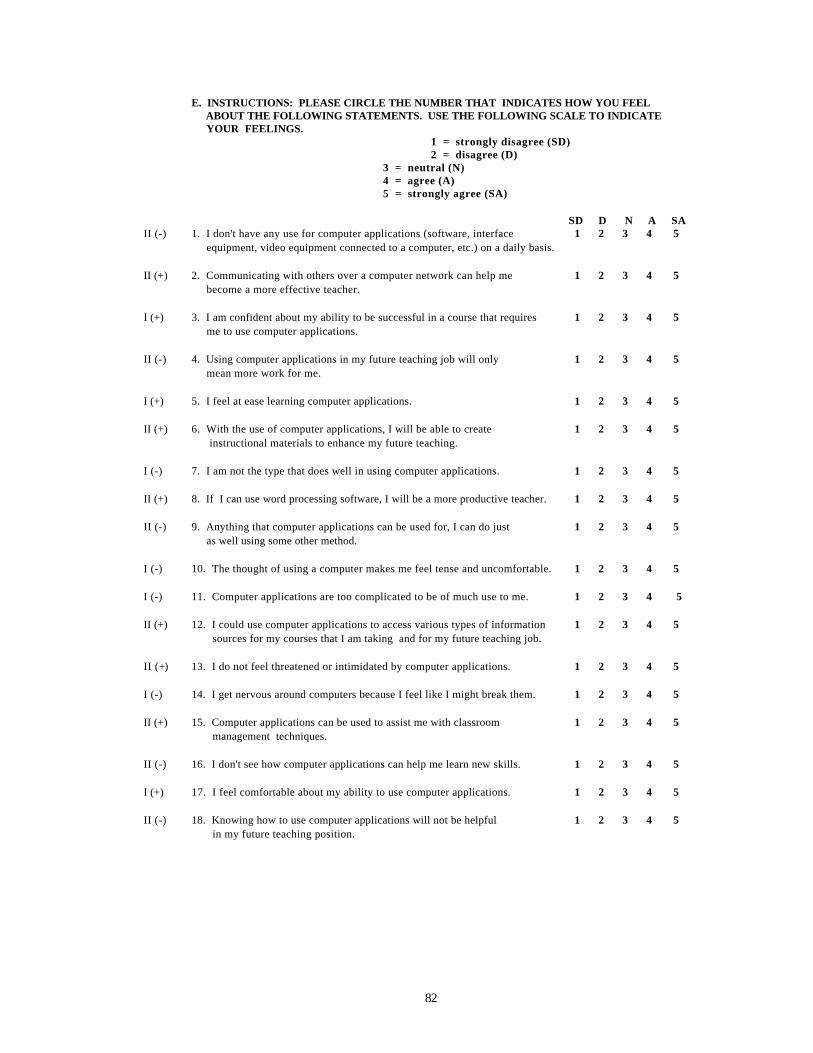
82
E. INSTRUCTIONS: PLEASE CIRCLE THE NUMBER THAT INDICATES HOW YOU FEEL ABOUT THE FOLLOWING STATEMENTS. USE THE FOLLOWING SCALE TO INDICATE YOUR FEELINGS. 1 = strongly disagree (SD) 2 = disagree (D) 3 = neutral (N) 4 = agree (A) 5 = strongly agree (SA) SD D N A SA II (-) 1. I don't have any use for computer applications (software, interface 1 2 3 4 5 equipment, video equipment connected to a computer, etc.) on a daily basis. II (+) 2. Communicating with others over a computer network can help me 1 2 3 4 5 become a more effective teacher. I (+) 3. I am confident about my ability to be successful in a course that requires 1 2 3 4 5 me to use computer applications. II (-) 4. Using computer applications in my future teaching job will only 1 2 3 4 5 mean more work for me. I (+) 5. I feel at ease learning computer applications. 1 2 3 4 5 II (+) 6. With the use of computer applications, I will be able to create 1 2 3 4 5 instructional materials to enhance my future teaching. I (-) 7. I am not the type that does well in using computer applications. 1 2 3 4 5 II (+) 8. If I can use word processing software, I will be a more productive teacher. 1 2 3 4 5 II (-) 9. Anything that computer applications can be used for, I can do just 1 2 3 4 5 as well using some other method. I (-) 10. The thought of using a computer makes me feel tense and uncomfortable. 1 2 3 4 5 I (-) 11. Computer applications are too complicated to be of much use to me. 1 2 3 4 5 II (+) 12. I could use computer applications to access various types of information 1 2 3 4 5 sources for my courses that I am taking and for my future teaching job. II (+) 13. I do not feel threatened or intimidated by computer applications. 1 2 3 4 5 I (-) 14. I get nervous around computers because I feel like I might break them. 1 2 3 4 5 II (+) 15. Computer applications can be used to assist me with classroom 1 2 3 4 5 management techniques. II (-) 16. I don't see how computer applications can help me learn new skills. 1 2 3 4 5 I (+) 17. I feel comfortable about my ability to use computer applications. 1 2 3 4 5 II (-) 18. Knowing how to use computer applications will not be helpful 1 2 3 4 5 in my future teaching position.
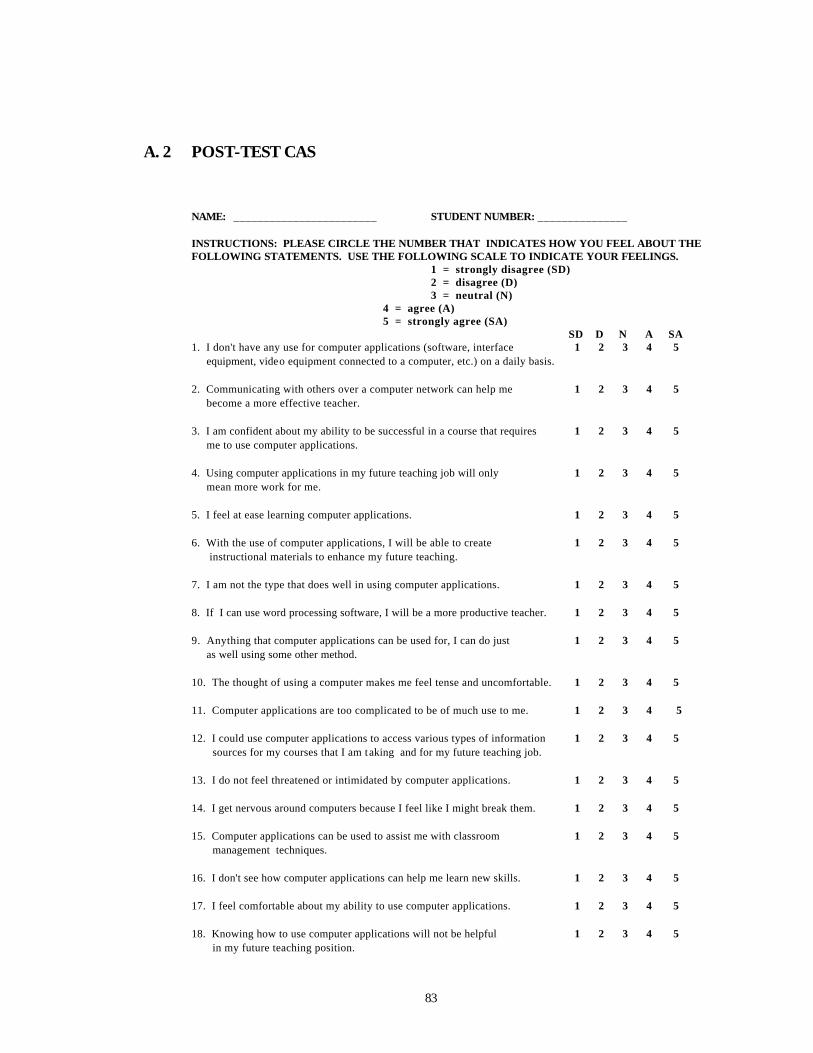
83
A. 2 POST-TEST CAS NAME: ________________________ STUDENT NUMBER: _______________ INSTRUCTIONS: PLEASE CIRCLE THE NUMBER THAT INDICATES HOW YOU FEEL ABOUT THE FOLLOWING STATEMENTS. USE THE FOLLOWING SCALE TO INDICATE YOUR FEELINGS. 1 = strongly disagree (SD) 2 = disagree (D) 3 = neutral (N) 4 = agree (A) 5 = strongly agree (SA) SD D N A SA 1. I don't have any use for computer applications (software, interface 1 2 3 4 5 equipment, video equipment connected to a computer, etc.) on a daily basis. 2. Communicating with others over a computer network can help me 1 2 3 4 5 become a more effective teacher. 3. I am confident about my ability to be successful in a course that requires 1 2 3 4 5 me to use computer applications. 4. Using computer applications in my future teaching job will only 1 2 3 4 5 mean more work for me. 5. I feel at ease learning computer applications. 1 2 3 4 5 6. With the use of computer applications, I will be able to create 1 2 3 4 5 instructional materials to enhance my future teaching. 7. I am not the type that does well in using computer applications. 1 2 3 4 5 8. If I can use word processing software, I will be a more productive teacher. 1 2 3 4 5 9. Anything that computer applications can be used for, I can do just 1 2 3 4 5 as well using some other method. 10. The thought of using a computer makes me feel tense and uncomfortable. 1 2 3 4 5 11. Computer applications are too complicated to be of much use to me. 1 2 3 4 5 12. I could use computer applications to access various types of information 1 2 3 4 5 sources for my courses that I am taking and for my future teaching job. 13. I do not feel threatened or intimidated by computer applications. 1 2 3 4 5 14. I get nervous around computers because I feel like I might break them. 1 2 3 4 5 15. Computer applications can be used to assist me with classroom 1 2 3 4 5 management techniques. 16. I don't see how computer applications can help me learn new skills. 1 2 3 4 5 17. I feel comfortable about my ability to use computer applications. 1 2 3 4 5 18. Knowing how to use computer applications will not be helpful 1 2 3 4 5 in my future teaching position.
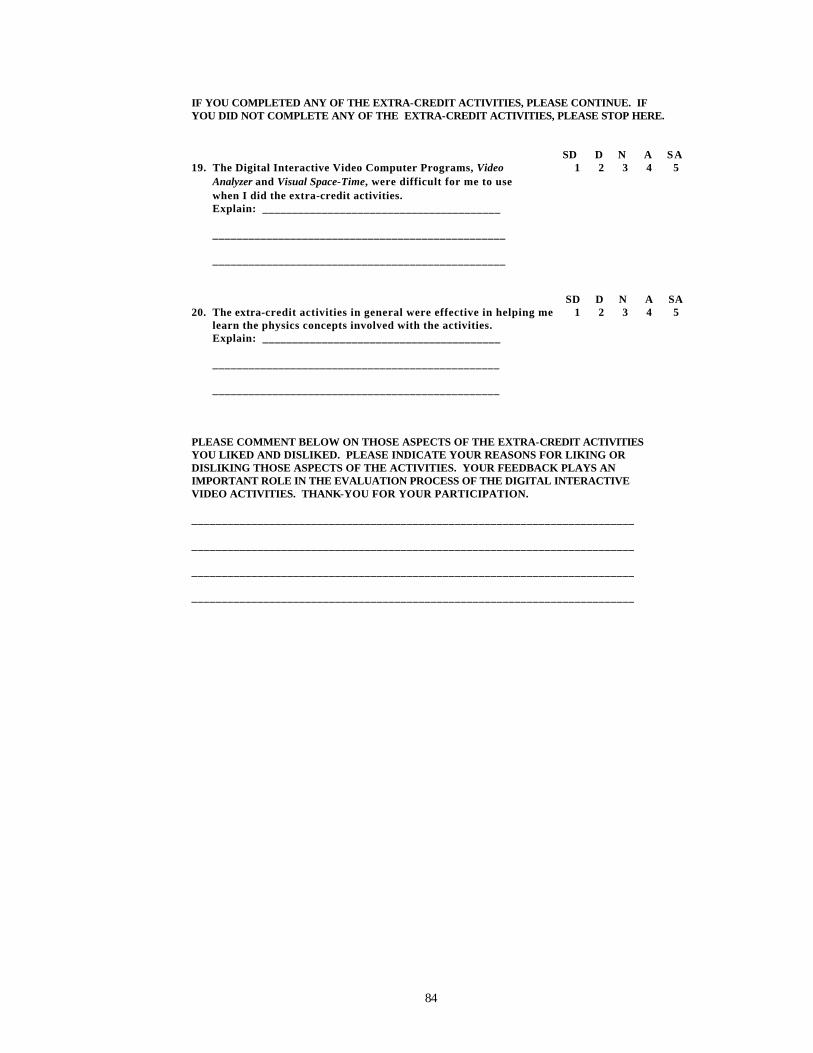
84
IF YOU COMPLETED ANY OF THE EXTRA-CREDIT ACTIVITIES, PLEASE CONTINUE. IF YOU DID NOT COMPLETE ANY OF THE EXTRA-CREDIT ACTIVITIES, PLEASE STOP HERE. SD D N A SA 19. The Digital Interactive Video Computer Programs, Video 1 2 3 4 5 Analyzer and Visual Space-Time, were difficult for me to use when I did the extra-credit activities. Explain: ________________________________________ _________________________________________________ _________________________________________________ SD D N A SA 20. The extra-credit activities in general were effective in helping me 1 2 3 4 5 learn the physics concepts involved with the activities. Explain: ________________________________________ ________________________________________________ ________________________________________________ PLEASE COMMENT BELOW ON THOSE ASPECTS OF THE EXTRA-CREDIT ACTIVITIES YOU LIKED AND DISLIKED. PLEASE INDICATE YOUR REASONS FOR LIKING OR DISLIKING THOSE ASPECTS OF THE ACTIVITIES. YOUR FEEDBACK PLAYS AN IMPORTANT ROLE IN THE EVALUATION PROCESS OF THE DIGITAL INTERACTIVE VIDEO ACTIVITIES. THANK-YOU FOR YOUR PARTICIPATION. __________________________________________________________________________ __________________________________________________________________________ __________________________________________________________________________ __________________________________________________________________________
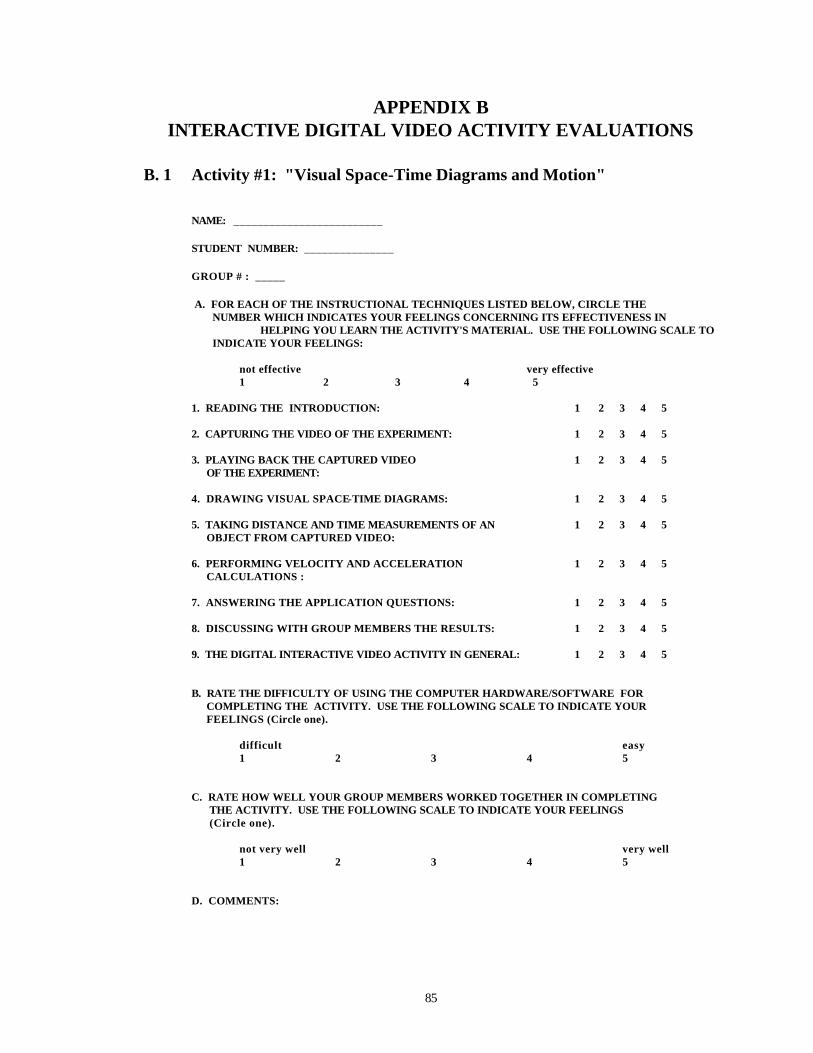
85
APPENDIX B INTERACTIVE DIGITAL VIDEO ACTIVITY EVALUATIONS
B. 1 Activity #1: "Visual Space-Time Diagrams and Motion" NAME: _________________________ STUDENT NUMBER: _______________ GROUP # : _____ A. FOR EACH OF THE INSTRUCTIONAL TECHNIQUES LISTED BELOW, CIRCLE THE NUMBER WHICH INDICATES YOUR FEELINGS CONCERNING ITS EFFECTIVENESS IN HELPING YOU LEARN THE ACTIVITY'S MATERIAL. USE THE FOLLOWING SCALE TO INDICATE YOUR FEELINGS: not effective very effective 1 2 3 4 5 1. READING THE INTRODUCTION: 1 2 3 4 5 2. CAPTURING THE VIDEO OF THE EXPERIMENT: 1 2 3 4 5 3. PLAYING BACK THE CAPTURED VIDEO 1 2 3 4 5 OF THE EXPERIMENT: 4. DRAWING VISUAL SPACE-TIME DIAGRAMS: 1 2 3 4 5 5. TAKING DISTANCE AND TIME MEASUREMENTS OF AN 1 2 3 4 5 OBJECT FROM CAPTURED VIDEO: 6. PERFORMING VELOCITY AND ACCELERATION 1 2 3 4 5 CALCULATIONS : 7. ANSWERING THE APPLICATION QUESTIONS: 1 2 3 4 5 8. DISCUSSING WITH GROUP MEMBERS THE RESULTS: 1 2 3 4 5 9. THE DIGITAL INTERACTIVE VIDEO ACTIVITY IN GENERAL: 1 2 3 4 5 B. RATE THE DIFFICULTY OF USING THE COMPUTER HARDWARE/SOFTWARE FOR COMPLETING THE ACTIVITY. USE THE FOLLOWING SCALE TO INDICATE YOUR FEELINGS (Circle one). difficult easy 1 2 3 4 5 C. RATE HOW WELL YOUR GROUP MEMBERS WORKED TOGETHER IN COMPLETING THE ACTIVITY. USE THE FOLLOWING SCALE TO INDICATE YOUR FEELINGS (Circle one). not very well very well 1 2 3 4 5 D. COMMENTS:
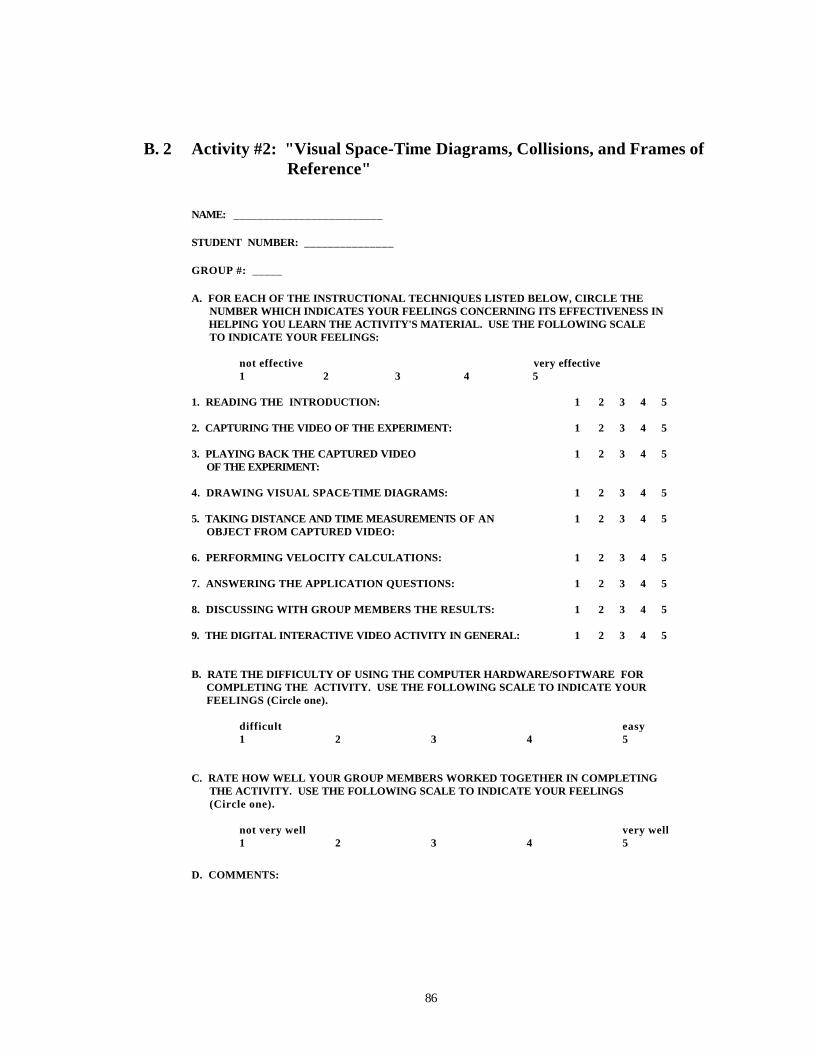
86
B. 2 Activity #2: "Visual Space-Time Diagrams, Collisions, and Frames of Reference" NAME: _________________________ STUDENT NUMBER: _______________ GROUP #: _____ A. FOR EACH OF THE INSTRUCTIONAL TECHNIQUES LISTED BELOW, CIRCLE THE NUMBER WHICH INDICATES YOUR FEELINGS CONCERNING ITS EFFECTIVENESS IN HELPING YOU LEARN THE ACTIVITY'S MATERIAL. USE THE FOLLOWING SCALE TO INDICATE YOUR FEELINGS: not effective very effective 1 2 3 4 5 1. READING THE INTRODUCTION: 1 2 3 4 5 2. CAPTURING THE VIDEO OF THE EXPERIMENT: 1 2 3 4 5 3. PLAYING BACK THE CAPTURED VIDEO 1 2 3 4 5 OF THE EXPERIMENT: 4. DRAWING VISUAL SPACE-TIME DIAGRAMS: 1 2 3 4 5 5. TAKING DISTANCE AND TIME MEASUREMENTS OF AN 1 2 3 4 5 OBJECT FROM CAPTURED VIDEO: 6. PERFORMING VELOCITY CALCULATIONS: 1 2 3 4 5 7. ANSWERING THE APPLICATION QUESTIONS: 1 2 3 4 5 8. DISCUSSING WITH GROUP MEMBERS THE RESULTS: 1 2 3 4 5 9. THE DIGITAL INTERACTIVE VIDEO ACTIVITY IN GENERAL: 1 2 3 4 5 B. RATE THE DIFFICULTY OF USING THE COMPUTER HARDWARE/SOFTWARE FOR COMPLETING THE ACTIVITY. USE THE FOLLOWING SCALE TO INDICATE YOUR FEELINGS (Circle one). difficult easy 1 2 3 4 5 C. RATE HOW WELL YOUR GROUP MEMBERS WORKED TOGETHER IN COMPLETING THE ACTIVITY. USE THE FOLLOWING SCALE TO INDICATE YOUR FEELINGS (Circle one). not very well very well 1 2 3 4 5
D. COMMENTS:
87
B. 3 Activity #3: "Video-Captured Collisions and Momentum Conservation" NAME: __________________________ STUDENT NUMBER: _______________ GROUP #: _____ A. FOR EACH OF THE INSTRUCTIONAL TECHNIQUES LISTED BELOW, CIRCLE THE NUMBER WHICH INDICATES YOUR FEELINGS CONCERNING ITS EFFECTIVENESS IN HELPING YOU LEARN THE ACTIVITY'S MATERIAL. USE THE FOLLOWING SCALE TO INDICATE YOUR FEELINGS: not effective very effective 1 2 3 4 5 1. READING THE INTRODUCTION: 1 2 3 4 5 2. PLAYING BACK THE CAPTURED VIDEO 1 2 3 4 5 OF THE EXPERIMENT: 3. TAKING DISTANCE AND TIME MEASUREMENTS OF AN 1 2 3 4 5 OBJECT FROM CAPTURED VIDEO: 4. PERFORMING VELOCITY AND MOMENTUM CALCULATIONS: 1 2 3 4 5 5. ANSWERING THE APPLICATION QUESTIONS: 1 2 3 4 5 6. DISCUSSING WITH GROUP MEMBERS THE RESULTS: 1 2 3 4 5 7. THE DIGITAL INTERACTIVE VIDEO ACTIVITY IN GENERAL: 1 2 3 4 5 B. RATE THE DIFFICULTY OF USING THE COMPUTER HARDWARE/SOFTWARE FOR COMPLETING THE ACTIVITY. USE THE FOLLOWING SCALE TO INDICATE YOUR FEELINGS (Circle one). difficult easy 1 2 3 4 5 C. RATE HOW WELL YOUR GROUP MEMBERS WORKED TOGETHER IN COMPLETING THE ACTIVITY. USE THE FOLLOWING SCALE TO INDICATE YOUR FEELINGS (Circle one). not very well very well 1 2 3 4 5 D. COMMENTS:
88
B. 4 Activity #4: "The Ball Drop and Frames of Reference" NAME: _________________________ STUDENT NUMBER: _______________ GROUP #: _____ A. FOR EACH OF THE INSTRUCTIONAL TECHNIQUES LISTED BELOW, CIRCLE THE NUMBER WHICH INDICATES YOUR FEELINGS CONCERNING ITS EFFECTIVENESS IN HELPING YOU LEARN THE ACTIVITY'S MATERIAL. USE THE FOLLOWING SCALE TO INDICATE YOUR FEELINGS: not effective very effective 1 2 3 4 5 1. READING THE INTRODUCTION: 1 2 3 4 5 2. CAPTURING THE VIDEO OF THE EXPERIMENT: 1 2 3 4 5 3. PLAYING BACK THE CAPTURED VIDEO 1 2 3 4 5 OF THE EXPERIMENT: 4. USING THE CAPTURED VIDEO TO TRACE THE MOTION 1 2 3 4 5 OF AN OBJECT. 5. DRAWING VISUAL SPACE-TIME DIAGRAMS: 1 2 3 4 5 6. ANSWERING THE APPLICATION QUESTIONS: 1 2 3 4 5 7. DISCUSSING WITH GROUP MEMBERS THE RESULTS: 1 2 3 4 5 8. THE DIGITAL INTERACTIVE VIDEO ACTIVITY IN GENERAL: 1 2 3 4 5 B. RATE THE DIFFICULTY OF USING THE COMPUTER HARDWARE/SOFTWARE FOR COMPLETING THE ACTIVITY. USE THE FOLLOWING SCALE TO INDICATE YOUR FEELINGS (Circle one). difficult easy 1 2 3 4 5 C. RATE HOW WELL YOUR GROUP MEMBERS WORKED TOGETHER IN COMPLETING THE ACTIVITY. USE THE FOLLOWING SCALE TO INDICATE YOUR FEELINGS (Circle one). not very well very well 1 2 3 4 5 D. COMMENTS:
89
B. 5 Activity #5: "The Human Cannonball" NAME: _________________________ STUDENT NUMBER: _______________ GROUP #: _____ A. FOR EACH OF THE INSTRUCTIONAL TECHNIQUES LISTED BELOW, CIRCLE THE NUMBER WHICH INDICATES YOUR FEELINGS CONCERNING ITS EFFECTIVENESS IN HELPING YOU LEARN THE ACTIVITY'S MATERIAL. USE THE FOLLOWING SCALE TO INDICATE YOUR FEELINGS: not effective very effective 1 2 3 4 5 1. READING THE INTRODUCTION: 1 2 3 4 5 2. CAPTURING THE VIDEO OF THE EXPERIMENT: 1 2 3 4 5 3. PLAYING BACK THE CAPTURED VIDEO 1 2 3 4 5 OF THE EXPERIMENT: 4. USING THE CAPTURED VIDEO TO TRACE THE MOTION 1 2 3 4 5 OF AN OBJECT. 5. PERFORMING THE RELATIVE POSITION EXERCISES (stickers) 1 2 3 4 5 6. ANSWERING THE APPLICATION QUESTIONS: 1 2 3 4 5 7. DISCUSSING WITH GROUP MEMBERS THE RESULTS: 1 2 3 4 5 8. THE DIGITAL INTERACTIVE VIDEO ACTIVITY IN GENERAL: 1 2 3 4 5 B. RATE THE DIFFICULTY OF USING THE COMPUTER HARDWARE/SOFTWARE FOR COMPLETING THE ACTIVITY. USE THE FOLLOWING SCALE TO INDICATE YOUR FEELINGS (Circle one). difficult easy 1 2 3 4 5 C. RATE HOW WELL YOUR GROUP MEMBERS WORKED TOGETHER IN COMPLETING THE ACTIVITY. USE THE FOLLOWING SCALE TO INDICATE YOUR FEELINGS (Circle one). not very well very well 1 2 3 4 5 D. COMMENTS:
90
APPENDIX C ACTIVITY-RELATED FINAL EXAM MULTIPLE-CHOICE QUESTIONS*
C. 1 Activity #1: "Visual Space-Time Diagrams and Motion" 1. A rabbit hops 12 meters in 5 seconds. What is his speed? (a) 0.4 m/sec (b) 2.4 m/sec (c) 17 m/sec (d) 60 m/sec (e) None of the above. _________________________ 2. From the information given in question 1 which did you calculate: an instantaneous speed or an average speed? (a) Instantaneous speed. (b) Average speed. (c) Both an instantaneous speed and an average speed. (d) Neither an instantaneous speed nor an average speed. (e) None of the above. _________________________ 3. Randy changes his speed from (8m/s, east) to (3m/s, east) in four seconds. What is the magnitude of his acceleration? (a) 44 (m/s)/s (b) 20 (m/s)/s (c) 2.75 (m/s)/s (d) 1.25 (m/s)/s (e) None of the above. ____________________________ 4. I am riding a bicycle which suddenly stops. In the reference frame of the Earth, how do I describe my motion? (a) I was thrown forward by the force of the stop. (b) I accelerate because of the bike's inertia. (c) A reaction force changes my motion. (d) I continue moving as I did. (e) None of the above. _________________________
C. 2 Activity #2: "Visual Space-Time Diagrams, Collisions, and Frames of Reference" 1. While standing next to a railroad track, a train comes toward you and moves past you. From the train's reference frame, how is that event described? (a) You are standing still and the train moves past you. (b) You move away from the train all the time. (c) You move toward the train all the time. (d) You move toward the train, pass it, and move away from it. (e) None of the above. _________________________
91
2. Kevin is hanging upside from a tree. I am standing on the ground. We both observe a collision. Which of use is in a reference frame from which momentum is conserved for this collision? (a) Me (b) Kevin (c) Both Kevin and I. (d) Neither Kevin nor I. (e) None of the above. __________________________ C. 3 Activity #3: "Video-Captured Collisions and Momentum Conservation" 1. Kim (Mass = 55 kg) is moving on very low friction roller skates at 2 m/s, east. She hits and sticks to a second 55 kg person who is moving at 2 m/s west. What is the speed of the two people together after the collision? (a) 4 m/s (b) 2 m/s (c) 1 m/s (d) 0 m/s (e) None of the above. __________________________ 2. Kevin is riding his wagon at 3 m/s, east. He has a mass of 30 kilograms. What is his momentum? (a) 10 kg m/s (b) (10 kg m/s, east) (c) 90 kg m/s (d) (90 kg m/s, east) (e) None of the above. __________________________ 3. A 1 kilogram toy train car is moving at 2 m/s, east. Another car with the same mass is moving toward the first one at 3 m/s, west. The two cars hit and stick together. Which direction do they move after the collision? (a) East (b) West (c) They stop moving. (d) Insufficient information is given to answer the question. (What else do you need? _______________ ) (e) None of the above. _________________________
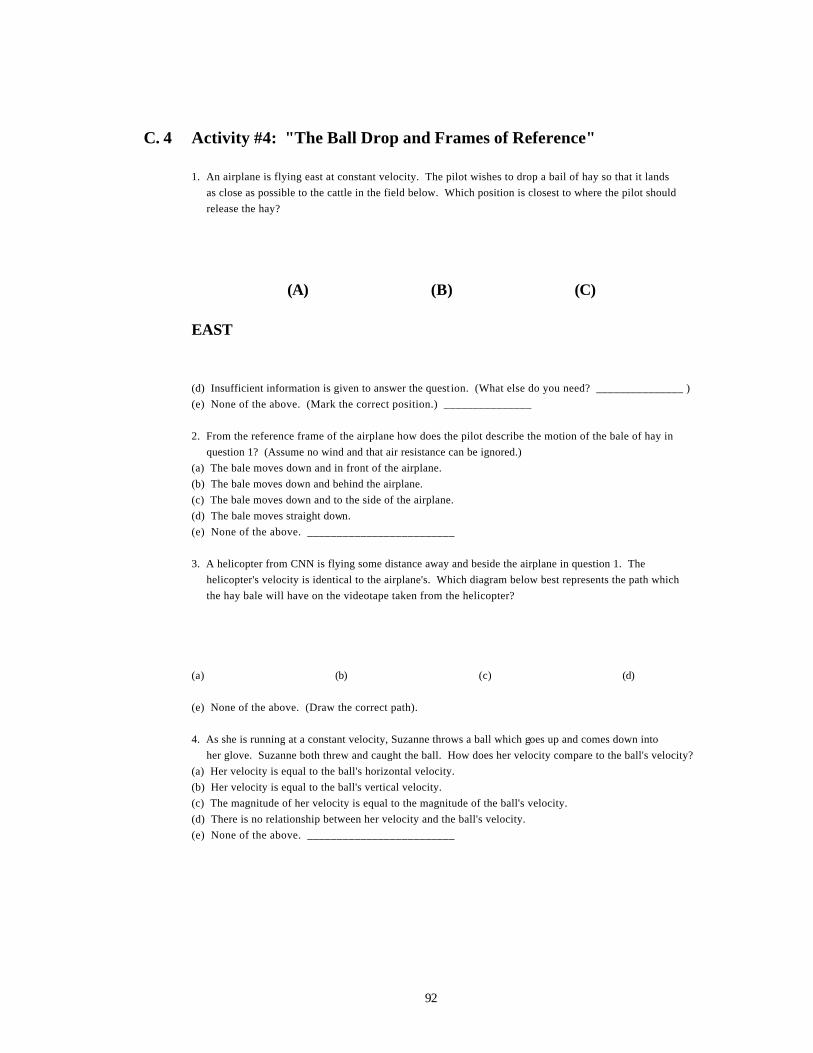
92
C. 4 Activity #4: "The Ball Drop and Frames of Reference" 1. An airplane is flying east at constant velocity. The pilot wishes to drop a bail of hay so that it lands as close as possible to the cattle in the field below. Which position is closest to where the pilot should release the hay?
(A) (B) (C) EAST (d) Insufficient information is given to answer the quest ion. (What else do you need? _______________ ) (e) None of the above. (Mark the correct position.) _______________ 2. From the reference frame of the airplane how does the pilot describe the motion of the bale of hay in question 1? (Assume no wind and that air resistance can be ignored.) (a) The bale moves down and in front of the airplane. (b) The bale moves down and behind the airplane. (c) The bale moves down and to the side of the airplane. (d) The bale moves straight down. (e) None of the above. _________________________ 3. A helicopter from CNN is flying some distance away and beside the airplane in question 1. The helicopter's velocity is identical to the airplane's. Which diagram below best represents the path which the hay bale will have on the videotape taken from the helicopter? (a) (b) (c) (d) (e) None of the above. (Draw the correct path). 4. As she is running at a constant velocity, Suzanne throws a ball which goes up and comes down into her glove. Suzanne both threw and caught the ball. How does her velocity compare to the ball's velocity? (a) Her velocity is equal to the ball's horizontal velocity. (b) Her velocity is equal to the ball's vertical velocity. (c) The magnitude of her velocity is equal to the magnitude of the ball's velocity. (d) There is no relationship between her velocity and the ball's velocity. (e) None of the above. _________________________
93
C.5 Activity #5: "The Human Cannonball"
1. While standing next to a railroad track, a train comes toward you and moves past you. From the train's reference frame, how is that event described? (a) You are standing still and the train moves past you. (b) You move away from the train all the time. (c) You move toward the train all the time. (d) You move toward the train, pass it, and move away from it. (e) None of the above. _________________________
* These multiple-choice questions and the remaining multiple-choice questions that made up the final for the Fall Semester, 1994 Concepts of Physics course were developed by Dean Zollman. These questions were used with his permission.
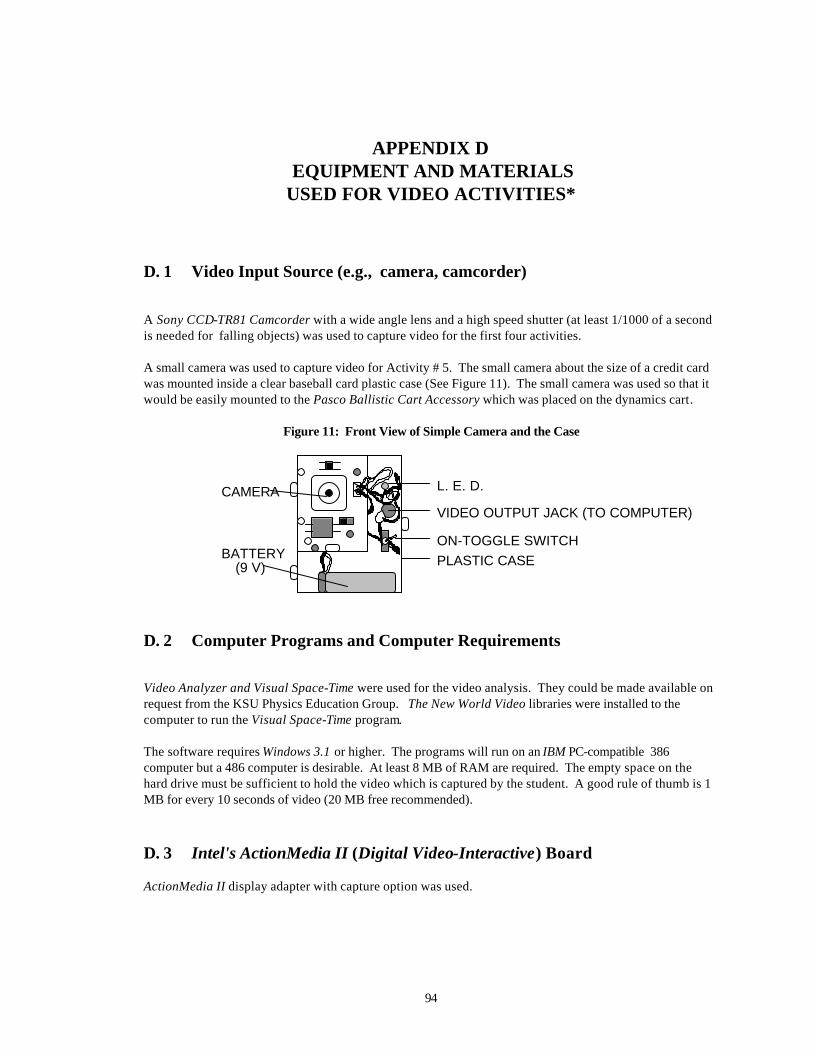
94
APPENDIX D EQUIPMENT AND MATERIALS USED FOR VIDEO ACTIVITIES*
D. 1 Video Input Source (e.g., camera, camcorder) A Sony CCD-TR81 Camcorder with a wide angle lens and a high speed shutter (at least 1/1000 of a second is needed for falling objects) was used to capture video for the first four activities. A small camera was used to capture video for Activity # 5. The small camera about the size of a credit card was mounted inside a clear baseball card plastic case (See Figure 11). The small camera was used so that it would be easily mounted to the Pasco Ballistic Cart Accessory which was placed on the dynamics cart .
Figure 11: Front View of Simple Camera and the Case
CAMERA
ON-TOGGLE SWITCH
VIDEO OUTPUT JACK (TO COMPUTER)
L. E. D.
BATTERY(9 V) PLASTIC CASE
D. 2 Computer Programs and Computer Requirements Video Analyzer and Visual Space-Time were used for the video analysis. They could be made available on request from the KSU Physics Education Group. The New World Video libraries were installed to the computer to run the Visual Space-Time program. The software requires Windows 3.1 or higher. The programs will run on an IBM PC-compatible 386 computer but a 486 computer is desirable. At least 8 MB of RAM are required. The empty space on the hard drive must be sufficient to hold the video which is captured by the student. A good rule of thumb is 1 MB for every 10 seconds of video (20 MB free recommended). D. 3 Intel's ActionMedia II (Digital Video-Interactive) Board ActionMedia II display adapter with capture option was used.
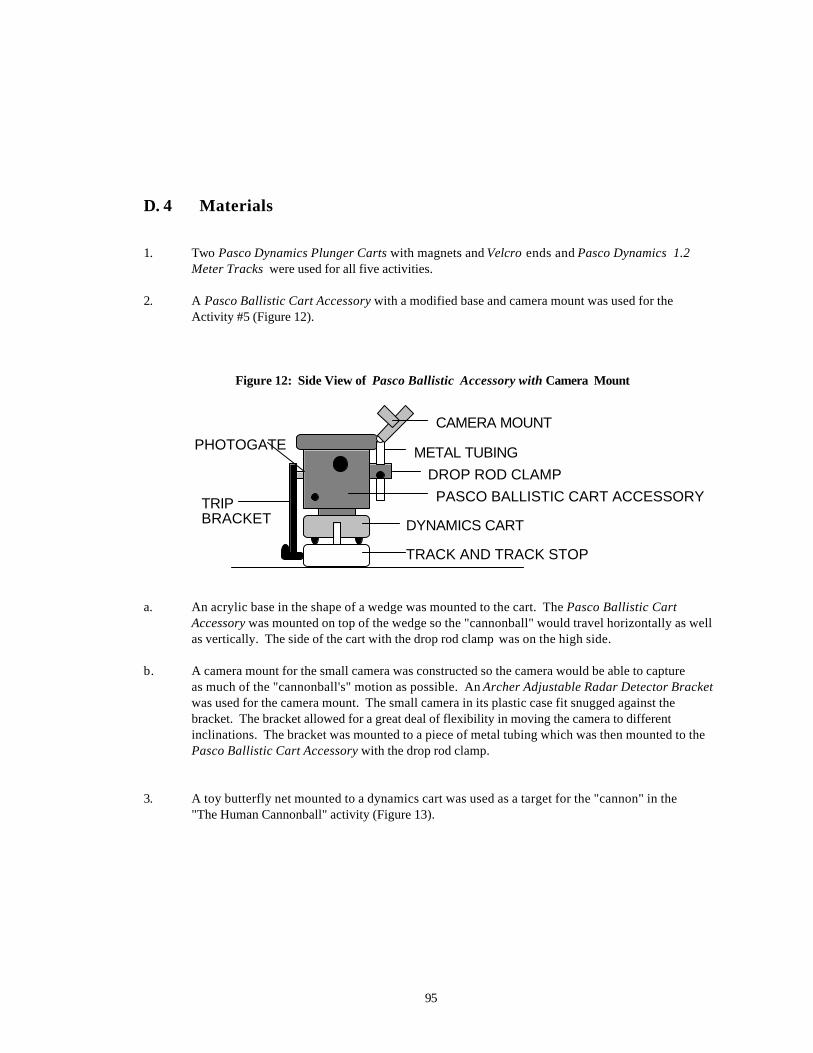
95
D. 4 Materials 1. Two Pasco Dynamics Plunger Carts with magnets and Velcro ends and Pasco Dynamics 1.2 Meter Tracks were used for all five activities. 2. A Pasco Ballistic Cart Accessory with a modified base and camera mount was used for the Activity #5 (Figure 12).
Figure 12: Side View of Pasco Ballistic Accessory with Camera Mount
DYNAMICS CART
TRACK AND TRACK STOP
DROP ROD CLAMP
TRIPBRACKET
PHOTOGATECAMERA MOUNT
METAL TUBING
PASCO BALLISTIC CART ACCESSORY
a. An acrylic base in the shape of a wedge was mounted to the cart. The Pasco Ballistic Cart Accessory was mounted on top of the wedge so the "cannonball" would travel horizontally as well as vertically. The side of the cart with the drop rod clamp was on the high side. b. A camera mount for the small camera was constructed so the camera would be able to capture as much of the "cannonball's" motion as possible. An Archer Adjustable Radar Detector Bracket was used for the camera mount. The small camera in its plastic case fit snugged against the bracket. The bracket allowed for a great deal of flexibility in moving the camera to different inclinations. The bracket was mounted to a piece of metal tubing which was then mounted to the Pasco Ballistic Cart Accessory with the drop rod clamp. 3. A toy butterfly net mounted to a dynamics cart was used as a target for the "cannon" in the "The Human Cannonball" activity (Figure 13).
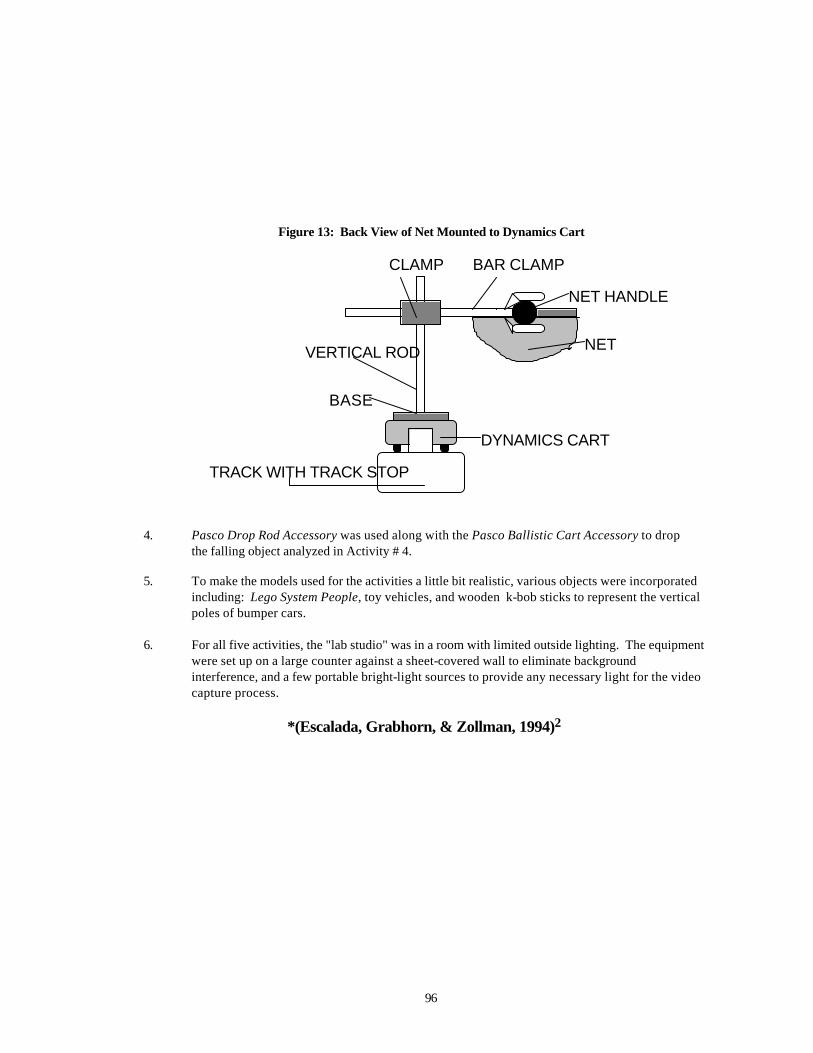
96
Figure 13: Back View of Net Mounted to Dynamics Cart
TRACK WITH TRACK STOP
DYNAMICS CART
BASE
VERTICAL ROD NET
NET HANDLE
CLAMP BAR CLAMP
4. Pasco Drop Rod Accessory was used along with the Pasco Ballistic Cart Accessory to drop the falling object analyzed in Activity # 4. 5. To make the models used for the activities a little bit realistic, various objects were incorporated including: Lego System People, toy vehicles, and wooden k-bob sticks to represent the vertical poles of bumper cars. 6. For all five activities, the "lab studio" was in a room with limited outside lighting. The equipment were set up on a large counter against a sheet-covered wall to eliminate background interference, and a few portable bright-light sources to provide any necessary light for the video capture process. *(Escalada, Grabhorn, & Zollman, 1994)2