Embed Size (px)
DESCRIPTION
AN INVESTIGATION OF THE WORKLOAD AND JOB SATISFACTION OFNORTH CAROLINA’S SPECIAL EDUCATION DIRECTORSA CAPSTONE RESEARCH PROJECTJennifer Brown Cash
Citation preview
AN INVESTIGATION OF THE WORKLOAD AND JOB SATISFACTION OF
NORTH CAROLINA’S SPECIAL EDUCATION DIRECTORS
A CAPSTONE RESEARCH PROJECT
Submitted to the Faculty
in partial fulfillment of the requirements
for the degree of
DOCTOR OF EDUCATION IN EDUCATIONAL LEADERSHIP
Wingate University School of Graduate and Continuing Education
By
Jennifer Brown Cash
Wingate University
Matthews Campus
Matthews, NC
Official Graduation August/2013

All rights reserved
INFORMATION TO ALL USERSThe quality of this reproduction is dependent upon the quality of the copy submitted.
In the unlikely event that the author did not send a complete manuscriptand there are missing pages, these will be noted. Also, if material had to be removed,
a note will indicate the deletion.
Microform Edition © ProQuest LLC.All rights reserved. This work is protected against
unauthorized copying under Title 17, United States Code
ProQuest LLC.789 East Eisenhower Parkway
P.O. Box 1346Ann Arbor, MI 48106 - 1346
UMI 3591766
Published by ProQuest LLC (2013). Copyright in the Dissertation held by the Author.
UMI Number: 3591766
ii

iii
© Copyright 2013 Jennifer Brown Cash
All Rights Reserved. Wingate University School of Graduate and Continuing Education has
permission to reproduce and disseminate this document in any form by any means for
purposes chosen by the University, including, without limitation, preservation and
instruction.
iv
ABSTRACT
AN INVESTIGATION OF THE WORKLOAD AND JOB SATISFACTION OF
NORTH CAROLINA’S SPECIAL EDUCATION DIRECTORS
Jennifer Brown Cash
Wingate University School of Graduate and Continuing Education
Chair: Dr. Cynthia Compton
Keywords: special education directors, workload, job satisfaction, special education
administration
The purpose of this mixed methods research study was to investigate employee characteristics,
workload, and job satisfaction of special education directors employed by local education
agencies in North Carolina (N=115). This study illuminates the complex nature of this
leadership role and identifies factors influencing the job satisfaction among this population of
special education directors. While these leaders have many years of experience in public
education, the majority report fewer than five years of experience in special education
administration. Findings identified these administrators have an immense workload that often
requires reporting to work early, staying late, and/or working on weekends to fulfill job duties.
While findings showed these leaders derive satisfaction when they apply strategic and
instructional leadership, collaborate with stakeholders, and put forth efforts to improve outcomes
for children with disabilities, this group has ambivalence toward their jobs. Areas of greatest
dissatisfaction with regard to special education administration included demands from the state
and local education agency, scarcity of resources, addressing conflict, and inadequate salaries.
Findings of this study support earlier studies in that special education administration is inundated
with turnover. Attrition is likely to continue until state and local education agencies take steps to
improve the working conditions of special education administrators.
v
VITAE
Jennifer Brown Cash
PERSONAL
Birthplace: Ft. Belvoir, Virginia, USA, 1964
EDUCATION
B.A. Journalism, University of North Carolina, Chapel Hill, NC, 1986
M.A. in Education, East Carolina University, Greenville, NC, 1991
Add-on Licensure in School Administration and Supervision, East Carolina University,
Greenville, NC, 1996
Ed.S. in Educational Administration, Wingate University, Matthews, NC, 2011
Ed.S in Educational Administration, Appalachian State University, Boone, NC, 2009
Ed.D. in Educational Leadership, Wingate University, Matthews, NC, graduation August 2013
CERTIFICATION AND LICENSES
K-6 Elementary Education, 1986 Mentor, 1989
K-12 Principal, 1996 Curriculum & Instruction Specialist, 1996
Exceptional Children Program Administrator, 2005 Superintendent, 2009
EMPLOYMENT
2011 – Current: Regional Special Education Consultant in partnership with NC Dept. of Public
Instruction and the University at North Carolina at Charlotte, NC
2006 – 2011: Exceptional Children Program Director, Newton-Conover City Schools, Newton,
NC
2003 – 2006: Principal, Person Co. Schools, Roxboro, NC; Iredell-Statesville Schools,
Statesville, NC; and Enola School, Morganton, NC
2000 – 2003: Assistant Principal of Little River Elementary School, Durham Public Schools,
Durham, NC
1986 – 2000: Teacher, assistant principal, and Curriculum Director, Onslow County Schools,
Jacksonville, NC
MEMBERSHIPS
Council for Exceptional Children (national and state)
Council for the Administrators of Special Education Administrators (national and state)
North Carolina Association of School Administrators
Association for Supervision and Curriculum Development

vi
DEDICATION
This work is dedicated to my husband, Michael, the love of my life and best friend. The
fulfillment of this educational accomplishment would not have been possible without his
unwavering love, support, guidance, humor, and wisdom. Thank you, Michael, for believing in
me! You will always be the joy in my heart and my Blue Skies (Betts, 1972):
Walk along the river, sweet lullaby, it just keeps on flowing.
It don’t worry ’bout where it’s going, no, no.
Don’t fly, mister blue bird, I’m just walking down the road.
Early morning sunshine tells me all I need to know.
Chorus
You’re my blue sky, you’re my sunny day.
Lord, you know it makes me high when you turn your love my way,
Turn your love my way.
Good old Sunday morning, bells are ringing everywhere.
Going to Carolina, it won’t be long and I’ll be there.
Chorus (track eight)
vii
ACKNOWLEDGEMENTS
Recognition is due to several individuals at Wingate University who have supported me
throughout this Educational Leadership Doctoral Program experience: Dr. Cynthia Compton,
Assistant Professor of Education and Capstone Committee Chair; Dr. Lloyd Wimberley, Director
of Graduate Programs, Associate Professor, and second reader; and Dr. Chris Cobitz, Assistant
Professor. Recognition is also due to Dr. Ric Vandett, Executive Director of the Southwest
Education Alliance, who serves as sponsor of this research and third reader. I greatly appreciate
their efforts, guidance, countless hours of reading and editing, and words of encouragement.
Thank you for pushing me to strive for excellence.
Recognition is also due to the special education directors who participated in study. The
fulfillment of this project would not have been possible without their participation. Thank you
for your leadership and dedication to children with disabilities.
viii
Table of Contents
Page
Chapter I: Introduction ……………………………………………………………………………1
Background………………………………………………………………………………..1
Theoretical Framework……………………………………………………………………5
Statement of the Problem………………………………………………………………...11
Purpose of Study…………………………………………………………………………13
Research Questions………………………………………………………………………13
Limitations, Delimitations, and Design Controls………………………………………..14
Definition of Terms………………………………………………………………………16
Summary…………………………………………………………………………………19
Chapter II: Review of the Literature……………………………………………………………..21
Early Landscape of Special Education in the United States……………………………..21
Catalysts of Change……………………………………………………...………………22
Turning the Tide – Landmark Court Cases and Federal Legislation…………………….24
Mandates for Transformational Change…………………………………………….…...27
Special Education Administration and Supervision…………………………….……….36
Studies of State Credentials of Special Education Directors……………………….……39
NC Credentials for Special Education Administrators……………….…………….……41
Early Supervision of Special Education Programs…………………….………….……..42
Studies to Identify Competencies of Special Education Directors………….…….……..43
National Competencies Defined by the Council for Exceptional Children…………….47
ix
Page
Studies to Assess Workload of Special Education Administrators…………….…….….48
Other Factors Affecting Workload in Special Education Administration….……………53
Job Satisfaction………………………..…………………………………………………63
Organizational Management Practices and Job Satisfaction…………………………….66
Job Satisfaction in Special Education……………………………………………………73
Measures of Job Satisfaction…………………………………………………………….80
Summary…………………………………………………………………………………82
Chapter III: Methodology……………………………………………………………………......83
Research Questions………………………………………………………………………83
Description of Participants and Sampling Procedures…………………………………...84
Mixed Methods Research Design………………………………………………………..86
Instrumentation…………………………………………………………………………..88
Methods of Data Collection………………………………...……………………………91
Methods of Data Analysis…………………………………………………………….….91
Summary…………………………………………………………………………………93
Chapter IV: Results………………………………………………………………………………94
Research Questions………………………………………………………………………96
Question 1: Employee Characteristics…………………………………………………...97
Question 2: Workload at the District Level…………………………………………….106
Question 3: Job Satisfaction of Special Education Directors…………………………..113
Question 4: Relationships among Variables……………………………………………121
Question 5: Job Satisfaction, Dissatisfaction, and Needed Supports……….………….132
x
Page
Summary………………………………………………………………………………..152
Chapter V: Discussion and Recommendations………...……………………………………….153
Statement of the Problem……………………………………………………………….154
Methodology……………………………………………………………………………156
Research Questions……………………………………………………………………..158
Results and Discussion………………………………………………………………....159
Characteristics of Special Education Directors in North Carolina……………………..159
What is the Workload of Special Education Directors?..................................................168
What is the Level of Job Satisfaction among Special Education Directors?...................174
What Relationships Exist among Variables and Job Satisfaction?.................................178
Recommendations………………………………………………………………………180
Conclusion………………………………………………………………………….......183
References………………………………………………………………………………………184
Appendices…………………..…………………………………………………….……………215
Appendix A: Wingate University Research Review Board Approval……………….…216
Appendix B: Consent to Use Job Satisfaction Survey (Spector, 1994)………….……..218
Appendix C: Wingate University Consent Letter/Description of Study……………….221
Appendix D: Special Education Director Survey………………………………………223
Appendix E: Open-Ended Question One – Areas of Satisfaction……….……………..238
Appendix F: Open-Ended Question Two – Areas of Dissatisfaction………….……….245
Appendix G: Open-Ended Question Three – Needed Supports………………….…….252
xi
List of Tables and Figures
Page
Table 1: 2012-2013 Central Office Administrators’ Salary Ranges……..…………………….73
Table 2: Gender and Age…………………………………………………………………...……98
Figure 1: Years of Experience in Education among NC Special Education Directors…………100
Figure 2: Years of Experience as Special Education Director………………………………….101
Table 3: Salary and District Size………………………………….……………………………104
Table 4: Salary and Child Count………………………………………………………………..105
Figure 3: Programs of Supervision Assigned to NC Special Education Directors……………..107
Table 5: Percentage of Time Special Education Directors Devote to Programs of
Supervision…………………………………………………………………....………..108
Figure 4: Supervisory Duties of Special Education Directors………………………………….109
Figure 5: NC Special Education Directors’ Weekly Hours Worked…………...………………112
Table 6: JSS Normative Mean Values for Education/Elementary and Secondary
Population………………………………………………………………………………116
Table 7: JSS Mean Subscale Values of NC Special Education Directors in Comparison
to JSS Normative Mean Subscale Values of Elementary/Secondary
Education Population………………...…………………………………………………120
Table 8: T test: Two-Sample Assuming Unequal Variance (JSS Mean Subscales of
Special Education Directors and JSS Normative Mean Subscales of
Elementary/Secondary Education Population………………………………………….121
Table 9: NC Special Education Directors’ JSS Mean Values of Years of Experience
in Public Education and Their JSS Mean Values of Years of Experience in
xii
Page
Special Education Administration………………...……………………………………124
Table 10: T-test: JSS Mean Values of NC Special Education Directors’ Years of
Experience in Public Education and JSS Mean Values of Years of Experience
in Special Education Administration…..………………………………….……………124
Table 11: Pearson Product-Moment Correlation (Two-Tailed) Using JSS Subscale
Scores and Overall JSS Scores of NC Special Education Directors..……….…………127
Figure 6: Scatter Plot of JSS Contingent Rewards Subscale Scores and JSS Scores of
NC Special Education Directors..………………………………………………………128
Figure 7: Scatter Plot of JSS Operational Conditions Subscale Scores and JSS Scores of
NC Special Education Directors.……………….………………………………………128
Table 12: Logistic Regression – Categorical X (Independent) Variable and Continuous Y
(Dependent) Variables of Job Satisfaction…………………………………………….130
Figure 8: Years of Experience in Public Education and Years of Experience in Special
Education Administration among NC Special Education Directors…………………..165
Chapter I
INTRODUCTION
Today’s special education administrators find themselves working in a complex field
where they are confronted with a myriad of legal issues, must assure compliance of state and
federal regulations, and are challenged by increased fiscal and educational accountability. These
leaders have a great responsibility in that they must implement instructional programs and
related services across all schools in the district in order to meet the individual functional and
academic needs of children with disabilities age 3-21 who are enrolled. In addition, these leaders
must forge collaborative and meaningful relationships with stakeholders to ensure that the
organization works collectively to meet the needs of students. Upon reflection of the evolution of
special education in the United States, this researcher concludes that special education
administrators will continue to face a high level of accountability. As a result, this research
study on the employee characteristics, workload, and job satisfaction of North Carolina’s special
education directors was born.
This introductory chapter provides the background of this research study and the
theoretical framework on which it is based. The chapter presents a statement of the problem,
purpose of the study, research questions for investigation, limitations and delimitations, design
controls, and definition of key terms. Through this investigation, the employee characteristics,
workload, and job satisfaction of North Carolina’s special education directors will be identified,
as well as their attitudes and perceptions of this leadership role.
Background
According to the Condition of the Schools 2012 report (Aud, Hussar, Johnson, Kena,
Roth, Manning, Wang, & Zhang, 2012), 49.5 million children were enrolled in public schools in
2
the 2010-11 school year; of these students, 6.5 million were identified as having a disability. Of
this group, almost 40% were identified as specific learning disabled, 20% speech/language
impaired, and 10% other health impaired (Aud et al., 2012). Students with intellectual
disabilities, autism, and emotional disturbances totaled to almost 20% collectively (Aud et al.,
2012). Students identified as multiple impaired, hearing impaired, orthopedically impaired,
visually impaired, traumatic brain injured, or deaf-blind totaled to 10% of this population (Aud et
al., 2012). According to this report, 95% of identified children with disabilities received their
education in typical schools (Aud et al., 2012). Almost 60% of these school age children were
educated in the general education environment with nondisabled peers at least 80% of the
instructional day, a significant increase when compared to 33% in 1990 and 47% in 2000 (Aud et
al., 2012).
The North Carolina Department of Public Instruction (NCDPI) reported 1,486,524
children enrolled in public schools in the 2012-2013 school year (NCDPI, 2013). Of these
students, 190,098 are children with disabilities age 3-21 who receive special education (NCDPI,
2012). Of these, 18,665 are age 3-5 and 171,494 are age 6-21 (NCDPI, 2012). Of those in the
school age subgroup, 59.7% receive instruction in the general education setting with typical
peers at least 80% of the school day (NCDPI, 2012). In a review of state education data from
2005 – 2012, trends show an increase in the percentage of students with disabilities educated in a
general education setting with typical peers the majority of the school day (NCDPI, 2012). This
is a laudable achievement as children with disabilities are experiencing greater access to the
general education environment and curricula in recent years (Daugherty, 2001; Engle, 1991;
Katsiyannis, Yell, & Bradley, 2001; Martin, Martin, & Terman, 1996; McHatton, Glenn, &
Gordon, 2007; U.S. Department of Education, 2010; Winzer, 1993). In light of these facts and

3
since school personnel must collaborate to ensure that all children succeed at school, the
leadership of the special education director is paramount to this effort.
Today’s special education directors find themselves in an expansive leadership role that
is entangled with administration, special education, and general education. These administrators
are responsible for the supervision of the district’s special education program, personnel, and
resources to ensure that children with disabilities receive a free appropriate public education
(FAPE) in a least restrictive environment (LRE) that meets their needs (Crockett, 2007). Special
education directors must necessarily possess the knowledge and skills to apply the provisions of
federal laws, such as the Section 504 of the Rehabilitation Act of 1973 (29 U.S.C. 794), the
Individuals with Disabilities Education Improvement Act of 2004 (20 U.S.C. 1400), and the
Americans with Disabilities Act of 1990 (42 U.S.C. 12101-12213) that guarantee the educational
rights of children with disabilities (U.S. Department of Education, 2010).
The administrative expectations of special education directors are further expanded as
North Carolina public school personnel are charged with implementing the mission of the North
Carolina State Board of Education (2006):
Every public school student will graduate from high school, globally competitive for
work and postsecondary education and prepared for life in the 21st Century.
(NCSBOE, 2006, http://stateboard.ncpublicschools.gov/about-sbe/sbe-goals)
Additional challenges for the special education director remain in the Elementary and Secondary
Education/No Child Left Behind Act of 2001 (20 U.S.C.A. 6301) that mandates children with
disabilities learn the same curricula as typical peers and participate in statewide achievement
testing (NCLB, 2001; U.S. Department of Education, 2008). Collectively, the state’s public
4
school workforce must meet these standards. Special education directors must lead collaboration
across the district to ensure that this mission is accomplished for all children.
Lashley and Boscardin (2003) summarized that effective special education leaders
establish systems and partnerships with stakeholders to facilitate organizational change.
Through collaboration, the special education director identifies strengths and gaps of the
district’s programs and services, makes adjustments, aligns resources, and secures personnel to
meet students’ needs (Lashley & Boscardin, 2003). The leader’s application of an improvement
cycle focused on outcomes is essential to establishing a vision for the success of all children
(Boscardin, 2007; Seltzer, 2011; Wiggins & McTighe, 2007). This cycle mirrors the tenets of
the Schooling by Design model where leaders and stakeholders focus on results and work
backward to accomplish the mission, thus preparing children for the real world (Wiggins &
McTighe, 2007). Components of this model are:
1) Clear focus on the long-term mission of schooling…enabling learners to transfer their
learning with understanding to worthy tasks and in their habits of mind;
2) A curriculum and assessment framework that honors the mission and long term goals
of academic programs;
3) A set of principles of learning and instructional design, based on research and wisdom
of the profession, to which all decisions about pedagogy and planning are referred;
4) Structures, policies, job descriptions, practices, and use of resources consistent with
the mission and learning principles;
5) An overall strategy of reform…a feedback and adjustment system to enable teachers
and students to change course en route, as needed, to achieve desired results;
5
6) A set of tactics linked to the strategy and process of planning the key work of
schooling and reform backward from the mission and desired results (p. 1-2).
Today’s special education directors have a monumental task in the workplace as they
must implement numerous laws and regulations regarding special education services and fulfill
other duties such as human resource and fiscal management, recruitment and training of staff,
and completion of numerous reports as required by the education agency (Begley, 1982; Carter
2011; Edmondson, 2001). Literature suggests that the field of special education is filled with
great stress, conflict, and at times, litigation; therefore, leaders must apply knowledge of
education laws, dispute resolution, and due process as challenges occur (Boscardin, Weir, &
Kusek, 2010; Lashley & Boscardin, 2003; Valesky & Hirth, 1992). While special education
administration is rewarding, these leaders in this field report a demanding workload coupled with
emotional strain and exhaustion (Begley, 1982; Carter, 2011; Edmonson, 2001).
Theoretical Framework
A review of the literature in special education administration and organizational
management led to the identification of a theoretical basis for this study of the workload and job
satisfaction of North Carolina’s special education directors. The literature identified the origin of
special education leadership in the United States, federal laws that protect the rights of
individuals with disabilities, credentials of special education administrators, workload associated
with this role, and job satisfaction. Two frames emerge and serve as the foundation for this
study – a legal framework and a psychological/organizational management framework.
Legal Framework
The legal framework for this research study is grounded in many federal laws that protect the
rights of individuals with disabilities:
6
- The Civil Rights Act of 1964 (78 Stat 241) – addressed voting rights, nondiscrimination,
desegregation, provided equal employment opportunities, and identified court procedures
(Bureau of National Affairs, 1964);
- The Elementary and Secondary Education Act of 1965 (ESEA) (20 U.S.C. 6301) -
provided funds to improve the education of disadvantaged children (Cross, 2005);
- Title IX of the Education Amendments of 1972 (20 U.S.C.A. 1681-1688) - prohibited
gender discrimination (U.S. Department of Justice, 2009);
- Section 504 of the Rehabilitation Act of 1973 (29 U.S.C. 794) – guaranteed a free
appropriate public education in the least restrictive environment to children with
disabilities and established a broad definition of a person with a disability (USED, 2010);
- The Education for All Handicapped Children Act (EAHCA) of 1975 (20 U.S.C. 1400) -
ordered states to develop policies to guarantee an education to children with disabilities
in the least restrictive environment and required an individual education program for a
child with a disability (EAHCA, 1975; USED, 2010);
- Individuals with Disabilities Education Act of 1990, PL 101-476 (20 U.S.C. 1400) and
subsequent amendments IDEA 1997, PL 105-17 (20 U.S.C. 1400) – expanded disability
categories to include autism, traumatic brain injury, and included transition plans for
students with disabilities age 16 and older (IDEA 1990; IDEA 1997; USED, 2010);
- The Americans with Disabilities Act of 1990 (42 U.S.C. 12101-12213) - protected the
rights of individuals with disabilities, guaranteed equal employment opportunities, and
access to facilities/services (USED Office for Civil Rights, 2006);
- Elementary and Secondary Education/No Child Left Behind Act (NCLB) of 2001
(20.U.S.C.A. 6301) – expanded educational opportunities for students, held education
7
agencies accountable for students’ academic achievement, and required teachers to meet
highly qualified licensure provisions (NCLB, 2001; USED, 2001; USED, 2010);
- Individuals with Disabilities Education Improvement Act of 2004 or PL 108-446 (20
U.S.C. 1400) – reinforced earlier special education laws, expanded dispute resolution,
and increased accountability through the provision of special education programs to
address the needs of the total child (Apling & Jones, 2005; IDEA 2004).
The provisions of these laws are discussed in Chapter II to illustrate the depth of special
education regulations to which education agencies must comply. These federal statutes are the
foundation of special education in the United States and translate to increased accountability
among individuals and organizations to protect the rights of individuals with disabilities.
Psychological/Organizational Management Framework
The theoretical framework of job satisfaction is anchored in the fields of psychology and
organizational management to explore individuals’ motivation and actions; these frameworks
rest in content and process theories of motivation (Helander, Landauer, & Prabhu, 1997; Locke,
1976; Lunenburg, 2011; Miner, 2007; Pate, 1987; Schermerhorn, Hunt, & Osborn, 2005;
Robbins, 2009; Steers, Mowday, & Shapiro, 2004). Content theories of motivation attempt to
identify what causes an individual to act and include his or her values, needs, goals, and intrinsic
motivators (Alderfer, 1969 & 1972; Alderfer & Smith, 1982; Herlander et al., 1997; Locke 1976;
Lunenburg, 2011; McClelland, 1965 & 1988; Pate, 1987; Schermerhorn, Hunt, & Osborn, 2005;
Steers et al., 2004). Process theories, on the other hand, examine how motivation occurs,
including extrinsic influences and relationships among variables (Helander, et al., 1997; Locke,
1976; Lunenburg, 2011; Pate, 1987; Schermerhorn, Hunt, & Osborn, 2005; Steers et al., 2004).
8
Content theories of motivation. Literature identified four content theories of motivation
used in psychology and organizational management to explain human behavior – the hierarchy
of needs theory by Maslow (1943), the two-factor theory of job satisfaction by Herzberg,
Mausner, and Snyderman (1959), the existence relatedness growth (ERG) theory by Alderfer
(1969 & 1972), and human needs theory by McClelland (1965 & 1988). Maslow posited that
human behavior is driven by a hierarchy of five needs – survival, safety needs, a desire to
affiliate with others, self-esteem, and self-actualization whereby one strives to reach personal
goals (Maslow, 1943; Maslow, 1954). According to Maslow (1954), individuals first seek to
fulfill deficiency or lower-level needs, followed by growth needs. As individuals fulfill primary
needs, they advance to the next level among the hierarchy; however, Maslow explained that
some needs may occur simultaneously while not often (Maslow, 1943; Maslow, 1954).
In the two-factor theory of job satisfaction, satisfying and dissatisfying factors influence
personal satisfaction and motivation (Herzberg et al., 1959). Satisfying factors, or motivators,
may be intrinsic and include workplace recognition, promotion, perceptions of one’s job
performance, and assigned duties (Herzberg et al., 1959). Dissatisfying variables, or hygiene,
are factors such as workplace regulations, salaries, and supervision of employees (Herzberg et
al., 1959). In this two-factor theory, motivators influenced satisfaction while hygiene factors led
to dissatisfaction (Herzberg et al., 1959). Interestingly, researchers found there were no
guarantees of improved job performance inherent in greater job satisfaction (Herzberg et al.,
1959; Wahba & Bridwell, 1976).
Alderfer’s (1969 & 1972) ERG theory presented a contemporary approach of Maslow’s
hierarchy of needs. The ERG theory identified three primary needs, rather than five, that drive
human behavior – existence, relatedness, and growth (Alderfer, 1969; Alderfer, 1972). Existence
9
needs encompass physical and safety needs and include income, employee benefits, and
environmental conditions that may affect one’s health and well-being (Alderfer, 1969; Alderfer,
1972). Relatedness needs target one’s desire to have mutual relationships where thoughts and
emotions are exchanged and accepted (Alderfer, 1969; Alderfer, 1972). Growth needs are
motivated by one’s desire to set goals, develop knowledge and skills, and put forth personal
effort to attain such goals (Alderfer, 1969; Alderfer, 1972).
The ERG theory accepts Maslow’s hierarchy of needs as it incorporates its five primary
needs into the domains of expectancy, relatedness, and growth (Alderfer, 1969; Alderfer, 1972).
However, the ERG theory posits flexibility for individuals to ascend or descend the hierarchy as
needs are met or not met (Alderfer, 1969; Alderfer, 1972). Frustration regression may occur, as
identified in the ERG theory, when one’s desire for a higher-level need is not attained over an
extended time (Alderfer, 1969; Alderfer, 1972). Due to one’s failure to meet a higher-level need
over a long time period, an individual will seek to fulfill lower needs (Alderfer, 1969; Alderfer,
1972). For example, individuals whose growth needs are not met will attempt to satisfy concrete
and/or relatedness needs (Alderfer, 1969; Alderfer, 1972).
McClelland’s (1965 & 1988) human needs theory posits that individuals have a desire for
achievement, affiliation, and power which motivates behavior. Central to achievement needs are
an individual’s desire to problem solve, apply knowledge and skills, and fulfill tasks with the
acknowledgement that there may be risks associated with such efforts (McClelland, 1965;
McClelland, 1988). Affiliation needs are those whereby individuals seek meaningful
relationships (McClelland, 1965; McClelland, 1988). Power needs, conversely, are driven by an
individual’s desire to control others and their behavior (McClelland, 1965; McClelland, 1988).
10
Unlike the theories of Maslow and Alderfer, the human needs theory posits that one of
these needs - achievement, affiliation, or power - will supersede other needs and dominate
behavior (McClelland, 1965; McClelland, 1988). McClelland (1988) concluded that individuals
in managerial roles have a greater desire for power whereas entrepreneurs have a greater desire
for achievement. McClelland (1965 &1988) viewed achievement and power positively as these
needs may lead to improved performance. Affiliation was seen negatively as it may interfere
with objectivity (McClelland, 1965; McClelland, 1988).
Process theories of motivation. Well-known process theories that examine how
individuals experience workplace motivation are the expectancy theory by Vroom (1964) and the
equity theory by Adams (1963) (Adams, 1965; Helander et al., 1997; Locke, 1976; Lunenburg,
2011; Steers et al., 2004; Vroom, 1964). Psychological factors and cognition anchors the
expectancy theory as employees’ beliefs, expectations, and needs drive behavior (Vroom, 1964;
Lunenberg, 2011). Key components of the expectancy theory include:
Expectancy – the employee expects goals to be fulfilled based on job performance;
Instrumentality – the employee expects rewards with high performance;
Valence – the employee values rewards (Vroom, 1964).
Vroom (1964) concluded that workers’ motivation will be high if expectancy, instrumentality,
and valence are also high.
Adams’ equity theory is a well-respected process theory that assesses employees’
perceptions and job satisfaction (Adams, 1963; Bolino & Turnley, 2008; Coldwell & Perumal,
2007; Cosier & Dalton, 1983; Moorehead & Griffin, 1998). The equity theory posits that
employees compare their treatment in the workplace to others in similar roles (Adams, 1963). Its
central components are:
11
Inputs – employees’ perceptions of their performance and contributions;
Outputs – employees’ perceptions of organizational rewards and punishments;
Referent others – individuals whom employees identify in the workplace;
Equity evaluations – employees’ comparisons of their treatment in the workplace to
others to determine fairness (Bolino & Turnley, 2007; Adams, 1963).
If employees determine their personal inputs/outputs are like others in the organization,
satisfaction and maintenance of job performance occur; if imbalance exists, employees seek
changes to bring parity (Adams, 1963; Bolino & Turnley, 2008; Coldwell & Perumal, 2007;
Moorehead & Griffin, 1998). These changes may manifest themselves as improved or
diminished work performance, conflict, or attrition (Adams, 1963; Bolino & Turnley, 2008;
Coldwell & Perumal, 2007; Moorehead & Griffin, 1998).
Research in workplace satisfaction is grounded on well-known content and process
theories of motivation aimed to investigate the driving forces of human behavior. Content and
process theories of motivation have implications across all organizations as employees’ needs,
values, experiences, and perceptions influence workplace performance and satisfaction (Adams,
1963; Alderfer, 1969 & 1972; Herzberg et al., 1959; Maslow, 1943; McClelland, 1965 & 1988;
Vroom, 1964). These federal laws and psychological/organizational management frames of
content and process theories of motivation provide the foundation for this study on the workload
and job satisfaction of North Carolina’s special education directors.
Statement of the Problem
Since the 1970s, special education administration has undergone many changes due to the
passage and/or reauthorization of special education laws of which districts are accountable,
coupled with increased rigor and academic standards. While literature documents these changes
12
and their impact on special education teachers and related service providers, there are few studies
on the working conditions of special education administrators. Available studies suggest special
education administration suffers from stress, attrition, and a lack of qualified personnel. Marro
and Kohl’s (1972) study of special education directors showed that 40% of these leaders had
fewer than three years of experience in the role, and 37% ranged from four to nine years of
experience. Arick and Krug’s (1993) study of special education directors showed that 10% of
districts reported a vacancy in the special education director role, and over half anticipated a
vacancy in this position in the next few years. This study also showed that almost one-half of
special education directors did not hold the required credential as determined by their state
education agency (Arick & Krug, 1993). DiPierro (2003) reported that New Jersey’s special
education directors had an extreme workload.
Tate’s (2009) study shed light on North Carolina with regard to attrition in special
education leadership and pointed out that one-third of special education directors were new to
this position. These directors perceived attrition in special education administration to be caused
by workplace dissatisfaction, lack of support, and excessive paperwork (Tate, 2009).
Satisfaction was perceived to be caused by support from supervisors and other special education
administrators, job security, salary, and support from other personnel (Tate, 2009).
This capstone project on the workload and job satisfaction of North Carolina’s special
education directors contributes to the field of special education administration in many ways.
This study investigates employee characteristics, workload, and job satisfaction of special
education directors in the state. Additionally, findings will identify areas of satisfaction and
dissatisfaction among these leaders and give insight into their perceptions regarding what
supports may be needed to improve job satisfaction. This study is vitally important to education
13
agencies as they recruit, induct, and retain individuals into this leadership role. Literature
suggests that effective organizations routinely evaluate the working conditions of employees and
make adjustments to improve motivation and performance (Hackman & Oldham, 1976;
Harrison, Killion, & Mitchell, 1989; Kim, 2002; Vroom, 1964). This researcher is hopeful that
this study will be a catalyst among education leaders to examine workplace conditions and make
adjustments to attract and retain well-qualified individuals into special education administration.
Purpose of the Study
The purpose of this capstone project is to contribute to the body of research in special
education administration by identifying the workload and job satisfaction of North Carolina’s
special education directors as these variables influence the recruitment and retention of
individuals into this supervisory role. Analysis of data will determine whether any relationships
exist between employee characteristics, workload, and job satisfaction of these leaders. Lastly,
the study will identify perceptions of these leaders with regard to job satisfaction/dissatisfaction,
and whether any supports are needed to improve the satisfaction of individuals in this role.
Research Questions
To gain an understanding of the workload and job satisfaction among North Carolina’s
special education directors, the following research questions were investigated:
1) What are the employee characteristics of North Carolina’s special education directors
(age, gender, level of education, years of experience in the position, etc.)?
2) What is the workload of special education directors at the district level?
3) What is the level of job satisfaction among special education directors?
4) What relationships exist, if any, between employee characteristics, workload, and job
satisfaction of special education directors?
14
5) What are the perceptions of special education directors in regard to job
satisfaction/dissatisfaction and any needed supports to improve job satisfaction?
A thorough investigation of these areas will attempt to identify perceptions and attitudes of North
Carolina’s special education directors with regard to their workload and job satisfaction.
Limitations, Delimitations, and Design Controls
Limitations
While this study will provide a comprehensive investigation of the workload and job
satisfaction of North Carolina’s special education directors, the project has limitations for
consideration. It is noted that the sample is small as there are only 115 special education
directors in North Carolina. Due to this small sample, findings of this study should not be
generalized to a larger population of special education directors or other states. While online
surveys are convenient to administer, these instruments may yield a low response due to faulty
email addresses of participants or issues with technology, according to Sills and Song (2002) (as
cited in Creswell, 2011). A further limitation is that the survey is cross-sectional in design as it
collects data at one point in time, rather than across many time periods, to measure attitudes and
perceptions of the sample (Creswell, 2008; Creswell, 2011).
An additional limitation is that the researcher developed three of four sections of the
survey that the sample will complete: section one, employee characteristics; section two,
workload; and section four, open-ended questions. This researcher developed these sections of
the survey based on prior knowledge of the special education director role. Section three of the
survey is comprised of a research-validated job satisfaction instrument known as the Job
Satisfaction Survey (JSS) created by psychologist Dr. Paul Spector (1994) and which the
researcher has permission to incorporate into the study (Appendix B). The JSS may pose a
15
limitation as it is a copyrighted instrument whose contents cannot be altered (Spector, 1994).
Bias must also be considered as the researcher of this capstone project has prior experience as a
special education director in North Carolina. Furthermore, use of qualitative data produces
further limitation as data are subject to interpretation by the researcher (Creswell, 2008;
Creswell, 2011). To increase its overall reliability and validity, the special education survey was
piloted among five individuals with knowledge of special education administration and/or human
resources management. Based on their feedback, the researcher revised the survey accordingly.
Delimitations
The researcher will exclude North Carolina’s charter schools in this study as these
educational units may employ personnel who lack the appropriate licensure credentials. The
state’s charter school law 115C-238.29F allows charter schools to employ non-certified staff
under the condition that at least three-fourths of teachers in grades K-5, one-half in grades 6-8,
and one half in grades 9-12 hold current teaching credentials (North Carolina Office of Charter
Schools, 2013). Local education agencies, conversely, must employ individuals who hold the
required licensure for their position (NCDPI Licensure Division, 2013). Special education
directors of local education agencies must meet the following credentials – a master’s degree in
special education or school administration, an additional nine hours of graduate-level courses in
special education, and a passing score on the Praxis Educational Leadership examination
(NCDPI Exceptional Children Division, 2010; NCDPI Licensure Division, 2013).
Design Controls
The researcher will use a mixed methods research design to investigate the employee
characteristics, workload, and job satisfaction of North Carolina’s special education directors
through deployment of an online survey. A mixed methods research design allows the
16
researcher to collect quantitative and qualitative data to investigate a topic of study and
corroborate evidence from multiple sources of information, known as triangulation (Creswell,
2008; Creswell, 2011). The researcher will collect participants’ work email addresses from
school district web sites as this information is readily available to the general public. Using this
information, the researcher will deploy the online survey to the sample using Qualtrics, a web-
based program for survey research. This survey will remain open for 30 days to give participants
sufficient time to respond. Weekly reminders will be sent to participants who have not yet
responded to the survey in an effort to increase participation. Upon closure, survey data will be
analyzed to investigate the research questions of the study.
Definition of Terms
For the purpose of this capstone project the following terms and definitions will be used:
Ambivalence – a simultaneous and contradictory attitude, as attraction and repulsion, toward an
object, person, or action (Merriam-Webster, Inc., 2013)
Child find – policies and procedures implemented by the school district to locate and evaluate
children who may require special education services (NCDPI, 2010)
Child with a disability – a child having autism, deaf-blindness, deafness, developmental delay,
hearing impairment, intellectual disability, multiple disabilities, orthopedic impairment, other
health impairment, serious emotional disability, specific learning disability, speech/language
impairment, traumatic brain injury, and/or visual impairment who meets eligibility for such a
disability and requires special education (NCDPI, 2010)
Core academic subjects – English, language arts, mathematics, science, foreign languages, civics
and government, economics, arts, history, and geography (NCDPI, 2010; IDEA 2004)
17
Education for All Handicapped Act of 1975 (EAHCA) – the cornerstone federal law that
mandates education agencies to provide for the educational needs of children with disabilities
age 3-21 enrolled in the district (20 U.S.C. 1401)
Free appropriate public education (FAPE) - refers to special education and related services that
are provided to a child with a disability without cost (NCDPI, 2010; IDEA 2004)
Highly qualified teacher – a teacher who holds the state’s required licensure credentials for the
subject area(s) which he or she is assigned to teach (IDEA 2004; NCDPI, 2010)
Individuals with Disabilities Education Improvement Act of 2004 – the current federal law
containing provisions to protect the educational rights of children with disabilities age 3-21 (20
U.S.C. 1400)
Individual Education Program (IEP) – a written statement for a child with a disability that
describes his or her special education and related services, including academic and functional
goals that are developed, reviewed, and revised annually (IDEA, 2004; NCDPI, 2010)
IEP Team – a team consisting of a local education agency representative, the child’s special
education teacher, the child’s general education teacher, the child’s parent(s), an individual who
can interpret evaluations, the child with a disability (when appropriate), and others such as
related services providers, who are responsible for developing, reviewing, and revising the
child’s IEP (IDEA 2004; NCDPI, 2010)
Local education agency (LEA) – a public Board of Education or other public authority
sanctioned by the state to serve as the administrative unit for its public schools (NCDPI, 2010)
Job satisfaction - an affective or emotional response to one’s job causing satisfaction or
dissatisfaction (Spector, 1997)
18
Job Satisfaction Survey (JSS) - a research-validated instrument to assess employees’ job
satisfaction among nine facets: salary, benefits, workplace advancement opportunities,
supervision, rewards, workplace procedures, co-workers, the nature of one’s work, and
communication (Spector, 1985)
Least restrictive environment (LRE) – the general education environment where a child with a
disability should be educated with typical peers (IDEA 2004; NCDPI, 2010)
Motivation – the process for stimulating an individual to act to reach a desired outcome
(Montana & Charnov, 2008)
School day – any day where children attend school to receive instruction (NCDPI, 2010)
State education agency (SEA) –the State Board of Education responsible for the
supervision of its public schools (NCDPI, 2010)
Related services – services to assist a child with a disability so that he or she benefits from
special education (includes transportation, speech/language, audiology, interpreting, counseling,
physical/occupational therapy, recreation services, rehabilitation counseling, orientation and
mobility services, health services, parent education, and training) (IDEA 2004; NCDPI, 2010)
Special education – specially designed instruction provided to a child with a disability that
includes instruction in the classroom, home, and other settings (IDEA 2004; NCDPI, 2010)
Special education director or special education administrator – an individual employed by the
local education agency who is responsible for the supervision and management of the special
education program and services for children with disabilities age 3-21 who are enrolled (NCDPI,
2010)
19
Specially designed instruction – adjustments made to the content, methods, or delivery of
instruction to meet the educational needs of a child with a disability to ensure he or she has
access to curricula to the same extent as typical peers (IDEA 2004; NCDPI, 2010)
Workload – the physical and cognitive costs sustained by a worker to accomplish a task at a
particular performance level, influenced by task requirements, circumstances under which it is to
be performed, and his or her skills, behaviors, and perceptions (Hart & Staveland, 1988, p. 140)
Summary
Special education directors are in a dynamic leadership role as these individuals interact
with all areas within the school district to meet the needs of children with disabilities age 3-21
who are enrolled. Areas of interaction include general and special education, curricula, student
services, transportation, child nutrition, statewide testing, human resources, finance, etc. These
leaders must possess in-depth knowledge of special education laws, regulations, and set forth
policies and procedures to ensure these provisions are instituted across the district. Added
responsibilities include problems solving with parents, staff, and IEP Teams. With the myriad of
skills these leaders must possess and apply to be successful in their role, it is critical to identify
their working conditions and job satisfaction.
This research study follows the traditional five chapter format for theses and dissertations
and adheres to APA 6th
edition guidelines for publication. Chapter I identifies background
information, a theoretical framework, the problem statement, purpose of the study, and research
questions. Chapter II reviews the literature from the field of special education administration,
organizational management, and studies relating to the areas of investigation. Chapter III
describes the research methodology, sample, survey instrument, types of data to be collected, and
statistical measures that will be used to analyze data. Chapter IV presents the findings of the

20
study using descriptive and inferential statistics. Chapter V provides discussion of the results
and recommendations for further research in the field of special education administration.
References will be provided along with appendices and tables.

21
Chapter II
REVIEW OF THE LITERATURE
A detailed review of available literature provides a vast array of foundational knowledge
regarding special education programs and how they formally came into existence in U.S. public
schools. This literature review explores relevant landmark court cases and federal laws which
have shaped the role of special education directors. Additionally, the literature will examine
studies of the role of the special education director, essential competencies associated with this
position, and licensure requirements of individuals serving in special education administration.
The workload and job satisfaction of individuals in the workplace will be investigated as these
variables influence recruitment and retention. Finally, the literature review will examine steps
education agencies take to recruit and retain highly qualified individuals into special education
and leadership roles.
The Early Landscape of Special Education in the United States
The Tenth Amendment of the U.S. Constitution is the dividing line between federal and
state powers. Its core principle is that powers not granted to the United States are vested to
states; as a result, each state determines its education program for children (Yell, Rogers, &
Rogers, 1998). In the 1800s states acknowledged the value of educating children and enacted
compulsory attendance laws; by 1918, all states mandated attendance at school (Yell et al.,
1998). By the early to mid-1800s, many states formed asylums and institutions to address the
needs of individuals with disabilities, among which were the Asylum for the Deaf in
Connecticut, schools for the deaf in Kentucky and Ohio, the New England Asylum for the Blind,
and Institution for the Idiotic and Feebleminded of Massachusetts (Myhill, 2010; Osgood, 2008;
Winzer, 1993). By the late 1920s, a number of state education agencies formed separate schools
22
for children with visual impairments, hearing loss, and/or cognitive impairments (Myhill, 2010;
Winzer, 1993). While this movement was illustrative of an organizational approach to take
measures to educate children with disabilities, segregated practices continued (Osgood, 2008;
Winzer, 1993).
While compulsory attendance laws were enacted in all states by 1918, some state and
local education agencies barred the admission of children with disabilities as evidenced by
several court cases. In the 1893 case of Watson v. City of Cambridge (32 N.E. 864), the
Massachusetts Supreme Court determined the district might exclude children with cognitive
disabilities, while the 1919 case, Beattie v. Board of Education (172 N.W. 153), determined that
children with disabilities in Wisconsin were not required to attend school until the fifth grade
(Yell et al., 1998). In 1934, the Cuyahoga Appeals Court supported the exclusion of children
with disabilities in the case of Board of Education of Cleveland Heights v. State of Ohio (47
Ohio App. 417), and in Department of Public Welfare v. Haas (154 N.E. 2nd
265) of 1958,
Illinois children with cognitive impairments were not held to compulsory attendance (Yell et al.,
1998).
Catalysts of Change
The works of leading European researchers and educators, such as cognitive theorist Jean
Piaget, psychologist Semenovich Vygotsky, and educators Jean-Jacques Rousseau and Johann
Pestalozzi of the 1920s and 1930s, greatly influenced general and special education programs of
the United States. Piaget’s theory of cognitive development identified pivotal stages through
which children progress as they mature and interact with their environment; therefore,
instructional practices should consider child development (Cook & Cook, 2006; Gargiuolo &
Kilgo, 2011). Vygotsky’s socio-cultural theory of cognitive development was based on the
23
premise that culture, interactions, and language acquisition shaped cognition (Cooke & Cook,
2006). Vygotsky concluded that children should have challenging learning activities with adult
support (Cook & Cook, 2006). Both Rousseau and Pestalozzi were proponents of early
childhood education and hands-on instruction, with Rousseau advocating for non-structured
learning while Pestalozzi preferred adult supervision (Gargiulo & Kilgo, 2011). The idea of
educating the whole child came about through Pestalozzi’s leadership in education, and he was
an early advocate for parental involvement in education (Gargiulo & Kilgo, 2011). These
individuals influenced education in the U.S. by promoting stimulating learning in appropriate
environments for all children.
National efforts of the 1900s drew attention to the educational needs of children with
disabilities. The 1910 White House Conference of Children established remedial education
programs for children which increased enrollments of children with disabilities in public schools,
even though many were educated in segregated environments (Winzer, 1993; Yell et al., 1998).
The 1930 White House Conference on Child Health and Protection led to the Children’s Charter
that recommended the early identification of children with disabilities, a precursor to child find
requirements in the Education for All Handicapped Children Act (EAHCA) of 1975 (20 U.S.C.
1401), and the educational needs of such individuals (Winzer, 1993).
Between the 1920s and 1940s, advocacy groups formed to promote the rights of parents
and children with disabilities. The Council for Exceptional Children, a national organization for
individuals with disabilities and special education, formed in 1922 (Yell et al., 1998; Winzer,
1993). Between the 1940s and early 1960s, organizations such as the United Cerebral Palsy
Association, Inc., the National Association for Retarded Citizens, and National Society for
24
Autistic Children drew attention to discriminatory practices against individuals with disabilities
(Yell et al., 1998; Winzer, 1993).
Turning the Tide – Landmark Court Cases and Legislation
The U.S. Constitution did not address education in its provisions, and, as a result, states
determined their own education program for children. Prior to the U.S. Supreme Court case
Brown v. Board of Education of Topeka, Kansas (347 U.S. 483) of 1954, public schools
excluded many children with disabilities or educated them in segregated settings (Katsiyannis,
Yell, & Bradley, 2001; Martin, Martin, & Terman, 1996; U.S. Department of Education, 2010).
The 1954 Brown v. Board of Education of Topeka, Kansas (347 U.S. 483) case brought
transformation to public schools as it was the catalyst to end segregation. This suit established
the principle that all individuals have a right to education (Esteves & Rao, 2008; Katsiyannis et
al., 2001). Although the courts ordered desegregation, public schools excluded many disabled
children (Engle, 1991). It was not until two class action court cases came about was there
sweeping change to the landscape of educating children with disabilities – Pennsylvania
Association of Retarded Citizens (PARC) v. Commonwealth of Pennsylvania (334 F. Supp. 1257)
of 1971 and Mills v. Board of Education of the District of Columbia (348 F. Supp. 866) of 1972
(Engle, 1991; Daugherty, 2001; Yell et al., 1998).
In 1971, the Pennsylvania Association for Retarded Citizens (PARC) v. Commonwealth
of Pennsylvania (334 F Supp 1257) established precedents in special education that play a
significant role in public education (Daugherty, 2001). This PARC initiated litigation on behalf
of a group of disabled children who were barred from enrolling in the schools of Pennsylvania.
The plaintiffs alleged that excluding these students in education violated their rights under the
due process and equal protection provisions of the Fourteenth Amendment of the U.S.
25
Constitution (Daugherty, 2001; Engle, 1991; Yell et al., 1998). The court protected the rights of
these children and concluded that disabled children were entitled to a public education equivalent
to the education provided to non-disabled children (Daugherty, 2001; Engle, 1991; Martin et al.,
1996; Yell et al., 1998).
Reynolds and Fletcher-Janzen (2007) asserted that PARC v. Commonwealth of
Pennsylvania (334 F. Supp. 1257) established precedents that remain in special education
through the Individuals with Disabilities Education Improvement Act or IDEA 2004 (20 U.S.C.
1400). The provisions of IDEA 2004 mandated state and local education agencies to:
1) provide a free appropriate public education to children with disabilities regardless of
the nature or extent of the disability;
2) educate children with disabilities with non-disabled peers to the extent possible;
3) conduct an annual census to locate and serve children with disabilities;
4) eliminate school exclusionary practices including serial suspensions;
5) notify parents prior to an evaluation of their child to determine whether there is the
presence of a disability and prior to placement into a special education program;
6) establish procedures to meet due process requirements of the Fourteenth Amendment
should a dispute arise regarding the educational placement and program for a child
with a disability;
7) reevaluate a child with a disability on a systematic basis; and
8) pay private school tuition if a school refers a child with a disability to a private school
or cannot reasonably meet the needs of a child with a disability in a public setting
(Reynolds & Fletcher-Janzen, 2007, p. 1529).
26
In Mills v. Board of Education of the District of Columbia (348 F. Supp. 866) of 1972,
the U.S. district court determined the school system must educate all children who reside in its
region (Reynolds & Fletcher-Janzen, 2007). The plaintiffs charged that the district excluded
children with mental deficiencies, medical conditions, and misbehavior (Reynolds & Fletcher-
Janzen, 2007). The district’s rationale for prohibiting enrollment centered on insufficient funds,
a position rejected by the court (Reynolds & Fletcher-Janzen, 2007). The district was
subsequently ordered to educate these affected children, and the court directed the district to
notify the plaintiffs before implementing alternatives, indicating that plaintiffs may challenge
such decisions (Reynolds & Janzen, 2007). Finally, the court ordered the district to identify and
educate children with similar needs, thus establishing a class action lawsuit (Reynolds &
Fletcher-Janzen, 2007).
Similarly, the Mills v. Board of Education (348 F. Supp. 866) case established precedents
in special education regarding change in placement and mechanisms to protect the rights of
children with disabilities and their parents, key components of IDEA 2004 (Reynolds &
Fletcher-Janzen, 2007). This court ruling was significant in special education in that the Mills
decision (348 F. Supp. 866) established a free appropriate public education for children (FAPE)
with disabilities in a suitable environment (Reynolds & Fletcher-Janzen, 2007). Procedural
protections included timely notice to parents or guardians regarding proposals to change their
child’s individual education program (IEP), records access, a provision allowing parties to seek
legal advice, and annual review of the IEP (Martin et al., 1996; Reynolds & Fletcher-Janzen,
2007).
In the 1960s and 1970s, other federal laws transformed public schools of the U.S. as these
statutes were designed to protect the rights of individuals:

27
1) Civil Rights Act of 1964 (78 Stat 241)– addressed voting rights and desegregation,
established nondiscrimination in federal programs, provided equal opportunities for
employment, and identified court procedures (Bureau of National Affairs, 1964);
2) The Elementary and Secondary Education Act of 1965 (ESEA) (20 U.S.C. 6301) -
provided funds through grants to state education agencies to improve the education of
disadvantaged children (Cross, 2005);
3) Title IX of the Education Amendments of 1972 (20 U.S.C.A. 1681-1688) - prohibited
gender discrimination (U.S. Department of Justice, 2009);
4) Section 504 of the Rehabilitation Act of 1973 (29 U.S.C. 794) – guaranteed FAPE in
the least restrictive environment to children with disabilities and established a broad
definition of a person with a disability (U.S. Department of Education, 2010);
5) The Education for All Handicapped Children Act of 1975 (EAHCA) (20 U.S.C.
1401) - ordered states to develop policies to guarantee a FAPE to children with
disabilities in the least restrictive environment and required an IEP for a child with a
disability (U.S. Department of Education, 2010);
6) The Americans with Disabilities Act of 1990 (42 U.S.C. 12101-12213) - protected the
rights of individuals with disabilities and guaranteed equal opportunities in
employment, access to facilities, and other services (U.S. Department of Education
Office for Civil Rights, 2006).
Mandates for Transformational Change
The Education for All Handicapped Children Act of 1975
With the passage of the Education for All Handicapped Children Act of 1975 (EAHCA)
(20 U.S.C. 1401) known as PL 94-142, the law mandated state and local education agencies to
28
provide for the educational needs of children with disabilities. According to Engle (1991), the
law guaranteed the “educational rights of children with disabilities through the provision of a
free appropriate public education with emphasis on special education and related services
designed to meet their unique needs” (p. 173). The statute defined special education as “specially
designed instruction…at no cost to parents…including instruction in the classroom, instruction in
the home, instruction in hospitals and institutions, and other settings” (20 U.S.C. 1401(29)). The
act provided funds to state education agencies to assist them in meeting the needs of children
with disabilities, and in order to receive these revenues, state education agencies were required to
submit a plan to the Bureau of Education for the Handicapped describing its special education
policies (Yell et al., 1998). Upon receipt of federal funds, state education agencies accepted the
provisions of the EAHCA 1975 and entered into partnership with the government for the
education of children with disabilities (Katsiyannis et al., 2001; Yell et al., 1998).
The EAHCA of 1975 transformed school districts across the U.S. as these provisions
guaranteed the educational rights of children with disabilities. As summarized by Kirk,
Gallagher, Coleman, and Anastasiow (2012), this act mandated school districts to:
1) provide a free appropriate public education to children age 3-21 with disabilities;
2) provide an evaluation, using tests appropriate to the child’s culture and background,
prior to being placed into a special education program, with parental consent;
3) provide special education and related services to eligible children;
4) develop an Individual Education Program (IEP) for each child with a disability who
receives special education; the IEP must describe the child’s current performance,
educational goals, special education services to be provided, procedures for
evaluation, and must be reviewed annually;
29
5) educate children with disabilities in the least restrictive environment with non-
disabled peers to the extent possible;
6) establish legal due process procedures to ensure fairness of educational decisions; and
7) include parents in the development of their child’s IEP and ensure their right to access
their child’s educational records (p. 35).
This legislation required states and local education agencies to locate, identify, and
educate children with disabilities who reside in the district, a process known as “Child Find,” and
it established guidelines for the eligibility of special education and related services (Martin et al.,
1996). The EAHCA of 1975 did not guarantee full federal funding to state and local education
agencies for the education of children with disabilities as it was a shared responsibility (Martin et
al., 1996).
The 1990 Amendments – The Individuals with Disabilities Education Act
The revised EAHCA of 1990 further strengthened the educational rights of children with
disabilities and parents’ rights. Through its 1990 amendments, the act was named the Individuals
with Disabilities Education Act, or P.L. 101-476 (20 U.S.C. 1400), and established two other
eligibility categories for special education– autism and traumatic brain injury (Katsiyannis et al.,
1991). The amendments of 1990 required the IEP of children with disabilities age 16 and older
to include a transition plan with goals and activities to prepare them for postsecondary education,
the workplace, and independence (Apling & Jones, 2005; Katsiyannis et al., 2001).
The 1997 Amendments of the Individuals with Disabilities Education Act
IDEA 1990 was amended in 1997 to bolster the individual education program of children
with disabilities and the rights of parents. IDEA 1997 or P.L. 105-17 (20 U.S.C. 1400) clarified
the required members of the IEP Team responsible for making instructional decisions of a child
30
with a disability – the local education agency representative, a general education teacher of the
child, a special education teacher of the child, and the child’s parent(s) (Apling & Jones, 2005;
IDEA, 1997). The statute required parents of children with disabilities to be involved in the
development of their child’s IEP, a written plan that describes the child’s educational needs and
special education services to be provided (Gorn, 1997; IDEA, 1997; Katsiyannis et al., 2001).
The statute mandated that the IEP describe the child’s present level of performance, including
measurable annual goals and a statement regarding how the child’s progress will be reported to
parents (Apling & Jones, 2005; Katsiyannis et al., 2001). IDEA 1997 directed districts to invite
the child’s parents to IEP Team meetings through written notification, including any other
meetings whereby the district proposed to change the child’s education program (IDEA, 1997;
Katsiyannis et al., 2001). While the law encouraged parental involvement, the act authorized
IEP Teams to excuse members with notice and proceed with decisions regarding the IEP of child
with a disability after written invitations to involve the parent had been documented (Apling &
Jones, 2005; IDEA 1997; Katsiyannis et al., 2001). The law did not identify the number of
written notifications that must be sent to parents prior to the IEP meeting; however, the district
must maintain documentation of their efforts (IDEA, 1997; Katsiyannis et al., 2001). In
addition, IDEA 1997 added a process whereby parties may resolve disputes through mediation
(Apling & Jones, 2005).
IDEA 1997 protected the rights of children with disabilities in discipline matters and
required IEP Teams to consider interventions for children who experienced misbehaviors
(Katsiyannis et al., 2001). Such interventions included a behavior plan based on a functional
assessment, and both should be included in the IEP (IDEA 1997; Katsiyannis et al., 2001).
These provisions supported the authority of school personnel to discipline a child with a
31
disability in the same manner as non-disabled children, as long as a removal did not exceed 10
cumulative days (IDEA, 1997; Katsiyannis et al., 2001). When removals exceeded 10 days, the
district must conduct a manifestation determination to decide whether the incident was as a result
of the child’s disability or failure to deploy the IEP (IDEA 1997; Apling & Jones, 2005). In
cases of removal beyond 10 days, special education and related services must continue (Apling
& Jones, 2005; IDEA, 1997; Katsiyannis et al., 2001). Other provisions gave districts the right
to remove a child with a disability to an interim alternative educational setting (IAES) up to 45
days if weapons were involved or if the child’s placement endangered others (IDEA 1997;
Katsiyannis et al., 2001).
The Individuals with Disabilities Education Improvement Act of 2004
In 2004, IDEA 1997 was reauthorized and named the Individuals with Disabilities
Education Improvement Act, P.L. 108-446, (20 U.S.C. 1400). While its core principles
remained intact, IDEA 2004 made some changes:
1) required special education teachers to be highly qualified,
2) increased accountability of state and local education agencies,
3) gave flexibility with the use of federal special education funds,
4) added provisions to serve children with disabilities placed in private schools, and
5) expanded procedural safeguards (Apling & Jones, 2005).
Highly qualified special education teachers. To ensure that children with disabilities
received instruction from licensed personnel, IDEA 2004 required special education teachers to
be licensed, or highly qualified, in their respective teaching field. These teachers must hold a
bachelor’s degree and certification in their assigned special education teaching area whereas
temporary or provisional licenses were insufficient (Apling & Jones, 2005; IDEA 2004).
32
Provisions of this act required general and special education teachers of secondary
schools to meet the highly qualified standard as defined by IDEA 2004 and the ESEA/No Child
Left Behind Act (NCLB) of 2001 (20 U.S.C.A. 6301). According to these acts, a teacher of
record is one who delivers direct instruction to students in a core subject area; therefore, these
teachers must possess licensure in the subject area (Apling & Jones, 2005; IDEA 2004;
ESEA/NCLB, 2001). Core academic areas are English, language arts/reading, mathematics,
science, foreign languages, civics and government, economics, arts, history, and geography
(ESEA/NCLB, 2001). Special education teachers assigned to elementary schools were not held
to this core subject requirement as it was acknowledged that elementary curricula followed an
integrated approach (Apling & Jones, IDEA 2004; ESEA/NCLB, 2001). Special education
teachers of children with significant disabilities must possess a bachelor’s degree and licensure
for their respective teaching assignment; however, these teachers are exempt from the core
subject requirement if students are assessed by alternative standards (Apling & Jones, 2005;
IDEA 2004).
Increased accountability of state and local education agencies. IDEA 2004 expanded
state and local education accountability regarding academic achievement standards and outcomes
for children with disabilities. Annual academic performance goals and adequate yearly progress
targets were established under the ESEA/NCLB of 2001 whereby all schools and districts must
meet. IDEA 2004 mirrored ESEA/NCLB 2001 as it required state and local education agencies
to set performance goals for children with disabilities to the same extent as non-disabled children
and include these students in statewide testing to determine academic proficiency (IDEA, 2004).
The act further required local education agencies to include children with disabilities in district
33
wide assessments, provide test accommodations as stated on the IEP, and provide alternative
assessments (Apling & Jones, IDEA, 2004).
Flexibility with IDEA funds. IDEA 2004 gave flexibility to education agencies with the
use of its IDEA funds received through its special education appropriations. This
accommodation allowed state education agencies to reserve a share of its IDEA funds for
administrative expenses (Apling & Jones, 2005). Such expenses included monitoring of school
districts, investigations, and enforcement of sanctions to districts found in noncompliance of
IDEA 2004, while simultaneously requiring state education agencies to use mediation (Apling &
Jones, 2005; IDEA 2004). State education agencies established risk pool funds to assist districts
with unanticipated expenses of educating a child with great needs (Apling & Jones, 2005; IDEA,
2004). High-needs children with disabilities may require intensive special education services
such as nursing care, one-on-one assistance, mobility equipment, and/or augmentative or
assistive technology devices. Through IDEA 2004, the state education agency may earmark
10% of its special education funds designated for state expenses or up to 1.05 percent of its total
appropriation for risk pool (Apling & Jones, 2005; IDEA 2004).
IDEA 2004 instituted flexibility into local education agencies regarding the use of its
funds for coordinated early intervening services (CEIS). This provision allowed districts to use
up to 15% of its IDEA funds to provide CEIS to children not identified with a disability (IDEA,
2004). The intent of CEIS was to provide extra support to particular students in grades K-12,
with emphasis on grades K-3 (Apling & Jones, 2005; IDEA 2004). These funds may be
appropriated for professional development to equip staff to meet the needs of such students and
to supplement existing services (Apling & Jones, 2005; ESEA/NCLB, 2001; IDEA 2004).
34
Private school children with disabilities. Added provisions of IDEA 2004 addressed
the educational rights of children with disabilities enrolled in private schools. The 2004 act gave
state and local education agencies the right to place a child with a disability in a private school to
meet its FAPE provision (Apling & Jones, 2005; IDEA 2004). A child with a disability could,
according to provisions, be placed at a private school by his or her parents; however, the parents
were financially responsible unless a court ruled otherwise or the district agreed to fund the
placement (Apling & Jones, 2005; IDEA 2004).
Through IDEA 2004, school districts must collaborate with private and home schools
regarding child find, the identification of children with disabilities. Upon evaluation and
eligibility determination, parentally-placed private or home school children with disabilities
received special education services through a service plan (IDEA, 2004). The law gave
flexibility to districts regarding equitable services to parentally-placed private or home school
children as these services were based on the proportionate share of IDEA funds generated by
private school and home school children with disabilities included in child count (Apling &
Jones, 2005; IDEA, 2004). IDEA 2004 directed districts to consult with private and home
schools within its region regarding the use of these funds to meet the needs of exceptional
children enrolled in these schools (Apling & Jones, 2005; IDEA, 2004). The district retained the
right to decide how the share of funds will be used to meet the educational needs of these private
school and home school children with disabilities; when funds were expended, services may
cease (IDEA, 2004). IDEA 2004 required districts to keep records of private and home school
children with disabilities, what services were provided, and by whom (Apling & Jones, 2005).
Additions to procedural safeguards. IDEA 2004 altered procedural safeguards
concerning the filing of complaints and mediation. The act clarified how far back in time an
35
individual may go when filing a complaint against a state or local education agency regarding the
provisions of IDEA - no more than two years before the alleged action or when individuals
should have known (Apling & Jones, 2005). When state law shortens the timeline for formal
complaints, it shall take precedent, per IDEA 2004 (Apling & Jones, 2005). North Carolina has
a one year statute of limitation for filing a formal state complaint against a state and/or local
education agency (North Carolina Department of Public Instruction, 2010).
IDEA 2004 expanded existing mediation procedures by directing state and local
education agencies to offer, not require, mediation to resolve conflict. Moreover, mediations
reaching resolution between parties require a written agreement of decisions (Apling & Jones,
2005; IDEA 2004). Furthermore, mediation agreements must be signed by the parties, the
district representative, and are enforceable by a court (Apling & Jones, 2005; IDEA 2004).
IDEA 2004 set forth a new element to resolve conflict known as a resolution session,
which must occur before a due process hearing. The resolution session must be held within 15
days upon notification of a due process petition unless both parties agree to mediation (Apling &
Jones, 2005). This new provision allows the district to have legal representation present if the
parent does so (Apling & Jones, 2005). Failure by the district to resolve a dispute within 30 days
may initiate a due process hearing (Apling & Jones, 2005; IDEA, 2004). Like mediation, when
agreement is reached at the resolution session, a legally-binding agreement must be drafted by
the parties, signed, and then becomes enforceable. According to the law, either party may void
the resolution agreement within three days (Apling & Jones, 2005; IDEA, 2004). In the event a
dispute goes through a due process hearing, the court’s decision may be appealed within 90 days
(Apling & Jones, 2005; IDEA, 2004).
36
Student discipline. IDEA 2004 upheld earlier disciplinary provisions provided in IDEA
1997. School officials retain the right to discipline a child with a disability in the same manner
as a non-disabled child for a breach of the school’s code of conduct, but require a manifestation
determination for removals exceeding10 days (Apling & Jones, 2005; IDEA, 2004). The law
gave power to school officials by allowing them to determine whether a removal constituted a
change of placement (Apling & Jones, 2005; IDEA, 2004). IDEA 2004 required a manifestation
within 10 days of a decision to alter the placement of a child with a disability (Apling & Jones,
2005; IDEA, 2004). If no causation exists between the incident and disability or failure to
implement the IEP, the child with disabilities may be disciplined in the same manner as non-
disabled peers; children with disabilities must continue to receive special and related services
throughout the duration of a removal exceeding 10 days (Apling & Jones, 2005; IDEA, 2004).
Special Education Administration and Supervision
A Starting Point in History
National efforts of the 1800s and 1900s led to compulsory attendance in public schools
and federal legislation to guarantee the rights of individuals with disabilities. While inclusive
practices began in the 1900s, legal challenges persisted with regard to educating children with
disabilities alongside non-disabled peers. Berry, Derrick, McCord, Wilkes, and Doll (1929)
recognized the imperative for school districts to adapt to meet the needs of students; therefore,
these researchers conducted a study of a district of “20,000 students for the purpose of
establishing a modern system of instruction for exceptional children” (as cited by Doll, 1932, p.
245-246). They discovered in their research that 15% of the district’s population consisted of
children with needs ranging mild to significant disabilities, all of which required intensive
instruction (as cited by Doll, 1932). This study concluded that special education programs
37
should include referral and evaluation for the early identification of children with disabilities, a
continuum of services, and adequate resources (Berry et al., 1929; Doll, 1932).
Early Preparation in Special Education
In the early 1900s, colleges and universities instituted teacher education programs to train
individuals to be successful instructors. Three modes of training available at this time consisted
of internship, on-the-job training, and formal preparation through institutions of higher education
(Winzer, 1993). Internship programs dated to the early 1900s and incorporated supervision and
observation of professionals in practice; on-the-job training was less formal with little or no
coaching (Winzer, 1993). By the late 1800s, higher education institutions offered courses on
teaching children with physical and/or cognitive impairments (Winzer, 1993). Over 50
universities offered special education preparation programs by 1930, and many states enacted
laws to secure these programs (Winzer, 1993). Education leaders of the 1930s advocated for
teacher credentials that included a college degree with special education training, and efforts led
to inclusion of such courses in teacher education programs (Scheerenberger, 1983; Winzer,
1993). These early training efforts were necessary as almost 400,000 children with disabilities
enrolled in public schools by the 1940s; by the early 1960s, 1.5 million children with disabilities
received special education in public schools (Baker, 1944; Willenberg, 1966; Winzer, 1993).
The Birth of Special Education Leadership
In the 1920s, institutions of higher education and education agencies embraced special
education, resulting in the development of training programs and supervisory positions. A
review of literature identified Columbia University as the forerunner of special education
administration as it was the earliest institution to offer such courses prior to 1910 (Connor,
1961). By the 1920s, special education leadership arrived as evidenced by 35 districts
38
employing special education administrators, and by 1950, over half of state education agencies
employed such leaders (Ayer & Barr, 1928; Martens, 1946; Winzer, 1993). Special education
administration was further supported by the establishment of the National Association of State
Directors of Special Education in 1938 (Burrello & Sage, 1979). In 1951, the Council of
Administrators of Special Education joined partnership with the Council for Exceptional
Children in an effort to broaden leadership development to district special education directors
(Burrello & Sage, 1979).
Early Efforts to Define the Role of Special Education Directors
In the early 1960s, the U.S. Department of Education promoted research in special
education through grants to institutions of higher education to spawn the development of special
education preparation programs (Milazzo & Blessing, 1964; Reynolds & Fletcher-Janzen, 2007).
In questionnaires mailed to institutions of higher education, almost one-fourth offered programs
in special education administration that included master’s, advanced, and doctoral degrees
(Milazzo & Blessing, 1964). While these universities offered special education administration
courses, teaching was not a prerequisite (Milazzo & Blessing, 1964). By 1977, over 70
institutions of higher education offered programs in special education administration (Nutter &
McBride, 1981). As these programs flourished in the 1960s and 1970s, many states examined
the role of special education director to determine credentials (Milazzo & Blessing, 1964). A
study by Marshman (1965) produced a portrayal of the special education administrator:
The Director of Special Education is an educational leader with many and varied
responsibilities. The basis for his professional behavior is a body of specialized
knowledge which he uses to create a general education program for specialized clientele.
To do this, he interacts with the entire spectrum of the school system…he must
39
coordinate a variety of services – psychological, vocational, transportation, etc.
Expenditure of funds to be properly coordinated requires his specialized knowledge.
Organizing this job into a meaningful description is no small task (p. 3).
Marshman’s (1965) account of special education administrators illustrated a vast array of
responsibilities, including collaboration with general education and support services.
In 1966, the Council for Exceptional Children revealed its position regarding credentials
of special education personnel in Professional Standards for Personnel in the Education of
Exceptional Children (CEC, 1966). This organization identified a wide range of skills for
special education administrators encompassing expertise in general education and special
education (CEC, 1966; Warfield, 1982). In 1983, the organization adopted its Code of Ethics
and Standards for Professional Practice for Special Educators, which provide the foundation for
competencies (CEC, 2009). NCLB 2001 and IDEA 2004 set minimum qualifications for
teachers of special education; however, these laws fell short of establishing credentials for
administrators, perhaps due to the fact that states have the responsibility of determining their
own education program (Boscardin, McCarthy, & Delgado, 2009). The most recent revision to
CEC standards for special education personnel occurred in 2009 and brought alignment among
competencies, NCLB 2001, and IDEA 2004 (CEC, 2009). National expectations for special
education administrators included “leadership and policy, program development and
organization, research and inquiry, individual and program evaluation, professional
development, ethical practice, and collaboration” (CEC, 2009, p. 173-177).
Studies of State Credentials of Special Education Directors
A thorough exploration of literature revealed several studies with variance among state
credentials for special education directors. Kern and Mayer’s (1970) survey yielded results from
40
three-fourths of state agencies, and of these, almost one-fourth developed standards for special
education directors. These researchers further identified an initial movement in licensure
requirements for special education administrators – a master’s degree, teacher certification,
teaching experience, and courses in administration (Kern & Mayer, 1970).
After the passage of the EAHCA 1975, Forgnone and Collings (1975) surveyed
institutions of higher education to determine what formal training programs existed in special
education administration. Results showed that few colleges offered such programs, and three-
fourths of states failed to define credentials for special education administrators (Forgnone &
Collings, 1975). These researchers posited minimum standards in special education governance
to include a master’s degree in special education administration, courses in general and special
education, teaching and internship, and concluded “such training would better prepare
professionals to deal with the many contingencies inherent in the maintenance and development
of programs for exceptional children” (Forgnone & Collings, 1975, p. 9). Jones and Wilkerson
(1975), in a review of existing research of the time, concurred that prerequisites for special
education leaders must encompass knowledge of special education, general education, and
administration. Additionally, Ripscher’s (1979) survey to special education administrators, who
completed university training in administration, identified courses that best prepared them for
this role – special education administration and supervision, school law, and leadership
development (as cited by Nutter & McBride, 1981).
Research studies conducted in the 1980s to 2010 identified continued variation among
states in regard to credentials for special education administrators. While 80% of state education
agencies established certification requirements for administration (Stile & Pettibone, 1980), one-
half went further by identifying specific credentials for the special education administrators (Stile

41
& Pettibone, 1980; Prillaman & Richardson, 1985). States proved to be flexible, accepting
supervisor and director credentials or educational administration with special education
certification for these supervisory roles (Warfield, 1982). Since the passage of EAHCA 1975,
subsequent reauthorizations and increased litigation in special education, many states expanded
credentials for these administrators to include knowledge of special education laws (Boscardin,
Weir, & Kusek, 2010; Valesky & Hirth, 1992). In addition, a master’s degree and passing score
on a standardized examination became prerequisites among many states for individuals serving
in the role of special education director (Boscardin et al., 2010).
North Carolina Credentials for Special Education Administrators
Taking this research to the state level showed that North Carolina’s education agency
allowed flexibility with special education administrator credentials. The North Carolina
Department of Public Instruction (NCDPI) and its Exceptional Children Division established two
options for individuals seeking the credentials of special education administrator, as stated in
Policies Governing Services for Children with Disabilities (2010):
-A master’s degree in an exceptional children area or an advanced degree in school
psychology, and
-Three graduate semester hours of credit in each: administration, curriculum
development, supervision, and
-A passing score on the National Teachers Examination/Praxis Educational Leadership:
Administration and Supervision exam, or
-A master’s degree in administration and/or curriculum and instruction, and
-Nine semester hours of course work in exceptional children, and

42
-A passing score on the NTE/Praxis Educational Leadership: Administration and
Supervision exam (NCDPI, 2010, p. 43).
These options allowed flexibility for North Carolina’s special education directors
regarding the type of master’s degree required for this supervisory role. Individuals in this state
who hold this position but lack credentials must seek a provisional license from the state
education agency and complete required graduate-level courses through an accredited institution
of higher education (NCDPI, 2010). Similar to other states, North Carolina requires a passing
score on a professional examination as a means to document executive leadership competencies
(NCDPI, 2010).
Early Supervision of Special Education Programs
Prior to anti-discrimination and special education laws, oversight of the special education
program was a primary responsibility of principals (Baker, 1944; Reavis, Pierce, & Stollken,
1940). In the 1930s and 1940s, principals’ responsibilities relative to special education included
the identification of children with disabilities or child find, the development of education
programs, training, acquisition of resources, and fiscal management (Baker, 1944; Reavis et al.,
1940). Fulfilling these many responsibilities required extensive knowledge of disabilities,
community, and medical resources to meet the needs of children with disabilities (Baker, 1944).
Marshman’s (1965) early definition of the special education director pointed to
competencies specific to this leadership role. These responsibilities encompassed extensive
knowledge of disabilities, the establishment of appropriate education programs and services for
children with disabilities, collaboration with staff and parents, coordination of services within the
school district and community to meet children’s educational needs, and fiscal management
(Marshman, 1965; Finkenbinder, 1981).
43
Studies to Identify Competencies of Special Education Directors
Exploration of the literature identified several state and national studies from the past 50
years that examined the role of special education directors and led to the identification of core
competencies. Mackie and Engle (1955) surveyed administrators of special education programs
(N=153) across the U.S. to identify employee characteristics, district and student demographics,
and performance tasks (Mackie & Engle, 1955). Findings revealed administrative behaviors
among participants that included demonstrated skills in human resources and fiscal management,
program and policy development, school law, and public relations (Mackie & Engel, 1955).
Newman (1970) investigated seven administrative domains to determine their importance
among special education directors across the U.S. Participants examined these domains and
ranked them in order of importance (Newman, 1970):
1) Planning - making broad outlines indicating the needs of and methods for
accomplishing the purposes of the enterprise;
2) Organizing – setting up formal structures of authority through which work
subdivisions are arranged and coordinated;
3) Directing – making decisions and serving as leader of the enterprise;
4) Staffing –recruiting and training of personnel and maintaining favorable work
conditions;
5) Coordinating – interrelating the various parts of the work;
6) Budgeting – fiscal planning, accounting, control; and
7) Reporting – keeping others informed of all administrative activities (p. 523).
Respondents identified the directing and coordinating domains as most important,
including essential behaviors associated with the position (Newman, 1970). Correlation results
44
showed the directing and coordinating domains were statistically significant (.01 level), followed
by the planning and organizing domains (.05 level) (Newman, 1970). In the area of planning,
respondents identified policy development and operation of special education programs as top
priorities (Newman, 1970). Curriculum development ranked third, followed by facilities,
acquisition of equipment/materials, and child find efforts (Newman, 1970).
Communication efforts ranked highest under the organizing domain, according to
respondents (Newman, 1970). These efforts included district wide communication and
notification of child find procedures (Newman, 1970). Other high ranking behaviors included
assignment of programs and personnel within the district’s schools to ensure the provision of
services for children with disabilities (Newman, 1970).
Special education directors in the study also identified directing and coordinating
domains as core competencies (Newman, 1970). Directing behaviors included the provision of
special education services and training of personnel (Newman, 1970). These leaders identified
the marriage of special and general education programs, collaboration, and communication as
essential practices (Newman, 1970). Despite the small number of participants involved in the
study (N=59), Newman’s findings identified key competencies associated with district special
education directors, revolving around administration, curricula, operations, collaboration, and
communication (Newman, 1970).
Marro and Kohl (1972) instituted a national survey to determine employee characteristics
and competencies of district special education directors. The study yielded data from over 1,060
surveys producing a response rate of 62% (Marro & Kohl, 1972). Descriptive statistics showed
that of the sample, over half were under the age of 45, and the average age was 44 (Marro &
Kohl, 1972). Data showed that 40% of the sample had fewer than three years of experience in
45
this leadership role, and of these individuals, 26% were female (Marro & Kohl, 1972). This
study provided a glimpse of the percentage of time special education directors devoted to tasks in
the workplace (Marro & Kohl, 1972):
-32.3% on administration
-20% on supervision and coordination of services
-11.8% on direct services
-11.7% on clerical duties
-10.5% on curriculum development
-8.3% on community relations
-5.4% on self- improvement activities (p. 9).
The special education directors participating in the study identified the following
necessary competencies: policy development, human resources and fiscal management, and
curricula (Marro & Kohl, 1972). Over 60% of respondents indicated frequent collaboration with
district leaders regarding policies and curricula, 70% assisted in personnel matters, and 50%
prepared budgets (Marro & Kohl, 1972). Waters’ (1974) research supported these findings
through a three-state survey of superintendents and doctoral students who identified essential
skills of special education directors – administration, fiscal management, personnel, and school
law (as cited by Jones & Wilkerson, 1975).
A study of Minnesota’s special education directors reinforced results of earlier studies in
that the primary responsibilities of special education leaders consisted of administration of the
special education program, policy development, human resources duties, fiscal management,
collaboration, and community relations (Weatherman & Hapoz, 1975). These researchers, like
Forgnone, Collings, Jones, and Wilkerson (1975), suggested credentials for this role should
46
include a master’s degree in general and/or special education, supervisory experience, and
knowledge of special education laws (Weatherman & Hapoz, 1975).
Brennan (1980) conducted a national survey of special education administrators and their
supervisors (N=322) to determine the essential skills of special education directors. Correlation
and chi square results identified competencies which these individuals identified as necessary to
this job: administration, personnel and fiscal management, policy development, and
understanding of legal issues (Brennan, 1980). The findings showed that training in human
resources management, instructional leadership, and legal issues were necessary for success in
the role (Brennan, 1980).
In a Colorado study conducted by Rude and Sasso (1988), 48 special education directors
ranked in importance the state agency’s competencies for special education administrators (as
cited in Gillung et al, 1992). Findings yielded similar results to earlier studies by identifying
human resources and fiscal management, school law, and program development as essential
dispositions (as cited in Gillung et al., 1992).
Gillung et al. (1992) investigated the competencies of special education directors in
Connecticut through survey research. Methodology for this study included development of a
questionnaire to assess 84 performance tasks across nine domains (Gillung et al., 1992), a similar
technique used by Newman (1970). A team of experienced special education leaders examined
the proposed survey to provide feedback and to ensure alignment to job duties associated with
this leadership role (Gillung et al., 1992). The study produced data from 184 participants and a
72% response rate (Gillung et al., 1992). Employee characteristics illustrated that one-half of
respondents were female, individuals had an average of six years’ experience in the role, and
three-fourths earned an advanced degree (Gillung et al., 1992). “Weighted” means identified
47
items of importance - special education laws, coordination of services, management duties, and
curricula (Gillung et al., 1992).
A thorough review of these state and national research studies on the competencies of
special education administrators yielded many similarities. These leaders should demonstrate
extensive knowledge of special education laws, administer the special education program in
accordance with such provisions, fulfill human resources and fiscal management duties,
collaborate with stakeholders, and communicate effectively (Baker, 1944; Brennan, 1980;
Gillung et al., 1992; Mackie & Engle, 1955; Forgnone & Collings, 1975; Jones & Wilkerson,
1975; Marro & Kohl, 1972; Marshman,1965; Newman, 1970; Rude & Sasso, 1988; Weatherman
& Hapoz, 1975).
National Competencies Defined by the Council for Exceptional Children
The Council for Exceptional Children (CEC) developed national standards regarding
special education personnel in an effort to assist education units with defining expectations for
these complex roles (CEC, 2009). These standards, revised in 2009, aligned competencies to
NCLB 2001 and IDEA 2004 directives (CEC, 2009). While the foundation of university
educational administration programs rested on Interstate School Leaders Licensure Consortium
(ISLLC) standards, the CEC developed 10 specialized standards for special education personnel
and six advanced standards for administrators to further define these roles (Boscardin, McCarthy,
& Delgado, 2009; CEC, 2009; Setzer, 2011). These advanced special education leadership
dispositions included:
Standard 1: Leadership and policy
Standard 2: Program development and organization
Standard 3: Research and inquiry
48
Standard 4: Student program evaluation
Standard 5: Professional development and ethical practice
Standard 6: Collaboration (Setzer, p. 126; CEC, p. 170-172).
These CEC guidelines illustrated the vast array of responsibilities that special education
personnel must demonstrate to be effective in their role (Boscardin et al., 2009).
Studies to Assess Workload of Special Education Administrators
Studies found in current literature pointed to an expansion of competencies associated
with the role of special education directors. Added points for consideration regarding role
expansion were struggling national and state economies. The nation’s unemployment rate in
September 2012 was 7.3%, whereas North Carolina’s unemployment rate for September 2012
exceeded the national average with a rate of 9.3% (U.S. Bureau of Labor Statistics, 2012).
A variety of resources illustrated that North Carolina’s education budget continues to
falter. North Carolina’s 2012-2013 education budget exceeded $7 billion yet required $500
million in cuts (North Carolina Public Schools, 2012). Since the onset of the 2008 recession,
almost “17,000 North Carolina public school employees lost employment of which 35 percent
were in instructional positions and 30 percent were supplemental roles” (North Carolina Public
Schools, 2012, p.1). Concurrently, state data revealed steady increases in student enrollment and
suggested increased workplace demands on the remaining public schools employees. For
example, the net gain in enrollment from the 2010-2011 and 2011-2012 school years alone was
over 16,000 students, an increase of nearly 10% (North Carolina Public Schools, 2012). Since
the onset of the 2008 recession, enrollment in North Carolina’s public schools has grown by
60,000 children while its workforce has been reduced by 12,000 employees (NCDPI Finance and
Business Services Division, 2012; NCDPI Information Analysis Division, 2012).
49
A review of relevant research revealed few studies measuring the workload of special
education directors. Prior to the passage of the EAHCA 1975, Marro and Kohl (1972)
investigated the competencies of special education directors through a national survey, and
through these findings, a view of their workload emerged. Data from survey respondents
(N=1066) showed over one-half of special education administrators were employed year round
and averaged 42-54 hours per week on the job; however, directors of districts with fewer
enrolled students were employed fewer than 12 months annually (Marro & Kohl, 1972).
Individuals holding a school district leadership role likely work beyond the typical 40-
hour work week, according to the 2010-2011 Occupational Outlook Handbook (U.S. Department
of Labor, Bureau of Labor Statistics, 2010). Similarly, school principals and assistant principals
work in excess of 40 hours and include arriving to work early, staying late, and weekend work
depending on school and/or district-level functions (U.S. Department of Labor, Bureau of Labor
Statistics, 2010). By comparison, the typical work week among general managers and top
executives, including leaders of marketing, financial institutions, and school district
superintendents, exceeds 40 hours and requires excess travel and weekend work (U.S.
Department of Labor-Bureau of Labor Statistics, 2010). Teachers and school counselors
typically work at least 40 hours per week to meet the demands of their job, which include lesson
planning, paperwork, and attendance at school functions (U.S. Department of Labor-Bureau of
Labor Statistics, 2010).
Special education directors participating in Marro and Kohl’s (1972) study identified
their actual time devoted to special education tasks and ideal tasks which they would like to
complete. These administrators indicated they spent one-half of their time on fiscal,
administrative, and supervisory duties while preferring to spend more time on curriculum
50
development and instructional issues (Marro & Kohl, 1972). Respondents specified barriers to
fulfilling ideal tasks that included district-level obligations and an inadequate number of
personnel, coupled with growing demands and pressures of the job (Marro & Kohl, 1972).
These stressors included increased accountability, growth in enrollment, regulations, and
additional assignments at the local level (Marro & Kohl, 1972).
In the early 1980s, a time-and-effort study of special education directors in Florida set out
to identify duties of the job and how administrators allotted time on special education tasks
(Nutter, Forgnone, McBride, & Boone, 1983). The methodology differed from previous and
contemporary studies, as it included on-the-job observations of special education directors, a
survey whereby respondents ranked behaviors completed in the workplace, and a time log to
document activities during the workday (Nutter et al., 1983).
Researchers observed eight special education administrators three times in the workplace
in four-hour increments; anecdotal notes were made at 15-minute intervals to document tasks
(Nutter et al., 1983). Survey results captured respondents’ perceptions of how they allotted their
time in the workplace, and time logs gave insight into daily routines (Nutter et al., 1983). Many
points of analysis allowed researchers to triangulate data to make inferences about the working
conditions of these special education administrators (Nutter et al., 1983).
Survey respondents indicated 35% of their time went to problem solving and instructional
support and greater than 20% on fiscal management and program planning (Nutter et al., 1983).
Professional development and community relations received the least amount of attention, each
scoring at four percent (Nutter et al., 1983).
Analysis of time logs showed these directors spent one-fourth of their time on problem
solving to assure the provisions of special education laws and fiscal management respectively
51
(Nutter et al., 1983). Other areas noted in time logs were planning and development, curriculum,
and policy development (Nutter et al., 1983). Time logs concurred with survey data and showed
that professional development, public relations, and community relations received less attention
(Nutter et al., 1983).
Conversely, analysis of observation data yielded different findings from time logs and
surveys completed by these special education directors (Nutter et al., 1983). Observation data
proved that directors spent over one-fourth of time on policy development and implementation,
followed by evaluation of educational processes, and fiscal management (Nutter et al., 1983).
Less than 10% of time was spent on problem solving (Nutter et al., 1983). While these special
education directors perceived themselves as spending large amounts of time on problem solving,
curricula, program/policy development, and fiscal management, observations yielded different
results (Nutter et al., 1983). These researchers speculated as to why variance occurred and
concluded that perceptions play a large role in studies that do not incorporate direct observation
of research participants (Nutter et al., 1983).
Arick and Krug (1993) surveyed the working conditions and training needs of special
education directors (N=1,468) across the nation. Descriptive data of the sample indicated that
more females than males held the position, over three-fourths were full-time employees, and
over three-fourths held advanced or doctoral degrees (Arick & Krug, 1993). Respondents spent
over 70% of their time fulfilling administrative functions, 20% on general education duties, and
10% on other tasks (Arick & Krug, 1993). Interestingly, 85% of special education
administrators were directly responsible for the completion of performance evaluations of special
education staff or assisted principals with this duty (Arick & Krug, 1993). Findings identified
the greatest training needs of these individuals were related to preparing grant proposals, human
52
resources, and program management (Arick & Krug, 1993). Data showed a shortage of special
education administrators as 10% of districts reported a vacancy in this position (Arick & Krug,
1993). In addition, one-half of districts anticipated special education director turnover in
upcoming years due to retirement or reassignment (Arick & Krug, 1993).
DiPierro (2003) investigated the working conditions of New Jersey’s special education
directors in relation to job satisfaction and perceptions of attrition through a mailed survey
(N=267). Findings showed that “54 percent of respondents had a heavy workload, 37 percent
had an impossible workload, and 85 percent supervised other programs in addition to the special
education program” (DiPierro, 2003, p. 143). While the majority of special education directors
reported a taxing workload, over 60% voiced job satisfaction (DiPierro, 2003). Collectively,
findings showed that most of New Jersey’s special education directors faced extreme demands in
the workplace (DiPierro, 2003). Many areas of dissatisfaction pointed to regulations, paperwork,
lack of support, disgruntled parents, lack of time to complete tasks, and litigation (DiPierro,
2003). Further analysis identified that as workload increased so did job dissatisfaction (DiPierro,
2003). These leaders perceived special education turnover to be high and caused by stress,
workload, and poor working conditions (DiPierro, 2003).
While the literature review yielded just a few research studies on the workload of special
education administrators, collective findings suggested that these individuals have great demands
in the workplace. Notable factors contributing to increased workload included special education
and general education responsibilities, fiscal management in a time of economic distress,
increased enrollment, lack of personnel, and litigation (Arick & Krug, 1993; DiPierro, 2003;
Marro & Kohl; 1972; Nutter et al., 1983).
53
Other Factors Affecting Workload in Special Education
Current literature revealed other factors of consideration with regard to the workload of
special education administrators. Driving forces affecting workloads included the expanded role
of the federal government in public education as evidenced by the provisions of NCLB 2001 and
IDEA 2004, increased accountability through these statutes, and litigation in special education.
These areas warranted additional exploration to give an enhanced perspective on the workload of
special education directors.
Challenges of the ESEA/No Child Left Behind Act of 2001
Increased rigor. The Elementary and Secondary Education Act 1965 was enacted in an
effort to assist education agencies through funding to boost learning opportunities for
impoverished children (Cross, 2005). In its most recent reauthorization, NCLB 2001,
accountability and educational opportunities for students increased (Stodden, Galloway, &
Stodden, 2003). The core principle of this legislation required all students and schools to meet
adequate yearly progress in core academic subjects annually with 100% of students scoring at or
above grade level on statewide assessments by 2013-2014 (NCLB 2001; USED, 2001 & 2010).
The law mandated inclusion of all students in states’ testing and accountability models with at
least 95% participating in such assessments (NCLB 2001; USED 2001 & 2010). These annual
measures of achievement and public reporting of results increased accountability for state
education agencies, districts, and personnel (USED 2001; USED, 2010). Schools and districts
failing to reach academic targets face sanctions and monitoring by state and federal education
agencies (CEC, 2003; USED 2001; USED, 2010). This legislation compelled education
agencies to involve parents and ensure students received instruction from qualified staff (CEC,
2003; NCLB 2001; USED, 2001; USED, 2010). Additional provisions of the law directed
54
education agencies to address reading instruction, implement research-based instructional
programs and practices, and provide training to staff and parents (NCLB 2001; CEC, 2003;
USED, 2001; USED, 2010).
Increased accountability. NCLB 2001 focused on results coupled with accountability;
teachers, school leaders, and district administrators were held accountable to close achievement
gaps and improve students’ academic performance (NCLB, 2001). A review of relevant
literature showed that gains in student achievement related to the leader’s establishment of
professional learning communities across the district, creating a culture of collective
responsibility for student learning, goal setting with frequent progress monitoring, and
collaboration (DuFour, Dufour, Eaker, & Many, 2006; Stodden et al., 2003; Tomlinson, 2001).
Other effective practices noted in the literature pointed to training and coaching of staff on
research-based instructional practices and programs, differentiation, and integration of
technologies (DuFour et al., 2006; Stodden et al., 2003; Tomlinson, 2001).
Uncertainty of NCLB 2001. Ambiguity exists with ESEA/NCLB 2001 as President
Barak Obama and the U.S. Department of Education proposed changes to this legislation in 2010
(USED, 2010). These proposals, described in A Blueprint for Reform: The Reauthorization of
the Elementary and Secondary Education Act (USED, 2010) identified proposals which states
must adopt to sidestep current NCLB 2001 accountability measures:
- Adoption of the Common Core Standards in English/Language Arts and
Mathematics and Essential Standards for other content areas;
- Emphasis on postsecondary education and employment;
- Implementation of a teacher evaluation model linked to student achievement;
- Revision of the state’s annual student achievement assessments; and
55
- Revision of the state’s accountability model to allow for differing achievement
rates for subgroups (USED, 2010).
Most state education agencies adopted these proposals and subsequently received federal funds
to implement these measures (USED, 2012). Regardless of whether NCLB 2001 is reauthorized
in the future, the provisions of NCLB 2001 influence all education personnel to re-examine their
role and make adjustments accordingly.
IDEA 2004
Access to general curricula. IDEA 2004 held education agencies accountable to a
plethora of federal mandates designed to protect the educational rights of children with
disabilities; as a result, special education administrators must deploy such regulations across the
district. IDEA 2004 emphasized students’ accessibility to curricula and participation in
statewide tests to measure achievement; as a result, children with disabilities were likely to
receive instruction in the general education program with the support of special education
personnel and instructional modifications (IDEA 2004; Yell, Katsiyannis, & Shiner, 2006). In
keeping with a best practice approach, special education directors were charged to train IEP
Teams on supplemental supports, instructional modifications, and accommodations to ensure
students’ access to curricula (Yell et al., 2006). NCLB 2001 and IDEA 2004 solidified the
partnership among general and special education as these laws implied collaboration across
disciplines to close student achievement gaps (Ratcliffe & Willard, 2006).
Consideration of the total child. One of the many components of IDEA 2004 promoted
enhanced accountability among IEP Teams. These groups must develop individual education
programs that meet the needs of the total child, taking into consideration students’ present
academic and functional levels of performance, and transition planning beginning at age 16 to
56
prepare children for postsecondary education and the workplace (IDEA, 2004; Yell et al., 2006).
Special education personnel must monitor the performance of children with disabilities in
relation to special education goals through data collection, and progress must be reported to
parents regularly (IDEA, 2004; Yell et al., 2006). The progress monitoring requirement of IDEA
2004 pointed to leaders’ responsibilities to train staff accordingly on formative assessments and
required the implementation of such practices to gauge students’ learning (Yell et al., 2006).
Literature confirmed that frequent monitoring of students’ performance allowed for adjustments
in instructional practices and differentiation, all of which may lead to improved achievement
(Deno, 2003; DuFour et al., 2006).
Barrage of paperwork. While IDEA 2004 encouraged states to reduce paperwork in
special education, the revised statute had the opposite effect, thus impacting workload (Embich,
2001; Gersten, Gillman, Morvant, & Billingsley, 1995; Lashley & Boscardin, 2003). It is widely
known that special education teachers are responsible for direct teaching as well as providing
oversight of assigned special education files that must meet compliance with federal, state, and
local regulations (Gersten et al., 1995; Lashley & Boscardin, 2003). Results of a 2001 study of
special education personnel needs in education sponsored by the U.S. Department of Education
showed that special education teachers spent five hours weekly on special education files and
other related tasks such as scheduling IEP Team meetings, whereas, general education teachers
spent two hours weekly on paperwork duties (as cited by Lashley & Boscardin, 2003). This
survey found that 50% of special education teachers reported that paperwork obligations
interfered with teaching (as cited by Lasley & Boscardin, 2003).
The burden of paperwork impacts special education directors as they must complete
many reports, monitor caseloads, class size, and schedules, while ensuring that staff has the
57
appropriate credentials for assigned teaching areas to ensure compliance with NCLB 2001 and
IDEA 2004 provisions (NCDPI, 2010). Special education directors are further required to
submit an annual performance report (APR) to the state education agency to document
compliance with IDEA 2004 as the state monitors each district’s performance on indicators
regarding outcomes for children for disabilities (IDEA, 2004; NCDPI, n.d.; USED, 2012).
Monitored areas include the graduation rate and academic achievement of children with
disabilities, suspensions, and expulsions (USED, 2012). Furthermore, IDEA 2004 required
monitoring related to the determination of special education eligibility, over-identification of
minorities in special education programs, and dispute resolution (USED, 2012). Districts failing
to meet areas of the APR are subject to increased monitoring by the state education agency, and
sanctions may be applied to the local education agency if the non-compliance is not addressed
within a timely manner (USED, 2012; NCDPI, 2010). As indicated, the demands of
administering, monitoring, and reporting that are necessary to fulfilling the objectives of IDEA
2004 suggest excessive levels of administrative responsibilities for personnel charged with
program oversight.
Issues Regarding Highly Qualified Special Education Personnel
Highly qualified personnel requirements. NCLB 2001 and IDEA 2004 mandated that
students receive instruction from highly qualified licensed personnel; as a result, special
education directors must exhaust efforts to employ and retain highly qualified employees. These
laws required teachers of secondary schools, including special education teachers, to hold
licensure in core academic subjects if serving as ‘teacher of record’ for a child with a disability
(IDEA, 2004; NCLB, 2001). Core academic areas included English, reading/language arts,
mathematics, science, languages, civics and government, arts, history, and geography (NCLB,
58
2001; USED, 2004). A teacher of record was defined as one solely responsible for the provision
of core content to a child with a disability (IDEA, 2004; NCLB, 2001; USED, 2004).
In 2002, the Board of Directors for the Council for Exceptional Children endorsed the
NCLB 2001 provision and concluded that special educators serving as teacher of record must
hold special education and core academic subject area licensure as all children must meet
proficiency on statewide achievement measures (CEC, 2005). To monitor states’ progress
regarding the highly qualified personnel provisions of NCLB 2001 and IDEA 2004, the U.S.
Department of Education required each state education agency to develop a Highly Qualified
Teacher Plan by 2005-2006 to identify its efforts in meeting these standards (USED, 2005).
NCLB 2001 defined highly qualified requirements for inexperienced and experienced
teachers. Teachers with less than three years of experience were required to pass the appropriate
Praxis teacher examination and complete courses necessary to fulfill the highly qualified
personnel standards for their area of teaching assignment (NCLB, 2001; NCDPI, 2003). NCLB
2001 allowed alternative methods for experienced teachers to meet the highly qualified
provisions; as a result, many state education agencies, including North Carolina, adopted a
portfolio model to certify teachers’ core content knowledge, known as Highly Objective Uniform
State Standards for Evaluation or HOUSSE (NCDPI, 2003; USED, 2005). In 2009, the U.S.
Department of Education notified NCDPI that the Praxis 0511 teacher examination and
HOUSSE process were not accurate measures of core content knowledge (NCDPI, 2009). As a
result, the state education agency eliminated these options as means to meet the highly qualified
requirements of NCLB 2001 and IDEA 2004 (NCDPI, 2009). Subsequently, educators who
serve as teacher of record in core academic subject areas were held to the rigorous core content
licensure standards (NCDPI, 2009).
59
These highly qualified personnel requirements added complications to decisions set forth
by IEP Teams regarding the education program of children with disabilities enrolled in
secondary schools. Through IDEA 2004, IEP Teams determine students’ special education
goals, measures, and continuum of services (IDEA, 2004). An IEP Team may decide that the
secondary school child with a disability requires intensive instruction to such a degree that it can
only be provided by a special education teacher in an environment away from typical peers;
therefore, this special education teacher must hold licensure in both special education and the
core academic subject (CEC, 2005; IDEA, 2004; NCDPI, 2009). In situations where a mismatch
exists between the licensure of special education teachers and services as identified on the child’s
IEP, the special education director should problem solve to ensure that the child with a disability
receives instruction from a highly qualified licensed teacher (NCDPI, 2009).
Personnel shortage. Hiring decisions are among the most important decisions education
administrators make to ensure that students receive instruction from qualified teachers; however,
literature suggested a continued shortage of licensed special education personnel in public
schools (Billingsley, 2004; Boe & Cook, 2006; Boe, 2006; Thornton, Peltier, & Medina, 2007;
Higher Education Consortium for Special Education, 2010; USED, 2003; USED, 2012). This
shortage is due to thousands of fewer individuals entering college to earn a degree in special
education (Katsiyannis, Zhang, & Conway, 2003). In a study of personnel needs in public
education, Gonzalez and Carlson (2001) reported over 65,000 special education teachers were
needed to fill vacancies; approximately 50,000 teachers were hired, leaving about 15,000
vacancies (as cited by Lashley & Boscardin, 2003). Additional data supported these findings as
vacancies in special education rose from 7% in 1994 to 12% in 2002; almost 25% of special
education teachers had incomplete credentials, and 10% lacked licensure in their teaching
60
assignment (Boe & Cook, 2006; USED, 2003). When faced with a shortage of qualified
teachers, districts must employ substitute teachers in the interim to address students’
instructional needs (Katsiyannis et al., 2003).
Other factors influencing special education teacher shortages included efforts of state and
local education agencies to lower class size (Boe, 2006). Class size reduction initiatives required
districts to employ more personnel to educate students, while simultaneously student enrollments
for children with disabilities have increased due to enhanced child find measures, according to
Boe (2006).
The NCDPI is closing the highly qualified personnel gap as evidenced by past and
present personnel data. In its baseline report to the U.S. Education Department, NCDPI reported
over 80 percent of classes were instructed by highly qualified teachers (NCDPI, 2003). North
Carolina’s schools made significant gains in meeting the highly qualified provision of NCLB
2001 and IDEA 2004, as evidenced by the employment of over 99,000 teachers in 2011-2012 of
which 96% were highly qualified, 0.4% held provisional credentials, and 2.3% were working
toward completion of credentials (NCDPI, 2012).
Attrition. Special education directors must confront the reality that special education
personnel are rapidly leaving the field due a variety of reasons. Primary reasons why special
education personnel leave the profession include salaries, licensure requirements, lack of support
from administrators and parents, student issues, and better employment opportunities
(Billingsley, 2004; Gersten, Keating, Yovanoff, & Harniss, 2001). Related literature suggested
that teacher attrition was the result of a lack of support from school and district leaders
(Billingsley, Gersten, Gillman, & Morvant, 1995; Lashley & Billingsley, 2003).
61
Due to continued shortages of special education personnel, district special education
directors must put recruitment, selection, induction, and retention efforts in the forefront of the
many duties to be fulfilled in the workplace (Thornton et al., 2007). Literature suggested that
school and district leaders should collaborate to address teacher attrition by instituting
participatory decision making practices and the inclusion of frequent communication among
supervisors and employees, performance feedback, removal of unnecessary work tasks, and
measures to reduce paperwork (Billingsley et al., 1995; Gersten, Gillman, Morvant, &
Billingsley, 1995; Lashley & Boscardin, 2003).
A study by Tate (2009) showed that the field of special education leadership in North
Carolina also suffers from attrition, as one-third of practicing directors who participated in this
study (N=70) reported that they were new to this leadership role. This study investigated
perceptions of these special education directors with regard to why individuals choose to remain
or vacate this district-level leadership role (Tate, 2009). These leaders perceived attrition in the
field of special education administration to be caused by several factors such as workplace
dissatisfaction, a lack of administrative support, and excessive paperwork (Tate, 2009).
Satisfaction, on the other hand, was a result of administrative support from supervisors and other
special education administrators, job security, acceptable annual salary, and support from special
education personnel (Tate, 2009).
Litigation in Special Education
Current literature further emphasized that special education is a litigious environment,
perhaps due to the fact that its foundation rests on federal laws designed to protect the
educational rights of children with disabilities. IDEA 2004 required state and local education
agencies to resolve disputes in special education through formal complaint investigations,
62
mediation, resolution meetings, and due process hearings (IDEA, 2004; Mueller, 2009; NCDPI,
2010). North Carolina’s state education agency added facilitation as a mechanism to resolve
conflict and provided at no cost to parents or districts (NCDPI, 2010). Special education
directors should train staff and school administrators on these and other mechanisms, including
strategies for conflict resolution and should assist IEP Teams in resolving disagreements
(Mueller, 2009). Although these measures attempt to resolve conflict, there are no guarantees of
resolution; therefore, individuals must be aware of the potential for litigation (Mueller, 2009).
When districts are faced with any of these dispute actions, it is the responsibility of the local
education agency, namely the special education director, to attempt to bring resolution by
following procedures and timelines as stated in NCDPI Exceptional Children Policies Governing
Services for Children with Disabilities (NCDPI, 2010).
State and national data suggested disputes in special education occur regularly. Recent
data from the Consortium for Appropriate Dispute Resolution in Special Education (CADRE)
showed that in the 2009-2010 school year, almost 5,400 mediations occurred, and of those, two-
thirds reached agreement (CADRE, 2012). In the same year, almost 20,000 due process
complaints were filed and over 2,000 of these were adjudicated through the courts (CADRE,
2012). Data from this report showed that North Carolina reported almost 185,000 children with
disabilities on its December 2009 child count, and the state experienced “64 requests for
mediation and 39 mediations of which 28 reached resolution” (CADRE, 2012, p. 18). By
comparison, Georgia reported just over 175,000 on its December 2009 child count, and of these
cases, it experienced “84 mediation requests and 61 mediations of which 42 reached a
resolution” (CADRE, 2012, p. 18). National child count for 2009-2010 totaled 6.6 million
63
children with disabilities, and of these cases, there were over 8,200 mediation requests, 5,400
mediations, and 731 unresolved disputes (CADRE, 2012, p. 18).
The CADRE (2012) report confirmed that cases of litigation are prevalent in special
education. Its 2009-2010 data demonstrated that North Carolina experienced “54 due process
complaints of which 24 reached settlement, and 13 cases awaited a court decision” (CADRE,
2012, p. 30). By comparison, Georgia reported “74 due process complaints of which 26 reached
a resolution, and six awaited a court decision” (CADRE, 2012, p. 30). Collectively, the nation’s
school districts reported 17,200 due process complaints of which 5,300 were resolved and 2,750
awaited a court decision (CADRE, 2012). According to NCDPI Exceptional Children Policies
Governing Services for Children with Disabilities (2010), it is the responsibility of the local
education agency to address special education disputes and adhere to timelines as established in
policies (NCDPI, 2010). Dispute resolution efforts influence the overall workload of special
education directors. Through these statistics, it is reasonable to conclude that the field of special
education is a litigious environment and may affect the workload of special education directors.
Job Satisfaction
Special education administrators serve in a complex leadership role within the school
district as these individuals must fulfill a multitude of administrative, human resources, and
fiscal management duties to ensure the provision of special education to children with
disabilities. An extensive examination of the literature developed the context of special
education leadership, particularly the job-specific credentials, competencies, and workload,
establishing that these leaders face considerable demands in the workplace. Through this
examination, a definition of job satisfaction and assessment measures surfaced, along with
theoretical frameworks on which research in this field rests. In an environment of increased
64
workplace demands, rigor, and accountability in public education, job satisfaction is relevant for
exploration as an element of organizational management, as leaders must put forth efforts to
attract qualified individuals to the workplace.
What is Job Satisfaction?
For almost 100 years, researchers have investigated the phenomenon of job satisfaction in
an attempt define it and identify variables of influence. Early studies of job satisfaction dated to
the 1920s and1930s through the Hawthorne studies and research of Robert Hoppock (Buchanan
& Byrman, 2009; Hoppock, 1935; Roethlisberger, 1972; Roethlisberger, & Dickson, 1939). The
results of these studies pointed to workplace variables that influence employee behavior and job
satisfaction, such as supervision, environmental conditions, interpersonal relations with
colleagues and supervisors, salaries, and opportunities for advancement (Hoppock, 1935;
Roethlisberger, 1972; Roethlisberger & Dickson, 1939).
A review of the literature indicated that job satisfaction is difficult to define, but it is not
impossible. Hoppock (1935) defined job satisfaction as a recipe of cognitive and environmental
conditions that influence an individual to have, or not have, workplace satisfaction. Later studies
defined job satisfaction as an overall attitude shaped by variables such as wages, supervision,
productivity, perceptions of performance, and employee characteristics (Bullock, 1952; Blum,
1956; Sinha, 1958). Locke (1969) put forth the following description of job satisfaction and
dissatisfaction:
Job satisfaction is a pleasurable emotional state resulting from the appraisal of one’s job
as achieving or facilitating the achievement of one’s job values. Job dissatisfaction is the
unpleasurable emotional state resulting from the appraisal of one’s job as frustrating or
blocking the attainment of one’s job values or as entailing disadvantages. Job satisfaction
65
and dissatisfaction are functions of the perceived relationship between what one wants
from one’s job and what one perceives it as offering or entailing (p. 316).
Job satisfaction was later described as a psychological condition of workers influenced by their
personal needs and values (Hopkins, 1983). Pestonjee (1991) added internal and external factors
of influence to the definition of job satisfaction including work tasks, interpersonal relationships,
attitudes, and perceptions. Spector (1997) concurred with contemporary definitions of job
satisfaction and described it as an affective response to one’s job causing satisfaction or
dissatisfaction.
Gender and Job Satisfaction
A review of relevant literature regarding gender and job satisfaction presented conflicting
findings in a variety of studies. Newbury’s (2000) study of middle school principals identified
females in this leadership role presented a higher level of job satisfaction than male middle
school principals. Eckman’s (2004) study, on the other hand, identified that male and female
high school principals in three mid-western states were similarly satisfied in their leadership role.
Heyd’s (2010) study of high school principals identified that females in this leadership role had a
higher level of job satisfaction than male high school principals, and both reported satisfaction.
In a study of social workers, Jayartne and Chess (1986) found no statistical significance with
regard to gender and job satisfaction. Peter-Schinsky’s (2002) national study of school district
superintendents identified that gender was not a factor influencing job satisfaction. Speech-
language pathologists reported a high level of job satisfaction with no differences noted among
males and females in this study (Blood, Ridenour, Thomas, Qualls, & Hammer, 2002).
DiPierro’s (2003) study of special education directors found similar levels of satisfaction among
males and females in this supervisory role.
66
Conflicting findings regarding the role of gender on job satisfaction may be attributed to
workplace trends. Research from the 1970s and 1980s identified that females typically held
inferior roles in organizations where they were employed and experienced less autonomy in the
workplace, greater supervision, and fewer opportunities for promotion as compared to males
(Berch, 1982; Featherman & Hauser, 1976; Kreps, 1971; Wolf & Fligstein, 1972). Kanter
(1977) suggested that females value facets of the workplace differently than males, including
relationships with co-workers, which may account for variance with gender and job satisfaction.
Crosby (1982) suggested similarities to Adams’ (1965) equity theory in that employees compare
their treatment in the workplace to other employees in similar roles; however, Crosby asserted
that workers compare themselves to individuals of the same gender. Hodson (1989) speculated
as to whether equity evaluations among workers were gender-relevant. Gender socialization
may also be a contributing factor influencing job satisfaction as females in the workplace may be
expected by their supervisors to behave in a submissive or docile manner while it may be more
acceptable for males to assert dominance (Glen & Feldberg, 1977; Hodson, 1989).
Organizational Management Practices and Job Satisfaction
The 21st century brought forth a global economy whereby organizations must be results-
oriented as the marketplace is highly competitive. Today’s leaders hold themselves and
employees accountable for performance and results, and at the same time, employees expect
supervisors to be supportive of their needs. Leaders recognize that employees’ performance,
level of commitment to organizational values and goals, motivation, and job satisfaction have
considerable influence over the success or failure of the organization (Society for Human
Resource Management, 2011). Literature from the fields of organizational management and
psychology concluded that participative management practices influenced employees’
67
motivation, performance, and job satisfaction (Harrison, Killion, & Mitchell, 1989; Kim, 2002;
Vroom, 1964). These practices included routine assessments of employees’ performance and
assigned duties, strategic planning and empowerment, positive relationships among employees
and supervisors, and development of employees’ skills (Cook, 2000; DeSantis & Durst, 1996;
Duffy, 2004; Lee & Bruvold, 2003; Noer, 1993; Rango, 1996).
Empowered Employees
Employee empowerment, a participatory practice to engage individuals in decision
making, is a desirable tool between employees and supervisors to motivate workers to improve
individual performance and thusly, the organization (Butts, Vandenberg, DeJoy, Schaffer, &
Wilson, 2009; Lawler, 1996; Spreitzer, 1995; Wagner, 1994; Wagner & Gooding, 1987).
Empowerment practices implied the existence of routine collaboration among supervisors and
employees, sharing of information, goal setting, and problem solving (Butts et al., 2009; Lawler,
1996; Spreitzer, 1995; Wagner, 1994). Workplace empowerment reflected a continuous
improvement cycle: the creation of a vision and agreed-upon values with input from
stakeholders, division of responsibilities among employees, training and skill development,
improvements in organizational processes, and progress monitoring (Cook, 1994).
Many studies of organizational management linked employee empowerment to job
satisfaction (Butts et al., 2009; Lawler, Ledford & Mohrman, 1989; Vanderberg, Richardson, &
Eastman, 1999). Conversely, organizations choosing not to empower employees in decision
making may suffer the consequences of unmotivated workers, absenteeism, poor performance,
lack of commitment, and negative communication exchanges (Markos & Sridevi, 2010).
In a survey of almost 1,750 employees in the retail industry in the United States,
researchers investigated whether workplace empowerment increased motivation and satisfaction
68
of employees (Butts et al., 2009). Findings demonstrated that employees felt empowered when
they believed their actions made a positive impact in the workplace (Butts et al., 2009).
Interestingly, empowerment reduced stress among workers yet did not improve performance
unless paired with supervisory support (Butts et al., 2009). When employees perceived support
from supervisors, organizational commitment improved (Butts et al., 2009). Notably, these
researchers emphasized that relationships between supervisors and employees influence
motivation, performance, and job satisfaction (Butts et al., 2009).
Studies of several companies supported the importance of employee empowerment as a
means to improve individual and organizational performance (Development Dimensions
International, 2011; Lloyd, 1996; Rodriguez, 1994). Avnet, Inc., a distributor of electronics
equipment, sought to improve its performance through implementation of participatory decision
making practices to empower employees (DDI, 2011). This company involved employees in the
development of short and long-range corporate productivity goals to which employees’
performance goals were linked, accompanied by coaching and training to improve skills (DDI,
2011). Survey results from almost 800 employees showed that almost 90% felt a sense of shared
responsibility for the success of the company as a result of this environment, over 90% indicated
individual goals were aligned to organizational goals, and 80% felt increased communication
among employees and supervisors improved performance (DDI, 2011). Other corporate
examples of employee empowerment included Nissan Corporation and British Gas Corporation,
both of which solicited suggestions from staff to address problems in the workplace and
encouraged employees to problem solve (Lloyd, 1996; Rodriguez, 1994).
In other meta-analyses studies of organizational management practices, findings showed
that employees with empowerment and opportunities to participate in decisions experienced
69
higher levels of satisfaction, performance, organizational commitment, and had fewer instances
of physical and/or mental health problems (Spector, 1986; Miller & Monge, 1986).
Work Redesign to Improve Motivation and Performance
Hackman and Oldham (1976) expanded the research of content and process theories
(Maslow, 1943; Herzberg et al., 1959; Vroom, 1964; Adams, 1963) by proposing a job
dimension-work redesign model to improve employee motivation and performance. This model
identified work dimensions and attitudes that, when combined, increased motivation,
performance, and outcomes (Hackman & Oldham, 1976). These dimensions included the skills
required to complete tasks, employees’ successful completion and perceived importance of tasks,
autonomy, and feedback (Hackman & Oldham, 1976). Attitudes included tasks that employees
identified as meaningful, perceptions of personal responsibility, and feedback (Hackman &
Oldham, 1976). When jobs incorporated these practices, employees’ motivation, performance,
and satisfaction improved (Hackman & Oldham (1976).
Hackman and Oldham (1976) explored their proposition of work redesign through a
survey to 650 employees and supervisors in the retail industry. Participants identified job
characteristics relative to work dimensions, level of meaningfulness associated with work duties,
and performance (Hackman & Oldham, 1976). Findings showed that jobs with more than one
dimension, accompanied by autonomy and feedback, led to increased motivation, performance,
and satisfaction among employees (Hackman & Oldham, 1976). This study is pertinent to
organizational management as leaders interested in long-term job satisfaction and its benefit to
their employees and organization as a whole, should examine employees’ job duties and
restructure them accordingly to develop skills, connect tasks to organizational goals, and provide
feedback as a means to increase motivation and productivity (Hackman & Oldham, 1997).
70
Strategic Planning
Human resources management literature identified strategic planning as a means to
engage and involve stakeholders in the current and future direction of an organization (Berman
& West, 1998; Cook, 2000; Duffy, 2004). Strategic planning allows leaders and stakeholders to
craft a vision for the organization, based on identified strengths and needs, and develop a plan to
move the organization toward a new direction (Berry & Wechsler, 1995; Cook, 2000; Duffy,
2004). Strategic planning is viewed as a venue for stakeholder interaction to prioritize
organizational wants/needs and align resources to fulfill goals (Ashe & Bowman, 1989; Cook,
2000; Duffy, 2004). Strategic planning measures are relevant to organizational management as
supervisors and employees collaborate to advance the organization toward the direction of its
desired goals (Ashe & Bowman, 1989; Cook, 2000; Duffy, 2004). Employees involved in
strategic planning influence the workplace and its culture; as a result, individuals are more likely
to develop a sense of shared responsibility and job fulfillment (Daniels & Bailey, 1999; Kim,
2002). Employees’ involvement in strategic planning leads to improved communication and
understanding among workers regarding the organization’s direction and their roles in attaining
short and long-term objectives (Kim, 2002).
Employee-Supervisor Relationships
Several studies illustrated that humanistic management practices build positive
relationships among employees and supervisors, and these exchanges influence job satisfaction
(Butts et al., 2009; Daley, 1986; DDI, 2011, Emmert & Taher, 1992; Hackman & Oldham,
1976). Humanistic management exchanges include clarification of work duties, shared decision
making, goal setting, coaching, and feedback (Butts et al., 2009; Daley, 1986; DDI, 2011;
Emmert & Taher, 1992; Hackman & Oldham, 1976). Daley’s (1986) study of 340 Ohio state
71
agency employees demonstrated that workers felt valued when supervisors demonstrated
humanistic and participatory practices. Emmert and Taher (1992) concurred, adding that
feedback from supervisors influenced both field workers and professional staff. Other
recommended supervisory practices promoted a culture of idea exchange, collaboration among
colleagues, innovation, and problem solving (London, Larsen, & Thisted, 1999).
Investing in Employees
The success and sustainability of organizations most often depend on the skills and
adaptability of the workforce, and a number of studies of organizational management tend to
emphasize the wisdom of investing in its employees. Content and process theories reiterated that
human actions were driven by psychological needs paired with intrinsic and/or extrinsic
motivators, all of which influenced employees’ performance and job satisfaction (Adams, 1963;
Maslow, 1954; Herzberg et al., 1959; Vroom, 1964). It is understandable that organizations
exhaust a great deal of time and effort on the recruitment, induction, training, and retention of its
employees, as personnel costs may comprise as much as three-fourths of its annual operating
costs (NCDPI, 2012).
Investments in employees typically manifest themselves as salaries and benefits,
employee training, and establishment of participatory practices to engage and empower
employees in decision making (Chang, Chiu, & Chen, 2010). Salaries are viewed as tangible
rewards, and workers perceive compensation as a measure of commitment the organization has
to its workforce (Brown & Mitchell, 1993; Oliver & Anderson, 1994). Employee training has
long-term positive effect when employees practice and apply new skills to tasks assigned in the
workplace; however, studies indicated that employee training has a financial cost to the
organization (Chang et al., 2010; Choo & Bowley, 2007; Erstad, 1997). Other benefits of
72
employee training included collaboration, job satisfaction, and organizational commitment
(Bateman & Strasser, 1984; Chang et al., 2010; Choo & Bowley, 2007). Employers who
provided training to its employees were perceived as being committed to advancing the skills of
the workforce; thus, job security and retention resulted (Allen & Meyer, 1990; Gregersen &
Black, 1990; Naumann, 1993). Similarly, a cross-cultural job satisfaction study among nurses in
the U.S. and Singapore (N=405) revealed that employees were committed to the workplace when
the employer put forth measures to develop workers’ skills (Lee & Bruvold, 2003).
With regard to salary of North Carolina’s public school employees, districts fund their
positions in a variety of ways. Such methods include state-funded position allotments, state
and/or federally funded financial allocations that are specific to a particular program, grant
application, or local revenues (NCDPI Finance and Business Services Division, 2013). The
salary of central office administrators is determined by district size (total student population) and
supplemental pay that may be provided by the local education agency (NCDPI Finance and
Business Services Division, 2013). Local education agencies typically recognize employees who
have completed a graduate or doctoral degree with an additional $126 monthly or $253
respectively (NCDPI Finance and Business Services Division, 2013). Furthermore, school
districts may choose to provide local supplemental pay to employees due to variance in market
demand, demographics, geographic location, or hard-to-staff positions (NCDPI Finance and
Business Services Division, 2013).
North Carolina Public Schools’ salary guidelines for supervisors are applicable to a
variety of district leadership positions, including associate superintendents, assistant
superintendents, directors, supervisors, coordinators, and finance officers (NCDPI Finance and
Business Services Division, 2013). Table 1 displays the salary ranges for these positions,
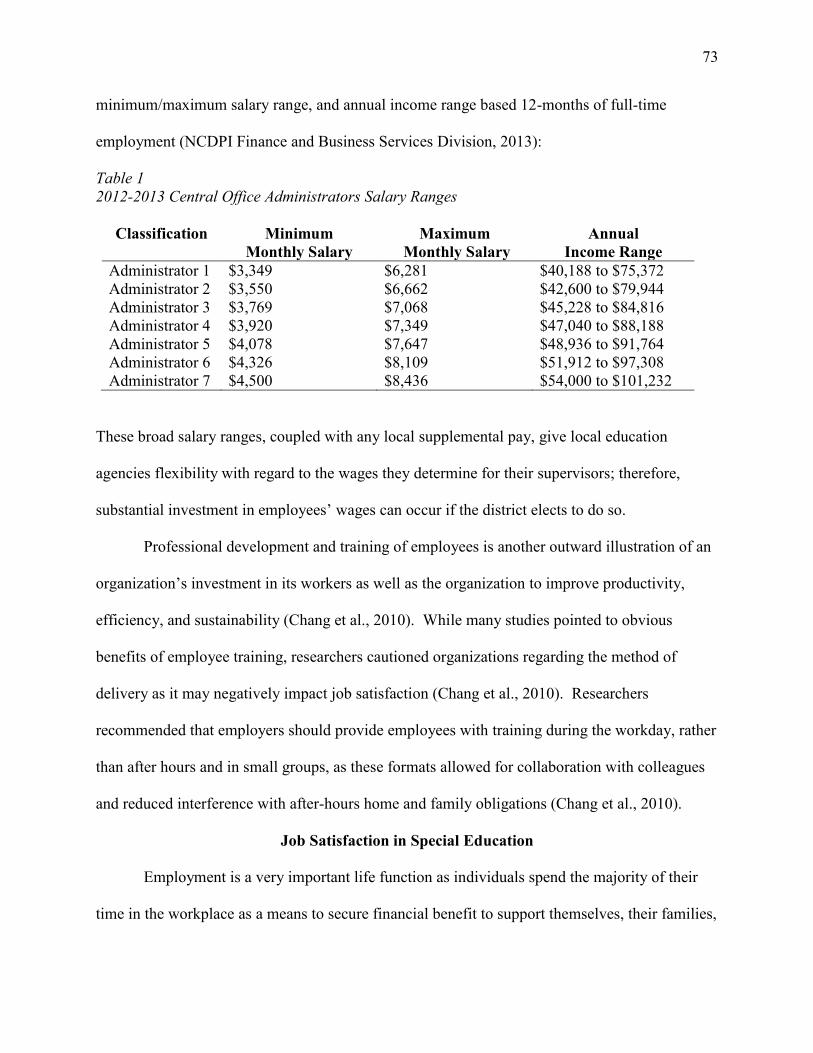
73
minimum/maximum salary range, and annual income range based 12-months of full-time
employment (NCDPI Finance and Business Services Division, 2013):
Table 1
2012-2013 Central Office Administrators Salary Ranges
Classification Minimum
Monthly Salary
Maximum
Monthly Salary
Annual
Income Range
Administrator 1 $3,349 $6,281 $40,188 to $75,372
Administrator 2 $3,550 $6,662 $42,600 to $79,944
Administrator 3 $3,769 $7,068 $45,228 to $84,816
Administrator 4 $3,920 $7,349 $47,040 to $88,188
Administrator 5 $4,078 $7,647 $48,936 to $91,764
Administrator 6 $4,326 $8,109 $51,912 to $97,308
Administrator 7 $4,500 $8,436 $54,000 to $101,232
These broad salary ranges, coupled with any local supplemental pay, give local education
agencies flexibility with regard to the wages they determine for their supervisors; therefore,
substantial investment in employees’ wages can occur if the district elects to do so.
Professional development and training of employees is another outward illustration of an
organization’s investment in its workers as well as the organization to improve productivity,
efficiency, and sustainability (Chang et al., 2010). While many studies pointed to obvious
benefits of employee training, researchers cautioned organizations regarding the method of
delivery as it may negatively impact job satisfaction (Chang et al., 2010). Researchers
recommended that employers should provide employees with training during the workday, rather
than after hours and in small groups, as these formats allowed for collaboration with colleagues
and reduced interference with after-hours home and family obligations (Chang et al., 2010).
Job Satisfaction in Special Education
Employment is a very important life function as individuals spend the majority of their
time in the workplace as a means to secure financial benefit to support themselves, their families,
74
and contribute to organizations within the community. It is a fact that much of an individual’s
time is spent in the workplace; therefore, one can reasonably assert that work influences one’s
level of satisfaction and happiness (Smith, 2007).
According to the research of Smith (2007) who examined census reports and data from
General Social Surveys from 1988-2006 (N=27,587), individuals in supervisory and
management roles had greater job satisfaction and happiness than unskilled laborers and entry
level positions (Smith, 2007). Using mean scores ranging from 0 to 4, occupations were
identified that provided the highest and lowest levels of employee satisfaction (Smith, 2007):
Top 10 occupations with highest levels of job satisfaction:
- Clergy, 3.79 and 87.2% satisfied
- Physical therapists, 3.72 and 78.1% satisfied
- Firefighters, 3.67 and 80.1% satisfied
- Education administrators, 3.62 and 68.4% satisfied
- Painters, sculptors, 3.62 and 67.3% satisfied
- Teachers, 3.62 and 69.2% satisfied
- Authors, 3.61 and 74.2% satisfied
- Psychologists, 3.59 and 66.9% satisfied
- Special education teachers, 3.59 and 70.1% satisfied
- Operating engineers, 3.56 and 64.1% satisfied
Bottom 10 occupations with lowest levels of job satisfaction:
- Roofers, 2.84 and 25.3% satisfied
- Waiters/servers, 2.85 and 27 percent satisfied
- Laborers, 2.86 and 21.4% satisfied
75
- Bartenders, 2.88 and 26.4% satisfied
- Packers and packagers, 2.88 and 23.7% satisfied
- Freight and stock handlers, 2.91 and 25.8% satisfied
- Apparel salespersons, 2.93 and 23.9% satisfied
- Cashiers, 2.94 and 25% satisfied
- Food preparers, 2.95 and 23.6% satisfied
- Expediters, 2.97 and 37% satisfied (Smith, 2007, p. 5)
In measures of happiness, the leading occupations were clergy, firefighters, transportation
and reservation personnel, architects, and special education teachers (Smith, 2007). Almost 60%
of special education teachers indicated job happiness (Smith, 2007). The bottom five jobs in
terms of happiness were garage attendants, roofers, machine operators, construction workers, and
other trades (Smith, 2007). Occupations whereby employees contributed to the health of others
gave these workers a higher level of happiness, whereas unskilled labor positions scored low on
the happiness scale, according to Smith (2007).
Job Satisfaction of Special Education Teachers
Several studies pointed to relationships between working conditions and job satisfaction,
retention, and attrition of special education teachers (Billingsley, 2004; Colbert & Wolff, 1992;
Embich, 2001; Gersten et al., 2001; Shann, 1998). Billingsley (2004) concluded that the
teacher’s level of experience and workplace variables, including school climate, mentoring
programs, and meaningful relationships with co-workers, influenced organizational commitment
and retention of special education teachers. Colbert and Wolff (1992) found that special
education attrition was a national concern as 50% of special education teachers vacated the
profession in the first few years of employment when assigned to non-supportive environments.
76
Sirk (1999) explored the perceptions of special education teachers (N=157) in West
Virginia regarding their perceptions of support from the principal and special education director
with regard to intrinsic and extrinsic job satisfaction. These teachers perceived principals as
being most supportive in the development of community relations and training of staff; however,
principals were perceived as least supportive in the coordination of special education services
(Sirk, 1999). Conversely, special education directors were perceived as being most supportive in
the coordination of special education services, development of curricula, and professional
development (Sirk, 1999). Findings showed significance between the special education teachers’
perceptions of principal support and extrinsic job satisfaction (Sirk, 1999). In addition, the study
showed these teachers’ perceptions of special education director support had an effect on their
intrinsic and extrinsic job satisfaction (Sirk, 1999). Sirk (1999) concluded that while special
education teachers viewed their principal as supportive, the special education director had greater
influence on the overall job satisfaction of these teachers. Sirk (1999) suggested collaboration
among principals and special education directors to provide support to staff, take steps to reduce
paperwork, redesign workload when possible, and develop their skills.
Gersten et al. (2001) surveyed special education teachers (N=887) of three large urban
districts to investigate their perceptions of factors that influenced job satisfaction and retention,
such as work design, working conditions, and participatory practices. This study yielded a
remarkable response rate of 81% of the special education teachers in the specified districts
(Gersten et al., 2001). Findings showed that the support special educators received from
principals and colleagues were the greatest factors influencing job satisfaction by helping them
to understand their role in the organization (Gersten et al., 2001).
77
The special education teachers surveyed in the Gersten et al. (2001) study expressed
dissatisfaction with their jobs and voiced concern about stress and work design. Work design
stressors included vast amounts of special education paperwork and lengthy IEP Team meetings
which interfered with teaching (Gersten et al., 2001). Other concerns included an inadequate
amount of time for lesson planning and collaboration with colleagues, as well as difficulties in
differentiating instruction for many students (Gersten et al., 2001). Gersten et al. (2001) stated
that these stressors may lead to attrition or serve as catalysts for these special educators to vacate
the position and seek other roles (Gersten et al., 2001). These researchers recommended that
school-level and district leaders reexamine the work responsibilities of special education
personnel and make necessary adjustments where possible to improve working conditions and
job satisfaction in efforts to reduce attrition (Billingsley, 2004: Gersten et al., 2001).
Several studies directed attention to work-related burnout as a variable influencing job
satisfaction, recruitment, and retention of special education teachers (Billingsley, 2004; Embich,
2001; Gersten et al, 1995; Gersten et al., 2001; Kaufhold, Alvarez, & Arnold, 2006; Maslach,
Jackson, & Leiter, 1996; Schlichte, Yssel, & Merbler, 2005). Burnout is defined as “a syndrome
of emotional exhaustion, depersonalization, and reduced personal accomplishment that can occur
among individuals who work with others in some capacity” (Maslach, Jackson, & Leiter, 1996,
p. 4). In a contemporary definition, Espeland (2006) defined burnout as a state of reduced
energy in the workplace with low self-confidence and accompanied by exhaustion.
Special education teacher burnout may be attributed to many factors. Such factors
included use of personal income for materials and a lack of training and support to meet the
needs of children with disabilities (Kaufhold et al., 2006). In addition, burnout among novice
special education teachers was attributed to large caseloads to manage, classroom management
78
issues, minimal parental and administrative support, a deficit of planning time with colleagues,
and deficiencies in mentor support (Schlichte, Yssel, & Merbler, 2005). Conclusions of the
special education teacher case studies by Schlichte et al. (2005) illustrated that novice teachers
desired the support of administrators and a mentor willing to coach and develop their skills.
A study by Embich (2001) examined the role of special education teachers whose current
teaching assignment was that of co-teaching with a general education teacher in heterogeneous,
or mixed abilities, class. These special education teachers (N=300) assigned to co-teaching roles
stated they felt ambiguity with their role (Embich, 2001). They reported exhaustion and pressure
to demonstrate mastery of several grade levels of curricula and proficiency in lesson
modifications to meet students’ diverse learning needs (Embich, 2001). School scheduling
caused additional pressure for these teachers as they were not able to attend all grade level
planning sessions at their assigned school due to direct teaching commitments (Embich, 2001).
Other factors causing exhaustion were large caseloads and special education files of which these
teachers were responsible, time spent coordinating parents’ participation in IEP Team meetings,
and the length of such meetings (Embich, 2001). Burnout may lead to other organizational
management issues such as absenteeism, worker disengagement, conflict, and attrition; therefore,
leaders should examine and redesign employees’ job responsibilities regularly (Maslach,
Schaufeli, & Leiter, 2001).
Job Satisfaction of Special Education Administrators
While there are many research studies on the job satisfaction of teachers, principals, and
superintendents in public education, very few studies exist on the job satisfaction of special
education directors. A search of the Proquest Dissertation and Theses database yielded only four
studies when co-joined terms were used in its advanced search function: special education-
79
special education administrators-job satisfaction. One such study was conducted by DiPierro
(2003) who explored the job satisfaction and attrition of special education directors (N=267) in
New Jersey. DiPierro (2003) found that that over 90% of these special education directors
experienced extreme workplace demands; however, more than half reported they were satisfied
with their jobs. While the focus of the Sirk (1999) study was the perceptions of special
education teachers (N=157) in West Virginia regarding administrative support, findings
concluded that special education directors greatly influenced both the intrinsic and extrinsic job
satisfaction of these teachers. The Sirk (1999) study showed that special education teachers
perceived the special education director as being supportive in the management of the special
education program, curriculum development, and training of staff.
A study by Godshall (2004) explored the factors that influenced the job satisfaction of
New York’s special education directors (N=322). This mixed methods research study used the
Minnesota Satisfaction Questionnaire and interviews of 10 respondents which yielded a response
rate of 42.5% (Godshall, 2004). Findings implied that the job satisfaction of these special
education administrators was influenced by intrinsic factors, such a desire to contribute to the
welfare of children with disabilities, the community and society, and to strengthen relationships
between schools and parents (Godshall, 2004).
District size also played a role in job satisfaction in the Godshall (2004) study. Findings
showed that special education directors of small (fewer than 500 students) and large districts
(greater than 5,001 students) experienced greater job satisfaction than mid-sized districts
(between 501 and 5,000 students ) (Godshall, 2004). Godshall (2004) speculated as to why these
leaders of small and large districts had higher job satisfaction than mid-size districts – smaller
student population and fewer workplace demands in small districts, and large districts have
80
greater numbers of employees which allow for task delegation. Respondents reporting a heavy
workload were less satisfied on the job (Godshall, 2004).
A study of non-public school administrators of special education programs in California
supported the findings of Godshall (2004) regarding the influence of intrinsic factors on job
satisfaction (Houpt, 2009). While this study had a low response rate (N=91), survey responses
showed that these special education administrators felt gratification from the nature of the work,
its challenges, and opportunities to collaborate with others (Houpt, 2009). Additionally, findings
showed that special education administrators with more years of experience in the position
reported higher job satisfaction than novice special education administrators (Houpt, 2009).
In summary, conclusions reached from these studies were that employees’ job
satisfaction was influenced by many intrinsic and extrinsic factors. Organizations should take
note of the role of humanistic and participatory management practices in the workplace and their
effects on the overall motivation, performance, and job satisfaction of employees.
Measures of Job Satisfaction
Studies of employee job satisfaction are important in organizational management as
human behaviors are motivated by cognitive and affective evaluations made by workers and are
shaped by individual needs, values, and experiences, as described in content and process theories
(Adams, 1963; Maslow, 1943; Herzberg et al., 1959; Moorman, 1993; Vroom, 1964). In the
workplace individuals make cognitive assessments of their assigned job duties, their
performance, promotion opportunities, and goals (Moorman, 1993). Workers also make
affective evaluations formulated on feelings, perceptions of the environment, and relationships
with others (Moorman, 1993). Job satisfaction instruments attempt to measure both the
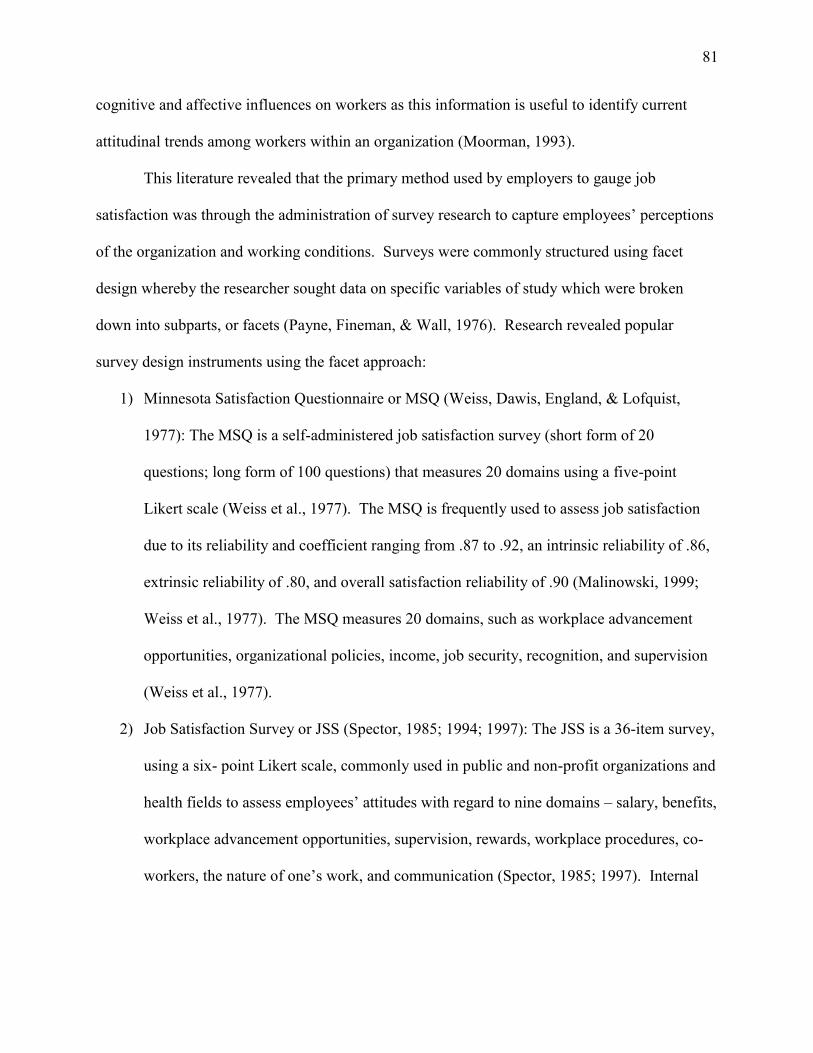
81
cognitive and affective influences on workers as this information is useful to identify current
attitudinal trends among workers within an organization (Moorman, 1993).
This literature revealed that the primary method used by employers to gauge job
satisfaction was through the administration of survey research to capture employees’ perceptions
of the organization and working conditions. Surveys were commonly structured using facet
design whereby the researcher sought data on specific variables of study which were broken
down into subparts, or facets (Payne, Fineman, & Wall, 1976). Research revealed popular
survey design instruments using the facet approach:
1) Minnesota Satisfaction Questionnaire or MSQ (Weiss, Dawis, England, & Lofquist,
1977): The MSQ is a self-administered job satisfaction survey (short form of 20
questions; long form of 100 questions) that measures 20 domains using a five-point
Likert scale (Weiss et al., 1977). The MSQ is frequently used to assess job satisfaction
due to its reliability and coefficient ranging from .87 to .92, an intrinsic reliability of .86,
extrinsic reliability of .80, and overall satisfaction reliability of .90 (Malinowski, 1999;
Weiss et al., 1977). The MSQ measures 20 domains, such as workplace advancement
opportunities, organizational policies, income, job security, recognition, and supervision
(Weiss et al., 1977).
2) Job Satisfaction Survey or JSS (Spector, 1985; 1994; 1997): The JSS is a 36-item survey,
using a six- point Likert scale, commonly used in public and non-profit organizations and
health fields to assess employees’ attitudes with regard to nine domains – salary, benefits,
workplace advancement opportunities, supervision, rewards, workplace procedures, co-
workers, the nature of one’s work, and communication (Spector, 1985; 1997). Internal
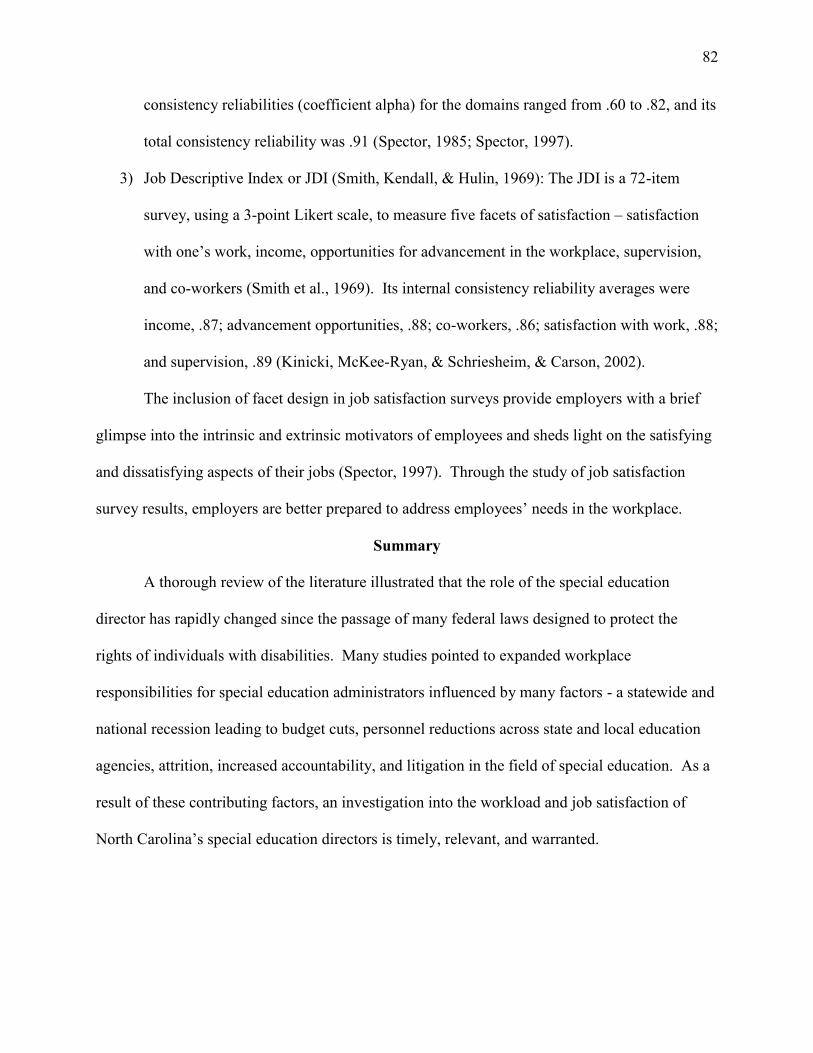
82
consistency reliabilities (coefficient alpha) for the domains ranged from .60 to .82, and its
total consistency reliability was .91 (Spector, 1985; Spector, 1997).
3) Job Descriptive Index or JDI (Smith, Kendall, & Hulin, 1969): The JDI is a 72-item
survey, using a 3-point Likert scale, to measure five facets of satisfaction – satisfaction
with one’s work, income, opportunities for advancement in the workplace, supervision,
and co-workers (Smith et al., 1969). Its internal consistency reliability averages were
income, .87; advancement opportunities, .88; co-workers, .86; satisfaction with work, .88;
and supervision, .89 (Kinicki, McKee-Ryan, & Schriesheim, & Carson, 2002).
The inclusion of facet design in job satisfaction surveys provide employers with a brief
glimpse into the intrinsic and extrinsic motivators of employees and sheds light on the satisfying
and dissatisfying aspects of their jobs (Spector, 1997). Through the study of job satisfaction
survey results, employers are better prepared to address employees’ needs in the workplace.
Summary
A thorough review of the literature illustrated that the role of the special education
director has rapidly changed since the passage of many federal laws designed to protect the
rights of individuals with disabilities. Many studies pointed to expanded workplace
responsibilities for special education administrators influenced by many factors - a statewide and
national recession leading to budget cuts, personnel reductions across state and local education
agencies, attrition, increased accountability, and litigation in the field of special education. As a
result of these contributing factors, an investigation into the workload and job satisfaction of
North Carolina’s special education directors is timely, relevant, and warranted.
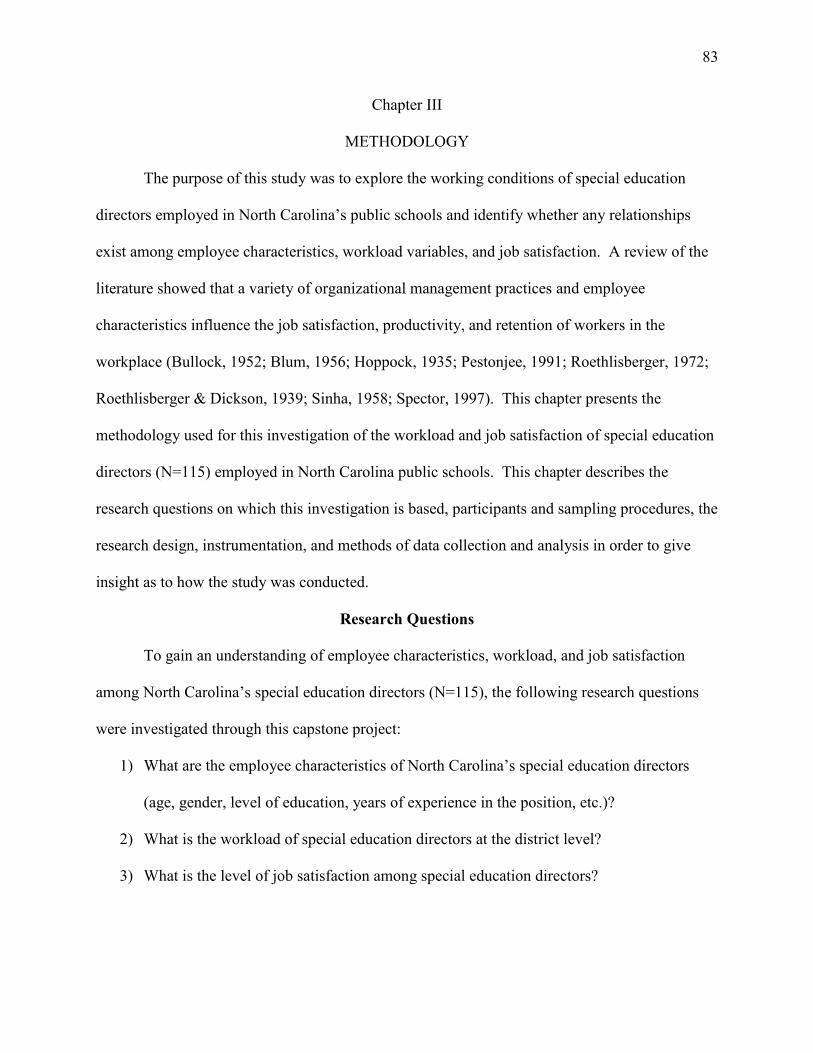
83
Chapter III
METHODOLOGY
The purpose of this study was to explore the working conditions of special education
directors employed in North Carolina’s public schools and identify whether any relationships
exist among employee characteristics, workload variables, and job satisfaction. A review of the
literature showed that a variety of organizational management practices and employee
characteristics influence the job satisfaction, productivity, and retention of workers in the
workplace (Bullock, 1952; Blum, 1956; Hoppock, 1935; Pestonjee, 1991; Roethlisberger, 1972;
Roethlisberger & Dickson, 1939; Sinha, 1958; Spector, 1997). This chapter presents the
methodology used for this investigation of the workload and job satisfaction of special education
directors (N=115) employed in North Carolina public schools. This chapter describes the
research questions on which this investigation is based, participants and sampling procedures, the
research design, instrumentation, and methods of data collection and analysis in order to give
insight as to how the study was conducted.
Research Questions
To gain an understanding of employee characteristics, workload, and job satisfaction
among North Carolina’s special education directors (N=115), the following research questions
were investigated through this capstone project:
1) What are the employee characteristics of North Carolina’s special education directors
(age, gender, level of education, years of experience in the position, etc.)?
2) What is the workload of special education directors at the district level?
3) What is the level of job satisfaction among special education directors?
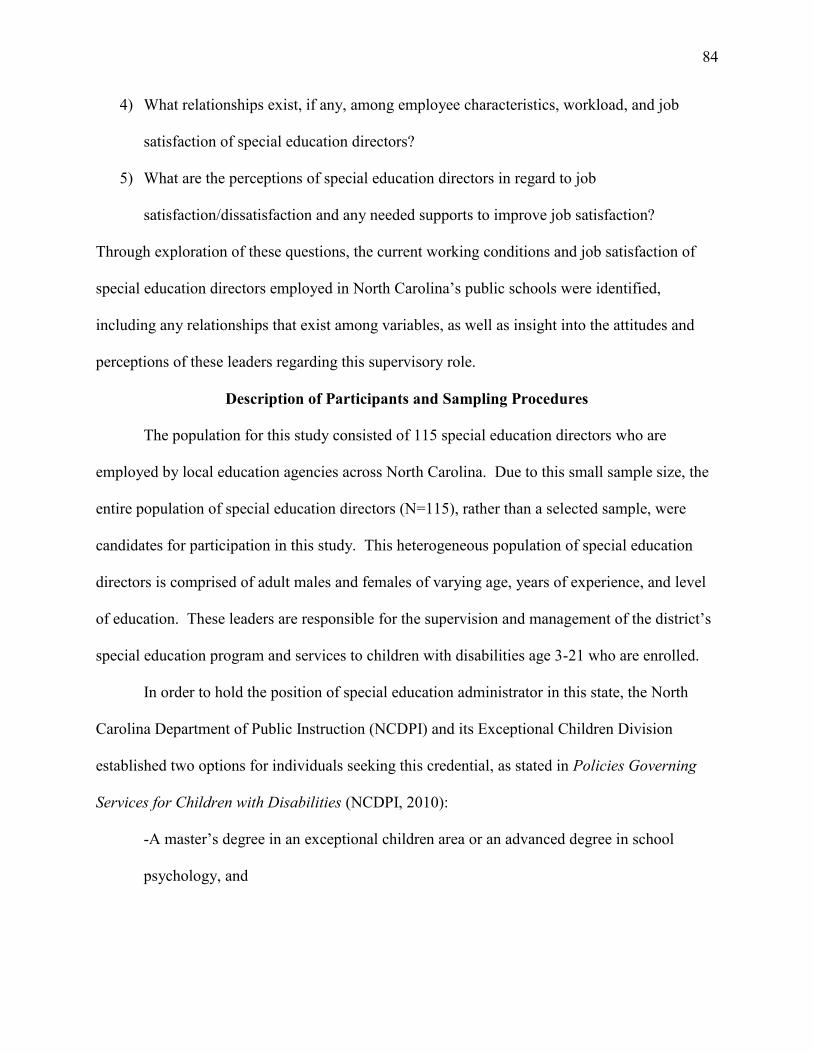
84
4) What relationships exist, if any, among employee characteristics, workload, and job
satisfaction of special education directors?
5) What are the perceptions of special education directors in regard to job
satisfaction/dissatisfaction and any needed supports to improve job satisfaction?
Through exploration of these questions, the current working conditions and job satisfaction of
special education directors employed in North Carolina’s public schools were identified,
including any relationships that exist among variables, as well as insight into the attitudes and
perceptions of these leaders regarding this supervisory role.
Description of Participants and Sampling Procedures
The population for this study consisted of 115 special education directors who are
employed by local education agencies across North Carolina. Due to this small sample size, the
entire population of special education directors (N=115), rather than a selected sample, were
candidates for participation in this study. This heterogeneous population of special education
directors is comprised of adult males and females of varying age, years of experience, and level
of education. These leaders are responsible for the supervision and management of the district’s
special education program and services to children with disabilities age 3-21 who are enrolled.
In order to hold the position of special education administrator in this state, the North
Carolina Department of Public Instruction (NCDPI) and its Exceptional Children Division
established two options for individuals seeking this credential, as stated in Policies Governing
Services for Children with Disabilities (NCDPI, 2010):
-A master’s degree in an exceptional children area or an advanced degree in school
psychology, and
85
-Three graduate semester hours of credit in each: administration, curriculum
development, supervision, and
-A passing score on the National Teachers Examination/Praxis Educational Leadership:
Administration and Supervision exam, or
-A master’s degree in administration and/or curriculum and instruction, and
-Nine semester hours of course work in exceptional children, and
-A passing score on the NTE/Praxis Educational Leadership: Administration and
Supervision exam (NCDPI, 2010, p. 43).
These options allow flexibility for North Carolina’s special education directors regarding
the type of master’s degree required for this supervisory role. Individuals in North Carolina who
are employed in this position by a local education agency, but lack the required credentials, must
seek a provisional license from the state education agency and complete required courses
through an institution of higher education (NCDPI, 2010). Similar to other states, North
Carolina requires a passing score on a professional examination as a means to document
executive leadership competencies (NCDPI, 2010, p. 43).
To identify the names of individuals employed as district special education directors in
North Carolina for inclusion in this sample, the researcher located a name directory LEA
Exceptional Children Program Directors on the web site of the North Carolina Department of
Public Instruction (NCDPI). Next, the work/professional email addresses of special education
directors were identified through school district web sites as this information was available to the
general public. This sampling design, known as census sampling, allowed for the collection of
information from an entire population to investigate the phenomena of study (Kish, 1979).
86
Telephone calls were made as needed when the director’s contact information was not listed on
the district’s web site. This information was compiled into an Excel spreadsheet for ease of use.
North Carolina’s charter schools were excluded from this this study as these educational
units operate independently and are granted flexibility through state statute 115C-238.29F to
employ individuals who do not hold a current teaching license (North Carolina Department of
Public Instruction, n.d.; North Carolina Office of Charter Schools, 2013). As a result of this
licensure flexibility, charter schools may employ individuals to oversee their special education
program who do not possess the credential for the position. Local education agencies,
conversely, must employ individuals who hold the required licensure for their position (NCDPI
Licensure Division, 2013).
Mixed Methods Research Design
A mixed methods research design was instituted for this study to investigate the
employee characteristics, workload, and job satisfaction of North Carolina’s special education
directors (N=115). A mixed methods design allowed for the collection of both quantitative and
qualitative data through a single study (Creswell, 2008; Creswell, 2011; Johnson &
Onwuegbuzie, 2004). According to Johnson and Onwuegbuzie (2004), an emerging trend is an
interdisciplinary approach to research through the blending of quantitative and qualitative
methods in an effort to produce exemplary results. Quantitative and qualitative data collection
allowed for in-depth investigation of the topic by exploring attitudes and perceptions of the
sample and corroboration of evidence from multiple sources of information, or triangulation
(Creswell, 2008; Creswell, 2011).
To implement this mixed methods research design, a cross-sectional survey was instituted
whereby data were collected at one point in time to measure the attitudes and perceptions of the
87
sample (Creswell, 2008; Creswell, 2011). To ensure the study protected the rights of
participants, a research proposal and the Special Education Director Survey (Appendix D) were
submitted to the Wingate University Research Review Board (RRB) for review and approval.
Upon RRB approval, a description of the study and survey were distributed to special education
directors using Qualtrics, a web-based platform for survey research (Qualtrics, 2011).
Survey Research in Special Education
The literature review of special education administration showed that researchers
frequently institute survey research as a way to assess phenomena in this field. Literature
supports the utilization of survey research as it allows researchers to sample a group to identify
perceptions of a topic of study and produce descriptive and inferential statistics (Creswell, 2011;
Pinsonneault & Kraemer, 1993). Benefits of survey research include data collection through a
structured questionnaire, descriptions of a sample, examination of variables, and application of
statistical measures to draw inferences among data (Creswell, 2011; Dillman, 1978; Fowler,
1984; Mueller, Liebig, & Hattrup, 2007; Pinsonneault & Kraemer, 1993).
Survey research is similar to other forms of research in that it considers study design,
sampling, and data collection (Dillman, 1978; Fowler, 1984; Pinsonneault & Kraemer, 1993). In
review of the literature, researchers piloted surveys among individuals with similar
characteristics of the sample and to ensure its contents aligned to the study (Creswell, 2011;
Fowler, 1984; Gall, Gall, & Borg, 2003; Pinsonneault & Kraemer, 1993). Cross-sectional
surveys, producing one-time data collection, were commonly used to investigate special
education administration, while a few studies deployed longitudinal surveys to capture data more
frequently (Creswell, 2011; Dillman, 1978; Fowler; 1984; Pinsonneault & Kraemer, 1993).
Making generalizations from a cross-sectional survey is difficult as it only collects data once,
88
whereas, longitudinal surveys collect data more often and aid in reliability of the study
(Creswell, 2011; Dillman, 1978; Fowler, 1984; Pinsonneault & Kraemer, 1993). Researchers of
survey design must consider sample size and type to ensure respondents represent the population
(Creswell, 2011; Dillman, 1978; Fowler, 1984). To increase the validity of surveys, researchers
should attempt to secure a 50 percent or greater response rate (Creswell, 2011).
Researchers of survey design must consider methods of data collection. Surveys provide
data from individuals; results are combined through descriptive statistics (Creswell, 2008;
Creswell, 2011; Pinsonneault & Kraemer, 1993). Popular methods of survey distribution include
mail, telephone, and the internet as means to assemble facts quickly; however, surveys may not
be beneficial when investigating a controversial subject (Creswell, 2011; Fowler, 1984;
Pinsonneault & Kraemer, 1993). Internet-based surveys are popular due to ease of distribution
among a sample, inexpensive cost, reductions in transcription errors, savings of time, and
computerized analysis (Cook, Heath, & Thompson, 2000; Mueller, Liebig, & Hattrup, 2007).
Literature supported the addition of qualitative data collection through open-ended
questions, interviews, focus groups, and coding of responses to supplement quantitative data
generated by surveys (Creswell, 2011; Fowler, 1984; Pinsonneault & Kraemer, 1993). The use
of both types of data, or mixed methods research design, allows for comparisons in order to
determine whether agreement exists among findings, or triangulation (Creswell, 2011;
Pinsonneault & Kraemer, 1993).
Instrumentation
To institute this study, an online survey was developed, consisting of four sections: 1)
employee characteristics, 2) workload, 3) job satisfaction, and 4) three open ended questions.
Sections one, two, and three collected quantitative data on employee characteristics, workload,
89
and job satisfaction by posing closed questions to participants with categorical and Likert scale
answer choices. Three of four sections of this survey were developed by the researcher -
employee characteristics, workload, and open-ended questions, based on prior experience in
special education administration, as well as conclusions drawn from a review of literature in
special education administration and relevant studies. The inclusion of open-ended questions
into the survey assisted in the collection of qualitative data from special education directors to
assess their attitudes and perceptions of their supervisory role with regard to areas of greatest
satisfaction, dissatisfaction, and needed supports.
To assess the level of job satisfaction among the sample, a research-validated instrument
of job satisfaction known as the Job Satisfaction Survey (JSS) was incorporated into this study.
This instrument was selected as it is one of many popular tools used by public and private sector
human services organizations to evaluate the job satisfaction of employees (Cook, Hepworth,
Wall, & Warr, 1981; Spector, 1997). Written consent was secured from JSS creator Dr. Paul
Spector (Appendix B), professor of Industrial/Organizational Psychology of the University of
South Florida, to incorporate this instrument in the researcher’s survey to participants (P.
Spector, personal communication, December 31, 2012).
The JSS was selected due to its brevity and measures of workplace components that are
known to influence satisfaction (Spector, 1994). This 36-item Likert scale survey explores nine
facets of workplace satisfaction: income, promotion, supervision, employee benefits, contingent
rewards, operational conditions, relationships with co-workers, the nature of one’s work, and
communication (Spector, 1994). In addition, the internal consistency reliabilities (coefficient
alpha) for these domains of the JSS range from .60 to .82, and the total consistency reliability for
90
the instrument is .91 (Spector, 1985; Spector, 1997). According to Nunnally (1978), the
acceptable minimum standard for internal consistency is .70.
The inclusion of facet design in job satisfaction surveys provides a glimpse into the
intrinsic and extrinsic motivators of employees and may expose the satisfying and dissatisfying
aspects of their jobs (Spector, 1997). Job satisfaction measures provide insight into human
behavior and attempt to identify individuals’ attitudes and perceptions of the workplace, its
operations, strengths within the organization, and areas of improvement (Spector, 1997).
Through the study of job satisfaction employers are better prepared to address employees’ needs
in the workplace (Spector, 1997).
The JSS is available free of charge for non-commercial educational use or research with
the stipulation that JSS results be provided to Spector so that norms may be updated (Spector,
2011). The JSS web site at http://shell.cas.usf.edu/~pspector/scales/jsspag.html identifies the
required data to submit: means per subscale and total score, sample size and brief description,
and name of the country where data were collected. Additional data may be submitted to
Spector such as standard deviations per subscale and total and coefficient alpha per subscale and
total. Spector will receive the JSS data and an electronic copy of the capstone project upon
completion of this study.
Methods used to Enhance Reliability and Validity
Prior to the Wingate University Research Review Board (RRB) submission, the proposed
special education survey was reviewed by five individuals with expertise in special education
administration and/or human resources leadership in order to solicit their feedback on the
questionnaire and improve its reliability and validity. In the review of the literature researchers
typically piloted surveys among individuals with similar characteristics of the sample to ensure
91
its contents aligned to the subject of investigation (Creswell, 2011; Fowler, 1984; Gall et al.,
2003; Pinsonneault & Kraemer, 1993). Based on their feedback, the survey was revised
accordingly. Once approved by the Wingate University Research Review Board (Appendix A),
the consent letter/description of the study (Appendix C) and special education director survey
(Appendix D) were distributed to the targeted population for participation in the study.
Methods of Data Collection
The professional email contact information of special education directors (N=115)
employed by public school districts across the state was collected and used to distribute a
description of the study and hyperlink to the online survey. The consent letter/description of the
study (Appendix C) identified its purpose, benefits and risks of participation, and the option to
withdraw consent to participate and discontinue involvement at any time without consequence.
Question one of the survey addressed consent for participation. To protect the identities and
confidentiality of participants, the survey was anonymized so that responses were not directly
associated with individuals. Through anonymity, participants were more likely to respond and
provide candid responses to the survey. The survey remained open for four weeks to give
respondents adequate time to respond. Through Qualtrics software, email reminders were
generated at one-week intervals to those who have not responded in order to increase the
response rate of the study.
Methods of Data Analysis
In a review of literature regarding statistical measures applied to survey research,
conventional methods of analysis included descriptive statistics, cross tabulation, chi square, t-
test, Pearson product-moment correlation, logistic and multiple regressions (Creswell, 2011; Gall
et al., 2003; Pagano, 2010; Qualtrics, 2011). Descriptive statistics produced information about
92
the sample and allowed for analysis in the form of percentages, mean scores, range, and
frequency distribution (Creswell, 2011; Gall et al., 2003). Cross tabulation allowed for the
analysis of categorical data among selected variables and displayed information in numbers of
respondents (Qualtrics, 2011). Chi square analysis compared actual results to expected results to
determine whether a significant difference existed (Creswell, 2011; Qualtrics, 2011). Pearson
product-moment correlation identified whether correlation existed among variables; however,
correlation cannot determine causation (Pagano, 2010). Logistic and multiple regressions
examined whether correlation existed among selected independent and dependent variables and
identified the probability that as one variable changed, so did the other (Pagano, 2010).
Quantitative and qualitative data generated from the survey were analyzed using
descriptive and inferential statistics and identified whether any significance existed among
selected variables. The survey’s quantitative measures, in the form of closed questions using
categorical and Likert scale answer choices, identified employee characteristics, workload, and
job satisfaction of the sample. The survey’s qualitative measures, through three open-ended
questions (Appendix E, F, G), identified the attitudes and perceptions of these special education
directors with regard to the areas of greatest satisfaction and dissatisfaction in this supervisory
role and what supports, if any, were needed to improve satisfaction. Data analysis tools within
the Qualtrics and Excel programs assisted in investigation of the research questions of the study.
Lastly, qualitative analysis occurred through coding of participants’ responses to the three
open-ended questions embedded in the survey. Coding of the open-ended responses identified
central themes, similarities, and differences among participants and assisted in triangulation of
data (Creswell, 2011). As suggested by Creswell (2011), open-ended responses were read a
minimum of three times to gain an understanding of the each statement, overall context,
93
accompanied by notations in margins to identify central ideas, phrases, or concepts. Next,
responses were coded to identify themes, or categories, and supporting text to serve as evidence
of the central idea (Creswell, 2011). Afterward, initial themes were sorted into broad themes
among the qualitative data, accompanied by supporting evidence from text (Creswell, 2011).
Coding of qualitative data may yield expected themes, unexpected themes, themes that do not fit
into a particular category, and major/minor themes (Creswell, 2011). This qualitative analysis
identified the similarities and differences among North Carolina’s special education directors
with regard to their attitudes and perceptions of workload and job satisfaction.
Based on these quantitative and qualitative findings, recommendations were posed to
improve the working conditions and job satisfaction of North Carolina’s special education
directors as these variables influence the recruitment, hiring, and retention of individuals into this
key leadership role.
Summary
This chapter provided an overview of the researcher’s methodology used to conduct this
study on the employee characteristics, workload, and job satisfaction of special education
directors across North Carolina. Though a mixed methods design and survey, both quantitative
and qualitative data were collected to investigate the working conditions of special education
directors, their perceptions, and attitudes regarding areas of satisfaction and dissatisfaction in this
complex leadership role.
94
Chapter IV
RESULTS
This mixed methods research study investigates the employee characteristics, workload,
and job satisfaction of special education directors employed in North Carolina’s public school
districts and identifies whether any relationships existed among these variables. This study also
explores the perceptions and attitudes of special education directors regarding areas of
satisfaction and dissatisfaction in their respective roles, and what supports they believe are
necessary to improve job satisfaction.
Methods of data collection included the distribution of a consent letter/description of the
study (Appendix B) and cross-sectional survey (Appendix D) to the population of special
education directors (N=115) using Qualtrics, an internet-based program for survey research. Use
of a cross-sectional survey assisted in the collection of quantitative and qualitative data from this
population promptly at one point in time to investigate the phenomena (Creswell, 2011). To
distribute this online survey, the names and work email addresses of special education directors
were collected through district web sites and directory LEA Exceptional Children Program
Directors located on the web site of the North Carolina Department of Public Instruction.
Due to this small sample size, census sampling was instituted as it was necessary to
survey the entire population of special education directors (N=115) to investigate the topic of
study (Kish, 1979). An online survey was presented to potential participants, whose responses
were anonymous, in order to protect identities, confidentiality, and to encourage candid
responses. As a result, participants’ responses were not associated to specific individuals. The
survey remained open for 30 days to provide adequate time for individuals to participate.
Individuals not responding to the survey received weekly email reminders in an effort to increase
95
participation. Participant consent was required for participation in the study and was secured
through question one of the survey. Participants were free to withdraw consent and discontinue
involvement at any time without consequence. Participants received direct benefit for participation
in this study as data will provide insight into the special education director position, workload,
and job satisfaction of individuals serving in this role. Additionally, this study benefits education
agencies as they recruit, hire, induct, and retain individuals into the role of special education
director. Special education directors giving consent for participation completed the survey which
was comprised of four sections: 1) employee characteristics, 2) workload, 3) job satisfaction, and
4) open-ended questions.
Three of four sections of the survey were developed by the researcher - employee
characteristics, workload, and three open-ended questions, based on information learned from a
review of existing literature in special education administration, as well as her prior experience
as a special education director. To assess job satisfaction, a research-validated measure known
as the Job Satisfaction Survey (JSS) (Spector, 1994) was selected for incorporation into the
overall survey. The creator of the JSS, professor and psychologist Dr. Paul Spector of the
University of South Florida, gave permission for this instrument to be used as a component of
the overall survey to special education directors (Appendix B).
Upon closure, 91 of 115 special education directors responded to the survey, giving the
study a 79.13% participation rate. Partial survey responses were accepted; thus, the number of
responses differed with each question. This high response rate was well above the anticipated
50% rate set as a goal.
96
Research Questions
To gain an understanding of employee characteristics, workload, and job satisfaction
among special education directors employed in public school districts across North Carolina, the
following research questions were investigated:
1) What are the employee characteristics of North Carolina’s special education directors
(age, gender, level of education, years of experience in the position, etc.)?
2) What is the workload of special education directors at the school district level?
3) What is the level of job satisfaction among special education directors?
4) What relationships exist, if any, among employee characteristics, workload, and job
satisfaction of special education directors?
5) What are the perceptions of special education directors in regard to job
satisfaction/dissatisfaction and any needed supports to improve job satisfaction?
The application of descriptive statistics produced information regarding the sample and
allowed for data analysis in the form of percentages, mean scores, range, and frequency
distribution (Creswell, 2011; Gall et al., 2003). Additionally, utilization of statistical measures
such as chi square, t-test, Pearson product-moment correlation, logistic regression, and multiple
regressions determined whether relationships, correlation, or differences existed among selected
variables. Coding of qualitative data generated from the three open-ended questions identified
central themes of similarity and outliers among this population of special education directors
with regard to areas of satisfaction, dissatisfaction, and perceived supports to improve job
satisfaction. Data analysis provided an understanding of these areas of investigation, allowing
for the exploration of attitudes and perceptions of this population, and further helped to

97
corroborate, or triangulate, evidence from multiple sources of information (Creswell, 2008;
Creswell, 2011).
Question One: Employee Characteristics
Section one of the survey investigated employee characteristics of North Carolina’s
special education directors by posing 13 questions with Likert scale categorical answer choices
for consideration. These questions examined the following: gender, age, highest level of
education, years of experience as a special education director, years of experience in public
education, acquisition of the job, and credentials as a North Carolina Exceptional Children
Program Administrator. The questions further examined participant salary, prior experience as a
school principal, number of years before retirement eligibility, intent to remain in the position,
size of the district’s special education population, and total student population.
Gender and Age
Survey results revealed that 90 respondents identified gender and 91 identified age. Data
showed a prevalence of females in special education administration as evidenced by 74 women
in this position, 82%, and 16 males, 18%, in this role. The most common age range was 51 to 55
years of age. Over 37% of special education directors were between 41 to 50 years of age, and
over 40% were between 51 to 60 years of age. Table 2 illustrates a cross tabulation and
frequency distribution of age and gender of this population (N=90):
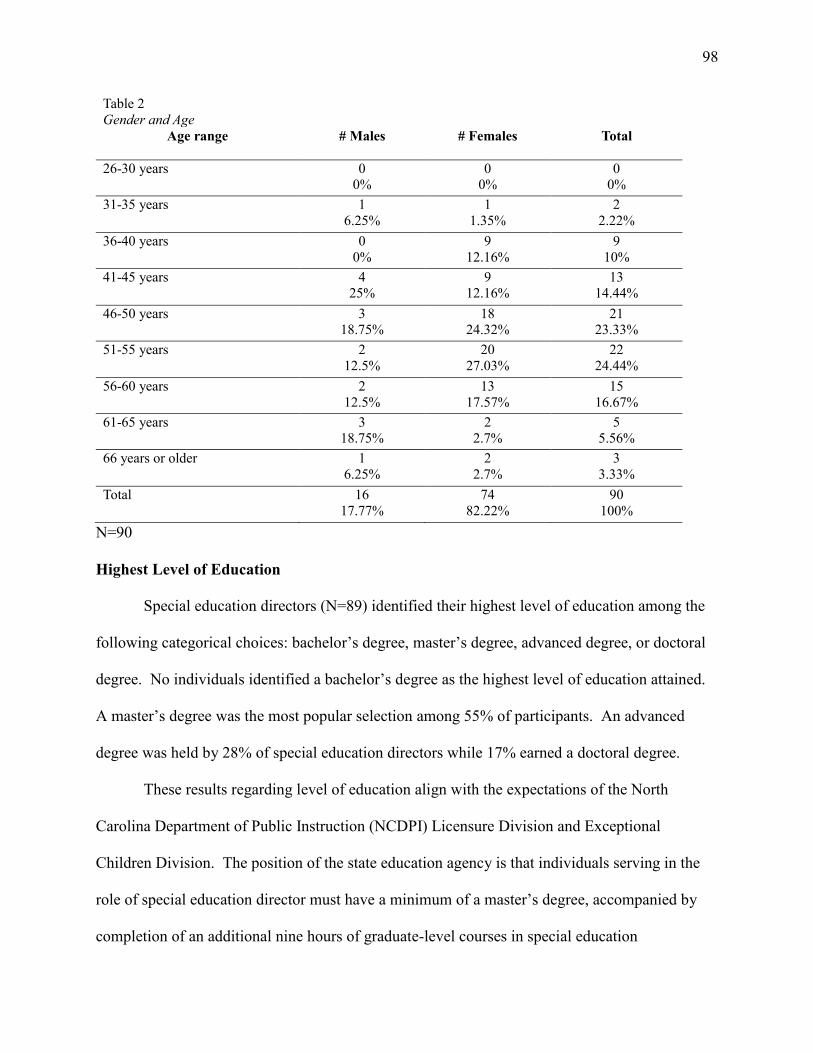
98
Table 2
Gender and Age
Age range
# Males # Females Total
26-30 years 0
0%
0
0%
0
0%
31-35 years 1
6.25%
1
1.35%
2
2.22%
36-40 years 0
0%
9
12.16%
9
10%
41-45 years 4
25%
9
12.16%
13
14.44%
46-50 years 3
18.75%
18
24.32%
21
23.33%
51-55 years 2
12.5%
20
27.03%
22
24.44%
56-60 years 2
12.5%
13
17.57%
15
16.67%
61-65 years 3
18.75%
2
2.7%
5
5.56%
66 years or older 1
6.25%
2
2.7%
3
3.33%
Total 16
17.77%
74
82.22%
90
100%
N=90
Highest Level of Education
Special education directors (N=89) identified their highest level of education among the
following categorical choices: bachelor’s degree, master’s degree, advanced degree, or doctoral
degree. No individuals identified a bachelor’s degree as the highest level of education attained.
A master’s degree was the most popular selection among 55% of participants. An advanced
degree was held by 28% of special education directors while 17% earned a doctoral degree.
These results regarding level of education align with the expectations of the North
Carolina Department of Public Instruction (NCDPI) Licensure Division and Exceptional
Children Division. The position of the state education agency is that individuals serving in the
role of special education director must have a minimum of a master’s degree, accompanied by
completion of an additional nine hours of graduate-level courses in special education
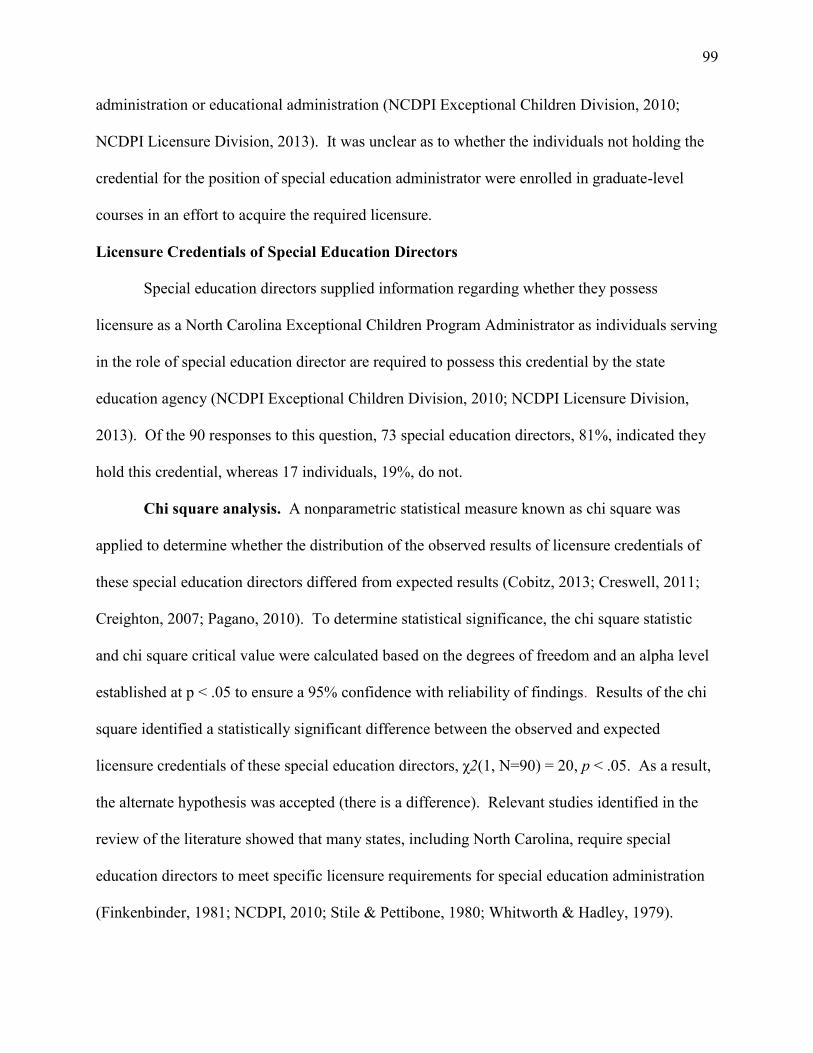
99
administration or educational administration (NCDPI Exceptional Children Division, 2010;
NCDPI Licensure Division, 2013). It was unclear as to whether the individuals not holding the
credential for the position of special education administrator were enrolled in graduate-level
courses in an effort to acquire the required licensure.
Licensure Credentials of Special Education Directors
Special education directors supplied information regarding whether they possess
licensure as a North Carolina Exceptional Children Program Administrator as individuals serving
in the role of special education director are required to possess this credential by the state
education agency (NCDPI Exceptional Children Division, 2010; NCDPI Licensure Division,
2013). Of the 90 responses to this question, 73 special education directors, 81%, indicated they
hold this credential, whereas 17 individuals, 19%, do not.
Chi square analysis. A nonparametric statistical measure known as chi square was
applied to determine whether the distribution of the observed results of licensure credentials of
these special education directors differed from expected results (Cobitz, 2013; Creswell, 2011;
Creighton, 2007; Pagano, 2010). To determine statistical significance, the chi square statistic
and chi square critical value were calculated based on the degrees of freedom and an alpha level
established at p < .05 to ensure a 95% confidence with reliability of findings. Results of the chi
square identified a statistically significant difference between the observed and expected
licensure credentials of these special education directors, χ2(1, N=90) = 20, p < .05. As a result,
the alternate hypothesis was accepted (there is a difference). Relevant studies identified in the
review of the literature showed that many states, including North Carolina, require special
education directors to meet specific licensure requirements for special education administration
(Finkenbinder, 1981; NCDPI, 2010; Stile & Pettibone, 1980; Whitworth & Hadley, 1979).
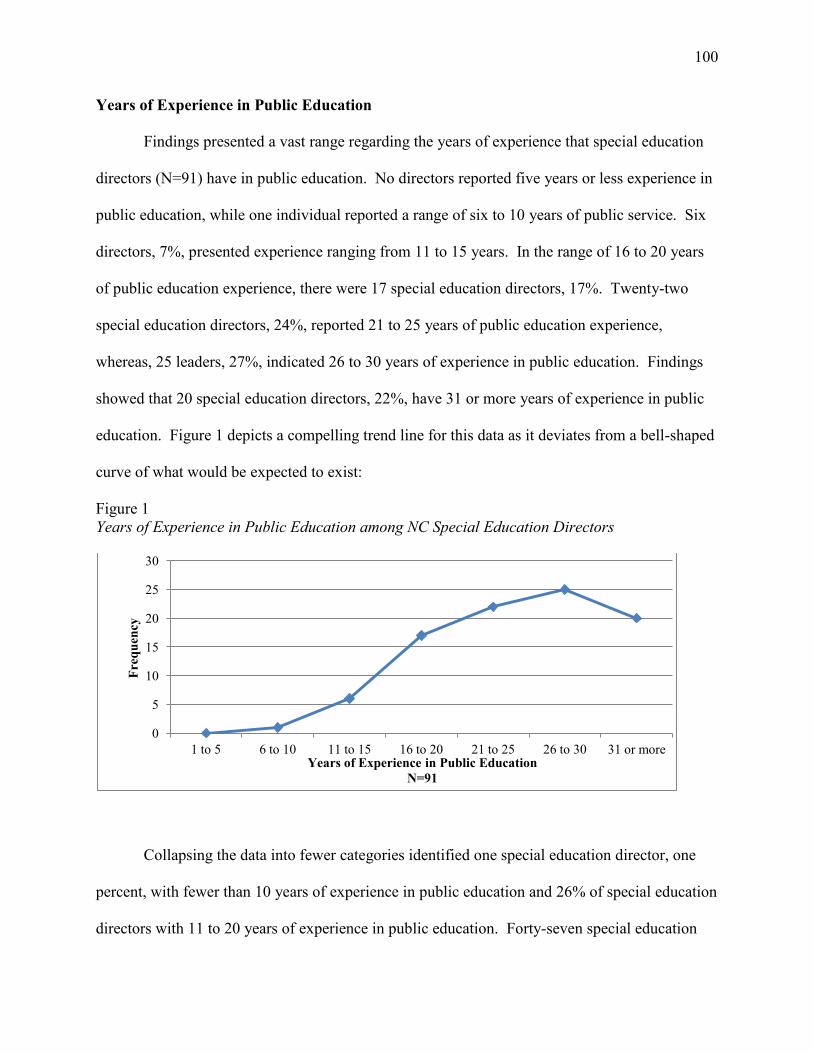
100
Years of Experience in Public Education
Findings presented a vast range regarding the years of experience that special education
directors (N=91) have in public education. No directors reported five years or less experience in
public education, while one individual reported a range of six to 10 years of public service. Six
directors, 7%, presented experience ranging from 11 to 15 years. In the range of 16 to 20 years
of public education experience, there were 17 special education directors, 17%. Twenty-two
special education directors, 24%, reported 21 to 25 years of public education experience,
whereas, 25 leaders, 27%, indicated 26 to 30 years of experience in public education. Findings
showed that 20 special education directors, 22%, have 31 or more years of experience in public
education. Figure 1 depicts a compelling trend line for this data as it deviates from a bell-shaped
curve of what would be expected to exist:
Figure 1
Years of Experience in Public Education among NC Special Education Directors
Collapsing the data into fewer categories identified one special education director, one
percent, with fewer than 10 years of experience in public education and 26% of special education
directors with 11 to 20 years of experience in public education. Forty-seven special education
0
5
10
15
20
25
30
1 to 5 6 to 10 11 to 15 16 to 20 21 to 25 26 to 30 31 or more
Fre
qu
ency
Years of Experience in Public Education
N=91
101
leaders, 51%, were identified with 21 to 30 years of experience in public education, and 20
special education directors, 22%, presented 31 or more years of experience in public education.
Almost 75% have 20 years of experience in public education; therefore, it is likely that special
education administration in North Carolina will undergo vast turnover in the upcoming years.
Years of Experience as Special Education Director
Data unveiled a prevalence of novice special education directors in North Carolina. Of
this population (N=91), 48 individuals, 52.74%, have fewer than five years of experience in this
role, and 21 individuals, 23%, reported six to10 years of experience in the position. The most
common range among this population was six to 10 years of experience in special education
administration. Collapsing the data in 10-year increments exposed that 69 individuals, 76%,
reported one to 10 years of experience as a special education director. Fifteen individuals, 16%,
identified 11 to 20 years of experience, and seven individuals, 7%, have 20 or more years of
experience in this supervisory role. Figure 2 presents a graphic description of these trends:
Figure 2
Years of Experience as a Special Education Director
It was noted that these data do not depict the traditional bell-shaped curve of normal distribution.
0
10
20
30
40
50
60
1-5 6-10 11-15 16-20 21-25 26-30 31 & >
Fre
qu
ency
Years of Experience as Special Education Director
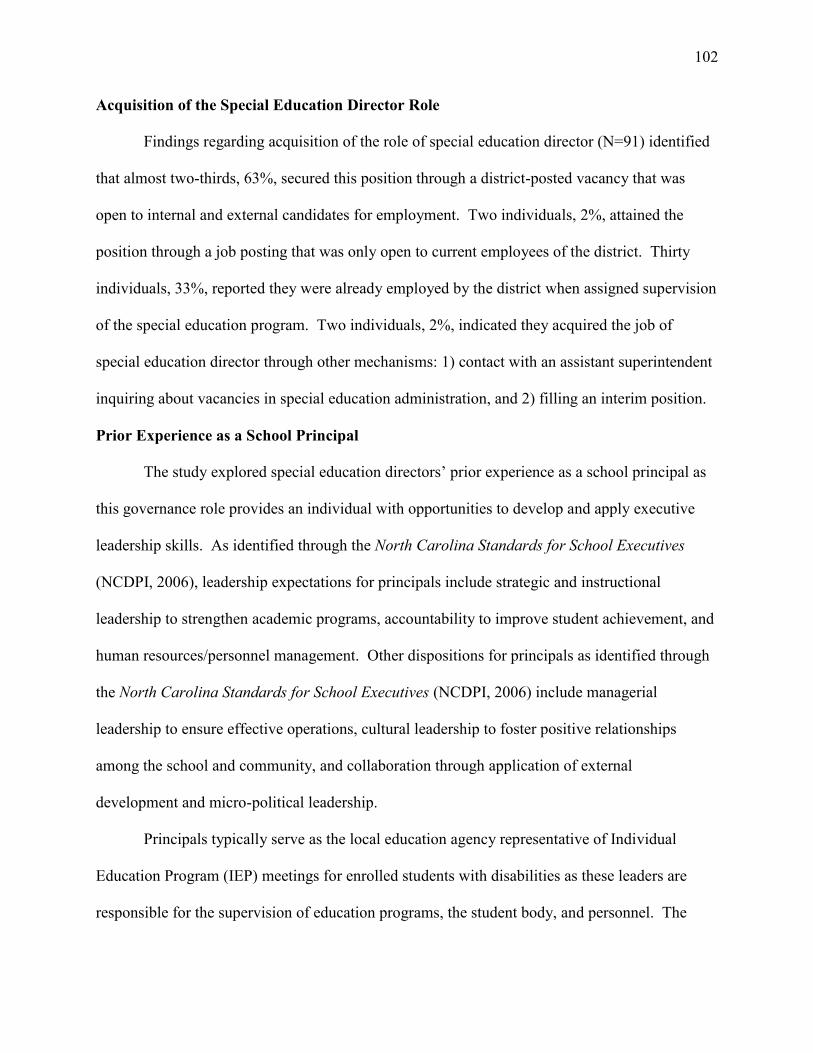
102
Acquisition of the Special Education Director Role
Findings regarding acquisition of the role of special education director (N=91) identified
that almost two-thirds, 63%, secured this position through a district-posted vacancy that was
open to internal and external candidates for employment. Two individuals, 2%, attained the
position through a job posting that was only open to current employees of the district. Thirty
individuals, 33%, reported they were already employed by the district when assigned supervision
of the special education program. Two individuals, 2%, indicated they acquired the job of
special education director through other mechanisms: 1) contact with an assistant superintendent
inquiring about vacancies in special education administration, and 2) filling an interim position.
Prior Experience as a School Principal
The study explored special education directors’ prior experience as a school principal as
this governance role provides an individual with opportunities to develop and apply executive
leadership skills. As identified through the North Carolina Standards for School Executives
(NCDPI, 2006), leadership expectations for principals include strategic and instructional
leadership to strengthen academic programs, accountability to improve student achievement, and
human resources/personnel management. Other dispositions for principals as identified through
the North Carolina Standards for School Executives (NCDPI, 2006) include managerial
leadership to ensure effective operations, cultural leadership to foster positive relationships
among the school and community, and collaboration through application of external
development and micro-political leadership.
Principals typically serve as the local education agency representative of Individual
Education Program (IEP) meetings for enrolled students with disabilities as these leaders are
responsible for the supervision of education programs, the student body, and personnel. The
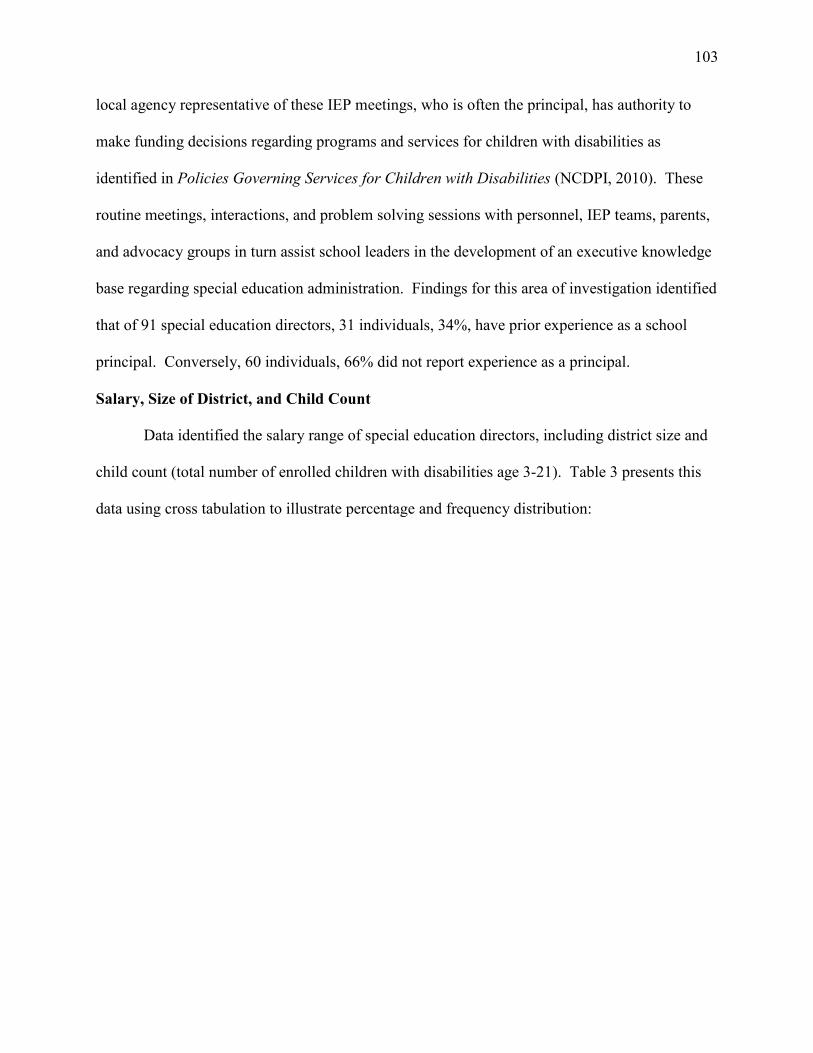
103
local agency representative of these IEP meetings, who is often the principal, has authority to
make funding decisions regarding programs and services for children with disabilities as
identified in Policies Governing Services for Children with Disabilities (NCDPI, 2010). These
routine meetings, interactions, and problem solving sessions with personnel, IEP teams, parents,
and advocacy groups in turn assist school leaders in the development of an executive knowledge
base regarding special education administration. Findings for this area of investigation identified
that of 91 special education directors, 31 individuals, 34%, have prior experience as a school
principal. Conversely, 60 individuals, 66% did not report experience as a principal.
Salary, Size of District, and Child Count
Data identified the salary range of special education directors, including district size and
child count (total number of enrolled children with disabilities age 3-21). Table 3 presents this
data using cross tabulation to illustrate percentage and frequency distribution:
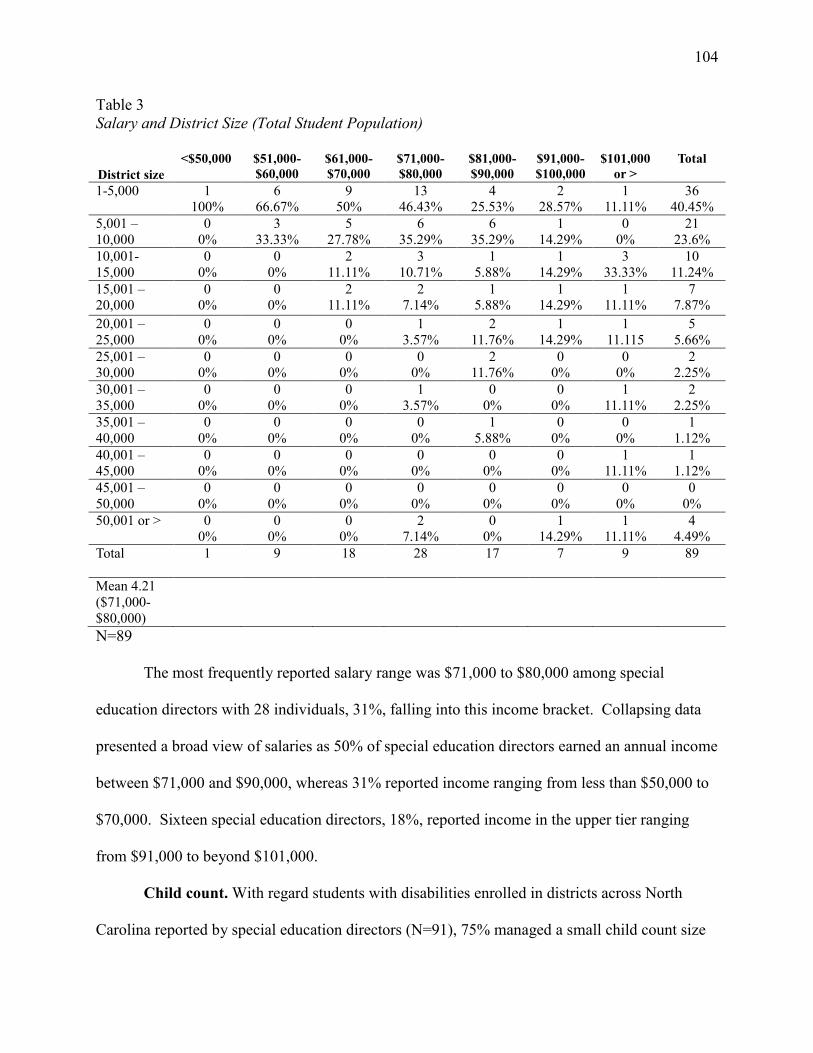
104
Table 3
Salary and District Size (Total Student Population)
District size
<$50,000 $51,000-
$60,000
$61,000-
$70,000
$71,000-
$80,000
$81,000-
$90,000
$91,000-
$100,000
$101,000
or >
Total
1-5,000
1
100%
6
66.67%
9
50%
13
46.43%
4
25.53%
2
28.57%
1
11.11%
36
40.45%
5,001 –
10,000
0
0%
3
33.33%
5
27.78%
6
35.29%
6
35.29%
1
14.29%
0
0%
21
23.6%
10,001-
15,000
0
0%
0
0%
2
11.11%
3
10.71%
1
5.88%
1
14.29%
3
33.33%
10
11.24%
15,001 –
20,000
0
0%
0
0%
2
11.11%
2
7.14%
1
5.88%
1
14.29%
1
11.11%
7
7.87%
20,001 –
25,000
0
0%
0
0%
0
0%
1
3.57%
2
11.76%
1
14.29%
1
11.115
5
5.66%
25,001 –
30,000
0
0%
0
0%
0
0%
0
0%
2
11.76%
0
0%
0
0%
2
2.25%
30,001 –
35,000
0
0%
0
0%
0
0%
1
3.57%
0
0%
0
0%
1
11.11%
2
2.25%
35,001 –
40,000
0
0%
0
0%
0
0%
0
0%
1
5.88%
0
0%
0
0%
1
1.12%
40,001 –
45,000
0
0%
0
0%
0
0%
0
0%
0
0%
0
0%
1
11.11%
1
1.12%
45,001 –
50,000
0
0%
0
0%
0
0%
0
0%
0
0%
0
0%
0
0%
0
0%
50,001 or > 0
0%
0
0%
0
0%
2
7.14%
0
0%
1
14.29%
1
11.11%
4
4.49%
Total
1
9
18
28
17
7
9
89
Mean 4.21
($71,000-
$80,000)
N=89
The most frequently reported salary range was $71,000 to $80,000 among special
education directors with 28 individuals, 31%, falling into this income bracket. Collapsing data
presented a broad view of salaries as 50% of special education directors earned an annual income
between $71,000 and $90,000, whereas 31% reported income ranging from less than $50,000 to
$70,000. Sixteen special education directors, 18%, reported income in the upper tier ranging
from $91,000 to beyond $101,000.
Child count. With regard students with disabilities enrolled in districts across North
Carolina reported by special education directors (N=91), 75% managed a small child count size
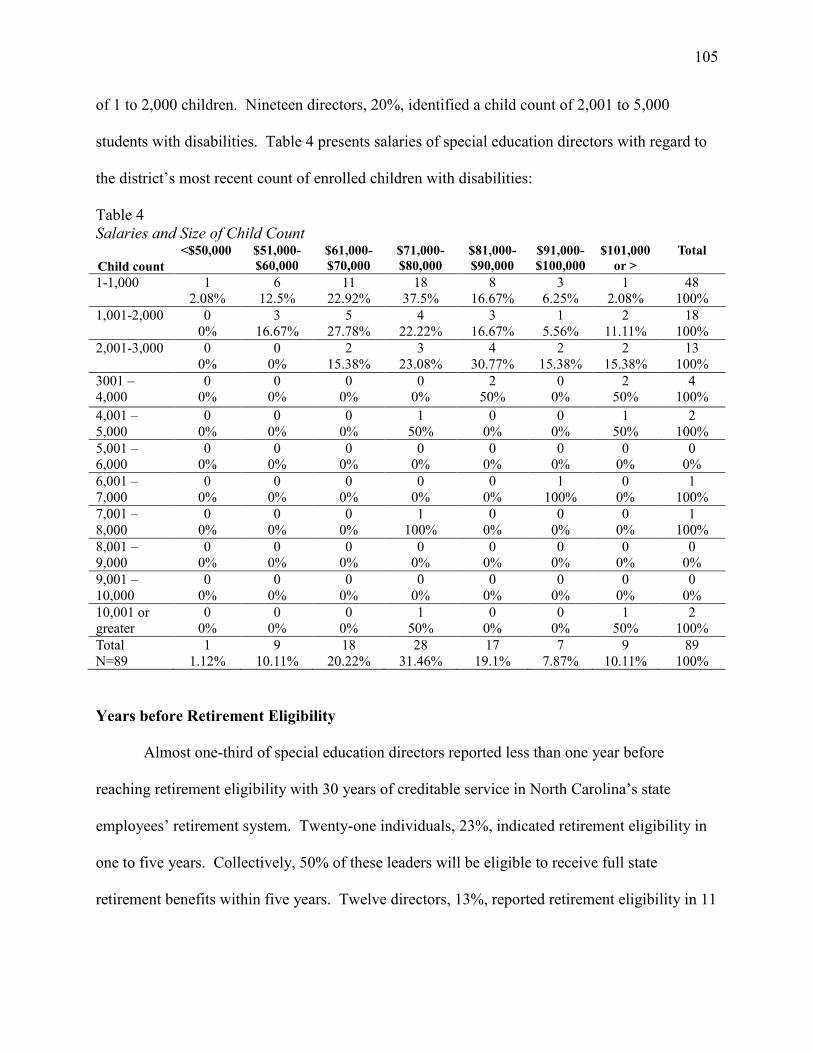
105
of 1 to 2,000 children. Nineteen directors, 20%, identified a child count of 2,001 to 5,000
students with disabilities. Table 4 presents salaries of special education directors with regard to
the district’s most recent count of enrolled children with disabilities:
Table 4
Salaries and Size of Child Count
Child count
<$50,000 $51,000-
$60,000
$61,000-
$70,000
$71,000-
$80,000
$81,000-
$90,000
$91,000-
$100,000
$101,000
or >
Total
1-1,000
1
2.08%
6
12.5%
11
22.92%
18
37.5%
8
16.67%
3
6.25%
1
2.08%
48
100%
1,001-2,000 0
0%
3
16.67%
5
27.78%
4
22.22%
3
16.67%
1
5.56%
2
11.11%
18
100%
2,001-3,000 0
0%
0
0%
2
15.38%
3
23.08%
4
30.77%
2
15.38%
2
15.38%
13
100%
3001 –
4,000
0
0%
0
0%
0
0%
0
0%
2
50%
0
0%
2
50%
4
100%
4,001 –
5,000
0
0%
0
0%
0
0%
1
50%
0
0%
0
0%
1
50%
2
100%
5,001 –
6,000
0
0%
0
0%
0
0%
0
0%
0
0%
0
0%
0
0%
0
0%
6,001 –
7,000
0
0%
0
0%
0
0%
0
0%
0
0%
1
100%
0
0%
1
100%
7,001 –
8,000
0
0%
0
0%
0
0%
1
100%
0
0%
0
0%
0
0%
1
100%
8,001 –
9,000
0
0%
0
0%
0
0%
0
0%
0
0%
0
0%
0
0%
0
0%
9,001 –
10,000
0
0%
0
0%
0
0%
0
0%
0
0%
0
0%
0
0%
0
0%
10,001 or
greater
0
0%
0
0%
0
0%
1
50%
0
0%
0
0%
1
50%
2
100%
Total
N=89
1
1.12%
9
10.11%
18
20.22%
28
31.46%
17
19.1%
7
7.87%
9
10.11%
89
100%
Years before Retirement Eligibility
Almost one-third of special education directors reported less than one year before
reaching retirement eligibility with 30 years of creditable service in North Carolina’s state
employees’ retirement system. Twenty-one individuals, 23%, indicated retirement eligibility in
one to five years. Collectively, 50% of these leaders will be eligible to receive full state
retirement benefits within five years. Twelve directors, 13%, reported retirement eligibility in 11
106
to 15 years; and seven individuals, 8%, will be eligible to retire in 16 to 20 years. One
individual, 1%, reported 21 to 25 years before retirement eligibility.
Intent to Remain in Current Position
Intent to remain in the role of special education director (N=90) was investigated. Seven
individuals, 8%, do not intend to remain in this supervisory role, whereas 46 individuals, 51%,
intend to remain in this role for the short term, one to five years. Collectively, 59% of special
education administrators reported a five-year or less commitment to their job. Thirty individuals,
33%, planned to remain in the role of special education director for the long term, six to 10
years. Six individuals, 7%, intend to remain in this position for the majority of their career. One
individual, 1%, intends to remain in the special education director position for most of his or her
career. These findings suggested great turnover in special education administration as almost
60% of these leaders indicated less than a five year commitment to this role. Factors influencing
these individuals to vacate this supervisory position were unknown.
Question Two: Workload at the District Level
Section two of the survey posed 10 questions to special education directors to investigate
their workload at the district level. These questions examined the following areas: programs to
which special education directors were assigned supervision, percentage of time devoted to these
assigned programs, and amount of time spent on supervisory duties. Questions further explored
the special education director’s involvement in district-level and community agency committees,
weekly hours worked, and frequency of overtime work to fulfill job duties. Final questions
identified whether the workload has increased for special education directors, factors causing
increased workload, and overall perception of their level of workload.
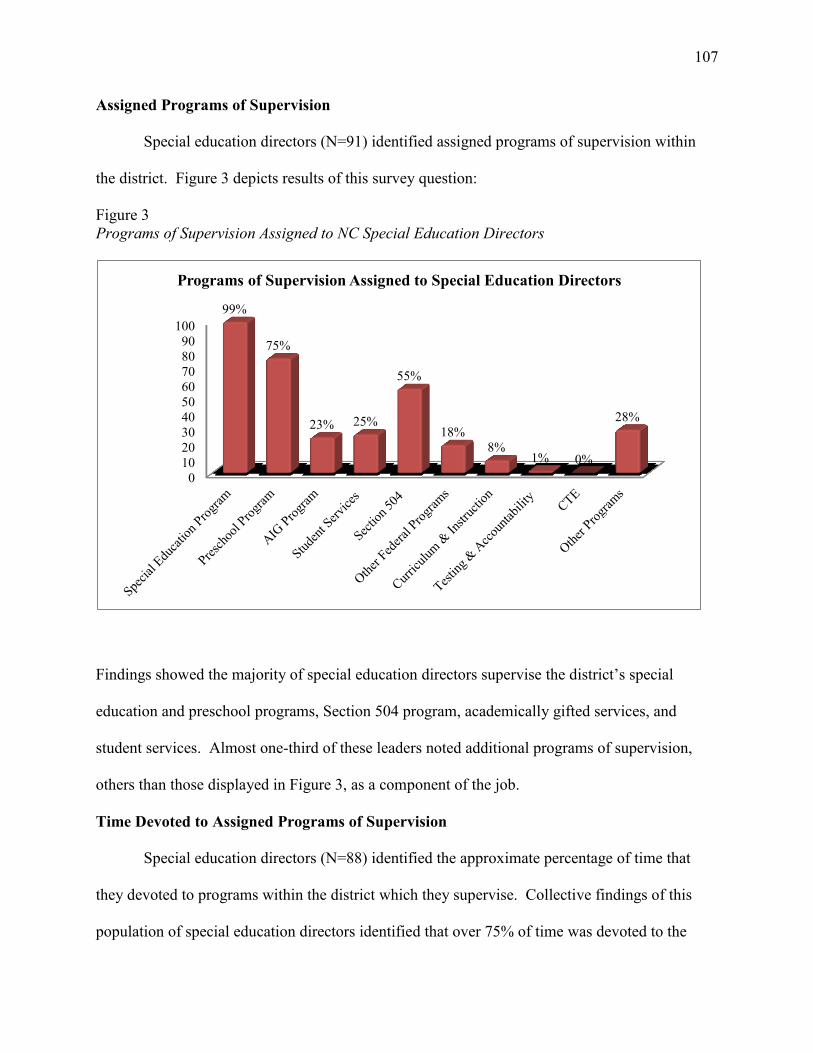
107
Assigned Programs of Supervision
Special education directors (N=91) identified assigned programs of supervision within
the district. Figure 3 depicts results of this survey question:
Figure 3
Programs of Supervision Assigned to NC Special Education Directors
Findings showed the majority of special education directors supervise the district’s special
education and preschool programs, Section 504 program, academically gifted services, and
student services. Almost one-third of these leaders noted additional programs of supervision,
others than those displayed in Figure 3, as a component of the job.
Time Devoted to Assigned Programs of Supervision
Special education directors (N=88) identified the approximate percentage of time that
they devoted to programs within the district which they supervise. Collective findings of this
population of special education directors identified that over 75% of time was devoted to the
0
10
20
30
40
50
60
70
80
90
100
99%
75%
23% 25%
55%
18%
8% 1% 0%
28%
Programs of Supervision Assigned to Special Education Directors
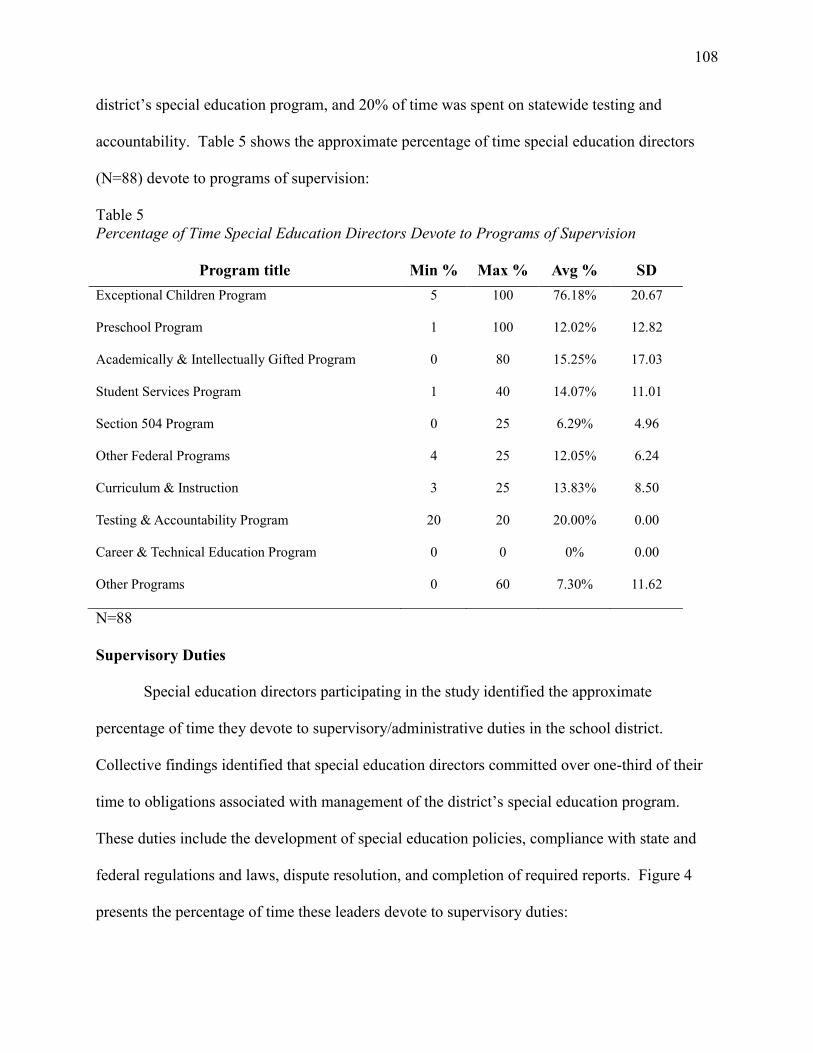
108
district’s special education program, and 20% of time was spent on statewide testing and
accountability. Table 5 shows the approximate percentage of time special education directors
(N=88) devote to programs of supervision:
Table 5
Percentage of Time Special Education Directors Devote to Programs of Supervision
Program title Min % Max % Avg % SD
Exceptional Children Program 5 100 76.18% 20.67
Preschool Program 1 100 12.02% 12.82
Academically & Intellectually Gifted Program 0 80 15.25% 17.03
Student Services Program 1 40 14.07% 11.01
Section 504 Program 0 25 6.29% 4.96
Other Federal Programs 4 25 12.05% 6.24
Curriculum & Instruction 3 25 13.83% 8.50
Testing & Accountability Program 20 20 20.00% 0.00
Career & Technical Education Program 0 0 0% 0.00
Other Programs 0 60 7.30% 11.62
N=88
Supervisory Duties
Special education directors participating in the study identified the approximate
percentage of time they devote to supervisory/administrative duties in the school district.
Collective findings identified that special education directors committed over one-third of their
time to obligations associated with management of the district’s special education program.
These duties include the development of special education policies, compliance with state and
federal regulations and laws, dispute resolution, and completion of required reports. Figure 4
presents the percentage of time these leaders devote to supervisory duties:
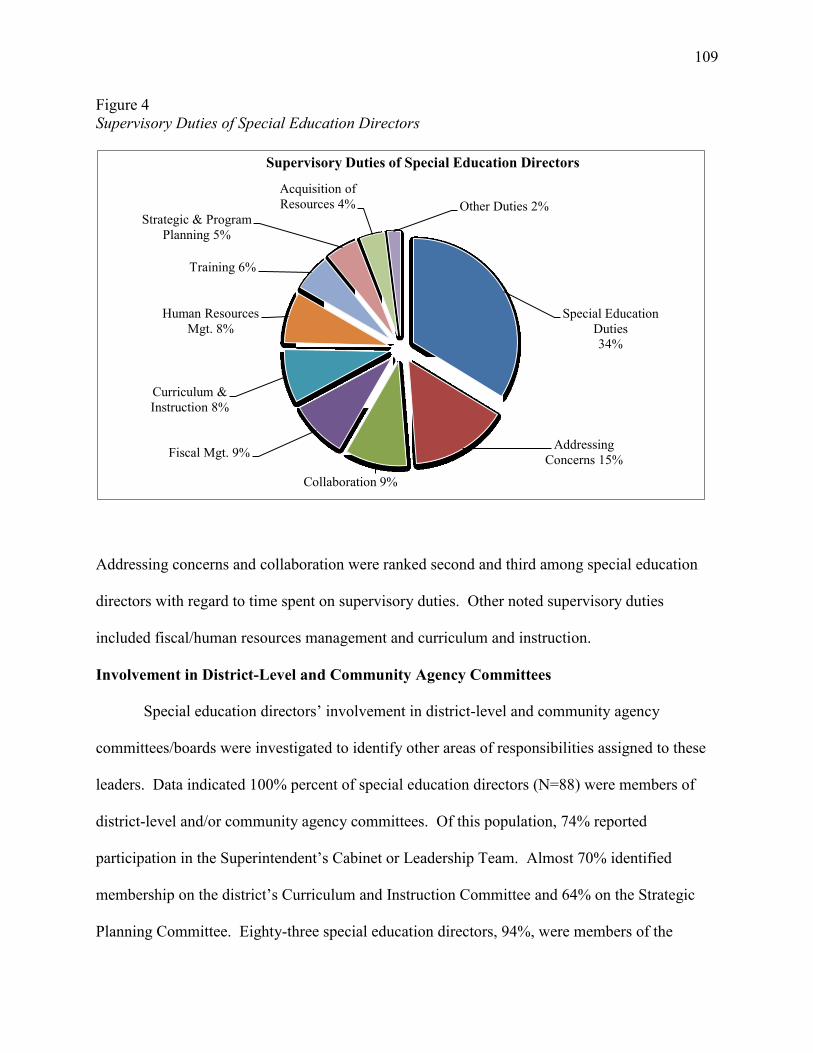
109
Figure 4
Supervisory Duties of Special Education Directors
Addressing concerns and collaboration were ranked second and third among special education
directors with regard to time spent on supervisory duties. Other noted supervisory duties
included fiscal/human resources management and curriculum and instruction.
Involvement in District-Level and Community Agency Committees
Special education directors’ involvement in district-level and community agency
committees/boards were investigated to identify other areas of responsibilities assigned to these
leaders. Data indicated 100% percent of special education directors (N=88) were members of
district-level and/or community agency committees. Of this population, 74% reported
participation in the Superintendent’s Cabinet or Leadership Team. Almost 70% identified
membership on the district’s Curriculum and Instruction Committee and 64% on the Strategic
Planning Committee. Eighty-three special education directors, 94%, were members of the
Special Education
Duties
34%
Addressing
Concerns 15%
Collaboration 9%
Fiscal Mgt. 9%
Curriculum &
Instruction 8%
Human Resources
Mgt. 8%
Training 6%
Strategic & Program
Planning 5%
Acquisition of
Resources 4% Other Duties 2%
Supervisory Duties of Special Education Directors
110
district’s Exceptional Children Program Committee. Over one-fourth of the special education
directors participate in the Academically and Intellectually Gifted Program Committee.
Membership on a Parent Advisory Council was represented by 23% individuals, and 2% were
members of a Staff Advisory Council. Membership to the district’s Board of Education Policy
Committee was represented by 16% of special education directors. Six individuals, 7%, reported
membership on a Media and Technology Advisory Committee. Thirty-one special education
directors, 35%, indicated involvement in other district-level organizations.
Findings showed the majority of special education directors have been assigned by their
supervisor to serve on community agency organizations as a component of their job. Almost
60% of special education directors have membership on a local preschool board and 42% on a
mental health agency board in their community. Twenty-four special education directors, 37%,
were members of a family and/or parenting support group. Six individuals, 10%, were required
to serve in a civic organization such as United Way, Rotary Club, or Chamber of Commerce.
Over one-third identified obligations to other community organizations such as Special
Olympics, Autism/TEACCH, Head Start, Department of Social Services, juvenile crime
prevention, and local housing authority.
Time Required to Fulfill Job Responsibilities
The review of literature in special education administration pointed to increased demands
in the workplace among special education directors. As such, it was essential to investigate the
amount of time special education directors devoted to their job to fulfill assigned duties in the
district. Areas of exploration included whether special education directors reported to work early
and/or stayed late to fulfill job duties, worked on weekends, and number of hours worked
weekly.
111
Reporting to work early and/or staying late. Of the 88 special education directors who
responded to this inquiry, 82% reported to work early and/or stayed late to get the job done.
Fifteen special education directors, 17%, indicated they sometimes reported to the workplace
before normal business hours and/or remained late at work to accomplish assigned tasks. One
individual indicated he or she did not work beyond assigned work hours.
Weekend work. Working on weekends was necessary to fulfill responsibilities
associated with special education program administration. Forty-four special education
directors, 51%, said they work on weekends to fulfill assigned job duties, whereas 36 leaders,
41%, said they sometimes work on weekends to meet the demands of the job. Seven special
education directors, 8%, stated they did not work on weekends. Collectively, 92% of special
education directors indicated weekend work was necessary to fulfill requirements of their job.
Average hours worked per week. Special education directors (N=88) were presented
with a list of numbers, from 30 to beyond 75, and identified the approximate number of hours
they work in a typical week to fulfill assigned job duties. Findings revealed that special
education directors worked an average of 53 hours per week, almost 13 hours beyond the
traditional work week of 40 hours. Figure 5 summarizes the frequency distribution of weekly
hours worked by these special education directors:
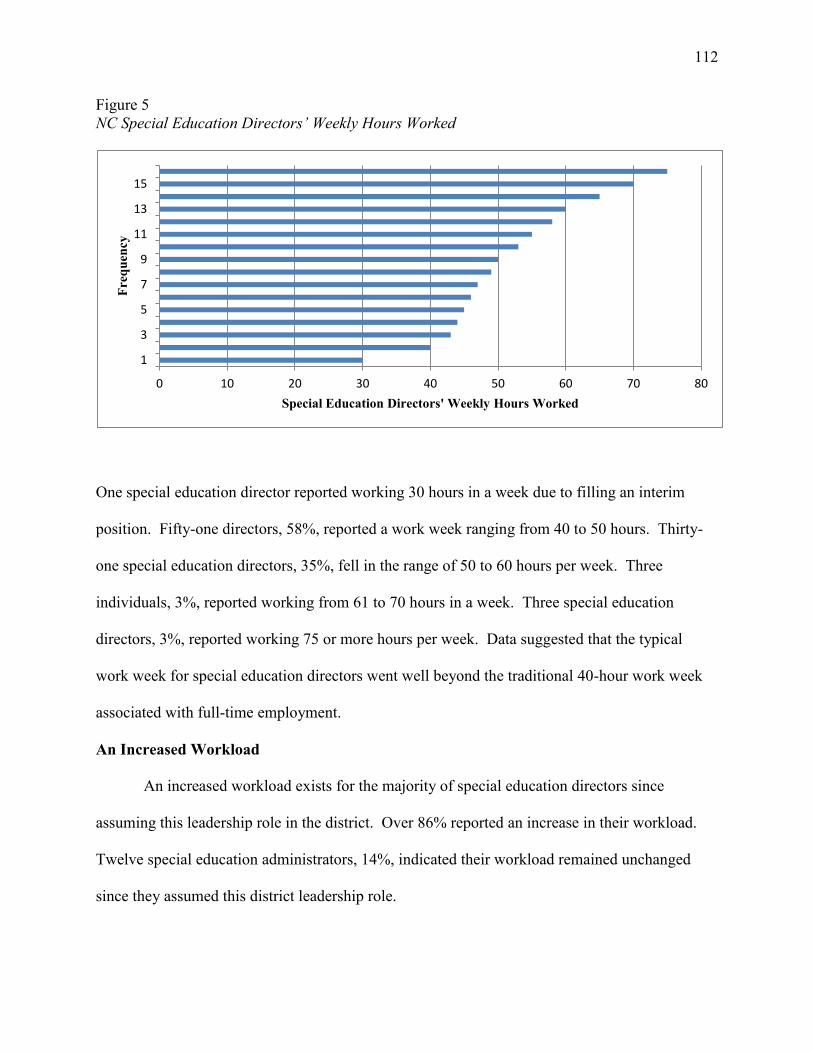
112
Figure 5
NC Special Education Directors’ Weekly Hours Worked
One special education director reported working 30 hours in a week due to filling an interim
position. Fifty-one directors, 58%, reported a work week ranging from 40 to 50 hours. Thirty-
one special education directors, 35%, fell in the range of 50 to 60 hours per week. Three
individuals, 3%, reported working from 61 to 70 hours in a week. Three special education
directors, 3%, reported working 75 or more hours per week. Data suggested that the typical
work week for special education directors went well beyond the traditional 40-hour work week
associated with full-time employment.
An Increased Workload
An increased workload exists for the majority of special education directors since
assuming this leadership role in the district. Over 86% reported an increase in their workload.
Twelve special education administrators, 14%, indicated their workload remained unchanged
since they assumed this district leadership role.
0 10 20 30 40 50 60 70 80
1
3
5
7
9
11
13
15
Special Education Directors' Weekly Hours Worked
Fre
qu
ency
113
Special education directors identified contributing factors to their increased workload.
These areas included: increased demands from the state education agency, 53%; realignment of
duties among central office staff, 52%; increased demands from the local education agency,
45%; reductions in force, 41%; vacant positions, 38%; poor job performance of others, 25%;
increased responsibilities due to outstanding job performance, 14%; solicitation of additional job
responsibilities, 6%; and other reasons, 10%.
Overall Assessment of Workload
Given a category of workload, special education directors selected one of five choices
that best described their overall workload. Of these respondents (N=88), no director reported a
very light or light workload. A manageable workload was identified by 16 special education
directors, 18%. Sixty special education directors, 68%, reported a heavy workload. Twelve
leaders, 14%, described an impossible workload to complete. Collectively, 82% of special
education directors described a heavy or impossible workload to manage. Findings were
supported by the average number of weekly hours worked by this population of special education
directors, 53 hours per week, as well as supervision of more than one program within the district.
Question Three: Job Satisfaction of Special Education Directors
Selection of the Job Satisfaction Survey Instrument
The study incorporated a research-validated job satisfaction measure to identify factors
relevant to the overall job satisfaction of North Carolina’s special education directors. After
reviewing a number of job satisfaction instruments, the Job Satisfaction Survey (JSS) (Spector,
1994) created by psychologist and researcher Dr. Paul Spector, was selected due to its brevity,
validity, and measures of workplace facets. Written consent was secured from Dr. Spector
114
(personal communication, Dec. 31, 2012) as documented in Appendix B to include the JSS into
the overall survey distributed to special education directors.
The JSS consists of 36 statements that explore facets of the workplace known to
influence job satisfaction (Spector, 1994; Spector, 1997). Use of a job satisfaction survey with
facet design may identify intrinsic and extrinsic motivators of employees and expose satisfying
and dissatisfying aspects of their jobs (Spector, 1997). The facets explored by the JSS include
the following: salary, promotion opportunities, autonomy in the workplace, employee benefits,
contingent rewards, operational conditions, relationships with co-workers, the nature of one’s
work, and communication within the organization (Spector, 1994; Spector, 1997). Spector
(1997) identified the normative mean values of the JSS through administration of the instrument
to over 8,100 individuals and more than 50 samples where data were collected from the fields of
elementary/secondary education, institutions of higher education, departments of correction,
manufacturing and retail industries, police, medical, and mental health.
The internal consistency reliabilities (coefficient alpha) for the facets of the JSS range
from .60 to .82, and the total reliability for the instrument is .91 (Spector, 1985; Spector, 1997;
Spector, 2001). JSS subscales with the strongest internal consistency reliability are autonomy in
the workplace/supervision, .82; nature of the work; .78; contingent rewards, .76; salary, .75;
employee benefits, .73; promotion opportunities, .73; and communication within the
organization, .71. Two subscales demonstrate a weaker reliability – operating conditions, .69,
and relationships with co-workers, .60. According to Nunnally (1978), the acceptable minimum
standard for internal consistency is .70. Collectively, the JSS instrument as a whole attains a
high consistency reliability of .91, indicating it is an appropriate measure to assess employees’
job satisfaction (Spector, 1985; Spector, 1997).
115
Nature of the Job Satisfaction Survey
The JSS applies a 6-point Likert-scale to 36 statements for which individuals select a
response to indicate agreement or disagreement. Choices are from one, strongly disagree, to six,
strongly agree (Spector, 1994). Statements are either positively or negatively worded. Examples
of positively worded statements on the JSS are: “When I do a good job, I receive the recognition
for it that I should receive,” and “Communications seem good within the organization” (Spector,
1994). Examples of negatively worded statements are: “I do not feel that the work I do is
appreciated,” and “The goals of this organization are not clear to me” (Spector, 1994). Positively
worded statements are scored according to the choice selected by respondents, whereas the 19
negatively worded statements are reverse-scored (choice six scored as one, choice five was
scored as two, etc.), adhering to scoring guidelines of the JSS (Spector, 1997). Four questions
comprise each subscale of examination: income, promotion, autonomy/supervision, employee
benefits, contingent rewards, operational conditions, relationships with co-workers, the nature of
one’s work, and communication within the organization (Spector, 1994; Spector, 1997). Scores
are totaled to determine the overall job satisfaction of individuals and the sample population of
special education directors as a whole. JSS scores may range from 36 to 216 (Spector, 1997).
Methods to Interpret Results of the Job Satisfaction Survey
The Job Satisfaction Survey (JSS) evaluates an individual’s job satisfaction on a
continuum; therefore, it is challenging to identify an exact score of where satisfaction ends and
dissatisfaction begins (Spector 1997; Spector, 2007). Two options exist regarding the
interpretation of JSS results – a normative approach and an absolute approach (Spector, 2007).
The normative approach compares an individual’s JSS score to the normative mean values
associated with a selected population (Spector, 2007). Since the population of this study consists
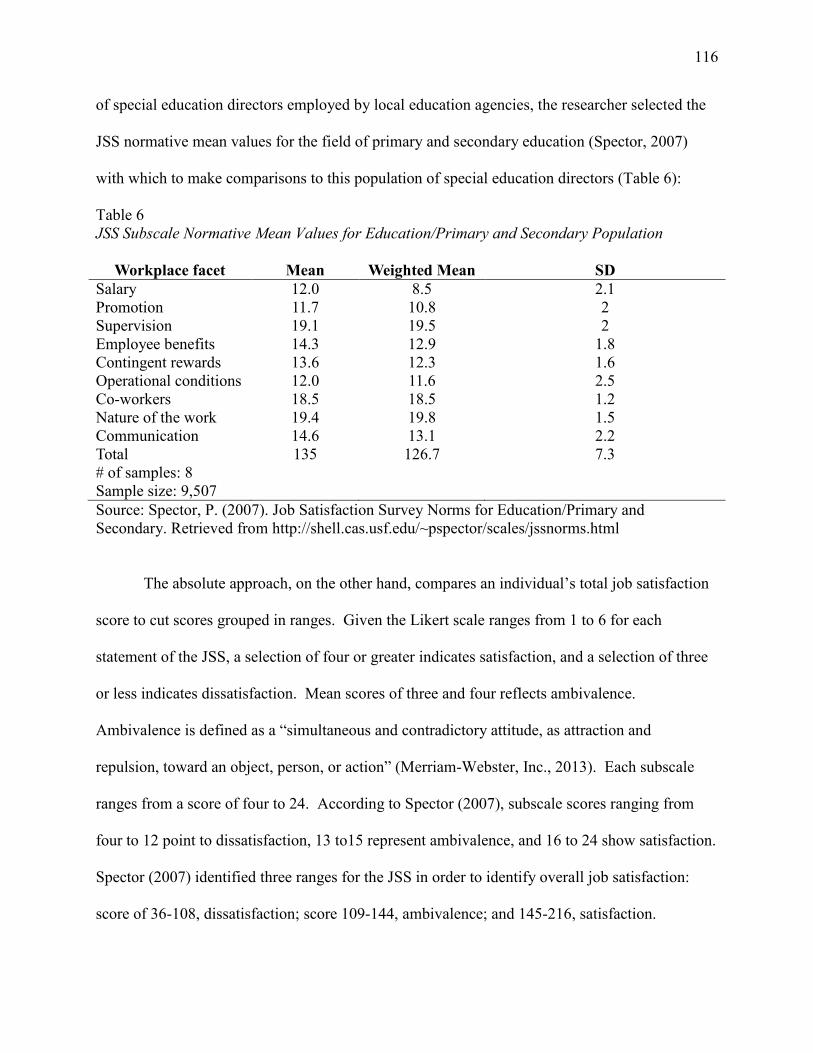
116
of special education directors employed by local education agencies, the researcher selected the
JSS normative mean values for the field of primary and secondary education (Spector, 2007)
with which to make comparisons to this population of special education directors (Table 6):
Table 6
JSS Subscale Normative Mean Values for Education/Primary and Secondary Population
Workplace facet Mean Weighted Mean SD
Salary 12.0 8.5 2.1
Promotion 11.7 10.8 2
Supervision 19.1 19.5 2
Employee benefits 14.3 12.9 1.8
Contingent rewards 13.6 12.3 1.6
Operational conditions 12.0 11.6 2.5
Co-workers 18.5 18.5 1.2
Nature of the work 19.4 19.8 1.5
Communication 14.6 13.1 2.2
Total 135 126.7 7.3
# of samples: 8
Sample size: 9,507
Source: Spector, P. (2007). Job Satisfaction Survey Norms for Education/Primary and
Secondary. Retrieved from http://shell.cas.usf.edu/~pspector/scales/jssnorms.html
The absolute approach, on the other hand, compares an individual’s total job satisfaction
score to cut scores grouped in ranges. Given the Likert scale ranges from 1 to 6 for each
statement of the JSS, a selection of four or greater indicates satisfaction, and a selection of three
or less indicates dissatisfaction. Mean scores of three and four reflects ambivalence.
Ambivalence is defined as a “simultaneous and contradictory attitude, as attraction and
repulsion, toward an object, person, or action” (Merriam-Webster, Inc., 2013). Each subscale
ranges from a score of four to 24. According to Spector (2007), subscale scores ranging from
four to 12 point to dissatisfaction, 13 to15 represent ambivalence, and 16 to 24 show satisfaction.
Spector (2007) identified three ranges for the JSS in order to identify overall job satisfaction:
score of 36-108, dissatisfaction; score 109-144, ambivalence; and 145-216, satisfaction.
117
Are North Carolina’s Special Education Directors Satisfied with their Job?
The researched applied both the normative and absolute approaches to interpret data
collected from administration of the Job Satisfaction Survey (Spector, 1994) to this population of
special education directors (N=86). Methods of analysis exposed a prevalence of ambivalence
among these special education directors as this group scored 135.58 on the JSS and fell within
the range of ambivalence. Examination of the data by levels of satisfaction showed that 46.54%
scored in the ambivalence range, 109-144. Eleven special education directors, 12.79%, reported
dissatisfaction with their job. Thirty-five individuals, 40.69%, indicated satisfaction.
Collectively, almost 60% of special education directors in North Carolina voiced ambivalence or
dissatisfaction toward this leadership role. Disaggregation of data by gender showed males had a
higher job satisfaction, 140.43, than females, 134.47, although both groups fell in the range of
ambivalence.
With regard to years of experience in public education and job satisfaction, special
education directors with fewer than 10 years in public education attained a job satisfaction score
of 125, in the range of ambivalence. Individuals with 11 to 15 years of experience in public
education scored 146.2, indicating satisfaction. Special education directors with 16 to 20 years
of service in public education showed a decline in job satisfaction, as evidenced by a score of
139.2, ambivalence. Job satisfaction fell to an even lower level among special education
directors with 21 to 25 years of experience in public education with a score of 126.4, indicating
ambivalence toward their job. Satisfaction rose to 136, a level of ambivalence, for special
education directors with 26 to 30 years of experience. Individuals reporting 31 or more years of
service in public education attained a job satisfaction score of 139.8, ambivalence.
118
An examination of years of experience in special education administration and job
satisfaction revealed that special education directors with greater years of experience in special
education administration had a higher level of job satisfaction than those who were less
experienced in this role. Special education directors with 16 to 20 years of experience in special
education administration have the lowest job satisfaction score, 112.75, ambivalence. The
highest level of job satisfaction, 150, a level of satisfaction, was shown by special education
directors with 26 to 30 years of experience in special education administration. Individuals with
31 or more years of experience in special education administration scored 141, showing
ambivalence.
With regard to highest level of education and overall job satisfaction among this
population of special education directors, individuals with an advanced degree reported a higher
level of job satisfaction, 141.56, than those with a master’s degree, 130.19, or a doctoral degree,
140.86. All of these scores are within the range of ambivalence regarding job satisfaction.
With regard to prior experience as a principal, 34% of special education directors
reported experience in school governance; whereas, 66% do not have this administrative
leadership experience. Special education directors reporting prior experience as a principal
scored 152.06 on the JSS, indicating satisfaction. Special education directors lacking experience
as a principal had a much lower JSS score, 132.45, a level of ambivalence toward their job.
There was a difference of almost 20 points between the JSS scores of special education directors
with prior experience as a principal and those who lack this school governance experience.
The mean JSS score of special education directors participating in this study, 135.58,
aligns to the JSS normative mean scores of the elementary and secondary education population,
135 (Spector, 2007; Spector, 2011). However, these special education directors scored lower
119
than other sampled populations within the United States. North Carolina’s special education
directors had a lower level of job satisfaction than individuals employed by institutions of higher
education (137.2), manufacturing (140.7), mental health (136.2), retail industry (145.5), medical
personnel (135.8), and social services (142.3) (Spector, 2011). The level of job satisfaction
among North Carolina’s special education directors fell below the mean for the public sector
workforce (138.3), private sector workforce (141.2), and total U.S. workforce (138.7) (Spector,
2011). Conversely, special education directors had a higher level of job satisfaction compared to
individuals employed by Department of Corrections (125.6) and police (129) (Spector, 2011).
Analysis of JSS Subscales
Each subscale of the Job Satisfaction Survey (Spector, 1994) was analyzed to identify its
mean score in order to make comparisons to the JSS normative mean scores of the primary and
secondary education population as identified by Spector (2011). Mean subscale scores of the
JSS in the range of four to 12 show dissatisfaction;13-15, ambivalence; and 16 to 24, satisfaction
(Spector, 2007). The JSS mean subscale scores of North Carolina’s special education directors
align to the JSS normative mean values of the elementary and secondary education population,
with the exception of two areas. Areas of symmetry include salary, autonomy in the workplace,
employee benefits, contingent rewards, operational conditions, relationships with co-workers,
and nature of the work. Differences exist among the JSS subscales of promotion and
communication. With regard to promotion, the mean subscale results among special education
directors surveyed was 13.05, indicating ambivalence with regard to promotion in the workplace,
whereas the JSS normative mean value for the elementary and secondary education population
was 11.7, dissatisfaction (Spector, 2011). In the domain of communication, the mean value of
special education directors was 16.54, demonstrating satisfaction, whereas the JSS normative
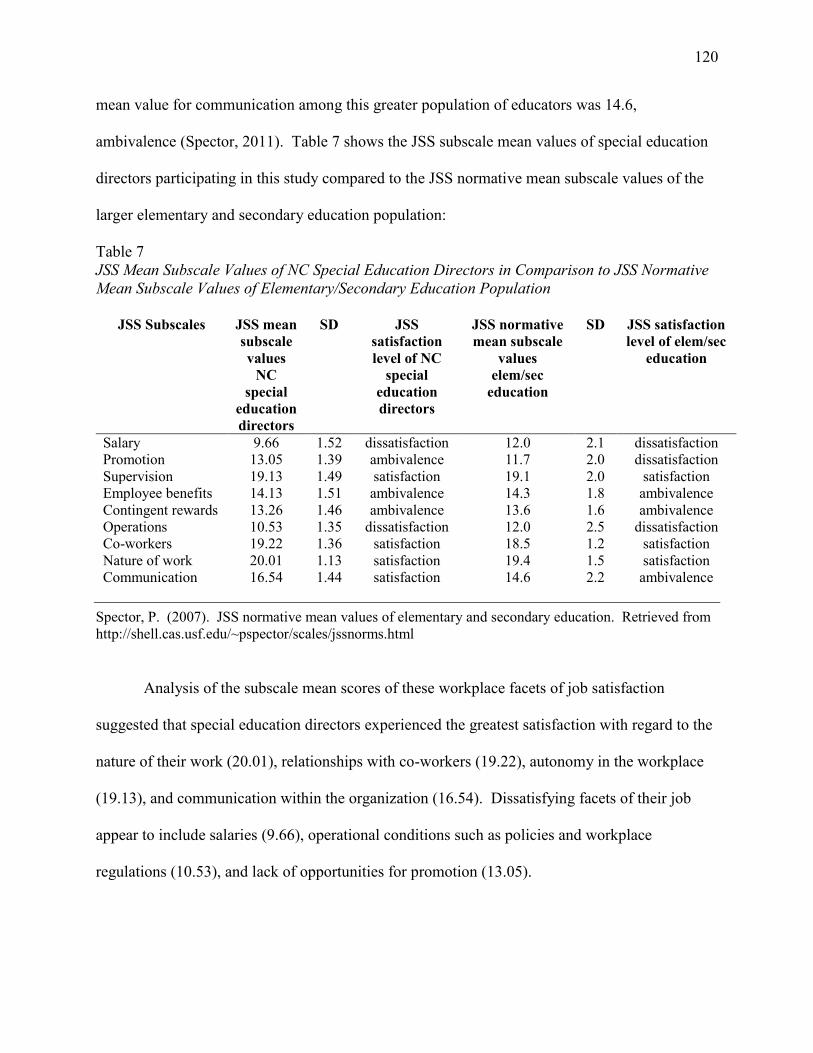
120
mean value for communication among this greater population of educators was 14.6,
ambivalence (Spector, 2011). Table 7 shows the JSS subscale mean values of special education
directors participating in this study compared to the JSS normative mean subscale values of the
larger elementary and secondary education population:
Table 7
JSS Mean Subscale Values of NC Special Education Directors in Comparison to JSS Normative
Mean Subscale Values of Elementary/Secondary Education Population
JSS Subscales JSS mean
subscale
values
NC
special
education
directors
SD JSS
satisfaction
level of NC
special
education
directors
JSS normative
mean subscale
values
elem/sec
education
SD JSS satisfaction
level of elem/sec
education
Salary 9.66 1.52 dissatisfaction 12.0 2.1 dissatisfaction
Promotion 13.05 1.39 ambivalence 11.7 2.0 dissatisfaction
Supervision 19.13 1.49 satisfaction 19.1 2.0 satisfaction
Employee benefits 14.13 1.51 ambivalence 14.3 1.8 ambivalence
Contingent rewards 13.26 1.46 ambivalence 13.6 1.6 ambivalence
Operations 10.53 1.35 dissatisfaction 12.0 2.5 dissatisfaction
Co-workers 19.22 1.36 satisfaction 18.5 1.2 satisfaction
Nature of work 20.01 1.13 satisfaction 19.4 1.5 satisfaction
Communication 16.54 1.44 satisfaction 14.6 2.2 ambivalence
Spector, P. (2007). JSS normative mean values of elementary and secondary education. Retrieved from
http://shell.cas.usf.edu/~pspector/scales/jssnorms.html
Analysis of the subscale mean scores of these workplace facets of job satisfaction
suggested that special education directors experienced the greatest satisfaction with regard to the
nature of their work (20.01), relationships with co-workers (19.22), autonomy in the workplace
(19.13), and communication within the organization (16.54). Dissatisfying facets of their job
appear to include salaries (9.66), operational conditions such as policies and workplace
regulations (10.53), and lack of opportunities for promotion (13.05).
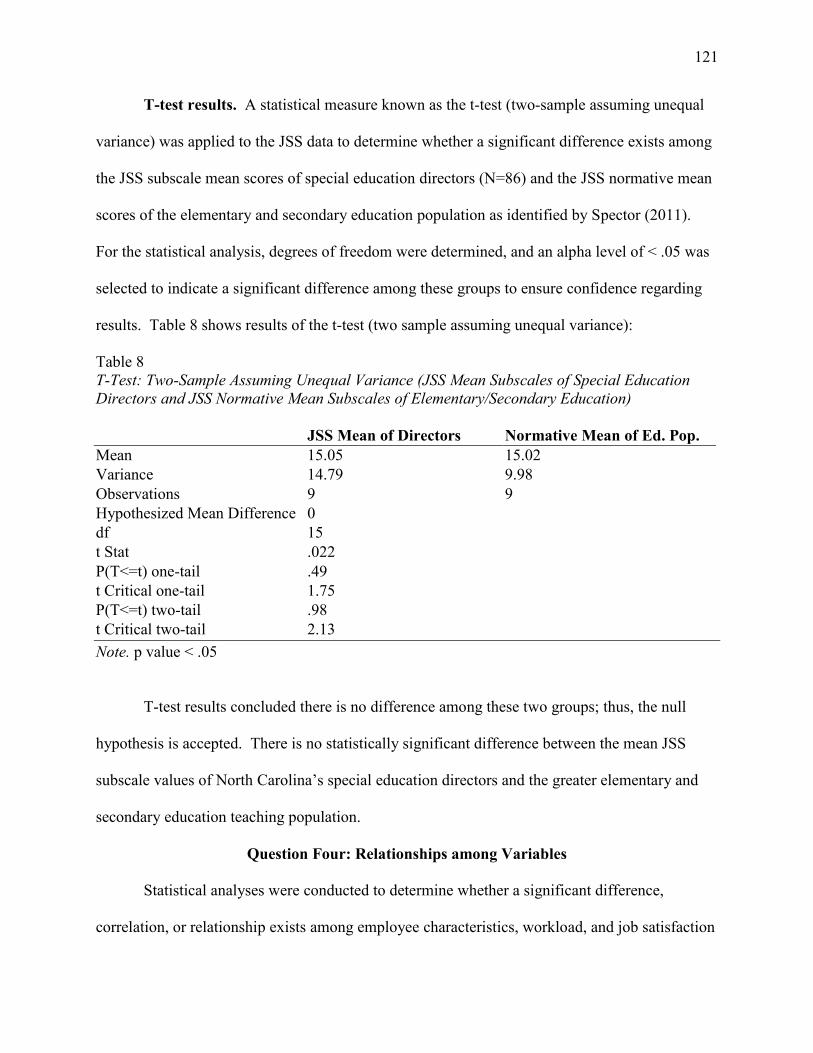
121
T-test results. A statistical measure known as the t-test (two-sample assuming unequal
variance) was applied to the JSS data to determine whether a significant difference exists among
the JSS subscale mean scores of special education directors (N=86) and the JSS normative mean
scores of the elementary and secondary education population as identified by Spector (2011).
For the statistical analysis, degrees of freedom were determined, and an alpha level of < .05 was
selected to indicate a significant difference among these groups to ensure confidence regarding
results. Table 8 shows results of the t-test (two sample assuming unequal variance):
Table 8
T-Test: Two-Sample Assuming Unequal Variance (JSS Mean Subscales of Special Education
Directors and JSS Normative Mean Subscales of Elementary/Secondary Education)
JSS Mean of Directors Normative Mean of Ed. Pop.
Mean 15.05 15.02
Variance 14.79 9.98
Observations 9 9
Hypothesized Mean Difference 0
df 15
t Stat .022
P(T<=t) one-tail .49
t Critical one-tail 1.75
P(T<=t) two-tail .98
t Critical two-tail 2.13
Note. p value < .05
T-test results concluded there is no difference among these two groups; thus, the null
hypothesis is accepted. There is no statistically significant difference between the mean JSS
subscale values of North Carolina’s special education directors and the greater elementary and
secondary education teaching population.
Question Four: Relationships among Variables
Statistical analyses were conducted to determine whether a significant difference,
correlation, or relationship exists among employee characteristics, workload, and job satisfaction
122
of North Carolina’s special education directors. Statistical measures applied to this data include
a t-test (two-sample assuming unequal variance), Pearson product-moment correlation, logistic
and multiple regressions. For all statistical analyses, the coefficient and critical value statistic
were determined based on degrees of freedom and an alpha level of < .05, as this level of
statistical significance ensures a 95% confidence with results (Pagano, 2010). A t-test (two-
sample of unequal variance) was applied to investigate the mean differences among two groups.
In this case, a t-test examined the JSS mean scores of special education directors’ years of
experience in public education and JSS mean scores of their years of experience in special
education administration to determine whether a statistically significant difference exists
(Pagano, 2010).
A Pearson product-moment correlation was instituted to determine whether a significant
correlation or relationship exists among selected quantitative variable(s). Correlation examines
the magnitude and direction that may exist among variables (Pagano, 2010). The Pearson
product-moment correlation draws a line of best fit through the data of two variables to present
the strength of their linear association (Pagano, 2010). The Pearson r coefficient points to
whether a positive or negative correlation exists among selected independent and dependent
variables (Pagano, 2010). The closer the Pearson r coefficient is to +1 indicates the strength of
the correlation among variables (Pagano, 2010). A positive correlation suggests that as one
variable increases, so does the other; a negative correlation suggests that as one variable
increases, the second variable decreases (Pagano, 2010). It is noted that the Pearson product-
moment correlation cannot prove causation (Pagano, 2010). Pearson product-moment
correlations investigate whether a statistically significant correlation exists among an
123
independent variable, such as weekly hours worked or mean subscale scores of the JSS, with
regard to the dependent variable, job satisfaction scores of special education directors.
Logistic and multiple regression analyses determine whether a statistically significant
relationship exists between categorical x (independent) variables(s) and a continuous y
(dependent) variable. Like correlation, regression examines whether a linear relationship exists
among variables; however, regression estimates the probability of a dependent variable occurring
as the value of an independent variable changes (Creswell, 2011; Pagano, 2010). It is noted that
regression works well with categorical or continuous predictor variables (Creswell, 2011;
Pagano, 2010). Categorical x (independent) variables under scrutiny in relation to the dependent
variable of job satisfaction include: age; gender; highest level of education; years of experience
in public education; years of experience in special education administration; licensure in special
education administration; experience as a school principal; salary; intent to remain in the
position; and assessment of workload.
Years of Experience in Public Education and Years of Experience in Special Education
Administration
The JSS scores of special education directors (N=86) were disaggregated according to
years of experience in public education and years of experience in special education
administration to identify the JSS mean values (Table 9). Using this data, a t-test (two-sample
assuming unequal variance) was applied to determine whether a statistically significant
difference exists among the JSS mean scores of these groups (Table 10). The t statistic and t
critical value (two-tail) were identified based on degrees of freedom and an alpha level of < .05
to ensure a 95% confidence level with results.
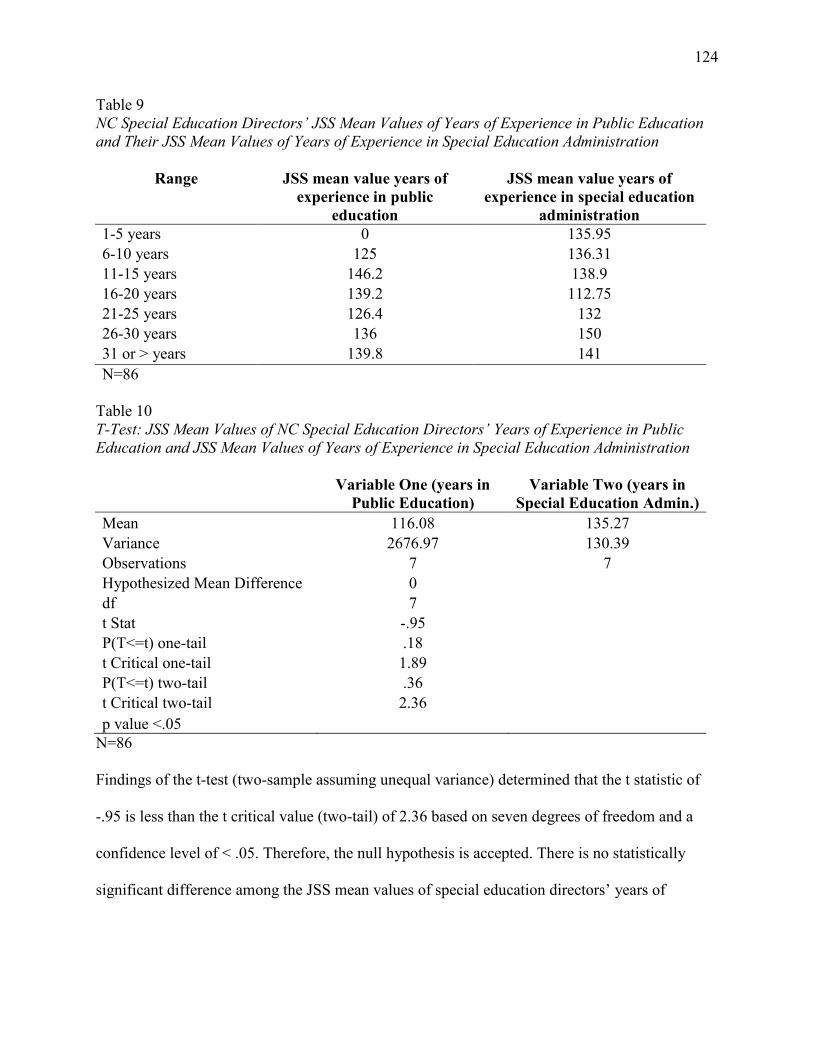
124
Table 9
NC Special Education Directors’ JSS Mean Values of Years of Experience in Public Education
and Their JSS Mean Values of Years of Experience in Special Education Administration
Range JSS mean value years of
experience in public
education
JSS mean value years of
experience in special education
administration
1-5 years 0 135.95
6-10 years 125 136.31
11-15 years 146.2 138.9
16-20 years 139.2 112.75
21-25 years 126.4 132
26-30 years 136 150
31 or > years 139.8 141
N=86
Table 10
T-Test: JSS Mean Values of NC Special Education Directors’ Years of Experience in Public
Education and JSS Mean Values of Years of Experience in Special Education Administration
Variable One (years in
Public Education)
Variable Two (years in
Special Education Admin.)
Mean 116.08 135.27
Variance 2676.97 130.39
Observations 7 7
Hypothesized Mean Difference 0
df 7
t Stat -.95
P(T<=t) one-tail .18
t Critical one-tail 1.89
P(T<=t) two-tail .36
t Critical two-tail 2.36
p value <.05
N=86
Findings of the t-test (two-sample assuming unequal variance) determined that the t statistic of
-.95 is less than the t critical value (two-tail) of 2.36 based on seven degrees of freedom and a
confidence level of < .05. Therefore, the null hypothesis is accepted. There is no statistically
significant difference among the JSS mean values of special education directors’ years of
125
experience in public education and their JSS mean values of years of experience in special
education administration.
Weekly Hours Worked and Job Satisfaction
The average work week for North Carolina’s special education directors was 53 hours, 13
hours beyond the traditional 40 hours associated with full-time employment. As previously
reported, findings identified that this population of special education directors had a JSS mean
score of 135.58 (Spector, 1994) indicating ambivalence toward their job. In addition, 82% of
special education directors described their workload as heavy or impossible to manage. A
Pearson product-moment correlation was computed to assess whether a correlation exists among
the independent variable, weekly hours worked, and dependent variable, job satisfaction, among
these special education directors (N=86). Results of the Pearson product-moment correlation
identified that the Pearson r coefficient was .17, less than the Pearson r critical value of .21,
based on 84 degrees of freedom and an alpha level of < .05. While the r coefficient pointed to a
positive linear relationship (.17), it failed to surpass the r coefficient critical value of .21. Thus,
the strength of the correlation between the independent variable (weekly hours worked) and
dependent variable (job satisfaction) was weak. As a result of these findings, the null hypothesis
is accepted. There is no statistically significant correlation between special education directors’
weekly hours worked and their job satisfaction.
Relationships among JSS Subscales and Overall Job Satisfaction
The Job Satisfaction Survey (Spector, 1994) used as a component of the survey to North
Carolina’s special education directors assessed job satisfaction with regard to nine facets of
influence in the workplace: promotion opportunities; salary; employee benefits; autonomy in the
workplace; contingent rewards; operational conditions; relationships with co-workers; nature of
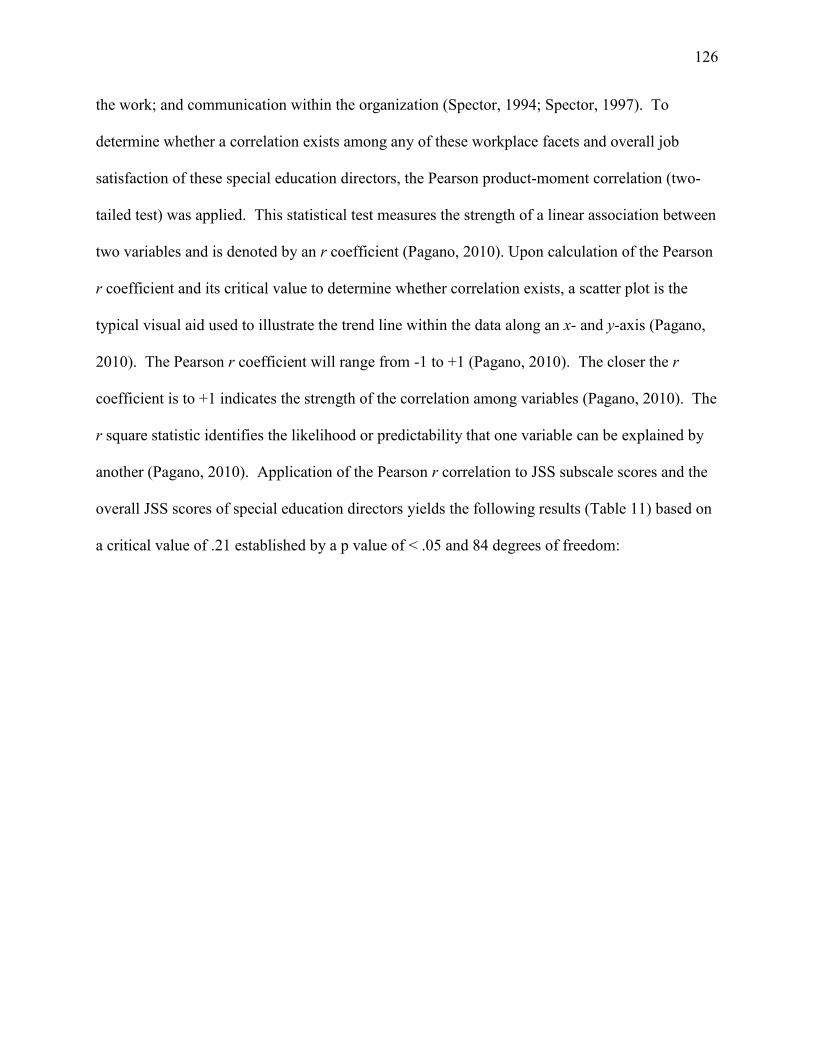
126
the work; and communication within the organization (Spector, 1994; Spector, 1997). To
determine whether a correlation exists among any of these workplace facets and overall job
satisfaction of these special education directors, the Pearson product-moment correlation (two-
tailed test) was applied. This statistical test measures the strength of a linear association between
two variables and is denoted by an r coefficient (Pagano, 2010). Upon calculation of the Pearson
r coefficient and its critical value to determine whether correlation exists, a scatter plot is the
typical visual aid used to illustrate the trend line within the data along an x- and y-axis (Pagano,
2010). The Pearson r coefficient will range from -1 to +1 (Pagano, 2010). The closer the r
coefficient is to +1 indicates the strength of the correlation among variables (Pagano, 2010). The
r square statistic identifies the likelihood or predictability that one variable can be explained by
another (Pagano, 2010). Application of the Pearson r correlation to JSS subscale scores and the
overall JSS scores of special education directors yields the following results (Table 11) based on
a critical value of .21 established by a p value of < .05 and 84 degrees of freedom:
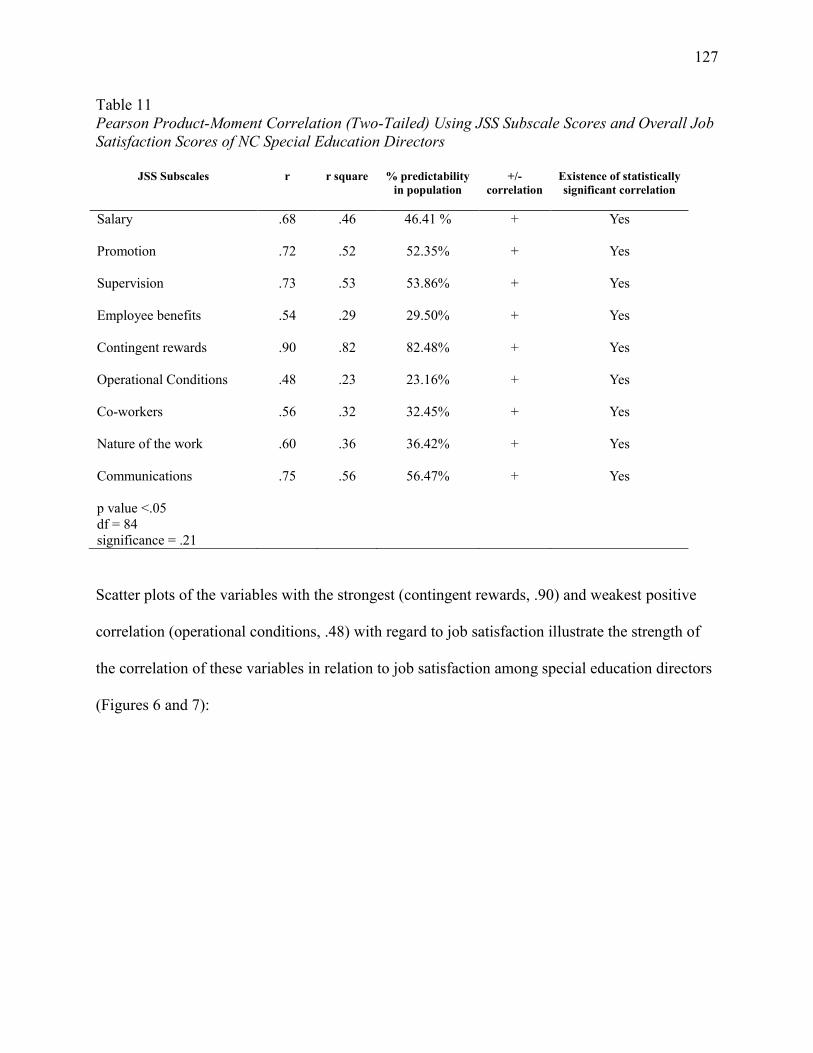
127
Table 11
Pearson Product-Moment Correlation (Two-Tailed) Using JSS Subscale Scores and Overall Job
Satisfaction Scores of NC Special Education Directors
JSS Subscales r r square % predictability
in population
+/-
correlation
Existence of statistically
significant correlation
Salary .68 .46 46.41 % + Yes
Promotion .72 .52 52.35% + Yes
Supervision .73 .53 53.86% + Yes
Employee benefits .54 .29 29.50% + Yes
Contingent rewards .90 .82 82.48% + Yes
Operational Conditions .48 .23 23.16% + Yes
Co-workers .56 .32 32.45% + Yes
Nature of the work .60 .36 36.42% + Yes
Communications .75 .56 56.47% + Yes
p value <.05
df = 84
significance = .21
Scatter plots of the variables with the strongest (contingent rewards, .90) and weakest positive
correlation (operational conditions, .48) with regard to job satisfaction illustrate the strength of
the correlation of these variables in relation to job satisfaction among special education directors
(Figures 6 and 7):
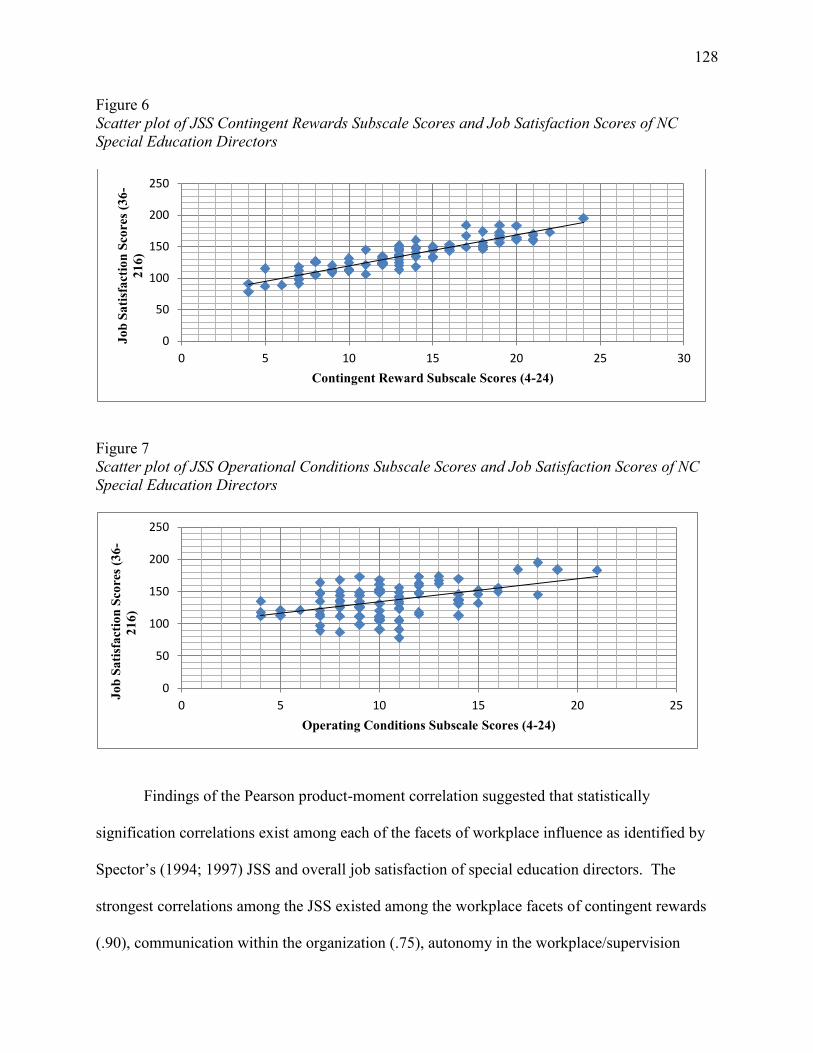
128
Figure 6
Scatter plot of JSS Contingent Rewards Subscale Scores and Job Satisfaction Scores of NC
Special Education Directors
Figure 7
Scatter plot of JSS Operational Conditions Subscale Scores and Job Satisfaction Scores of NC
Special Education Directors
Findings of the Pearson product-moment correlation suggested that statistically
signification correlations exist among each of the facets of workplace influence as identified by
Spector’s (1994; 1997) JSS and overall job satisfaction of special education directors. The
strongest correlations among the JSS existed among the workplace facets of contingent rewards
(.90), communication within the organization (.75), autonomy in the workplace/supervision
0
50
100
150
200
250
0 5 10 15 20 25 30
Jo
b S
ati
sfa
ctio
n S
core
s (3
6-
21
6)
Contingent Reward Subscale Scores (4-24)
0
50
100
150
200
250
0 5 10 15 20 25 Jo
b S
ati
sfa
ctio
n S
core
s (3
6-
21
6)
Operating Conditions Subscale Scores (4-24)
129
(.73), and opportunities for promotion (.72). JSS subscale facets with the lowest positive
correlation include operational conditions (.48) and employee benefits (.54), two organizational
constraints of which employees have little influence in the workplace (Peters, O’Connor, &
Rudolf, 1980). These positive correlations suggest that when employees are satisfied with
contingent rewards, workplace autonomy, feedback from supervisors, and opportunities for
promotion, there is a greater likelihood of the occurrence of job satisfaction (Billingsley, 2004;
Butts, Vandenberg, DeJoy, Schaffer, & Wilson, 2009; Colbert & Wolff, 1992; Embich, 2001;
Gersten et al., 2001; Hackman & Oldham, 1976; Lawler, 1996; Spreitzer, 1995; Wagner, 1994;
Wagner & Gooding, 1987).
Analysis of Categorical Variable(s) and Continuous Variable of Job Satisfaction
Using the data analysis tools of the Microsoft Excel program, logistic and multiple
regressions were applied to determine whether correlation exists among selected independent
variable(s) and the dependent variable of job satisfaction with regard to this population of special
education directors. Regression analysis identifies whether correlation exists between
categorical (independent) x variable(s) and a continuous (dependent) y variable (Pagano, 2010).
Additionally, regression shows whether a linear relationship exists among variables and
estimates the probability of a dependent variable occurring when the value of an independent
variable changes (Creswell, 2011; Pagano, 2010). Independent variables of investigation
regarding this population of special education directors with regard to the dependent variable job
satisfaction include the following: age; gender; highest education level; years of experience in
public education; years of experience in special education administration; licensure in special
education administration; experience as a principal; salary; workload; intent to remain in the
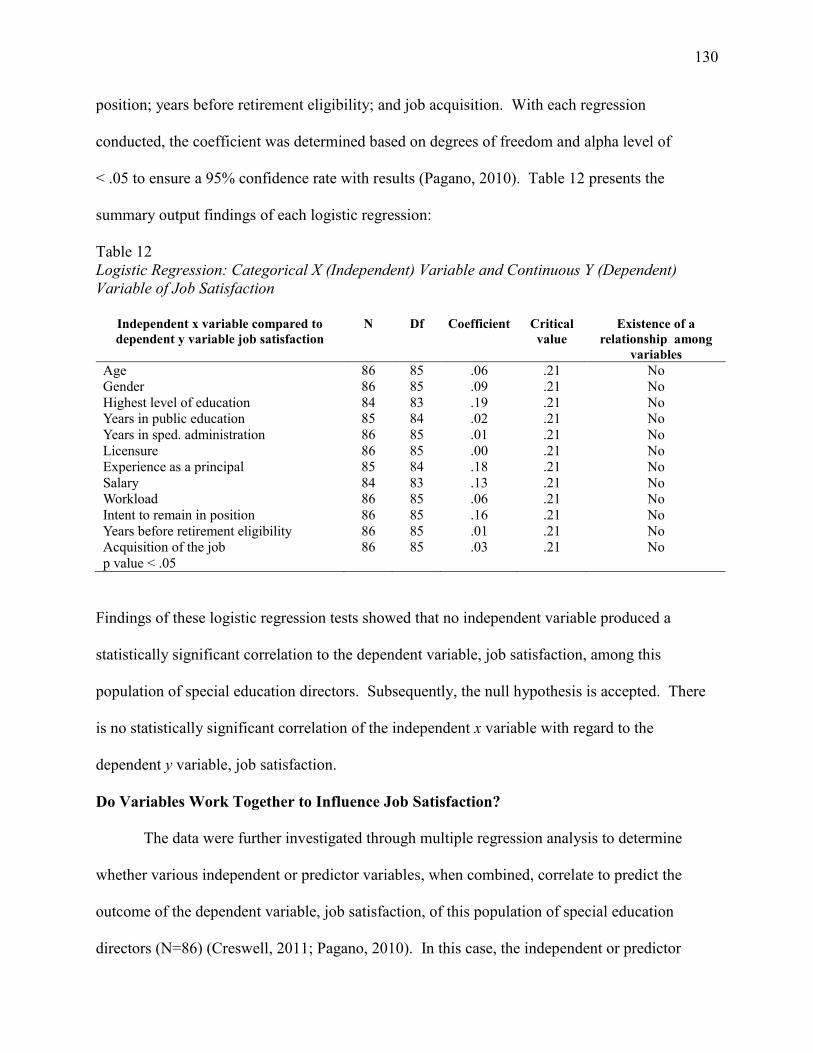
130
position; years before retirement eligibility; and job acquisition. With each regression
conducted, the coefficient was determined based on degrees of freedom and alpha level of
< .05 to ensure a 95% confidence rate with results (Pagano, 2010). Table 12 presents the
summary output findings of each logistic regression:
Table 12
Logistic Regression: Categorical X (Independent) Variable and Continuous Y (Dependent)
Variable of Job Satisfaction
Independent x variable compared to
dependent y variable job satisfaction
N Df Coefficient Critical
value
Existence of a
relationship among
variables
Age 86 85 .06 .21 No
Gender 86 85 .09 .21 No
Highest level of education 84 83 .19 .21 No
Years in public education 85 84 .02 .21 No
Years in sped. administration 86 85 .01 .21 No
Licensure 86 85 .00 .21 No
Experience as a principal 85 84 .18 .21 No
Salary 84 83 .13 .21 No
Workload 86 85 .06 .21 No
Intent to remain in position 86 85 .16 .21 No
Years before retirement eligibility 86 85 .01 .21 No
Acquisition of the job 86 85 .03 .21 No
p value < .05
Findings of these logistic regression tests showed that no independent variable produced a
statistically significant correlation to the dependent variable, job satisfaction, among this
population of special education directors. Subsequently, the null hypothesis is accepted. There
is no statistically significant correlation of the independent x variable with regard to the
dependent y variable, job satisfaction.
Do Variables Work Together to Influence Job Satisfaction?
The data were further investigated through multiple regression analysis to determine
whether various independent or predictor variables, when combined, correlate to predict the
outcome of the dependent variable, job satisfaction, of this population of special education
directors (N=86) (Creswell, 2011; Pagano, 2010). In this case, the independent or predictor
131
variables included highest level of education, salary, and prior experience as a principal with
regard to the dependent variable, job satisfaction. The multiple regression coefficient and critical
value were calculated based on degrees of freedom and an alpha level of < .05 to ensure a 95%
level of confidence and reliability with findings (Pagano, 2010).
Multiple regression results identified the correlation coefficient was .22, greater than the
critical value of .21, based on 85 degrees of freedom and alpha level of < .05. Findings unveiled
the existence of a statistically significant correlation among the independent variables of highest
education level, salary, and prior experience as a principal when combined and may serve as a
predictor of job satisfaction among special education directors. As a result, the null hypothesis
(there is no difference) is rejected, and alternate hypothesis is accepted. There is a statistically
significant correlation among these selected independent variables when combined and the
overall job satisfaction of special education directors. These findings imply that special
education directors who possess the characteristics of a higher level of education and experience
as a principal, coupled with an appropriate salary, may experience a greater degree of job
satisfaction than individuals in this role who lack these characteristics.
In summary, statistical analyses identified the existence of correlation among each of the
workplace facets of the JSS (Spector, 1994; Spector, 1997) and the job satisfaction of North
Carolina’s special education directors. Multiple regression analysis also identified correlation
among a combination of independent variables and overall job satisfaction of special education
directors participating in this study. These independent variables include salary, highest
education level, and prior experience as a principal. While these findings are significant, it is
noted that correlation does not prove causation and merely implies that a relationship exists
among independent and dependent variables (Creswell, 2011; Pagano, 2010).
132
Question Five: Job Satisfaction, Dissatisfaction, and Needed Supports
As a component of this mixed methods study, qualitative data collection occurred by
including open-ended questions into the survey distributed to special education directors to
identify areas of their job that were most satisfying, dissatisfying, and what supports, if any, were
needed. Text boxes of ample size accompanied each open-ended question as a means to collect
information. Survey responses (Appendix E, F, G) were downloaded from Qualtrics into the
Microsoft Word and Excel software programs for ease of reading, sorting, and coding purposes.
The coding of participants’ responses identified central themes, similarities, outliers, and
triangulation among data (Creswell, 2011). Open-ended responses were read a minimum of
three times to gain an understanding of the each statement and its context (Creswell, 2011).
Creswell (2011) recommended note taking in the margins of participants’ responses to identify
central concepts; therefore, this strategy was applied to understand and organize information.
Responses were sorted according to themes, accompanied by highlighting of text to identify
supporting statements (Creswell, 2011). Initially-identified themes were sorted again and
categorized into overarching themes (Creswell, 2011). Coding of qualitative data may yield
expected and unexpected themes, as well as outliers (Creswell, 2011). This qualitative analysis
identified central themes among special education directors with regard to areas of their job that
were most satisfying, dissatisfying, and areas of needed support.
Areas of Satisfaction
Seventy-eight special education directors responded to the open-ended statement,
“Describe the areas of greatest satisfaction in your role as district special education director.”
Through coding of participants’ responses, the following overarching themes emerged with
regard to satisfaction with their jobs: strategic and instructional leadership, collaboration and
133
problem solving with stakeholders, and improved outcomes for children with disabilities.
Outliers included work flexibility, a supportive supervisor, and making a difference in the lives
of students and families.
Strategic and instructional leadership. The application of strategic and instructional
leadership skills brought much satisfaction among special education directors. According to the
North Carolina Standards for Superintendents (North Carolina State Board of Education, 2007)
and the North Carolina Standards for Central Office Administrators (North Carolina State Board
of Education, 2007), strategic leadership entails a leader’s abilities to define the district’s vision
and mission, develop and implement a strategic plan with stakeholder input, monitor progress
toward goals, and re-structure the district when change is warranted to ensure all students reach
academic success. Strategic leaders are expected to routinely use data in decision making,
according to these executive standards for education leaders (NCSBOE, 2007). These
dispositions describe strategic leaders as catalysts of change who bring about reform to improve
teaching, learning, and long-term outcomes for all students (NCSBOE, 2007).
Instructional leadership expectations, as presented in the North Carolina Standards for
Superintendents (NCSBOE, 2007) and the North Carolina Standards for Central Office
Administrators (NCSBOE, 2007), emphasize improving the academic achievement of all
students. Instructional leadership dispositions include the creation of a learning environment
based high standards for students and staff through the identification of strengths and areas of
improvement, goal setting, progress monitoring, and data analysis from formative and
summative assessments to drive educational decisions (NCSBOE, 2007). Instructional
leadership, according to these standards, entails informed decision making to implement and
evaluate education programs, services, and practices across schools to meet students’ diverse
134
learning needs (NCSBOE, 2007). These standards state that instructional leaders should
establish and support professional learning communities across the district so that personnel have
opportunities to collaborate, examine data, and problem solve (NCSBOE, 2007). Resource
alignment and the provision of professional development to staff are other essential components
of executive leadership (NCSBOE, 2007).
Twenty-four statements from special education directors’ open-ended survey responses
pointed to satisfaction regarding the application of strategic and instructional leadership in the
district. A sample of their statements is provided to illustrate their views:
- The greatest satisfaction is implementing programming that positively impacts
students with disabilities. I enjoy the continuous improvement opportunities that are
presented.
- Developing programs and finding services that help students receive what they need
to be successful…empowering teachers to become better at their craft.
- Provision of effective services for students. / ability to write and get funding for
grants to enhance our programs.
- The ability to lead, define, and accomplish vision and direction to positively impact
decisions, services, and programs for students! I love being the ONE who is the go-to
person. The fact that I can influence programs and services for children is awesome.
I also enjoy being in a position to influence thinking and beliefs regarding students
with disabilities in my district… My work is entrusted to me as a professional with
limited distractions or interference from those above.
- Despite the fact that my job is littered with red tape, I know that by manipulating
budgets, monopolizing staff plans, and other administrative functions, I have a direct
135
impact on classrooms. I know that my students are better off because of the work that
I do behind the scenes.
- Staff growth and development, academic growth and development of students,
personal growth and development.
- The greatest satisfaction in my role as district special education director thus far has
been seeing the growth and development of the EC teaching staff here in the district.
This is the greatest factor impacting higher achievement for students with disabilities.
- Putting together programming that meets the educational needs of students and seeing
the outcome data supporting those efforts.
- The opportunity to work with other professionals to seek continuous improvement in
instruction, program planning, assessment, parent and community involvement to
offer the highest level of education for all of our students.
- Aligning appropriate instructional supports to meet students’ needs…Engaging in
strategic planning with other district leaders. Observing instances of improved
student outcomes as a result of changes in practice, training, etc.
- I love the areas of strategic planning for program improvement, working directly with
teachers and staff on program initiatives, observing classrooms, and working
cooperatively with other Central Office administrators on district initiatives.
Special education directors indicated satisfaction when the nature of their work provided them
with opportunities to utilize strategic and instructional leadership practices. Through these
efforts, special education directors are empowered to shape and influence education programs
and initiatives to positively impact teaching and learning.
136
Collaboration and problem solving with stakeholders. Twenty-nine open-ended
responses suggested that special education directors experienced satisfaction when they
collaborated and solved problems with stakeholders. Stakeholders referenced include teachers,
parents, students, special education staff, school principals, IEP teams, and central office leaders.
A representative sample of their statements follows:
- I enjoy identifying a need/problem, analyzing the situation with a group of
stakeholders, developing solutions/resolutions and monitoring the situation to
determine if the problem has been resolved.
- I enjoy breaking down the barriers for students and collaborating with other staff to
make sure all students are achieving.
- Working directly with teachers and staff on program initiatives, observing classrooms
and working cooperatively with other central office administrators on district-wide
initiatives.
- Collaborating to develop strong comprehensive services.
- Working with EC teachers and helping them grow as professionals.
- Problem solving with IEP teams who are having difficulties with parents, teachers,
situations, etc. and resolving issues.
- Seeing parents happy which does not always mean they get everything they want.
- I enjoy working with parents and planning strategies for children to be successful. I
work closely with principals to help staff.
- Working directly with EC teachers, EC staff, and EC students / Brainstorming
solutions and noting positive outcomes to documented concerns and problems.
137
These statements reinforced a high level of satisfaction among special education directors with
regard to collaboration and problem solving with parents, IEP Teams, personnel, and school
administrators.
Improved outcomes for children with disabilities. Fifteen open-ended responses of
special education directors showed that their effort to improve outcomes for children with
disabilities was a source of satisfaction. Improved outcomes included academic achievement,
student progress toward IEP goals, and graduating from high school, as illustrated by the
following remarks:
- Helping students with disabilities succeed academically.
- The success of students with disabilities, academically and functionally.
- Working with students in the district and seeing the ‘ah ha’ moments when they
finally grasp a different strategy or technique; looking at data reports and seeing the
growth of our students.
- Seeing the students graduate; smiles on the faces of parents and students when they
reach a milestone.
- Seeing students become successful and feel good about themselves. Seeing the
teachers with the “whatever it takes attitude” making school an enjoyable and inviting
place for students.
- Seeing the data show how students with disabilities ARE making progress and more
EC students ARE graduating.
- My greatest satisfaction comes from the success of the students. I love the way I get
to follow the career of the students throughout their school career. I do not miss a
graduation ceremony so I can see the pride they have as well as their parents.
138
These statements suggested that special education directors were satisfied when students
demonstrated academic progress and were able to reach long-term outcomes, such as the
application of learning strategies and graduation from high school.
Corroboration: themes of satisfaction. These central themes of satisfaction – strategic
and instructional leadership, collaboration and problem solving with stakeholders, and improved
outcomes for children with disabilities, were corroborated with quantitative data collected from
the special education director survey. Results of the Job Satisfaction Survey (Spector, 1994)
showed the greatest areas of job satisfaction among these special education directors rested in the
following workplace facets: nature of the work (20.01, satisfaction), relationships with co-
workers (19.22, satisfaction), and autonomy in the workplace (19.13, satisfaction). Further
evidence of corroboration exists among directors’ assessment of their assigned duties in the
workplace. These special education directors devoted approximately 25% of workplace time to
collaboration and problem solving and 20% of time on strategic and instructional leadership.
Special education directors expressed satisfaction when they were instrumental in implementing
effective programs and services for students across the district. Furthermore, many of the survey
respondents’ statements articulated the rewarding aspect of working in special education as it
provides many opportunities to collaborate with parents, staff, and administrators.
Areas of Dissatisfaction
Seventy-four special education directors provided commentary in their open-ended
survey responses regarding areas of dissatisfaction in their leadership role. Central themes of
dissatisfaction included demands from the state and local education agencies, conflict among
stakeholders, and scarcity of resources. Outliers included a lack of recognition by supervisors,
139
poor communication in the workplace, exclusion of special education directors in district
initiatives, inadequate pay, lack of promotion, and stress.
Demands of the state education agency. Twenty-six statements from special education
directors showed dissatisfaction with regard to meeting the demands imposed by the state
education agency. These demands included excessive paperwork attributed to the field of special
education, such as grants and reporting requirements to secure funds, and compliance with IEP
forms. The following statements reflect their concerns with regard to state education agency
demands:
- The demands of reports that take so much time to complete for the little bits of funds
we receive at the state level. The amount of work that is required just to receive and
continue to receive $10,000 is burdensome, but in this day and time, we need funds so
badly that we must do it…Petty things get in the way but require my attention
(paperwork)…The amount of work that Medicaid entails to try to maintain
compliance makes me question whether to continue as a fee for service provider.
- Great special education teachers are leaving because of paperwork and caseloads.
- Too time-demanding with paperwork, reports, grant applications, meetings, etc.
- When the state requires documentation that is two years old on an annual basis.
- Compliance – both paperwork and paying penalties for things that are not within
control of the special education department.
- The limitations placed on the provision of services to students by required rules and
regulations and the mountains of paperwork required to make services available.
- NC IEP forms require far too much narrative causing continuous training for teachers
to meet all the working demands and to avoid non-compliance issues. My time
140
would be better spent focusing on instructional strategies; teacher time needed to
write IEPs would be better spent teaching and planning instruction.
- IEP meetings that go on for six hours.
- The paperwork and nitpicky rules of how we must write things on paperwork often
get in the way of teaching students. This is the reason I see so many teachers
becoming dissatisfied and leaving the profession.
- Way too much paperwork and documentation required to fulfill federal and state
expectations and requirements.
- Too much paperwork from the state and the feds. Too many procedural requirements
that bog down teaching and working with students…The policy and procedural
requirements never lessen; they grow like kudzu vines.
These statements imply dissatisfaction among this population of special education directors with
regard to meeting the demands of the state education agency. Dissatisfaction may stem from the
bureaucracy and paperwork demands associated with the implementation and supervision of the
district’s special education program and services.
Addressing conflict among stakeholders. Twenty-six open-ended statements from
special education directors expressed dissatisfaction with regard to addressing conflict among
stakeholders such as parents, personnel, administrators, and supervisors. The following
statements showcase their dissatisfaction:
- Principals and school staff not following prescribed procedures.
- Being asked to meet the unrealistic demands of parents, administrators, and the
community.

141
- The constant threat of lawsuits and parental complaints are the greatest areas of
dissatisfaction. Additionally, while most of my staff are GREAT, there seems to
always be some kind of conflict to address.
- Dealing with difficult individuals, including parents and education staff.
- I lose the most sleep when I have to deal with angry parents who think money is no
object and that all of their demands should be satisfied…Parents threaten us with
legal action when it is clear the school staff has gone above and beyond the call of
duty to provide for their child and their child is having the most successful year of
their academic career.
- The lack of communication and micro-management of the superintendent is a
hindrance to providing services to students.
- Dealing with resistant regular education staff and administration.
- Bickering and power struggles among colleagues.
- Trying to solve endless monumental problems.
- Many decisions that seem to be driven by what adults desire as the outcomes rather
than what really needs to happen for a student.
- Dealing with due process hearings, Office of Civil Rights, and state complaints.
- Feeling blamed for special education subgroups of children hindering schools from
reaching adequate yearly progress.
- Being forced into reactive decision making due to actions or non-actions of others.
- Lack of support from supervisors and lack of clarity from departments in the district.
142
While collaboration and problem solving were identified as central themes of satisfaction among
special education directors, addressing conflict was also noted as a theme of dissatisfaction
among these leaders.
Too many demands placed on special education directors. Twenty-two open-ended
statements from special education directors exposed dissatisfaction with the demands placed
upon them in the workplace. Dissatisfaction seemed to stem from not having enough time to
fulfill job duties, supervision of several programs in the district, and stress due to workload. The
following statements reflect these views:
- Too much stress; too many demands and deadlines that are connected to others
getting something done or responding.
- Too time-demanding with paperwork, reports, grant applications, meetings, etc.
- Not enough time to adequately address what I need to. Feeling like I’m pulled in so
many different directions most days.
- Dealing with personnel issues.
- Feeling overworked and overwhelmed with so much to do.
- Not feeling that I have enough time to address all areas of need and devote time to
improvements.
- I have recently been assigned a whole new program, and I have been told I will not
receive additional pay.
- The amount of time spent on personnel is greater than it should be.
- I wear so many hats that it is impossible to do anything well.
- The inability to spend enough time in any one area to make progress.
- The extra amount of work outside the arena of special education.
143
- Two people in my office were not replaced when I took the job, so I feel I am doing
the work of three.
- Too many roles.
- The greatest dissatisfaction in my role as district special education director is having
so many other duties and responsibilities assigned to me. I am willing to be a team
player and realize we all have other assigned duties. But I would have preferred there
be a closer look at the enormity of each duty assigned such that heavier roles could
have been spread among others as opposed to placing multiple heavy program
responsibilities on one person because he or she has the capacity to do the job.
According to these statements, many special education directors were dissatisfied with their
demands in the workplace and those associated with the district’s implementation of its special
education program. Several statements identified causes of dissatisfaction - the supervision of
more than one program in the district, vacant positions, reductions in force, and lack of time, all
of which attribute to an increased workload for special education directors.
Scarcity of resources. Scarcity of fiscal and human resources was a prevailing theme of
dissatisfaction among special education directors. Twenty statements addressed a lack of
adequate funding to support the district’s special education program, a lack of qualified special
education personnel, and/or inadequate salaries for special education program administrators.
The following statements showcased the views of special education directors regarding scarcity
of resources:
- Less funding and students with greater physical, emotional, and behavioral needs.
- Scarcity dilemma: unlimited demands for services, limited supply of funds.
- Too many responsibilities compared to my monthly pay.

144
- The pay. I feel we deserve more for our dedication to our students.
- There is little support from the district; being asked to do a lot but funding keeps
getting cut.
- Financial limitations cause great dissatisfaction as I try to provide services with a
minimal budget.
- Limited availability of certified teachers in rural areas such as mine.
- The job of a special education director requires many skills and a vast amount of
knowledge. We should be compensated better for the work we do. All special
education directors should be paid like other central office administrators.
- I am totally frustrated with the fact that special education is seen as a “stand alone”
program financially. If we truly feel that special education students are general
education students first, then it should be mandated that we are given resources above
and beyond the special education budget to meet the needs of our students.
- Budget shortfall; loss of local positions.
- Coordinating a program that requires a substantially larger budget to provide
appropriate services to all children. Providing a make-shift continuum based on
staffing and budget.
- My salary…I love my job. I love what I can make happen in my classrooms, but I
may have to look elsewhere so that I can better provide for my family.
- Challenges of retaining highly qualified personnel without the ability to compensate
them differently.
These statements exposed special education directors’ frustration with regard to a lack of human
and fiscal resources across the district. These statements imply a desire for increased personnel
145
to implement the district’s education programs and initiatives, improved salaries, and a
realignment of duties to alleviate an unmanageable workload.
Corroboration: themes of dissatisfaction. The prevailing themes of dissatisfaction
identified through the open-ended responses of special education directors included: the demands
of the state education agency, conflict among stakeholders, too many demands placed on special
education directors, and scarcity of resources. These themes of dissatisfaction were corroborated
through comparison of quantitative and qualitative data collected through this special education
director survey.
The majority of special education directors were assigned supervision of more than one
program in the district as evidenced by quantitative and qualitative data. Typical program
assignments of these leaders included the district’s special education and preschool programs,
Section 504 Program, academically gifted services, and student services. These additional
supervisory responsibilities supported the dissatisfaction themes of ‘state agency demands’ and
‘workplace demands.’ It is widely known that education programs are accompanied by their
own rules, regulations, reporting procedures, and paperwork, which was reinforced by the
comments of these special education directors. Quantitative data showed that one-third of
special education directors were already employed by the district when they were assigned
supervision of the special education program, a fact that may warrant further investigation
regarding workplace satisfaction.
According to the responses received, special education directors devoted approximately
34% of their time in the workplace directly to the management and operations of the district’s
special education program, 17% on human and fiscal management, 8% on curriculum and
instruction, 5% on strategic and program planning, and 4% on resource acquisition, according to
146
quantitative data. With regard to conflict among stakeholders, special education directors spent
approximately 15% of their time addressing the concerns of stakeholders.
Open-ended responses and quantitative data implied disparities regarding the salaries of
special education directors. For example, 50% of special education directors reported an annual
income ranging from $71,000 - $90,000. On the other hand, 31% reported an annual income
ranging from less than $50,000 to $70,000. Six percent reported an annual income in excess of
$91,000. Special education directors expressed concern regarding inadequate salaries in relation
to the demands associated with special education administration. Other factors that may
influence salary include years of experience in public education, highest level of education, and
experience as a principal. In addition, it is widely known that salary negotiation may occur
regarding central office administrative positions within state and local agencies; therefore, it is
unknown as to whether negotiation played a role in the salaries of special education directors.
Dissatisfaction with workload and scarcity of resources were corroborated through
comparison of quantitative and qualitative data. Special education directors reported an average
work week of 53 hours, 13 hours in excess of the customary 40-hour work week. The majority
of special education directors reported to work early, stayed late, and/or worked on weekends to
fulfill job obligations. These findings supported statements reflecting a very heavy workload.
Over 86% of special education directors indicated that their workload has increased since
acquisition of the position. Increased workload was attributed to position vacancies, budget cuts,
and realignment of duties among central office staff. With regard to intent to remain in the
position, 8% of special education directors indicated less than a one year commitment to the job,
whereas 51% identified a commitment of five years or less. Over 80% of special education
directors described their workload as heavy or impossible to manage.
147
Finally, the mean subscale scores of the Job Satisfaction Survey (Spector, 1994)
identified dissatisfaction among special education directors with regard to their salary (9.66) and
operational conditions (10.53) such as workplace regulations, procedures, reports, special
education paperwork, etc. Ambivalence was noted with the JSS subscales of contingent rewards
(13.26) and employee benefits (14.13). Areas of dissatisfaction or ambivalence regarding
salaries, benefits, and excessive paperwork in special education administration were noted
through the open-ended responses of survey participants.
Areas of Needed Support
A final open-ended question was posed to special education directors (N=68) to gauge
their attitudes and perceptions regarding what supports, if any, were needed to improve the job
satisfaction of individuals serving in this leadership role. Coding of responses revealed the
prevailing themes regarding areas of needed supports to improve job satisfaction: increased
human and fiscal resources, improved salaries and benefits for special education program
administrators, and reductions in bureaucracy.
Increased human and fiscal resources. Twenty-one responses from special education
directors indicated that increased human and fiscal resources were needs of the local education
agency and/or special education department. Many statements reflect a desire for increased
funding as state and local education agency budgets experienced vast reductions in recent years.
Other statements illustrate a need for additional personnel at the state and local education
agencies to support districts with initiatives. These statements exemplify the need for increased
human and fiscal resources:
- More funding for students and teacher needs.

148
- More resources!!! Resources can mean funding special education at a new and
reasonable rate, not at the 1997 rate.
- More collaboration/coordination of resources with superintendent and finance
officers.
- Adequate funding to meet the needs of the students.
- More regional consultants on the ground and knowledgeable of day-to-day needs.
- Resources that are more focused on professional development for student
improvement in core content areas and skills.
- More funding for special education, particularly for programs and staffing.
- Resources more focused on professional development for student improvement in
core content/skills and school skills.
- Additional support, consultation, and planning from the state to meet the needs of
hard-to-serve students.
- Allocate to each local education agency a certain number of state-funded special
education teacher positions.
- I need more staff and money to operate my programs based on state regulations.
- Provide a cohort training program for new directors each year, not every two years.
- Additional staff to alleviate some of the pressures and to support other programs
under my umbrella.
- An increase in state funding per student so directors are not constantly “squeezing
lemons” to make ends meet would help.

149
As the responses demonstrated, special education directors desired additional human and fiscal
resources to improve job satisfaction as a large portion of the job entails the provision of
educational programs and services in the face of diminishing resources in their environment.
Improved salaries and benefits. In order to improve the job satisfaction of special
education directors these leaders proposed increased salaries and benefits for individuals
working in the field of special education administration. The rationale for increased salaries and
benefits for special education personnel hinted at the level of expertise, knowledge, and skills
required for individuals employed in this supervisory role. In addition, improvements in salaries
and benefits were tools frequently used to recruit, hire, and retain highly qualified personnel into
the organization. The following statements illustrate the need for increased salaries and benefits
for special education leaders:
- The lack of raises over the past few years has really hurt everyone. I do not think the
role of special education director is viewed as equitably for administration openings
at higher levels (such as assistant superintendent) compared to other administrative
positions (such as principal and curriculum director).
- Better benefits and higher salaries.
- We need a separate pay scale with a guiding chart for years of experience.
- Pay special education teachers and teacher assistants more. This would make it easier
to find quality staff and keep them.
- More time and money.
- Encourage the state to pay us more in this role.
- Supplements to stay in the position.
150
- Increased funding at the local level so we can have the personnel to oversee all of the
initiatives that we need and want to do in order to improve programming for schools.
- Better health benefits and pay (cut the costs of family/spouse insurance).
- Our job is very stressful which results in high turnover. We need additional
motivation in the form of compensation and leave time.
According to these statements, improvements to salaries and benefits of special education
administrators were needed supports to improve their overall job satisfaction and attract highly
qualified individuals into this complex and demanding leadership role.
Reduction in bureaucracy. A reduction in bureaucracy (paperwork, reporting,
regulations, etc.) was identified as a need to improve job satisfaction of special education
directors. Several comments of these leaders pointed to a desire to reduce paperwork, streamline
special education forms, and unify reporting requirements. In addition, flexibility with state
regulations was suggested. The following statements illustrated the need for reductions in
bureaucracy, according to special education directors:
- Less paperwork.
- Less paperwork or one system that includes all reporting.
- Simplified paperwork. It needs to be condensed. There is a great deal of repetition.
- Improved IEP forms.
- We need fewer requirements from the federal government.
- Remove class size limits and require reasonable numbers.
- The paperwork required for PRC 082 and PRC 118 funds is out of control. Special
grants have rubrics that create unequal distribution of funds.
151
- I understand the rational for writing grants and what have you, but there has just got
to be an easier and better way to serve the needs of our children.
- Reduction in paperwork; more time needed to work with students.
- The state education agency should follow the legal requirements of IDEA and stop
creating “policy.” These policies have created massive paperwork requirements that
keep expanding. These policies have created an incredible number of legal and
procedural problems for LEAs that are burdensome, costly, and have always slanted
toward parents and advocates. It’s as if special education directors working daily in
the LEA are ignored and seldom, if ever, truly consulted and listened to.
These statements suggested that special education directors are entangled in a web of
bureaucracy and regulations that include excessive paperwork and compliance to state and
federal special education policies and regulations.
Corroboration: areas of needed support. With regard to needed supports to improve
job satisfaction, special education directors recommended increased human and fiscal resources,
improvements to salaries and benefits of special education personnel, and reductions in
bureaucracy. Corroboration of these statements occurred through open-ended responses
regarding areas of dissatisfaction as identified by special education directors. Quantitative data
also supported these themes of needed supports as identified through the programs of supervision
assigned to these leaders, the amount of time devoted to supervisory duties, and workload
associated with this role. Many statements provided by special education directors regarding job
dissatisfaction were associated with increased workload, excessive paperwork, and cumbersome
IEP forms. Factors attributing to increased workload included vacant positions within the
organization, the district’s decision to cut positions and/or reassign duties among central office
152
staff. In addition, special education directors’ JSS mean subscale scores (Spector, 1994)
corroborated dissatisfaction among special education directors regarding salaries (9.66) and
operational conditions (10.53).
Summary
Based on the quantitative and qualitative findings of this mixed methods research study,
North Carolina’s special education directors certainly have a vast and difficult workload to
manage which impacts their overall satisfaction with this leadership role. Over 50% of special
education directors, many of whom are novice leaders with fewer than five years of experience
in this role, have the responsibility of supervising and managing several programs within the
school district. Such programs of supervision include the special education and preschool
programs, Section 504 program, academically gifted services, and student services. Other
leadership responsibilities include, and are not limited to, strategic and instructional leadership
practices to implement effective education programs and services, human and fiscal
management, collaboration, and problem solving with stakeholders. Findings showed that the
majority of special education directors have ambivalence or a feeling of dissatisfaction toward
their supervisory role. In addition, correlation among workplace facets and job satisfaction, as
well as combined independent variables and job satisfaction, were exposed through statistical
analyses. Local and state education agencies should ponder these findings as they point to a
need to improve job satisfaction of special education administrators. If neglected, vast turnover
in the field of special education administration may occur in the near future. These findings will
be further discussed in Chapter V, accompanied by recommendations to improve the overall
working conditions and job satisfaction of North Carolina’s special education directors.
153
Chapter V
DISCUSSION AND RECOMMENDATIONS
Today’s special education administrators are embroiled in a complex leadership role that
has expanded in recent years due to state and federal education laws, increased accountability,
and greater emphasis to improve student achievement. Special education administrators have
great responsibilities in the workplace as they must implement the provisions of laws that
guarantee the educational rights of enrolled children with disabilities age 3-21. These statutes
include the Section 504 of the Rehabilitation Act of 1973 (29 U.S.C. 794), the Individuals with
Disabilities Education Improvement Act of 2004 (20 U.S.C. 1400), and the Americans with
Disabilities Act of 1990 (42 U.S.C. 12101-12213) (U.S. Department of Education, 2010). To
accomplish the intent and purpose of these regulatory provisions, these leaders collaborate,
leverage support, and problem-solve with the district’s education programs and services,
personnel, parents, school administrators, and other district leaders to provide individualized
education programs and services for children with disabilities (Council of Exceptional Children,
2009; Lashley & Boscardin, 2003; Seltzer, 2011).
This capstone study investigates employee characteristics, workload, and job satisfaction
of special education directors (N=115) employed by local education agencies in North Carolina.
This study illuminates the attitudes and perceptions of special education directors regarding areas
of their leadership role that are most satisfying, dissatisfying, and what supports are needed to
improve job satisfaction. Data analysis yields a profile of these leaders, their workload, job
satisfaction, and identifies the most rewarding and challenging aspects of this supervisory
position. Data analysis shows the existence of relationships among variables influencing the job
satisfaction of these leaders, all of which are discussed in Chapter V.
154
Statement of the Problem
A review of literature in special education administration concluded that special
education directors have faced increased demands in the workplace in recent years. These
increased demands may be attributed to greater accountability and regulations associated with
the implementation of the Individuals with Disabilities Education Improvement Act of 2004 (20
U.S.C. 1400), a law designed to protect the educational rights of children with disabilities. Other
factors contributing to this expansive role include state and national expectations to improve
student achievement and academic rigor, increased bureaucracy from education agencies,
personnel shortages, budget cuts, and disputes in special education (Apling & Jones, 2005;
Begley, 1982; CADRE, 2012; Carter, 2011; Edmondson, 2001; Embich, 2001; ESEA/NCLB,
2001; IDEA, 2004; Boscardin, Weir, & Kusik, 2010; Gersten, Gillman, Morvant, & Billingsley,
1995; Lashley & Boscardin, 2003; NCDPI, 2010; NCSBOE, 2006; U.S. Department of
Education, 2010; Valesky & Hirth, 1992; Yell et al., 2006).
While a review of literature identified many challenges associated with special education
administration, few studies exist on the workload and job satisfaction of special education
directors. Marro and Kohl’s (1972) national study of special education directors identified a
prevalence of novice administrators with fewer than five years of experience in the role. These
administrators devoted a majority of their time in the workplace to supervisory and management
duties of the district’s special education program and little time on curricula and instruction
(Marro & Kohl, 1972). These leaders identified their preferences with regard as to how they
would like to spend their work time which included the provision of direct services to children,
supervision of personnel, curricula and instruction, and self-improvement activities (Marro &
Kohl, 1972). Obstacles preventing involvement in preferred tasks were identified and included
155
assignment of other district duties, personnel shortages, lack of administrative assistance, and
job-related pressures (Marro & Kohl, 1972).
Arick and Krug’s (1993) national study of special education administrators yielded
similar findings to the research of Marro and Kohl (1972). Approximately 70% of special
education directors’ time in the workplace was spent on supervisory duties associated with
implementing the special education program, 20% on curricula, and 10% on other assigned
duties (Arick & Krug, 1993). Over 10% of education agencies reported vacancies in the special
education administration, and over half anticipated a vacancy in this role (Arick & Krug, 1993).
Arick and Krug’s (1993) study recognized that almost 50% of special education directors did not
hold the requisite credentials as required by the state education agency. Lastly, this study
identified training needs of special education administrators which included development of
grant proposals, creation/implementation of data systems for management, and strategies to
foster collaboration and facilitation across personnel and disciplines (Arick & Krug, 1993).
Tate’s (2009) study investigated perceptions of special education directors in North
Carolina, many of whom were inexperienced in the role, with regard to why individuals remain
or vacate this position. These directors perceived attrition in special education administration to
be influenced by the lack of fulfillment of intrinsic and extrinsic motivators (Tate, 2009).
Intrinsic factors included recognition for hard work and support from supervisors, whereas
extrinsic factors were operational conditions, regulations, and excessive paperwork demands
associated with the administration of the special education program (Tate, 2009).
DiPierro’s (2003) study of special education directors in New Jersey identified a novice
population of administrators with fewer than five years of experience in special education
administration. While these leaders described their workload as unmanageable or extreme,
156
almost two-thirds expressed job satisfaction (DiPierro, 2003). Godshall’s (2004) study of special
education administrators in New York concluded that intrinsic motivators of building
relationships with stakeholders and the nature of the work influenced job satisfaction.
Subsequently, this capstone study is focused to shed an informative light on the workload and
job satisfaction of North Carolina’s special education directors with respect to their changing
role in recent years.
Methodology
Upon approval of the Wingate University Research Review Board (Appendix A), this
mixed methods research study was instituted to investigate employee characteristics, workload,
and job satisfaction among North Carolina’s special education directors (N=115). This design
collected quantitative and qualitative data through census sampling as the entire population of
special education directors was targeted for participation (Creswell, 2008; Creswell, 2011;
Johnson & Onwuegbuzie, 2004; Kish, 1979). An online survey (Appendix D) was developed
which contained the following components: 1) employee characteristics, 2) workload, 3) job
satisfaction, and 4) open-ended questions. This online survey was distributed accordingly by
email to the targeted population. Sections one, two, and three of the survey collected
quantitative data by posing closed questions to participants. Section four collected qualitative
data by posing open-ended questions to explore the attitudes of special education directors
regarding areas of their job that were most satisfying, dissatisfying, and what supports, if any,
were needed to improve satisfaction. Responses were anonymous to protect identities,
confidentialities, and to promote straightforwardness. Upon closure, 91 of 115 special education
directors participated in the survey, giving the study a 79.13% response rate. This high response
rate intimated that special education directors employed by local education agencies in North
157
Carolina were eager to provide insight into their workload, job satisfaction, and areas of their
work that were most rewarding and challenging.
Three of four sections of this survey were developed by the researcher - employee
characteristics, workload, and open-ended questions, based on her prior experience in special
education administration and conclusions reached from a review of literature. To assess job
satisfaction of special education directors, the Job Satisfaction Survey (JSS) (Spector, 1994) was
integrated into this study. Written permission to incorporate this instrument into the special
education director survey was received from JSS creator Dr. Paul Spector, a professor and
psychologist of the University of South Florida as evidenced in Appendix B (P. Spector, personal
communication, December 31, 2012). The online survey was vetted among five experts in
special education administration and human resources management to solicit feedback on its
contents to ensure it appropriately investigated the constructs of inquiry.
The JSS is a research-validated measure of employee job satisfaction that applies a 6-
point Likert-scale to 36 statements regarding facets of the workplace where individuals agree or
disagree (Spector, 1985; Spector, 1997). Workplace facets explored by the JSS include the
following: salary, promotion opportunities, autonomy in the workplace, employee benefits,
contingent rewards, operational conditions, relationships with co-workers, the nature of one’s
work, and communication within the organization (Spector, 1994; Spector, 1997). Internal
consistency reliabilities for its subscales range from .60 to .82, and its total reliability is .91,
indicating accuracy in measuring job satisfaction (Spector, 1985; Spector, 1997).
Each facet or subscale of the JSS produces a score ranging from four to 24, and the
instrument as a whole produces a total job satisfaction score of each participant ranging from 36
to 216 (Spector, 1985; Spector, 1997). Subscale scores ranging from four to 12 point to
158
dissatisfaction; 13 to15, ambivalence; and 16 to 24, satisfaction (Spector, 2007). Collectively,
JSS scores ranging from 36 to108 indicate dissatisfaction; 109 to144, ambivalence; and 145 to
216, satisfaction (Spector, 2007).
Data analysis produced descriptive statistics about this population of special education
directors in percentages, mean scores, range, and frequency distribution (Creswell, 2011; Gall et
al., 2003). Statistical measures such as chi square, t-test (two sample of unequal variance),
Pearson product-moment correlation, logistic regression, and multiple regressions were applied
to determine whether relationships, correlation, or differences exist among variables (Pagano,
2010). Coding of qualitative data identified themes of similarity regarding areas of special
education administration that produced the greatest satisfaction, dissatisfaction, and identified
needed supports. These multiple sources of data allow for triangulation and assist in making
inferences regarding the workload and job satisfaction of special education administrators
(Creswell, 2008; Creswell, 2011).
Research Questions
This study investigated the following research questions to gain an understanding of
employee characteristics, workload, and job satisfaction of special education directors employed
by local education agencies in North Carolina:
1) What are the employee characteristics of North Carolina’s special education directors?
2) What is the workload of special education directors at the district level?
3) What is the level of job satisfaction among special education directors?
4) What relationships exist, if any, among employee characteristics, workload, and job
satisfaction of special education directors?
159
5) What are the perceptions of special education directors in regard to job
satisfaction/dissatisfaction and any needed supports to improve job satisfaction?
Results and Discussion
A discussion of the findings of this study on the workload and job satisfaction of special
education directors is presented and accompanied by an interpretation of results with
implications for state and local education agencies to consider. Embedded into this discussion
are the most satisfying and challenging areas of special education administration identified by
the open-ended responses of these leaders, as well as supports they indicate are necessary to
improve the overall satisfaction of individuals in this supervisory role. Local and state education
agencies should consider the implications of these findings with regard to organizational
management practices and the intrinsic/extrinsic motivators among employees - factors that have
great influence on human behavior, work performance, and overall job satisfaction.
Characteristics of Special Education Directors in North Carolina
A Profile of North Carolina’s Special Education Directors
Findings present a prevalence of women in special education administration among North
Carolina’s local education agencies, 82% females and 18% males. While earlier studies of
special education administration point to a field dominated by males in the 1960s and 1970s,
greater leadership opportunities in special education administration have become available and
accessible to females in the past 35 years (Marro & Kohl, 1972; Marshman, 1965; Gillung et al.,
1992; DiPierro, 2003; Tate, 2009).
Approximately 40% of special education directors in North Carolina are within the age
range of 51 to 60, according to survey responses. Fifty-five percent hold a master’s degree as
their highest level of education, while 45% possess an advanced degree or doctoral degree.
160
Findings regarding the education level of these leaders align to the regulations set forth by the
North Carolina Department of Public Instruction as individuals providing oversight of the
district’s special education program must have a master’s degree, accompanied by nine hours of
graduate-level courses in special education administration or educational administration (NCDPI,
2010; NCDPI Licensure Division, 2013).
The majority of special education directors in North Carolina are seasoned educators with
many years of experience in public education. Fifty percent report 21 to 30 years of experience
in public education, and 22% report greater than 31 or more years in public education. With
almost 75% of special education directors identifying two decades of service in public education,
school districts will likely experience great turnover in special education administration as many
of these individuals reach the age of retirement eligibility.
Findings suggest district size may play a role in the salary of special education
administrators. Approximately 41% of special education directors are employed by districts
with a very small population of 1-5,000 students; of this group, 78% earn less than $71,000
annually. Only 8% of directors employed by the smallest districts report an annual income
greater than $80,000. Almost 25% of special education directors are employed in districts with a
population of 5,001 to 10,000 students. Of this tier, 8% earn a salary of $81,000 to $101,000,
similar to the salary of special education directors employed by the smallest districts. Eleven
percent of special education directors are employed by districts with a population of 10,001 to
15,000 students. Of this group, more individuals, 53%, earn a salary in excess of $81,000. Eight
percent of special education directors work in districts reporting a population of 15,001 to 20,000
students. Thirty percent of these individuals earn more than $81,000 annually. Of the 6% of
special education directors employed in districts with a population of 20,001 to 25,000 students,

161
37% of salaries exceed $81,000. Special education directors employed by very large districts
with a population of greater than 30,000 students typically earn beyond $90,000 annually.
Findings suggest size of the district’s child count (total enrolled students with disabilities)
may be another factor influencing the salary of special education directors. Approximately 54%
of special education directors manage a small child count of 1 to 1,000 students with disabilities,
and the majority of them earn less than $80,000 annually. Twenty percent of special education
directors manage a child count of 1,001 to 2,000 students; of this group, one-third earn above
$81,000 annually. Almost 15% of special education directors manage a child count of 2,001 to
3,000 students. Of this group, a larger population, 62%, earn an income in excess of $81,000.
One director manages a child count of 4,001 to 5,000 and reports earnings beyond $101,000;
whereas another director manages a child count of 6,001 to 7,000 and earns beyond $90,000.
Two individuals report a child count greater than 10,000, and their salaries are $71,000 to
$80,000 and beyond $101,000 respectively. Findings suggest salaries of special education
directors increase as the district’s child count increases.
One-third of special education directors report prior experience as a principal; however,
this fact does not appear to have bearing on salary. While 14 directors report experience as a
principal and whose salaries are within $71,000 to $80,000, an equivalent number of special
education directors without principal experience receive a similar salary. Of the $81,000 to
$90,000 salary bracket, four special education directors indicate principal experience while 13
directors earning similar income report no experience as a school administrator. In the $91,000
to $100,000 salary level, five special education directors have prior service as a principal while
two do not. In the $101,000 and greater income tier, three special education directors have prior

162
experience as a principal while six do not. While there is a vast salary range among special
education directors, it appears that school governance experience may not be a factor.
The variance among special education directors’ salary may be attributed to broad
guidelines established by the state education agency as identified in the NCDPI 2012-13 State
Salary Manual and 2012-13 Salary Schedule regarding central office leadership positions
(NCDPI Finance and Business Services Division, 2013). For example, a level one supervisor
earns an annual income from $40,188 to $75,372, whereas a level three supervisor earns from
$45,228 to $84,816 (NCDPI Finance and Business Services Division, 2013). To further
illustrate this local flexibility, district leaders assigned to level five earn between $48,936 and
$91,764 annually while those in the top tier earn from $54,000 to 101,232 (NCDPI Finance and
Businesses Services Division, 2013). As such, school districts have great flexibility with regard
to the salary it assigns to its central office supervisory positions.
Local supplemental pay may serve as a contributing factor influencing the salary of
special education directors. A sample of data from the NCDPI 2010-2011 Local Salary
Supplement Report (NCDPI Finance and Business Services Division, 2013) illustrates the
variance regarding average local supplemental pay provided to central office supervisors: Duplin
County Schools, none; Mooresville Graded School District, $7,411; Davie County Schools,
$4,705; Chapel-Hill/Carrboro City Schools, $18,672; Lincoln County Schools, $6,541; Orange
County Schools, $8,362; Onslow County Schools, $7,060; Alexander County Schools, $6,177;
Guilford County Schools, $9,104; Cumberland County Schools, $3,784; Edgecombe County
Schools, $6,076; and Charlotte-Mecklenburg Schools, $19,706 (NCDPI Finance and Business
Services Division, 2013). If the local education agency decides to provide additional local
163
supplemental pay to its employees, the amount is left to the discretion of the district and local
school board (NCDPI Finance and Business Services, 2013).
Salary disparities are clearly a central theme of dissatisfaction among special education
directors’ open-ended responses and their mean salary subscale scores of the Job Satisfaction
Survey (Spector, 1994). The JSS mean salary subscale value for these directors was 9.6, a level
of dissatisfaction. Findings show a greater level of dissatisfaction when compared to the JSS
mean salary subscale value for the elementary and secondary education population (comprised of
K-12 teachers and administrators) whose score was 12, also indicating dissatisfaction (Spector,
2007). Participants’ responses illuminate their beliefs that special education directors are not
paid a commensurate wage as compared to other district-level roles. Individuals participating in
the study advocate for the establishment of a separate pay scale for special education directors
based on years of experience in the position, programs of supervision, and other duties.
These findings of dissatisfaction regarding special education directors’ salaries are
important for organizations to acknowledge as employees view salaries as extrinsic motivators,
tangible rewards, and an outward demonstration of the level of commitment and support the
organization has for its workers (Brown & Mitchell; 1993; Chang, Chiu, & Chen, 2010; Spector,
1997). Equity evaluations may be a factor of consideration with regard to salaries as employees
use them to determine whether their treatment in the workplace is congruent to others holding
similar roles (Adams, 1963; Bolino & Turnley, 2007; Rice, Phillips, & McFarlin, 1990; Spector,
1997). In addition, individuals interpret salaries as rewards for performance and place value on
such extrinsic rewards, as identified in Vroom’s (1964) expectancy theory. These findings
reinforce content and process theories of psychology and organizational management as
behaviors are driven by psychological and physical needs and shaped by intrinsic and extrinsic
164
motivators (Adams, 1963; Alderfer, 1969 & 1972; Maslow, 1943; Herzberg et al., 1959;
McClelland, 1975 & 1988; & &Vroom, 1964).
Findings show over one-half of special education directors in North Carolina are novice
administrators with fewer than five years of experience in this position, and 24% have six to 10
years of experience in this role. These findings concur with findings of state and national studies
investigating the characteristics of special education administrators (Marro & Kohl, 1972;
Gillung et al., 1992; DiPierro, 2003; Tate, 2009). Marro and Kohl (1972) found that special
education administrators possessed fewer than three years of experience in the role, whereas
Gillung et al. (1992) identified an average of six years of experience among special education
administrators. DiPierro (2003) and Tate (2009) identified the existence of a novice population
of special education administrators in New Jersey and North Carolina respectively. These
studies, coupled with the findings of this study, illuminate a pattern of novice leaders in special
education administration. These facts give education agencies cause for reflection as to why this
continual pattern of turnover exists.
Data regarding years of experience in public education and years of experience in special
education administration were overlaid to make comparisons, as depicted in Figure 8:
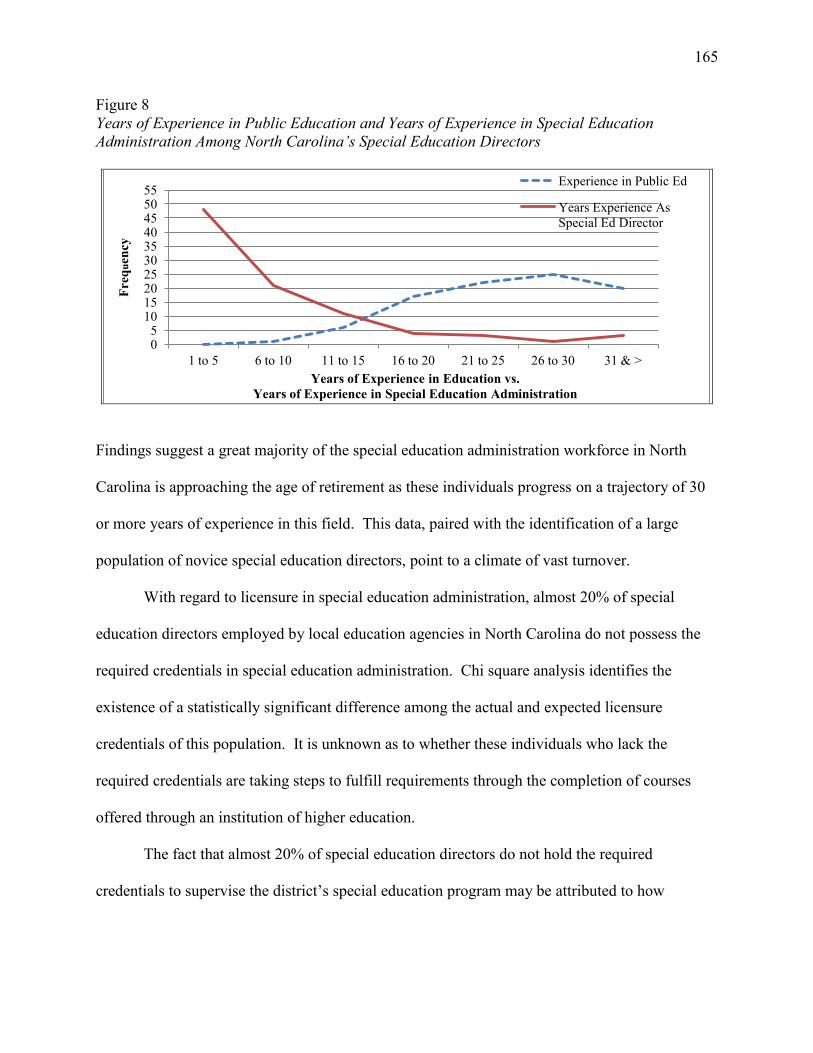
165
Figure 8
Years of Experience in Public Education and Years of Experience in Special Education
Administration Among North Carolina’s Special Education Directors
Findings suggest a great majority of the special education administration workforce in North
Carolina is approaching the age of retirement as these individuals progress on a trajectory of 30
or more years of experience in this field. This data, paired with the identification of a large
population of novice special education directors, point to a climate of vast turnover.
With regard to licensure in special education administration, almost 20% of special
education directors employed by local education agencies in North Carolina do not possess the
required credentials in special education administration. Chi square analysis identifies the
existence of a statistically significant difference among the actual and expected licensure
credentials of this population. It is unknown as to whether these individuals who lack the
required credentials are taking steps to fulfill requirements through the completion of courses
offered through an institution of higher education.
The fact that almost 20% of special education directors do not hold the required
credentials to supervise the district’s special education program may be attributed to how
0 5
10 15 20 25 30 35 40 45 50 55
1 to 5 6 to 10 11 to 15 16 to 20 21 to 25 26 to 30 31 & >
Fre
quen
cy
Years of Experience in Education vs.
Years of Experience in Special Education Administration
Experience in Public Ed
Years Experience As
Special Ed Director
166
individuals acquired the position. One-third of special education directors reported they were
already employed by the district and were assigned supervision of the special education program.
The fact that these individuals did not solicit supervision of the district’s special education
program hints to several issues worthy of discussion. First, the assignment of the special
education program to a current employee in the district implies a realignment of duties among
staff and perhaps an effort by the local education agency to conserve funds. This proposition is
supported by special education directors’ identification of factors increasing their workload as
identified in both the quantitative and qualitative data of this study – reductions in positions and
shifting of duties among central office staff. Their views are further supported by findings
identified in a national survey of state and local education agencies Weathering the Storm: How
the Economic Recession Continues to Impact School Districts (American Association of School
Administrators, 2012). This report identified a $44 billion deficit among more than half of state
education agencies for fiscal year 2013-2014 (American Association of School Administrators,
2012). This funding gap is in addition to previous budget cuts incurred by states since 2008,
totaling beyond $530 billion (American Association of School Administrators, 2012). Findings
showed that 81% of school districts consider themselves to be poorly funded, and 70% will
continue to eliminate positions (American Association of School Administrators, 2012). Other
cost-saving measures that districts include are reducing employees’ benefits, eliminating
professional development, and outsourcing of services (American Association of School
Administrators, 2012). With districts continuing these practices, job assignments will likely
expand among public school employees as education agencies struggle with the provision of an
education program with shrinking revenues.
167
From a state perspective, North Carolina’s 2012-2013 education budget was $7.74 billion
excluding federal funds; however, a decline in revenue exists in comparison of the 2008-2009
state education budget of $8.19 billion (NCDPI Information Analysis Division, 2013). While
education agencies continue to experience financial loss, the state has gained 60,000 students
since 2006-2007 bringing enrollment to 1,480,991 children in 2011-2012 (NCDPI Information
Analysis Division, 2013). Conversely, personnel reductions have occurred since the onset of the
recession as there were 187,463 public school employees in 2008-2009 as compared to 175,630
in 2011-2012, a loss of 11,833 workers (NCDPI Finance and Business Services Division, 2012).
These data emphasize that local education agencies have fewer employees; as such, the work of
educating students must be distributed among a smaller workforce influencing their workload.
With reassignment of duties it is noted that individuals who lack the required credentials
in special education administration may lack the requisite knowledge and skills associated with
the role. As a result, these individuals find themselves in a precarious situation of “on the job”
training. When an individual charged with management of the special education program lacks
expertise in special education laws, policies, human resources, fiscal management, instructional
programming, and techniques used to resolve disputes, the district may find itself in a vulnerable
position if and/or when confronted with formal complaints, and/or litigation. In addition, special
education directors who lack the requisite strategic and human resources management
dispositions will likely face challenges as they must develop and implement a budget with
constrained financial resources.
The fact that almost 20% of special education administrators lack the required
supervisory credentials for their position also hints to a less than serious attempt by some local
education agencies to recruit and hire the best qualified person for the role of special education
168
director. Assignment of a job to an employee who has no interest for the task may pose a wealth
of problems for the employee and organization. These problems include employee frustration,
job stress, illness and/or absenteeism, increased workplace errors, costly mistakes, and turnover
(Embich, 2001; Markos & Sridevi, 2010; Gersten, Gillman, Morvant, & Billingsley, 1995;
Lashley & Boscardin, 2003; Spector, 1997).
Findings indicate that almost 10% of special education administrators do not intend to
remain in their current role, and 51% have a short-term commitment of one to five years. While
one may speculate that increased years of experience in public education, retirement eligibility,
and intent to remain in the position are associated, there may be other factors influencing intent
to remain in the position, such as workload and job satisfaction.
What is the Workload of Special Education Directors?
A Monumental Workload
Findings imply an immense workload among special education administrators in North
Carolina as the majority of these individuals manage more than one program in the district and
work prolonged hours to fulfill job duties. Typical program assignments among special
education directors include the special education program, preschool, academically and
intellectually gifted program, and student services. Interesting, one special education director
reports he or she supervises the district’s testing and accountability program. All special
education directors participating in this study report membership on district and/or community-
level committees as a job requirement. Approximately 74% are members of the superintendent’s
cabinet and 70% are on the district’s curriculum team. Other committees are specific to
directors’ assigned programs of supervision.
169
Findings unveil a prolonged work week among special education directors, 53 hours, 13
hours beyond the typical 40 hours associated with full-time employment. Most of these leaders
report to work early and/or stay late, and work on weekends, to fulfill the demands of their job.
By comparison, the typical work week of special education directors as identified in Marro and
Kohl’s (1972) national study was 45 hours. Findings from the 2010-2011 Occupational Outlook
Handbook (U.S. Department of Labor, Bureau of Labor Statistics, 2010) concluded that central
office administrators and principals typically worked in excess of the traditional 40-hour work
week, including evening and weekend work. Similarly, teachers and school counselors worked
40 hours a week and included attendance at evening school-sponsored events (U.S. Department
of Labor, Bureau of Labor Statistics, 2010).
The mean 53-hour work week among North Carolina’s special education directors
supports earlier discussion regarding the state’s budget crisis and reductions in personnel across
public schools. According to Trends: Growing Student Population served by Fewer Adults
(NCDPI Finance and Business Services Division, 2012), the state’s public school workforce was
reduced by almost 12,000 workers since the recession began in 2008. Reductions in force of this
magnitude are likely to be a factor increasing the workload of the district’s remaining employees
as they will most likely be assigned extra responsibilities in the workplace.
Other factors that may contribute to an increased workload among special education
directors may are the provisions of IDEA 1997, ESEA/NCLB 2001, and IDEA 2004. The
ESEA/NCLB 2001 and IDEA 2004 require state and local education agencies to ensure the
participation of all students in its statewide testing, district wide measures, and accountability
model to the same extent as non-disabled children (ESEA/NCLB 2001; IDEA 2004; Katsiyannis
et al., 2001). NCLB 2001 and IDEA 2004 put forth provisions regarding the instruction of
170
children with disabilities in the least restrictive environment by highly qualified teachers;
therefore, directors must exhaust efforts to hire and retain qualified personnel, as well as ensure
that a full placement continuum exists across the district. Furthermore, IEP Teams must consider
the academic and functional performance of a child with a disability, taking into consideration
the total child, and develop an appropriate individualized education program to meet his or her
needs (Gorn, 1997; IDEA, 1997; IDEA, 2004; Katsiyannis et al., 2001).
Disciplinary provisions of IDEA 1997, upheld in IDEA 2004, may also influence the
workload of today’s special education directors. These leaders typically train and problem solve
with school administrators, parents, and IEP Teams regarding the procedural safeguards
regarding short-term and long-term removals of children with disabilities who violate the
district’s code of conduct. These safeguards include functional behavior assessments (FBA),
behavior interventions, and manifestation determination review (MDR) (Apling & Jones, 2005;
IDEA, 1997; IDEA, 2004; Skiba, 2002). The MDR is used when a student’s removal from his or
her education environment (suspension) exceeds 10 days; therefore, the child’s IEP team must
determine whether the misbehavior causing the removal is due to his or her disability or the
district’s failure to implement the IEP (Apling & Jones, 2005; IDEA 1997; IDEA, 2004; Skiba,
2002). While these disciplinary provisions are designed to restrict unilateral removals of
children with disabilities, they may unintentionally pit special education directors against school
administrators. Principals have the authority to consider the unique circumstances of a student’s
disciplinary incident as school safety is paramount, while at the same time, special education
directors must ensure that children with disabilities receive a free, appropriate public education
with appropriate behavior supports to address the misbehavior in question (Apling & Jones,
2005; IDEA, 1997; IDEA, 2004; Skiba, 2002).
171
Pearson product-moment correlation did not identify correlation between hours worked
and the job satisfaction of this population of special education directors. In addition, directors’
JSS mean subscale scores for the domain “nature of the work” was 20.01, indicating satisfaction
with the work associated with special education administration. When an employee associates
purpose and meaning to his or her work, there is a greater likelihood of improved performance
and job satisfaction (Hackman & Oldham, 1976, 1980). These findings suggest that intrinsic
motivators such as the nature of the work itself, performance feedback, and relationships with
co-workers influence human behavior and may lead to satisfaction (Hackman & Oldham, 1976,
1980; Maslow, 1943; Herzberg et al., 1959; Mcclelland, 1965, 1988; Alderfer, 1969, 1972).
North Carolina’s special education directors devote more time to the management of the
special education program when compared to Arick and Krug’s (1993) study. This increase is
likely attributed to expanded laws designed to protect the educational rights of children,
increased accountability, and emphasis on improving the academic achievement of students
(Apling & Jones, 2005; Embich, 2001; ESEA/NCLB, 2001; IDEA, 2004; Lashley & Boscardin,
2003; NCDPI, 2010; Yell et al., 2006). Arick and Krug (1993) concluded that 70% of special
education directors’ time was devoted to management of the special education program, whereas
special education directors in North Carolina spend more time, 76%, administering its special
education program. Approximately 20% of time is directed to statewide testing and
accountability and preschool services respectively among North Carolina’s special education
administrators, but these programs were not noted by Arick and Krug (1993). It is
understandable that North Carolina’s special education directors spend 20% of their time on
statewide testing as children with disabilities are required to participate, to the same extent as
non-disabled children, in statewide testing and accountability measures, a requirement of the
172
ESEA/NCLB 2001 and IDEA 2004. Interestingly, special education directors in the Arick and
Krug (1993) study devoted 20% of their time to curricula and instruction, while special
education directors in North Carolina devote less time, 13.8%, to academics. Although North
Carolina’s special directors spend a small amount of time on curricula, many receive great
satisfaction when their efforts lead to improved outcomes for students with disabilities, as
evidenced by their open-ended survey responses.
With regard to supervisory responsibilities, 34% of North Carolina’s special education
directors’ time is spent on administrative aspects that accompany management of the district’s
special education program. These include special education reporting requirements, submission
of grants, paperwork, maintenance of special education records, and compliance with special
education laws and regulations. Addressing concerns of parents, staff, administrators, etc.
consumes 15% of directors’ time in the workplace. Curricula and human resources management
occupy 8% of time. Strategic and program planning receive the least amount of attention, 4%.
These findings regarding supervisory duties are similar to Marro and Kohl’s (1972) research as
special education directors in this early national study identified the majority of their work time
was spent on management of the district’s special education program and administrative tasks. It
is noted that the findings of Marro and Kohl’s (1972) research and the qualitative data produced
from this study show that special education directors experience dissatisfaction when their time
is spent on bureaucracy, paperwork, and clerical duties as these are obstacles to interaction with
children, staff, and curricula.
Although little time is spent on strategic/program planning and curricula among North
Carolina’s special education directors, their open-ended survey responses show they derive great
satisfaction when they have opportunities to apply strategic and instructional leadership and
173
improve outcomes for children. These findings mirror Marro and Kohl’s (1972) research as
directors participating in their study identified their preferred duties given ideal working
conditions. Their preferences included the provision of services to children with disabilities,
collaboration and supervision of personnel, and involvement with curricula (Marro & Kohl,
1972). The areas of satisfaction identified by North Carolina’s special education directors’ open-
ended responses include the application of strategic/instructional leadership, collaboration, and
efforts to improve long-term outcomes for children. These areas of satisfaction exemplify the
content theories of Maslow (1943), McClelland (1965), and Alderfer (1969, 1972) as human
behaviors are motivated by a desire to apply knowledge and skills, solve problems, set goals, and
affiliate with others.
Approximately 86% of special education directors state their workload has increased
since acquisition of the position, and an equivalent percentage describe their workload as heavy
or impossible to manage. Factors contributing to increased workload include budget reductions,
realignment of duties among staff, and increased demands from state and local education
agencies, as discussed earlier. Meeting the demands of education agencies and scarcity of
resources are central themes of dissatisfaction among these leaders. Directors express
dissatisfaction regarding the supervision of more than one program in the district. Reductions in
paperwork associated with special education administration and increased personnel would
improve job satisfaction, according to these participants’ open-ended survey responses.
Findings suggest conflicting views among special education directors regarding their
work. Their JSS mean subscale scores for the operations domain was 10.53, a level of
dissatisfaction; convesely, the nature of the work domain was 20.01, revealing satisfaction.
Operations refer to external factors influencing motivation such as policies, regulations,
174
bureaucracy, paperwork, etc., all of which are heavily associated in special education
administration. Nature of the work, an intrinsic motivator, refers to the fulfillment an individual
gains from the application of knowledge and skills, attainment of goals, and the level of purpose
and meaning associated with their job (Alderfer, 1969, 1972; Herzberg et al., 1959; Maslow,
1943; Spector, 2007).
Special education directors also have conflicting attitudes regarding the problem-solving
nature of their job. On one hand, open-ended survey responses of special education directors
(N=78) identify collaboration and problem solving with IEP Teams, personnel, parents, and
principals as satisfying aspects of their job. This satisfaction is supported by special education
directors’ (N=86) JSS mean subscale score in the domain of relationships with co-workers,
19.22, indicating a level of satisfaction. Conversely, special education directors open-ended
responses (N=74) regarding areas of dissatisfaction with their work include addressing conflict
among parents, IEP Teams, and personnel. Quantitative data from the survey determined that
these leaders spend approximately 15% of their time in the workplace dealing with conflict
management. Through these conflicting statements, it appears that special education directors
have a love-hate relationship with their job.
What is the Level of Job Satisfaction among Special Education Directors?
Job Ambivalence and Dissatisfaction Exposed
Findings of the Job Satisfaction Survey (Spector, 1994) administered to participants of
this study suggest that 60% of special education directors have ambivalence or dissatisfaction
toward their job. Collectively, this population of special education directors presents a mean JSS
score of 135.58 (Spector, 1994, 2007), indicating ambivalence toward their job. The mean job
satisfaction score of North Carolina’s special education directors, 135.58, mirrors the JSS
175
normative mean score of the elementary and secondary education population (K-12 teachers and
administrators), 135, a level of ambivalence (Spector, 2007). Only 40% express satisfaction with
their position. Findings from analysis of the mean JSS subscale scores for these special
education directors expose job dissatisfaction in the JSS domains of salary (9.66) and operational
conditions (10.53). Ambivalence exists in the JSS domains of promotion opportunities (13.05),
contingent rewards (13.26), and employee benefits (14.13). These areas of dissatisfaction are
considered extrinsic motivators and dissatisfying factors which influence behavior (Herzberg et
al., 1959). Job satisfaction is noted in their mean JSS subscale scores with regard to nature of the
work (20.01), autonomy in the workplace (19.13), relationships with co-workers (19.22), and
communication within the organization (16.54). These intrinsic motivators, or satisfiers,
influence performance as individuals who associate purpose and meaning to their work tend to
have greater satisfaction (Alderfer, 1969, 1972; Herzberg et al., 1959; McClelland, 1965, 1988).
Statistical analysis using the t-test (two sample of unequal variance) did not identify any
statistically significant difference among the JSS mean subscale scores of special education
directors and the JSS normative mean subscale scores of the elementary and secondary education
population (K-12 teachers and administrators). Conversely, logistic regression identifies
statistically significant correlation among each facet of the workplace, as measured by the JSS
(Spector, 2007), and the overall job satisfaction of these special education directors. While all of
these workplace facets are significant factors of influence among this population of special
education directors, the facets of contingent rewards, communication, and autonomy in the
workplace hold the strongest correlation with regard to their overall level of satisfaction.
With regard to gender, findings suggest that male special education directors have a
higher level of job satisfaction, 140.43, than females, 134.47; however, both are within the range
176
of ambivalence. Although this gap exists in job satisfaction among male and female special
education directors participating in this study, research regarding gender and job satisfaction
produced divergent conclusions (Blood et al., 2002; Eckman, 2000; Heyd, 2010; Jayartne &
Chess, 1986; Newbury, 2000; Peter-Schinsky, 2002). Discrepancies may be due to workplace
facets such as whether men and women have similar opportunities for promotion, autonomy in
the workplace, and positive relationships with co-workers and supervisors (Berch, 1982;
Featherman & Hauser, 1976; Kreps, 1971; Wolf & Fligstein, 1972). Another consideration is
that females and males may value workplace facets differently which may account for some of
the variance among gender and job satisfaction (Kanter, 1977). Crosby (1982) presented an
adaptation to Adams’ (1965) equity theory by suggesting that employees make gender-specific
equity evaluations in the workplace. In other words, females compared their treatment in the
workplace to other females in similar roles; males compared themselves to other males.
Furthermore, behavioral and social expectations in the workplace may play a role as one’s
supervisor may expect males to be assertive and females to be docile (Glen & Feldberg, 1977;
Hodson, 1989).
Special education directors approaching the midpoint of their career with 11-15 years of
general experience in public education hold a JSS score of 146.2, indicating satisfaction. All
other ranges regarding years of experience in public education yield scores in the ambivalence
range. With regard to years of experience in special education administration, individuals with
26 to 30 years of experience in this supervisory role attained a JSS score of 150, denoting
satisfaction, while all other ranges were ambivalence. Special education directors with an
advanced degree have a higher level of job satisfaction than those with a master’s or doctoral
degree; however, all are within the range of ambivalence.
177
Findings expose a 20-point difference in the job satisfaction scores of special education
directors with prior experience as a principal and those who have no experience in school
leadership. Special education directors with prior experience as a principal scored 152.06 on the
JSS (Spector, 1994), indicating satisfaction. Special education directors who lack experience as
a principal scored 132.45 on the JSS (Spector, 1994), a level of ambivalence.
This higher level of job satisfaction among special education directors with principal
experience may be attributed to several factors. The North Carolina Standards for School
Executives (North Carolina State Board of Education, 2006) presents a thorough description of
the dispositions required of today’s school principals. Principals are expected to collaborate and
supervise personnel and students, interact with curricula, monitor the school’s progress toward
goals, and problem solve with stakeholders (NCSBOE, 2006). Through these daily practices,
principals have frequent opportunities to develop and hone executive leadership skills. These
standards further describe expectations that principals must embrace with regard to human
resources and fiscal management practices as they must hire highly qualified staff, provide
employees with feedback, conduct evaluations, and resolve conflicts (NCSBOE, 2006).
Principals must also craft the school’s strategic plan and budget, work with stakeholders to
identify strengths and needs, set priorities, and align resources, according to these executive
leadership dispositions (NCBOE, 2006). Principals typically serve as the local education agency
(LEA) representative of IEP teams and devote much time to problem solving and collaborating
with parents and personnel to implement special education services to children with disabilities.
Special education directors who lack these administrative leadership experiences are likely to
struggle with the management and supervision of the district’s special education program and its
personnel until they develop these executive leadership dispositions accordingly.
178
While individuals who work in the field of special education administration typically
associate purpose and meaning with their work, a tone of dissatisfaction exists among this
population of special education directors regarding their workload and job duties. Both
quantitative and qualitative data of this study converge to support this conclusion. Factors
contributing to their dissatisfaction include expansive state and federal regulations that
accompany management of the district’s special education program, supervision of several
district programs, scarcity of human and fiscal resources as a result of continued budget
reductions in recent years, and conflict among internal and external stakeholders.
What Relationships Exist Among Variables and Job Satisfaction?
Combined Variables Influence Job Satisfaction
As shown in Table 12, logistic regression did not produce findings of significance among
a single independent variable and the overall job satisfaction among special education directors.
These findings may be attributed to the fact that job satisfaction is multi-faceted and workplace
facets may be inter-correlated, such as salary and opportunities for promotion (Smith, Kendall, &
Hulin, 1969; Kinicki, McKee-Ryan, Schriesheim, & Carson, 2002; Saiyadain, 2003; Wanous &
Lawler, 1972). Conversely, multiple regression analysis produced compelling findings.
Multiple regressions identified a correlation among a combination three particular independent
variables – salary, highest education level, and experience as a principal, and the overall job
satisfaction of special education administrators. It appears that these three independent variables
work in tandem to influence their job satisfaction.
The researcher speculates as to why these variables, when combined, influence the job
satisfaction of special education administrators who participated in this study. First of all, wages
are necessary to fulfill primary human needs such as food, shelter, and clothing (Alderfer, 1969,
179
1972; Maslow, 1943). Although income is a necessity to fulfill primary needs, workers typically
view salary as a dissatisfying factor because employees have little control over the salaries an
employer sets for its workforce (Herzberg et al., 1959). In addition, individuals expect to be
compensated for work they perform and typically make comparisons of their treatment in the
workplace to individuals in similar roles (Adams, 1963; Vroom, 1964). Findings of this study
show that these special education directors associate value to their salaries and desire a
commensurate wage for the work they perform.
Why is education a contributing variable of job satisfaction? Education is referred to as
human capital as it is a commodity of which nations depend for its wealth, prosperity, economic
success, and longevity (Brimley, Verstegen, & Garfield, 2012). According to Brimley et al.
(2012), educated workers exhibit greater productivity in the workplace and are more likely to
continue their education as they desire to acquire new knowledge and skills. Findings of this
study suggest that special education directors place value on their own personal education. Of
this group, 100% have a master’s degree. In addition, an advanced degree is held by 28% and
17% a doctoral degree. Their intrinsic desire to achieve a high level of education aligns to the
needs theories of Maslow (1943), McClelland (1965, 1988), and Alderfer’s (1969, 1972) ERG
theory as humans have a need for self-actualization in order to reach their highest potential.
As described earlier, special education directors with prior experience as a school
principal yield a much higher level of job satisfaction on the JSS (Spector, 1994) than those
special education directors who have no experience in school leadership. The researcher
attributes these higher job satisfaction scores to the unique nature of the principalship as it is a
comprehensive leadership role as described by the North Carolina Standards for School
Executives (NCSBOE, 2006). Principals apply executive leadership disposition every moment

180
of the school day as they make countless decisions that impact teaching and learning. These
leaders are expected to manage, influence, and guide the school’s education program to ensure
that all students succeed academically. These standards point to principals serving as change
agents when the school’s performance data indicate a new path is warranted in order to meet
identified goals (NCSBOE, 2006). Principals are held to very high performance standards by
their superintendent and the community as they are ultimately responsible for the academic
success of all students enrolled in their respective school.
It is understandable that the independent variables of salary, highest level of education,
and prior school administrative experience, when combined, correlate to the overall job
satisfaction of special education directors. State and local education agencies must take note of
this significant finding as it illuminates characteristics of a special education director who will be
most satisfied in this supervisory role.
Recommendations
Based on the findings of this study, several recommendations are presented to state and
local education agencies for consideration in order to improve the workload and job satisfaction
of North Carolina’s special education directors. In addition, recommendations regarding future
research are included:
1) The most important findings of this study speak directly to local education agency leaders
and their responsibility to recruit, hire, and retain the best qualified individual for the role
of special education director. The data present a profile of a highly satisfied employee in
this critical role as one who brings executive leadership experience to the position and is
prepared through higher levels of training and education commensurate with the
challenges such leaders will likely face. Therefore, it is of utmost importance to stress in
181
the stages of position recruitment to seek those candidates which best suit a model of
academic achievement and successful prior leadership experience. Conversely, failure to
do so may create an atmosphere of frustration and limited success, potentially placing the
local education agency in a position of vulnerability. Additionally, ensuring a successful
recruitment outcome necessitates that superintendents and school board members are
committed to applying adequate resources to bring in the right candidate for this
supervisory position. The degree of resource commitment and investment, to include
salary and benefit packages, will very likely determine the quality of the candidate hired
and potentially affect attrition rates in these positions across the state.
2) Local education agencies should exhaust efforts to hire individuals who possess the
required credentials for the special education director position and ensure that the
individual desires this supervisory role. Findings of this study identified almost 20% of
special education directors in North Carolina lack the requisite licensure for the position,
and one-third were current employees of the district who did not solicit supervision of the
special education program. As discussed previously, districts will likely become
vulnerable if the special education director lacks the requisite skills to lead and manage
the district’s special education program and its personnel.
3) Local education agencies should take measures to reduce the number of programs
assigned to the district’s special education director for supervision as findings of this
study show that this practice creates an unmanageable workload, leading to
dissatisfaction.
182
4) Annually, education agencies should examine the workload and work design of its central
office supervisors and make adjustments. By revisiting workload and work design
annually, this practice will ensure that workload is distributed equitably among all staff.
5) The local education agency should consider funding of additional positions (such as
assistant special education director) to assist the special education director with
management and supervision of the district’s special education program when an
unmanageable or extreme workload is identified.
6) The state education agency should conduct a salary study of central office supervisory
positions in order to accurately identify the wages assigned by the local education agency
to various leadership roles (director, supervisor, coordinator, assistant superintendent,
etc). Information collected through this study will identify the actual wages assigned to
these leadership positions and whether any local supplemental pay is received.
7) The state education agency should re-examine its special education policies, IEP forms,
paperwork/reporting requirements, and make adjustments to each accordingly to reduce
paperwork demands that tax special education directors.
8) While the NCDPI Exceptional Children Division provides an induction program for
special education directors with fewer than two years of experience in the role, there is no
advanced leadership program to support seasoned special education directors. The state
education agency should institute a targeted program for experienced directors to support
them with the challenges they face in the workplace and stress associated with the job.
9) Further research should be conducted on the workload of central office supervisors
employed by local education agencies in order to identify their working conditions. It is
183
unknown if the working conditions of other school district-level supervisory positions are
similar to that of special education directors.
10) Further research is warranted regarding attrition of special education directors to identify
the reasons they vacate this supervisory role after a short period of time.
Conclusion
This mixed methods research design investigated employee characteristics, workload,
and the overall job satisfaction of special education directors employed by local education
agencies in North Carolina (N=115). A review of literature identified few studies on the role of
special education directors; therefore, this study contributes to this knowledge base and sheds
light on this complex leadership role. Findings identify an immense workload among North
Carolina’s special education directors, an environment filled with prolonged work hours,
expansive bureaucracy, excessive paperwork, and much conflict. While these leaders derive
satisfaction when they have opportunities to practice strategic and instructional leadership,
collaborate, and put forth efforts to improve outcomes for children with disabilities, this group as
a whole reports ambivalence toward their job. Findings reveal that almost 10% have no intent to
remain in the position, and 50% have less than a five-year commitment to the role. Findings of
this study support earlier studies in that the field of special education administration is inundated
with vast turnover. Attrition is likely to continue unless state and local education agencies take
measures to improve the working conditions of special education directors.
184
References
Adams, J.S. (1963). Toward an understanding of inequity. Journal of Abnormal and Social
Psychology, 67, 422-436. doi:10.1037/h0040968
Adams, J.S. (1965). Inequity in social exchange. In L. Berkowitz (Ed.), Advances in
experimental social psychology Vol. II (pp. 267-299). New York, NY: Academic Press.
Alderfer, C.P. (1969). An empirical test of a new theory of human needs. Organizational
Behaviors and Human Performance, 4(2), 142-175.
Alderfer, C.P. (1972). Existence, relatedness, and growth: Human needs in organizational
settings. New York, NY: Free Press.
Alderfer, C.P., & Smith, K.K. (1982). Studying intergroup relations embedded in organizations.
Administrative Science Quarterly, 27(1), 35-65.
Allen, N.J., & Meyer, J.P. (1990). The measurement and antecedents of affective, continuance,
and normative commitment to the organization. Journal of Organizational Psychology,
63(1), 1-18. doi: 10.1111/j.2044-8325.1990.tb00506.x
American Association of School Administrators. (2012). Weathering the storm: How the
economic recession continues to impact school districts. Retrieved from
https://www.aasa.org/uploadedFiles/Policy_and_Advocacy/files/Weathering_the_Storm_
Mar_2012_FINAL.pdf
Apling, R.N., & Jones, N.L. (2005). CRS Report for Congress Individuals with Disabilities
Education Act (IDEA): Analysis of changes made by P.L. 108-446. Washington, DC:
Congressional Research Service.
Americans with Disabilities Act of 1990, 42 U.S. C. §12101-12213 et. seq.
185
Arick, J.R., & Krug, D.A. (1993). Special education administrators in the United States:
Perceptions on policy and personnel issues. The Journal of Special Education, 27(3),
348-364.
Ashe, D., & Bowman, C. (1989). Readings in strategic management. Basingstoke, UK:
Macmillan.
Aud, S., Hussar, W., Johnson, F., Kena, G., Roth, E., Manning, E., Wang, X., & Zhang, J.
(2012). The Condition of Education 2012 (NCES 2012-045). U.S. Department of
Education, National Center for Education Statistics. Washington, DC. Retrieved from
http://nces.ed.gov/pubs2012/2012045.pdf
Ayer, F.C., & Barr, A.S. (1928). The organization of supervision. New York, NY: Appleton.
Baker, H.J. (1944). Administration of special education. Review of Educational Research, 14(3),
209-216. doi: 10.3102/00346543014003209
Bateman, T.S., & Strasser, S. (1984). A longitudinal analysis of antecedents of organizational
commitment. Academy of Management Journal, 27(1), 95-112. doi: 10.2307/255959
Beattie v. Board of Education, 172 N.W. 153 (Wis. 1919).
Begley, D.M. (1982). An evaluation of intellectual and emotional depletion (“burnout’) among
special education administrators. Carbondale, IL: University of Southern Illinois.
Berch, B. (1982). The endless day: The political economy of women and work. New York, NY:
Harcourt Brace Jovanovich.
Berman, E.M., & West, J.P. (1998). Productivity enhancement efforts in public and nonprofit
organizations. Public Productivity and Management Review, 22(2), 207-219.
Berry, C.S., Derrick, C., McCord, C.P., Wilkes, L.A., & Doll, E.A. (1929). A survey and
program for special types of education. Trenton, New Jersey: Board of Education.
186
Berry, F.S., & Wechsler, B. (1995). State agencies’ experience with strategic planning: Findings
from a national survey. Public Administration Review, 55(2), 159-168.
Betts, Dickey. (1972). Blue skies. [Recorded by the Allman Brothers Band]. On Eat a Peach
[vinyl]. Miami, FL: Capricorn.
Billingsley, B. (2004). Special education teacher retention and attrition: Critical analysis of the
research literature. Journal of Special Education, 38(1), 39-55. doi:
10.1177/00224669040380010401
Billingsley, B., Gersten, R., Gillman, J., & Morvant, M. (1995). Working conditions:
Administrator support. National Dissemination Forum on Issues, Special Education
Teacher Satisfaction, Retention, and Attrition. Washington, DC.
Blood, G.W., Ridenour, J.S., Thomas, E.A., Qualls, C.D., & Hammer, C.S. (2002). Predicting
job satisfaction among speech-language pathologists in public schools. Language,
Speech, and Hearing Services in Schools, 33(4), 282-290.
Blum, M.L. (1956). Industrial psychology and first social foundations. New York, NY: Harper..
Board of Education of Cleveland Heights v. State ex rel. Goldman, 47 Ohio App. 417 (Ohio Ct.
App. 1934)
Boe, E.E. (2006). Long-term trends in the national demand, supply, and shortage of special
education teachers. Journal of Special Education, 40(3), 138-150.
Boe, E.E., & Cook, L.H. (2006). The chronic and increasing shortage of fully certified teachers
in special and general education. Exceptional Children, 72(4), 443-460.
Bolino, M.C., & Turnley, W.H. (2008). Old faces, new places: Equity theory in cross-cultural
contexts. Journal of Organizational Behavior, 29, 29-50. doi: 10.1002/job.454
187
Boscardin, M.L. (2007). What is special about special education administration? Considerations
for school leadership. Exceptionality, 15(3), 189-200.
Boscardin, M.L., McCarthy, E., & Delgado, R. (2009). An integrated research-based approach to
creating standards for special education leadership. Journal of Special Education
Leadership, 22(2), 68-84.
Boscardin, M.L., Weir, K., & Kusek, C. (2010). A national study of state credentialing
requirements for administrators of special education. Journal of Special Education
Leadership, 23(2), 61-75.
Brennan, J.J. (1980). An analysis of the role, area of competence, and in-service needs of special
education administrators as perceived by special education administrators and their
immediate supervisors in eighteen north central association states. (Doctoral
dissertation). University of Nebraska- Lincoln. Publication AAT8021336
Brimley, V., Verstegen, D.A., & Garfield, R.R. (2012). Financing education in a climate of
change. Upper Saddle River, NJ: Pearson Education, Inc.
Brown, K., & Mitchell, T. (1993). Organizational obstacles: Links with financial performance,
customer satisfaction, and job satisfaction in a service environment. Human Relations,
46(6), 725-727. doi: 10.1177/001872679304600603
Brown v. Board of Education of Topeka, Kansas. 347 U.S. 483 (1954).
Buchanan, D.A., & Bryman, A. (Eds.). (2009). The Sage handbook of organizational research
methods. Thousand Oaks, CA: Sage Publications, Inc.
Bullock (1952). Social factors related to job satisfaction. Columbus, OH: Ohio State University.
Bureau of National Affairs. (1964). The Civil Rights Act of 1964: text analysis legislative history.
Washington, DC: Bureau of National Affairs, Inc.
188
Burrello, L.C., & Sage, D.D. (1979). Leadership and change in special education. Englewood
Cliffs, NJ: Prentice Hall.
Butts, M.M., Vandenberg, R.J., DeJoy, D.M., Schaffer, B.S., & Wilson, M.G. (2009). Individual
reactions to high involvement work practices: Investigating the role of empowerment and
perceived organizational support. Journal of Occupational Health Psychology, 14(2),
122-136. doi: 10.1037/a0014114
Carter, S.J. (2011). Burnout among special education administrators: A preliminary study.
Journal of Special Education Leadership, 24(2), 104-110.
Chang, C.C., Chiu, C.M., & Chen, C.A. (2010). The effect of TQM practices on employee
satisfaction and loyalty in government. Total Quality Management, 21(12), 1299-1314.
Child Welfare League of America. (n.d.). The history of White House conferences on children
and youth. Retrieved from http://www.cwla.org/advocacy/whitehouseconfhistory.pdf
Choo, S. & Bowley, C. (2007). Using training and development to affect job satisfaction with
franchising. Journal of Small Business and Enterprise Development, 14(2), 339-352.
Civil Rights Act of 1964, PL 88-352, 78 Stat 241
Cobitz, C. (2013). February 4. [Class 1, 2, 3, and 4 PowerPoint slides]. Retrieved from
http://www.cobitz.com/wu7061s13/
Colbert, J., & Wolff, D. (1992). Surviving in urban schools. Journal of Teacher Education,
43(3), 193-199. doi: 10.1177/0022487192043003005
Coldwell, D.A., & Perumal, S. (2007). Perceptions of the measurability, importance, and effects
of work equity in job motivation: An exploratory study of the utility of the equity theory.
Alternation, 14(1), 197-217.
189
Connor, L.E. (1961). Administration of special education programs. New York, NY: Teachers
College, Columbia University.
Consortium for Appropriate Dispute Resolution in Special Education. (2012). Six year state and
national summaries of dispute resolution. Retrieved from
http://www.directionservice.org/cadre/pdf/National%20Part%20B%20Tables%2004-
05%20thru%2009-10%20Summary%2021March%202012.pdf
Cook, C., Heath, H., & Thompson, R.L. (2000). A meta-analysis of response rates in web- or
internet-based surveys. Educational and Psychological Measurement, 60(6), 821-836.
doi: 10.1177/00131640021970934
Cook, J.D., Hepworth, S.J., Wall, T.D., & Warr, P.B. (1981). The experience of work. New
York, NY: Academic Press.
Cook, J.L., & Cook. G. (2006). Child development: Principles and perspectives. Boston, MA:
Allyn and Bacon.
Cook, S. (1994). The cultural implications of empowerment. Empowerment in Organizations,
4(2), 29-39.
Cook, W.J. (2000). Strategics: The art and science of holistic strategy. Westport, CT: Quorum
Books.
Cosier, R.A., & Dalton, D.R. (1983). Equity theory and time: A reformulation. Academy of
Management Review, 8(2), 311-319. doi: 10.5465/AMR.1983.4284741
Council for Exceptional Children. (1966). Professional standards for personnel in the education
of exceptional children. Washington, DC: Council of Exceptional Children.
Council for Exceptional Children. (2003). No Child Left Behind Act of 2001: Implications for
special education policy and practice. Retrieved from
190
http://www.cec.sped.org/Content/NavigationMenu/PolicyAdvocacy/CECPolicyResource
s/NCLBside-by-side.pdf
Council for Exceptional Children. (2005). Academic subject matter content of the general
curriculum and special educators. Retrieved from
http://www.cec.sped.org/AM/Template.cfm?Section=Highly_Qualified_Teachers&templ
ate=/CM/ContentDisplay.cfm&ContentID=3995
Council for Exceptional Children. (2005). Highly qualified special education teacher
requirements: Frequently asked questions. Retrieved from
http://www.cec.sped.org/AM/Template.cfm?Section=Highly_Qualified_Teachers&Conte
ntID=1804&template=/CM/ContentDisplay.cfm
Council for Exceptional Children. (2009). What every special educator must know: Ethics,
standards, and guidelines (6th
ed.). Arlington, VA: Council for Exceptional Children.
Creighton, T.B. (2007). Schools and data: The educators guide for using data to improve
decision making. (2nd
ed). Thousand Oaks, CA: Sage Publications, Inc.
Creswell, J.W. (2008). Research design: qualitative, quantitative, and mixed methods
approaches (3rd
ed.). Thousand Oaks, CA: Sage Publications, Inc.
Creswell, J.W. (2011). Educational research: Planning, conducting, and evaluating quantitative
and qualitative research (4th
ed.). Upper Saddle River, NJ: Pearson Education, Inc.
Crockett, J.B. (2007). The changing landscape of special education administration.
Exceptionality, 15(3), 139-142.
Crosby, F. (1983). Relative deprivation and working women. New York, NY: Oxford.
Cross, C. (2005). The evolving role of the federal government in education. Retrieved from
www.pearsonassessments.com/hai/images/NES_Publications/2005_02Cross_513_1.pdf
191
Daley, D. M. (1986). Humanistic management and organization success: The effect of job and
work environment characteristics on organizational effectiveness, public responsiveness,
and job satisfaction. Public Personnel Management, 15(2), 131-142.
Daniels, K., & Bailey, A. (1999). Strategy development processes and participation in decision
making: Predictors of role stressors and job satisfaction. Journal of Applied Management
Studies, 8(1), 27-42.
Daugherty, R. F. (2001). Special education: A summary of legal requirements, terms, and trends.
Westport, CT: Greenwood Publishing Group, Inc.
Demato, S.D. (2000). Job satisfaction among elementary school counselors in Virginia. Ph.D.
dissertation. University of Virginia.
Deno, S.L. (2003). Developments in curriculum-based measurement. The Journal of Special
Education, 37(3), 184-192.
Department of Public Welfare v. Haas, 154 N.E. 2nd
265 (Ill. 1958)
DeSantis, V.S., & Durst, S.L. (1996). Comparing job satisfaction among public and private
sector employees. American Review of Public Administration, 26(3), 327-339. doi:
10.1177/027507409602600305
Development Dimensions International. (2011). New performance management processes create
a high performance culture. Retrieved from
http://www.ddiworld.com/DDIWorld/media/clientresults/Maximizing_Performance_rr_d
di.pdf
Dillman, R. (1978). Mail and telephone surveys: Total design method. New York, NY: John
Wiley and Sons.
192
DiPierro, M.L. (2003). The special education administrator: Job satisfaction, workload, and
turnover. Retrieved from Proquest Digital Dissertations. (ID 288270425)
Doll, E.A. (1932). Special education as a department of school administration. The Journal of
Educational Research, 26(4), 241-248.
Duffy, F.M. (2004). Moving upward together. Lanham. MD: Scarecrow Education.
DuFour, R., DuFour, R., Eaker, R., & Many, T. (2006). Learning by doing: A handbook for
professional learning communities at work. Bloomington, IN: Solution Tree.
Eckman, E.W. (2004). Similarities and differences in role conflict, role commitment, and job
satisfaction for female and male high school principals. Educational Administration
Quarterly, 40(3), 366-387. doi: 10.1177/0013161X03257835
Edmondson, S. (2001). Burnout among special education administrators. Paper presented at the
Annual Conference of the American Association of School Administrators Annual
Conference, Orlando, FL. Retrieved from www.eric.ed.gov
Education for All Handicapped Children Act of 1975, 20 U.S.C. §1401 et seq.
Elementary and Secondary Education Act of 1965, 20 U.S.C. § 6301 et seq.
Embich, J.L. (2001). The relationship of secondary special education teachers’ roles and factors
that lead to professional burnout. Teacher Education and Special Education, 24(1), 58-
69. doi: 10.1177/088840640102400109
Emmert, M.A., & Taher, W.A. (1992). Public sector professionals: The effects of public sector
jobs on motivation, job satisfaction, and work involvement. American Review of Public
Administration, 22(1), 37-48. doi: 10.1177/027507409202200103
Engle, D.M. (1991). Law, culture, and children with disabilities: Educational rights and the
construction of difference. Duke Law Journal, 40(1), 166-205.
193
Erstad, M. (1997). Empowerment and organizational change. International Journal of
Contemporary Hospitality Management, 9(7), 325-333. doi:
10.1108/09596119710190976
Espeland, K.E. (2006). Overcoming burnout: How to revitalize your career. The Journal of
Continuing Education for Nursing, 37(4), 178-184.
Esteves, K. J., & Rao, S. (2008). The evolution of special education. Principal, Retrieved from
http://www.naesp.org/resources/1/Principal/2008/N-Oweb2.pdf
Featherman, D.L., & Hausner, R.M. (1976). Sexual inequalities and socioeconomic achievement
in the U.S. 1962 – 1973. American Sociological Review, 41, 462-483.
Finkenbinder, R.L. (1981). Special education administration and supervision: The state of the art.
Journal of Special Education, 15(4), 485-495. doi: 10.1177/002246698101500409
Forgnone, D., & Collings, G.D. (1975). State certification-endorsement in special education
administration. The Journal of Special Education, 9(1), 5-9.
Fowler, F.J. (1984). Survey research methods. Beverly Hills, CA: Sage Publications.
Gall, M.D., Gall, J.P., & Borg, W. R. (2003). Educational research: An introduction (7th
ed.).
Boston, MA: Pearson Education, Inc.
Galloway, D., Boswell, K., Panckhurst, F., Boswell, C., & Green, K. (1985). Sources of
satisfaction and dissatisfaction for New Zealand primary school teachers. Education
Research, 27, 44-51.
Gargiuolo, R., & Kilgo, J.L. (2011). An introduction to young children with special needs birth
to age eight (3rd
ed). Belmont, CA: Wadsworth/Cengage Learning.
194
Gersten, R., Gillman, J., Morvant, M., & Billingsley, B. (1995). Working conditions: Job design.
Paper presented at the National Dissemination Forum, Special Education Teacher
Satisfaction, Retention, and Attrition. Washington, DC.
Gersten, R., Keating, T., Yovanoff, P., & Harniss, M. (2001). Working in special education:
Factors that enhance special educators’ intent to stay. Exceptional Children, 67(4), 549-
567.
Gillung, T.B., Spears, J., Campbell, P., & Rucker, C.N. (1992). Competencies for administrators
of special education. Journal of Personnel Evaluation in Education, 6(1), 71-90.
Glenn, E.N., & Feldberg, R.L. (1977). Degraded and deskilled: The proletarianization of clerical
work. Social Problems, 25(1), 52-64.
Glenn, N.D., Taylor, P.A., & Weaver, C.N. (1977). Age and job satisfaction among males and
females: A multivariate, multisurvey study. Journal of Applied Psychology, 62, 189-193.
Godshall, B.M. (2004). Understanding the factors that influence the job satisfaction of special
education administrators in New York State. Retrieved from Proquest Digital
Dissertations. (ID 305078059)
Gonzalez, P., & Carlson, E. (2001). Preliminary results from the study of personnel needs in
special education (SPeNSE). Paper presented to the Ninth Annual CSPD Conference,
Washington, DC.
Gorn, S. (1997). What do I do when: the answer book on individual education programs.
Horsham, PA: LRP Publications, Inc.
Gregersen, H.B., & Black, J.S. (1990). A multifaceted approach to expatriate retention in
international assignments. Group and Organizational Studies, 15(4), 461-485.
195
Hackman, J.R., & Oldham, G.R. (1976). Motivation through the design of work: Test of a
theory. Organizational Behavior and Human Performance, 16, 250-279. doi:
10.1016/0030-5073(76)90016-7
Harrison, C.R., Killion, J.P., & Mitchell, J. (1989). Site based management: The realities of
implementation. Educational Leadership, 46(8), 55-58.
Hart, S.G., & Staveland, L.E. (1988). Development of NASA task load index: Results of
empirical and theoretical research. In P.A. Hancock & N. Meshkati (Eds.), Human
Mental Workload (140-184). New York, NY: Elsevier Science Publishing Co.
Helander, M.G., Landauer, T.K., & Prabhu, P.V. (1997). Handbook of human-computer
interaction. Amsterdam, Netherlands: Elsevier Science B.V.
Herzberg, F., Mausner, B., & Snyderman, B.B. (1959). The motivation to work. New York, NY:
John Wiley and Sons, Inc.
Heyd, S.D. (2010). Job satisfaction among Minnesota high school principals. Ph.D. Dissertation.
The University of North Dakota. Accession Number: ED 529749
Higher Education Consortium for Special Education. (2010). Shortage of special education
expertise among teachers and higher education faculty. Retrieved from
http://hecse.net/policy_documents/FactSheetSPED%20Shortages.pdf
Hodson, R. (1989). Gender differences in job satisfaction: Why aren’t women more dissatisfied?
The Sociological Quarterly, 30(3), 385-399.
Hopkins, A. (1983). Work and job satisfaction in the public sector. Totowa, NJ: Roman and
Allanheld.
Hoppock, R. (1935). Job satisfaction. New York, NY: Harper Publishing.
196
Houpt, J.J. (2009). Job satisfaction/dissatisfaction of nonpublic school administrators. Retrieved
from Proquest Digital Dissertations. (ID 305085418)
Individuals with Disabilities Education Act of 1990, 20 U.S.C. § 1400 et seq.
Individuals with Disabilities Education Act Amendments of 1997, 20 U.S.C. § 1400 et seq.
Individuals with Disabilities Education Improvement Act of 2004, 20 U.S.C. § 1400 et seq.
Jayartne, S., & Chess, W.A. (1986). Job satisfaction: A comparison of case workers and
administrators. Social Work, 31, 144-146.
Johnson, R. B., & Onwuegbuzie, A.J. (2004). Mixed methods research: A research paradigm
whose time has come. Educational Researcher, 33(7), 14-26.
Jones, P.R., & Wilkerson, W.R. (1975). Preparing special education administrators. Theory into
Practice, 14(2),105-109.
Kanter, R.M. (1977). Men and women of the corporation. New York, NY: Basic.
Katsiyannis, A., Yell, M.L., & Bradley, R. (2001). Reflections on the 25th
anniversary of the
Individuals with Disabilities Education Act. Remedial and Special Education, 22(6), 324-
334.
Katsiyannis, A., Zhang, D., & Conroy, M. (2003). Availability of special education teachers:
Trends and issues. Remedial and Special Education, 24(4), 246-253.
Kaufhold, J., Alvarez, V.G., & Arnold, M. (2006). Lack of supplies, materials, and resources as
an elementary cause of frustration and burnout of South Texas special education teachers.
Journal of Instructional Psychology, 33(3), 159-161.
Kern, W.H., & Mayer, J.F. (1971). Certification of directors in special education programs: The
result of a national survey, Contemporary Education, 42(1), 126-128.
197
Kim, S. (2002). Participative management and job satisfaction: Lessons for management
leadership. Public Administration Review, 62(2), 231-241.
http://www.jstor.org/stable/3109906
Kinicki, A.J., McKee-Ryan, F., & Schriesheim, C.A., & Carson, K.P. (2002). Assessing the
construct validity of the Job Descriptive Index: review and meta-analysis. Journal of
Applied Psychology, 87(1), 14-32. doi:10.1037/0021-9010.87.1.14
Kirk, S., Gallagher, J., Coleman, M., & Anastasiow, N. (2012). Educating exceptional children.
Belmont, CA: Wadsworth/Cengage Learning.
Kish, L. (1979). Sample and censuses. International Statistical Review, 47(2), 99-109.
Kreps, J. (1971). Sex in the marketplace: America’s women at work. Baltimore, MD: Johns
Hopkins Press.
Lashley, C., & Boscardin, M.L. (2003). Special education administration at a crossroads:
Availability, licensure, and preparation of special education administrators. (COPSSE
Document No. IB-8). Florida: University of Florida. Center on Personnel Studies in
Special Education.
Lashley, C.L., & Boscardin, M. (2003). Special education administration at a crossroad. Journal
of Special Education Leadership, 16, 63-75.
Lawler, E.E. (1996). From the ground up: Six principles for building the new logic corporation.
San Francisco, CA: Jossey-Bass.
Lawler, E.E., Ledford, G.E., & Mohrman, S. (1989). Employee involvement in America: A study
of contemporary practice. Houston, TX: American Productivity Center.
Lee, C.H., & Bruvold, N.T. (2003). Creating value for employees: Investment in employee
development. International Journal of Human Resource Management, 14(6), 981-1000.
198
doi: 10.1080/0958519032000106173
Lloyd, G.C. (1996). Fostering an environment of employee contribution to increase commitment
and motivation. Empowerment in Organizations, 4(1), 25-28. doi:
10.1080/0958519032000106173
Locke, E.A. (1969). What is job satisfaction? Organizational Behavior and Human
Performance, 4(4), 309-336.
Locke, E.A. (1976). The nature and causes of job satisfaction. In M.D. Dunnette (Ed.).
Handbook of Industrial and Organizational Psychology (pp. 1499-1500). Chicago, IL:
Rand McNally.
London, M., Larsen, H.H., & Thisted, L.N. (1999). Relationships between feedback and self-
development. Group and Organization Management, 24(1), 5-27.
doi:10.1177/1059601199241002
Lortie, D.C. (1975). School teacher. Chicago, IL: University of Chicago Press.
Lunenberg, F.C. (2011). Expectancy theory of motivation: Motivating by altering expectations.
International Journal of Management, Business, and Administration, 15(1), 1-6.
Mackie, R.P., & Engel, A.M. (1955). Directors and supervisors of special education in local
school systems (Bulletin No. 13, U.S. Office of Education). Washington, DC: U.S.
Government Printing Office.
Malinowski, R.J. (1999). A study of job satisfaction among urban superintendents in New
Jersey. (Published dissertation). Seton Hall University, South Orange, NJ.
Markos, S., & Sridevi, M.S. (2010). Employee engagement: The key to improving performance.
International Journal of Business and Management, 5(12), 89-96.
199
Marro, T.D., & Kohl, J.W. (1972). Normative study of the administrative position in special
education. Exceptional Children, 39(1), 5-13.
Marshman, L.R. (1965). Job description for director of special education. Jefferson Township
School District. (Unpublished paper). University of Texas, Austin.
Martens, E.H. (1946). State legislation for the education of exceptional children – some basic
principles. Exceptional Children, 12, 225-230.
Martens, E.H., & Foster, E.M. (1942). Statistics of Special schools and classes for exceptional
children: Biennial Survey of Education, 1938-1940. Vol. II. Federal Security Agency,
U.S. Office of Education, Washington, DC: Government Printing Office.
Martin, E.W., Martin, R., & Terman, D. L. (1996). The legislative and litigation history of
special education. The Future of Children, 6(1), 25-39.
http://www.jstor.org/stable/1602492
Maslach, C., Jackson, S.E., & Leiter, M.P. (1996). MBI: The Maslach Burnout Inventory Manual
(3rd
ed.). Palo Alto, CA: Consulting Psychologists Press.
Maslach, C., Schaufeli, W.B., & Leiter, M.P., (2001). Job burnout. Annual Review of
Psychology, 52(1), 397-422.
Maslow, A.H. (1943). A theory of human behavior. Psychological Review, 50(4), 370-396. doi:
10.1037/h0054346
Maslow, A.H. (1954). Motivation and personality. New York, NY: Harper.
McClelland, D.C. (1965). Toward a theory of motive acquisition. American Psychologist, 20(5),
321-333. doi: 10.1037/h0022225
McClelland, D.C. (1988). Human motivation. New York, NY: Cambridge University Press.
200
Mchatton, P.A., Glenn, T.L., & Gordon, K.D. (2007). Troubling special education leadership:
Finding purpose, potential, and possibility in challenging contexts. Journal of Special
Education, 25(1), 38-47.
Milazzo, T.C., & Blessing, K.R. (1964). The training of directors and supervisors of special
education programs. Exceptional Children, 31, 129-141.
Miller, K.I., & Monge, P.R. (1986). Participation, satisfaction, and productivity: A meta-analytic
review. Academy of Management Journal, 29(4), 727-753. doi: 10.2307/255942
Mills v. Board of Education District of Columbia, 348 F Supp 866 (1972).
Miner, J.B. (2007). Organizational behavior 4: From theory to practice. Armonk, New York:
M.E. Sharpe, Inc.
Mirriam-Webster, Inc. (2013). Definition of ambivalence. Retrieved from
http://www.merriam-webster.com/dictionary/ambivalence
Montana, P.J., & Charnov, B.H. 92008). Management. Hauppauge, NY: Barron’s Educational
Series, Inc.
Moorehead, G. & Griffin, R.W. (1998). Organizational behavior: Managing people and
organizations. New York, NY: Houghton-Mifflin.
Moorman, R.H. (1993). The influence of cognitive and affective based job satisfaction measures
on the relationship between satisfaction and organizational behavior. Human Relations,
46(6), 759-776. doi:10.1177/001872679304600604
Mueller, T.G. (2009). Alternative dispute resolution: A new agenda for special education policy.
Journal of Disability Policy Studies, 20(1), 4-13.
Mueller, T.G. (2009). IEP facilitation: A promising approach to resolving conflicts between
families and schools. Teaching Exceptional Children, 41(3), 60-67.
201
Mueller, K., Liebig, C., & Hattrup, K. (2007). Computerizing organizational attitude surveys: An
investigation of the measurement equivalence of a multifaceted job satisfaction measure.
Educational and Psychological Measurement, 67(4), 658-678. doi:
10.1177/0013164406292084
Mukherjee, K. (2009). Principles of management and organizational behavior. Nagar, New
Delhi: Tata McGraw-Hill.
Muller, E., & Burdette, P. (2007). Highly qualified teachers and special education: Several state
approaches. Project Forum at NASDE. Retrieved from
http://www.cec.sped.org/AM/Template.cfm?Section=Highly_Qualified_Teachers&Conte
ntID=8419&template=/CM/ContentDisplay.cfm
Myhill, W. (2011). The first one hundred years of special education in America? 1817 to 1925
[internet]. The E Journal of Disability Law and Policy. Retrieved from
http://ejournalofdisabilitylawandpolicy.wordpress.com/article/the-first-one-hundred-
years-of-special-1y94ijr3ii5zl-2/.
Naumann, E. (1993). Antecedents and consequences of satisfaction and commitment among
expatriate managers. Group and Organization Management, 18(2), 153-187.
doi:10.1177/1059601193182003
Newbury, J.E. (2000). Job satisfaction of middle school principals in Virginia. Dissertation
Abstracts International, 60(7A), 2313 (UMI No. 9934560)
Newman, K.S. (1970). Administrative tasks in special education. Exceptional Children, 36(1),
521-524.
No Child Left Behind Act of 2001, P.L. 107-110, 20 U.S.C.A. § 6301 et seq.
202
Noer, D.M. (1993). Healing the wounds: Overcoming the trauma of layoffs and revitalizing
downsized organizations. San Francisco, CA: Jossey-Bass.
North Carolina Department of Public Instruction. (2003). Baseline information on federal teacher
quality measure completed. Retrieved from
http://www.ncpublicschools.org/newsroom/news/2003-04/20031125
North Carolina Department of Public Instruction. (2012). Child count data 2004-2012. Retrieved
from http://ec.ncpublicschools.gov/reports-data/child-count/reports/december-1
North Carolina Department of Public Instruction. (2010). Equity plan for highly qualified
teachers. Retrieved from
http://www.ncpublicschools.org/docs/federalprograms/titleII/a/2010-equity-plan.pdf
North Carolina Department of Public Instruction. (2013). LEA EC Program Directors. Retrieved
from http://ec.ncpublicschools.gov/directory/lea-ec-program-directors
North Carolina Department of Public Instruction. (2009). Memo special education licensure.
Retrieved from
http://policy.microscribepub.com/cgibin/om_isapi.dll?clientID=438217596&depth=2&in
fobase=ncser.nfo&record={92E}&softpage=PL_frame
North Carolina Department of Public Instruction. (2012). 2012-13 Education budget frequently
asked questions. Retrieved from
http://www.ncpublicschools.org/docs/budget/communication/budgetguide.pdf
North Carolina Department of Public Instruction. (2012). North Carolina school report cards.
Retrieved from
http://www.ncreportcards.org/src/stateDetails.jsp?Page=1&pYear=2011-2012
203
North Carolina Department of Public Instruction. (2006). North Carolina standards for school
executives. Raleigh, NC: Human Resources Division.
North Carolina Department of Public Instruction. (2010). Policies and procedures governing
services for children with disabilities. Raleigh, NC: Exceptional Children Division.
North Carolina Department of Public Instruction Exceptional Children Division. (n.d.) State
performance plan. Retrieved from http://ec.ncpublicschools.gov/reports-data/state-
performance-plan
North Carolina Department of Public Instruction Finance and Business Services Division.
(2013). Average daily membership 2012-2013. Retrieved from
http://www.ncpublicschools.org/fbs/accounting/data/
North Carolina Department of Public Instruction Finance and Business Services Division.
(2013). 2010-2011 Local salary supplements. Retrieved from
www.ncpublicschools.org/fbs/finance/salary
North Carolina Department of Public Instruction Finance and Business Services Division.
(2012). 2012-2013 Central office administrator ranges. Retrieved from
www.ncpublicschools.org/fbs/finance/salary
North Carolina Department of Public Instruction Finance and Business Services Division.
(2012). Trends: Growing student population served by fewer adults. Retrieved from
http://www.ncpublicschools.org/docs/fbs/budget/spendingtrends.pdf
North Carolina Department of Public Instruction Information Analysis Division. (2012).
Highlights of the North Carolina public school budget: February 2012. Raleigh, NC:
North Carolina Public Schools Division of School Business.
204
North Carolina Department of Public Instruction Analysis Division. (2013). Highlights of the
North Carolina public school budget: February 2013. Raleigh, NC: North Carolina
Public Schools Division of School Business.
North Carolina Department of Public Instruction Licensure Division. (n.d.). School-based
administrators and special service personnel licensure requirements. Retrieved from
http://www.ncpublicschools.org/licensure/administrator
North Carolina Department of Public Instruction Licensure Division. (2013). Professional
educator’s licensure. Retrieved from http://www.ncpublicschools.org/licensure/
North Carolina Office of Charter Schools. (2013). NC 115C-238.29F General requirements of
charter schools. Retrieved from
http://www.ncga.state.nc.us/EnactedLegislation/Statutes/HTML/BySection/Chapter_115
C/GS_115C-238.29F.html
North Carolina State Board of Education. (2006). Mission statement. Retrieved from
http://www.dpi.state.nc.us/organization/mission/
North Carolina State Board of Education. (2007). North Carolina standards for superintendents
and central office administrators. Retrieved from
http://www.ncpublicschools.org/docs/effectiveness-
model/ncees/standards/superintendent-standards.pdf
Nunnally, J.C. (1978). Psychometric theory. (2nd
ed.). New York, NY: McGraw-Hill.
Nutter, R.E., Forgnone, C.E., McBride, J., & Boone, R. (1983). A time and effort study of
selected directors of exceptional student education. Planning and Changing, 14(2), 109-
125.
205
Nutter, R.E, & McBride, J. (1981). The relative importance of preparation to the job performance
of special education administrators. Teacher Education and Special Education: The
Journal of the Teacher Education Division of the Council for Exceptional Children, 4(4),
15-20. doi:10.1177/088840648100400404
Oliver, R., & Anderson, P. (1994). An empirical test of the consequences of behavior and
outcome based sales control systems. Journal of Marketing, 58(4), 21-35.
Osgood, R.L. (2008). The history of special education: A struggle for equality in American
public schools. Westport, CT: Praeger Publishing Co.
Pagano, R.R. (2010). Understanding statistics in the behavioral sciences. Belmont, CA:
Wadsworth-Cengage Learning.
Pate, L.E. (1987). Understanding human behavior. Management Decisions, 25(6), 58-64. doi:
10.1108/eb001477
Payne, R.L., Fineman, S., & Wall, T.D. (1976). Organizational climate and job satisfaction: A
conceptual synthesis. Organizational Behavior and Human Performance, 16(1), 46-62.
http://dx.doi.org.librarylink.uncc.edu/10.1016/0030-5073(76)90006-4
Pennsylvania Association for Retarded Citizens (PARC) v. Commonwealth of Pennsylvania,
334 F Supp 1257 (1971) and 334 F Supp 279 (1972).
Pestonjee, D.M. (1991). Motivation and job satisfaction. New Delhi, India: Macmillan India Ltd.
Peters, L.H., O’Connor, E.J., & Rudolf, C.J. (1980). The behavioral and affective consequences
of performance-relevant situational variables. Organizational Behavior and Human
Performance, 25, 79-96.
Peters-Schinsky, A.E. (2002). Correlates of job satisfaction among school superintendents.
Dissertation Abstracts International, 62(9A), 2943. (UMI No. 95005048).
206
Pinsonneault, A., & Kraemer, K. (1993). Survey research methodology in management
information systems: An assessment. Journal of Management Information Systems,
10(2), 75-105.
Prillaman, D., & Richardson, R. (1985). State certification endorsement requirements for special
education administrators. Journal of Special Education, 19(2), 231-236.
doi:10.1177/002246698501900209
Qualtrics. (2011). Cross tabulation analysis. Retrieved from
http://www.qualtrics.com/university/researchsuite/docs/CrosstabulationAnalysis.pdf
Rango, W.V. (1996). Struggles in transformation: A study in TQM, leadership, and
organizational culture in a government agency. Public Administration Review, 56(3),
227-234. http://www.jstor.org/stable/976445
Ratcliffe, K.G., & Willard, D.T. (2006). NCLBA and IDEA: Perspectives from the field. Focus
on Exceptional Children, 39(3), 1-14.
Reavis, W.C., Pierce, P.R., & Stullken, E.H. The elementary school: its organization and
administration (3rd
ed.). Chicago, IL: University of Chicago Press.
Reynolds, C.R., & Fletcher-Janzen, E. (Eds.). (2007). Encyclopedia of special education: A
reference for the education of children, adolescents, and adults with disabilities, and
other exceptional individuals (Vol. 3). Hoboken, NJ: John Wiley and Sons, Inc.
Rice, R.W., Phillips, S.M., & McFarlin, D.B. (1990). Multiple discrepancies and pay
satisfaction. Journal of Applied Psychology, 75, 386-393.
Ripscher, H.H. (1979). A survey of the doctoral level special education administration
preparation programs. (Unpublished doctoral dissertation). University of Florida.
207
Robbins, S.R. (2009). Organizational behavior: Global and South Africa perspectives.
Pinelands, South Africa: Pearson Education South Africa.
Rodriguez, C.A. (1994). Employee participation and empowerment programs: Problems of
definition and implementation. Empowerment in Organizations, 2(1), 29-40.
doi:10.1108/09684899410061645
Roethlisberger, F.J. (1972). A conversation with Fritz J. Roethlisberger. Organizational
Dynamics, 1(2), 31-45.
Roethlisberger, F.J., & Dickson, W.J. (1939). Management and the worker: An account of a
research program conducted by the Western Electric Company, Hawthorne works,
Chicago. Cambridge, MA: Harvard University Press.
Rude, H.A., & Sasso, G.M. (1988). Colorado special education administrative competencies.
Teacher Education and Special Education: The Journal of the Teacher Education
Division of the Council for Exceptional Children, 11(4), 139-143.
Saiyadain, M.S. (2003). Human resources management. New Delhi, India: Tata McGraw-Hill
Publishing.
Schaffer, R.H. (1953). Job satisfaction as related to need satisfaction in work. Psychological
Monograph, 67(14), 3-12. doi:10.1037/h0093658
Scheerenberger, R.C. (1982). Treatment from ancient times to the present. In P. Cegelka and H.
Prehm (Eds.) Mental retardation: from categories to people (p. 44-75). Columbus, Ohio:
Merrill Publishing Co.
Schermerhorn, J.R., Hunt, J.G., & Osborn, R.N. (2005). Organizational behavior. (9th
ed). New
York, NY: John Wiley & Sons, Inc.
208
Schlichte, J., Yssel, N., & Merbler, J. (2005). Pathways to burnout: Case studies in teacher
isolation and alienation, Preventing School Failure, 50(1), 35-40.
Section 504 of the Rehabilitation Act of 1973, 29 U.S.C. 794
Seltzer, M. (2011). The roundabout of special education leadership. International Journal of
Humanities and Social Science, 1(15), 120-139.
Sills, S.J., & Song, C. (2002). Innovations in survey research: An application of web-based
surveys. Social Science Computer Review, 20(1), 22-30.
Sinha, D. (1987). Job satisfaction in office and manual workers. Indian Journal of Social
Workers, 19, 39-46.
Sirk, J.P. (1999). Administrators’ influence on job satisfaction of West Virginia special education
teachers. Retrieved from Proquest Digital Dissertations. (ID 304535331)
Skiba, R.J. (2002). Special education and school discipline: A precarious balance. Behavioral
Disorders, 27(2), 81-97.
Smith, P.C., Kendall, L.M., & Hulin, C.L. (1969). Measurement of satisfaction in work and
retirement. Chicago, IL: Rand McNally.
Smith, S.F. (2007). Evaluation measures: Do they measure the special education administrator’s
roles and responsibilities by which they are held accountable for under NCLB and IDEA
2004. (Published dissertation). Retrieved from Proquest database. ID #1021374650
Smith, T. (2007). Job satisfaction in the United States. Chicago, IL: University of Chicago.
Society for Human Resource Management. (2012). 2012 Employee job satisfaction and
engagement: Executive summary. Retrieved from
http://www.shrm.org/Research/SurveyFindings/Articles/Documents/SHRM-Employee-
Job-Satisfaction-Engagement-Executive-Summary.pdf
209
Society for Human Resource Management. (2012). 2012 Employee job satisfaction and
engagement: How employees are dealing with uncertainty. Retrieved from
http://www.shrm.org/LegalIssues/StateandLocalResources/StateandLocalStatutesandReg
ulations/Documents/12-0537%202012_JobSatisfaction_FNL_online.pdf
Society for Human Resource Management. (2012). SHRM research spotlight: Employee job
satisfaction. Retrieved from
http://www.shrm.org/Research/SurveyFindings/Articles/Documents/SHRM-Employee-
Job-Satisfaction--Spotlight.pdf
Spector, P.E. (1985). Measurement of human service staff satisfaction: Development of the Job
Satisfaction Survey. American Journal of Community Psychology, 13(6), 693-713.
Spector, P.E. (1986). Perceived control by employees: A meta-analysis of studies concerning
autonomy and participation at work. Human Relations, 39(11), 1005-1016.
doi:10.1177/001872678603901104
Spector, P.E. (1994). Job Satisfaction Survey. Retrieved from
http://shell.cas.usf.edu/~pspector/scales/jsspag.html
Spector, P.E. (1997). Job satisfaction: application, assessment, causes, and consequences.
Thousand Oaks, CA: Sage Publications.
Spector, P.E. (2001). Internal consistency reliabilities. Retrieved from
http://shell.cas.usf.edu/~pspector/scales/jssovr.html
Spector, P. E. (2007). Job Satisfaction Survey norms for education / primary and secondary.
Retrieved from http://shell.cas.usf.edu/~pspector/scales/jssnorms.html
Spector, P.E. (2011). Job Satisfaction Survey Overview, JSS Page. Retrieved from
http://shell.cas.usf.edu/~pspector/scales/jsspag.html
210
Spreitzer, G.M. (1995). Psychological empowerment in the workplace: Dimensions,
measurement, and validation. Academy of Management Journal, 38(5), 1442-1465. doi:
10.2307/256865
Srivastava, S.K. (2009). Organizational behavior and management. New Delhi, India: Sarrup
and Sons.
Steers, R.M., Mowday, R.T., & Shapiro, D.L. (2004). The future of work motivation theory.
Academy of Management Review, 29(3), 379-387. doi: 10.5465/AMR.2004.13670978
Stile, S.W., & Pettibone, T.J. (1980). Training and certification of administrators in special
education. Exceptional Children, 46(7), 530-533.
Stodden, R.A., Galloway, L.M., & Stodden, N.J. (2003). Secondary school curricula issues:
Impact on postsecondary students with disabilities. Exceptional Children, 70(1), 9-25.
Tate, A.S. (2009). Special education administrators in North Carolina: Who is leading the field?
Retrieved from Proquest Digital Dissertations. (ID 304962206)
Thornton, B., Peltier, G., & Medina, R. (2007). Reducing the teacher education shortage. Journal
of Educational Strategies, Issues, and Ideas, 80(5), 233-238.
Title IX of the Education Amendments of 1972, 20 U.S.C. A. §1681-1688 et seq.
Tomlinson, C.A. (2001). Standards and the art of teaching: Crafting high quality classrooms.
NASSP Bulletin, 85(622), 38-47.
United States Bureau of Labor Statistics. (2012). North Carolina economy at a glance. Retrieved
from http://www.bls.gov/eag/eag.nc.htm
United States Department of Education. (2010). A blueprint for reform: The reauthorization of
the Elementary and Secondary Education Act. Washington, DC: USED Education
Publications Center.
211
United States Department of Education. (2012). A summary of highly qualified teacher data for
school year 2010-2011. Retrieved from
http://www2.ed.gov/programs/teacherqual/resources.html
United States Department of Education. (2012). Determination letters on state implementation of
IDEA. Retrieved from http://www2.ed.gov/fund/data/report/idea/sppapr.html
United States Department of Education. (2010). Free appropriate public education for students
with disabilities: Requirements under Section 504 of the Rehabilitation Act of 1973.
Retrieved from http://www2.ed.gov/about/offices/list/ocr/docs/edlite-FAPE504.html
United States Department of Education. (2003). Meeting the highly qualified teachers challenge:
The Secretary’s second annual report on teacher quality. Washington, DC: U.S.
Department of Education.
United States Department of Education. (2005). New No Child Left Behind flexibility: Highly
qualified teachers. Retrieved from
http://www2.ed.gov/nclb/methods/teachers/hqtflexibility.html
United States Department of Education. (2001). No Child Left Behind. Retrieved from
http://www2.ed.gov/policy/elsec/leg/esea02/index.html
United States Department of Education. (2004). No Child Left Behind: A toolkit for teachers.
Retrieved from http://www2.ed.gov/teachers/nclbguide/nclb-teachers-toolkit.pdf
United States Department of Education. (2008). No Child Left Behind provisions give schools
new flexibility and ensure accountability for students with disabilities. Retrieved from
http://www2.ed.gov/nclb/freedom/local/specedfactsheet.html
212
United States Department of Education. (n.d.). Part B state performance plans, letters, and annual
performance reports. Retrieved from
http://www2.ed.gov/fund/data/report/idea/partbspap/allyears.html
United States Department of Education. (2012). Race to the top fund. Retrieved from
http://www2.ed.gov/programs/racetothetop/index.html
United States Department of Education. (2010). State and local implementation of the No Child
Left Behind Act Volume IX – accountability under NCLB: Final report. Washington, DC:
United States Department of Education Office of Planning, Evaluation, and Policy
Development.
United States Department of Education. (2010). Thirty-five years of progress in educating
children with disabilities through IDEA. Retrieved from
http://www2.ed.gov/about/offices/list/osers/idea35/history/idea-35-history.pdf
United States Department of Education Office for Civil Rights. (2006). Americans with
Disabilities Act. Retrieved from
http://www2.ed.gov/about/offices/list/ocr/docs/hq9805.html
United States Department of Justice. (2009). Overview of the education amendments of 1972, 20
U.S.C. § 1681. Retrieved from http://www.justice.gov/crt/about/cor/coord/ixovervw.php
United States Department of Labor, Bureau of Labor Statistics. (2010). Occupational outlook
handbook, 2010-2011 edition. Indianapolis, IN: JIST Works, Inc.
Valesky, T.C., & Hirth, M.A. (1992). Survey of the states: Special education knowledge
requirements for school administrators. Exceptional Children, 58(5), 399-406.
213
Vandenberg, R.J., Richardson, H.A., & Eastman, L.J. (1999). The impact of high involvement
work processes on organizational effectiveness. Group and Organization Management,
24(3), 300-339. doi:10.1177/1059601199243004
Vroom, V.H. (1964). Work and motivation. San Francisco, CA: Jossey-Bass.
Wagner, J.A. (1994). Participation’s effect on performance and satisfaction: A reconsideration of
research evidence. Academy of Management Review, 19(2), 312-330. doi:
10.5465/AMR.1994.9410210753
Wagner, J.A., & Gooding, R.Z. (1987). Effects on societal trends on participation research.
Administrative Science Quarterly, 32, 241-262.
Wahba, M.A., & Bridwell, L.G. (1976). Maslow reconsidered: a review of research on the need
hierarchy theory. Organizational Behavior and Human Performance, 15(2), 212-240.
http://dx.doi.org.librarylink.uncc.edu/10.1016/0030-5073(76)90038-6
Wanous, J.P., & Lawler, E.E. (1972). Measurement and meaning of job satisfaction. Journal of
Applied Psychology, 56, 95-105.
Warfield, E.R. (1982). Graduate programs, certification and performance requirements for
special education administrators. (Doctoral dissertation). Retrieved from University of
Arizona open repository.
http://arizona.openrepository.com/arizona/bitstream/10150/188103/1/azu_td_8217481_si
p1_m.pdf
Watson v. City of Cambridge 32 N.E. 864 (Mass., 1893).
Weatherman, R., & Hapoz, I. (1975). A study of special education directors in Minnesota.
(Unpublished report). Duluth, MN: University of Minnesota.
214
Weiss, D., Dawis, R., England, G., & Lofquist, L. (1977). Manual for the Minnesota satisfaction
questionnaire. Minneapolis, MN: University of Minnesota Press of Industrial Relations
Center
Whitworth, J.E., & Hatley, R.V. (1979). Certification and special education leadership
personnel: An analysis of state standards. Journal of Special Education, 13(3), 297-303.
doi:10.1177/002246697901300308
Wiggins, G., & McTighe, J. (2007). Schooling by design: Mission, action, and achievement.
Alexandria, VA: Association for Supervision and Curriculum Development.
Willenberg, E.P. (1966). Organization, administration, and supervision of special education.
Review of Educational Research, 36(1), 134-150. http://www.jstor.org/stable/1169641
Winzer, M.A. (1993). The history of special education: From isolation to integration.
Washington, DC: Gallaudet University Press.
Wolf, W.C., Flegstein, N.D. (1979). Sex and authority in the workplace: The causes of sexual
inequity. American Sociological Review, 44, 235-252.
Yell, M.I., Katsiyannas, A., & Shiner, J.G. (2006). The No Child Left Behind Act, adequate
yearly progress, and students with disabilities. Teaching Exceptional Children, 38(4), 32-
39.
Yell, M.L., Rogers, D., & Rogers, E. L. (1998). The legal history of special education: what a
long, strange trip it’s been! Remedial and Special Education, 19(4), 219-228.
doi:10.1177/074193259801900405

215
Appendices
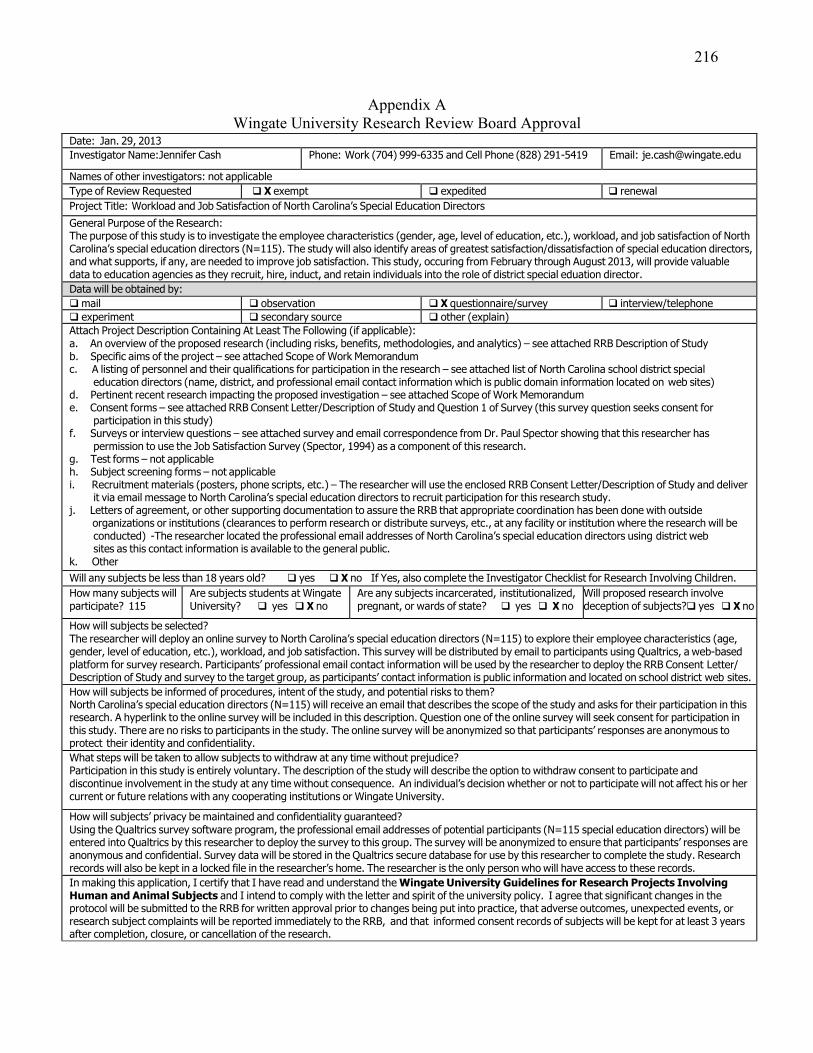
216
Appendix A
Wingate University Research Review Board Approval Date: Jan. 29, 2013 Investigator Name:Jennifer Cash Phone: Work (704) 999-6335 and Cell Phone (828) 291-5419 Email: [email protected]
Names of other investigators: not applicable Type of Review Requested X exempt expedited renewal Project Title: Workload and Job Satisfaction of North Carolina’s Special Education Directors
General Purpose of the Research: The purpose of this study is to investigate the employee characteristics (gender, age, level of education, etc.), workload, and job satisfaction of North Carolina’s special education directors (N=115). The study will also identify areas of greatest satisfaction/dissatisfaction of special education directors, and what supports, if any, are needed to improve job satisfaction. This study, occuring from February through August 2013, will provide valuable data to education agencies as they recruit, hire, induct, and retain individuals into the role of district special eduation director. Data will be obtained by: mail observation X questionnaire/survey interview/telephone experiment secondary source other (explain) Attach Project Description Containing At Least The Following (if applicable): a. An overview of the proposed research (including risks, benefits, methodologies, and analytics) – see attached RRB Description of Study b. Specific aims of the project – see attached Scope of Work Memorandum c. A listing of personnel and their qualifications for participation in the research – see attached list of North Carolina school district special
education directors (name, district, and professional email contact information which is public domain information located on web sites) d. Pertinent recent research impacting the proposed investigation – see attached Scope of Work Memorandum e. Consent forms – see attached RRB Consent Letter/Description of Study and Question 1 of Survey (this survey question seeks consent for
participation in this study) f. Surveys or interview questions – see attached survey and email correspondence from Dr. Paul Spector showing that this researcher has
permission to use the Job Satisfaction Survey (Spector, 1994) as a component of this research. g. Test forms – not applicable h. Subject screening forms – not applicable i. Recruitment materials (posters, phone scripts, etc.) – The researcher will use the enclosed RRB Consent Letter/Description of Study and deliver
it via email message to North Carolina’s special education directors to recruit participation for this research study. j. Letters of agreement, or other supporting documentation to assure the RRB that appropriate coordination has been done with outside
organizations or institutions (clearances to perform research or distribute surveys, etc., at any facility or institution where the research will be conducted) -The researcher located the professional email addresses of North Carolina’s special education directors using district web sites as this contact information is available to the general public.
k. Other
Will any subjects be less than 18 years old? yes X no If Yes, also complete the Investigator Checklist for Research Involving Children. How many subjects will participate? 115
Are subjects students at Wingate University? yes X no
Are any subjects incarcerated, institutionalized, pregnant, or wards of state? yes X no
Will proposed research involve deception of subjects? yes X no
How will subjects be selected? The researcher will deploy an online survey to North Carolina’s special education directors (N=115) to explore their employee characteristics (age, gender, level of education, etc.), workload, and job satisfaction. This survey will be distributed by email to participants using Qualtrics, a web-based platform for survey research. Participants’ professional email contact information will be used by the researcher to deploy the RRB Consent Letter/ Description of Study and survey to the target group, as participants’ contact information is public information and located on school district web sites. How will subjects be informed of procedures, intent of the study, and potential risks to them? North Carolina’s special education directors (N=115) will receive an email that describes the scope of the study and asks for their participation in this research. A hyperlink to the online survey will be included in this description. Question one of the online survey will seek consent for participation in this study. There are no risks to participants in the study. The online survey will be anonymized so that participants’ responses are anonymous to protect their identity and confidentiality. What steps will be taken to allow subjects to withdraw at any time without prejudice? Participation in this study is entirely voluntary. The description of the study will describe the option to withdraw consent to participate and discontinue involvement in the study at any time without consequence. An individual’s decision whether or not to participate will not affect his or her current or future relations with any cooperating institutions or Wingate University.
How will subjects’ privacy be maintained and confidentiality guaranteed? Using the Qualtrics survey software program, the professional email addresses of potential participants (N=115 special education directors) will be entered into Qualtrics by this researcher to deploy the survey to this group. The survey will be anonymized to ensure that participants’ responses are anonymous and confidential. Survey data will be stored in the Qualtrics secure database for use by this researcher to complete the study. Research records will also be kept in a locked file in the researcher’s home. The researcher is the only person who will have access to these records. In making this application, I certify that I have read and understand the Wingate University Guidelines for Research Projects Involving Human and Animal Subjects and I intend to comply with the letter and spirit of the university policy. I agree that significant changes in the protocol will be submitted to the RRB for written approval prior to changes being put into practice, that adverse outcomes, unexpected events, or research subject complaints will be reported immediately to the RRB, and that informed consent records of subjects will be kept for at least 3 years after completion, closure, or cancellation of the research.
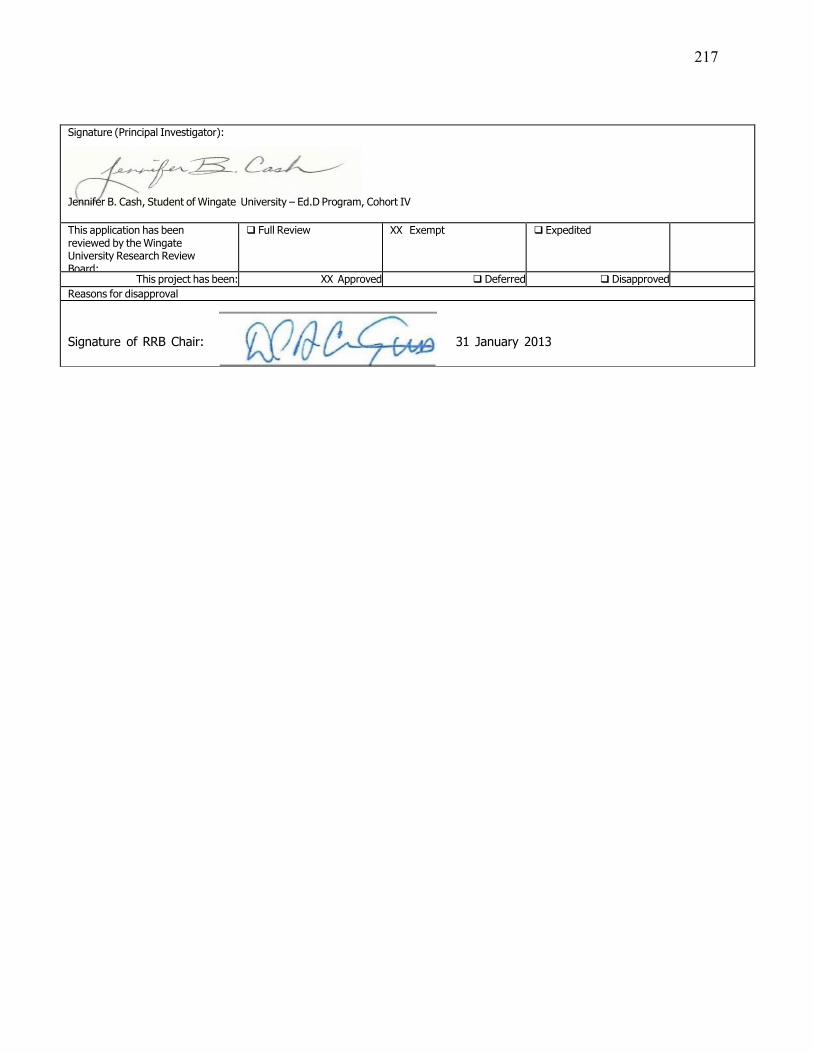
217
Signature (Principal Investigator):
Jennifer B. Cash, Student of Wingate University – Ed.D Program, Cohort IV
This application has been reviewed by the Wingate University Research Review Board:
Full Review XX Exempt Expedited
This project has been: XX Approved Deferred Disapproved Reasons for disapproval
Signature of RRB Chair: 31 January 2013
218
Appendix B
Consent to Use Job Satisfaction Survey (Spector, 1994)
219
220

221
Appendix C
Wingate University Consent Letter/Description of Study
Description of Study - Consent
Please read this document as it describes a very important research study for North
Carolina’s special education directors. The survey link is at the end of this document.
Description of Research Study: My name is Jennifer Cash, a doctoral candidate of the
Educational Leadership Program of Wingate University. I am conducting a study on the
Workload and Job Satisfaction of North Carolina’s Special Education Directors. I invite you to
participate in this study as you serve as the special education director of your district. Please read
this form and ask any questions before agreeing to be in the study.
Background Information and Purpose of Study: The purpose of this study is to investigate
employee characteristics (age, gender, etc.), workload, and job satisfaction of North Carolina’s
special education directors. The study will also identify areas of satisfaction and/or
dissatisfaction among special education directors, and what supports, if any, are needed, to
improve job satisfaction.
Procedures: I am requesting your participation in this study through the completion of an
online survey that I created using Qualtrics, a web-based platform for survey research.
Participants’ survey responses are anonymous to protect their identity and confidentiality. Participants are free to withdraw consent to participate and may discontinue participation at any
time without consequence. Reminder emails will be sent to participants who have not completed
the survey. The survey will take less than 20 minutes to complete. Findings of this study will be
made available ot the general public upon publication. Question one of the online survey will
ask for your consent to participate in this study.
Risks and Benefits of Participating in the Study: There are no risks to participants of his
study. There are direct benefits to participants as this data will provide insight into the special
education director position, workload, and job satisfaction. This study will benefit education
agencies as they recruit, hire, induct, and retain individuals into the role of special education
director.
Confidentiality: The survey was designed so that participants’ responses are anonymous to
protect their identity and confidentiality. I will not be able to associate any of the survey
data to specific individuals. Survey responses are stored in the Qualtrics secure database to
allow me, as a researcher, to conduct the study. Research records will also be kept in a locked
file in my home. I am the only person who will have access to these records.
222
Voluntary Nature of the Study: Your participation in this study is voluntary. Your decision
whether or not to participate will not affect your current or future relations with any cooperating
institutions or Wingate University. If you decide to participate, you are free to withdraw at any
time without penalty.
Contacts and Questions: If you have any questions regarding this study, please contact me at
telephone (828) 291-5419 or by email at [email protected]. You may contact the faculty
advisor of this project, Assistant Professor Dr. Cindy Compton at [email protected] or
telephone 704-849-3416. You may also contact the chairperson of the Wingate University
Research Review Board at [email protected] or telephone 704-233-8187 with any
questions or concerns. You may print this form for your records if you choose. Thank you for
your support and participation in this research study.
To access the online survey on the Workload and Job Satisfaction of North Carolina’s
Special Education Directors, please click on the hyperlink below.
Follow this link to the Survey: ${l://SurveyLink?d=Take the Survey}
Or copy and paste the URL below into your internet browser:
${l://SurveyURL}
Follow the link to opt out of future emails: ${l://OptOutLink?d=Click here to unsubscribe}

223
Appendix D
Special Education Director Survey
Q1.1 I have read the description of the research study. Participants' responses are anonymous to
protect their identity and confidentiality. Do you give consent to be included in the research
study?
o Yes (1)
o No (2)

224
Q2.1 What is your gender?
o Male (1)
o Female (2)
Q2.2 What is your age?
o 21 - 25 years of age (1)
o 26 - 30 years of age (2)
o 31 - 35 years of age (3)
o 36 - 40 years of age (4)
o 41 - 45 years of age (5)
o 46 - 50 years of age (6)
o 51 - 55 years of age (7)
o 56 - 60 years of age (8)
o 61 - 65 years of age (9)
o 66 years of age or older (10)
Q2.3 What is the highest level of education you have completed?
o Bachelors Degree (BA/BS) (1)
o Master's Degree (2)
o Advanced Degree (3)
o Doctoral Degree (4)
Q2.4 How many years of experience do you have in the field of public education, counting this
year?
o 1 - 5 years of experience in public education (1)
o 6 - 10 years of experience in public education (2)
o 11 - 15 years of experience in public education (3)
o 16 - 20 years of experience in public education (4)
o 21 - 25 years of experience in public education (5)
o 26 - 30 years of experience in public education (6)
o 31 or more years of experience in public education (7)
Q2.5 How did you acquire the job of the district's special education director?
o District posted job vacancy - open to internal & external candidates (1)
o District posted job vacancy - open to internal candidates (2)
o Was already employed in the district & was assigned supervision of the Exceptional Children
Program (3)
o Other (4) ____________________
Q2.6 Do you hold North Carolina licensure as an Exceptional Children Program Administrator?
o Yes (1)
o No (2)
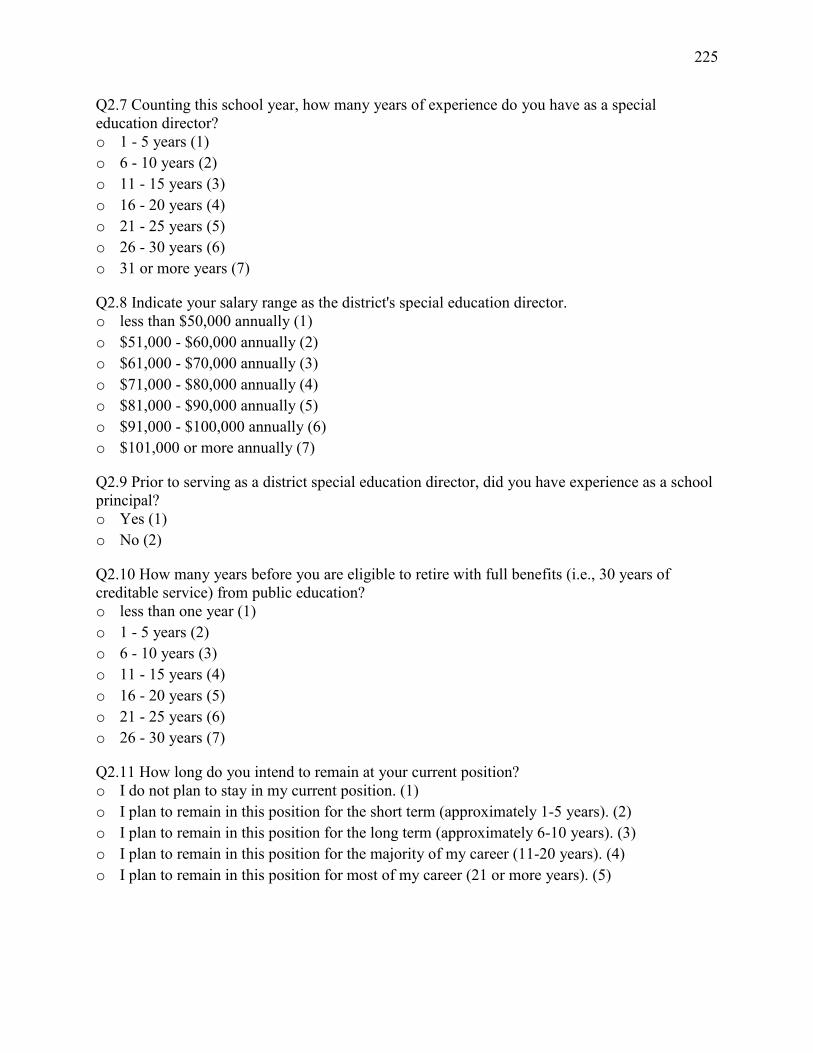
225
Q2.7 Counting this school year, how many years of experience do you have as a special
education director?
o 1 - 5 years (1)
o 6 - 10 years (2)
o 11 - 15 years (3)
o 16 - 20 years (4)
o 21 - 25 years (5)
o 26 - 30 years (6)
o 31 or more years (7)
Q2.8 Indicate your salary range as the district's special education director.
o less than $50,000 annually (1)
o $51,000 - $60,000 annually (2)
o $61,000 - $70,000 annually (3)
o $71,000 - $80,000 annually (4)
o $81,000 - $90,000 annually (5)
o $91,000 - $100,000 annually (6)
o $101,000 or more annually (7)
Q2.9 Prior to serving as a district special education director, did you have experience as a school
principal?
o Yes (1)
o No (2)
Q2.10 How many years before you are eligible to retire with full benefits (i.e., 30 years of
creditable service) from public education?
o less than one year (1)
o 1 - 5 years (2)
o 6 - 10 years (3)
o 11 - 15 years (4)
o 16 - 20 years (5)
o 21 - 25 years (6)
o 26 - 30 years (7)
Q2.11 How long do you intend to remain at your current position?
o I do not plan to stay in my current position. (1)
o I plan to remain in this position for the short term (approximately 1-5 years). (2)
o I plan to remain in this position for the long term (approximately 6-10 years). (3)
o I plan to remain in this position for the majority of my career (11-20 years). (4)
o I plan to remain in this position for most of my career (21 or more years). (5)

226
Q2.12 Indicate the number of children enrolled in your school district (go by Average Daily
Membership).
o 1 to 5,000 Average Daily Membership (1)
o 5,001 to 10,000 Average Daily Membership (2)
o 10,001 to 15,000 Average Daily Membership (3)
o 15,001 to 20,000 Average Daily Membership (4)
o 20,001 to 25,000 Average Daily Membership (5)
o 25,001 to 30,000 Average Daily Membership (6)
o 30,001 to 35,000 Average Daily Membership (7)
o 35,001 to 40,000 Average Daily Membership (8)
o 40,001 to 45,000 Average Daily Membership (9)
o 45,001 to 50,000 Average Daily Membership (10)
o 50,001 or greater Average Daily Membership (11)
Q2.13 Indicate the number of children with disabilities age 3 - 21 enrolled in your district (go by
most recent December 1 Child Count).
o 1 - 1,000 Child Count (1)
o 1,001 - 2,000 Child Count (2)
o 2,001 - 3,000 Child Count (3)
o 3,001 - 4,000 Child Count (4)
o 4,001 - 5,000 Child Count (5)
o 5,001 - 6,000 Child Count (6)
o 6,001 - 7,000 Child Count (7)
o 7,001 - 8,000 Child Count (8)
o 8,001 - 9,000 Child Count (9)
o 9,001 - 10,000 Child Count (10)
o 10,001 or greater Child Count (11)
Q3.1 Indicate the programs/areas of which you have been assigned direct oversight in your
school district. Check all that apply.
o Exceptional Children Program (1)
o Preschool Program (includes EC Pre-K and/or General Ed Pre-K) (2)
o Academically & Intellectually Gifted Program (3)
o Student Services Program (includes counselors, nurses, dropout prevention, Student
Assistance Teams, Alternative Education, etc.) (4)
o Section 504 Program (5)
o Other Federal Programs (such as Title 1, Title II, ESL Program, etc.) (6)
o Curriculum & Instruction (7)
o Testing & Accountability Program (8)
o Career & Technical Education Program (9)
o Other (10)

227
Q3.2 The programs/areas of which you indicated you have direct oversight are displayed. Please
indicate the approximate PERCENTAGE of time you spend on these programs/areas. Responses
selected must total to 100%.
Q3.3 In an average week, indicate the approximate percentage of time you spend on the
following areas in your school district. Responses selected must total to 100%.
______ Curriculum and Instruction (1)
______ Exceptional Children Program obligations (policies, compliance, dispute resolution,
required reports, etc.) (2)
______ Human Resources & Personnel Management (3)
______ Collaboration with School Administrators and/or District Leaders (4)
______ Finance and Budgeting (5)
______ Professional Development (providing training to others or participating in training) (6)
______ Addressing Concerns (7)
______ Strategic Planning and/or Program Planning (8)
______ Other Federal Program obligations (Title 1, Title II, ESL Program, etc.) (9)
______ Acquisition and/or Coordination of Resources (10)
Q3.4 Identify any district-level committees and/or councils of which you serve. Check all that
apply.
o Superintendent's Cabinet and/or District-level Leadership Team (1)
o District-level Curriculum & Instruction Committee (2)
o District-level Safety/Security Committee (3)
o Academically & Intellectually Gifted Program Committee (4)
o Exceptional Children Program Committee (5)
o Certified and/or Classified Staff Advisory Council (6)
o Parent Advisory Council (7)
o District-level Media and Technology Advisory Committee (8)
o District-level Strategic Planning Committee (9)
o Board Policy Committee (10)
o Other Committee (11)
o I do not serve on any district-level committees and/or councils. (12)
Q3.5 In your role as district special education director, indicate any community agencies and/or
local organizations of which you have been assigned by your supervisor to participate.
o NC Pre-K (1)
o Disabilities Support Group (2)
o Local Parent / Family Support Group (3)
o Community Mental Health Board (4)
o United Way or Rotary Club (5)
o Chamber of Commerce (6)
o Other (7) ____________________
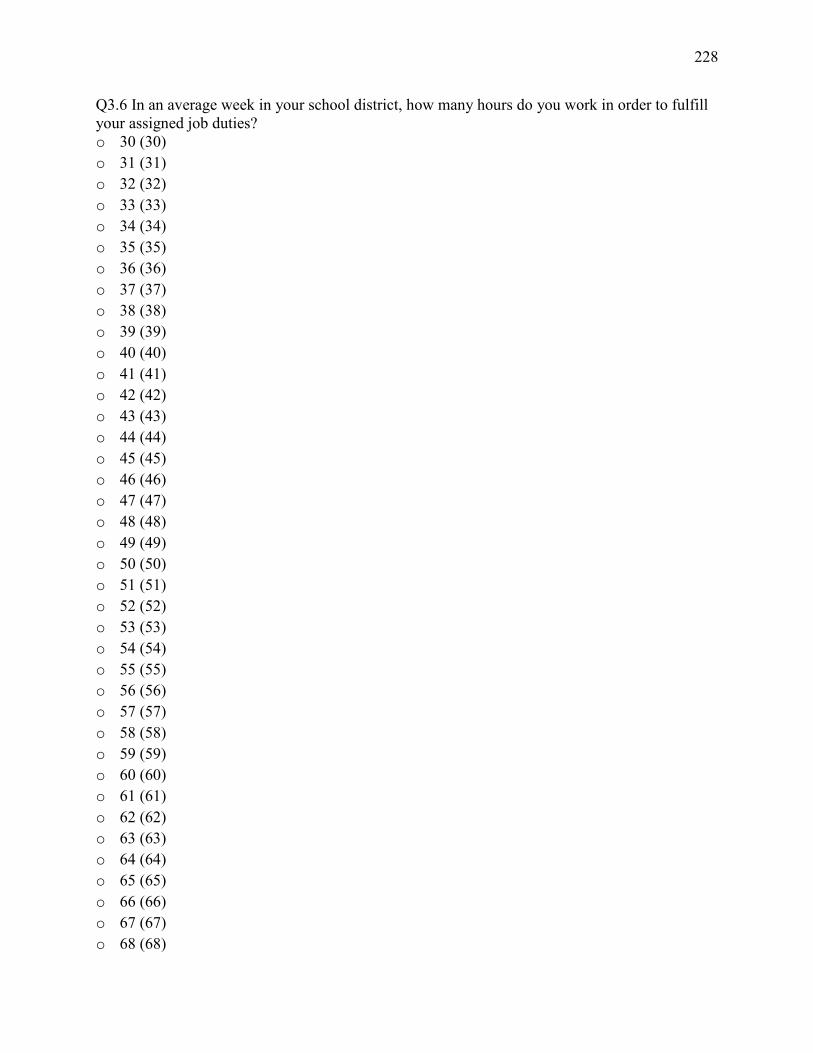
228
Q3.6 In an average week in your school district, how many hours do you work in order to fulfill
your assigned job duties?
o 30 (30)
o 31 (31)
o 32 (32)
o 33 (33)
o 34 (34)
o 35 (35)
o 36 (36)
o 37 (37)
o 38 (38)
o 39 (39)
o 40 (40)
o 41 (41)
o 42 (42)
o 43 (43)
o 44 (44)
o 45 (45)
o 46 (46)
o 47 (47)
o 48 (48)
o 49 (49)
o 50 (50)
o 51 (51)
o 52 (52)
o 53 (53)
o 54 (54)
o 55 (55)
o 56 (56)
o 57 (57)
o 58 (58)
o 59 (59)
o 60 (60)
o 61 (61)
o 62 (62)
o 63 (63)
o 64 (64)
o 65 (65)
o 66 (66)
o 67 (67)
o 68 (68)
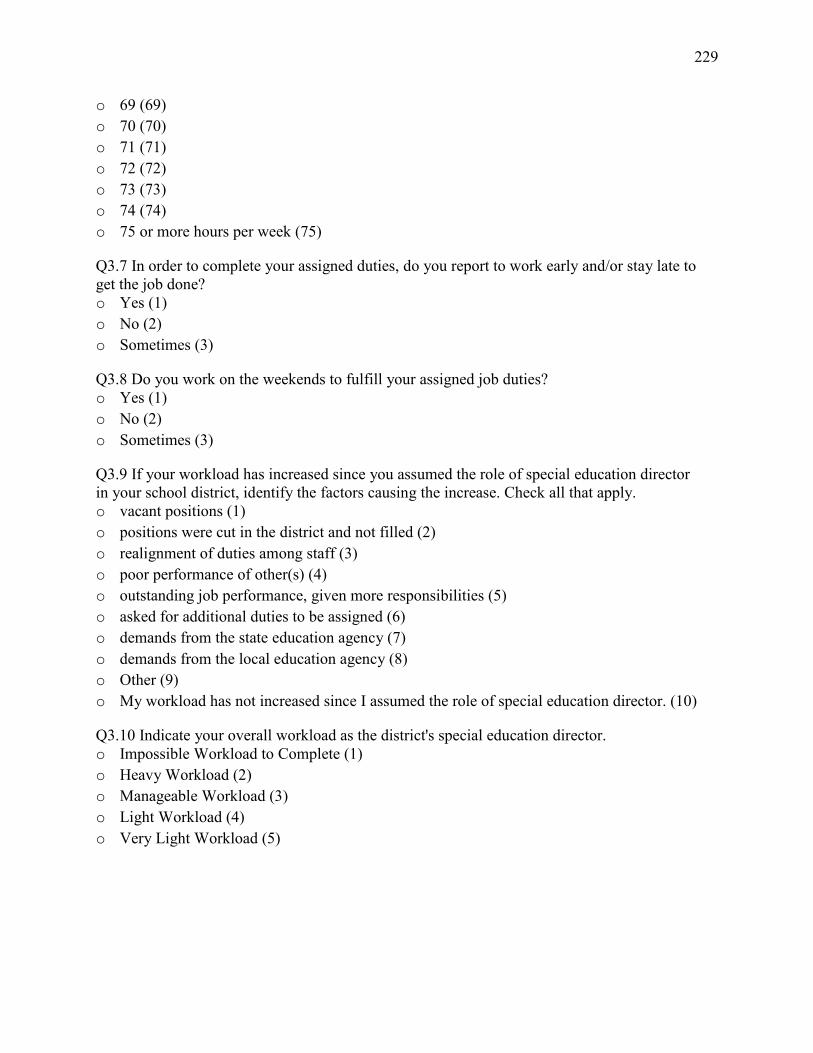
229
o 69 (69)
o 70 (70)
o 71 (71)
o 72 (72)
o 73 (73)
o 74 (74)
o 75 or more hours per week (75)
Q3.7 In order to complete your assigned duties, do you report to work early and/or stay late to
get the job done?
o Yes (1)
o No (2)
o Sometimes (3)
Q3.8 Do you work on the weekends to fulfill your assigned job duties?
o Yes (1)
o No (2)
o Sometimes (3)
Q3.9 If your workload has increased since you assumed the role of special education director
in your school district, identify the factors causing the increase. Check all that apply.
o vacant positions (1)
o positions were cut in the district and not filled (2)
o realignment of duties among staff (3)
o poor performance of other(s) (4)
o outstanding job performance, given more responsibilities (5)
o asked for additional duties to be assigned (6)
o demands from the state education agency (7)
o demands from the local education agency (8)
o Other (9)
o My workload has not increased since I assumed the role of special education director. (10)
Q3.10 Indicate your overall workload as the district's special education director.
o Impossible Workload to Complete (1)
o Heavy Workload (2)
o Manageable Workload (3)
o Light Workload (4)
o Very Light Workload (5)
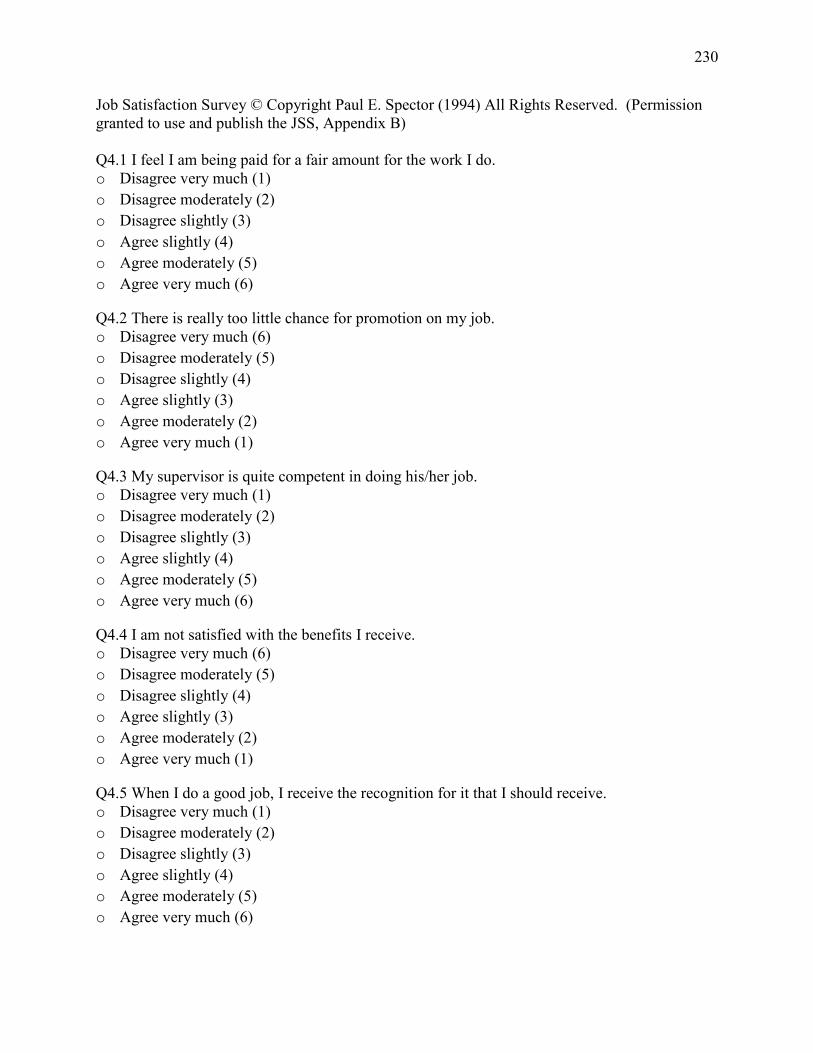
230
Job Satisfaction Survey © Copyright Paul E. Spector (1994) All Rights Reserved. (Permission
granted to use and publish the JSS, Appendix B)
Q4.1 I feel I am being paid for a fair amount for the work I do.
o Disagree very much (1)
o Disagree moderately (2)
o Disagree slightly (3)
o Agree slightly (4)
o Agree moderately (5)
o Agree very much (6)
Q4.2 There is really too little chance for promotion on my job.
o Disagree very much (6)
o Disagree moderately (5)
o Disagree slightly (4)
o Agree slightly (3)
o Agree moderately (2)
o Agree very much (1)
Q4.3 My supervisor is quite competent in doing his/her job.
o Disagree very much (1)
o Disagree moderately (2)
o Disagree slightly (3)
o Agree slightly (4)
o Agree moderately (5)
o Agree very much (6)
Q4.4 I am not satisfied with the benefits I receive.
o Disagree very much (6)
o Disagree moderately (5)
o Disagree slightly (4)
o Agree slightly (3)
o Agree moderately (2)
o Agree very much (1)
Q4.5 When I do a good job, I receive the recognition for it that I should receive.
o Disagree very much (1)
o Disagree moderately (2)
o Disagree slightly (3)
o Agree slightly (4)
o Agree moderately (5)
o Agree very much (6)
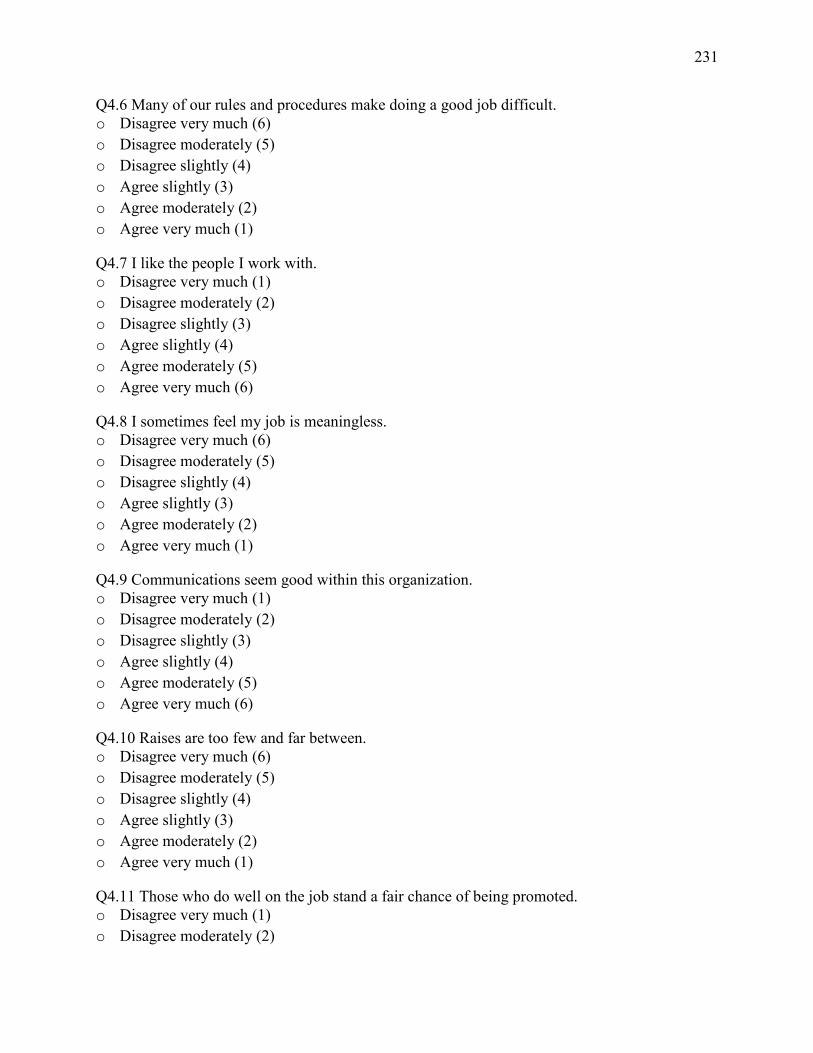
231
Q4.6 Many of our rules and procedures make doing a good job difficult.
o Disagree very much (6)
o Disagree moderately (5)
o Disagree slightly (4)
o Agree slightly (3)
o Agree moderately (2)
o Agree very much (1)
Q4.7 I like the people I work with.
o Disagree very much (1)
o Disagree moderately (2)
o Disagree slightly (3)
o Agree slightly (4)
o Agree moderately (5)
o Agree very much (6)
Q4.8 I sometimes feel my job is meaningless.
o Disagree very much (6)
o Disagree moderately (5)
o Disagree slightly (4)
o Agree slightly (3)
o Agree moderately (2)
o Agree very much (1)
Q4.9 Communications seem good within this organization.
o Disagree very much (1)
o Disagree moderately (2)
o Disagree slightly (3)
o Agree slightly (4)
o Agree moderately (5)
o Agree very much (6)
Q4.10 Raises are too few and far between.
o Disagree very much (6)
o Disagree moderately (5)
o Disagree slightly (4)
o Agree slightly (3)
o Agree moderately (2)
o Agree very much (1)
Q4.11 Those who do well on the job stand a fair chance of being promoted.
o Disagree very much (1)
o Disagree moderately (2)
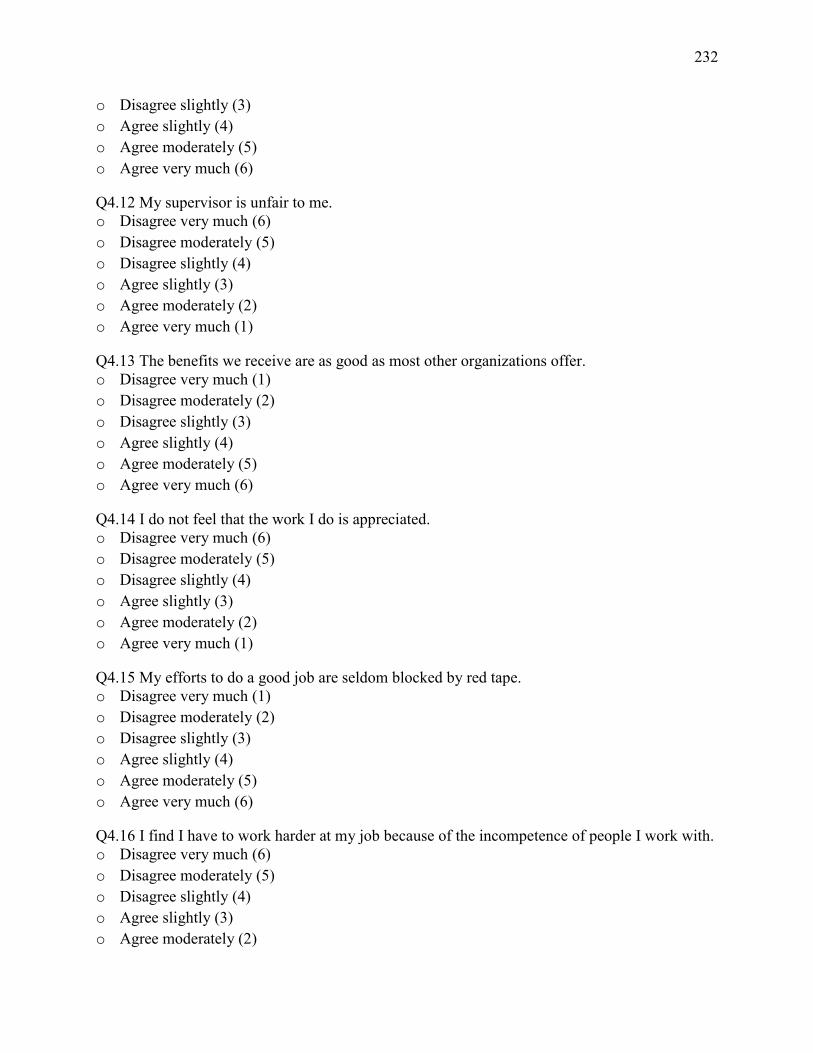
232
o Disagree slightly (3)
o Agree slightly (4)
o Agree moderately (5)
o Agree very much (6)
Q4.12 My supervisor is unfair to me.
o Disagree very much (6)
o Disagree moderately (5)
o Disagree slightly (4)
o Agree slightly (3)
o Agree moderately (2)
o Agree very much (1)
Q4.13 The benefits we receive are as good as most other organizations offer.
o Disagree very much (1)
o Disagree moderately (2)
o Disagree slightly (3)
o Agree slightly (4)
o Agree moderately (5)
o Agree very much (6)
Q4.14 I do not feel that the work I do is appreciated.
o Disagree very much (6)
o Disagree moderately (5)
o Disagree slightly (4)
o Agree slightly (3)
o Agree moderately (2)
o Agree very much (1)
Q4.15 My efforts to do a good job are seldom blocked by red tape.
o Disagree very much (1)
o Disagree moderately (2)
o Disagree slightly (3)
o Agree slightly (4)
o Agree moderately (5)
o Agree very much (6)
Q4.16 I find I have to work harder at my job because of the incompetence of people I work with.
o Disagree very much (6)
o Disagree moderately (5)
o Disagree slightly (4)
o Agree slightly (3)
o Agree moderately (2)
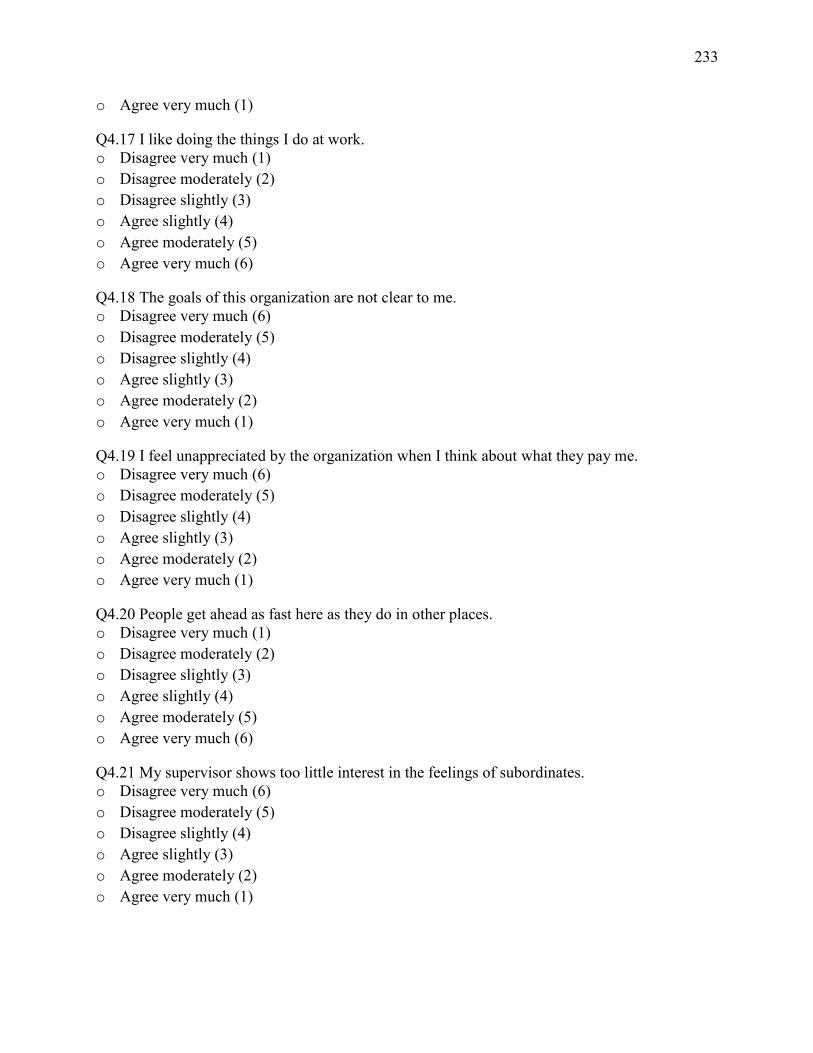
233
o Agree very much (1)
Q4.17 I like doing the things I do at work.
o Disagree very much (1)
o Disagree moderately (2)
o Disagree slightly (3)
o Agree slightly (4)
o Agree moderately (5)
o Agree very much (6)
Q4.18 The goals of this organization are not clear to me.
o Disagree very much (6)
o Disagree moderately (5)
o Disagree slightly (4)
o Agree slightly (3)
o Agree moderately (2)
o Agree very much (1)
Q4.19 I feel unappreciated by the organization when I think about what they pay me.
o Disagree very much (6)
o Disagree moderately (5)
o Disagree slightly (4)
o Agree slightly (3)
o Agree moderately (2)
o Agree very much (1)
Q4.20 People get ahead as fast here as they do in other places.
o Disagree very much (1)
o Disagree moderately (2)
o Disagree slightly (3)
o Agree slightly (4)
o Agree moderately (5)
o Agree very much (6)
Q4.21 My supervisor shows too little interest in the feelings of subordinates.
o Disagree very much (6)
o Disagree moderately (5)
o Disagree slightly (4)
o Agree slightly (3)
o Agree moderately (2)
o Agree very much (1)
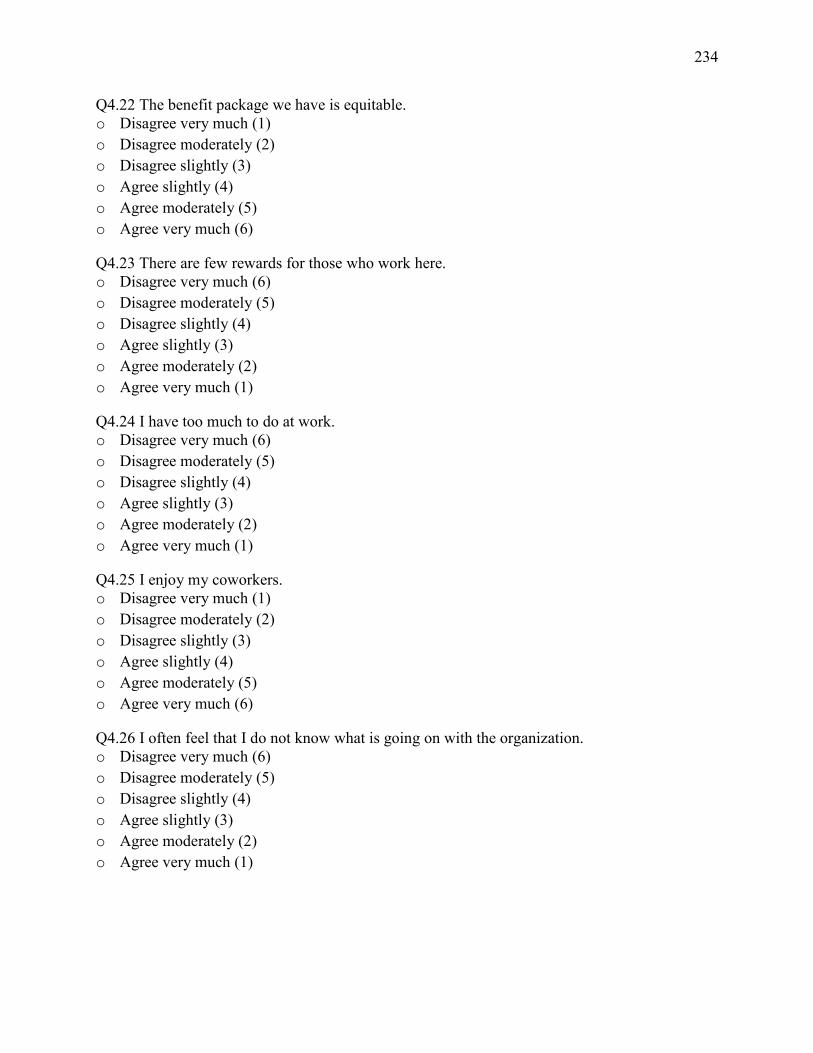
234
Q4.22 The benefit package we have is equitable.
o Disagree very much (1)
o Disagree moderately (2)
o Disagree slightly (3)
o Agree slightly (4)
o Agree moderately (5)
o Agree very much (6)
Q4.23 There are few rewards for those who work here.
o Disagree very much (6)
o Disagree moderately (5)
o Disagree slightly (4)
o Agree slightly (3)
o Agree moderately (2)
o Agree very much (1)
Q4.24 I have too much to do at work.
o Disagree very much (6)
o Disagree moderately (5)
o Disagree slightly (4)
o Agree slightly (3)
o Agree moderately (2)
o Agree very much (1)
Q4.25 I enjoy my coworkers.
o Disagree very much (1)
o Disagree moderately (2)
o Disagree slightly (3)
o Agree slightly (4)
o Agree moderately (5)
o Agree very much (6)
Q4.26 I often feel that I do not know what is going on with the organization.
o Disagree very much (6)
o Disagree moderately (5)
o Disagree slightly (4)
o Agree slightly (3)
o Agree moderately (2)
o Agree very much (1)
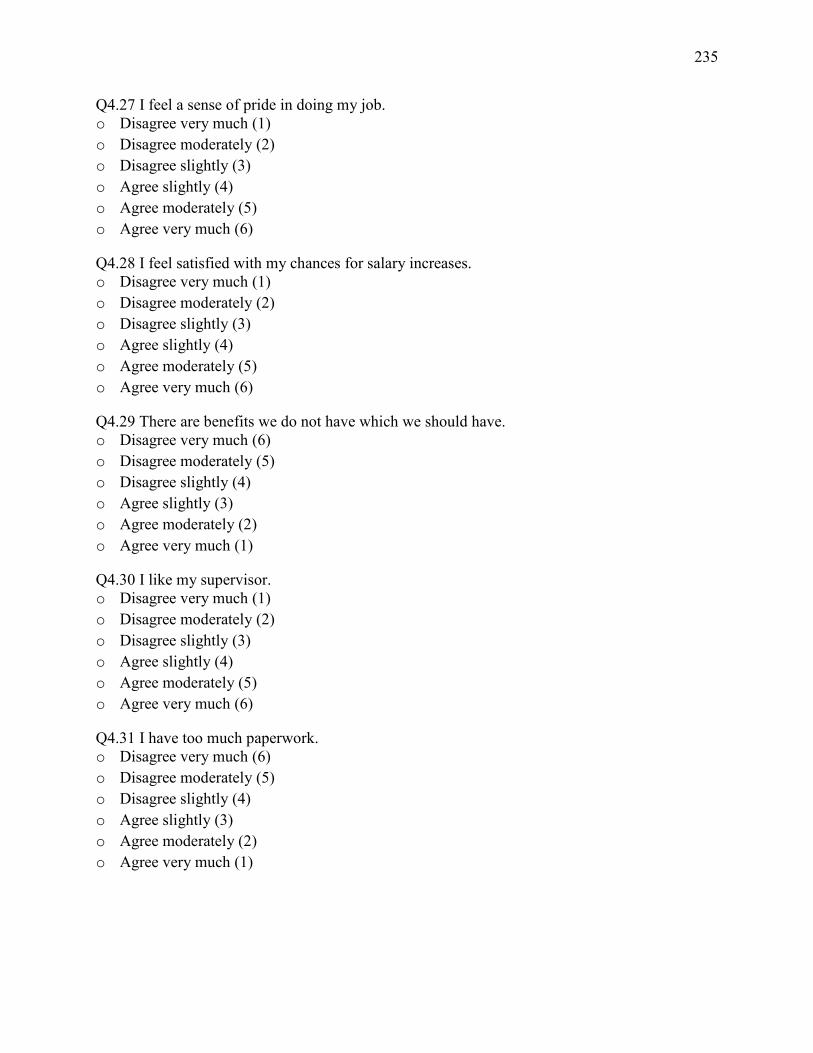
235
Q4.27 I feel a sense of pride in doing my job.
o Disagree very much (1)
o Disagree moderately (2)
o Disagree slightly (3)
o Agree slightly (4)
o Agree moderately (5)
o Agree very much (6)
Q4.28 I feel satisfied with my chances for salary increases.
o Disagree very much (1)
o Disagree moderately (2)
o Disagree slightly (3)
o Agree slightly (4)
o Agree moderately (5)
o Agree very much (6)
Q4.29 There are benefits we do not have which we should have.
o Disagree very much (6)
o Disagree moderately (5)
o Disagree slightly (4)
o Agree slightly (3)
o Agree moderately (2)
o Agree very much (1)
Q4.30 I like my supervisor.
o Disagree very much (1)
o Disagree moderately (2)
o Disagree slightly (3)
o Agree slightly (4)
o Agree moderately (5)
o Agree very much (6)
Q4.31 I have too much paperwork.
o Disagree very much (6)
o Disagree moderately (5)
o Disagree slightly (4)
o Agree slightly (3)
o Agree moderately (2)
o Agree very much (1)
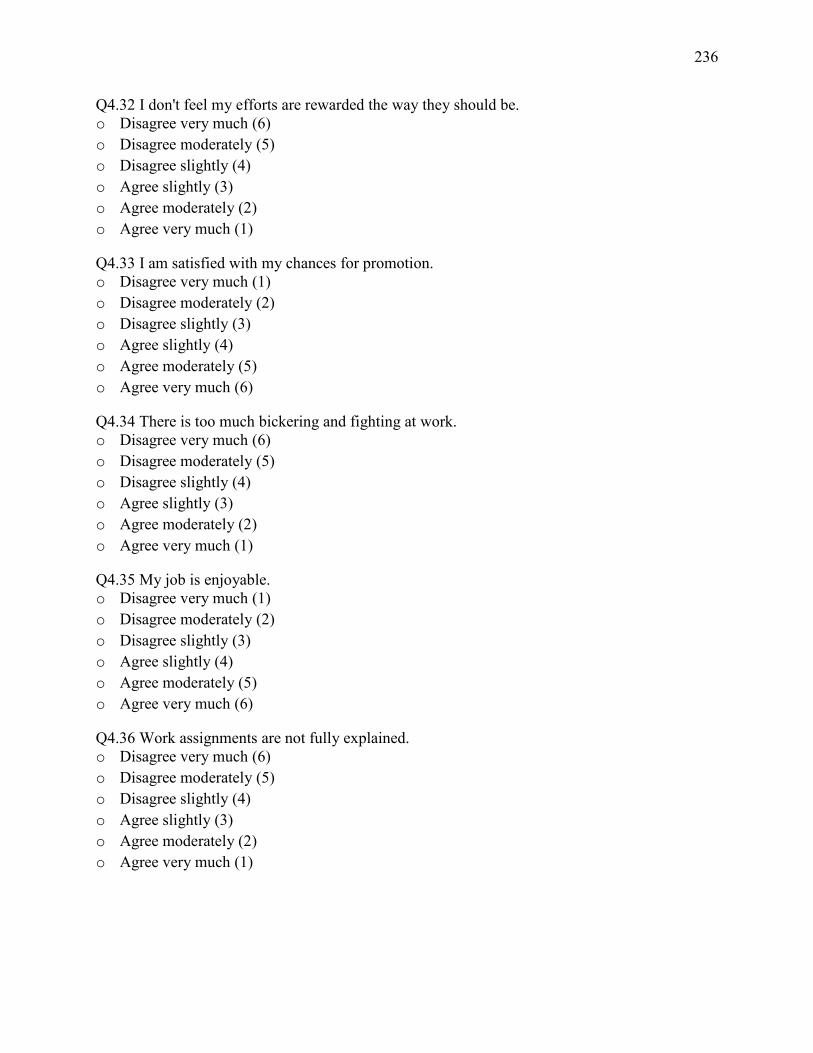
236
Q4.32 I don't feel my efforts are rewarded the way they should be.
o Disagree very much (6)
o Disagree moderately (5)
o Disagree slightly (4)
o Agree slightly (3)
o Agree moderately (2)
o Agree very much (1)
Q4.33 I am satisfied with my chances for promotion.
o Disagree very much (1)
o Disagree moderately (2)
o Disagree slightly (3)
o Agree slightly (4)
o Agree moderately (5)
o Agree very much (6)
Q4.34 There is too much bickering and fighting at work.
o Disagree very much (6)
o Disagree moderately (5)
o Disagree slightly (4)
o Agree slightly (3)
o Agree moderately (2)
o Agree very much (1)
Q4.35 My job is enjoyable.
o Disagree very much (1)
o Disagree moderately (2)
o Disagree slightly (3)
o Agree slightly (4)
o Agree moderately (5)
o Agree very much (6)
Q4.36 Work assignments are not fully explained.
o Disagree very much (6)
o Disagree moderately (5)
o Disagree slightly (4)
o Agree slightly (3)
o Agree moderately (2)
o Agree very much (1)

237
Open Ended Questions:
Q5.1 Describe the areas of greatest satisfaction in your role as district special education director.
Q5.2 Describe the areas of greatest dissatisfaction in your role as district special education
director.
Q5.3 What supports, if any, are needed to improve the job satisfaction of North Carolina's
special education directors?

238
Appendix E
Open-Ended Question One: Describe the areas of greatest satisfaction in your role as district
special education director.
(N=78)
1. Staff growth and development, academic growth and development of students, personal
growth and development.
2. Working with teachers, meeting parents, seeing growth in students....
3. Ensuring that we remain in compliance with the law; helping teachers to help students.
4. I love the areas of strategic planning for program improvement, working directly with
teachers and staff on program initiatives, observing classrooms and working cooperatively
with other Central Office administrators on district-wide initiatives.
5. Love working with special education staff / Love seeing the growth and progress of children.
6. When others, parents, teachers, or community members, express appreciation for the efforts
made to help student overcome challenges and be successful.
7. The children making progress. Seeing appropriate learning environments and services
provided to the children in my district ....and seeing the students grow.
8. Student growth in behavior and academics. / -Increase in competence and confidence in my
staff. / -Task completion, which include timely submission to DPI. / /
9. I enjoy working with my EC Team.
10. Aligning appropriate instructional supports to students' needs. Interacting with students,
parents and school personnel. Attempting to instill passion into the practice of service
delivery. Engaging in strategic planning with other district leaders. Observing instances of
improved student outcomes as a result of changes in practice, training, etc.
11. Rewarding, enjoy coworkers, enjoy problems solving, feeling supported by superiors.
12. I have excellent, dedicated staff members who always have the best interest of the students as
their priority. / Staff members express to me that they are supported and appreciated.
13. When teachers, parents and administrators collaborate to assist students to be successful.

239
14. Student accomplishments and improvement.
15. My greatest satisfaction is improving the quality of instruction and the outcomes for students
with disabilities. I also enjoy breaking down the barriers for students and collaborating with
other staff to make sure all students are achieving. However, the real perk of this job is
working with teachers and staff who are so passionate about helping students overcome their
challenges. The best people tend to go into Special Education. They are incredibly
generous. I feel honored to be able to support them in their mission to help students and
their families.
16. Watching the children excel and progress throughout the school year. I enjoy working and
supporting our principals and staff.
17. What brings me the most satisfaction is when EC teachers share their appreciation for my
efforts and how initiatives or things that I have put into place are making a difference in their
students' learning progress.
18. Beginning new programs that show student growth
19. Working directly with EC teachers, EC staff and EC students / Brainstorming solutions and
noting positive outcomes to documented concerns and problems / Student success
20. My greatest satisfaction comes from the success of the students. I love the way I get to
follow the career of the students throughout their school career. I do not miss a graduation
ceremony so that I can see the pride they have as well as their parents. I still love the simple
a-ha moments of a classroom. I love visiting the schools and the students know me and share
their stories with me. I love to see the excitement in the classroom.
21. I am very satisfied with my role as special education director. I like being the Pre-School
coordinator as well. It gives me great satisfaction to work with children and families,
providing them with the services that they need. I feel like my work is worthwhile. I am
doing a great service.
22. Actually being the catalyst to make a difference for our hardest to serve children and
providing the resources for staff to make their jobs easier.
23. I enjoy working with the EC staff. I feel I make a positive contribution to the lives of the
students. I get along well with my coworkers. I have good support from regional and state
consultants. I have a strong network of support from other directors. I get along well with my
supervisor and respect him as a friend and as an educator.
24. Meeting the needs of the students.
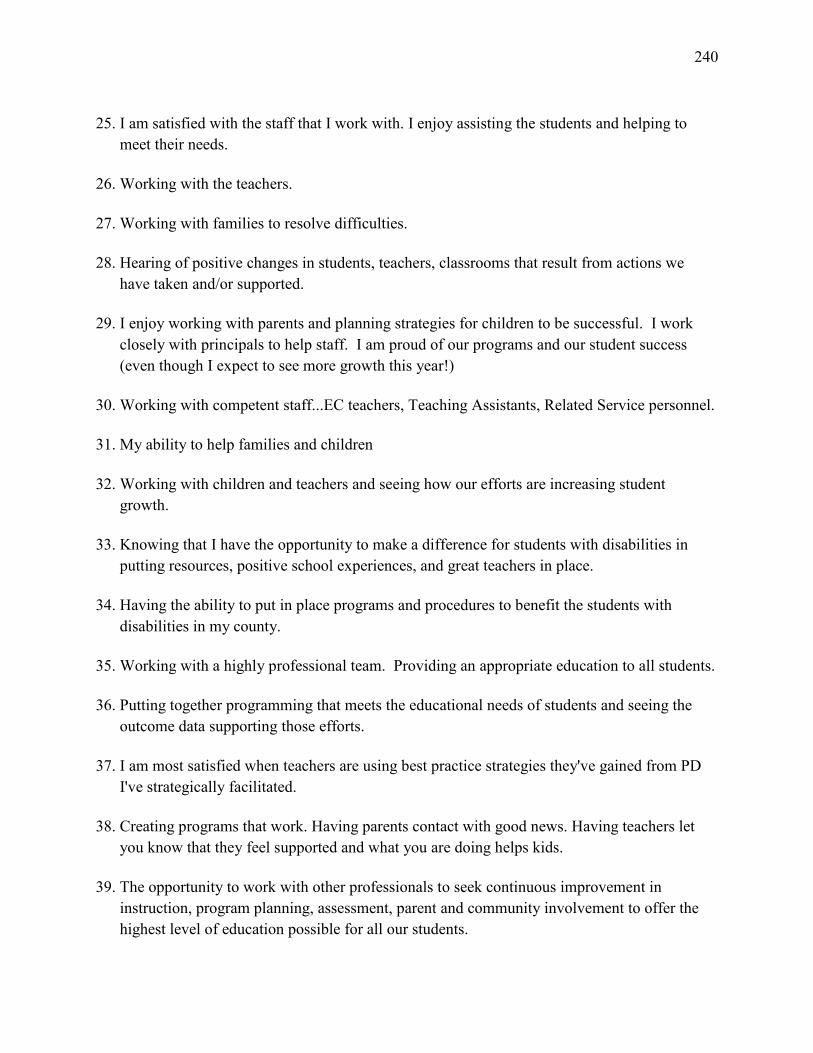
240
25. I am satisfied with the staff that I work with. I enjoy assisting the students and helping to
meet their needs.
26. Working with the teachers.
27. Working with families to resolve difficulties.
28. Hearing of positive changes in students, teachers, classrooms that result from actions we
have taken and/or supported.
29. I enjoy working with parents and planning strategies for children to be successful. I work
closely with principals to help staff. I am proud of our programs and our student success
(even though I expect to see more growth this year!)
30. Working with competent staff...EC teachers, Teaching Assistants, Related Service personnel.
31. My ability to help families and children
32. Working with children and teachers and seeing how our efforts are increasing student
growth.
33. Knowing that I have the opportunity to make a difference for students with disabilities in
putting resources, positive school experiences, and great teachers in place.
34. Having the ability to put in place programs and procedures to benefit the students with
disabilities in my county.
35. Working with a highly professional team. Providing an appropriate education to all students.
36. Putting together programming that meets the educational needs of students and seeing the
outcome data supporting those efforts.
37. I am most satisfied when teachers are using best practice strategies they've gained from PD
I've strategically facilitated.
38. Creating programs that work. Having parents contact with good news. Having teachers let
you know that they feel supported and what you are doing helps kids.
39. The opportunity to work with other professionals to seek continuous improvement in
instruction, program planning, assessment, parent and community involvement to offer the
highest level of education possible for all our students.
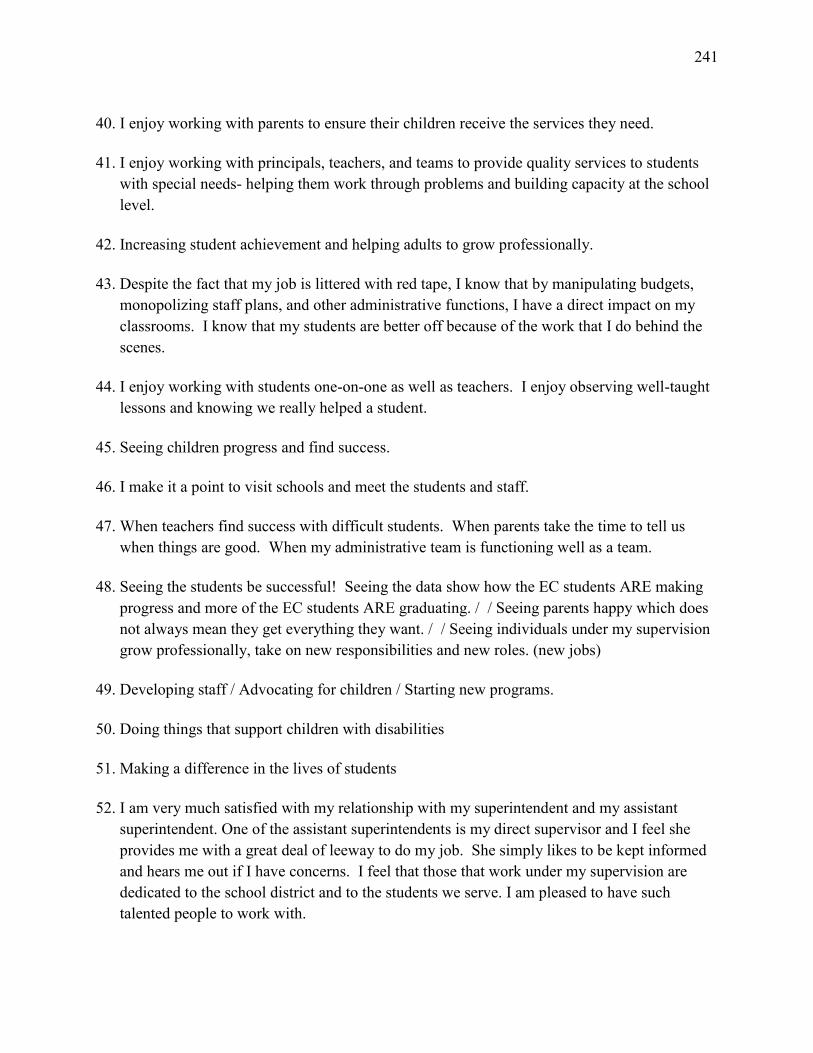
241
40. I enjoy working with parents to ensure their children receive the services they need.
41. I enjoy working with principals, teachers, and teams to provide quality services to students
with special needs- helping them work through problems and building capacity at the school
level.
42. Increasing student achievement and helping adults to grow professionally.
43. Despite the fact that my job is littered with red tape, I know that by manipulating budgets,
monopolizing staff plans, and other administrative functions, I have a direct impact on my
classrooms. I know that my students are better off because of the work that I do behind the
scenes.
44. I enjoy working with students one-on-one as well as teachers. I enjoy observing well-taught
lessons and knowing we really helped a student.
45. Seeing children progress and find success.
46. I make it a point to visit schools and meet the students and staff.
47. When teachers find success with difficult students. When parents take the time to tell us
when things are good. When my administrative team is functioning well as a team.
48. Seeing the students be successful! Seeing the data show how the EC students ARE making
progress and more of the EC students ARE graduating. / / Seeing parents happy which does
not always mean they get everything they want. / / Seeing individuals under my supervision
grow professionally, take on new responsibilities and new roles. (new jobs)
49. Developing staff / Advocating for children / Starting new programs.
50. Doing things that support children with disabilities
51. Making a difference in the lives of students
52. I am very much satisfied with my relationship with my superintendent and my assistant
superintendent. One of the assistant superintendents is my direct supervisor and I feel she
provides me with a great deal of leeway to do my job. She simply likes to be kept informed
and hears me out if I have concerns. I feel that those that work under my supervision are
dedicated to the school district and to the students we serve. I am pleased to have such
talented people to work with.
242
53. I went to school to be a special educator, so I find great joy in being able to assist teachers,
parents, and students in determining best services for students with disabilities. I know the
population that I work with and now that I am a parent I have a new perspective to add to the
table that was not there before.
54. Seeing the students become successful and feel good about themselves. Seeing the teachers
with the "Whatever it takes attitude" making school and enjoyable and inviting place for the
students.
55. The ability to lead and define and accomplish vision and direction and to positively impact
decisions, services and programs for students! I love being the ONE who is the go-to person.
The fact that I can influence programs and services is awesome. I also enjoy being in a
position to influence thinking and beliefs regarding students with disabilities in my district. I
also enjoy the problem-solving aspect of the work. Things are fast-paced and never boring
and there are always opportunities to learn and grow as a leader. I value being in charge and
being allowed to do so, for the most part. My work is entrusted to me as a professional with
limited distractions or interference from those above. They trust me, and I am appreciative of
that. I also appreciate having the support from above.
56. seeing the differences made for students; working with amazing staff
57. I enjoy watching the growth of my students in their core area subjects. / I enjoy doing
observations in exceptional classrooms. /
58. Knowing that building a good EC Team is making a difference in our system ... data driven
decisions and results of our efforts. / Making a positive impact on the community as a whole.
/ Problem solving with IEP Teams who are having difficulties with
parents/teachers/situations etc. and resolving issues.
59. *Working with the students in the district and seeing the 'ah ha' moments when they finally
grasp a different strategy or technique. / *Looking at data reports and seeing the growth of
our students.
60. When my students are growing and my teachers are happy. When programs have adequate
supplies and curriculum needs to address the needs of the students being served. When all
positions are filled with highly qualified staff.
61. Parent involvement / student success / providing resources for EC teachers.
62. Seeing the students graduate. / Smiles on the faces of parents and students when they reach a
milestone / Great collaboration between other directors /
243
63. When we are able to build appropriate services for students.
64. Provision of effective services for our students. / Ability to write and get funding for grants
to enhance our programs. / Ability to make decisions and get support for these decisions,
most of the time. / Working with EC teachers and helping them grow as professionals.
65. Completing an interim position allows me to work more freely. In my previous position it
was having time to work on curriculum issues.
66. The greatest satisfaction is implementing programming that positively impacts students with
disabilities. I enjoy the continuous improvement opportunities that are presented. I enjoy
identifying a need/problem, analyzing the situation with a group of stakeholders, developing
solutions/resolutions and monitoring the situation to determine if problem has been resolved.
67. Helping teachers develop plans to support children.
68. Developing programs and finding services that help students receive what they need to be
successful. / Collaborating to develop strong comprehensive services / Empowering teachers
to become better at their craft
69. Being able to assist staff with strategies to ensure student growth and learning.
70. My greatest area of satisfaction is helping parents when they feel like no one else cares.
71. The success of students with disabilities, academically and functionally.
72. Seeing Increased student performance.
73. Helping students with disabilities succeed academically.
74. The mission!!!!!!!!!! / departmental collaboration / our CIPP ratings from DPI / my
staff!!!!!!!!! / accessibility to the schools / support of the boss, Superintendent and school
board
75. Knowing that I make a difference in the lives of students, staff and parents.
76. I have a supportive and informed team. Each person is capable and performs their respective
jobs well. Overall, our EC teachers try to do the right thing for our children.
77. The greatest satisfaction in my role as a district special education director thus far has been
that of seeing growth and development of the EC teaching staff here in the district. This is
the greatest factor impacting higher achievement for our EC students.

244
78. Collaboration with principals, teachers, and parents.
245
Appendix F
Open Ended Question Two: Describe the areas of greatest dissatisfaction in your role as district
special education director.
(N=74)
1. Communication among staff at all times.
2. Compliance issues; unable to provide things parents want but don’t need.
3. Trying to solve endless monumental problems.
4. The areas that are most difficult are: trying to meet all the needs of our students with a finite
amount of financial resources, having to fit what we would like to do within the confines of
state regulations or guidelines, and having to work with attention to local small town politics.
5. Too time demanding with paperwork, reports, grant applications, meetings, etc.
6. Dealing with difficult individuals including parents and education staff.
7. Paperwork and legal issues.
8. 1. The limitations placed on the provision of services to students in need by required rules
and regulations and the mountains of paperwork required to make those services available.
2. In the last few years, financial limitations have caused great dissatisfaction as I try to
provide services especially related services with minimal budget. 3. Limited availability of
certified teachers in rural areas such as mine. One school had gone four months with only a
substitute teacher.
9. Superintendent and Assistant Superintendents do not seem to get involved at all in special
education.
10. Being forced into reactive decision making due to actions or non-actions of others.
Challenges of retaining high quality personnel without the ability to compensate them
differently.
11. Scarcity dilemma: unlimited demands for services, limited supply of funds.
12. The constant threat of lawsuits and parental complaints are the greatest areas of
dissatisfaction. Additionally, while most of my staff members are GREAT, there seems to
always be some kind of conflict to address.
13. Lack of inclusion with other directors concerning system wide initiatives (especially in
curriculum)
14. Focus of accountability on compliance.

246
15. I lose the most sleep when I have to deal with angry parents who think that money is no
object and that all of their demands should be satisfied. I actually had a parent this week who
demanded that we have two adults with her child at all times. / Each year about three or four
parents harass our staff so much that good teachers leave the profession. Yesterday I had a
parent demand to have 72 hours written notice any time a chemical or dust was present in a
school of 1,000 students because her daughter might get a headache. / Parents threaten us
with legal action when it is clear that the school staff has gone above and beyond the call of
duty to provide for their child and their child is having the most successful year of their
academic career. We have a lot of talented parent advocates who add to IEP Team meetings,
but then we have some who have never spent a day in a classroom and who try to create a
wedge between the parent and the faculty. If I ever left my job early, it would be because of
the way parents and advocates treat our teachers.
16. It would have to be not getting the credit I deserve for all of the work I do!
17. The demands of reports that take so much time to complete for the little bits of funds that we
receive at the state level. The amount of work that is required just to receive and continue to
receive small $10,000 funds is burdensome, but in this day and time, we need funds so badly,
that we must do it. / / There is never enough time to focus on curriculum and instruction.
Petty things seem to always get in the way, but require my attention (paperwork). / /
Medicaid is a funding source that is so badly needed by my district, but the amount of work it
entails to try to maintain compliance makes me almost question whether to continue as a fee
for service provider.
18. No raise in seven years.
19. Paperwork overload / Not feeling that I have enough time to address all areas of need and
devote time to improvements.
20. Dealing with discipline issues is my least favorite part of my job. I feel as if sometimes the
principals see me as a “Pollyanna” who does not see the pressing issues of safety or the
student not wanting to comply. I get frustrated with people who do not do their job and then
want to complain that no one helps them. I want people to step up to the plate. We cannot
pick and choose who walks through our door.
21. I have worked in this district for 4 ½ years and have received a raise. I have recently been
assigned a new program and I have been told that I will not receive additional pay. I have
spent a great deal of money educating myself to be the best EC Director I can, but how will I
pay back student loans if I get no raises? I am currently working on a doctorate degree. The
job of an EC Director requires many skills and a vast amount of knowledge. We should be
compensated better for the work we do. I believe that I am one of the higher paid directors
because I came from a principalship, but all directors should be paid like other central office
administrators.

247
22. Parents with lawyers, parents I don’t mind, and many are unrealistic in terms of what can
actually be done, even though the expectation is that we can do it all.
23. I feel as though there is no opportunity for advancement within the organization. I feel there
is little chance I will be able to increase my salary, no matter how hard I work or how well I
do my job. I feel as though the underlying political influences which shape our
organization’s framework reward only a select few.
24. Working with the finance director who does not understand the EC programs and policies.
25. Not being able to provide all of the supplies that are needed to classrooms and having to deal
with complaints.
26. Dealing with unhappy parents and administrators that do not like the EC policies.
27. Pay
28. Inability to spend enough time in any one area to make progress – program compliance vs.
curriculum and instruction vs. personnel recruitment and retainment vs. budget management.
29. Coming into a new job I have had no support in working on the budget. I am inundated with
people issues and am pressed to keep up with paperwork and reports. Two people in my
office were not replaced when I took the job, so I feel that I am doing the work of three. I
have had difficulty finding those good people to work for me. I have hired teachers that have
taken the Praxis to teach special ed that have no idea about paperwork and little knowledge
of strategies to help our special needs students.
30. Too much paperwork from DPI and the Feds. Too many procedural requirements that bog
down teaching and working with students. / / Principals who will circumvent and block the
EC process, both with procedures and with instruction. / / Principals who force Child Study
Teams to refer a student(s) to special education for a formal evaluation. / / The policy and
procedural requirements never lessen; they grow like kudzu vines.
31. Too many roles.
32. Paperwork
33. Not enough time to adequately address what I need to. Feeling like I’m pulled in so many
different directions most days. Dealing with unhappy parents who often have unrealistic
expectations from public schools.
34. Lack of administrator follow up with special education teachers at the school level when the
teacher is not completing the required paperwork in a compliant manner or on time; too
many responsibilities compared to my monthly pay; lack of support from district supervisor;
lack of clarity from departments in the district office, such as Human Resources, in their
248
policies/procedures; not enough local fiscal support for EC program to provide all the needs
of the department.
35. The lack of training by the state for new directors.
36. Unclear direction from DPI, lack of support from DPI in terms of deadlines not being
communicated in a timely fashion, information requested from DPI always seems to be a
surprise.
37. I am fully satisfied in my direct supervisor, the Assistant Superintendent. However, the lack
of communication and micro-management of the Superintendent is a hindrance to providing
services to students.
38. Compliance – both paperwork and paying penalties for things that are not all within control
of the special education department / Personnel – having teachers and assistants who don’t
want to do the work needed to be good / Unclear state and federal expectations.
39. NC IEP forms require far too much narrative causing continuous training for teachers to meet
all the wording demands and avoid non-compliance issues. My time would be better spent
focusing on instructional strategies; the teacher time needed to write IEPs would be better
spent teaching and planning for teaching students.
40. The paperwork is sometimes overwhelming.
41. Like others in a small district I wear so many hats that it is impossible to do anything well. I
have to focus more on compliance and deadlines in all programs.
42. The lack of definition and clarification on guidelines when asking DPI staff for guidance and
support. It is frustrating trying to find answers.
43. My salary. I make just a small amount more than a 12 month assistant principal. I have had
others tell me they would not do this job for what I make. I love my job, I love what I can
make happen in my classrooms, but I may have to look elsewhere so that I can better provide
for my family.
44. The district does not prioritize in the best interest of the students. Some of the students are
treated unfairly by teachers and principals by putting the needs of the adults first.
45. Dealing with personnel issues and people not doing their job.
46. The paperwork that the teachers have to do. There should be a way to streamline the
paperwork and cover all legalities without taking services away from the students. IEP
meetings should be done when the parent can attend, if it be before, during, or after school,
and we should do our best to accommodate them because we serve their children.
249
47. Lack of communication with higher ups. No sense of team with administrative cabinet. Too
much stress – too many demands and deadlines that are connected to others getting
something done or responding. High parent demand and bullying. Prinicipals and school
staff not following prescribed procedures.
48. Dealing with difficult parents!! It is okay to advocate for your child but to be difficult
because you can or because you have money and will lawyer up creates dissatisfaction for
me. / / IEP meetings that go on for six hours. / / Great special education teachers are leaving
teaching because of paperwork and large caseloads.
49. Things given to us by DPI to do / Dealing with unreasonable parents
50. Dealing with resistant regular education staff and administration
51. Many decisions that seem to be driven by what adults desire as the outcomes rather than what
really needs to happen for a student.
52. There are several things that concern me as a new EC director. One is the way that I feel at
the state level, there is a lack of communication between departments. It seems decisions are
made concerning issues that greatly affect EC departments and yet other departments are not
including the DPI EC department. I feel as though I often get memo after memo about what
we should be doing. I can’t imagine how much I would be working if I were to be doing
everything as perfectly as the memos dictate. I am holding my head above water. I feel the
amount of time spent on personnel is greater than it should be. I do feel there is little
recognition for what EC directors do but then again, we don’t hold a monopoly on that.
53. I am totally frustrated with the fact that special education is seen as a stand alone program
financially. If we truly feel that special education students are general education students
first, then it should be mandated that we are given resources above and beyond the special
education budget to meet the needs of our students. Additionally, there is a huge difference
between special education and mental health, but people do not know how to separate the
two. Therefore, anyone with a mental health issue is assumed to need special education. The
roles of special education director and student services director are very murky in public
education at this time. It’s time to filter the water again!
54. The paperwork and nitpicky rules of how we must write things on the paperwork often get in
the way of teaching our students and is the reason I see so many teachers becoming
dissatisfied and leaving the profession.
55. Greatest dissatisfaction comes from an HR standpoint – having to work with and keep
individuals who are not in the right seats on the bus – all the red tape involved in removing
people who are incompetent or not in the right spots and the impact of that on students and
learning and departmental growth. We are also working on linking our department with
other departments in the district – to continue to grow the belief that EC is an integral part of
all other departments. The challenges are there, but the doors are open for progress.

250
56. Legal issues or state complaints; feeling like I have to fight principals and others to do the
right things.
57. Dealing with due process hearings, OCR, and state complaints
58. Inability to stay ahead of the problems that arise – constantly putting out fires! / Being part of
a system that has no REAL Strategic Plan…on paper yes, in action NO! / Working with an
immediate supervisor that does NOT understand RtI and EC and their critical relationship to
each other! TOO much site based decision making and NOT enough procedures/processes
system wide…kids getting lost in the shuffle from school to school in this system! /
59. The extra amount of work outside of the arena of exceptional children.
60. When everyone wants something right now and the state requires documentation that is two
years old on an annual basis.
61. Lack of funding / unnecessary paperwork / incompetence of other staff
62. The biggest issue is that it seems that the last few years, I have little support of my efforts
and too much listening of others complain by my supervisor. My recent growth plan was
unfair, even though I took ownership of it.
63. Paperwork / Parents who do not take responsibility for their children. / Help that is not
provided by mental health agencies / Lack of funding for appropriate staffing / Having to
correct mistakes with parents and others made at the school level.
64. I have no complaints at this interim position. In my previous position it was finding a place
at the table. We have to work harder before our expertise is recognized.
65. Coordinating a program that requires a substantially larger budget to provide appropriate
services to all children. Providing a make shift continuum based on staffing and budget.
66. Being asked to meet unrealistic demands by parents, other administrators, and the community
/ Having less community resources, particularly in the area of mental health / Less funding
and students with greater physical, emotional, and behavioral needs
67. The pay. I feel we deserve more for our dedication to our students.
68. The special education director is asked to do a lot, but funding keeps being cut. There is little
to no support from the district. Being EC Director is a very thankless job in my district.
69. How to provide quality services with limited funds
70. Blocks to services for children
71. Budget shortfall / loss of local positions
251
72. Way too much paperwork/documentation to fulfill federal and state expectations and
requirements.
73. Feeling blamed for special education subgroups of children hindering schools from reaching
AYP. Also, not knowing where the boundaries are for my interactions with EC teachers and
assistants in reference to job performance – is it my responsibility to address or the individual
school’s administration? Each school seems to want something different.
74. The greatest dissatisfaction in my role as district special education director is having so many
other duties and responsibilities assigned to me. I am willing to be a team player and realize
we all have other assigned duties, but I would have preferred there be a closer look at the
enormity of each duty assigned such that heavier roles could have been spread among others
as opposed to placing multiple heavy program responsibilities on one person because he/she
has the capability to do the job.
252
Appendix G
Open-Ended Question Three: What supports, if any, are needed to improve the job satisfaction of
North Carolina’s special education directors?
(N=68)
1. Additional pay, additional support staff
2. I think that NC special education directors are truly supported adequately by our state
department of instruction. The EC Division at NCDPI is always responsive to questions,
works with us when we have conflicts or concerns, and does all they can to support special
education directors, teachers, and students. / / In all the districts I have worked with though,
there has been the need for other parts of the district – general education, principals,
superintendents, and executive staff, etc. – to fully realize that special education needs to be
part of everything that is going on in the district. Oftentimes, special education tends to work
in isolation or be left out of major decisions that will affect our students. We need to be at
the table.
3. Limit the amount of additional responsibilities that are being placed on special ed directors
during these hard economic times. The individual before me did special ed and 504. I do
that and Testing and Accountability, RttT Lead, Alternative Education, RtI Lead…This
really is difficult given the complexity involved in the Exceptional Children Program.
4. Better benefits and pay
5. Appreciation and recognition of the EC Department
6. I’m too new to the position to know at this point.
7. No one in education is paid what they are worth, but the lack of raises over the past few years
has really hurt everyone. In general, I do not think the role of special education director is
viewed as equitably for administrative openings at higher levels (assistant superintendent)
compared to other administrative positions (principal, curriculum director).
8. Our state leaders provide us with lots of support through additional staff development
activities and funding for high needs students. Our state leaders could not be more
supportive.
9. Parity of directors in the central office / state level collaboration that trickles down to districts
10. Resources more focused on professional development for student improvement in core
content/skills and school skills.
11. The new EC Directors Institute is by far the most important support for new EC Directors.
this two-year training teaches new directors the skills needed to do the job and provides a

253
support network of experienced and new directors to reach out to in difficult situations.
NCDPI does an amazing job in supporting the LEA EC Directors in all facets of the job. It is
a very stressful job unless you realize that if you have 4 angry and threatening parents out of
1,200 parents that you really have greater than 99% customer satisfaction. You have to get
out in the classrooms to be with the kids and your staff in order to keep your focus on what is
important. Staying in the office working on budgets, submitting reports, and handling parent
complaints can make you old before your time. / An updated Q and A for directors to access
would help when staff asks unique questions. The policy and procedures manual is
sometimes difficult to navigate.
12. Recognition…supplements to stay in the position.
13. We need more support at the local level in the way of funds so that we can have the
personnel that we need to oversee all of the initiatives that we need and want to do to
improve programming for our schools. The workload just keeps multiplying but we have the
same number of staff members at the CO, or less than 10 years ago to do twice the work!
14. More staff / All regular education to acknowledge special education students are regular
education first.
15. I would be more satisfied if the state government would stop decreasing the education budget
and stop attacking the health care of the state employees.
16. We need guaranteed professional development, policies, and laws changes, and we have to
stay abreast. I should not have to hope and pray that my county will not be so broke that they
will have to use all EC funds to pay personnel costs.
17. Higher pay schedule since our job is one of a kind and less paperwork. I understand the
rationale for writing grants and what have you, but there has just got to be an easier and
better way to serve the needs of our students.
18. I feel the supports are adequate within the region and the state. I have always felt supported
in this role.
19. Helping other departments understand the importance of the special education program.
20. More funds, less paperwork
21. More training
22. DPI provides excellent support in all areas. More clarity on state assessments would help.
23. I think the state needs to support the provision of more curriculum support personnel for the
regions, as these roles are the most difficult to maintain at the local level. The compliance
and reporting happens and is prioritized because it has to be, as does the budgetary piece –
254
the curriculum and programming role gets slighted and we will never make the longstanding
gains with SWD that we need to make if we continue in this manner.
24. Less paperwork would be nice. Better planning or explanation of the workshops offered. I
have seen one presentation three times now (district level, region, and state).
25. North Carolina Department of Public Instruction Exceptional Children Division should
follow the legal requirements of IDEA and stop creating “policy”. These policies have
created massive paperwork requirements and keep expanding. These policies have created
an incredible number of legal and procedural problems for LEAs that are burdensome, costly,
and always slanted toward parents and advocates. It’s as if the EC Directors working daily in
the LEA are ignored and seldom, if ever, truly consulted and listened to.
26. Let us be EC Directors and not everything else.
27. Simplified paperwork…it needs to be condensed. There is a great deal of repetition.
28. More time, money, and less paperwork.
29. A yearly cohort for new directors.
30. The collaboration/communication from DPI needs to be cleaned up.
31. Regional Consultants who are on the ground and knowledgeable of the day-to-day needs.
32. Look at the budget structures to create a fairer way to fund special education.
33. An increase in state funding per student so directors are not constantly squeezing lemons to
make ends meet would help. Paperwork required for the very limited 82 and 118 funds is out
of control. Special grants have rubrics that create unequal distribution, even for like student
needs. Also, state funding for directors to attend national conferences every few years would
expand professional perspective and offer some personal satisfaction. Asking to use district
funds for this purpose would feel like taking something away from our children.
34. Less paperwork or one system that includes all of the reporting.
35. The support I have received from my colleagues and regional supports are invaluable. Some
kind of new director’s training should be offered every year and required. (I came on in a
year training wasn’t offered and then my superintendent did not permit me to attend the
training my second year because I was already “experienced” by then…). I would also like
to see a Directors Institute in August or the very beginning of the year, rather than just in the
spring.
36. Pay increases would be greatly appreciated.
255
37. We need a separate pay scale. EC Data Managers were given their own scale several years
ago because the duties of their job exceed the typical pay scale. We need our own pay scale
with a guiding chart for years of experience.
38. As central office continues to be cut, there are less and less people to help support the schools
and ensure that there is adequate support to the schools. This results in frustration in having
limited time to be available to assist in meeting the needs of the students.
39. Reduction in paperwork and time to work with the students.
40. Continued support from DPI from those who understand our role. More coordination and
collaboration with superintendents and finance officers.
41. More resources!!! Resources can mean funding EC at a new reasonable rate and not at the
1997 rate. / Take the classroom limits away and require reasonable numbers. / / Pay EC
teachers a little more and EC assistants. This would make it easier to find quality staff and
keep them. / /
42. More support from DPI / More acceptance of children with disabilities
43. Simplified forms and processes and better funding
44. Superintendents need to better understand the huge responsibility that their special education
directors have in supporting the work of the districts. Superintendents do not seem
knowledgeable of special education issues or how to support district leaders to meet the legal
and instructional challenges.
45. We need to meet much more than quarterly. We need to meet almost every month. There
needs to be more webinars that are provided to us from different sections of the EC
Department to assist us in various requirements that are heaped on us constantly.
46. 1. It would be wonderful if the superintendent and finance officers could hear the fiscal
suggestions that are made to directors on how to manage our budgets so that appropriate
resources would be available to provide quality services to students with disabilities. / / 2.
Pay the EC Director from the administrative pot, not from EC funds (takes away from money
for students). / / 3. Allow EC Directors to focus on EC and not every other program,
especially if being paid from EC totally. (AIG, ESL, 504, student services, etc.). / / 4. Other
ideas that are helpful: / / 1. Continue with the Directors’ Advisory Council. 2. Allow
collaboration of directors from similar sized LEAs on a routine basis. 3. For state
correspondence to come to directors first and then superintendents so we can have time to
collect the data we need to defend/explain what is happening locally. 4. To inform directors
of changes prior to them happening. (Examples: 1. Forms changes with no explanations of
how to complete the form, then you find out it is wrong. 2. Teachers are calling about a
change in a form that is found in CECAS or online and you don’t know what is going on as
the director).
256
47. Support from NCDPI’s EC Division has been questionable and evasive. Information is not
given in a timely manner and regional supports are not proactive in providing assistance.
Sometimes it feels like a “gotcha” game or that information needs to be chased down rather
than readily offered as a proactive strategy. Supports should be up front and initiated by
NCDPI…not chased down. Information needs to be provided in a more timely manner.
48. I would appreciate being in the know or included in information of major initiatives, such as
“common core”, etc.
49. I need more staff and money to operate my programs based on state regulations.
50. Monetary recognition of a job that can be done by few people. Surely supply and demand
will take effect eventually?? / Principals get an extra “bump” in years of experience for every
four years worked…EC Directors should get similar bump due to the nature of the difficult
work being done! / Consistent policy information from EC DPI.
51. *Additional staff to help alleviate some of the other pressures and support some of the other
programs under this umbrella. *Additional funds in order to provide some additional
supports at the school and classroom levels. / *Colleges and universities to train teachers for
the real classroom setting and provide some background knowledge of the NC CECAS data
collection/tracking system.
52. Assistants, adequate funding to address the needs of the students in your district.
53. Better benefits / higher salaries / more funding for student and teacher needs
54. It would be nice to be trusted with the programmatic and legal choices made and not be
second guessed and asked to defend myself.
55. Supports and recommendations from the Superintendent’s meeting to place those who are
most qualified in the position and not just principals with little to no background in special
education.
56. 1. More funding for special education, particularly for programs and staffing. 2. More
opportunity to be heard at the district and state levels. 3. Less job responsibilities unrelated
to special education.
57. Clearly defined and more timely responses from DPI.
58. I would appreciate more support with budget/finance issues. As a trained special educator, I
do not have the budget/finance knowledge that is required.
59. If pay is always dependent on state salary guidelines due to limited (no) supplement, then
income will always be a sore part of the job.
60. More funding for students with greater needs / less paperwork
257
61. Encourage the state to pay us more in this role.
62. A job coach
63. Increased funding / better health benefits (cut costs of family/spouse insurance) / increased
salary
64. Support for hard to serve students in terms of consultation, observation, and assistance in
planning and locating services
65. No sequestration of funds!!!!!! / more funding / opportunities to give feedback before
decisions are made at the state level / /
66. The job is very stressful which results in high turnover. We need additional motivation in the
form of compensation and leave time. We need less requirements from the FEDS.
67. Cohort for new directors each year, not every two years. More clearly defined role. Funding
to allow directors to offer financial support or incentives to teachers in high intensity
classrooms.
68. Higher salaries! I think the state does a good job of providing necessary training
opportunities; however, because there are so few consultants with so many districts to serve,
it’s very difficult to get that one-on-one assistance that I feel is sometimes crucial!
Especially as a new director, having the opportunity to spend some time working alongside
or shadowing an experienced or effective director would be highly beneficial.