Embed Size (px)
Citation preview

Study:
"An investigation into the performance of facial recognition systems relative to their
planned use in photo identification documents – BioP I"
Public final report
Version 1.1 07.04.2004

secunet
Page 2 of 84
Contents 1 Preface ........................................................................................................................................... 5 2 Management Summary................................................................................................................ 6 3 Introduction ................................................................................................................................ 13 4 Test overview............................................................................................................................... 14
4.1 Reference bases.................................................................................................................... 14 4.2 Systems and algorithms ....................................................................................................... 17 4.3 Procedure ............................................................................................................................. 17 4.4 Test conditions..................................................................................................................... 19
4.4.1 Population ....................................................................................................................... 19 4.4.2 Test environment.............................................................................................................. 23 4.4.3 Architecture of the test configuration .............................................................................. 24 4.4.4 System configuration ....................................................................................................... 24
5 Test implementation ................................................................................................................... 26 5.1 Field test............................................................................................................................... 26
5.1.1 Enrolment ........................................................................................................................ 27 5.2 Additional investigations ..................................................................................................... 27
6 Analysis of the field test results ................................................................................................. 29 6.1 Analysis concept .................................................................................................................. 29
6.1.1 Comparison types ............................................................................................................ 29 6.1.2 Evaluation of recognition performance........................................................................... 30
6.2 Test results ........................................................................................................................... 35 6.2.1 Definition of basic data sets ............................................................................................ 35 6.2.2 Failed enrolment rate (FER) ........................................................................................... 37 6.2.3 Recognition performance ................................................................................................ 37 6.2.4 Individual user statistics.................................................................................................. 49 6.2.5 Analysis of face detection ................................................................................................ 53 6.2.6 General results on systems and vendors.......................................................................... 53
6.3 Statistical significance of the results and error analysis....................................................... 54 6.3.1 Evaluation of statistical significance of the results ......................................................... 54 6.3.2 Error analysis .................................................................................................................. 54
7 Analysis of the additional investigations................................................................................... 57 7.1 Technical investigations....................................................................................................... 57
7.1.1 Verifications of impostors................................................................................................ 57 7.1.2 Variation of reference data.............................................................................................. 57 7.1.3 Variation of environmental conditions ............................................................................ 59

secunet
Page 3 of 84
7.1.4 Influence of the age of the identity card .......................................................................... 60 7.1.5 Influence of identity card quality..................................................................................... 62 7.1.6 Resilience of FR systems to attempts to outwit them ....................................................... 63
7.2 Investigation of user acceptance .......................................................................................... 66 7.2.1 Ratings of the systems...................................................................................................... 66 7.2.2 Acceptance of biometric procedures ............................................................................... 67
8 Evaluation scheme ...................................................................................................................... 70 8.1 Structure of evaluation scheme ............................................................................................ 70 8.2 Selection of reference bases to be considered...................................................................... 70 8.3 Evaluation criteria................................................................................................................ 71 8.4 Classification of the results.................................................................................................. 72
9 Summary and interpretation of results .................................................................................... 78 9.1 Algorithm comparison ......................................................................................................... 78 9.2 System comparison .............................................................................................................. 79 9.3 Reference base comparison.................................................................................................. 80
9.3.1 Provision of biometric characteristics as photograph .................................................... 80 9.3.2 Provision of biometric characteristics as an image file .................................................. 80 9.3.3 Provision of biometric characteristics as a template ...................................................... 81
9.4 Factors influencing facial recognition.................................................................................. 81 9.4.1 Lighting conditions.......................................................................................................... 81 9.4.2 Quality of the image file .................................................................................................. 82 9.4.3 Quality of the photograph on the identity card ............................................................... 82 9.4.4 Effects of the age of the identity card .............................................................................. 82
9.5 Resilience of FR systems to attempts to outwit them .......................................................... 82 9.6 General suitability of facial recognition............................................................................... 82
References ............................................................................................................................................ 84

secunet
Page 4 of 84
List of Abbreviations
BKA Federal Criminal Police Office
BSI Federal Office for Information Security
FR Facial recognition
FAR False acceptance rate
FER Failed enrolment rate
FRR False rejection rate
ICAO International Civil Aviation Organization
ME Matching Engine
MRZ Machine Readable Zone
NTP Network Time Protocol
OCR Optical character recognition
ODBC Open Database Connectivity
RefID 1 Image file containing a frontal photograph as reference base
RefID 2 Photograph on purpose-made ID card as reference base (fresh scan for each equipment activation)
RefID 3 Photo on EU visa as reference basis
RefID 4 Compressed image file of a frontal photograph as reference base
RefID 5 Image file of a semi-profile photograph as reference base
RefID 6 Photo on current identity card as reference basis
RefID 7 System template from live enrolment as reference base
RefID 8 Photo on purpose-made ID card as reference base
SQL Structured Query Language
SSH Secure Shell
User50 Subset of the total population
UPS Uninterruptible power supply
FI Additional investigations
VNC Virtual Network Computing
VPN Virtual private network

secunet
Page 5 of 84
1 Preface As part of the effort to combat international terrorism, the authorities are interested in improving identity verification at the various stages of checking new arrivals and residence entitlement through the use of biometric technology. The primary basis for such endeavours is the Prevention of Terrorism Act passed by the Bundestag, which came into effect on 9 January 2002 and contains provisions amending a large number of security laws in line with the new threat situation. The legislation amended includes the Passport Act, the Identity Card Act, the Aliens Act and the Asylum Procedure Act. These amendments have changed a number of aspects of personal identification. Thus, for example, as well as the photograph and signature, passports and ID cards may now contain other biometric characteristics relating to fingerprints, hand geometry or the face of the ID card owner.
International activities and framework conditions in this area provide further reason to look into this area. In particular, the present work should contribute towards endeavours at standardisation aimed at achieving interoperability. The International Civil Aviation Organization (ICAO) is also interested in this area, specifically in recommendations for widening travel documents to include biometric characteristics. The ICAO specifies the use of facial recognition as the biometric characteristic for global interoperability, but leaves the door open to other optional characteristics such as fingerprints or iris scans. In addition, the US Congress has passed a legislative package aimed at combating terrorism, which amongst other things includes major changes to the visa waiver programme. This requires that participating states, including Germany, incorporate biometric characteristics into their travel documents by 26 October 2004 or, as a minimum, that such a programme should exist by that date. In accordance with the objectives of the US Enhanced Border Security and Visa Entry Reform Act of 14 May 2002, based on the US Patriot Act, for the introduction of biometrics on the travel documents from the visa waiver states, the use of biometric methods to improve the identity verification of persons in possession of an ID card has gained significantly in importance in Germany, along with the activities already initiated.
In this connection, the aim of the BioP I study was to examine the performance of facial recognition systems currently available on the market for use on photograph identity cards. In the course of the study, one of the systems was found to be superior, and in the second phase of the project, BioP II, this will be subject to a comparative system test for finger and iris recognition systems.
This report presents the test concept and the main findings of BioP I. The study was carried out under the overall joint project management of the BSI and the Federal Criminal Police Office (BKA), and was implemented by secunet Security Networks AG as contractor.
Bonn, Wiesbaden, Essen, March 2004

secunet
Page 6 of 84
2 Management Summary
The investigation of biometric facial recognition technology carried out under the BioP I study enabled conclusions to be drawn about various aspects of the performance of facial recognition systems currently available on the market and regarding the possible use of facial recognition in combination with personal documents. The study draws amongst other things from the numerous amendments in the area of personal documents that were introduced under the umbrella of the Prevention of Terrorism Act of 9 January 2002 and pave the way for the use of other biometric characteristics, such as the face, in addition to the photograph which has traditionally been used up to now. Specifically, BioP I entailed a comparative investigation of two systems selected in a pilot study in a scientific system test, while at the same time several different kinds of algorithm were compared. Moreover, on the basis of the variety of personal documents with photograph that were considered, several reference bases were examined in order to be able to draw conclusions as to whether and with what results the tested systems are able in a verification process to process photographs on personal documents that vary widely as to their nature and quality. Finally, subjects were asked to provide ratings of biometrics in general, facial recognition in particular and the specific systems used.
Whereas BioP I only examined facial recognition (FR), BioP II, which is to follow immediately after it, is intended to compare facial recognition, fingerprint recognition and iris recognition methods.
The idea of using facial recognition on personal documents stems from the fact that the ICAO (see above) has prescribed this method so as to ensure interoperability. Moreover, both the German identity card and the German passport in its present form already contain photographic information, so that the use of photographs for identification verification is already common practice. The basic alternatives for supplying biometric facial characteristics on the ID card that might be considered are to use the existing photograph and to store a graphics file and a template in digital form on a chip integrated into the identity document.
Project goals The BioP I project thus examined the feasibility and technical implementation issues that arise in this connection. Specifically, these are as follows:
�� Is facial recognition technically suitable for use with photo identity cards?
�� In what form and quality do the biometric characteristics have to be provided.
�� What are the main parameters that influence facial recognition?
�� How difficult is it to outwit facial recognition systems?
�� Which of the facial recognition systems tested achieves the best recognition performance?
In addressing these issues, the underlying international situation, especially the ICAO guidelines on facial images that can be used with biometric systems, are the primary yardstick.
The photo identity cards included in the study were the current German federal identity card, the German passport, the EU visa, papers documenting the long-term right of abode following the EU model and the new provisional passports and identity cards of the Federal Republic of Germany.1
To meet these objectives, in the BioP I study, facial recognition systems from two different vendors were tested in the verification mode (1:1). One of these systems incorporated several facial recognition
1 The photograph on the passport is the same as the one on the federal identity card, hence in this study the latter is taken to be representative of both documents. Similarly, the photograph on the EU visa is assumed below to be representative of the photographs on papers documenting the long-term right of abode and on provisional passports and identity cards.

secunet
Page 7 of 84
algorithms from different suppliers. The decision to use these systems was made on the basis of a selection test carried out in advance of the actual trials.
The following comparisons were possible with the chosen systems:
�� comparison of two complete systems
�� comparison of different algorithms within one complete system
�� comparison of one algorithm within two complete systems
Procedure Under facial recognition, a current photograph of the face is compared with a reference photograph of the same person, known as the reference base, which has been stored in advance. There are several alternative ways of creating such a reference base for personal documents. First of all, the photograph on the ID card can be used as the reference. This means that during identity verification of a person, the photograph on the ID card is scanned and compared with the new image generated during identity verification. Depending on the type of ID card, the photograph it contains may have different characteristics. Thus, for example, the photograph on the EU visa is smaller and has more visual noise than the photo on the identity card.
One alternative to using the ID card photograph is to provide the reference base in electronic form. This can be either an image file of the face or a special, normally proprietary, encoding of the face, known as a template. This would require that the identity card was expanded to include a memory area. During identity verification, the reference base would then be read from this memory area.
To evaluate these alternatives with regard to their suitability for facial recognition, a representative sample of different reference bases was tested in parallel. These were: the photo on the current federal identity card, the photo on a purpose-made identity card specially prepared for the project with a frontal photograph2, the EU visa photo, the image file for a frontal photo, the compressed image file of a frontal photo as per the ICAO recommendations, the image file for a semi-profile photo and a proprietary template produced by the relevant system provider. The reference bases chosen covered all the ID card types mentioned above. Moreover, this selection allowed further conclusions to be drawn as regards the effect on facial recognition of compression of the image material and the difference in recognition performance obtained with frontal versus semi-profile photographs, and enabled the present federal identity card to be compared with a purpose-made identity card optimised for facial recognition.
The tests for the different reference bases were carried out for facial recognition systems from two different vendors, which were selected on the basis of a pilot study. One of these systems allowed more than one facial recognition algorithm to be integrated and operated in parallel, independently of each other. For the purposes of BioP I, algorithms from three different providers were used in this system. Each of these was also modified to incorporate an alternative face-finder ("Plus" version of the relevant algorithms).
2 The photograph on the purpose-made identity card complied with the ICAO guidelines for the creation of passport photographs for use in biometric applications.

secunet
Page 8 of 84
Figure 1: overview of systems and algorithms
This combination first of all permitted comparisons to be made between complete systems on the basis of an identical algorithm which was integrated into both systems. Secondly, it allowed algorithms from different providers to be compared within an identical complete system. Accordingly, a distinction was made in BioP I between a system comparison and an algorithm comparison.
For representative test results, the investigations were carried out on the basis of an extensive field test in a building belonging to the BKA in Wiesbaden. During the field test, the systems were used over a period of seven weeks by almost 250 people, 152 of whom underwent identity verification more than 50 times, as described below, and hence were included in the analysis.
During the field test, an identity card reader was also used. On each occasion, subjects placed their purpose-made identity cards, which contained their personal identity card number and the scanned photograph for the facial recognition systems, on the device. This procedure was based on the target scenario described above.
The sequence of events that occurred when the subject activated the system was as follows.
After the ID card scanner had collected the necessary information from the document, facial recognition was initiated. This entailed taking a continuous sequence of photographs of the subject with a camera and comparing them with a stored reference base. Recording was terminated when either a comparison was successful or a predefined time limit had been reached. The fact that images were being recorded was communicated to the subject by means of a yellow light signal. The success or failure of the verification process was communicated to the subject, respectively, by a green or red light signal. In the background, unbeknown to the subject, other comparisons were taking place between the recorded image and all the algorithms and reference bases integrated into the system. The results were recorded in a database for later analysis.
In addition to the field test described above, a number of additional investigations were carried out in the laboratory of secunet Security Networks AG in Essen. As well as the investigation of parameters that influence facial recognition, possibilities for reducing the storage space required to hold the reference bases were also examined. Other important elements were checking of the extent to which the systems in question could be outwitted and the performance of some offline tests.
To present and compare the results obtained, the data collected was classified, rated according to a marking scheme and mapped to the evaluation schemes, weighted with regard to its importance for the planned applications. The weighted partial marks were compiled together into overall marks which
secunet
Page 9 of 84
allowed a comparative evaluation to be made. This procedure was used as a tool suitable for comparing both algorithms and complete systems. The results obtained are summarised below.
Algorithm comparison Within the system in which multiple algorithms were integrated (system A), algorithm 1 performed the best on virtually every significant evaluation criterion. All the others performed less well, in some cases by a considerable margin.
System comparison Whereas system A had a slight advantage as regards biometric recognition performance, on other significant evaluation criteria, system B came out in the lead, in some cases by a significant margin. In particular, as regards robustness, system errors, administration overhead and support, system B performed significantly better. Especially in relation to wider usage and also to selecting which system to use for BioP II, recognition performance is not the only pertinent criterion, but these criteria are very important too.
Reference base comparison One issue of particular interest in BioP I was the determination of suitable reference bases, especially with regard to any modifications that might be necessary to German personal documents.
The study demonstrated that the federal identity card cannot be used in conjunction with biometric facial recognition in its present form. This conclusion is essentially based on the fact that the photograph used on the ID card is in semi-profile. Moreover, in individual cases, characteristics of these photos, such as contrast and brightness, are very poor.
The purpose-made identity card created for the project with a photograph that complies with the ICAO recommendations demonstrated that facial recognition is possible on the basis of an image scanned from the document. The results obtained were still not satisfactory, but they did show that there is a certain potential to improve recognition performance.
On the other hand, recognition performance was significantly worse with the EU visa photograph tested. The reasons for this is essentially noise within the facial image, the effect of which is magnified as a result of the optical security characteristics (e.g. fluorescent fibres, background printing) on the visa.
It was demonstrated that, instead of using the document photograph directly, an image file could be used instead. This is in line with the ICAO recommendations and would allow international interoperability. The recognition performance that can be achieved with this alternative is very promising. Again, when the compression recommended by the ICAO was used, the recognition rate declined only to an extent that is acceptable from a technical point of view. This suggests that if existing optimisation potential is exploited, successful use of this option is definitely a possibility. This includes, for example, the use of special camera systems, optimisation of algorithms to the processing of image files and appropriate pre-processing of the image material.
Tests carried out on an image file based on a photograph in semi-profile showed clearly that this type of photograph is unsuitable for facial recognition. This was underlined by results obtained with the present German identity card (see above).
As one would expect, representation of the face as a vendor-specific template resulted in by far the best recognition performance on all systems. Amongst other things this is due to the fact that this template was generated in an enrolment process specific to and optimised for the system in question, whereas the image files were produced from system- and vendor-independent photographs.
Additional investigations The additional investigations carried out as part of BioP I examined some additional detailed questions. The first area of interest here was to determine the parameters which have a significant impact on

secunet
Page 10 of 84
facial recognition. It is known that the most important factor in facial recognition is the lighting, specifically the intensity and direction of the lighting. This was confirmed once again through the investigations carried out in BioP I. In this connection it is interesting to note that the extent of this influence varies widely between algorithms and systems. Another important factor is the capability of the data acquisition unit, i.e. the camera system.
The biggest decline in recognition performance for all algorithms and systems was found when the light came from the side. When a suitable camera system was used, the incidence of light from behind the person could be virtually ignored. Where the light came strongly from the front, an extremely surprising effect occurred. Normally, recognition performance worsened, but in exceptional cases a significant improvement occurred. Of the algorithms examined, in virtually every case algorithm 1 proved very robust.
Bearing in mind that the storage capacity of a possible chip on the personal document would be limited and that according to ICAO and EU recommendations several characteristics need to be stored, it is a further advantage if the information to be stored can be compressed to the maximum extent possible. For this reason, the impact on recognition performance of different levels of compression for the image files used as the reference base was examined. In the event, recognition performance generally declined as the degree of compression increased. Whereas low compression (image size approx. 75KB) resulted in a negligible decline in performance, a significant deterioration occurred with very high compression (image size approx. 11KB). Compression of the order of magnitude proposed by the ICAO (image size approx. 14KB) still produced an acceptable recognition performance compared with reference bases that were only slightly compressed.
As a further means of reducing the storage requirements, low resolution image files were also tested. This modification resulted in slightly worse recognition rates on all the systems tested. However, in this case no results were obtained for the Plus versions of the algorithms, as the resulting image files could not be processed due to inadequate resolution.
Another significant aspect of the assessment of suitability of facial recognition systems in relation to personal documents is the effect of the age of the ID card and hence the influence of the reference image contained on the card on recognition performance. A corresponding investigation was carried out on the basis of subjects' current identity cards. However, since recognition performance based on these ID cards was generally very poor, no definitive conclusions can be drawn here. Nevertheless there was a discernible trend to the effect that recognition performance declines as the age of the ID card increases. Generally, the effect of ageing on facial recognition systems has not yet been adequately investigated, as was confirmed by a review of research activities in this area that was carried out as part of BioP I.
Another parameter that affects the use of facial recognition on identity cards is the quality of the document. To examine this more closely, subjects' current identity cards were classified in terms of scratches, kinks, cracks etc. Virtually no identity cards whose surfaces in the area of the picture were of medium or poor quality were identified. This suggests that the federal identity card is very robust, especially in the area of the photograph. As the sample of identity cards of poor quality was very small, no firm conclusions can be drawn as regards the impact on facial recognition.
One important evaluation criterion for biometric systems, especially given the background requirement of higher security for the operational scenario, is the extent to which the systems can be outwitted. The tests carried out in the course of BioP I showed that the two biometric systems involved can be outwitted with little effort by copying the biometric facial characteristics in the form of photographs. However, the provision of a suitable device which ensures that the face belongs to a living person was not a mandatory criterion for the systems. Nevertheless, it is alarming that with both systems there was one case of mistaken identity involving two people who bore only limited visual similarity to each other. This raises the possibility that without further effort somebody could be identified using the ID card of another person and be accepted by the system as the proper owner of the document.
secunet
Page 11 of 84
User Acceptance Within the framework of the BioP I project, statistical investigations were used to examine acceptance of the biometric systems tested. These acceptance investigations were based on three questionnaires completed by the subjects. The first questionnaire was completed prior to the start of the test phase, the second approximately half-way through the test phase and the third at the end of the test phase. Vendor B's system was rated significantly more highly than vendor A's. In each of the five categories of ease of use, recognition accuracy, speed, susceptibility to errors and flexibility, and also in the overall assessment, system B came out ahead of system A. But despite this clear difference, system A was also assessed as good. All in all, the user ratings of the systems can be described as encouraging. On the basis of the results collected, there were no problems as regards ease of use of the systems, although their susceptibility to errors was in need of improvement.
As well as the assessment of the systems specifically used in the test, subjects were also asked to assess facial recognition and biometrics in general. The questionnaire results suggest two parallel trends. First of all, subjects became increasingly positive in their attitude to numerous detailed questions on facial recognition in the course of the trial. Thus, only a minority thought that facial recognition was a danger to health, whereas the practical maturity of the technology and its reliability were viewed by a large majority of subjects as satisfactory. Despite this positive attitude, subjects appeared to be sceptical as a whole in detail. Thus, a majority supported the requirement that facial recognition should not be used unattended. Again, only a third of subjects felt that it was generally beneficial. This suggests that information on specific operational scenarios could help to raise acceptance of biometrics amongst the public, whereas positioning it as a technology for a very wide range of applications should remain more in the background.

secunet
Page 12 of 84
Summary BioP I demonstrated that facial recognition can produce good recognition performance if the following framework conditions are adhered to and the basic preconditions presented are satisfied:
�� The reference base must be provided on the personal document. The best results are achieved where a template is used. However, it is more realistic as regards international usability if an image file that complies with the ICAO recommendations is provided. Here, however, the available optimisation potential must be better utilised so as to achieve better results. Although use of a photograph on the identity card, as recommended by the ICAO, appears to be possible, a lot of effort is required on the part of the companies responsible for the algorithms to ensure that satisfactory recognition performance is achieved.
�� One important framework condition for the successful use of facial recognition is that the environment should be controlled as regards the influence of lighting.
�� Before facial recognition systems can be used, it is essential that security as regards the possibility of outwitting the system is improved. Whereas the use of photographs to outwit the system appears to be critical only to a limited extent if one assumes that identity verification is monitored, it is unacceptable that persons who look alike should be mistaken for each other.
�� With regard to the suitability of facial recognition for personal documents, one reservation is that the effects of ageing effects have not yet been adequately studied. This is especially relevant when one considers the relatively long period of validity of these documents.
�� The aforementioned framework conditions imply that some changes are necessary to German passports and identity cards if qualitatively reliable facial recognition is to be achieved. To accommodate the reference bases, the identity card should be extended to include a storage medium. As a fallback solution, one possibility is to use the photograph on the identity card in parallel or for a transitional period, as long as the current guidelines regarding the creation of photographs are modified. Here the ICAO guidelines for the creation of passport photographs for use in biometric applications could serve as a suitable model. The same guidelines should be binding for the image files provided through the identity card storage medium.
�� The results obtained in BioP I are to be checked in the course of project BioP II on the basis of a significantly larger test population and compared with the biometric procedures of iris and fingerprint recognition. The algorithm comparison carried out in BioP I indicates a clear preference for algorithm 1, which was chosen for the BioP II studies. Once again, the system test made it possible to make a clear recommendation, as system B produced better results in the BioP I scenario in relation to other criteria deemed to be relevant in addition to facial recognition, such as fault behaviour, reliability, vendor support and acceptance by the test subjects.

secunet
Page 13 of 84
3 Introduction As part of the battle against terrorism and criminal elements, efforts are currently under way to improve internal security through various measures. For this reason, the German Prevention of Terrorism Act of January 2002 introduced a number of amendments to the German Passport Act and Identity Card Act. These enable identity documents to be extended to incorporate biometric characteristics such as face, fingerprint or hand geometry, with a view to improving the process of determining a person's identity. Moreover, central storage of these biometric characteristics is not allowed. This makes it a priority to use biometric methods in the verification mode (1:1 comparison of a characteristic stored in the identity card against the corresponding live characteristic of the person).
The idea of using facial recognition on personal documents stems from the fact that the ICAO (see above) has prescribed this method in order to ensure interoperability. Moreover, both the German identity card and the German passport in its present form already contain photographic information, so that the use of photographs for identification verification is already common practice. The basic alternatives for supplying biometric facial characteristics on the ID card that might be considered are to use the existing photograph and to store a graphics file and a template in digital form on a chip integrated into the identity document. The BioP I project examined the feasibility and technical implementation issues that arise in this connection, as follows.
�� Is facial recognition technically suitable for use with photo identity cards? If so, in what form and quality do the biometric characteristics have to be provided?
�� What are the main parameters that influence facial recognition? How great an effect do these parameters have on facial recognition?
�� How difficult is it to outwit facial recognition systems?
�� Which of the facial recognition systems tested achieves the best recognition performance?
In addressing these issues, the underlying international situation, especially the ICAO guidelines on facial images that can be used with biometric systems, have been considered.
To meet these objectives, in the BioP I study facial recognition systems from two different vendors were tested in the verification mode. One of these systems incorporated several facial recognition algorithms from different suppliers. The decision to use these systems was made on the basis of a selection test carried out in advance of the actual trials.
The following comparisons were possible with the chosen systems:
�� comparison of two complete systems
�� comparison of different algorithms within one complete system
�� comparison of one algorithm within two complete systems
The BioP I study was carried out under the direction of the BSI, which was responsible overall for the project, and the BKA. The study was performed under contract by secunet Security Networks AG. This document is the official final report for the BioP I study.

secunet
Page 14 of 84
4 Test overview
4.1 Reference bases Under facial recognition, a current photograph of the face is compared with a reference photograph of the same person, known as the reference base, which has been stored in advance. There are several alternative ways of creating such a reference base for personal documents. Figure 2 provides a summary. First of all, the photograph on the ID card can be used as the reference. This means that during identity verification of a person, the photograph on the ID card is scanned and compared with the new image generated during identity verification. Depending on the type of ID card, the photograph it contains may have different characteristics. Thus, for example, the photograph on the EU visa is smaller and has more visual noise than the photo on the identity card.
One alternative to using the ID card photograph is to provide the reference base in electronic form. This can be either an image file of the face or a special, normally proprietary, encoding of the face, known as a template. This would require that the identity card was expanded to include a memory area. During identity verification, the reference base would then be read from this memory area.
Figure 2: provision of reference photographs for facial recognition

secunet
Page 15 of 84
To evaluate these alternatives with regard to their suitability for facial recognition, a representative sample of different reference bases was tested in parallel. Specifically, these were as follows:
�� photograph on a current federal identity card
�� frontal photograph on a purpose-made identity card specifically prepared for the project3
�� photograph on an EU visa
�� the image file of a frontal photograph
�� the compressed image file of a frontal photograph that complied with the ICAO recommendations
�� the image file of a semi-profile photograph
�� a proprietary template
RefID Description Provision in the target scenario
Photo-graph
Image file Template
1 Photo taken from the front X
2 Photo (1) on purpose-made identity card (equivalent to examining federal identity card and passport)
X
3 Photo (1) on visa sticker (equivalent to examining EU visa, papers documenting the long-term right of abode as per EU model and provisional passports and identity cards)
X
4 Compressed image file of (1) X
5 Photograph in semi-profile X
6 Photo on current identity card X
7 System template based on live enrolment X
8 Same as RefID 2, but with modified provision X
Table 1: reference bases examined in BioP I
The chosen reference bases cover all the identity card types mentioned above and, moreover, permit a number of interesting comparisons. These include the effect on facial recognition of compression of the image material and the difference in recognition performance obtained with frontal versus semi-profile photographs, and comparison of the present federal identity card with a purpose-made identity card optimised for facial recognition.
For each test subject, the image files presented in Table 2 were fed into the facial recognition (FR) systems. On this basis, file enrolment was carried out in advance of the field test for all the FR algorithms involved. On the other hand, for reference base 7, live enrolment was carried out on the systems to generate the system templates. Reference base 2 (purpose-made identity card) was re-scanned and then immediately enrolled on every occasion that the subject's identity was verified. An
3 The photograph on the purpose-made identity card complied with the ICAO guidelines for the creation of passport photographs for use in biometric applications.

secunet
Page 16 of 84
identity card reader produced by the Bundesdruckerei – the Verifier – was used to scan the identity card document.
RefID Photograph Format Quality (photoshop)
Typical file size
1 Frontal JPEG 10 75KB
2 Photo scanned by Verifier on each equipment activation and provided to FR as JPEG file.
3 Frontal JPEG 10 142KB
4 Frontal JPEG 2 14KB
5 Semi-profile JPEG 10 75KB
6 Federal identity card JPEG greyscale 10 65KB
7 Live photograph taken with FR system camera prior to start of the field test
8 Purpose-made identity card
JPEG greyscale 10 65KB
Table 2: image files passed to facial recognition systems
An example of the various reference bases involved is shown in Figure 3.
Figure 3: set of examples for the various reference bases4
4 Publication of the images is with the consent of the person in the photographs.

secunet
Page 17 of 84
4.2 Systems and algorithms The tests were carried out for facial recognition systems from two different vendors, which were selected on the basis of a pilot study. The specific goals of the BioP I project precluded the use of any standard systems from the participating vendors. Instead, the systems used were modified to a specification, and therefore have the status of a prototype.
System A allowed more than one facial recognition algorithm to be integrated and operated in parallel, independently of each other. For the purposes of BioP I, algorithms from three different providers were used in this system. Each of these was also modified to incorporate an alternative face-finder ("Plus" version of the relevant algorithms).
Figure 4: overview of systems and algorithms
This combination first of all permitted comparisons to be made between complete systems on the basis of an identical algorithm which was employed in both systems. Secondly, it allowed different algorithms to be compared within an identical complete system.
4.3 Procedure During the field test, an identity card reader was also used. On each occasion, subjects placed their purpose-made identity cards, which contained their personal identity card number and the scanned photograph for the facial recognition systems, on the device.
The procedure followed by the test subjects was as follows. After the identity card reader had captured the necessary information from the document, facial recognition was initiated. This entailed taking a continuous sequence of photographs of the subject with a camera and comparing them with a stored reference base. Recording was terminated when either a comparison was successful or a predefined time limit had been reached. The fact that images were being recorded was communicated to the subject by means of a yellow light signal. The success or failure of the verification process was communicated to the subject, respectively, by a green or red light signal. In the background, unbeknown to the subject, other comparisons were taking place between the recorded image and all the algorithms and reference bases integrated into the system. The results were recorded in a database for later analysis. The sequence of events involved from the subject's point of view is illustrated in Figure 5.

secunet
Page 18 of 84
Figure 5: sequence of events involved in each equipment activation
Because recognition performance was being examined in parallel for different reference bases and also different facial recognition algorithms, a number of biometric verifications were triggered by each equipment activation by a person.
The starting point was always a live image pre-selected on the basis of a "master reference" and a master algorithm, which was recorded upon equipment activation. From this a template was generated using the relevant integrated algorithms (in the diagrams below template creation is presented as function ftpl). For each algorithm a comparison was then made with the associated person and algorithm templates of the various reference bases (RefID 1 to 8). The match score achieved was recorded in a central database. The processes involved are shown in Figure 6 and 7. The elements highlighted in yellow in the diagram show the configuration of master reference and master algorithm specified for the field test.

secunet
Page 19 of 84
Figure 6: verification process under system A
Figure 7: verification process under system B
These multiple verifications were completely concealed from the test subjects. Only the verification result for the master reference and the master algorithm was displayed.
4.4 Test conditions
4.4.1 Population The subjects of the BioP I field test were volunteers from the staff of the BKA. This group comprised 241 persons. None of the subjects in the field test group was involved in the administration of the systems or the field test support service. The statistical characteristics of this test group are shown in the tables and diagrams below. A comparison was carried out between the structure of the test population and the structure of the total population. The statistical characteristics selected for recording (sex, age, highest educational qualification and ethnic origin) were based on [TechEval].
secunet
Page 20 of 84
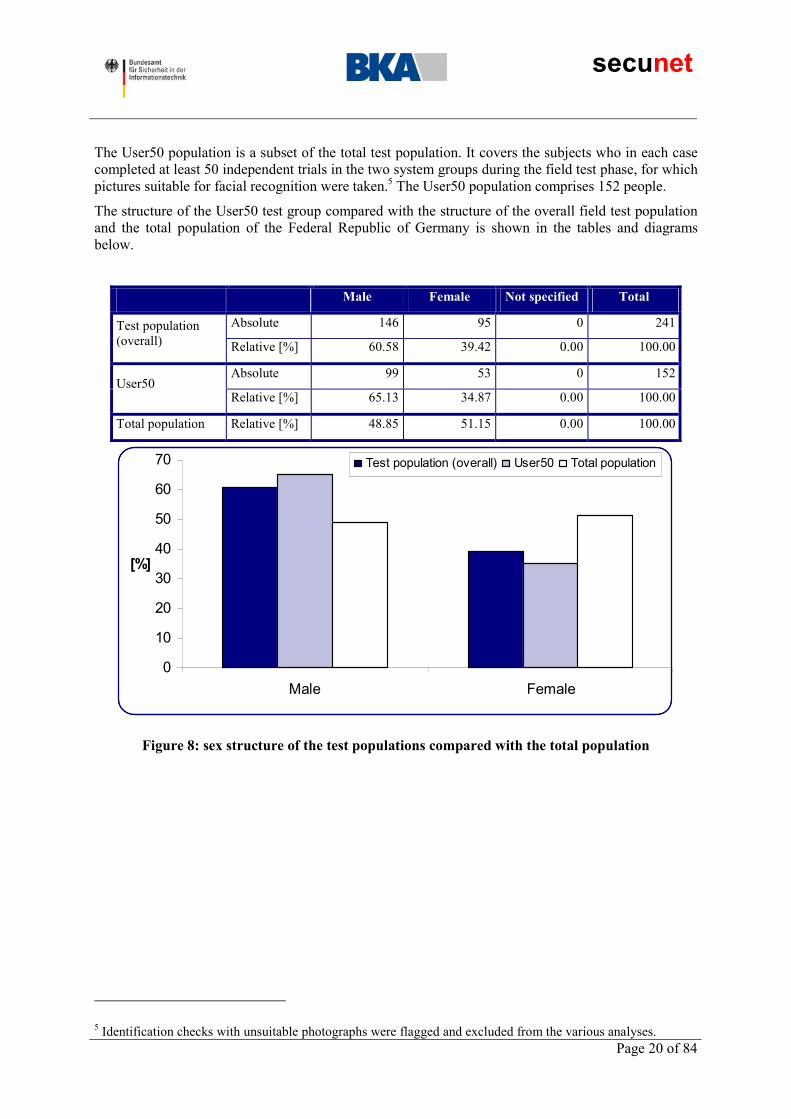
The User50 population is a subset of the total test population. It covers the subjects who in each case completed at least 50 independent trials in the two system groups during the field test phase, for which pictures suitable for facial recognition were taken.5 The User50 population comprises 152 people.
The structure of the User50 test group compared with the structure of the overall field test population and the total population of the Federal Republic of Germany is shown in the tables and diagrams below.
Male Female Not specified Total
Absolute 146 95 0 241Test population (overall) Relative [%] 60.58 39.42 0.00 100.00
Absolute 99 53 0 152User50
Relative [%] 65.13 34.87 0.00 100.00
Total population Relative [%] 48.85 51.15 0.00 100.00
0
10
20
30
40
50
60
70
Male Female
[%]
Test population (overall) User50 Total population
Figure 8: sex structure of the test populations compared with the total population
5 Identification checks with unsuitable photographs were flagged and excluded from the various analyses.

secunet
Page 21 of 84
<18 18-24 25-44 45-59 60-64 ≥65 NS Tot.
Absolute 0 8 140 88 5 0 0 241Test population (overall) Relative [%] 0.00 3.32 58.09 36.51 2.07 0.00 0.00 100
Absolute 0 6 92 51 3 0 0 152User50
Relative [%] 0.00 3.95 60.53 33.55 1.97 0.00 0.00 100
Total population Relative [%] 18.85 7.94 30.70 18.91 6.95 16.65 0.00 100
0
10
20
30
40
50
60
70
<18 18-24 25-44 45-59 60-64 ≥ 65
[%]
Test population (overall) User50 Total population
Figure 9: age structure of the test populations compared with the total population

secunet
Page 22 of 84
Ap-
pren-ticeship
Tech. coll.
Tech. coll. GDR
Poly. Univ. PhD NS Tot.
Absolute 74 33 2 66 18 34 14 241Test population (overall) Relative [%] 30.71 13.69 0.83 27.39 7.47 14.11 5.81 100
Absolute 40 25 2 42 8 25 10 152User50
Relative [%] 26.32 16.45 1.32 27.63 5.26 16.45 6.58 100
Total population Relative [%] 52.16 6.59 1.60 3.72 5.94 0.89 29.09 100
0102030405060
Appren
tices
hip
Techn
ical c
olleg
e
Tech.
coll.
(GDR)
Polytec
hnic
Univers
ityPhD
Not sp
ecifie
d
[%]
Test population (overall) User50 Total population
Figure 10: educational background of the test populations compared with the total population6
6 In the total population, the values "Not specified" correspond to the proportion of persons without educational qualifications.

secunet
Page 23 of 84
Central European
Arab., N. Afr.,
Mid. East
Black Afr.
East Asia Others Not
spec. Total
Absolute 231 2 0 1 0 7 241Test population (overall) Relative [%] 95.85 0.83 0.00 0.41 0.00 2.90 100
Absolute 149 1 0 0 0 2 152User50
Relative [%] 98.03 0.66 0.00 0.00 0.00 1.32 100
0
20
40
60
80
100
CentralEuropean
Arabia, NorthAfrica, Middle
East
Black Africa East Asia Others Not specified
[%]
Testpopulation (gesamt) User50
Figure 11: ethnic origin of the test populations7
Since the subjects were recruited from the workforce of the BKA, as one would expect, the test population is not representative of the structure of the total population of the Federal Republic of Germany.
4.4.2
Test environment The facial recognition systems were set up in a building belonging to the BKA in Wiesbaden. To ensure that there was an appropriate distance between the person to be captured and the camera unit, for system A the cabinets for the Verifier were positioned appropriately and for system B markings were applied to the floor.
To ensure that the lighting conditions would be suitable for facial recognition and uniform for all the systems, the following measures were taken:
�� The windows were covered with curtains that allowed virtually no light to pass through.
�� The ceilings and walls were covered in such a way as to permit very little light absorption.
7 It is not possible to compare the ethnic origins of the test population with the total population since the German Federal Statistical Office does not keep statistics on the ethnic origin of people living in Germany, only their nationality.

secunet
Page 24 of 84
4.4.3
4.4.4 System configuration
�� By installing lights which radiated indirectly above the area for each system in which subjects were captured, it was possible to ensure that the face was illuminated without any shadows being cast and without glare.
�� A constant level of lighting (approx. 130 lux) was maintained by using continuous lighting which could not be altered (the lighting could neither be switched on/off nor dimmed). The illumination level complied with the recommendations made in DIN 5035 Part 2 for reception rooms and rooms accessed by the public.
The influence of light coming in through the open door was judged irrelevant by the vendors. The measures originally intended so as to ensure a single-coloured background, exclude background movements and confine the recording area at the sides were not taken, since according to the vendors these factors would not have any impact on the recording and recognition performance of the systems.
Architecture of the test configuration The computer systems and associated network infrastructure consisted essentially of two elements:
�� biometric systems from the two vendors
�� background systems for data collection, analysis, administration and the provision of central functions
The central database system used to collect all the results was based on the following consideration:
�� RedHat Linux 8.0
�� PostgreSQL 7.3.2
�� time server service to ensure that all the logged data and results data were synchronised in time
�� RAID5 controller, accommodating approx. 600GB of user data plus a further 250GB of external backup storage
�� 2GB of main memory
�� Pentium 4, 2.533 GHz
�� 1 GBit/s network connection
All the systems were operated in an independent test network. Remote access was only possible from special stand-alone systems over a VPN.
4.4.4.1 Verifier settings In BioP I, the biometric systems were operated exclusively in verification mode. Accordingly, on every equipment activation the user ID of the relevant person had to be entered. During the field test, the Verifier document reader supplied by the Bundesdruckerei was used exclusively.
Six identical Verifiers were used for the trial. With regard to the image data prepared for facial recognition, all the systems were checked to ensure that they behaved in the identical manner8. The image file eventually provided had a resolution of 472 x 620 pixels (the equivalent of approx. 300 dpi at picture size) and an 8-bit colour depth (greyscale).
8 An identity card photo was generated by each Verifier for the same person, and then the resolution, depth of colour, compression and image characteristics (brightness, contrast and sharpness) were compared.

secunet
Page 25 of 84
4.4.4.2 Facial recognition system parameters The following parameters were determined prior to the start of the field test for both systems and were not subsequently altered during the trial.
�� Master reference. Reference 7 (system template generated during live enrolment) was chosen as the reference base, against whose template the live image was subjected to verification during the interactive equipment activation.
�� Master algorithm. Algorithm 1 was chosen as the matching engine with which the live image was checked against the master reference during the interactive equipment activation. This algorithm was used in both systems.
�� Tolerance threshold. For the purposes of user feedback, the threshold for the match score from which a verification was deemed to be successful was determined. The choice of tolerance threshold initially followed the recommendations of the vendors. In the pilot trial it turned out that when the same tolerance thresholds were used, system B produced better recognition performance. To exclude the possibility of the threshold influencing the user surveys which were carried out in parallel to the field test, it was decided that the systems should have similar recognition performance for user feedback. Therefore the tolerance threshold for system B was set higher. Despite using the same algorithm in both systems, this meant that different tolerance thresholds were used in the field test.
�� Timeout on recording the live image. The maximum time during which the data acquisition unit continuously recorded live images was set to six seconds.
4.4.4.3 Information provided to facial recognition systems The facial recognition systems only had the templates for the individual reference bases associated with a given user ID. Further information, such as body size or other significant characteristics, were not used to support the verification process.

secunet
Page 26 of 84
5
Test implementation
5.1 Field test This section describes the preparations and running of the field test at the BKA in Wiesbaden.
The first step involving the subjects was the creation of the photo by the BKA photo office.
The next step was to start the vendor installation. Before this could get under way, the test rooms had to be prepared and the technical infrastructure for the field test had to be put into operation. This entailed the provision of the necessary power supply and networked environment and setting up of the background systems. The two vendors began installing the equipment on 9 April 2003 and 15 April 2003 respectively.
Between setting up the functionality and the teach-in phase, some pre-tests were carried out jointly with the manufacturers. These were aimed at optimally configuring the systems and calibrating them to the environmental conditions. During this time, the vendors were allowed to install updates and modify essential function parameters as long as they informed the team of what they had done.
On 16 April and 22 April 2003, respectively, the BKA administrators were trained on how to use the systems. The induction training concentrated mainly on how to perform enrolment.
On 24 April 2003, an information event was held for the subjects. At this event, the main objectives of the project, the tasks and the amount of time that subjects should expect to spend on the project and the project timetable were explained. Subjects were also informed of the relevant data protection provisions. The project team was then available to answer any questions.
Straight after the event, the written survey on user acceptance (first questionnaire) was begun. Similar surveys were carried out half-way through the field test and then at the end of the field test.
On 28 April 2003 live enrolment was started. Detailed information on carrying out enrolment is provided in section 5.1.1 below.
The actual field tests were preceded by a three-day teach-in phase. The main difference between this and the field tests was that during this phase project team members were always on hand in the test environment. This served two purposes. Firstly, the subjects would be trained in how to use the systems and, secondly, any problems and sources of error would be identified and, if possible, eliminated prior to the start of the field test.
The actual field test began on 15 May 2003. The trials were carried out unsupervised, i.e. normally there were no project team members on hand. Record sheets on which subjects could jot down any notes were laid out in the test room. Using these sheets, subjects could provide details of any significant changes in their characteristics (e.g. new pair of glasses or hairstyle) and also record any error messages relating to the facial recognition systems.
The original strategy of not permitting the vendors to implement any updates during the field tests was not adhered to in practice. Whereas vendor B only implemented updates relating to communications between the Verifier document reader and the PC terminal and some functionality relating to the logs, some basic modifications were necessary for the system of vendor A. No changes were made here to the embedded facial recognition algorithms. However, the software provided by the vendor to perform the functions required for BioP I turned out to have several serious problems. For example, it produced incorrect verification results9.
The field test terminated on 2 July 2003.
9 As all the live images from the identification checks were saved, it was possible to repeat the verifications and hence obtain the correct results.

secunet
Page 27 of 84
5.1.1 Enrolment Two different types of enrolment were used in BioP I. To generate the templates based on the live image of a person in front of the data acquisition unit (RefID 7), live enrolment was carried out. The templates for all the other reference bases were generated on the basis of image files, i.e. using file enrolment.
5.1.1.1 Live enrolment Live enrolment was carried out in parallel for both the complete systems involved. Subjects were invited to attend at fixed times in small groups so as to avoid longer waiting times. The majority of the subjects were enrolled between 28 and 30 April 2003. A few other subjects were enrolled during the teach-in phase.
The live enrolment was carried out by employees of the BKA. To help them, they were given a system-specific instruction sheet on enrolment and a log in which to enter the results manually. Some of the main points are presented below:
�� Instructions for the subject
o Stand in the predefined area
o Look at the camera
o Normal facial expression (neither particularly happy nor unfriendly)
o Instructions for subjects wearing spectacles: enrolment the same as for the picture on the purpose-made identity card.
�� Consider quality control of the systems
�� Exclude any obviously poor photographs
�� Carry out a test verification directly after enrolment (functionality for vendor A was not available)
�� Enrolment deemed to have been unsuccessful after four failed attempts
Especially during the teach-in phase and during the first few days of the field tests, the results were monitored to see whether any individual persons were rejected more frequently than others. Unless the subject had failed to follow the correct procedure, re-enrolment was carried out. For each system, three persons were re-enrolled. In each case, re-enrolment resulted in better recognition performance.
5.1.1.2 File enrolment During file enrolment, image files were fed into the facial recognition systems, from which templates were then generated. The user ID of the subject to whom the photograph related was derived from the file name. A summary of the image files provided is presented in Table 2.
5.2 Additional investigations Additional tests were carried out in the laboratory of secunet Security Networks AG in Essen. In particular, these covered the following areas:
�� examination of the factors that influence facial recognition (the effect of lighting)
�� reduction of the storage space required to hold the reference bases
�� checking of the systems involved as to whether they could be outwitted
�� offline tests to determine false acceptances

secunet
Page 28 of 84
In parallel to the field tests, user acceptance was investigated at set times.

secunet
Page 29 of 84
6
6.1.1
Analysis of the field test results
6.1 Analysis concept This section presents the analysis concept for BioP I, which took into account the various project aims. The analysis was oriented towards terms and methods defined in [BestPrac] to the extent that the relevant subjects are covered there. Departures from this concept occurred only in isolated cases where there was good reason; these instances are referenced appropriately.
Comparison types The aims of BioP I were firstly to compare different facial recognition systems and secondly to compare the underlying reference bases. Moreover, the systems selected for BioP I also enabled different facial recognition algorithms within an identical system to be compared.
Altogether, the following comparisons were carried out on the basis of the results obtained from BioP I (see Figure 12):
1. Comparison of biometric complete systems under comparable conditions (FR algorithm, environmental conditions, test period) = system comparison (horizontal comparison 1 in Figure 12)
2. Comparison of FR algorithms under comparable conditions (identical system, identical enrolment images, identical live images) = algorithm comparison (horizontal comparison 2 in Figure 12)
3. Comparison of different reference bases within the same system (identical live images) = reference base comparison (vertical comparison in Figure 12)
According to [BestPrac], the system comparison and hence the field tests as experienced by the subjects constitutes a "scenario evaluation". The algorithm comparison on the other hand is of the "technical evaluation" type. For the algorithm comparison, it was therefore necessary to limit the verifications carried out in order to exclude errors which are not attributable to the algorithms. Live images that were unsuitable for facial recognition due to incorrect system- and user-specific action had to be excluded. This was done in BioP I (see section 6.2.1).
Similarly, system and user errors were in the background for the reference base comparison. Therefore the relevant results were calculated on the same database as the algorithm comparison.
Figure 12: vertical and horizontal comparisons

secunet
Page 30 of 84
6.1.2 Evaluation of recognition performance The main criterion used to evaluate biometric systems is their recognition performance. This is obtained from the probabilities of the system rejecting the right person (a "genuine person") and of the system accepting the wrong person (an "impostor"). These probabilities are referred to as the false rejection rate (FRR) and the false acceptance rate (FAR). The values of FRR and FAR cannot be calculated theoretically, but always have to be worked out statistically on the basis of elaborate tests.
As the values of FRR and FAR always correlate in a test scenario, it is always necessary to specify both values in order to work out a system's recognition performance. This is done for "working points", at which the values of FRR and FAR associated with a fixed threshold are calculated. Isolated statements of FAR as FRR are not very meaningful, as it is then always possible to find good working points. Thus, saying the FRR is low is not very informative if the associated FAR value (which will normally be high) is not known.
By definition, an FRR is always calculated from verifications of genuine persons, whereas the FAR is calculated from verifications of impostors. For BioP I, this meant that in order to be able to draw statistically significant conclusions, both operations had to be carried out many times before the recognition performance could be determined.
To determine the FRR, verifications of subjects throughout the field test period were used. On the other hand the FAR was calculated on the basis of live images obtained during the field test, which were used for verification against the references of other persons. In this way a large number of verifications of impostors were simulated.
There are several procedures for presenting the recognition performance of biometric systems. For BioP I, three different methods were used. These are explained below.
One simple and useful method is to present the relative frequencies of match scores (genuine/impostor frequency diagram). A match score is the hit value obtained when the currently generated template of the person to be authenticated is compared with the template stored from the enrolment. Genuine persons typically achieve high match scores, while impostors generally have low ones. With this presentation method, all the values of match scores that occur in the test are entered on the abscissa. The ordinate contains in each case the associated relative frequencies of occurrence (i.e. the absolute number of occurrences of a match score value standardised in relation to the total number of all match scores). These values are entered both for genuine persons and impostors. In the ideal case, there is no overlap between the two distribution curves.

secunet
Page 31 of 84
0
5
10
15
20
25
30
35
0 0.05 0.1 0.15 0.2 0.25 0.3 0.35 0.4 0.45 0.5 0.55 0.6 0.65 0.7 0.75 0.8 0.85 0.9 0.95
Match score
Genuine Impostor
Figure 13: example of a genuine-impostor frequency diagram
It is easy to derive the FAR and FRR from this histogram. If one picks a certain match score as the tolerance threshold to distinguish between genuine persons and impostors, then the FAR is derived from the number of match scores of impostors which lie above this threshold as a proportion of the total number of attempts or match scores obtained. Conversely, the FRR is obtained from the number of match scores of genuine persons which lie below the threshold, expressed as a proportion of the associated total number. In this way, FAR-FRR curves can successively be calculated from these distribution curves. These represent the error rates as a function of the threshold.

secunet
Page 32 of 84
0
10
20
30
40
50
60
70
80
90
100
0 0.05 0.1 0.15 0.2 0.25 0.3 0.35 0.4 0.45 0.5 0.55 0.6 0.65 0.7 0.75 0.8 0.85 0.9 0.95 1
Threshold
FRR FAR
Figure 14: example of a FAR-FRR diagram
FAR-FRR diagrams are the most widely used way of presenting the recognition performance of a biometric system. As they are easy to understand, they were also used for BioP I. This way of presenting the data is particularly well suited for setting a threshold for a system for a particular operational purpose. With this type of diagram, it is possible only to a certain extent to make absolute statements about the actual performance of the system and, in particular, to make comparisons between different biometric systems. This is mainly because the match scores obtained for different algorithms are implemented very differently. This means that the match scores and, accordingly, the resulting thresholds for different systems are not comparable. Any scaling factors and transformations can be applied to the distribution of the match scores, altering the appearance of FAR-FRR curves accordingly. For example, frequently individual working areas of the curve are stretched so as to make the system appear more robust to changes in the threshold. However, these methods do not affect the ratio of the FAR and FRR values to each other. This makes it attractive to present the FRR directly as a function of the FAR. The result is to eliminate the parameter of match score and portray the data independently of threshold scaling factors, thus enabling proper comparisons to be made between different biometric systems and system configurations.
This way of presenting the data is called a receiver operating characteristic (ROC) curve. The FRR is presented as a function of the FAR. The ideal ROC curve accepts only values on the co-ordinate axes (FAR�0 � FRR=0 and vice versa). The uppermost point is given by FAR = 0% and FRR = 100% for all systems. By definition, ROC curves cannot rise. Generally it is true that, the closer the curve of a system lies to the axes, the better the recognition performance. The equal error rate (EER), at which FAR=FRR, is derived from the point at which the ROC curve intersects the diagonal of the co-ordinate system.

secunet
Page 33 of 84
0
10
20
30
40
50
60
70
80
90
100
0 10 20 30 40 50 60 70 80 90
FAR [%]
100
Figure 15: example of an ROC diagram
In BioP I, ROC curves were calculated by working out the FAR and FRR for the entire range of possible thresholds. The result is a complete map of performance. With this way of presenting the data, it is easy to compare different systems, by presenting different curves within a single diagram. As the resulting curves do not necessarily lie in an obvious order that permits a simple ranking, the recognition performance can be evaluated by reference to individual working points. The definition of working points is described in section 6.1.2.1.
Several definitions of ROC curves for comparing biometric systems exist in the technical literature. Examples of these definitions include showing (1-FRR) on the ordinate instead of FRR and using the error rates false match rate (FMR) and false non-match rate (FNMR). [BestPrac] recommends the version explained above for the system comparison that was sought in BioP I. This is described there as a detection error trade-off (DET) curve.
In BioP I, no cumulative FRRs10 were determined (for example, the rejection rate after the second equipment activation), but only the rejection rate during the first equipment activation. It was necessary to carry out several recognition trials due to the way that the systems tested worked. In case of non-recognition, new trials were automatically triggered until a timeout occurred.
6.1.2.1 Algorithm comparison and reference base comparison The recognition performance of a biometric system always has to be stated as a combination of FRR and the related FAR. In order to be able to compare the algorithms and reference bases involved, working points were determined. These working points could be oriented to fixed values of either the FAR or the FRR. For BioP I, both directions were of interest. However, the main focus of interest was the aspect of security, i.e. a low FAR. The following points were identified as worth considering within the project team:
�� FAR: 0.01% 0.1% 1%
10 Cumulative in the sense of combining several identification checks into a single trial.

secunet
Page 34 of 84
�� FRR: 1% 2% 5%
The classification and evaluation of these working points according to the BSI Technical Evaluation Criteria [TechEval] are shown in Table 3.
Error rate Value range Evaluation according to criterion catalogue
< 0.3% Very high
0.3% - 1% High
1% - 5% Moderate
FAR
> 5% Low
< 1% Very high
1% - 3% High
3% - 7% Moderate
FRR
> 7% Low
Table 3: classification of error rates
During a comparison, in each case a FAR value or an FRR value had to be selected and the corresponding error rate calculated for the system or algorithm concerned. The results could then be used as a comparison criterion.
0
2
4
6
8
10
12
14
16
18
20
0.0 0.1 0.2 0.3 0.4 0.5 0.6 0.7 0.8 0.9 1.0
FAR [%]
Figure 16: working point FAR = 0.1%
In BioP I, most of the investigations are concentrated on the working point FAR = 0.1%.

secunet
Page 35 of 84
6.2.1
6.1.2.2 System comparison For the assessment of recognition performance of biometric complete systems, in BioP I an identical facial recognition algorithm was used in different complete systems. The tolerance threshold used to determine recognition performance was the same for both systems. The error rates FRR and FAR were calculated for this threshold. The results could then be used as a comparison criterion.
6.2 Test results
Definition of basic data sets In BioP I, all equipment activations were recorded in the database as long as the user ID of the person concerned was known. The manner in which the total set of equipment activations was limited to the subset necessary for the relevant investigation is described below.
Depending on the results to be calculated, it was necessary to exclude certain equipment activations. The exclusion criteria are listed below:
1. Equipment activated outside the defined field test period
2. Equipment activated by project staff/administrators
3. Results that were significantly influenced by changes in the environmental conditions (on one occasion during the field tests there was a lighting failure in the test room)
4. A sequence of equipment activations on one system by one person (which produced statistical dependencies after the first equipment activation which should not be neglected)
5. System in an undefined state (with system A, on several occasions the systems status and user feedback were inconsistent)
6. Malfunction of the camera
7. Swapping of identity cards by subjects (for fun)
8. Uncooperative behaviour by the subjects (deliberately changing appearance by making grimaces, wearing sunglasses etc.)
Whereas it was easy to technically exclude criteria 1 to 4, for criteria 5 to 8 this was only possible with manual support. To flag such cases, a special database report, which made a selection from the total set parameterised on the basis of recognition performance, was implemented. With the aid of the information presented in this report, it was possible to classify the relevant image, while at the same time instances of identity cards being swapped were identified through comparisons with the associated enrolment images. The criteria used to classify the live images presented by this report are shown in Table 4. Analysis of the report resulted in the frequencies stated in the table.

secunet
Page 36 of 84
Selection code Classification Frequency system A Frequency system B
0 No person 115 12
1 No face 69 0
2 Part of face 306 40
3 Posture of the head 19 1
4 Too dark 18 1
5 Too light 0 1
6 Swap 12 9
7 Sunglasses / grimace 8 6
8 More than one person 10 0
9 Camera out of focus 57 0
Table 4: criteria used to classify unsuitable live images
During the system comparison, only some of the exclusion criteria described above were applied, as it was a case of a "scenario evaluation" according to [BestPrac]. Equipment activations where identity cards had been swapped were excluded, along with live images in which no person appeared in the picture. The latter phenomenon occurred mainly due to an error in which system status and use of feedback were inconsistent. In isolated cases, pictures without any person occurred due to deliberate improper use.
According to the analysis concept presented in Section 6.1, in the algorithm and reference base comparisons it was necessary to exclude live images unsuitable for facial recognition which were caused by system- or user-specific incorrect action. In this way all the criteria mentioned were applied.
Depending on the comparison to be carried out, the relevant restricting criteria are summarised in Table 5.
Equipment activations Code Restricting criteria Number, system A
Number, system B
Overall set Over_All_Set Period of field tests
Subject (no one from the project team)
Only first equipment activation in a trial
14,532 14,176
System comparison set (scenario evaluation)
Scenario_Attempt_Set Restrictions corresponding to Over_All_Set
Test subjects with over 50 equipment activations on both systems (User50)
Only verifications with match scores � 0
Purging of live images as per selection codes 0 and 6
11,028 10,886
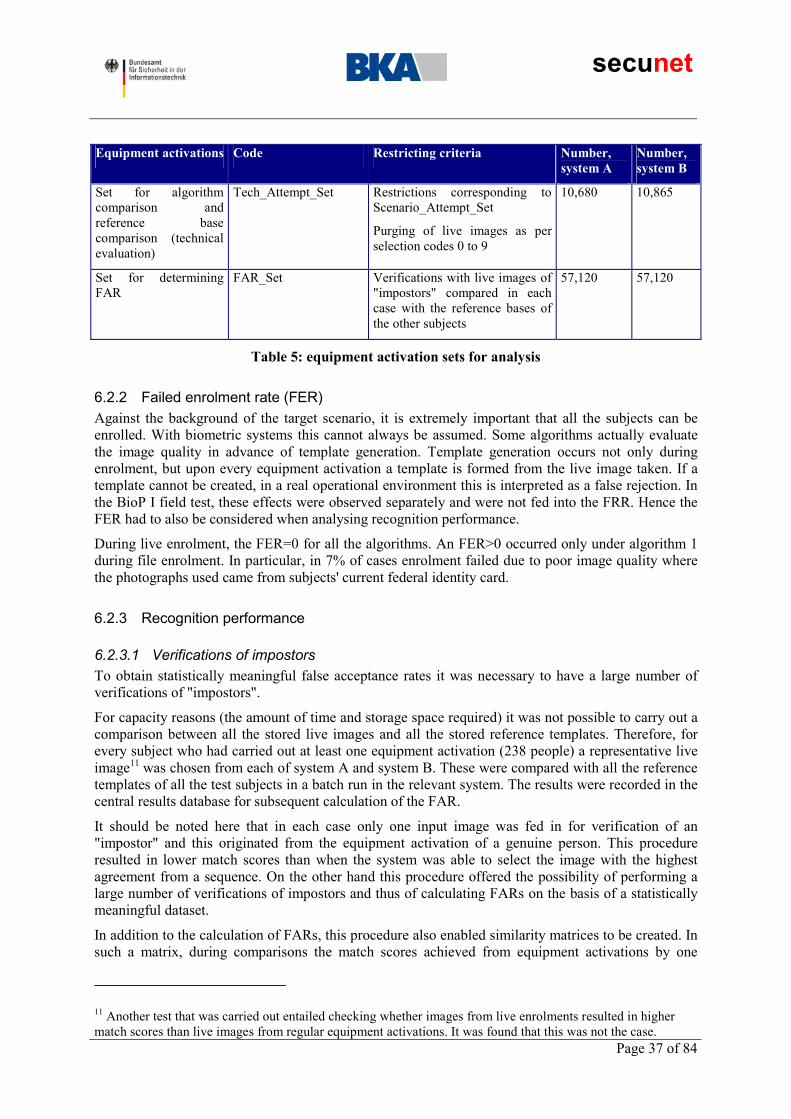
secunet
Page 37 of 84
Equipment activations Code Restricting criteria Number, system A
Number, system B
Set for algorithm comparison and reference base comparison (technical evaluation)
Tech_Attempt_Set Restrictions corresponding to Scenario_Attempt_Set
Purging of live images as per selection codes 0 to 9
10,680 10,865
Set for determining FAR
FAR_Set Verifications with live images of "impostors" compared in each case with the reference bases of the other subjects
57,120 57,120
Table 5: equipment activation sets for analysis
6.2.2
6.2.3
Failed enrolment rate (FER) Against the background of the target scenario, it is extremely important that all the subjects can be enrolled. With biometric systems this cannot always be assumed. Some algorithms actually evaluate the image quality in advance of template generation. Template generation occurs not only during enrolment, but upon every equipment activation a template is formed from the live image taken. If a template cannot be created, in a real operational environment this is interpreted as a false rejection. In the BioP I field test, these effects were observed separately and were not fed into the FRR. Hence the FER had to also be considered when analysing recognition performance.
During live enrolment, the FER=0 for all the algorithms. An FER>0 occurred only under algorithm 1 during file enrolment. In particular, in 7% of cases enrolment failed due to poor image quality where the photographs used came from subjects' current federal identity card.
Recognition performance
6.2.3.1 Verifications of impostors To obtain statistically meaningful false acceptance rates it was necessary to have a large number of verifications of "impostors".
For capacity reasons (the amount of time and storage space required) it was not possible to carry out a comparison between all the stored live images and all the stored reference templates. Therefore, for every subject who had carried out at least one equipment activation (238 people) a representative live image11 was chosen from each of system A and system B. These were compared with all the reference templates of all the test subjects in a batch run in the relevant system. The results were recorded in the central results database for subsequent calculation of the FAR.
It should be noted here that in each case only one input image was fed in for verification of an "impostor" and this originated from the equipment activation of a genuine person. This procedure resulted in lower match scores than when the system was able to select the image with the highest agreement from a sequence. On the other hand this procedure offered the possibility of performing a large number of verifications of impostors and thus of calculating FARs on the basis of a statistically meaningful dataset.
In addition to the calculation of FARs, this procedure also enabled similarity matrices to be created. In such a matrix, during comparisons the match scores achieved from equipment activations by one
11 Another test that was carried out entailed checking whether images from live enrolments resulted in higher match scores than live images from regular equipment activations. It was found that this was not the case.

secunet
Page 38 of 84
subject are shown against the reference templates of all the other subjects. Thus the diagonals contain the match scores which the subject in question achieved during equipment activations with comparisons made with that person's own reference template. Figure 17 presents an excerpt from a similarity matrix by way of example.
4699000019
4699000020
4699000031
4699000042
4699000053
4699000064
4699000075
4699000086469900001
90.7072 0.0734 0.0381 0.0945 0.1371 0.0981 0.1941 0.2434
4699000020
0.0937 0.7225 0.0927 0.1989 0.0442 0.0622 0.2173 0.24294699000031
0.0566 0.0572 0.711 0.0919 0.0317 0.0326 0.0984 0.03014699000042
0.3919 0.2697 0.1052 0.7212 0.1881 0.0911 0.5688 0.30014699000053
0.0715 0.3784 0.1955 0.4943 0.6186 0.3903 0.0987 0.12274699000064
0.0373 0.1624 0.1124 0.0405 0.0574 0.6727 0.1659 0.26714699000075
0.3483 0.1982 0.1819 0.0572 0.0556 0.0579 0.7314 0.3537469900008 0.1269 0.0643 0.0372 0.1326 0.0379 0.032 0.0829 0.7089
Figure 17: excerpt from a similarity matrix
6.2.3.2 Algorithm comparison One of the aims of BioP I was to determine the best algorithm within one system. Here the results are quite clear-cut. For all the reference bases examined, algorithm 1 produced the best recognition performance. For example, this is illustrated by the ROC diagrams for reference bases 4 (Figure 18), 7 (Figure 19) and 8 (Figure 20).
0
10
20
30
40
50
60
70
80
90
100
0 10 20 30 40 50 60 70 80 90
FAR [%]
100
Algorithm 1 Algorithm 1+ Algorithm 2 Algorithm 2+ Algorithm 3 Algorithm 3+
Figure 18: ROC curves for reference base 4 (compressed image file as recommended by ICAO)
With this diagram it is easy to rank the algorithms (the closer the curve is to the axes, the better the recognition performance of the algorithm):
1. Algorithm 1
2. Algorithm 1+
3. Algorithm 3+
4. Algorithms 2 and 2+ virtually indistinguishable

secunet
Page 39 of 84
5. Algorithm 3
0
10
20
30
40
50
60
70
80
90
100
0 10 20 30 40 50 60 70 80 90
FAR [%]
100
Algorithm 1 Algorithm 1+ Algorithm 2 Algorithm 2+ Algorithm 3 Algorithm 3+
Figure 19: ROC curves for reference base 7 (system template from live enrolment)
0
10
20
30
40
50
60
70
80
90
100
0 10 20 30 40 50 60 70 80 90
FAR [%]
100
Algorithm 1 Algorithm 1+ Algorithm 2 Algorithm 2+ Algorithm 3 Algorithm 3+
Figure 20: ROC curves for reference base 8 (photograph from purpose-made identity card)
This ranking order holds true for all the reference bases.
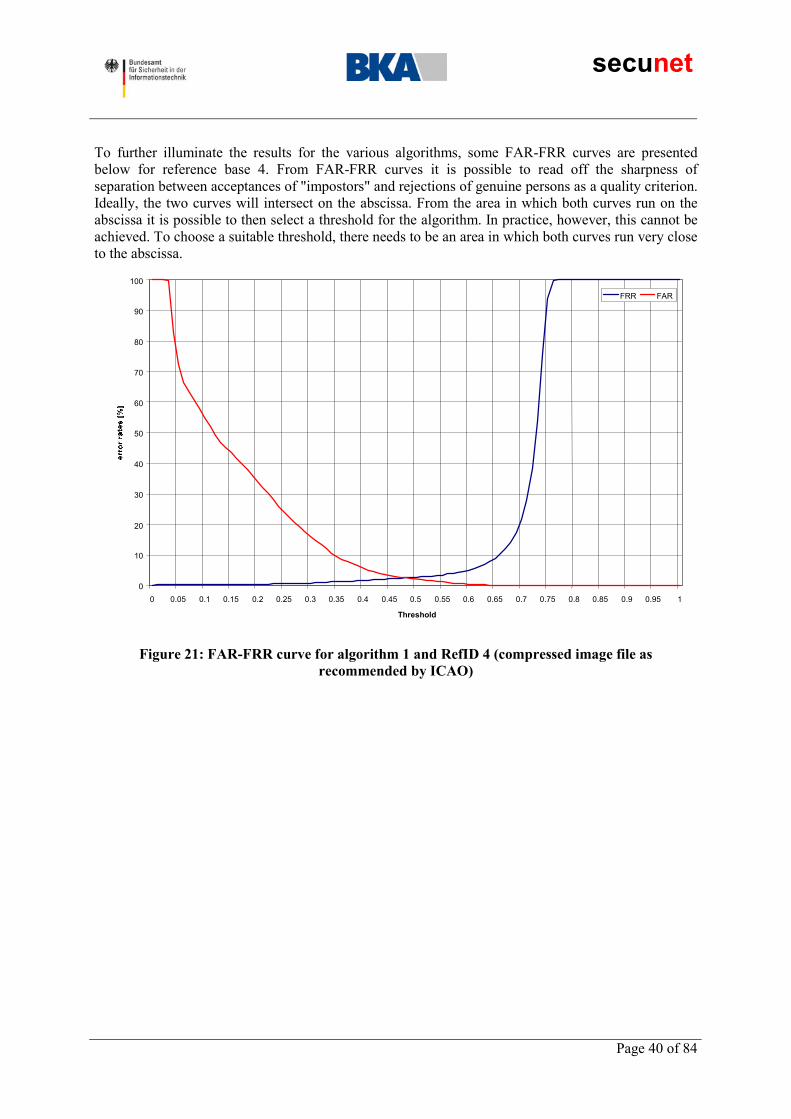
secunet
Page 40 of 84
To further illuminate the results for the various algorithms, some FAR-FRR curves are presented below for reference base 4. From FAR-FRR curves it is possible to read off the sharpness of separation between acceptances of "impostors" and rejections of genuine persons as a quality criterion. Ideally, the two curves will intersect on the abscissa. From the area in which both curves run on the abscissa it is possible to then select a threshold for the algorithm. In practice, however, this cannot be achieved. To choose a suitable threshold, there needs to be an area in which both curves run very close to the abscissa.
0
10
20
30
40
50
60
70
80
90
100
0 0.05 0.1 0.15 0.2 0.25 0.3 0.35 0.4 0.45 0.5 0.55 0.6 0.65 0.7 0.75 0.8 0.85 0.9 0.95 1
Threshold
FRR FAR
Figure 21: FAR-FRR curve for algorithm 1 and RefID 4 (compressed image file as recommended by ICAO)

secunet
Page 41 of 84
0
10
20
30
40
50
60
70
80
90
100
0 0.05 0.1 0.15 0.2 0.25 0.3 0.35 0.4 0.45 0.5 0.55 0.6 0.65 0.7 0.75 0.8 0.85 0.9 0.95 1
Threshold
FRR FAR
Figure 22: FAR-FRR curve for algorithm 2 and RefID 4 (compressed image file as recommended by ICAO)
0
10
20
30
40
50
60
70
80
90
100
0 0.05 0.1 0.15 0.2 0.25 0.3 0.35 0.4 0.45 0.5 0.55 0.6 0.65 0.7 0.75 0.8 0.85 0.9 0.95 1
Threshold
FRR FAR
Figure 23: FAR-FRR curve for algorithm 3 and RefID 4 (compressed image file as recommended by ICAO)
It is clear from these graphs, too, that with algorithms 2 and 3 there is no area in which the error rates are in an acceptable relationship to each other.

secunet
Page 42 of 84
This becomes even clearer when one considers the relative frequencies of match scores for equipment activations by genuine persons and impostors. These are presented (as explained in Section 6.1.2) with the aid of genuine-impostor frequency diagrams. The significant quality criterion which can be derived from genuine-impostor frequency diagrams is the sharpness of separation between the occurrence of match scores for genuine persons and impostors. Ideally, there will be no overlap between the two distribution curves. From the area between the two curves it is then possible to select a threshold for the algorithm. In practice, however, an overlap cannot be ruled out. In order to be able to choose a suitable threshold, however, this overlap should be as small as possible.
0
5
10
15
20
25
30
35
0 0.05 0.1 0.15 0.2 0.25 0.3 0.35 0.4 0.45 0.5 0.55 0.6 0.65 0.7 0.75 0.8 0.85 0.9 0.95
Match score
Genuine Impostor
Figure 24: match score distribution for algorithm 1 and RefID 4 (compressed image file as recommended by ICAO)
Figure 24 shows the best distributions achieved within the framework of BioP I for RefID 4. These were achieved with algorithm 1. Whereas the match scores of impostors are concentrated in an area significantly below 0.7, a relatively small number of match scores of genuine persons, which should not be overlooked, also occurs in this area.
The distribution of match scores achieved with algorithm 2, shown in Figure 25, exhibits a pronounced overlap. In such cases it is not possible to achieve a configuration that would make this algorithm useful for an application.
Still more extreme than algorithm 2 is the distribution obtained with algorithm 3. In this case, a cluster of match scores of genuine persons is found in the same area as the match scores of impostors (see Figure 26).

secunet
Page 43 of 84
0
5
10
15
20
25
30
35
0 0.05 0.1 0.15 0.2 0.25 0.3 0.35 0.4 0.45 0.5 0.55 0.6 0.65 0.7 0.75 0.8 0.85 0.9 0.95
Match score
Genuine Impostor
Figure 25: match score distribution for algorithm 2 and RefID 4 (compressed image file as recommended by ICAO)
0
5
10
15
20
25
30
35
0 0.05 0.1 0.15 0.2 0.25 0.3 0.35 0.4 0.45 0.5 0.55 0.6 0.65 0.7 0.75 0.8 0.85 0.9 0.95
Match score
Genuine Impostor
Figure 26: match score distribution for algorithm 3 and RefID 4 (compressed image file as recommended by ICAO)

secunet
Page 44 of 84
6.2.3.3 Reference base comparison Using algorithm 1, which produces the best recognition performance for all reference bases in the algorithm comparison, it is possible to make comparisons among the reference bases. This in turn is best presented using ROC curves.
0
10
20
30
40
50
60
70
80
90
100
0 10 20 30 40 50 60 70 80 90
FAR [%]
100
Ref1 Ref3 Ref4 Ref5 Ref6 Ref7 Ref8
Figure 27: ROC curves for algorithm 1

secunet
Page 45 of 84
0
1
2
3
4
5
6
7
8
9
10
0.0 0.5 1.0 1.5 2.0 2.5 3.0 3.5 4.0
FAR [%]
Ref1 Ref3 Ref4 Ref5 Ref6 Ref7 Ref8
Figure 28: section of ROC curves for algorithm 1
From the diagrams shown in Figure 27 and Figure 28, a clear gradation is visible between the individual reference bases. The best recognition performance is associated with the system-specific template from live enrolment, which is far better than the image files based on the frontal photographs. Here the moderately compressed image file produces slightly better results than the heavily compressed file. Once again the results obtained using the photographs on the purpose-made identity card and EU visa are significantly worse. Very poor recognition performance occurs with the image file based on the semi-profile photograph and with the current federal identity card.
In summary, the ranking that emerges is as follows:
1. RefID 7: system template from live enrolment
2. RefID 1: image file frontal photograph, no compression
3. RefID 4: image file frontal photograph, compressed
4. RefID 8: photograph on purpose-made identity card
5. RefID 3: photograph on EU visa
6. RefID 5: image file semi-profile photograph
7. RefID 6: photograph on federal identity card
These results are illustrated effectively by the diagrams below.

secunet
Page 46 of 84
0
10
20
30
40
50
60
70
80
90
100
0 0.05 0.1 0.15 0.2 0.25 0.3 0.35 0.4 0.45 0.5 0.55 0.6 0.65 0.7 0.75 0.8 0.85 0.9 0.95 1
Threshold
FRR FAR
Figure 29: FAR-FRR curve for algorithm 1 and RefID 4 (compressed image file as recommended by ICAO)
0
10
20
30
40
50
60
70
80
90
100
0 0.05 0.1 0.15 0.2 0.25 0.3 0.35 0.4 0.45 0.5 0.55 0.6 0.65 0.7 0.75 0.8 0.85 0.9 0.95 1
Threshold
FRR FAR
Figure 30: FAR-FRR curve for algorithm 1 and RefID 6 (current federal identity card)
Whereas Figure 29 shows a curve that is typical for biometric systems, a system that produces the behaviour shown in Figure 30 is totally unsuitable.

secunet
Page 47 of 84
0
5
10
15
20
25
30
35
0 0.05 0.1 0.15 0.2 0.25 0.3 0.35 0.4 0.45 0.5 0.55 0.6 0.65 0.7 0.75 0.8 0.85 0.9 0.95
Match score
Genuine Impostor
Figure 31: match score distribution for algorithm 1 and RefID 4 (compressed image file as recommended by ICAO)
0
5
10
15
20
25
30
35
0 0.05 0.1 0.15 0.2 0.25 0.3 0.35 0.4 0.45 0.5 0.55 0.6 0.65 0.7 0.75 0.8 0.85 0.9 0.95
Match score
Genuine Impostor
Figure 32: match score distribution for algorithm 1 and RefID 6 (current federal identity card)
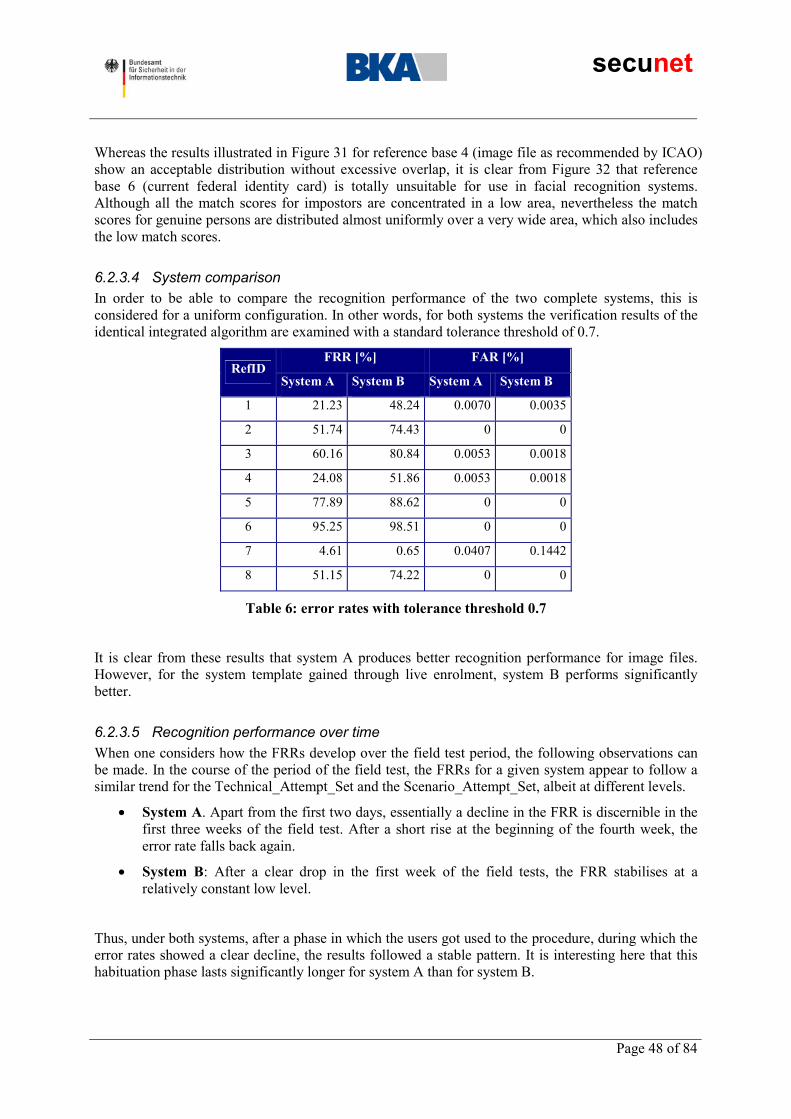
secunet
Page 48 of 84
Whereas the results illustrated in Figure 31 for reference base 4 (image file as recommended by ICAO) show an acceptable distribution without excessive overlap, it is clear from Figure 32 that reference base 6 (current federal identity card) is totally unsuitable for use in facial recognition systems. Although all the match scores for impostors are concentrated in a low area, nevertheless the match scores for genuine persons are distributed almost uniformly over a very wide area, which also includes the low match scores.
6.2.3.4 System comparison In order to be able to compare the recognition performance of the two complete systems, this is considered for a uniform configuration. In other words, for both systems the verification results of the identical integrated algorithm are examined with a standard tolerance threshold of 0.7.
FRR [%] FAR [%] RefID
System A System B System A System B
1 21.23 48.24 0.0070 0.0035
2 51.74 74.43 0 0
3 60.16 80.84 0.0053 0.0018
4 24.08 51.86 0.0053 0.0018
5 77.89 88.62 0 0
6 95.25 98.51 0 0
7 4.61 0.65 0.0407 0.1442
8 51.15 74.22 0 0
Table 6: error rates with tolerance threshold 0.7
It is clear from these results that system A produces better recognition performance for image files. However, for the system template gained through live enrolment, system B performs significantly better.
6.2.3.5 Recognition performance over time When one considers how the FRRs develop over the field test period, the following observations can be made. In the course of the period of the field test, the FRRs for a given system appear to follow a similar trend for the Technical_Attempt_Set and the Scenario_Attempt_Set, albeit at different levels.
�� System A. Apart from the first two days, essentially a decline in the FRR is discernible in the first three weeks of the field test. After a short rise at the beginning of the fourth week, the error rate falls back again.
�� System B: After a clear drop in the first week of the field tests, the FRR stabilises at a relatively constant low level.
Thus, under both systems, after a phase in which the users got used to the procedure, during which the error rates showed a clear decline, the results followed a stable pattern. It is interesting here that this habituation phase lasts significantly longer for system A than for system B.

secunet
Page 49 of 84
0
1
2
3
4
5
6
7
15.05.2003 22.05.2003 29.05.2003 05.06.2003 12.06.2003 19.06.2003 26.06.2003
time
System B Tech_Attempt_Set System A Tech_Attempt_Set
System B Scenario_Attempt_Set System A Scenario_Attempt_Set
Figure 33: FRR trend over time (threshold 0.7)
6.2.4 Individual user statistics
6.2.4.1 Tech_Attempt_Set The individual user statistics for Tech_Attempt_Set constitute the FRRs (with FAR = 0.1%) specifically for every subject from the User50 population. Ideally, the FRRs for different subjects should all be as low as possible. High FRRs for individual persons suggest that these people's characteristics cannot be sufficiently well evaluated by the algorithm or by the reference base in question.
From Figure 34 it can be seen that with RefID 4 (compressed image file as recommended by the ICAO) approx. one-tenth of the test population is rejected on over one-third of their interactions with the FR systems.
For reference base 7 (template from live enrolment), the individual user statistics are significantly different for the same FAR. Whereas only two subjects had an FRR of over 10%, for most of the User50 population the FRR was virtually nil.

secunet
Page 50 of 84
0
10
20
30
40
50
60
70
80
90
100
2 12 22 32 42 52 62 72 82 92 102 112 122 132 142 152
No. of users
Figure 34: individual user statistics for algorithm 1 and RefID 4 (compressed image file as recommended by ICAO) (FAR=0.1%)
0
10
20
30
40
50
60
70
80
90
100
2 12 22 32 42 52 62 72 82 92 102 112 122 132 142 152
No. of users
Figure 35: individual user statistics for algorithm 1 and RefID 7 (template from live enrolment) (FAR=0.1%)

secunet
Page 51 of 84
0
10
20
30
40
50
60
70
80
90
100
2 12 22 32 42 52 62 72 82 92 102 112 122 132 142 152
No. of users
Figure 36: individual user statistics for algorithm 1 and RefID 8 (template from purpose-made identity card) (FAR=0.1%)
For reference base 8 (image from purpose-made identity card) there is no satisfactory distribution of individual users' FRRs. For around one-third of the User50 test population, the FRRs are partly well above the overall FRR for this reference base.
Significantly poorer individual user statistics were obtained with the other algorithms.
Another interesting result is the standard deviation of the individual users' FRRs. A high standard deviation means that for a relatively large number of subjects, recognition performance was worse than the mean. Here, reference base 7 (template from life enrolment) clearly performs the best, followed by reference base 1 (image file frontal photograph) and reference base 4 (compressed image file as recommended by the ICAO). The greatest scatter occurs with reference bases 5 (image file semi-profile photograph) and 6 (current federal identity card).
6.2.4.2 Scenario_Attempt_Set The individual user statistics for Scenario_Attempt_Set constitute the FRRs (with threshold set at 0.7) specifically for every subject from the User50 population. Ideally, the FRRs for different subjects should all be as low as possible. High FRRs for certain individuals suggest that either the capture of these people's characteristics is problematic or else that characteristics of these people cannot be sufficiently well evaluated by the algorithm or by the reference base under consideration.

secunet
Page 52 of 84
0
5
10
15
20
25
30
35
40
2 12 22 32 42 52 62 72 82 92 102 112 122 132 142 152
No. of users
Figure 37: individual user statistics for system A and RefID 7 (threshold 0.7)
0
5
10
15
20
25
30
35
40
2 12 22 32 42 52 62 72 82 92 102 112 122 132 142 152
No. of users
Figure 38: individual user statistics for system B and RefID 7 (threshold 0.7)
When one compares Figure 37 and 38, it becomes clear that for a majority of the test population under consideration recognition performance is significantly worse with system A. When one compares the standard deviations of individual users' FRRs, this is corroborated (system A: 5.45%, system B: 1.56%).

secunet
Page 53 of 84
6.2.5
6.2.6
There are two possible causes of this effect:
�� System B produced significantly better recognition performance than system A for reference bases which resulted from multiple image enrolments, as they were carried out during live enrolment.
�� The data acquisition unit used with system A produced poor recordings of facial characteristics for a number of subjects.
At this point we will not compare the individual user statistics of the two systems for the other reference bases. Because the error rates were calculated from the threshold defined for reference base 7, it is not necessarily helpful to consider the other reference bases. Nevertheless, these results confirm the finding discussed in section 6.2.3.5 that system A possesses advantages compared with system B for reference bases which result from a single image enrolment (image files, photographs).
Analysis of face detection The process of facial recognition can basically be broken down into two stages, face detection and face recognition. Face detection entails locating the face in the environment. The face is then extracted and passed to the facial recognition algorithm as a canonic representation. Accordingly, facial recognition as a total process can only be as good as the combination of face detection and face recognition algorithm concerned.
The complete systems examined in BioP I cannot be compared in this way. Whereas system B used the classical approach which allows corresponding analysis, system A worked in a different way due to an integrated intelligent camera system: independently of the integrated algorithms, a pre-processor carried out face detection. A scene geared towards the face was then passed to the integrated algorithms. The classic face detection process was then applied for the integrated algorithms and the actual facial recognition algorithm was initiated on these results.
Because the vendor implementation was partly at variance with the specification, it is not possible to draw any accurate conclusions regarding the error rate in the face detection process. However, the relationship between the two complete systems is very clear. Whereas under system B errors during face detection were extremely rare, the pre-processing unit of system A failed comparatively frequently. In over five percent of the recordings, complete image sections were prepared (not focused on the face).
General results on systems and vendors In the specification, the participating vendors were asked to provide systems suitable for unattended field tests to a particular deadline. Bearing in mind the target scenario for the facial recognition systems, these non-biometric-specific requirements are of an importance which should not be overlooked.
The systems involved and their vendors were investigated against the corresponding criteria.
secunet
Page 54 of 84
6.3.1
6.3.2
These included:
�� Initial operation. In the context of initial operation, the timely provision of the required functionality and its correct implementation were particularly relevant.
�� System errors. Of interest here were the major errors that occurred during the field test.
�� Failure behaviour: Where the systems are to be operated unsupervised, their reliability is very important. Accordingly, all system failures that occurred over the field test were logged. This was done from information provided by the BKA administrators, from the special EventSentry tool and the notes jotted down by subjects, subject to a check on the basis of EventSentry and results entries.
�� Administration overhead. The use of IT systems always entails a certain administration overhead. This should be kept as low as possible. Moreover, suitable tools should exist to support the administrator, for example, reporting mechanisms. Last but not least, it is important that the user interface should be intuitive.
�� User-induced problems. With biometric systems it can happen that, for example, due to errors in the system design, individual persons are harder to recognise than others due to their particular characteristics (e.g. body size). This aspect is relevant to the analysis of user-induced problems.
�� Service and support from the vendor. This criterion relates to whether the vendor has provided adequate service and support for the test to be carried out without problems. It is particularly interesting here to know whether any errors that occurred could be quickly solved.
These results have not been included in this public final report.
6.3 Statistical significance of the results and error analysis
Evaluation of statistical significance of the results The formula provided in [TechEval] for measuring significance has not been used here. For the sake of simplicity, statistical significance can be said to express the probability of the observed empirical findings occurring if a hypothesis to this effect that is formulated in advance is correct. This is based on the assumption of a random sample, in which every element in the population has the same chance of being included in the sample. This was not the case in the population examined in the BioP I project (see also Section 6.3.2.1.1).
Again, when one considers the sources of error presented in Section 6.3.2, the results obtained in BioP I are very significant. This statement is based on the fact that a very wide and substantial empirical database was available. Thus, empirical data was collected for 241 subjects. The results obtained are based on a population of 152 subjects, each of whom had effected at least 50 activations of the equipment. Thus this relatively large test population yielded over 10,000 equipment activations for each of the systems tested (and hence for each of the integrated algorithms and each of the reference bases under investigation). The considerable size of the resulting data set permits a far-reaching and sound insight into the capability and assessment of facial recognition systems.
Error analysis When collecting the results it is necessary to bear in mind that during the conduct of technical investigations sources of error can never completely be ruled out. The errors that occur can be classified according to their cause, as follows:
�� Systematic errors: errors which result from the basic test procedure

secunet
Page 55 of 84
�� Implementation errors: errors that arise through incorrect implementation or integration of (part) components
�� Analysis errors: errors induced by the analysis methods used
6.3.2.1 Systematic errors
6.3.2.1.1 Choice of test population The questions examined in the field test are mostly not confined to the group of persons considered in the investigation. For example, one might wish to generalise the results obtained to the population of Germany at large. For this problem of significance or representativeness, two kinds of solution are available in empirical research.
The first possibility, referred to as "deliberate selection", entails reproducing known parameters of the population at large (i.e. all German citizens), such as the proportion of men and women or the age distribution, in the sample selection. This approach is based on the idea that the sample thus created is a substitute for the total population to be described. However, within the framework of the BioP I project, it was not possible to construct such a sample, as the subjects were all recruited from the BKA workforce.
The second possible way of creating a sample is known as "random selection". Here, every element in the total population (i.e., for example, every German citizen) has the same opportunity of being included in the sample. If the selection is at least nearly random, then it is possible to transfer the results to the relevant total population through the application of inductive statistical procedures with a quantifiable degree of certainty, statistical significance or probability of error. However, because the sample used in BioP I was confined to employees of the BKA, it was not possible to have a truly random sample.
6.3.2.1.2 Selection of image material for verification The parallel comparison of different reference bases and different algorithms requires that all the verification processes running in the background work with the same image material. However, this was only optimally selected for the combination of master reference and master algorithm. Hence the possibility that the recognition performance associated with non-master reference bases and non-master algorithms will be worse cannot be ruled out. Despite this systematic error, comparability of the verifications running in the background can be assumed.

secunet
Page 56 of 84
6.3.2.1.3 Factors influencing performance To capture the results data necessary for the analysis, the facial recognition systems had to incorporate mechanisms for logging the corresponding data records in a central database. In particular, it is inevitable that the transfer of image data records influences the process time. Since, however, the same assumptions in this respect applied to all the systems, the comparability of the results obtained is not impaired by this source of error.
6.3.2.2 Implementation errors With regard to the integration of components of the facial recognition systems, potential sources of error exist which have a not inconsiderable influence on the recognition performance of the overall system. For example, the following important points deserve a mention:
�� non-optimal integration and configuration of an algorithm
�� use of camera systems which do not produce optimal image material
6.3.2.3 Analysis errors As well as the errors caused by the numeric computations (e.g. rounding errors, limits on accuracy), certain other important sources of error must also be considered.
�� Data material used. The analysis is based on data collected throughout the field test phase. Despite being preceded by a teach-in phase, comparatively high error rates were observed during the first few days of the field tests. If these days were excluded from the analysis, the overall results would be better.
�� Calculation of FAR. In BioP I, the FAR was calculated on the basis of individual image verifications. In real operational scenarios, however, verifications of "impostors" would be carried out on the basis of image sequences. Since this could result in higher match scores, it is necessary to use higher thresholds. This in turn means that the FRR is worse.
�� Statistical dependencies during FRR calculation. The FRR was calculated on the basis of activations by a fixed test population. As each of the subjects from this population conducted many activations, all of which were fed into the analysis, the FRR calculation is not based on completely independent statistical events.
�� Statistical dependencies during FAR calculation. The FAR was calculated from verifications of live images of all the subjects, in each case compared with the reference templates of all the other subjects. This resulted in two-way comparisons; hence the FAR calculation is not based on completely independent statistical results.

secunet
Page 57 of 84
7
7.1.1
7.1.2
Analysis of the additional investigations
7.1 Technical investigations
Verifications of impostors To ascertain the susceptibility to errors to attempts to outwit the system by impostors, verifications were carried out in which comparisons were made between live images of subjects and the reference templates of other subjects. [BestPrac] refers to these as "zero-effort attempts". This test carried out with the image files described in Section 6.2.3.2.
To quantify the effect on the match scores obtained during verification of impostors of the FR mechanism checking an image sequence instead of an individual image, an appropriate test was carried out with live verification checks.
For this purpose a subgroup of 21 persons, who approximated to the overall subject population in terms of the characteristics of sex, beards and spectacles, was selected from the field test population.
In this test, subjects tried authenticating themselves using the verification means (purpose-made identity card) of every other subject. This test was carried out in the same environment and under the same conditions as the regular field test, except that these trials were supervised. The results were recorded in the central database.
Analysis of the results confirms the supposition that impostors generally achieve significantly better match scores during verifications on the basis of image sequences. This needs to be taken into account when selecting the tolerance thresholds for real operational environments.
Variation of reference data This test examined the extent to which high compression and reduced resolution of the reference data impaired recognition performance. In all cases the test was based on a frontal photograph of the subject. In the variants presented in Table 7, this was used as the reference base in the extended test.
The background to this investigation is the need to minimise the amount of storage space required to store images held as a file on the identification document.

secunet
Page 58 of 84
RefID Description Format Typical file size
Test compression
Test resolution
AltRef1 Identical to RefID 1 from field test (photoshop quality 10)
JPEG 75KB
X
X
AltRef2 Identical to RefID 4 from field test (photoshop quality 2)
JPEG 14KB
X
AltRef3 Second highest photoshop compression (quality 1)
JPEG 12KB
X
AltRef4 Highest photoshop compression (quality 0)
JPEG 11KB
X
AltRef5 Reduced resolution (150 dpi) with photoshop quality 10
JPEG 32KB
X
Table 7: image files used for additional reference bases12
This test was carried out without any interactions on the part of subjects. One live image of one system was selected for every subject in the field test who had completed at least one trial (238 people). These live images were compared in a batch run in the relevant system against the associated, additionally enrolled alternative reference templates for the subject in question. The various test cases are thus based on 238 independent verifications. The results of the individual comparisons were recorded in the central results database.
The following points should be noted in connection with the enrolment of the image files:
�� Reference bases AltRef1 to AltRef4 (different compression levels) were enrolled by all the algorithms without any problems.
�� It was not possible for reference base AltRef5 (low resolution) to be enrolled by those versions of the algorithms which were supplemented by an alternative face finder (Plus versions).
On the basis of the verification results obtained (match scores), algorithm-specific FRRs (see Table 8) were calculated. In each case, the value of the working point at which FAR = 0.1% for AltRef1 was chosen as the threshold. In this way, the same threshold was used to calculate the FRR within a given algorithm for all the alternative reference bases.
12 Photoshop quality levels range from 0 to 12, whereby 0 represents the poorest quality (highest compression) and 12 the best quality (least compression).

secunet
Page 59 of 84
MeID AltRef1 AltRef2 AltRef3 AltRef4 AltRef5
Algorithm 1 4.64 5.91 7.59 8.86 6.78
Algorithm 1+ 8.40 9.66 11.34 10.50 -
Algorithm 2 65.97 65.97 64.71 64.71 66.24
Algorithm 2+ 61.76 63.03 60.92 62.18 -
Algorithm 3 26.05 30.25 30.25 33.19 32.07
Algorithm 3+ 14.29 18.49 18.07 24.37 -
Table 8: FRRs expressed as [%] for alternative reference bases (FAR=0.1%)
As one would expect, a deterioration in recognition performance was observed as the degree of compression increased. A similar trend occurred when the resolution was reduced.
7.1.3 Variation of environmental conditions As biometric systems record characteristic features of persons from the environment, the environmental conditions exercise a significant influence. For facial recognition, the prevailing lighting conditions are extremely pertinent. In particular, the intensity of lighting and the nature of the incidence of light have a material effect, especially the latter.
As these tests are comparatively time-consuming and the focus here was more on qualitative than quantitative results, the test group was kept very small. The test group comprised 13 people who were volunteers from the staff of secunet in Essen. Subjects were chosen in such a way that there were several permutations of each of the characteristics sex, beard, spectacles, hair style, make-up and ethnic origin.
These tests were carried out in a laboratory at secunet's Essen site. Uniform illumination was achieved using the existing ceiling lighting and covering the windows with virtually opaque curtains.
Variation of the light intensity and the creation of different kinds of incidence of light were implemented as follows:
�� Light falling on the subject from in front: lighting from a commercially available halogen spotlight (500 watts) approx. 1.5m away for the purpose of creating glare
�� Light falling on the subject from the side: lighting from a commercially available halogen spotlight (500 watts) approx. 1m away for the purpose of casting shadows
�� Light falling on the subject from behind: daylight allowed into the room by opening the window curtains for the purposes of creating counter-light.

secunet
Page 60 of 84
Incidence of light System A System B
Normal conditions 120 123
From the front 310 290
From the side 1300 1300
From behind 310 260
Table 9: illumination level (lux) in the secunet laboratory13
For each of the two systems, every subject underwent identity verification for all the conditions examined over a period of several days. The total numbers of trials were as follows:
�� Normal conditions: 650
�� Light from the front: 325
�� Light from the side: 325
�� Light from behind: 325
Due to the optimal laboratory conditions and the fact that the subjects were supervised, very high match scores were achieved on both systems under normal lighting conditions.
Using the verification results (match scores) recorded, algorithm-specific FRRs were calculated for the working points at which the FAR was 0.1%.
The following is a summary of the salient points:
�� Incidence of light from the front: under system A, there was a significant deterioration of the FRR. Only for RefID 7 (template from live enrolment) was the deterioration moderate.
�� Incidence of light from the front: for system B the FRR improved for the templates based on image files (RefID 1, 3, 4, 5, 8). For the template based on live enrolment (RefID 7) there was a very pronounced deterioration in the FRR.
�� Incidence of light from the side: for both systems, there was a pronounced deterioration in the FRRs.
�� Incidence of light from behind: under system A, there was a significant deterioration in the FRR.
�� Incidence of light from behind: for system B this had no noticeable effect on FRR.
7.1.4
Influence of the age of the identity card This investigation checked the extent to which recognition performance against the photo identity card depended on the age of the identity card. This was examined using subjects' current federal identity cards (RefID 6 of the field test).
From the entire field test population, a subgroup of 228 persons volunteered to make their current federal identity cards available for this investigation14. The age of each identity card was recorded. However, only the identity cards of the User50 population were included in the investigation – a total of 144 cards.
13 As the tests were carried with daylight entering the room from behind the person, the illumination level varied according to the weather. The values specified were recorded with light clouding. 14 The age of two identity cards exceeded the maximum age considered.

secunet
Page 61 of 84
Total test population Population User50 Age of ID card (years) Absolute number Relative propn. [%] Absolute number Relative propn. [%]
a ≤ 2 64 28.32 39 27.08
2 < a ≤ 4 76 33.63 44 30.56
4 < a ≤ 6 47 20.80 34 23.61
6 < a ≤ 8 25 11.06 16 11.11
8 < a ≤ 10 14 6.19 11 7.64
Total 226 100.00 144 100.00
0
5
10
15
20
25
30
35
a ≤ 2 2 < a ≤ 4 4 < a ≤ 6 6 < a ≤ 8 8 < a ≤ 10
[%]
Total test populationPopulation User50
Figure 39: age distribution (in years) of the identity cards
Using the verification results (match scores) collected during the field test, algorithm-specific FRRs were calculated for the User50 population and the working points at which the FAR for RefID 6 amounted to 0.1% (see Figure 40).

secunet
Page 62 of 84
0
10
20
30
40
50
60
70
80
90
100
Algorithm 1 Algorithm 1+ Algorithm 2 Algorithm 2+ Algorithm 3 Algorithm 3+
FRR
[%]
0 ≤ a ≤ 2 2 < a ≤ 4 4 < a ≤ 6 6 < a ≤ 8 8 < a ≤ 10
Figure 40: FRR as a function of identity card age (FAR = 0.1%)
For all algorithms there is a clear trend that FRR rises with identity card age. The fact that in the highest age bracket considered (identity card 8-10 years old) the FRR in some cases dropped back again can be explained in terms of the relatively small sample size (eleven identity cards in this group).
7.1.5 Influence of identity card quality This investigation checked the extent to which recognition performance against the photo identity card depended on the quality of the identity card. As the purpose-made identity cards used in the field test were brand new, the investigation into the effects of identity card quality was based on subjects' current federal identity cards (RefID 6).
From the entire field test population, a subgroup of 228 persons volunteered to make their current federal identity card available for the investigation.
At the time of scanning in current federal identity cards in advance of the field test, the cards were assessed according to the following criteria and classified by degree of deterioration:
�� kinks
�� scratches
�� tears
�� dirt
The following levels of deterioration were defined:
�� no deterioration = 0
�� moderate deterioration = 1
�� pronounced deterioration = 2
During the evaluation of identity card quality, only the area containing the photograph was considered.

secunet
Page 63 of 84
The identity card quality was then defined as the sum of the values obtained by a given identity card on all the criteria. The resulting values lay between 0 and 8, whereby 0 constituted the best possible identity card quality.
This permitted classification into the following quality brackets:
�� High identity card quality total < 1
�� Medium identity card quality total between 1 and 3
�� Poor identity card quality total > 3
Total test population Population User50 ID card quality Absolute number Relative propn. [%] Absolute number Relative propn. [%]
High 199 87.28 123 84.83
Medium 27 11.48 21 14.48
Low 2 0.88 1 0.69
Total 228 100.00 145 100.00
0102030405060708090
High Medium Low
[%]
Total test populationPopulation User50
Figure 41: distribution of identity card quality
The high proportion of identity cards rated as being of high quality suggests that the identity card is very robust in the area of the photograph.
Due to the small sample size for identity cards of medium and low quality, it is not appropriate to compare the FRRs for the different quality levels quantitatively. Therefore this will not be done at this point.
7.1.6 Resilience of FR systems to attempts to outwit them One important aspect in the evaluation of biometric systems is the extent to which they can be outwitted. A system is deemed to have been outwitted if, after reproducing the biometric characteristic, it is possible to obtain a positive verification even though the characteristic presented is not authentic.
As the investigation of resilience was not the primary objective of the BioP I project, no special security mechanisms (e.g. device which ensures that the face belongs to a living person) were requested of the system vendors.

secunet
Page 64 of 84
The verification of biometric characteristics will never be able to guarantee 100% resilience. Amongst other reasons, this is due to the fact that the goal of an acceptable false rejection rate results in the setting of a threshold which could be exploited by an aggressor seeking to outwit the system.
One difficulty for an aggressor during verification is the fact that he has to be in possession of a token (in the case of BioP I, the purpose-made identity card) of the person whose biometric characteristics he wishes to assume.
Trials involving the use of fakes were carried out in secunet's test laboratory in Essen. These tests examined whether verifications with fakes produce successful results and whether fraudulent attempts are accepted. As this security investigation was not one of the primary objectives of BioP I, elaborate attacks were not examined (for further details on the classification of attacks, see Table 10). Again, attacks on the relevant operating system or the application software were not carried out either, as it was assumed that these can be protected against external attackers in the target operational environment. The computer systems used were only examined for vulnerabilities using a penetration tool.
Little effort Moderate effort Large amount of effort
Motivation of the attacker Unintentional penetration, doing it for fun
Curiosity, competition Criminal intent, secret service activity, espionage
Information required None Information available in the public domain
Insider knowledge
Amount of preparation time required
Little Hours to days Weeks
Amount of time required to carry out attack
Little Hours to days Weeks
Financial outlay None Low Virtually unlimited financial resources required
Additional resources None Simple resources Specialist tools and similar
Table 10: criteria used to classify attacks (classes of external perpetrator)
7.1.6.1 Attempts to outwit the system with fakes Trials based on the use of fakes were only carried out for reference base 7 (system template) and algorithm 1, as there was relatively little scatter in the match scores obtained for this combination during the field test and the results of attempts to outwit the system were therefore easier to reproduce.
Attempts to outwit the system were made both with photographs (black-and-white and colour) and videos. In each case an appropriate photograph of a genuine person was prepared and presented to the data acquisition unit. Under both systems, the fake was accepted as the genuine person.
7.1.6.2 Attempts to outwit the system by persons with similar biometric characteristics People with similar biometric characteristics do not necessarily also look similar. Nevertheless, first of all trials were carried out with visually similar persons. Most of the match scores obtained fell within a relatively low range.
However, in one case the values presented below were achieved.
Procedure:
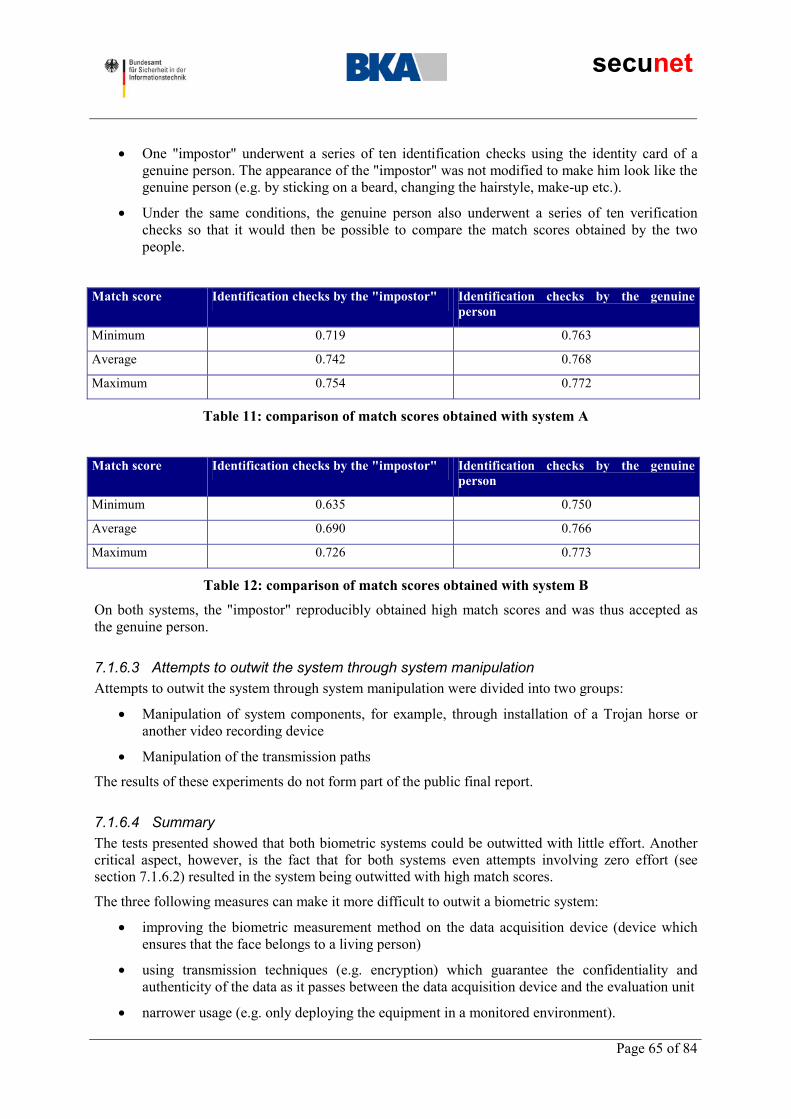
secunet
Page 65 of 84
�� One "impostor" underwent a series of ten identification checks using the identity card of a genuine person. The appearance of the "impostor" was not modified to make him look like the genuine person (e.g. by sticking on a beard, changing the hairstyle, make-up etc.).
�� Under the same conditions, the genuine person also underwent a series of ten verification checks so that it would then be possible to compare the match scores obtained by the two people.
Match score Identification checks by the "impostor" Identification checks by the genuine person
Minimum 0.719 0.763
Average 0.742 0.768
Maximum 0.754 0.772
Table 11: comparison of match scores obtained with system A
Match score Identification checks by the "impostor" Identification checks by the genuine person
Minimum 0.635 0.750
Average 0.690 0.766
Maximum 0.726 0.773
Table 12: comparison of match scores obtained with system B
On both systems, the "impostor" reproducibly obtained high match scores and was thus accepted as the genuine person.
7.1.6.3 Attempts to outwit the system through system manipulation Attempts to outwit the system through system manipulation were divided into two groups:
�� Manipulation of system components, for example, through installation of a Trojan horse or another video recording device
�� Manipulation of the transmission paths
The results of these experiments do not form part of the public final report.
7.1.6.4 Summary The tests presented showed that both biometric systems could be outwitted with little effort. Another critical aspect, however, is the fact that for both systems even attempts involving zero effort (see section 7.1.6.2) resulted in the system being outwitted with high match scores.
The three following measures can make it more difficult to outwit a biometric system:
�� improving the biometric measurement method on the data acquisition device (device which ensures that the face belongs to a living person)
�� using transmission techniques (e.g. encryption) which guarantee the confidentiality and authenticity of the data as it passes between the data acquisition device and the evaluation unit
�� narrower usage (e.g. only deploying the equipment in a monitored environment).

secunet
Page 66 of 84
7.2.1
7.2 Investigation of user acceptance Within the framework of the BioP I project, in-depth statistical investigations were used to examine acceptance of the biometric systems tested. The investigation of user acceptance was based on three questionnaires completed by the subjects, at the beginning, half-way through and at the end of the field test. The first questionnaire was completed prior to the start of the test phase, the second approximately half-way through the test phase and the third at the end of the test phase.
Ratings of the systems The following is a summary of the main parameters used to assess the facial recognition systems used in the field test. Ratings were provided on the basis of the marking scheme employed in German schools, under which 1 is the best mark and 6 is the worst mark (see Table 22 below).
�� On the issue of ease of use, system B had a slight advantage over system A, and the ratings did not change significantly between half-way through and the end of the study. The fact that both systems were given marks of well under 2 suggests that the systems tested were already very easy to use.
�� Ratings of recognition accuracy, in which once again system B performed the best, deteriorated slightly in the course of the experiment, although one would expect recognition accuracy to actually increase as subjects became more familiar with the systems. One possible explanation is that the users became more discerning over time and hence had higher expectations of the systems.
�� With regard to ratings of speed, system B emerged as better than system A. The discrepancy between the two systems is bigger in this area than in all the other categories of questions.
�� Again, system B scored better on susceptibility to errors. The ratings in this area were the least positive among all the categories of questions asked. This suggests that in the users' judgement, lack of susceptibility to errors was the biggest of all the possible shortcomings examined.
�� When it came to flexibility, a large number of people failed to rate this parameter. This may be due to the fact that many of the subjects did not significantly change their external appearance as regards spectacles, hairstyle or beard during the test phase. The ratings deteriorated in the course of the test. This could be because the difference between subjects' appearance and the reference data became greater over time, and/or subjects' subjective judgement could have changed.
�� Finally, the generally more positive assessment of system B compared with system A is confirmed in the overall ratings of the systems, which did not change significantly in the course of the test. In the final questionnaire, system A was awarded an average mark of 2.7 compared with 1.8 for system B.

secunet
Page 67 of 84
0
1
2
3
4
Ease of use Recognition accuracy Speed Susceptibility to errors Flexibility Overall assessment
System A System B
Figure 42: subjects' ratings of the systems at the end of the field test
To conclude, system B was rated more positively by subjects than system A. In all five individual categories and also in the overall assessment, system B was awarded scores several tenths of a mark higher than system A. On the other hand, despite being rated less positively, the results for system A should not be viewed as negative, as all the mean marks lay between 1.7 and 3.3.
All in all, the user ratings of the systems can be described as encouraging. However, it should be noted that in the course of the experiment subjects' initial ratings of recognition accuracy and tolerance to changes of the face deteriorated somewhat. The results indicate that there were no problems as regards ease-of-use of the systems, although their susceptibility to errors was in need of improvement.
7.2.2 Acceptance of biometric procedures As well as the assessment of the systems specifically used in the test, subjects were also asked to assess facial recognition and biometrics in general. The following is a summary of the extent of agreement with the statements presented:
�� "Facial recognition systems can identify people to an accuracy that is sufficient for practical purposes." Here it seems that the proportion of subjects who believed that the recognition performance of facial recognition systems was sufficiently good to be practical rose in the course of the experiment. In the questionnaire at the end of the study, those who agreed or were undecided together amounted to over 95%. Only 2.4 percent did not agree with this statement.
�� "Facial recognition systems have reached a stage of development which makes them suitable for use for everyday tasks." Once again, agreement had already risen by the time of the questionnaire half-way through the study and in the final questionnaire it had risen slightly further still. Over half of the subjects (53.3 percent) believed that facial recognition systems were practicable after their own initial experience. Only 7.7 percent did not agree with this statement.

secunet
Page 68 of 84
�� "Facial recognition systems should not be used as the sole means of identifying people, but only by way of support to a person performing manual checks." The ratings provided for this statement were to a certain extent inconsistent with the results previously described. Thus, the majority of subjects believed by the end of the test that facial recognition systems are already suitable for everyday use. Yet at the same time an even more pronounced majority (68.6 percent), which increased in the course of the test, believed that this technology should not be used in isolation.
�� "I estimate the proportion of incorrect identifications with facial recognition systems as _____%". Evidently subjects' own experience had convinced them that incorrect identifications are the exception rather than the rule with facial recognition systems. Hence, in the course of the experiment the mean number of estimated incorrect recognitions fell from 32.4 percent to 16.1 percent.
�� "Facial recognition systems are sufficiently flexible in use to cope with visual variations in the appearance of the user, such as spectacles, beard, hairstyle etc." This question is answered increasingly positively over time, although the number agreeing with the statement in the final questionnaire was no higher than 22 percent.
�� "When using a facial recognition system, it is transparent to the user in detail how biometric identification works." The number of people agreeing with the statement rose after the first questionnaire and then declined between the questionnaire half-way through and final questionnaire. The majority of subjects (59.1%) disagreed with the statement.
�� "The use of facial recognition systems is simple, fast and convenient." After subjects had become familiar with the test systems, a majority (92.9%) felt that facial recognition systems were simple, fast and convenient to use. Prior to the start of the test, only a minority (25.8%) were of this opinion.
�� "The use of facial recognition systems does not pose any risk to health." Only a small minority, which decreased in size in the course of the experiment from 3.3 percent to 1.8 percent, clearly felt that facial recognition systems were possibly harmful to health.
�� "The use of characteristics of my body in facial recognition systems makes me feel uneasy." It transpired that subjects did not associate the use of facial recognition systems with an unpleasant feeling. Only 6.5 percent of subjects agreed with the statement.
�� "Facial recognition systems give me the feeling that I am being fingerprinted and photographed." The majority of subjects denied any associations with fingerprinting and photographing, but 14.2 percent of subjects agreed with the statement. The numbers agreeing rose slightly between the second and third questionnaires.
�� "I am in favour of facial recognition systems being used routinely every day." The majority agreed with this statement, although there was a slight decline in agreement from 57.5 percent to 54.5 percent between the second and final questionnaires.
�� "In what areas do you see the use of facial recognition systems offering advantages in central areas of public life?" The benefits mentioned most frequently were higher security (68.5%) and simpler access (65.7%). On the other hand routine annoyance with passwords seems to have had little influence on the benefits identified by subjects.
�� "In what areas do you envisage problems with the use of facial recognition systems?" The main problems identified were technical problems (73.7%) and data protection issues (37.1%). On the other hand, possible health hazards were mentioned only by 3.3 percent.
�� "I estimate that ______% of my acquaintances and relatives would be in favour of the routine use of facial recognition systems." Most subjects estimated that around 50% of their acquaintances would be in favour. In this connection, the high percentage of persons who

secunet
Page 69 of 84
failed to respond (approx. 40%) is striking. This suggests that most of the people surveyed had no clear idea of how the people around them would view the subject of facial recognition.
The following statements were only included in the initial questionnaire:
�� "If facial recognition systems were to be used as a way of fighting terrorism, I would view this as ..." The subject of biometrics as a means of fighting terrorism was viewed positively by the subjects, with 84.5 percent giving positive replies.
�� "If facial recognition systems were to be used by the state authorities in conjunction with the identity card, I would view this as ..." 72.8 percent of subjects had a positive view of such a use of facial recognition systems.
�� "If another form of biometric personal identification were to be used by the state authorities (e.g. fingerprint or hand recognition), I would view this as ..." The replies to this statement were virtually the same as for the previous question.
�� "How would you rate the utility of biometric personal identification systems generally?" The answers divided sharply between those who felt they would be "very useful" (33%) and those who replied "so so" (60.6 percent).
�� "What physical attribute do you feel is best suited for biometric personal identification?" The most popular reply (43.7%) was fingerprint recognition. 37.1 percent felt that iris recognition was the best suited, and 14.1 percent facial recognition.
The questionnaire analysis suggests two parallel trends. First of all, subjects became increasingly positive in their attitude to numerous detailed questions on facial recognition in the course of the test. Thus, only a minority thought that facial recognition was a danger to health, whereas the practical maturity of the technology and its reliability were viewed by a large majority of subjects as satisfactory.
On the other hand, despite this basically positive attitude, some scepticism can be discerned among subjects as a whole. Thus, a majority supported the requirement that facial recognition should not be used unattended. Again, only a third of subjects felt that it was generally beneficial. It is possible that if specific operational scenarios were named, the degree of acceptance of biometrics amongst the public might be higher.

secunet
Page 70 of 84
8 Evaluation scheme One central objective of the BioP I project was to assess the quality of the facial recognition systems tested and, in particular, to compare the two complete systems and also the individual algorithms (matching engines). Such comparisons presuppose the availability of basic data that could be calculated with an evaluation scheme. The evaluation scheme developed for BioP I is described below.
8.1 Structure of evaluation scheme The evaluation scheme was based around the calculation of two indices, known as the "complete system index" (CSI) and the "matching engine index" (MEI). In statistics, an index is a weighted mean value that is gained from several parameters. In this case, the parameters were assessment criteria from the field experiment, the additional investigations and vendor-specific behaviour. In each case, the CSI produced basic data for the two complete systems and the MEI corresponding data for the individual matching engines.
The results achieved by a complete system or matching engine in the field test and in some of the additional investigations in some cases differed significantly for the different reference bases. The evaluation scheme was therefore confined to three reference bases which were examined with different weighting.
Not all the evaluation criteria were equally important to the final results. Therefore every criterion was given a weighting which reflected the proportion of the overall mark assigned to that criterion.
The range of permitted values for each evaluation criterion was based on the marking system customarily used in German schools, ranging from 1 to 6.
For each evaluation criterion, the weighting was multiplied with the mark. The weighted marks were then summed together to obtain the index value of the relevant complete system or matching engine. In this way, the overall mark was a number between 1 and 6.
8.2 Selection of reference bases to be considered Only results obtained for those reference bases which are relevant for potential application scenarios should go into the evaluation of systems and algorithms. Essentially, the three following implementation alternatives are of interest with regard to future identity documents:
�� Storage of an image file on the identity card. The most likely implementation variant is to store an image file on the identification document, as recommended by the ICAO guidelines. Due to the problem of limited storage space, a compressed file is to be preferred. In BioP I, this corresponds to reference base 4, which was therefore given the highest weighting (60%) in the evaluation.
�� Use of an existing photograph on the identity document. To cover the possibility of a fault in the storage chip and the case where documents which do not possess any such chip are used, the use of the photograph for parallel use in a transition phase and as a fallback is relevant. The photograph must comply with the ICAO guidelines. In BioP I, this corresponds to reference base 8, which was therefore given a weighting of 30% in the evaluation. On the other hand, the results obtained suggest that the present identity card (reference base 6) cannot be used because the photographs are in semi-profile and also in some cases the picture quality is poor.

secunet
Page 71 of 84
�� Storage of a template on the identity card. In BioP I, this corresponds to reference base 7. This alternative was examined, as it produced the best recognition performance. However, since this did not comply with the ICAO recommendations, for the purposes of the evaluation it was only assigned a low weighting (10%).
8.3 Evaluation criteria The algorithms and systems were assessed using the following criteria:
�� FER. The FER has to be viewed in conjunction with the FRR. Algorithms and systems which produce low FRRs may carry out a pre-sorting of accepted photographs. In a real application, for example for identity verification at passport control, the FER goes directly into the FRR. Therefore it must not be overlooked in a separate analysis. This criterion is relevant to comparisons of both algorithms and systems.
�� FRR (FAR=X%). For the comparison of algorithms, recognition performance is the main criterion. Here, however, a distinction is made between recognition performance for different security levels.
o FAR = 0.01% corresponds to very high security and is primarily relevant to high-security applications.
o FAR = 0.1% corresponds to the likeliest realistic operational scenario with an acceptable security level.
o FAR = 1% is rated lower, as in this case the security level is already somewhat weakened.
�� FRR(TH=0.7), FAR(TH=0.7). Recognition performance has the highest weighting in the comparison of biometric systems. Whether FRR or FAR is weighted the more highly depends on whether the priority is an acceptable level of security or an acceptable level of convenience. In the case of the analysis of recognition performance with a fixed threshold, FRR and FAR depend directly on each other and can therefore have equal weightings.
�� Standard deviation individual user statistics. A high standard deviation means that a large proportion of the users have high rejection rates. In the algorithm comparison, this is a criterion for down-grading algorithms which cause problems for a lot of people. In the system comparison, the standard deviation must be weighted less prominently, as here there is a direct link with the user-induced problems. Generally-speaking, the standard deviation should not be weighted too highly in relation to recognition performance, as otherwise it is possible that algorithms or systems which have a very low standard deviation, but with high FRRs, might score better.
�� Average time taken to identify oneself. This criterion is relevant to the system comparison, as it is time perceptible to the user. As biometric identity verification in a real scenario would generally be embedded in an overall process (e.g. passport control), the time taken is not heavily weighted in relation to the other criteria.

secunet
Page 72 of 84
�� Influence of lighting conditions. As in the planned operational scenarios it is not possible to create absolutely ideal conditions, the influence of lighting conditions requires careful consideration in the analysis. This applies both to the algorithm comparison, in which robustness in relation to poorly controlled image material was analysed, and also to the system comparison, in which a data acquisition unit that stands up well to noise is important.
The remaining criteria are relevant only to the system comparison, and not to the algorithm comparison.
�� User acceptance. Acceptance is relevant, as biometric systems generally require co-operative behaviour on the part of the users.
�� System errors, failure behaviour, administration overhead. For systems which are used in environments accessed by the public and consequently are used heavily, the weighting due to the guarantee of stable operation is second only to recognition performance.
�� User-induced problems. Problems caused by system design errors for people with particular characteristics (e.g. small body size) are a factor calling for a negative assessment.
�� Resilience to being outwitted with zero-effort attempts. These attacks constitute the biggest problem for the resilience of the systems to being outwitted, due to the ease with which they can be carried out, and are therefore correspondingly weighted.
�� Support & service. Where complex technical systems are used, reliable vendor support is an important criterion and therefore deserves a comparatively high weighting.
The criteria presented here are not exhaustive. However, the other criteria have a weighting in each case of less than two percent and therefore are not discussed further at this point.
8.4 Classification of the results This section presents the guidelines for the award of marks to the individual evaluation criteria.
FER Mark
≤ 0,0001% 1
≤ 0,001% 2
≤ 0,01% 3
≤ 0,1% 4
≤ 1% 5
> 1% 6
Table 13: classification of marks for FER

secunet
Page 73 of 84
FRR Mark
≤ 2% 1
≤ 4% 2
≤ 8% 3
≤ 16% 4
≤ 32% 5
> 32% 6
Table 14: classification of marks for FRR
FAR Mark
≤ 0,01% 1
≤ 0,1% 2
≤ 1% 3
≤ 3% 4
≤ 5% 5
> 5% 6
Table 15: classification of marks for FAR
Standard deviation in the individual user statistics Mark
≤ 1% 1
≤ 2% 2
≤ 4% 3
≤ 8% 4
≤ 16% 5
> 16% 6
Table 16: classification of marks for standard deviation in the individual user statistics

secunet
Page 74 of 84
Average time taken to identify oneself Mark
≤ 2 s 1
≤ 4 s 2
≤ 6 s 3
≤ 8 s 4
≤ 10 s 5
> 10 s 6
Table 17: classification of marks for average time taken to identify oneself
System error Mark
No errors or only marginal errors during the field test 1
Minor errors during the field test, which were easy to fix 2
Errors during the field test which could be fixed with a moderate amount of effort 3
Errors during the field test which could be fixed with a high amount of effort 4
Errors during the field tests which could not be fixed 5
Errors during the field tests which prevented proper use 6
Table 18: classification of marks for system errors
Failure behaviour Mark
No failures during the field test 1
Less than two failures during the field test, system up and running again within one hour 2
Less than five failures during the field test, system up and running again within one hour 3
Less than ten failures during the field test, system up and running again within 24 hours 4
Ten or more failures during the field test, system up and running again within 24 hours 5
Ten or more failures during the field test, not always possible to restore the system within 24 hours 6
Table 19: classification of marks for failure behaviour

secunet
Page 75 of 84
Criteria used to assess the administration overhead:
�� No administration required once the equipment is operational.
�� Enrolment is supported by suitable tools such as quality assessment of enrolment images and test verification.
�� The administrator user interface is intuitive to use.
�� There are suitable reporting tools available
Administration overhead Mark
All criteria adhered to 1
One criteria not satisfied, but this is regarded as reasonable 2
One criterion not satisfied 3
Two criteria not satisfied 4
Three criteria not satisfied 5
Criteria not satisfied 6
Table 20: classification of marks for administration overhead
User-induced problems Mark
No problems attributable to characteristics or behaviour of users were identified 1
Marginal problems 2
Isolated problems which were easy to fix 3
Isolated problems which were not easy to fix 4
Frequent problems which were easy to fix 5
Major problems which were not easy to fix 6
Table 21: classification of marks for user-induced problems
User Acceptance Mark
System rated "very good" 1
System rated "good" 2
System rated "satisfactory" 3
System rated "adequate" 4
System rated "unsatisfactory" 5
System rated "deficient" 6
Table 22: classification of marks for user acceptance

secunet
Page 76 of 84
Zero-effort attempts Mark
No cases of mistaken identity in a sample of up to 100,000 1
Cases of mistaken identity in a sample of > 10,000 2
Cases of mistaken identity in a sample of > 1,000 3
Cases of mistaken identity in a sample of > 100 4
Cases of mistaken identity in a sample of > 10 5
Cases of mistaken identity in a sample of ≤ 10 6
Table 23: classification of marks for zero-effort attempts
Initial operation was not included as a separate evaluation criterion in the evaluation schema. One-third of the mark went into the mark for support and service.
Initial operation Mark
Fully functional system provided on time 1
System provided on time, but modifications were subsequently necessary 2
System provided on time and significant subsequent modifications necessary or fully functional system provided late
3
System provided late and modifications subsequently necessary 4
System provided late and significant modifications were subsequently necessary 5
Suitable system not provided 6
Table 24: classification of marks for initial operation

secunet
Page 77 of 84
Criteria for the evaluation of support and service:
�� Response and solution during field test always within 24 hours
�� Response and solution during additional investigations always within 48 hours
�� A competent point of contact designated
�� Provision of suitable documentation
Support and service Mark
All criteria adhered to 1
One criteria not satisfied, but this is regarded as reasonable 2
One criterion not satisfied 3
Two criteria not satisfied 4
Three criteria not satisfied 5
Criteria not satisfied 6
Table 25: classification of marks for support and service
Two-thirds of the mark went into the evaluation of support and service, the other one-third is from the evaluation of initial operation.
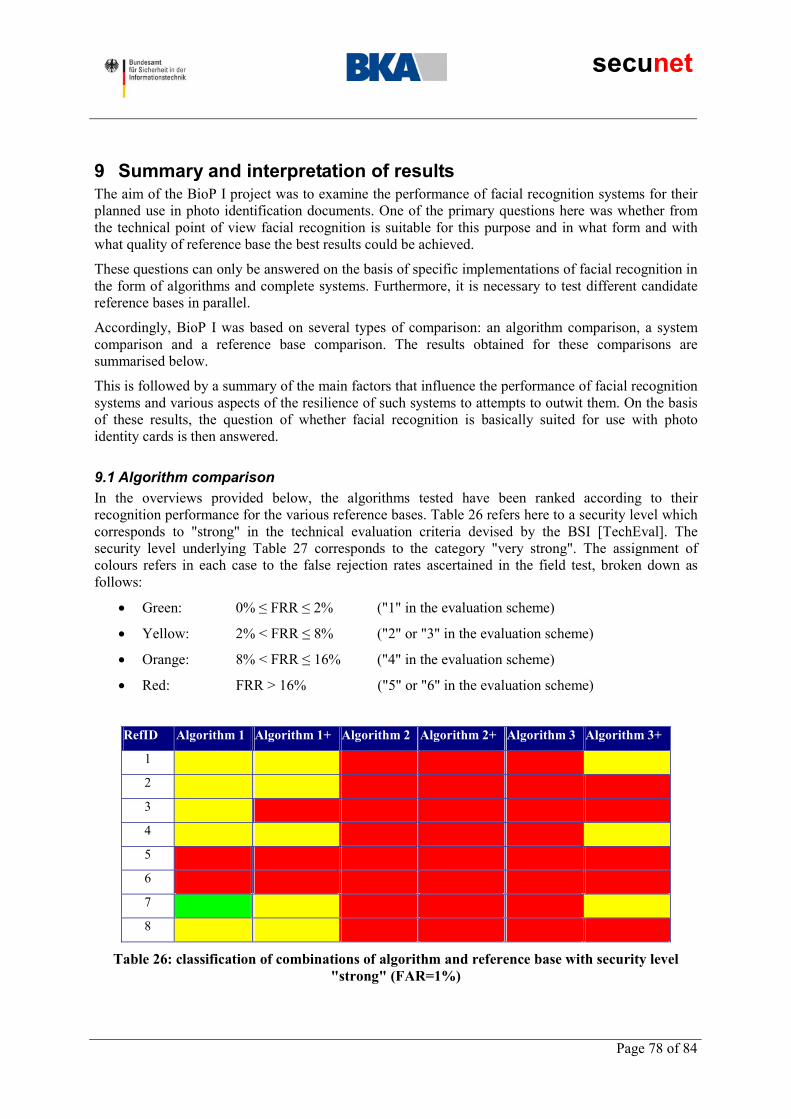
secunet
Page 78 of 84
9 Summary and interpretation of results The aim of the BioP I project was to examine the performance of facial recognition systems for their planned use in photo identification documents. One of the primary questions here was whether from the technical point of view facial recognition is suitable for this purpose and in what form and with what quality of reference base the best results could be achieved.
These questions can only be answered on the basis of specific implementations of facial recognition in the form of algorithms and complete systems. Furthermore, it is necessary to test different candidate reference bases in parallel.
Accordingly, BioP I was based on several types of comparison: an algorithm comparison, a system comparison and a reference base comparison. The results obtained for these comparisons are summarised below.
This is followed by a summary of the main factors that influence the performance of facial recognition systems and various aspects of the resilience of such systems to attempts to outwit them. On the basis of these results, the question of whether facial recognition is basically suited for use with photo identity cards is then answered.
9.1 Algorithm comparison In the overviews provided below, the algorithms tested have been ranked according to their recognition performance for the various reference bases. Table 26 refers here to a security level which corresponds to "strong" in the technical evaluation criteria devised by the BSI [TechEval]. The security level underlying Table 27 corresponds to the category "very strong". The assignment of colours refers in each case to the false rejection rates ascertained in the field test, broken down as follows:
�� Green: 0% ≤ FRR ≤ 2% ("1" in the evaluation scheme)
�� Yellow: 2% < FRR ≤ 8% ("2" or "3" in the evaluation scheme)
�� Orange: 8% < FRR ≤ 16% ("4" in the evaluation scheme)
�� Red: FRR > 16% ("5" or "6" in the evaluation scheme)
RefID Algorithm 1 Algorithm 1+ Algorithm 2 Algorithm 2+ Algorithm 3 Algorithm 3+
1
2
3
4
5
6
7
8
Table 26: classification of combinations of algorithm and reference base with security level "strong" (FAR=1%)

secunet
Page 79 of 84
RefID Algorithm 1 Algorithm 1+ Algorithm 2 Algorithm 2+ Algorithm 3 Algorithm 3+
1
2
3
4
5
6
7
8
Table 27: classification of combinations of algorithm and reference base with security level "very strong" (FAR=0.1%)
Algorithm 1 performed the best for all the reference bases.
9.2 System comparison In addition to the comparison of algorithms, it is interesting to compare the complete systems in relation to the operational scenarios. As well as biometric-specific criteria, aspects such as failure behaviour, system errors, administration overhead and support are also relevant. Table 28 provides an overview for the purposes of comparing the systems. The assignment of colours is oriented to the classification of marks as per the system assessment scheme, as follows:
�� Green: 1
�� Yellow: 2 or 3
�� Orange: 4
�� Red: 5 or 6
Criterion System A System B
Recognition performance15 3.11 3.33
System behaviour16 4.50 2.23
Additional investigations17 5.16 4.93
Vendor assessment18 5.00 2.30
Table 28: assessment of complete systems in relation to criterion groups
15 Consists of the individual criteria of FER, FAR, FRR, standard deviation individual user statistics 16 Consists of the individual criteria system errors, failure behaviour, administration overhead, user-induced problems, average time taken to identify oneself 17 Consists of the individual criteria of user acceptance, resilience to being outwitted, influence of lighting conditions 18 Consists of the individual criterion of support & service (including initial operation)

secunet
Page 80 of 84
9.3.1
9.3.2
Whereas system A had a slight advantage as regards biometric recognition performance, on the other evaluation criteria, system B came out in the lead, in some cases by a significant margin. In particular, as regards reliability, system errors, administration overhead and support, system B performed significantly better. These criteria are very important both when one considers the potentially widespread use of facial recognition systems, and also as regards selecting systems to be studied in BioP II.
9.3 Reference base comparison For the reference bases, basically there are three candidates, which are presented below with the relevant results. A summary of the results with an explanation of the colour coding used is provided in Figure 43.
Provision of biometric characteristics as photograph In every case, the study demonstrated that the federal identity card cannot be used in conjunction with biometric facial recognition in its present form. This conclusion is essentially based on the fact that the photograph used on the ID card is in semi-profile. Moreover, in individual cases, characteristics of these photos, such as contrast and brightness, are very poor.
The purpose-made identity card created for the project with a photograph that complied with the ICAO recommendations showed that facial recognition is possible on the basis of a photograph to be scanned. The results obtained are still not satisfactory, but they do show that there is a certain potential. In every case, however, great efforts are required on the part of the algorithm providers if satisfactory recognition performance is to be achieved.
On the other hand, recognition performance was significantly worse with the EU visa photograph tested. The reasons for this are essentially noise within the photograph, which is caused by the optical security characteristics on the visa.
Provision of biometric characteristics as an image file As an alternative to the direct use of the photograph, the use of an image file stored in electronic form on the identity document should be considered. This is in line with the ICAO recommendations and would thus facilitate international interoperability. The recognition performance that is possible with this alternative is not very satisfactory, but the potential for optimisation that exists in the area of the algorithms suggests that significant improvement can be expected, so that if the available leeway for improvement (e.g. use of special camera systems, optimisation of algorithms to the processing of image files, appropriate pre-processing of image files) is utilised, it is perfectly conceivable that the technology could be used successfully. The level of compression of the underlying image files recommended by ICAO does not have a significant influence on recognition performance.
Tests carried out on an image file based on a photograph in semi-profile show clearly that this type of photograph is unsuitable for facial recognition. This is confirms the results obtained with the present German identity card.

secunet
Page 81 of 84
9.3.3 Provision of biometric characteristics as a template Another alternative is to use a template stored on the identity document in electronic form. As one would expect, in the BioP I tests by far the best recognition performance was achieved when the face was represented as a vendor-specific template.
However, it is likely that this implementation alternative would face considerable difficulties as regards interoperability. As such a template is always specific to one vendor's particular system, it would be necessary to specify one system or one procedure at the international level.
Figure 43: suitability of reference bases for facial recognition
9.4 Factors influencing facial recognition
9.4.1 Lighting conditions It is known that the main noise factor in facial recognition is the lighting, specifically the intensity and direction of the lighting. This was confirmed through the investigations carried out in BioP I. However, the extent to which the results are influenced is different for different algorithms and different systems. Another important factor is the capability of the data acquisition unit, i.e. the camera system.
The biggest decline in recognition performance for all algorithms and systems was found when the light comes from the side. When a suitable camera system was used, the incidence of light from behind the person could be virtually ignored. Where the light came strongly from the front, an extremely surprising effect occurred. Normally, recognition performance worsened, but in exceptional cases a significant improvement occurred. Of the algorithms examined, in virtually every case algorithm 1 proved the most robust.
It is thus essential that stable lighting conditions are established if facial recognition systems are to be successfully employed.

secunet
Page 82 of 84
9.4.2
9.4.3
9.4.4
Quality of the image file Bearing in mind the limited storage capacity of a possible chip on the identity document, clearly it will help if the information to be stored is compressed to the maximum extent possible. For this reason, the impact on recognition performance of different levels of compression for the image files used as the reference base was examined. In the event, recognition performance declined as the degree of compression increased. Whereas low compression (image size approx. 75KB) resulted in a negligible decline in performance, a significant deterioration occurred with very high compression (image size approx. 11KB). Compression of the order of magnitude proposed by the ICAO (image size approx. 14KB) still produced an acceptable recognition performance compared with reference bases that were only slightly compressed.
As a further means of reducing the storage requirements, low resolution image files were also tested. This modification resulted in slightly poorer recognition rates.
Quality of the photograph on the identity card Another factor that influences facial recognition and identity cards is the quality of the relevant document. To examine this more closely, the current federal identity cards of the test subjects were classified in terms of scratches, kinks, cracks etc. Virtually no identity cards of medium or poor quality in the area of the picture were identified. This suggests that the federal identity card is very robust, especially in the area of the photograph. As the sample of identity cards of poor quality was very small, no firm conclusions can be drawn as regards the impact on facial recognition.
Effects of the age of the identity card One significant aspect of the assessment of suitability of facial recognition systems in relation to personal documents is the effect of the age of the ID card and hence the influence of the reference image contained on the card on recognition performance. A corresponding investigation was carried out on the basis of subjects' current identity cards. However, since recognition performance based on these ID cards was generally very poor, no definitive conclusions can be drawn here. Nevertheless there is a discernible trend to the effect that recognition performance declines as the age of the ID card increases. Generally, the effect of ageing on facial recognition systems has not yet been adequately investigated, as was confirmed by a review of research activities in this area that was carried out as part of BioP I.
9.5 Resilience of FR systems to attempts to outwit them One important evaluation criterion for biometric systems, especially given the background requirement of higher security for the operational scenario, is the extent to which the systems can be outwitted. The tests carried out in the course of BioP I showed that the two biometric systems involved could be outwitted with little effort by copying the biometric facial characteristics in the form of photographs. It must be added at this point, however, that the provision of a suitable device which ensures that the face belongs to a living person was not a mandatory criterion. Nevertheless, it is clear that with both systems there was one case of mistaken identity involving two people who bore only limited similarity to each other. This could make it possible for somebody to successfully use the identity card of another person without any additional effort.
9.6 General suitability of facial recognition BioP I showed that facial recognition is basically suitable for use with identity documents from a technical point of view. However, this is only true when the following framework conditions are adhered to and the basic preconditions presented are satisfied:
�� The reference base must be provided in a suitable manner on the personal document. The best results are achieved where a template is provided. However, it is more realistic as regards

secunet
Page 83 of 84
international usability if an image file that complies with the ICAO recommendations is provided. Here, however, the available optimisation potential must be better utilised if satisfactory results are to be achieved. Although use of a photograph on the identity card, as recommended by the ICAO, appears to be possible, a lot of effort is required on the part of the companies responsible for the algorithms to ensure that satisfactory recognition performance is achieved.
�� One important framework condition for the successful use of facial recognition is that the environment should be controlled as regards the influence of lighting.
�� Before facial recognition systems can be used, it is essential that security as regards the possibility of outwitting the system is improved, especially where the systems are operated unmonitored. Whereas the use of photographs to outwit the system appears to be critical only to a limited extent if one assumes that identity verification is monitored, it is unacceptable that persons who look alike should be mistaken for each other.
�� With regard to the suitability of facial recognition for personal documents, one reservation is that the effects of ageing of the documents have not yet been adequately studied. Given the long period of validity of these documents, this factor needs to be considered.
The results obtained in BioP I were checked in the course of project BioP II on the basis of a larger test population and compared with the biometric procedures of iris and fingerprint recognition. The algorithm comparison carried out in BioP I shows clearly that algorithm 1 is to be preferred for these investigations. As a complete system, system B appears to be a suitable choice, as this system performed significantly better against criteria such as fault behaviour, reliability, vendor support and also acceptance by the subjects.

secunet
Page 84 of 84
References [BestPrac] Biometric Working Group: Best Practices in Testing and Reporting
Performance of Biometric Devices, version 2.10; 2002
[BioFace] BSI: BioFace studies I & II – comparative study of facial recognition systems, public final report [Studie BioFace I & II – Vergleichende Untersuchung von Gesichtserkennungssystemen, Öffentlicher Abschlussbericht], 2003
[BioIS] BSI: BioIS study – comparative investigation of biometric identification systems, technical study [Studie BioIS – Vergleichende Untersuchung biometrischer Identifikationssysteme, Technische Untersuchung], 2000
[Breite] Marco Breitenstein: Biometric authentication – overview and evaluation of facial recognition systems [Biometrische Authentifizierung – Übersicht und Evaluation von Gesichtserkennungssystemen], diploma thesis at the Technical University of Clausthal, Institute of Information Technology, 2000
[CESG] Tony Mansfield, Gavin Kelly, David Chandler, Jan Kane: Biometric Product Testing - Final Report, 2001
[FRVT00] P. Jonathon Phillips, Patrick Grother, Duane M. Blackburn, Mike Bone: Face Recognition Vendor Test 2000
[FRVT02ER] P. Jonathon Phillips, Patrick Grother, Ross J. Micheals, Duane M. Blackburn, Elham Tabassi, Mike Bone: Face Recognition Vendor Test 2002 – Evaluation Report, March 2003
[FRVT02OS] P. Jonathon Phillips, Patrick Grother, Ross J. Micheals, Duane M. Blackburn, Elham Tabassi, Mike Bone: Face Recognition Vendor Test 2002 – Overview and Summary, March 2003
[OsbHar] Prepared by Australia (John Osborne & Terry Hartmann) for NTWG: Guidelines for Maximising Interoperability of Facial Biometrics, in: ICAO TECHNICAL REPORT, BIOMETRICS DEPLOYMENT, Development And Specification Of Globally Interoperable Biometric Standards For Machine Assisted Identity Confirmation Using Machine Readable Travel Documents; Outline Draft 5, 3 December 2002
[TechEval] BSI: Technical evaluation criteria for the assessment and classification of biometric systems [Technische Evaluierungskriterien zur Bewertung und Klassifizierung biometrischer Systeme] version 0.6, 2000
[TeTrKK] TeleTrusT AG 6: Assessment criteria for comparing biometric procedures [Bewertungskriterien zur Vergleichbarkeit biometrischer Verfahren], 2002
[VielStei] Claus Vielhauer, Ralf Steinmetz: Security aspects of biometric procedures: classification of security-relevant incidents and significant parameters for the assessment of functional security [Sicherheitsaspekte biometrischer Verfahren: Klassifizierung von sicherheitsrelevanten Vorfällen und wesentlicher Größen zur Beurteilung der Funktionssicherheit] 7th German IT Security Congress of the BSI, 2001
[WaAsMaMu] Wayman, Ashbourne, Mansfield, Munde: Principles of Biometric Security System Vulnerability Assessment; U.K. Biometric Working Group, 2001