Embed Size (px)
Citation preview
0
An Introduction to Well Integrity Rev 0, 04 December 2012
1
Preface
This document has been prepared as a joint project between members of the Norwegian Oil
and Gas Association's Well Integrity Forum (WIF) and professors at NTNU and UiS. The
intention with the document is to provide a document that can be used in educating personnel
in well integrity and especially students at the universities.
Authors of this document have been:
Hans-Emil Bensnes Torbergsen, Eni Norge
Hilde Brandanger Haga, Statoil
Sigbjørn Sangesland, NTNU
Bernt Sigve Aadnøy, UiS
Jan Sæby, Shell
Ståle Johnsen, Total
Marvin Rausand, NTNU
Mary Ann Lundeteigen NTNU
0 04.12.12 Original document
Revision Date of issue Reason for Issue
2
Index
Preface ................................................................................................................................................ 1
List of Abbreviations ................................................................................................................................ 6
List of figures ............................................................................................................................................ 1
List of Tables ............................................................................................................................................ 4
1. What is well integrity? (Well integrity – concepts and terminology) ........................................... 5
2. Background and History ................................................................................................................... 8
2.1 What can go wrong in wells? ................................................................................................. 9
2.2 How likely is loss of well integrity? ...................................................................................... 10
2.3 What are the consequences of loss of well integrity? ........................................................ 11
2.4 Some cases of loss of well integrity ..................................................................................... 12
2.4.1 Case 1: Failure of surface casing and drop of wellhead.............................................. 12
2.4.2 Case 2: Failure of production casing hanger ............................................................... 15
2.4.3 Case 3: Loss of wellbore .............................................................................................. 17
2.4.4 Case 4: Gas leaks in tubing strings .............................................................................. 20
2.4.5 Case 5: Production casing failure ............................................................................... 25
2.4.6 Case 6: Well failure .................................................................................................... 26
3. Well Construction and Field Development .................................................................................... 29
3.1 Well Types and Well Life Cycle ............................................................................................ 29
3.2 Subsea drilling ..................................................................................................................... 29
3.3 Platform drilling .................................................................................................................. 35
3.4 Subsea Well Completion ..................................................................................................... 35
3.4.1 Types of X-mas trees for subsea wells ........................................................................ 36
3.5 Surface well completion ...................................................................................................... 40
4. Well Barriers – definitions, classification, and requirements.................................................. 45
4.1 Key concepts and definitions ............................................................................................... 45

3
4.2 Well Barrier Requirements .................................................................................................. 46
4.3 Well Barrier Functions ......................................................................................................... 47
4.4 Well barrier schematics and diagrams ................................................................................ 49
4.4.1 Well barrier schematics .............................................................................................. 50
4.4.2 Well barrier diagrams ................................................................................................. 51
4.5 Reliability analysis and methods ......................................................................................... 53
4.5.1 Reliability analysis of well barriers .......................................................................... 53
4.5.2 Analysis steps .............................................................................................................. 53
4.6 Identification of barrier functions ....................................................................................... 55
4.7 Failure and failure analysis ................................................................................................ 56
4.7.1 Key terms and definitions ........................................................................................... 56
4.7.2 Classification of failure modes .................................................................................... 58
4.8 FMECA ................................................................................................................................. 60
4.8.1 FMECA procedure ....................................................................................................... 61
4.9 Fault tree analysis ................................................................................................................ 68
4.9.1 Fault tree programs .................................................................................................... 70
4.9.2 Fault tree construction ............................................................................................... 70
4.9.3 Fault tree pros and cons ............................................................................................. 74
4.9.4 Qualitative analysis of the fault tree........................................................................... 74
4.9.5 Failure rate, mean time to failure, and survival probability ....................................... 75
4.9.6 Well barrier performance data ................................................................................... 76
4.9.7 Quantitative analysis .................................................................................................. 77
5. Technical well barriers ................................................................................................................... 80
5.1 Well barrier philosophy ....................................................................................................... 80
5.1.1 Fail-safe functions: ...................................................................................................... 80
5.1.2 Safety systems ............................................................................................................ 81
5.1.3 Fire resistance ............................................................................................................. 81
4
5.1.4 Well barrier schematics .............................................................................................. 82
5.1.5 Drilling phase .............................................................................................................. 87
5.1.6 Completion phase ....................................................................................................... 89
5.1.7 Production phase ........................................................................................................ 91
5.1.8 Intervention phase ...................................................................................................... 93
5.1.9 P&A phase ................................................................................................................... 95
5.2 Barrier design, construction and qualification of barriers for life cycle ........................... 97
5.2.1 MWDP or MSDP .......................................................................................................... 97
5.3 Description of typical barrier elements and important qualification issues ...................... 98
5.3.1 Formation ................................................................................................................... 98
5.3.2 Casing Cement .......................................................................................................... 101
5.3.3 Casing Cement Plug .................................................................................................. 103
5.3.4. Casing/Tubing ........................................................................................................... 104
5.3.5. Production packer ..................................................................................................... 106
5.3.6. DHSV ......................................................................................................................... 107
5.3.7. CIV ............................................................................................................................. 108
5.3.8. Casing hanger seal .................................................................................................... 109
5.3.9. Wellhead ................................................................................................................... 110
5.3.10. Annulus valves ...................................................................................................... 111
6. Operational .................................................................................................................................. 116
6.1. General ............................................................................................................................ 116
6.2. Valves and Christmas Trees ............................................................................................ 117
6.2.4. Valve Test Criteria ..................................................................................................... 117
6.2.5. Subsurface Safety Valves (SSSV) ............................................................................... 119
6.2.6. Annular Safety Valve (ASV) ....................................................................................... 122
6.2.7. X-mas tree ................................................................................................................. 122
6.2.8. Annulus Valves .......................................................................................................... 123
5
6.2.9. Gas Lift Valves ........................................................................................................... 123
6.3. Pressure Monitoring ........................................................................................................ 123
6.3.1. Annulus Pressure Surveillance Principles ................................................................. 123
6.3.2. Types of annular pressures ....................................................................................... 124
6.3.3. Calculation of MAASP ............................................................................................... 134
6.3.4. Setting of Maximum Operational Pressure (MOP) ................................................... 137
6.3.5. ‘A’ Annulus MINAP (gas lifted wells) ......................................................................... 137
6.3.6. Management and Control ......................................................................................... 138
7. Organizational ................................................................................................................................. 140
7.1. Roles and responsibilities ......................................................................................................... 140
7.2. Competence and training ......................................................................................................... 141
8. Appendix A - Homework problems ..................................................................................................... 142
8.1. Exercise 1 ......................................................................................................................... 142
8.2. Exercise 2 ............................................................................................................................. 144
8.3. Exercise 3: ......................................................................................................................... 144
8.4. Exercise 4 .......................................................................................................................... 145
9. References .................................................................................................................................... 146
6
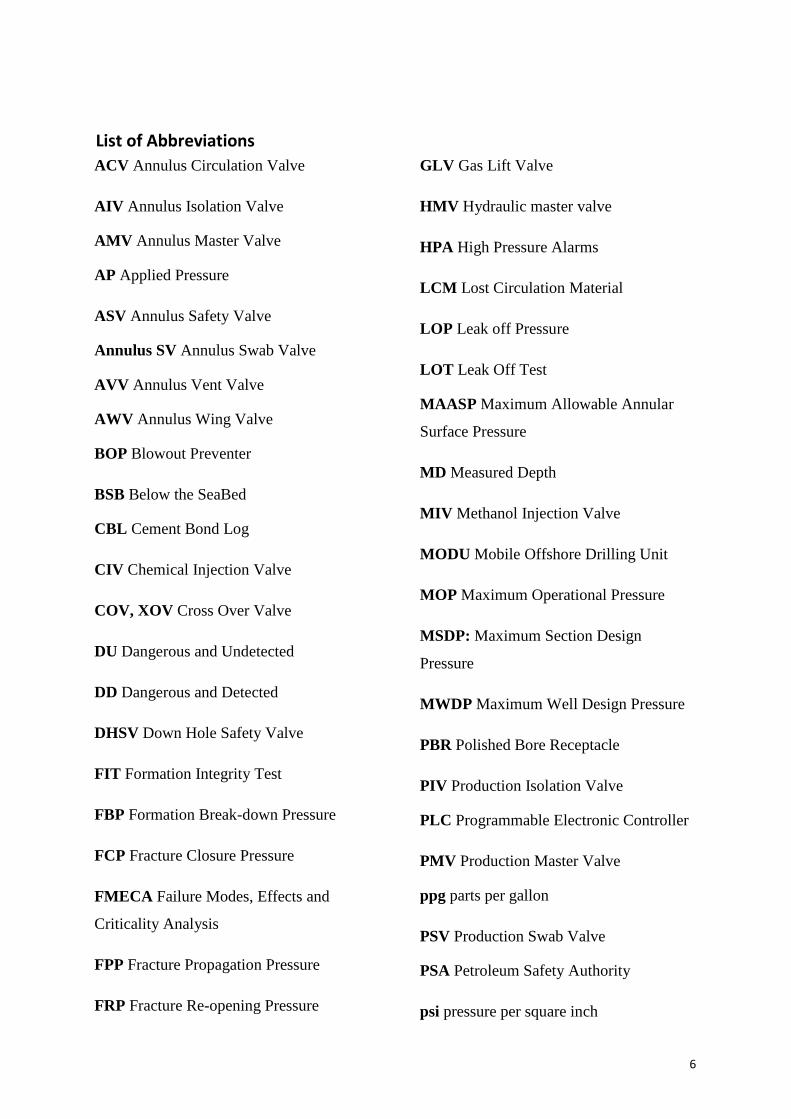
List of Abbreviations
ACV Annulus Circulation Valve
AIV Annulus Isolation Valve
AMV Annulus Master Valve
AP Applied Pressure
ASV Annulus Safety Valve
Annulus SV Annulus Swab Valve
AVV Annulus Vent Valve
AWV Annulus Wing Valve
BOP Blowout Preventer
BSB Below the SeaBed
CBL Cement Bond Log
CIV Chemical Injection Valve
COV, XOV Cross Over Valve
DU Dangerous and Undetected
DD Dangerous and Detected
DHSV Down Hole Safety Valve
FIT Formation Integrity Test
FBP Formation Break-down Pressure
FCP Fracture Closure Pressure
FMECA Failure Modes, Effects and
Criticality Analysis
FPP Fracture Propagation Pressure
FRP Fracture Re-opening Pressure
GLV Gas Lift Valve
HMV Hydraulic master valve
HPA High Pressure Alarms
LCM Lost Circulation Material
LOP Leak off Pressure
LOT Leak Off Test
MAASP Maximum Allowable Annular
Surface Pressure
MD Measured Depth
MIV Methanol Injection Valve
MODU Mobile Offshore Drilling Unit
MOP Maximum Operational Pressure
MSDP: Maximum Section Design
Pressure
MWDP Maximum Well Design Pressure
PBR Polished Bore Receptacle
PIV Production Isolation Valve
PLC Programmable Electronic Controller
PMV Production Master Valve
ppg parts per gallon
PSV Production Swab Valve
PSA Petroleum Safety Authority
psi pressure per square inch
1
PWV Production Wing Valve
RKB Rotary Kelly Bushing
SCP Sustained Casing Pressure
SCSSV Surface Controlled Subsurface
Safety Valve
SD Safe and Dangerous
SICP Shut In Casing Pressure
SIDPP Shut In Drill Pipe Pressure
SIV Scale Inhibitor Valve
SIWHP Shut In Wellhead Pressure
SSSV Subsurface Safety Valves
SU Safe and Undetected
TAP Trapped Annular Pressure
TH Tubing Hanger
TP Thermal Pressure
TVD True Vertical Depth
USIT Ultra Sonic Imaging Tool
WBS Well Barrier Schematic
XLOT Extended Leak of Test
XT X-mas Tree
1
List of figures
Figure 1: Example of possible redefinition of the well barriers after failure of the ASV ........................ 7
Figure 2 Example of failure statistics with age.(8) ................................................................................ 10
Figure 3 Example of barrier element failures (8) .................................................................................. 11
Figure 4 Failed surface casing and position of open cement return port ............................................. 14
Figure 5 Deformed casing hanger after failure ..................................................................................... 16
Figure 6 Well with circulation losses and well control ......................................................................... 19
Figure 7 Hole in the production tubing ................................................................................................. 21
Figure 8 Sketch of a typical horizontal subsea X-mas tree with valves ................................................. 22
Figure 9 Sketch showing the tubing stinging into the PBR above production packer .......................... 23
Figure 10 Failed production casing and production tubing .................................................................. 26
Figure 11 Sketch of situation when the scab liner was pulled out of hole ........................................... 27
Figure 12 Washed out formation around the well ................................................................................ 28
Figure 13 Typical casing program for a subsea well .............................................................................. 30
Figure 14 Equivalent mud weight, equivalent pore pressure (Pp) and equivalent fracture pressure (Pf
)/ equivalent minimum formation stress vs. depth (TVD) .................................................................... 32
Figure 15 Typical pressure behavior when performing XLOT ............................................................... 33
Figure 17 Example of a wellbore stability plot from the oil industry .................................................... 34
Figure 18 Example of subsea well with tubing hanger and tubing string installed (for vertical X-mas
tree installation) .................................................................................................................................... 36
Figure 19 Subsea well with vertical X-mas tree (dual bore through X-mas tree and TH) ..................... 37
Figure 20 Subsea well with horizontal X-mas tree ................................................................................ 38
Figure 21 Surface wellhead system (FMC Energy Systems) .................................................................. 41
Figure 22 Surface wellhead and X-mas tree (FMC Energy Systems) ..................................................... 43
Figure 23 Typical difference between annulus monitoring possibilities for platform well versus
platform TLP well................................................................................................................................... 44
Figure 24 Primary and secondary barriers in production and drilling mode ........................................ 48
Figure 25 Well barriers schematic for a standard production well. ...................................................... 51
Figure 26 Barrier diagram for the production well in Figure 242. ........................................................ 52
2
Figure 27 Top structure of fault tree for "Leakage to surroundings". .................................................. 71
Figure 28 Fault tree (top structure) for “Leakage flow path 6”. ........................................................... 71
Figure 29 Complete fault tree for "Leakage flow path 6". .................................................................... 73
Figure 30 the schematic indicates the first and secondary well barriers with their barrier elements.
Through this kind of illustration it is possible to verify the status of the barriers and whether it is
critical or not. Future operation of the well is greatly dependent on these assessments. Control and
monitoring may be planned based on these assessments to maintain the barriers ............................ 83
Figure 31 Well barrier production schematic illustration, .................................................................... 85
Figure 32 Swiss cheese model - barriers breached in Macondo field (Ref BP report). ......................... 86
Figure 34 WBS for the completion phase .............................................................................................. 89
Figure 35 Well barrier schematic for a well in the production phase ................................................... 91
Figure 36 WBS drawing for intervention phase .................................................................................... 93
Figure 37 WBS drawing for the P&A phase, temporary and permanent .............................................. 95
Figure 38: Example of leak to seabed due to injection pressure being higher than the re-opening
pressure of deep faults, allowing faults to propagate to the seafloor ................................................ 100
Figure 39: Casing cement acting as part of both the primary and secondary well barrier ................. 102
Figure 40: Picture of cut and retrieved intermediate casing, cemented production casing and tubing
string with control line ........................................................................................................................ 103
Figure 41: Principle of the casing cement plug setting depth ............................................................. 104
Figure 42: Possible leak path if the cement plug is set too shallow. Not according to requirement for
permanent abandonment. .................................................................................................................. 104
Figure 43: Principal of casing/tubing connection sealing .................................................................... 105
Figure 44 Corroded tubing due to incompatibility between the tubing material and injection water
quality .................................................................................................................................................. 106
Figure 45 showing a production packer installed downhole in a well ................................................ 107
Figure 46 Schematic of a Downhole Safety Valve (DHSV) in open and closed position. .................... 108
Figure 47 Examples of Wireline retrievable Chemical Injection Valves (CIV’s) ................................... 109
Figure 48 Example of a casing hanger with sealing elements ............................................................. 110
Figure 49 Examples of wellheads with Christmas trees installed. ...................................................... 111
Figure 50 Annulus master valve as part of secondary barrier envelope on horizontal XT. ................ 112
3
Figure 51. Drawing showing XT tree locked to the wellhead by lock down screws (Cameron). ........ 113
Figure 52 Tubing hanger installed in dry wellhead with control line feed through (Cameron). ......... 114
Figure 53 Tubing hanger as part of secondary barrier envelope on vertical dry XT. .......................... 114
Figure 54 Different types of dry X-mas trees (Cameron). ................................................................... 116
Figure 55 X-mas tree and production upper master valve as part of secondary barrier envelope on
vertical dry XT. ..................................................................................................................................... 116
Figure 56 Leakage testing of DHSV (SCSSV) ........................................................................................ 120
Figure 57 Variation of pressure with temperature for fresh water in an enclosed system ................ 125
Figure 58 Fresh water density as a function of pressure variations for various temperatures .......... 126
Figure 59 Fresh water density as a function of temperature variations for various pressures .......... 126
Figure 60: Situations where temperature induced pressure may/may not cause casing failure ....... 127
Figure 61: Simplified temperature profiles in a well during various phases ....................................... 129
Figure 62 Data for an exploration well ................................................................................................ 131
Figure 63 Examples of potential leak paths resulting in SCP .............................................................. 133
Figure 64 Calculation points for A-annulus MAASP ............................................................................ 136
Figure 65 Annular Triggers & Working Pressures................................................................................ 139
4
List of Tables
Table 1 Number of wells with reported tubing leaks ............................................................................ 20
Table 2 FMECA worksheet..................................................................................................................... 65
Table 3 FMECA explanation ................................................................................................................... 65
Table 4 Classification of failure rates and severity effects .................................................................... 66
Table 5 FMECA worksheet for DHSV ..................................................................................................... 67
Table 6 Explanation of OR and AND gates ............................................................................................ 69
Table 7 Test duration for XMT and DHSV, API 14B ............................................................................. 119
Table 8 Equations for calculation of MAASP ....................................................................................... 136
Table 9 Abbreviations used in the formulas above ............................................................................. 136
5
1. What is well integrity? (Well integrity – concepts and terminology)
Well Integrity is defined in Norsok D-010 as: “application of technical, operational and
organizational solutions to reduce risk of uncontrolled release of formation fluids throughout
the life cycle of a well”.
Norsok D-010 is a functional standard and sets the minimum requirements for the
equipment/solutions to be used in a well, but it leaves it up to the operating companies to
choose the solutions that meet the requirements. The operating companies then have the full
responsibility for being compliant with the standard.
Following from this definition, the personnel planning the drilling and completion of wells
will have to identify the solutions that give safe well life cycle designs that meet the minimum
requirements of the standard.
Another implication is that operating companies and service providers have an obligation to
ensure that the equipment planned to be used will comply with the standard and if not, the
equipment will need to be improved and qualified before use. Deviations from the standard
can be made in some cases when the standard allows this. If a solution selected deviates from
the standard, then this solution needs to be equivalent or better compared to what the
requirement is.
When selecting technical solutions, it is important to set the right equipment specifications
and define the requirements for the well barrier to ensure the well integrity is maintained
throughout the well life. Typical things to specify are the BOP rating and size, the casings to
be used, the pressure rating on downhole and topside equipment and the material specification
of the equipment. These specifications will be set at an early stage of a project and the later
selection of equipment will be based on it.
NORSOK D-0101 specifies that: “There shall be two well barriers available during all well
activities and operations, including suspended or abandoned wells, where a pressure
differential exists that may cause uncontrolled outflow from the borehole/well to the external
environment”. This sets the foundation for how to operate wells and keep the wells safe in all
phases of the development. This requirement is also referred to in PSA’s Activities and
Facilities regulation and it implies that operators have to adhere to the two well barrier
philosophies and maintain sufficient adherence in all phases of their operations. Good
6
operational solutions are also required to ensure that the well integrity requirements are met.
A typical example is the requirement to regularly function and pressure test the sub-surface
safety valve to ensure it is operational at all times. The operational solution will include
procedures for operating valves on a well, flowing restrictions etc. that can have an impact on
the integrity of the well and other day-to-day activities to keep a well under control and
producing it in a safe manner. Another example is to continuously monitor the pressure in the
annuli of a well to ensure a leak or breach of a well barrier is detected early and that
corrective action can be taken before the problem escalates.
Organizational solutions are also required to ensure the required well integrity is maintained.
This will include, amongst other things, that the operating company ensures that people with
the right competence are working with well operations and that they are up to date with the
latest well status. Good communication between the parties involved is required so that the
correct information is shared and passed on at e.g. shift handovers. In handover
documentation, all relevant information with regards to barriers, operational limits, valve
status, design of the well etc. has to be compiled as part of a handover package. Many
problems and accidents have been due to poor handover documentation or communication,
and good routines and organizational solutions for this is required to maintain the required
level of safety in offshore operations.
The Petroleum Safety Authority (PSA) have published the regulatory requirements regarding
well integrity aspects like organizational solutions, management system, competence and
training, work processes, operational organization, emergency preparedness etc.
Well barriers and failure modes of different well barrier elements have been discussed
in Chapter 3. A failure of a well barrier element will usually result in a well with reduced
integrity. If a well barrier has failed, the only action that can take place in the well is to restore
the failed well barrier. Alternatively, the well can be plugged and made secure or in some
cases, the well barrier can be redefined and production continued until the failure can be
corrected.
7
X-mas
tree
PWV
HMV
MMV
KV
SV
DHSV
PT
PT
PT
PI
A B C
Gas Lift
Valve
ASV
PT
CIV
X-mas
tree
PWV
HMV
MMV
KV
SV
DHSV
PT
PT
PT
PI
A B C
Gas Lift
Valve
Failed ASV
PT
CIV
Integrated
WH valve
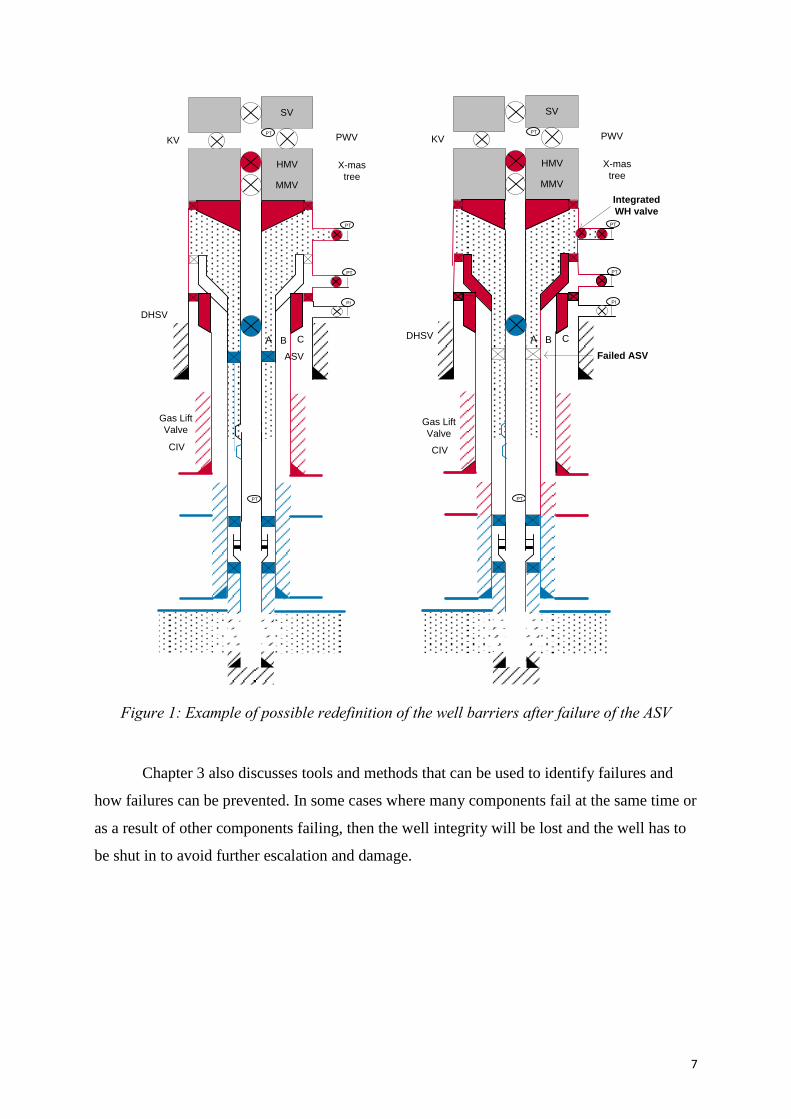
Figure 1: Example of possible redefinition of the well barriers after failure of the ASV
Chapter 3 also discusses tools and methods that can be used to identify failures and
how failures can be prevented. In some cases where many components fail at the same time or
as a result of other components failing, then the well integrity will be lost and the well has to
be shut in to avoid further escalation and damage.
8
2. Background and History
There has been a significant technological evolution in the drilling industry during the past
30years. The early platforms on the Norwegian Continental Shelf were designed for wells
with a reach of 3 km from the platform. To cover a large reservoir often several platforms
were required. Examples are Statfjord A, B and C and Gullfaks A, B and C. As these
platforms were very expensive, alternative solutions were pursued such as subsea installations
and extended reach wells. Today it is possible to reach targets 12 km from the platform. One
new platform can replace three old platforms from a reservoir coverage point of view.
The technical evolution exemplified above requires technology and improvement on very
many levels. Obviously since the wells are much longer, the risk of failure is also increased.
Unfortunately, the high number of elements that can possibly fail makes the analysis difficult.
Well Integrity can in its simplest definition be defined as a condition of a well in operation
that has full functionality and two qualified well barrier envelopes. Any deviation from this
state is a minor or major well integrity issue. Common integrity issues are often related to
leaks in tubular or valves, but can also be related the reservoir issues as loss of zonal control.
Any factor that leads to a functional failure is a loss of well integrity. The challenge is of
course to define all possible scenarios.
History shows some severe examples of losing integrity in wells such as the Phillips
Petroleum’s Bravo blowout in 1977, Saga Petroleum’s underground blowout in 1989,
Statoil’s blowout on Snorre in 2004, and BP’s Macondo blowout in the Gulf of Mexico in
2010. These serious accidents remind us of the potential dangers in the oil and gas industry
and they are some of the main drivers for the current focus on well integrity in the industry.
The Petroleum Safety Authority (PSA) initiated a pilot study in 2006, which has resulted in a
continuous activity in well integrity. The pilot study was based on supervisory audits and
input from seven operating companies, including 12 offshore facilities and 406 wells and
presents a snapshot of the well integrity status of the selected wells at the time. The results
indicated that 18 % of the wells in the survey had integrity failures, issues or uncertainties and
7 % of these were shut in because of well integrity issues. A later study indicated that each
fifth production well and each third injection well may suffer from well integrity issues. An
interesting observation was that old wells had few well integrity issues, actually most

9
problems occurred in the age group 5-14 years. These conclusions are not general but are
limited to the studies referred to.
It is clear from the above description that well integrity is an important safety aspect of a well.
However, some of the issues are not critical, whereas some may lead to accidents.
2.1 What can go wrong in wells?
Many different types of failures can lead to loss of well integrity. The degree of severity is
also varying. For each of the blowouts mentioned above, a long chain of events led to the
incidents. The simplest approach would be to consider failure of individual well components.
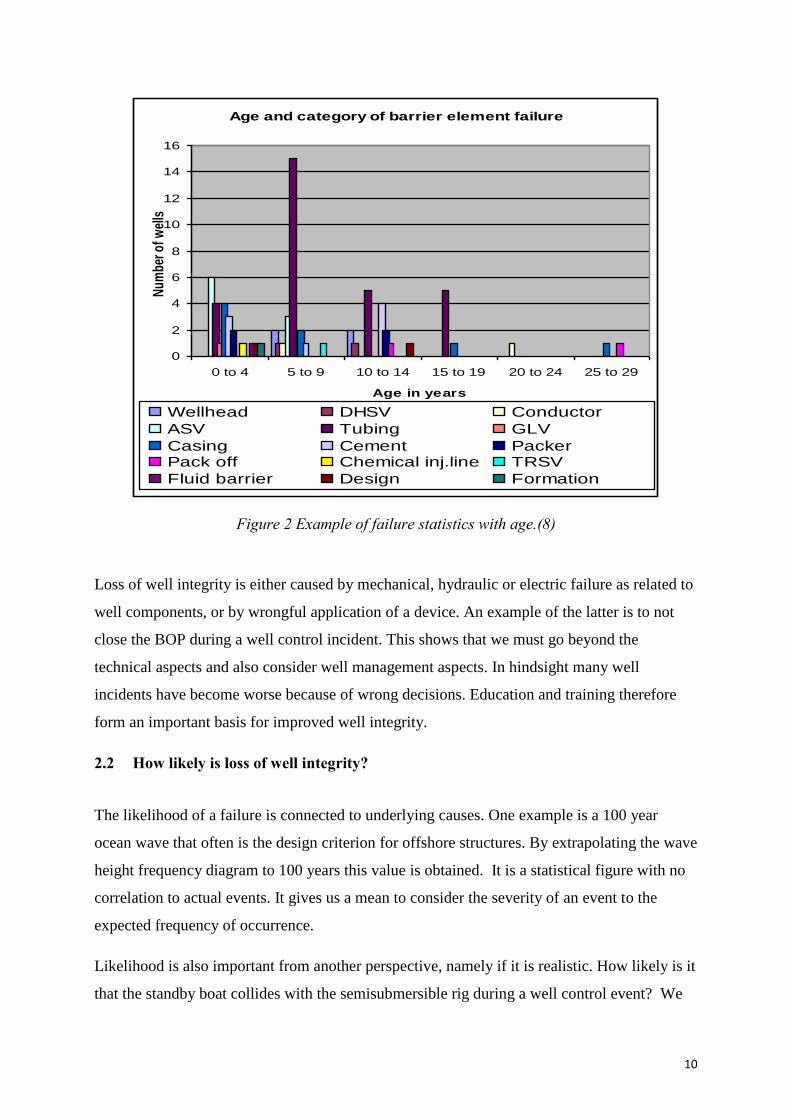
Figure 2 shows some results from a PSA study conducted in 2006. Clearly the production
tubing is the dominating component with failure. This is not unexpected as the tubing is
exposed to corrosive elements from the produced fluids and, the production tubing consists of
many threaded connections where the high number of connections gives a high risk of leak.
Two well barriers between the reservoirs and the environment are required in the production
of hydrocarbons to prevent loss of containment. If one of the elements shown in Figure1
fails, the well has reduced integrity and operations have to take place to replace or restore the
failed barrier element.
10
Age and category of barrier element failure
0
2
4
6
8
10
12
14
16
0 to 4 5 to 9 10 to 14 15 to 19 20 to 24 25 to 29
Age in years
Num
ber o
f wel
ls
Wellhead DHSV Conductor
ASV Tubing GLV
Casing Cement PackerPack off Chemical inj.line TRSV
Fluid barrier Design Formation
Figure 2 Example of failure statistics with age.(8)
Loss of well integrity is either caused by mechanical, hydraulic or electric failure as related to
well components, or by wrongful application of a device. An example of the latter is to not
close the BOP during a well control incident. This shows that we must go beyond the
technical aspects and also consider well management aspects. In hindsight many well
incidents have become worse because of wrong decisions. Education and training therefore
form an important basis for improved well integrity.
2.2 How likely is loss of well integrity?
The likelihood of a failure is connected to underlying causes. One example is a 100 year
ocean wave that often is the design criterion for offshore structures. By extrapolating the wave
height frequency diagram to 100 years this value is obtained. It is a statistical figure with no
correlation to actual events. It gives us a mean to consider the severity of an event to the
expected frequency of occurrence.
Likelihood is also important from another perspective, namely if it is realistic. How likely is it
that the standby boat collides with the semisubmersible rig during a well control event? We
11
understand that there is a compromise between the severity threshold and the number of
scenarios to consider. The PSA study did not resolve the likelihood issue, but there was some
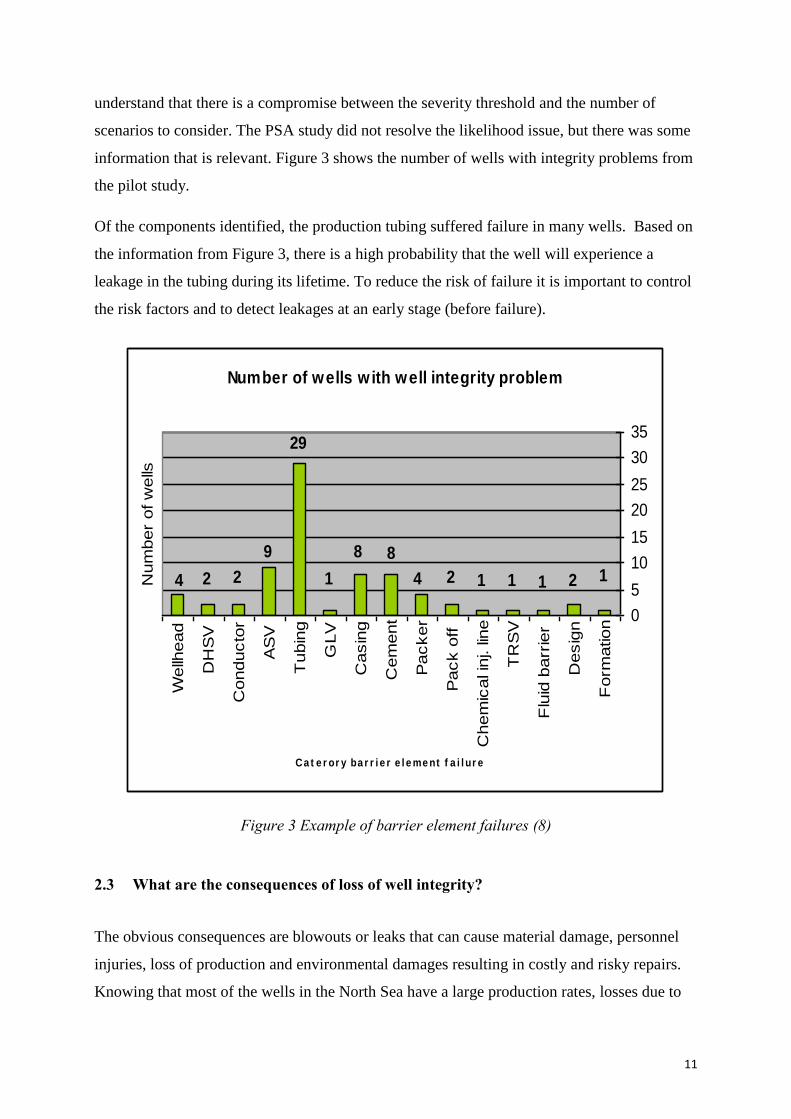
information that is relevant. Figure 3 shows the number of wells with integrity problems from
the pilot study.
Of the components identified, the production tubing suffered failure in many wells. Based on
the information from Figure 3, there is a high probability that the well will experience a
leakage in the tubing during its lifetime. To reduce the risk of failure it is important to control
the risk factors and to detect leakages at an early stage (before failure).
Number of wells w ith well integrity problem
29
42 1
89
2 1211124
8
Wellh
ead
DH
SV
Conducto
r
AS
V
Tubin
g
GLV
Casin
g
Cem
ent
Packer
Pack o
ff
Chem
ical in
j. lin
e
TR
SV
Flu
id b
arr
ier
Desig
n
Form
ation
Ca t e r or y ba r r i e r e l e me nt f a i l ur e
Num
ber
of w
ells
0
5
10
15
20
25
30
35
Figure 3 Example of barrier element failures (8)
2.3 What are the consequences of loss of well integrity?
The obvious consequences are blowouts or leaks that can cause material damage, personnel
injuries, loss of production and environmental damages resulting in costly and risky repairs.
Knowing that most of the wells in the North Sea have a large production rates, losses due to
12
production/injection stop may be very costly. Often these losses exceed the cost of the repair
of the well.
This shows that well integrity depends not only on equipment robustness, but on the total
process, the competence and resources of the organization and the competence of the
individual. In the following we will approach well integrity from a technical perspective, but
keep in mind that any other element like a wrong operational decision may lead to well
integrity issues.
2.4 Some cases of loss of well integrity
Several audits of well problems have been carried out by the PSA during the last decade. All
these problems led to well shut in for some time, and in some cases the entire platform
production was temporarily shut in. The cases will show examples of losses of well integrity
and the consequences.
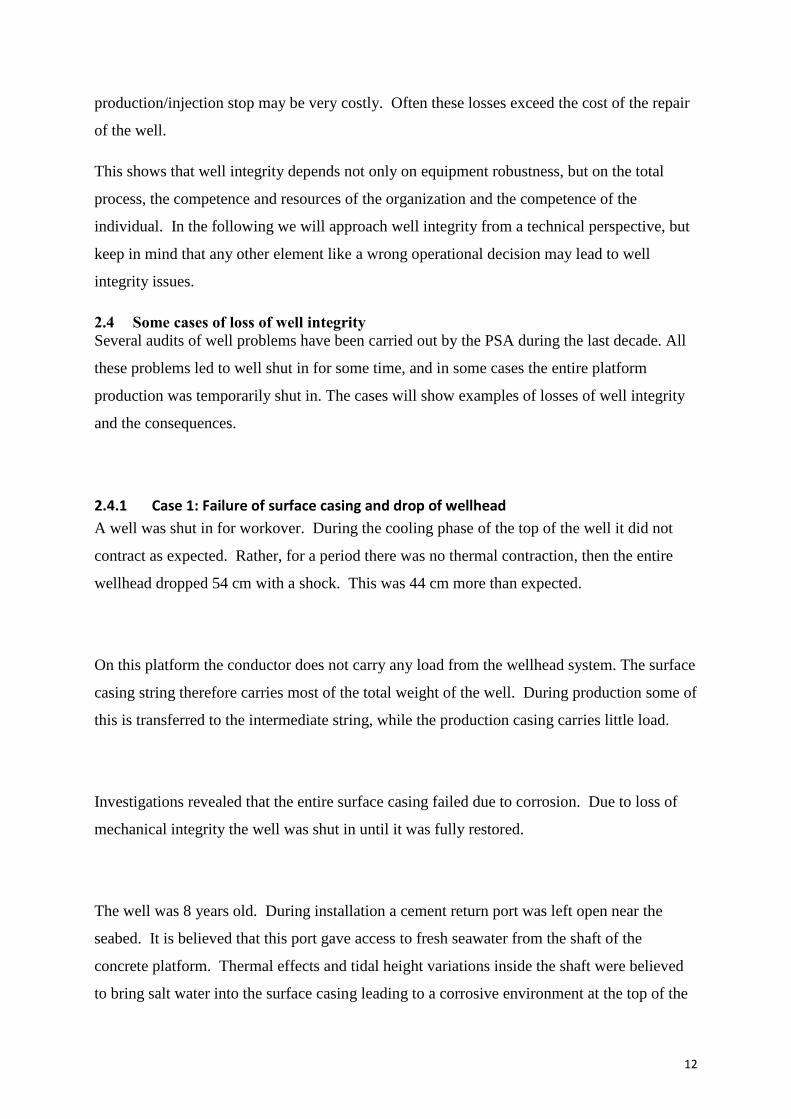
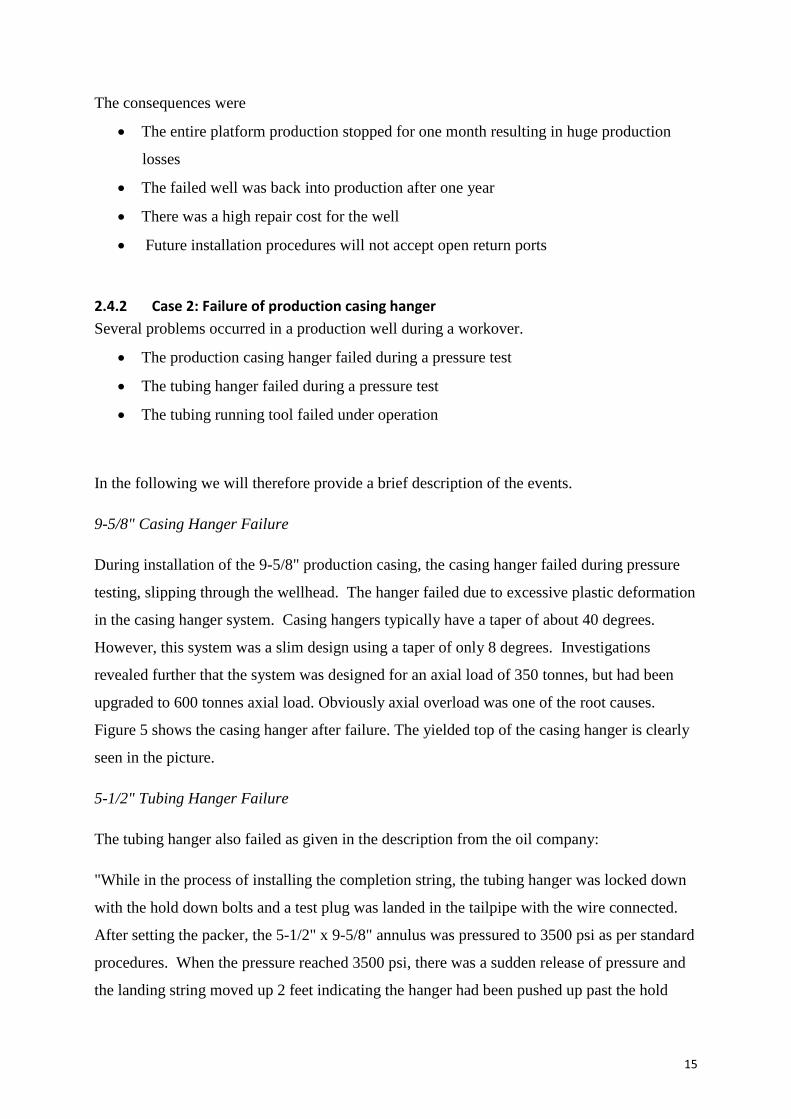
2.4.1 Case 1: Failure of surface casing and drop of wellhead
A well was shut in for workover. During the cooling phase of the top of the well it did not
contract as expected. Rather, for a period there was no thermal contraction, then the entire
wellhead dropped 54 cm with a shock. This was 44 cm more than expected.
On this platform the conductor does not carry any load from the wellhead system. The surface
casing string therefore carries most of the total weight of the well. During production some of
this is transferred to the intermediate string, while the production casing carries little load.
Investigations revealed that the entire surface casing failed due to corrosion. Due to loss of
mechanical integrity the well was shut in until it was fully restored.
The well was 8 years old. During installation a cement return port was left open near the
seabed. It is believed that this port gave access to fresh seawater from the shaft of the
concrete platform. Thermal effects and tidal height variations inside the shaft were believed
to bring salt water into the surface casing leading to a corrosive environment at the top of the

13
annulus. To avoid this problem for future wells it was recommended to fill the top of the
surface casing annulus with oil, which would coat the exposed tubular and eliminate
corrosion. The well is shown in Figure 4.

14
Figure 4 Failed surface casing and position of open cement return port
15
The consequences were
The entire platform production stopped for one month resulting in huge production
losses
The failed well was back into production after one year
There was a high repair cost for the well
Future installation procedures will not accept open return ports
2.4.2 Case 2: Failure of production casing hanger
Several problems occurred in a production well during a workover.
The production casing hanger failed during a pressure test
The tubing hanger failed during a pressure test
The tubing running tool failed under operation
In the following we will therefore provide a brief description of the events.
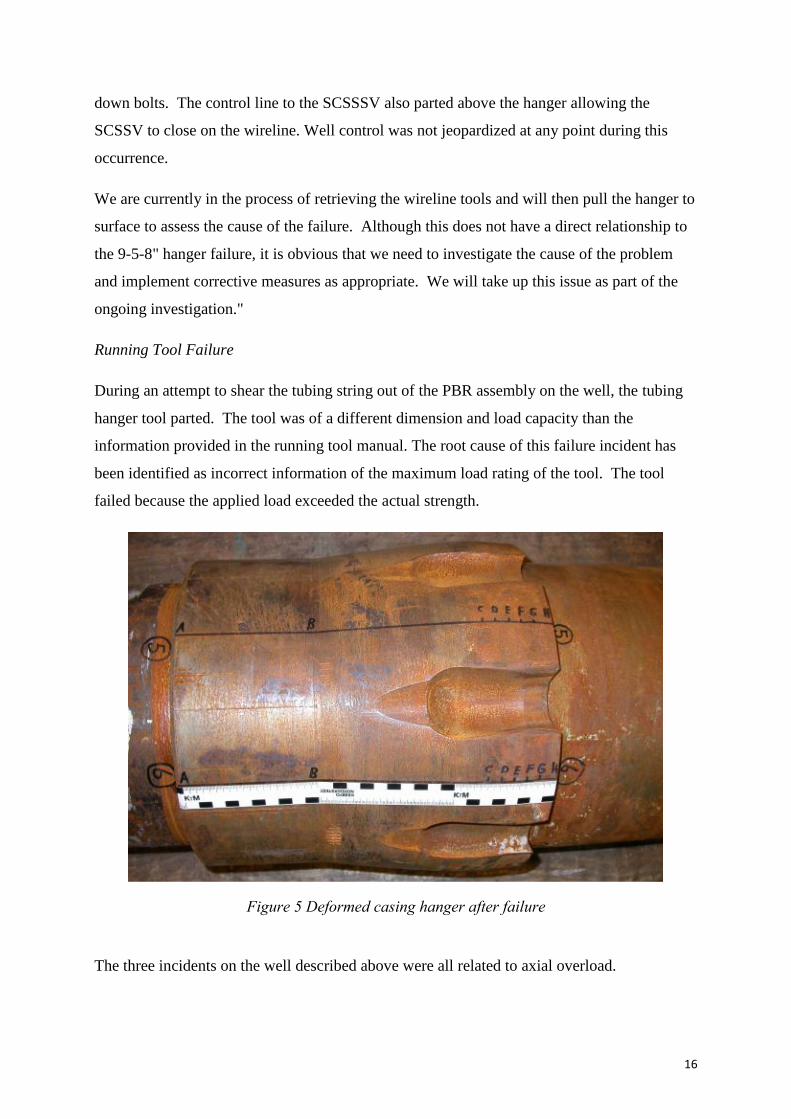
9-5/8" Casing Hanger Failure
During installation of the 9-5/8" production casing, the casing hanger failed during pressure
testing, slipping through the wellhead. The hanger failed due to excessive plastic deformation
in the casing hanger system. Casing hangers typically have a taper of about 40 degrees.
However, this system was a slim design using a taper of only 8 degrees. Investigations
revealed further that the system was designed for an axial load of 350 tonnes, but had been
upgraded to 600 tonnes axial load. Obviously axial overload was one of the root causes.
Figure 5 shows the casing hanger after failure. The yielded top of the casing hanger is clearly
seen in the picture.
5-1/2" Tubing Hanger Failure
The tubing hanger also failed as given in the description from the oil company:
"While in the process of installing the completion string, the tubing hanger was locked down
with the hold down bolts and a test plug was landed in the tailpipe with the wire connected.
After setting the packer, the 5-1/2" x 9-5/8" annulus was pressured to 3500 psi as per standard
procedures. When the pressure reached 3500 psi, there was a sudden release of pressure and
the landing string moved up 2 feet indicating the hanger had been pushed up past the hold
16
down bolts. The control line to the SCSSSV also parted above the hanger allowing the
SCSSV to close on the wireline. Well control was not jeopardized at any point during this
occurrence.
We are currently in the process of retrieving the wireline tools and will then pull the hanger to
surface to assess the cause of the failure. Although this does not have a direct relationship to
the 9-5-8" hanger failure, it is obvious that we need to investigate the cause of the problem
and implement corrective measures as appropriate. We will take up this issue as part of the
ongoing investigation."
Running Tool Failure
During an attempt to shear the tubing string out of the PBR assembly on the well, the tubing
hanger tool parted. The tool was of a different dimension and load capacity than the
information provided in the running tool manual. The root cause of this failure incident has
been identified as incorrect information of the maximum load rating of the tool. The tool
failed because the applied load exceeded the actual strength.
Figure 5 Deformed casing hanger after failure
The three incidents on the well described above were all related to axial overload.
17
The casing hanger failure was caused by overload due to the actual strength of the equipment,
compared to the rated strength. It also appears that this casing hanger system has an inherent
design problem.
The tubing hanger failed because misalignment during installation led to uneven loading of
the lock down bolts.
The tubing running tool failure was due to overloading, because specifications defined a
higher strength of the tool.
When upgrading the axial capacity of the casing hanger the manufacturer conducted a test.
Even if the material yielded during this test both the manufacturer and the oil company
accepted the upgrade.
The consequences were:
High cost of well repair
The many wellheads of this type can only be used within original specifications.
Axial load upgrade acceptance was reversed; the casing and tubing hangers can only
be used with initial specifications.
Correct specifications for running tools should be used.
Running and landing procedures for production tubing should be improved.
2.4.3 Case 3: Loss of wellbore
A well was drilled and cased according to plan with setting an intermediate liner and a 9 5/8”
drill-in liner at the top of the reservoir. The shoe was drilled out and a Formation Integrity
Test (FIT) was performed. Then the intermediate liner was pressure tested and the 9 5/8”
drill-in liner was inflow tested. The test showed no inflow.
While drilling ahead, total losses were suddenly encountered with high mud losses. The loss
rate was gradually reduced as the rig attempted to keep the hole full by filling it with pre-mix
and base oil and then eventually seawater. The well was then stabilized by placing Lost
Circulation Material (LCM) in the open hole section. The well schematic is shown in Figure
6.
18
The drill string was round-tripped to lay down a radioactive source. As the string washed
down from the top of the 9 5/8” liner, dynamic losses were again induced. At the shoe a flow
check gave some gains but this was suspected to be due to ballooning effects. The well was
circulated and conditioned before a new flow again gave some gains. Circulation with the
well open was performed when a sharp increase in returns was observed. The well was the
shut in on the annular preventer on the BOP.
Attempts were made to stabilize the well by circulating out gas through the choke. Returns
were again lost and then seawater was bullheaded on the annulus side while the losses
continued to increase. Two LCM pills were displaced in an attempt to cure the losses without
success. It was then attempted to kill the well by pumping additional water-based mud.
During the circulation, dynamic losses were experienced and the returns contained crude oil.
After circulating the well full of seawater, another LCM pill was displaced down and
squeezed to cure the losses, but this was unsuccessful. It was then attempted to kill the well
by circulating mud around through the choke. Due to high gas peaks and unstable returns, the
well was shut in and it was attempted to bullhead the gas on the annulus side by additional
volumes of seawater and mud.
Gas readings were still high and a gunk pill was pumped through the drill pipe to plug off the
open hole. The gunk pill plugged off the drill pipe, thus the ability to circulate the well was
lost. The casing pressure continued to rise and an attempt to pressure test the annulus broke
down the formation and gave injectivity. The casing pressure was still rising so the annulus
was bullheaded with seawater making the casing pressure to drop to 0 pressure. When
circulating across the BOP there were still loose sand to stem the losses, an LCM pill was
bullheaded down and squeezed into the formation. The well was then shut in and monitored
showing a rapid pressure build up on the casing side. The pressure was bled off in an attempt
to control the well. At the same time, they started to pump mud on the annulus side to
increase the hydrostatic head, while a mix of free gas and mud was bled off.
While continuing to bleed-off and pump/lubricate on the annulus side, wireline equipment
was rigged up on top of the drill string. After a wireline drift run, and a tubing perforator mis-
run, the drill string was successfully perforated at depth. The surface pressure was then
allowed to stabilize, while pressure was maintained on the outer annulus side. Subsequently,
the well was killed with mud and full well control regained.
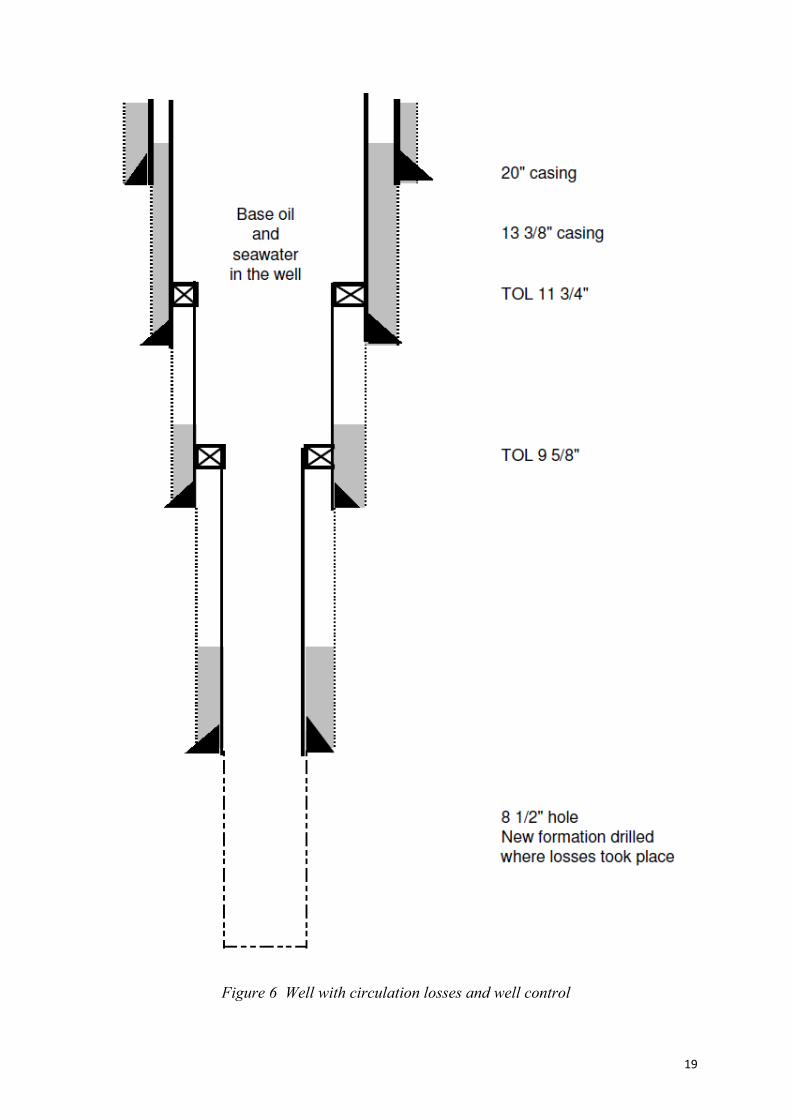
19
Figure 6 Well with circulation losses and well control
20
The consequences were:
The well had to be sidetracked at high cost
During the loss/well control events, well barriers were not in place at all times.
The gunk pill plugged off the drill string, worsening the situation
The load imposed on the well during the well control incident exceeded the test
pressure that had been applied. The barriers were not verified
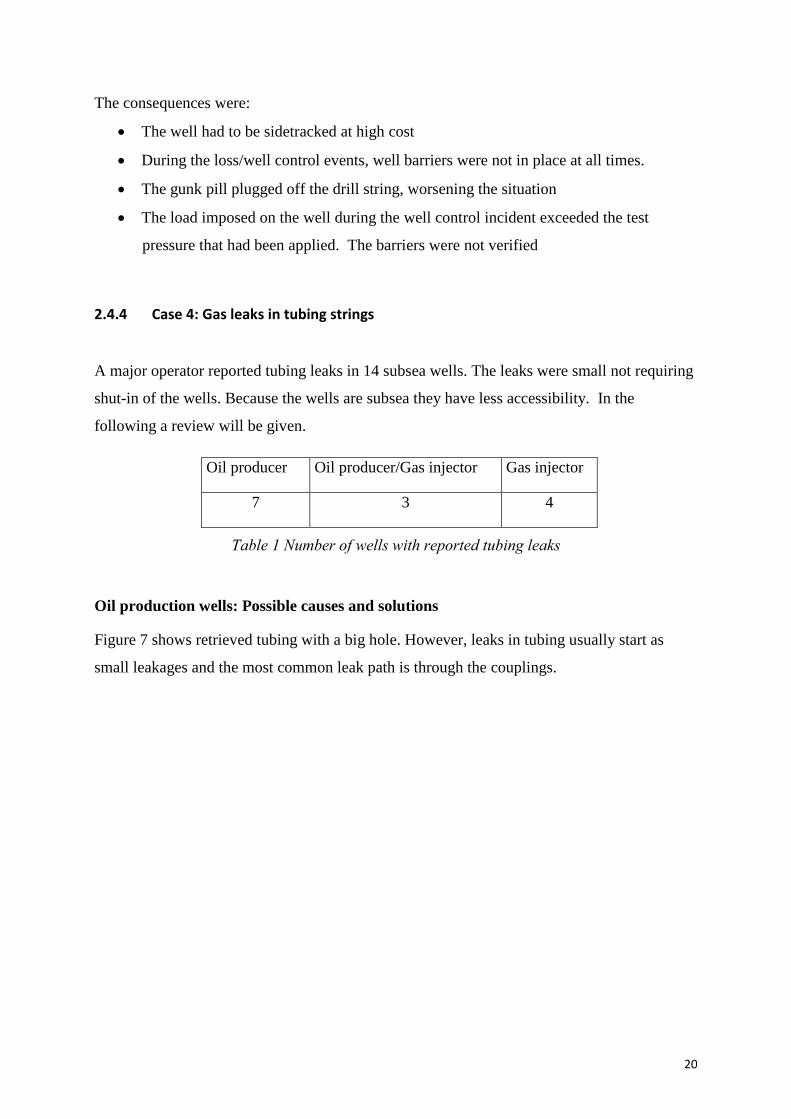
2.4.4 Case 4: Gas leaks in tubing strings
A major operator reported tubing leaks in 14 subsea wells. The leaks were small not requiring
shut-in of the wells. Because the wells are subsea they have less accessibility. In the
following a review will be given.
Oil producer Oil producer/Gas injector Gas injector
7 3 4
Table 1 Number of wells with reported tubing leaks
Oil production wells: Possible causes and solutions
Figure 7 shows retrieved tubing with a big hole. However, leaks in tubing usually start as
small leakages and the most common leak path is through the couplings.
21
Figure 7 Hole in the production tubing
There are many possible sources for leaks and these will be discussed below.
Leak in subsea valves
The pressure in the annuli is controlled using 2-1/16” needle valves. Particles in the flow may
damage or erode these valves leading to leakage. The following valves are used:
-annulus master valve (AMV)
-annulus wing valve (AWV)
-annulus circulation valve (ACV)
-cross over valve (COV)
-annulus vent valve (AVV)
All wells (for the specific field) were equipped with needle valves except in one well where
the valves have been replaced with Pacson gate valves.
22
PT
A B C
AWV
COV
SPWVPMVBMV
AMV
Horizontal
x-mas tree
ACV
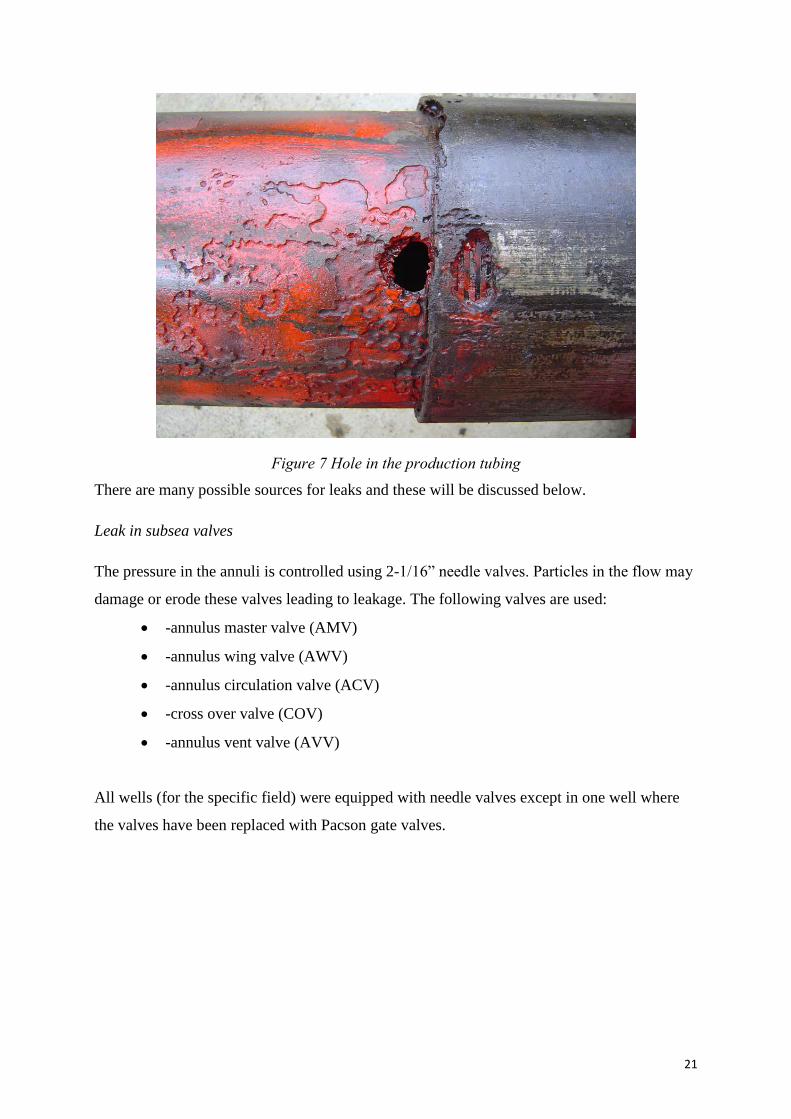
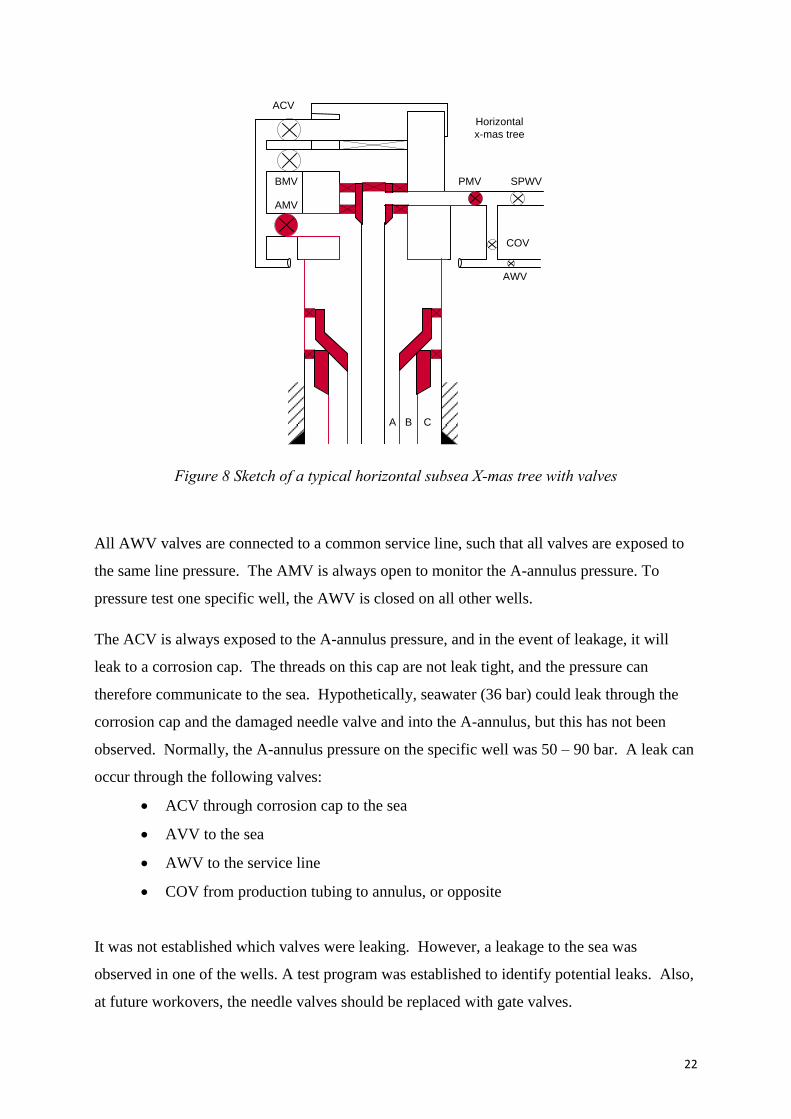
Figure 8 Sketch of a typical horizontal subsea X-mas tree with valves
All AWV valves are connected to a common service line, such that all valves are exposed to
the same line pressure. The AMV is always open to monitor the A-annulus pressure. To
pressure test one specific well, the AWV is closed on all other wells.
The ACV is always exposed to the A-annulus pressure, and in the event of leakage, it will
leak to a corrosion cap. The threads on this cap are not leak tight, and the pressure can
therefore communicate to the sea. Hypothetically, seawater (36 bar) could leak through the
corrosion cap and the damaged needle valve and into the A-annulus, but this has not been
observed. Normally, the A-annulus pressure on the specific well was 50 – 90 bar. A leak can
occur through the following valves:
ACV through corrosion cap to the sea
AVV to the sea
AWV to the service line
COV from production tubing to annulus, or opposite
It was not established which valves were leaking. However, a leakage to the sea was
observed in one of the wells. A test program was established to identify potential leaks. Also,
at future workovers, the needle valves should be replaced with gate valves.
23
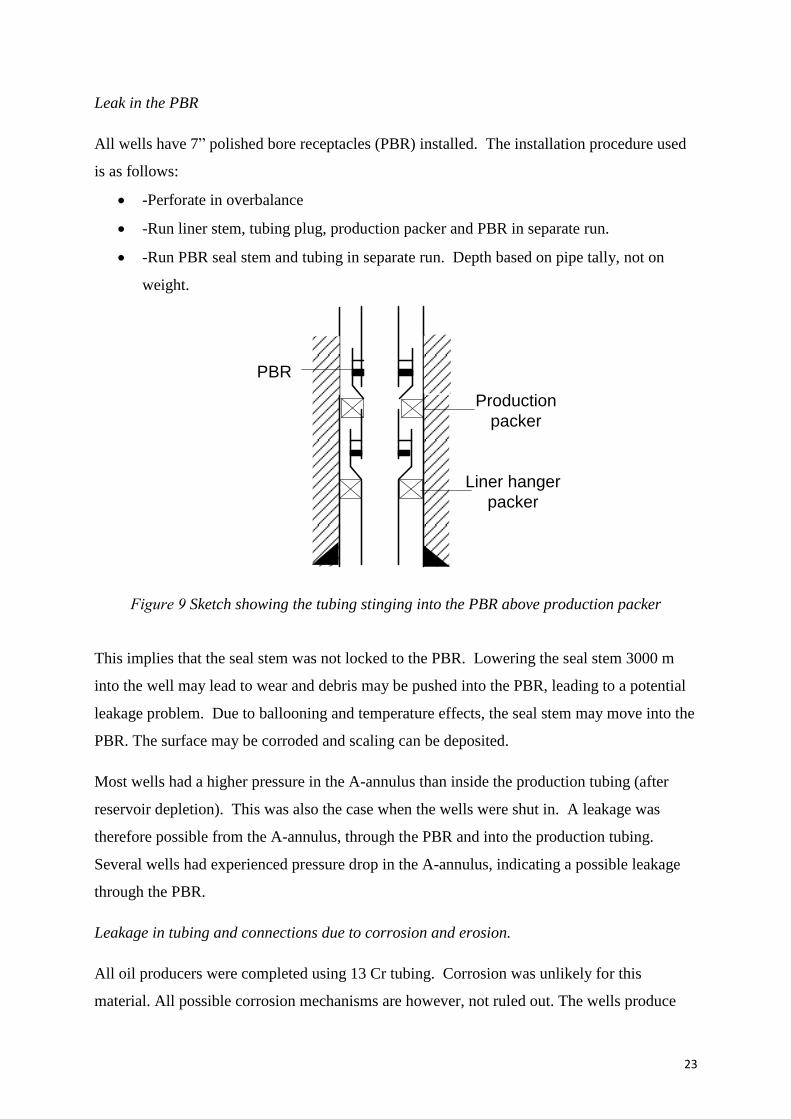
Leak in the PBR
All wells have 7” polished bore receptacles (PBR) installed. The installation procedure used
is as follows:
-Perforate in overbalance
-Run liner stem, tubing plug, production packer and PBR in separate run.
-Run PBR seal stem and tubing in separate run. Depth based on pipe tally, not on
weight.
Production
packer
Liner hanger
packer
PBR
Figure 9 Sketch showing the tubing stinging into the PBR above production packer
This implies that the seal stem was not locked to the PBR. Lowering the seal stem 3000 m
into the well may lead to wear and debris may be pushed into the PBR, leading to a potential
leakage problem. Due to ballooning and temperature effects, the seal stem may move into the
PBR. The surface may be corroded and scaling can be deposited.
Most wells had a higher pressure in the A-annulus than inside the production tubing (after
reservoir depletion). This was also the case when the wells were shut in. A leakage was
therefore possible from the A-annulus, through the PBR and into the production tubing.
Several wells had experienced pressure drop in the A-annulus, indicating a possible leakage
through the PBR.
Leakage in tubing and connections due to corrosion and erosion.
All oil producers were completed using 13 Cr tubing. Corrosion was unlikely for this
material. All possible corrosion mechanisms are however, not ruled out. The wells produce
24
with high GOR, and sand and water is reported in the separator systems. Erosion is most
likely to occur at chokes and bends. Measurements were not yet conducted. Some erosion was
seen in chokes, but defined as a design problem, it has now been corrected. New Vam threads
are used in part of the completion. These are notoriously weak in compression, but there is no
indication that they have failed.
The completion string in well A-17 was pulled out for inspection. No corrosion was found,
only minor marks on the pipe surface, and some small signs of sand erosion inside. The PBR
had many small marks on the seal surfaces, but this is inconclusive with respect to leakage.
Recommendations:
Measure wall thickness in surface bend to see if sand erosion is present.
Run caliper log/ pipe thickness tool in selected wells.
Evaluate another thread dope
Check make-up torque chart for all tubing and assemblies run in the next well.
Consider sand production reduction measures.
Analyze the completion string on well A-10 when recompleted.
Other factors
The oil wells were perforated in overbalance before placing the completion strings in two
runs. The wells were not cleaned out after perforating, which may lead to high skin (wells A-
11 and A-18). It is possible that the upper perforation interval or layers of high permeability
contributes to the production. The bottom-hole pressure varies 150-200 bars between
production and shut-in. This will lead to movement of the PBR, and a risk of leakage. Well A-
11 has a leak, and well A-18 has an indication of a leak. In drilling phase 2, alternative
completion solutions should be considered.
The following main recommendations were given:
Perform a leakage test program for subsea valves
Replace needle valves with gate valves at future workovers
Eliminate PBR where possible. If PBR is required, set new packer and pre-spaced
PBR over, alternatively use extended joint.
Verify metal-to-metal seal and pressure test seal on downhole pressure gauge.
25
Verify that thread loadings are within specifications.
Revise procedure for monitoring the A-annulus pressure in oil wells:
o A-annulus pressure between 10 and 90 bar
o Monitor the A-annulus pressure with other production data.
Measure wall thickness of bends to check for sand erosion.
Run caliper log/wall thickness in selected wells.
Consider 13 Cr. Tubing in gas injections wells.
2.4.5 Case 5: Production casing failure
Both the production tubing and the production casing in a North Sea well collapsed and had to
be replaced. The events that led to this incident are described below.
The 9-5/8“ production casing is installed in two operations. The bottom section is landed from
2515 m to 4815 mTVD and cemented in place. Then the upper part of the production casing
is landed on a PBR, which provides a seal. This is called a tieback solution. Repeated pressure
tests were performed after installation because the pressure could not be maintained. This
indicated a leak in the system. This leak could be at any location; at the PBR, in a casing
connection or in the surface equipment. The surface equipment was thoroughly checked and
eliminated. Finally, a couple of pressure tests were performed and accepted and the well was
completed for production.
The well was set on production. At a later time it was discovered that the production casing
had collapsed at a depth of about 700 m. It was decided to pull out and replace the tieback
production casing.
The tieback string was changed according to the plan, and the well is now back in production.
A possible root cause of the failure is that there was a leak somewhere in the production
casing or at the PBR, such that pressure was built up behind the casing during pressure
testing. During production thermal effects caused the pressure behind the production casing
to exceed the collapse resistance of the casing. Repeated casing pressure tests should question
the integrity of the casing.
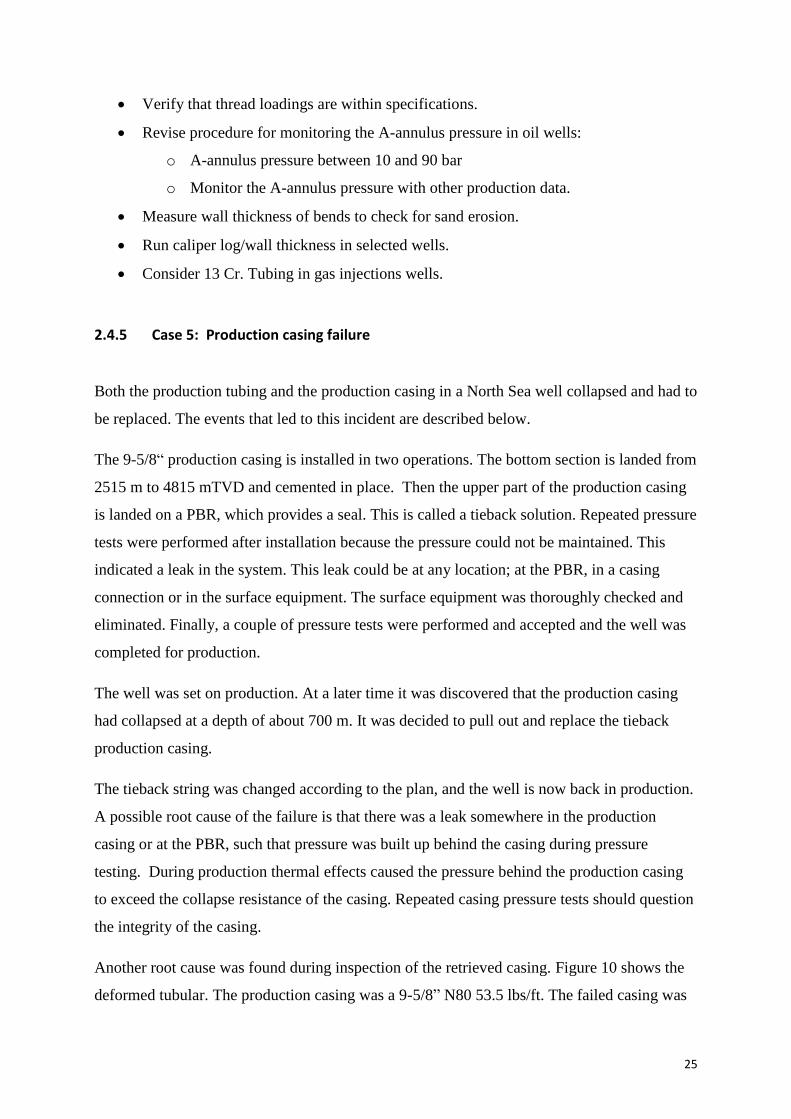
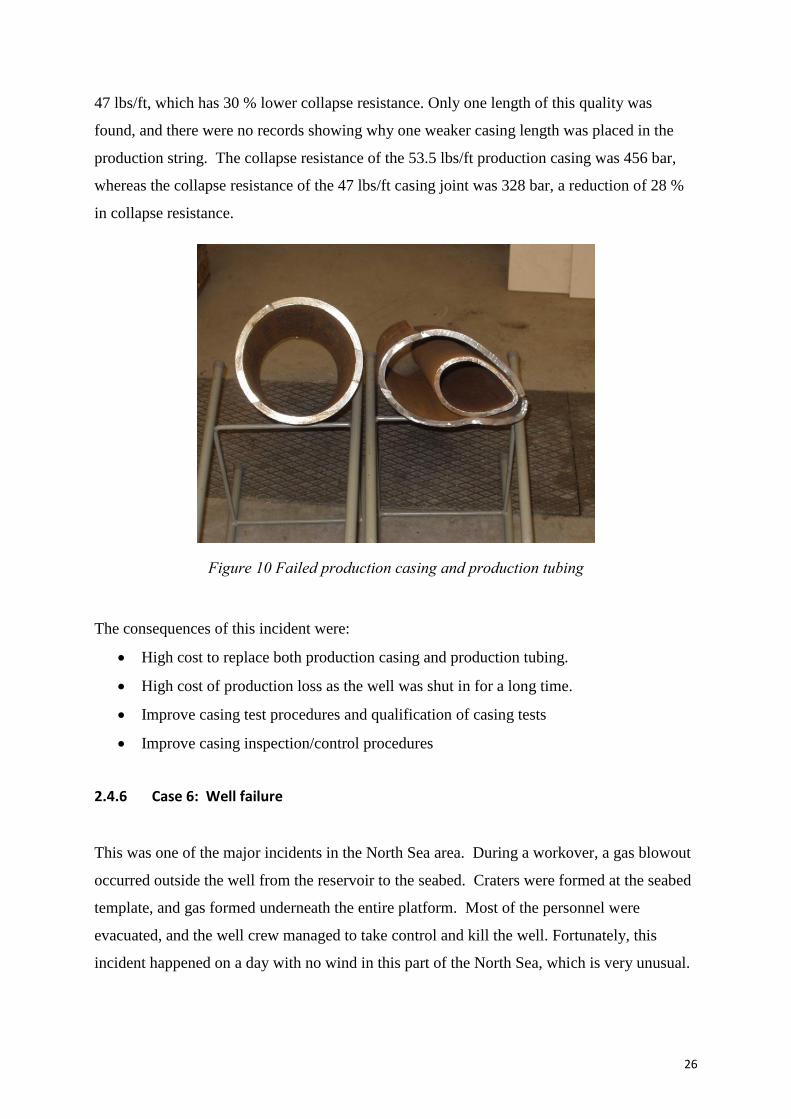
Another root cause was found during inspection of the retrieved casing. Figure 10 shows the
deformed tubular. The production casing was a 9-5/8” N80 53.5 lbs/ft. The failed casing was
26
47 lbs/ft, which has 30 % lower collapse resistance. Only one length of this quality was
found, and there were no records showing why one weaker casing length was placed in the
production string. The collapse resistance of the 53.5 lbs/ft production casing was 456 bar,
whereas the collapse resistance of the 47 lbs/ft casing joint was 328 bar, a reduction of 28 %
in collapse resistance.
Figure 10 Failed production casing and production tubing
The consequences of this incident were:
High cost to replace both production casing and production tubing.
High cost of production loss as the well was shut in for a long time.
Improve casing test procedures and qualification of casing tests
Improve casing inspection/control procedures
2.4.6 Case 6: Well failure
This was one of the major incidents in the North Sea area. During a workover, a gas blowout
occurred outside the well from the reservoir to the seabed. Craters were formed at the seabed
template, and gas formed underneath the entire platform. Most of the personnel were
evacuated, and the well crew managed to take control and kill the well. Fortunately, this
incident happened on a day with no wind in this part of the North Sea, which is very unusual.
27
For that reason gas accumulated underneath the entire platform giving it a significant potential
for explosion and fire. Luckily the situation was controlled with no further dangers.
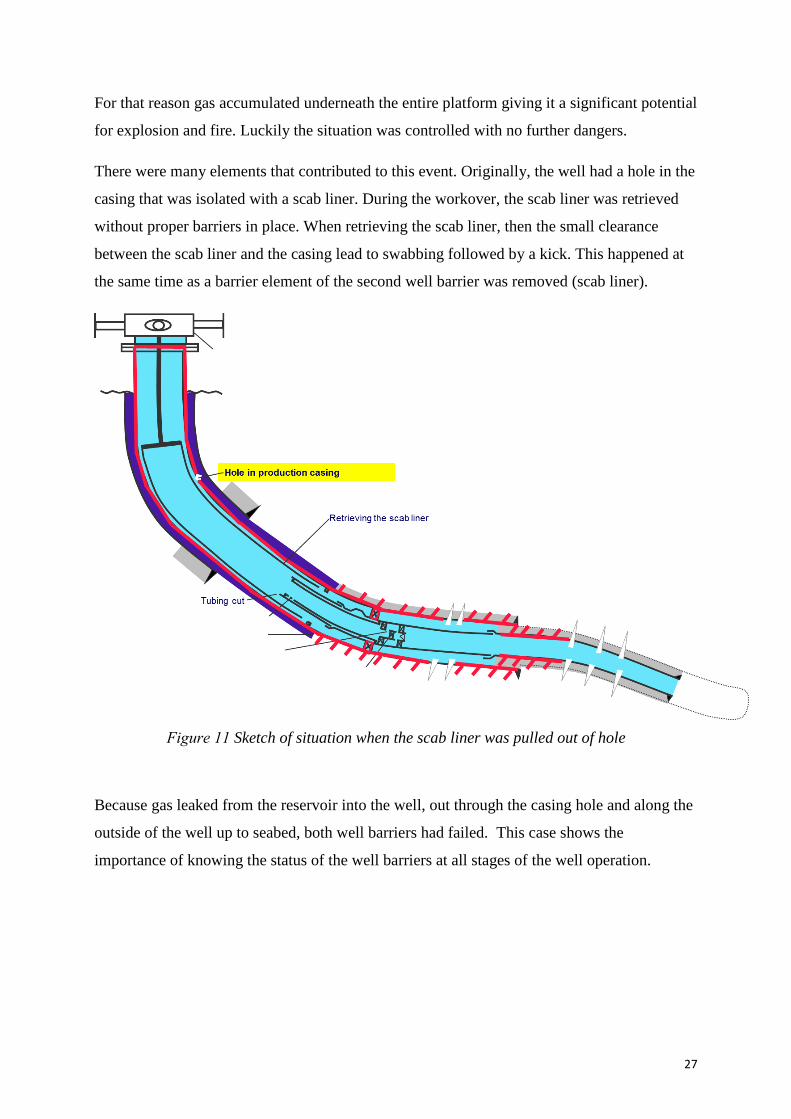
There were many elements that contributed to this event. Originally, the well had a hole in the
casing that was isolated with a scab liner. During the workover, the scab liner was retrieved
without proper barriers in place. When retrieving the scab liner, then the small clearance
between the scab liner and the casing lead to swabbing followed by a kick. This happened at
the same time as a barrier element of the second well barrier was removed (scab liner).
Figure 11 Sketch of situation when the scab liner was pulled out of hole
Because gas leaked from the reservoir into the well, out through the casing hole and along the
outside of the well up to seabed, both well barriers had failed. This case shows the
importance of knowing the status of the well barriers at all stages of the well operation.
28
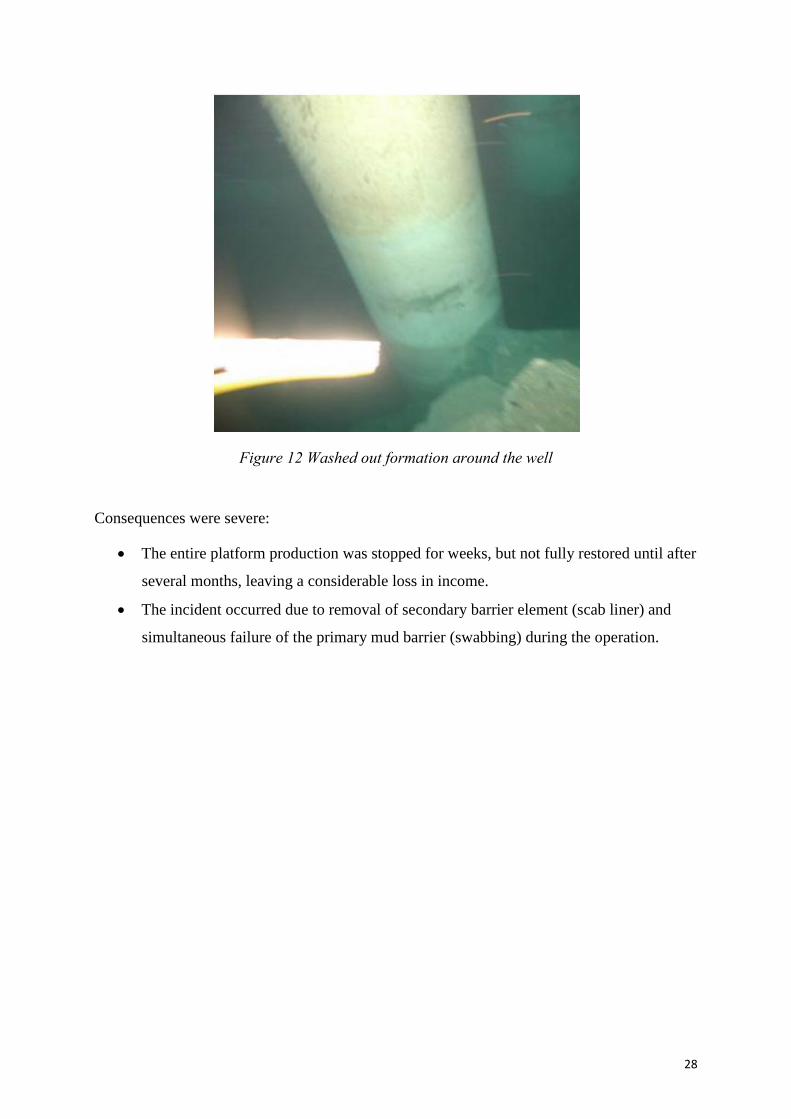
Figure 12 Washed out formation around the well
Consequences were severe:
The entire platform production was stopped for weeks, but not fully restored until after
several months, leaving a considerable loss in income.
The incident occurred due to removal of secondary barrier element (scab liner) and
simultaneous failure of the primary mud barrier (swabbing) during the operation.
29
3. Well Construction and Field Development
3.1 Well Types and Well Life Cycle
There are basically two types of wells:
Exploration well: The main purpose of an exploration well is to find potential reservoirs for
future development and production. These wells are normally plugged after logging / testing.
Production / injection wells: After drilling, these wells are completed for production and / or
injection. Water or gas is normally injected into the reservoir to maintain pressure. After the
production phase has ended, plugging and abandonment of the well takes place.
For offshore field developments, different types of drilling rigs can be used. Examples are
bottom-supported platforms like Jack-up rig, steel jacket-based platform, concrete-based
platform and Mobile Offshore Drilling Unit (MODU) like semi-submersible drilling rig and drill
ship. Field development can be divided into exploration, development, production and
abandonment phases.
3.2 Subsea drilling
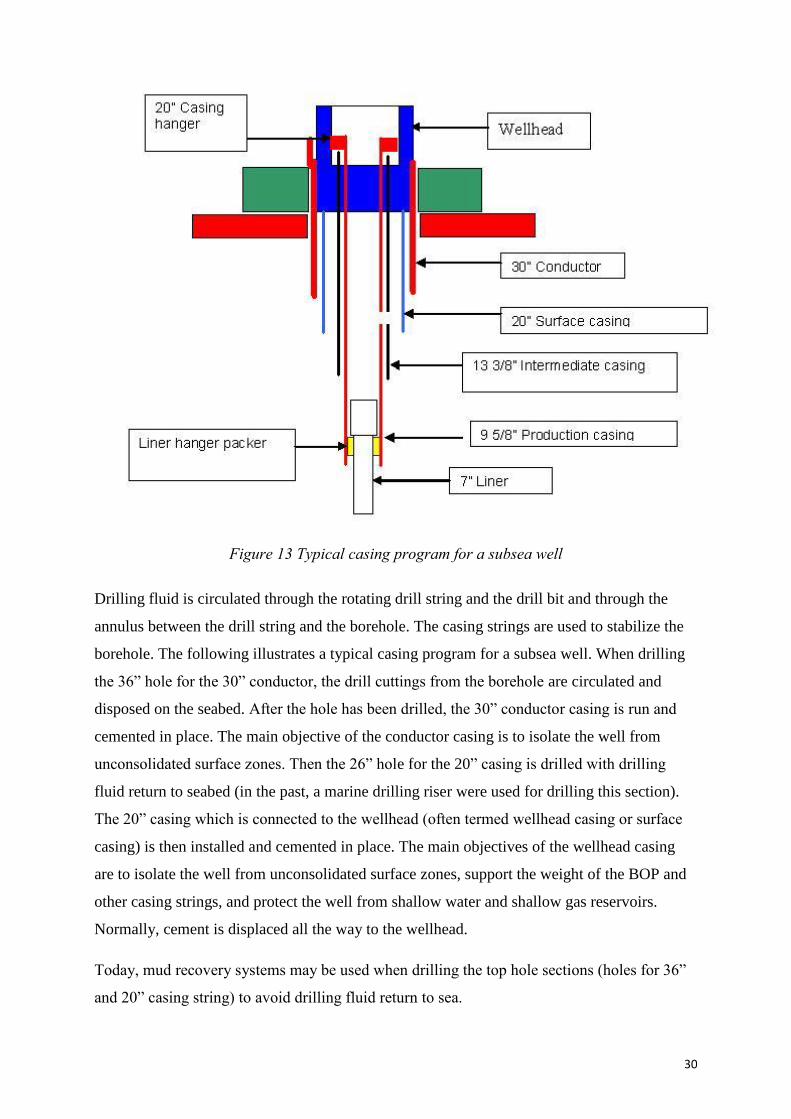
Figure 13 illustrates typical casing program for a subsea well.
30
Figure 13 Typical casing program for a subsea well
Drilling fluid is circulated through the rotating drill string and the drill bit and through the
annulus between the drill string and the borehole. The casing strings are used to stabilize the
borehole. The following illustrates a typical casing program for a subsea well. When drilling
the 36” hole for the 30” conductor, the drill cuttings from the borehole are circulated and
disposed on the seabed. After the hole has been drilled, the 30” conductor casing is run and
cemented in place. The main objective of the conductor casing is to isolate the well from
unconsolidated surface zones. Then the 26” hole for the 20” casing is drilled with drilling
fluid return to seabed (in the past, a marine drilling riser were used for drilling this section).
The 20” casing which is connected to the wellhead (often termed wellhead casing or surface
casing) is then installed and cemented in place. The main objectives of the wellhead casing
are to isolate the well from unconsolidated surface zones, support the weight of the BOP and
other casing strings, and protect the well from shallow water and shallow gas reservoirs.
Normally, cement is displaced all the way to the wellhead.
Today, mud recovery systems may be used when drilling the top hole sections (holes for 36”
and 20” casing string) to avoid drilling fluid return to sea.
31
After the surface casing is set and cemented, the Blow-Out Preventer (BOP) is run on the
marine drilling riser and connected to the subsea wellhead. The drilling riser is used for the
return of drilling fluid back to the drilling vessel where the drill cuttings are removed before
the drilling fluid is re-circulated into the borehole. The next hole size will typically be 17 ½”
and the corresponding intermediate casing string will be 13 3/8”. The main objective of the
intermediate casing string is to protect zones from circulation losses, isolate zones with low or
high pressure and isolate hydrocarbon formations that might not be produced temporary or
permanently. Further, the 12 ¼” bit is used to drill the hole section for the 9 5/8” production
casing. The purpose of the production casing, which is typically set in the cap rock above the
reservoir, is to protect the production tubing, allowing the hydrocarbons to be produced
safely. Finally the 8 ½” bit is used to drill the hole section for the 7” casing string. Normally,
the 7” casing string is run as a liner. A liner is a pipe extension from the last set of casing
string. A liner is normally extended back to the wellhead using a tie-back string.
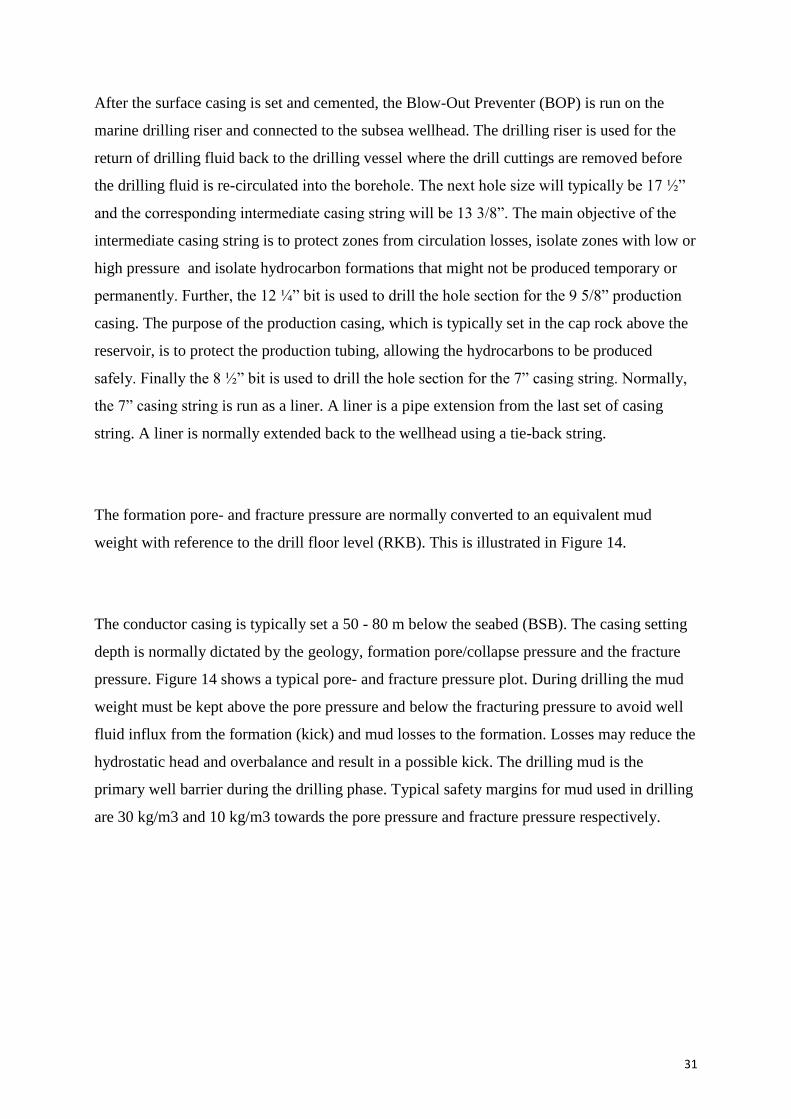
The formation pore- and fracture pressure are normally converted to an equivalent mud
weight with reference to the drill floor level (RKB). This is illustrated in Figure 14.
The conductor casing is typically set a 50 - 80 m below the seabed (BSB). The casing setting
depth is normally dictated by the geology, formation pore/collapse pressure and the fracture
pressure. Figure 14 shows a typical pore- and fracture pressure plot. During drilling the mud
weight must be kept above the pore pressure and below the fracturing pressure to avoid well
fluid influx from the formation (kick) and mud losses to the formation. Losses may reduce the
hydrostatic head and overbalance and result in a possible kick. The drilling mud is the
primary well barrier during the drilling phase. Typical safety margins for mud used in drilling
are 30 kg/m3 and 10 kg/m3 towards the pore pressure and fracture pressure respectively.
32
Figure 14 Equivalent mud weight, equivalent pore pressure (Pp) and equivalent fracture
pressure (Pf )/ equivalent minimum formation stress vs. depth (TVD)
For a well in operation or a well that is to be permanently plugged and abandoned, the
integrity of formation as part of the well barrier envelope should be ensured. Information
about the minimum formation stress of the formation being a part of the barrier envelope
should therefore be gained during drilling and used as baseline for maximum allowed pressure
for the formation as barrier in these phases.
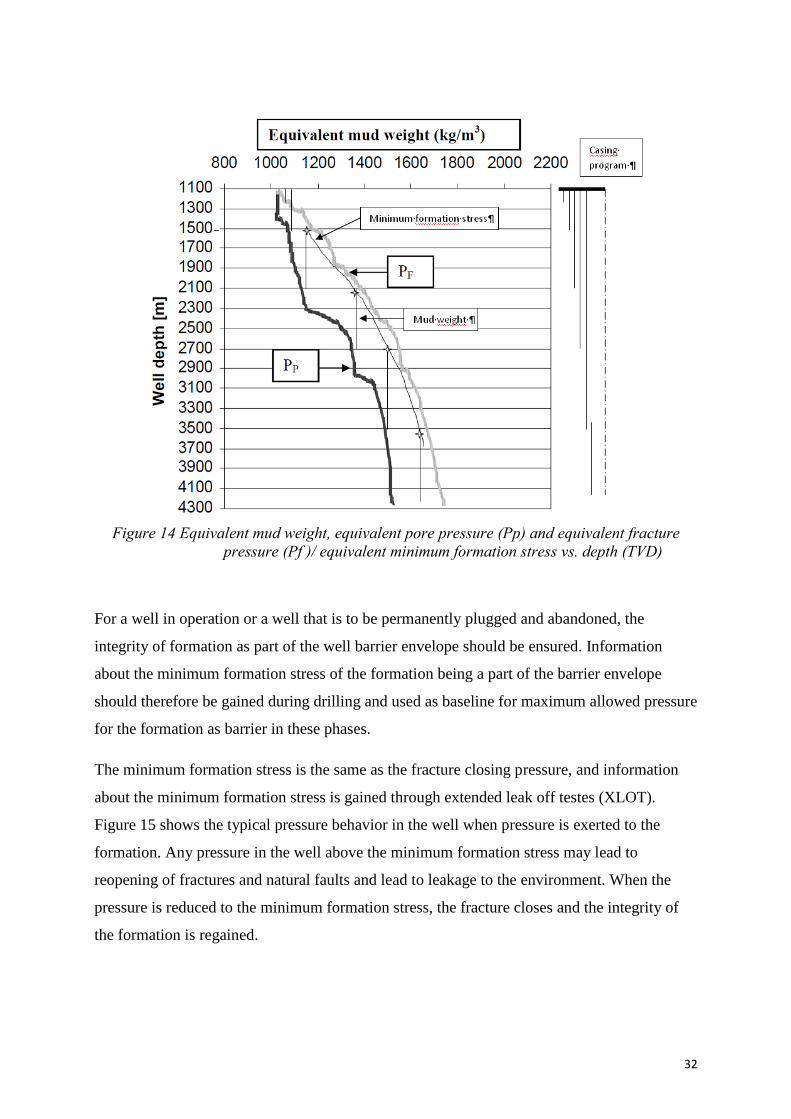
The minimum formation stress is the same as the fracture closing pressure, and information
about the minimum formation stress is gained through extended leak off testes (XLOT).
Figure 15 shows the typical pressure behavior in the well when pressure is exerted to the
formation. Any pressure in the well above the minimum formation stress may lead to
reopening of fractures and natural faults and lead to leakage to the environment. When the
pressure is reduced to the minimum formation stress, the fracture closes and the integrity of
the formation is regained.
33
Figure 15 Typical pressure behavior when performing XLOT
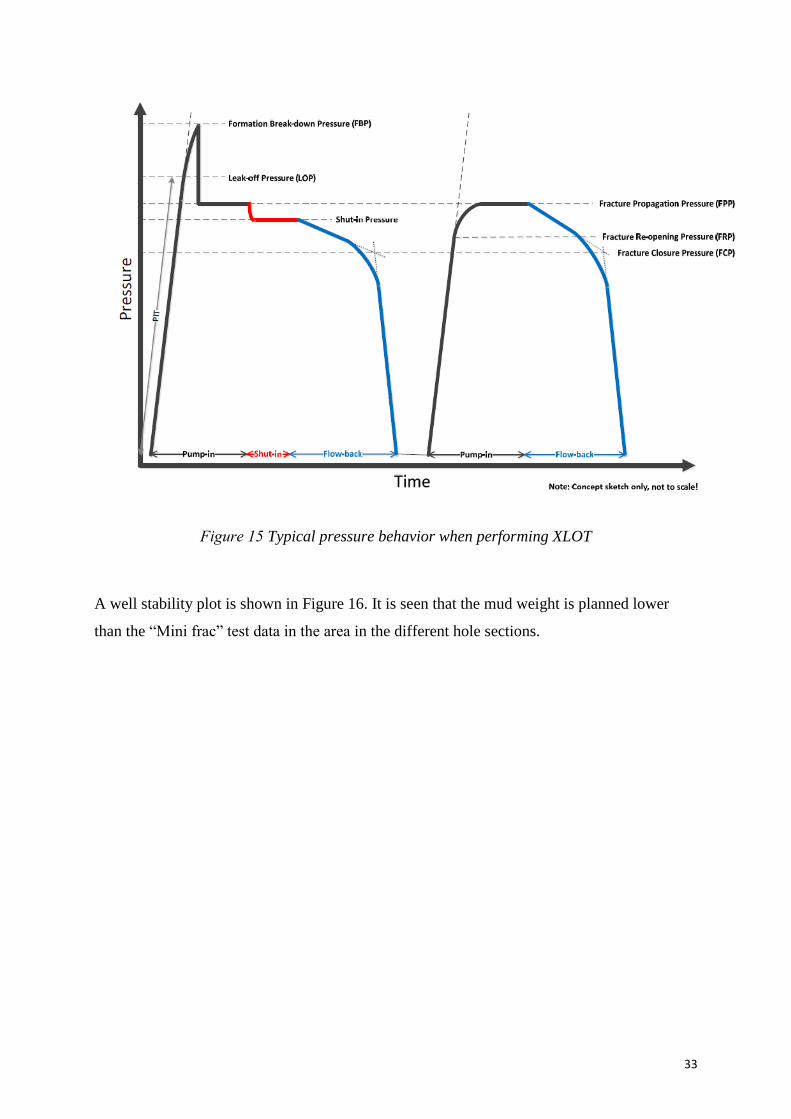
A well stability plot is shown in Figure 16. It is seen that the mud weight is planned lower
than the “Mini frac” test data in the area in the different hole sections.
34
Figure 16 Example of a wellbore stability plot from the oil industry
35
3.3 Platform drilling
Drilling a well from a seabed-supported platform is less complicated compared to using an
MODU, simply since there is no movement of the vessel, and the BOP is located on the
platform making maintenance and operations more convenient. The conductor in normally
installed using the hammer technique to drive the pipe into the top hole formations. Then
drilling continues more or less as in subsea drilling as discussed above. The main advantages
are access for monitoring of the annulus, easy wellhead access and less complicated and lower
cost well intervention.
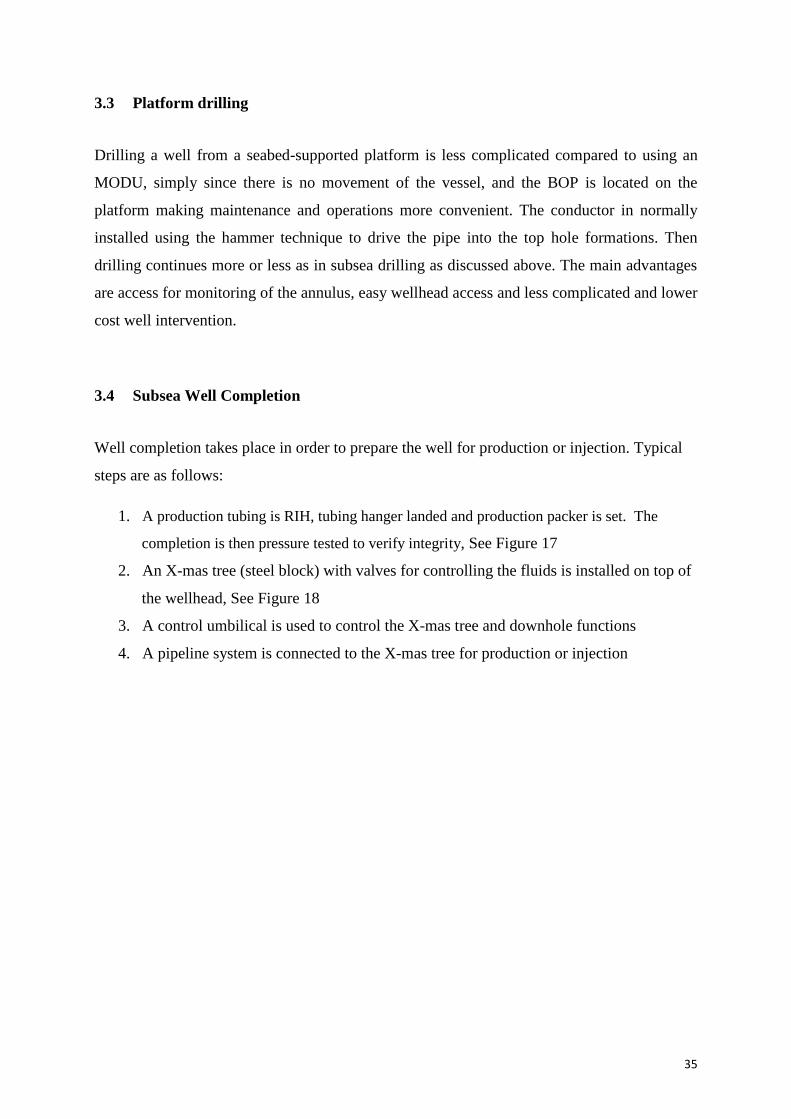
3.4 Subsea Well Completion
Well completion takes place in order to prepare the well for production or injection. Typical
steps are as follows:
1. A production tubing is RIH, tubing hanger landed and production packer is set. The
completion is then pressure tested to verify integrity, See Figure 17
2. An X-mas tree (steel block) with valves for controlling the fluids is installed on top of
the wellhead, See Figure 18
3. A control umbilical is used to control the X-mas tree and downhole functions
4. A pipeline system is connected to the X-mas tree for production or injection
36
Figure 17 Example of subsea well with tubing hanger and tubing string installed (for vertical
X-mas tree installation)
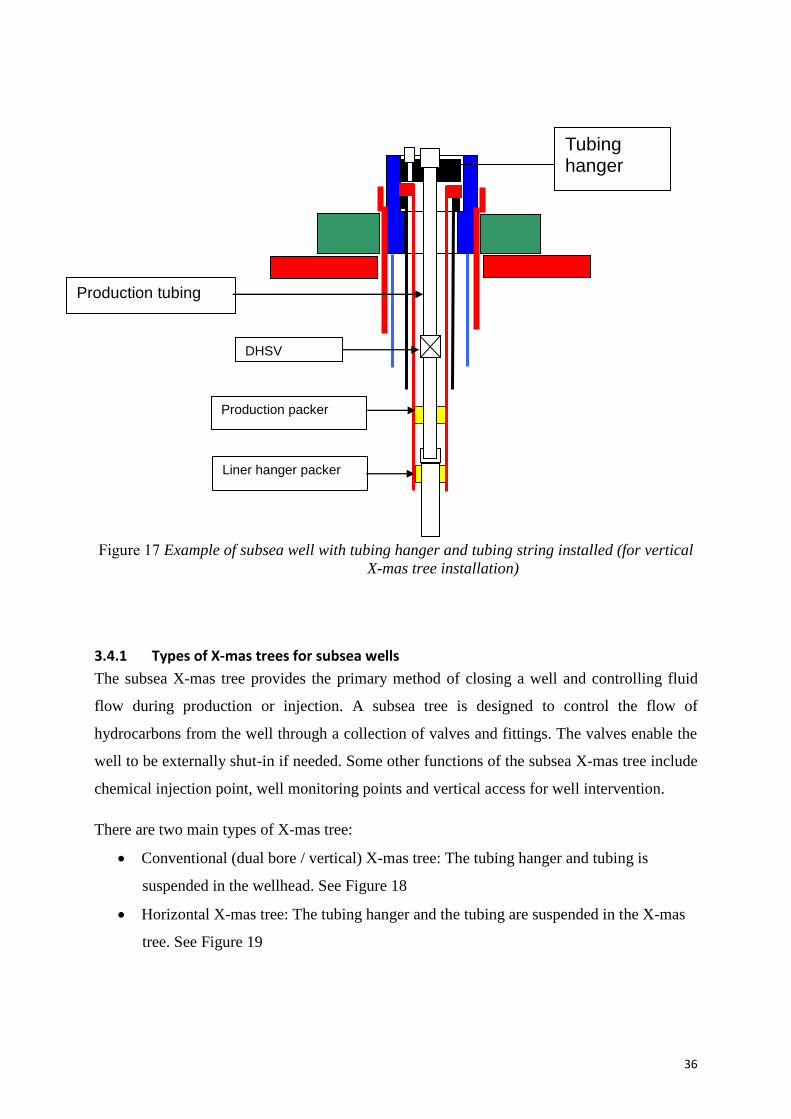
3.4.1 Types of X-mas trees for subsea wells
The subsea X-mas tree provides the primary method of closing a well and controlling fluid
flow during production or injection. A subsea tree is designed to control the flow of
hydrocarbons from the well through a collection of valves and fittings. The valves enable the
well to be externally shut-in if needed. Some other functions of the subsea X-mas tree include
chemical injection point, well monitoring points and vertical access for well intervention.
There are two main types of X-mas tree:
Conventional (dual bore / vertical) X-mas tree: The tubing hanger and tubing is
suspended in the wellhead. See Figure 18
Horizontal X-mas tree: The tubing hanger and the tubing are suspended in the X-mas
tree. See Figure 19
DHSV
Liner hanger packer
Tubing hanger
Production tubing
Production packer
37
Figure 18 Subsea well with vertical X-mas tree (dual bore through X-mas tree and TH)
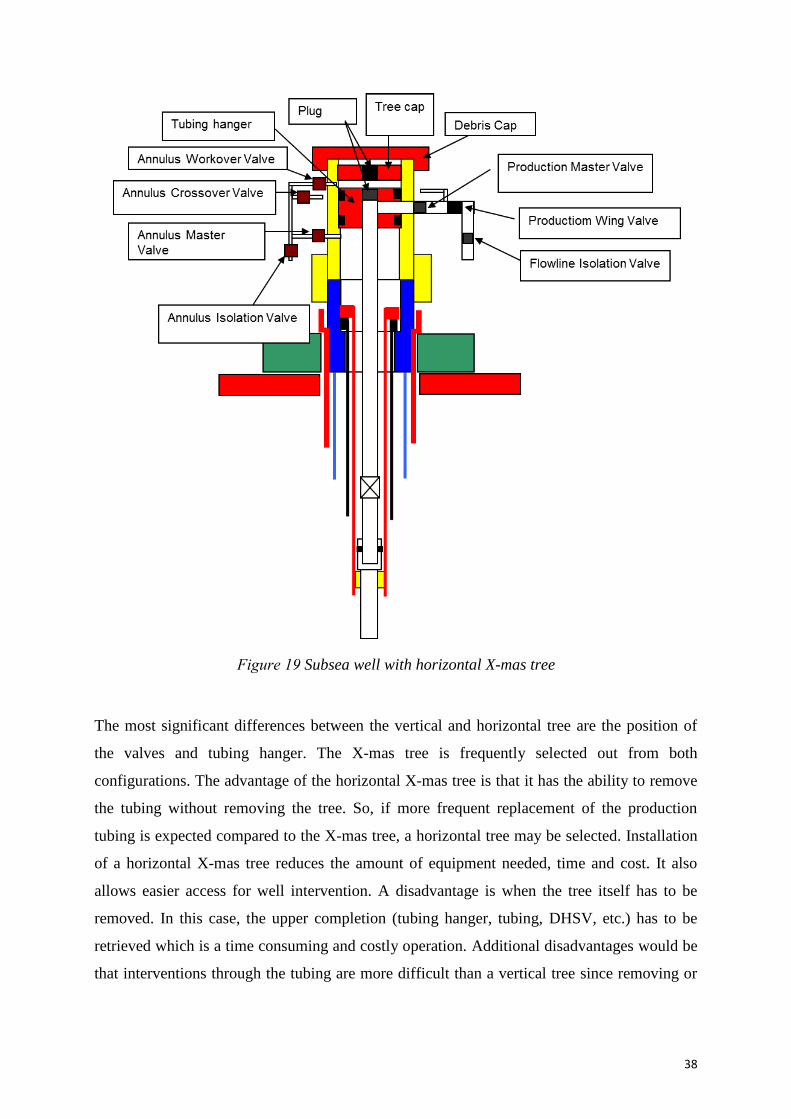
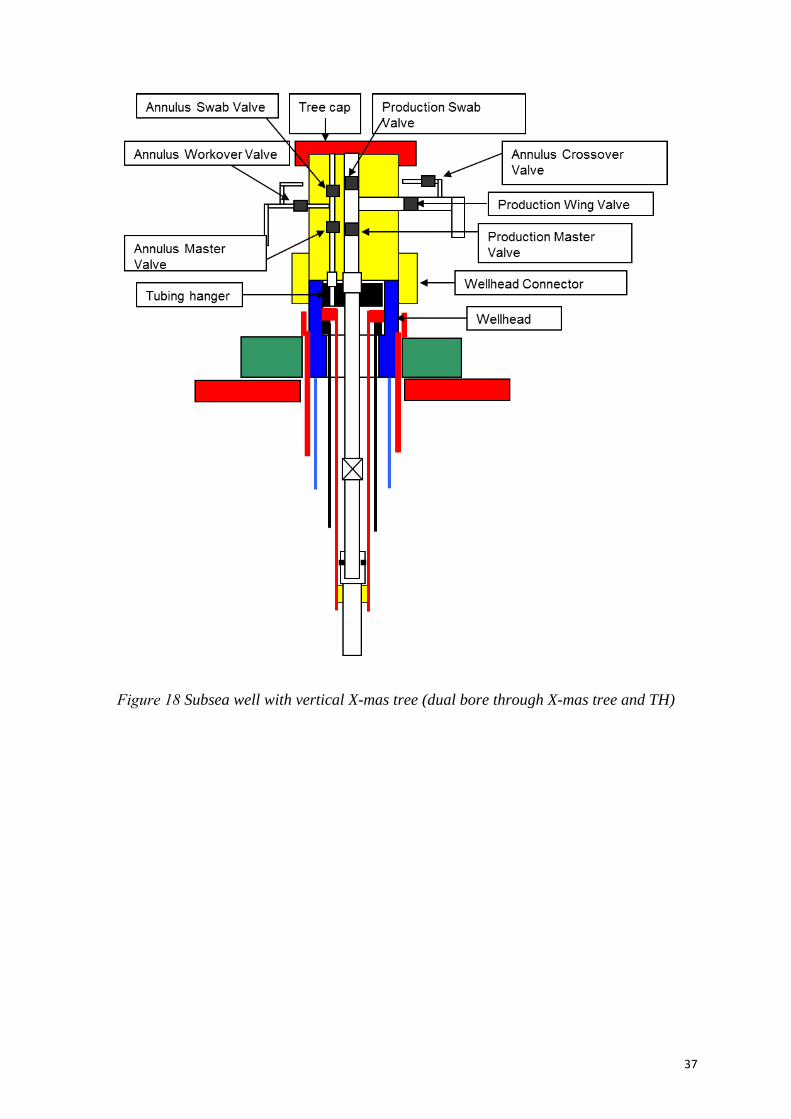
38
Figure 19 Subsea well with horizontal X-mas tree
The most significant differences between the vertical and horizontal tree are the position of
the valves and tubing hanger. The X-mas tree is frequently selected out from both
configurations. The advantage of the horizontal X-mas tree is that it has the ability to remove
the tubing without removing the tree. So, if more frequent replacement of the production
tubing is expected compared to the X-mas tree, a horizontal tree may be selected. Installation
of a horizontal X-mas tree reduces the amount of equipment needed, time and cost. It also
allows easier access for well intervention. A disadvantage is when the tree itself has to be
removed. In this case, the upper completion (tubing hanger, tubing, DHSV, etc.) has to be
retrieved which is a time consuming and costly operation. Additional disadvantages would be
that interventions through the tubing are more difficult than a vertical tree since removing or
39
installing plugs is more difficult than opening or closing the valves in the conventional X-mas
tree.
Below is a description of the main valves in a subsea X-mas trees used for the production
phase:
Master valve: It is used to completely shut in the well production tubing/annulus. The
valve is usually a 5 1/8” double acting seal valve. The production master valve is
situated between the wellhead and the production bore and the annulus master valve is
a valve on the bore into the annulus. The annulus master valve is used for shutting in
any production or injection in the annulus, i.e. gas lift. The valves are power operated
fail-safe closed valves.
Wing valve: The wing valve controls the production/injection or annulus flow. The
valve is usually a 5 1/8” double acting seal valve. The valve is usually located
downstream of the master valve in the production bore and the annulus bore.
Cross over valve (XOV): This valve provides communication between the annulus and
the production bore which normally is isolated.
Choke valve: The choke valve controls the flow and is located downstream of the
production wing valve. It is typically operated by a hydraulic stepping actuator. The
valve is retrievable and prone to erosion risk.
Typically, smaller pipes are connected to the production tubing branch (between PMV and
PWV). Two of these are used for injection of chemicals such as scale inhibitor (SIV) and
methanol (MIV).
The X-mas tree valves may need to be closed due to different situations such as functional
and pressure tests, shut-down on the platform and deterioration or leakage of subsea
equipment. This is why the hydraulic operated subsea X-mas tree valves in the production
phase are fail-safe close. This means that the valves will automatically close if the signal or
hydraulic control pressure is lost. Usually the valves are closed by a preprogrammed
shutdown sequence. If it is impossible to close the X-mas tree valves by using the control
system, the hydraulic fluid in the valve actuators may be drained from various places. In this
case closing operation will be more time consuming.
40
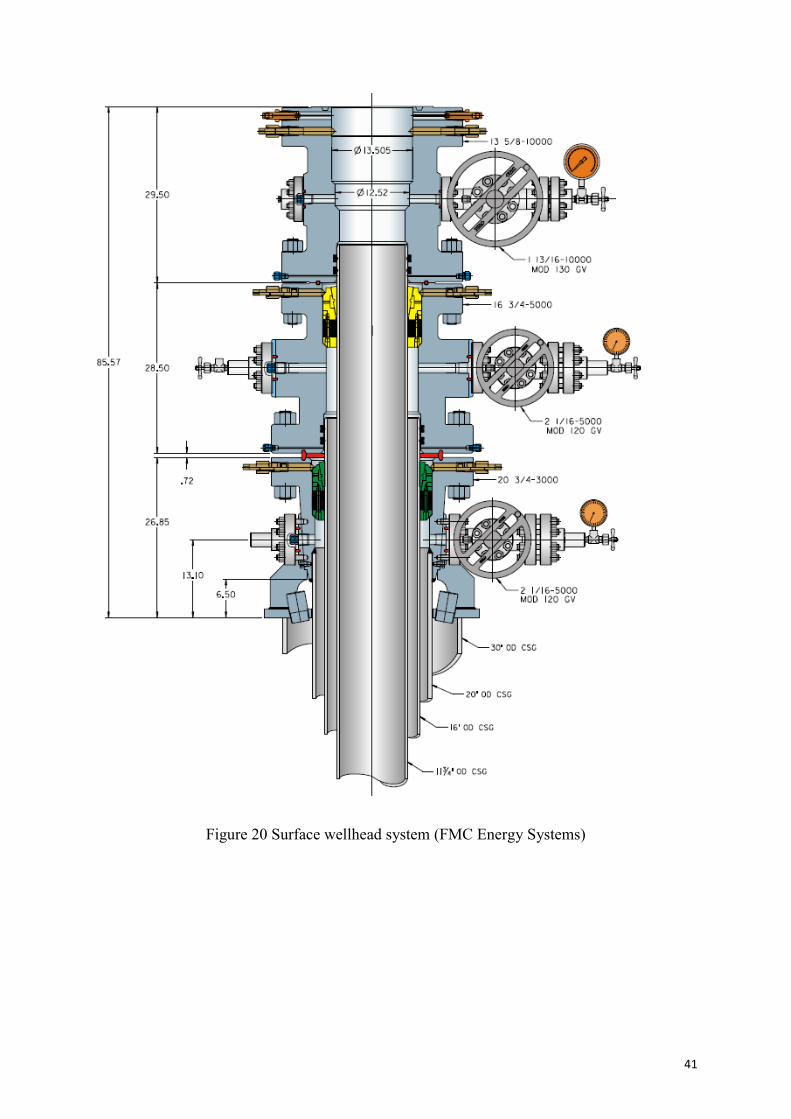
3.5 Surface well completion
Figure 20 illustrates a surface wellhead system. The different casing strings are supported in
the wellhead in separate casing hanger spools with annulus access for pressure monitoring.
The X-mas tree is stacked on top of the wellhead as illustrated in Figure 21
41
Figure 20 Surface wellhead system (FMC Energy Systems)
42
The following valves are always to be fail-safe closed:
Hydraulic master valve (HMV)
Production wing valve (PWV)
Exit blocks for chemical injection
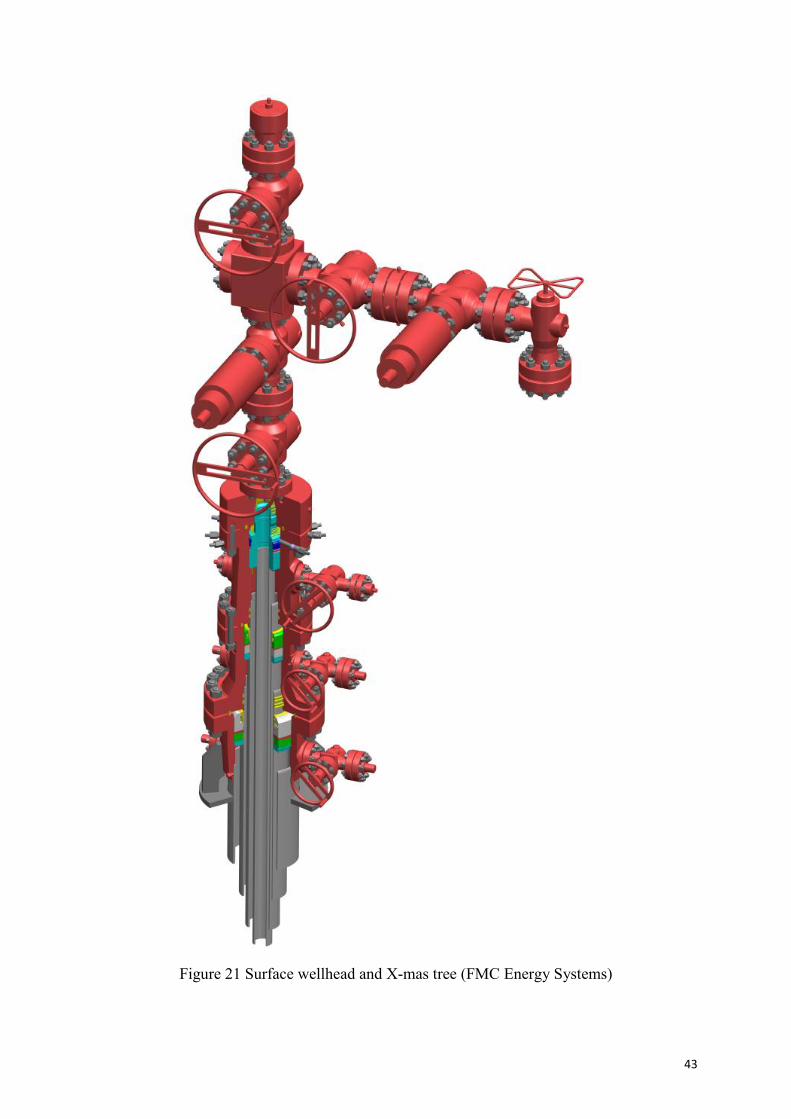
The surface X-mas tree usually consists of one solid block with the valves integrated. Figure
21 shows an example where the X-mas tree consists of valves flanged together (not one solid
block).
43
Figure 21 Surface wellhead and X-mas tree (FMC Energy Systems)

44
For surface completed wells all annuli are usually available through wellhead valves for
possible control and monitoring of pressure. For wells with a subsea wellhead with a surface
X-mas tree they may have limited access to the annuli outside annulus A. Such limitation is
typical for TLP platform wells. The difference is shown in Figure 22
X-mas
tree
PWV
HMV
MMV
KV
SV
Production
casing
PT
PT
PT
PI
PI
A B C
Cap Rock
Reservoir
Liner
TOC 9 5/8” @ 4585m MD
Production Packer @
4982m MD/2607m TVD
14" @ 2068m MD/
1914m TVDFIT @ 14" shoe 1.67 sg
9 5/8" shoe @ 5119m MD/
2675m TVD
9 5/8” Liner hanger packer/Top
PBR @ 2006m MD
TOC 14” @ 1875m MD
Gauge carrier @ 5031m MD/
2631m TVD 7" TOC @ 5057m MD
7"@ 5439m MD/
2854m TVD
Subsea WH
sH min @ 5119m MD/
2675m TVD 1.79 sg
sH min @ 4982m MD/
2607m TVD 1.79 sg
sH min @ 2068m MD/
1914m TVD 1.68 sg
A B C
FIT @ 9 5/8" shoe 1.79 sg
NOTE 2
sH min @ 5121 m MD/
2676m TVD 1.79 sg
PWV
PUMV
PLMV
KV
PSV
PT
7" Liner hanger packer @ 5057m MD
Lower completion with
ICVs, gauges and packers.
NOTE 3
PT
NOTE 1
PT
Top of reservoir/
cap rock
Figure 22 Typical difference between annulus monitoring possibilities for platform well
versus platform TLP well
45
4. Well Barriers – definitions, classification, and requirements
4.1 Key concepts and definitions
Well barriers are used to prevent leakages and reduce the risk associated with drilling,
production and intervention activities.
Well barrier: Envelope of one or several dependent barrier elements preventing fluids or
gases from flowing unintentionally from the formation into another formation or to surface
[NORSOK D-010].
The main objectives of a well barrier are to:
Prevent any major hydrocarbon leakage from the well to the external environment
during normal production or well operations.
Shut in the well on direct command during an emergency shutdown situation and
thereby prevent hydrocarbons from flowing from the well.
A well barrier has one or more well barrier elements.
Well barrier element: Object that alone cannot prevent flow from one side to the other side
of itself [NORSOK D-010].
Some well barriers have several barrier elements that, in combination, ensure that the well
barrier is capable of performing its intended function(s).
Events and situations that require a functioning well barrier are called demands. A demand
can be instantaneous or continuous. An example of an instantaneous demand is a command
from the emergency shutdown system at the platform that requires response from the well
barriers. A continuous demand may be a constant high pressure (that the well barrier must
withstand).
46
In general, there are four main ways in which hydrocarbons can leak from the system to the
environment:
Through the downhole completion tubing string
Through the downhole completion annulus
Through the cement between the annuli
Outside and around the well casing system
4.2 Well Barrier Requirements
The performance of a well barrier may be characterized by its:
Functionality; what the barrier is expected to do and within what time
Reliability (or availability); the ability, in terms of probability, to perform the required
functions under the stated operating conditions and within a specified time.
Survivability; the ability of the barrier to withstand the stress under specified demand
situations.
Regulatory bodies give overall requirements in their regulations, and make references to
guidelines and recognized national and international standards for more detailed requirements.
The Norwegian Petroleum Safety Authority (PSA) uses, for example, the following
regulatory hierarchy:
Regulations
Guidelines (to the regulations)
National and international standards that are referenced in the guidelines, such as
NORSOK standards, ISO standards, API standards, and IEC standards.
We may distinguish between requirements that apply to barriers in general (e.g., as stated in
PSA’s Management Regulations, §4 and §5), and requirements that apply to well barriers in
particular (e.g., as stated in PSA’s Facilities Regulations, §48). The associated guidelines
provide further details and give references to specific parts of national or international
standards. The guideline to §48 of the Facilities Regulations, for example, refers to specific
47
chapters of the NORSOK D-010 standard and also to specific sections of the Management
Regulations.
From the guideline to §48 of the Facilities Regulations, and the referenced standards, the
following requirements can be deduced:
At least two independent and tested barriers shall, as a rule, be available in order to
prevent an unintentional flow from the well during drilling and well activities.
The barriers shall be designed so as to enable rapid re-establishment of a lost barrier.
In the event of a barrier failure, immediate measures shall be taken in order to
maintain an adequate safety level until at least two independent barriers have been
restored. No activities for any other purposes than re-establishing two barriers shall
be carried out in the well.
The barriers shall be defined and criteria for (what is defined as a) failure shall be
determined.
The position/status of the barriers shall be known at all times.
It shall be possible to test well barriers. Testing methods and intervals shall be
determined. To the extent possible, the barriers shall be tested in the direction of
flow.
Separate regulations are issued by the PSA for handling of shallow gas in drilling operation.
When drilling the tophole section, the gas diversion possibility is regarded as the second
barrier. This is, however, not a barrier according to the barrier definition above.
4.3 Well Barrier Functions In the analysis of well barriers, it is important to understand the barrier functions and the
possible ways the barrier can fail.
NORSOK D-010 distinguishes between primary and secondary well barriers. A primary well
barrier is the barrier that is closest to the pressurized hydrocarbons. If the primary well barrier
is functioning as intended, it will be able to contain the pressurized hydrocarbons. If the
primary well barrier fails (e.g., by a leakage or a valve that fails to close), the secondary
barrier will prevent outflow from the well. If the secondary well barrier fails, there may, or
may not, be a tertiary barrier available that can stop the flow of hydrocarbons.
Examples: For operations in a killed well, the hydrostatic pressure is regarded as the primary
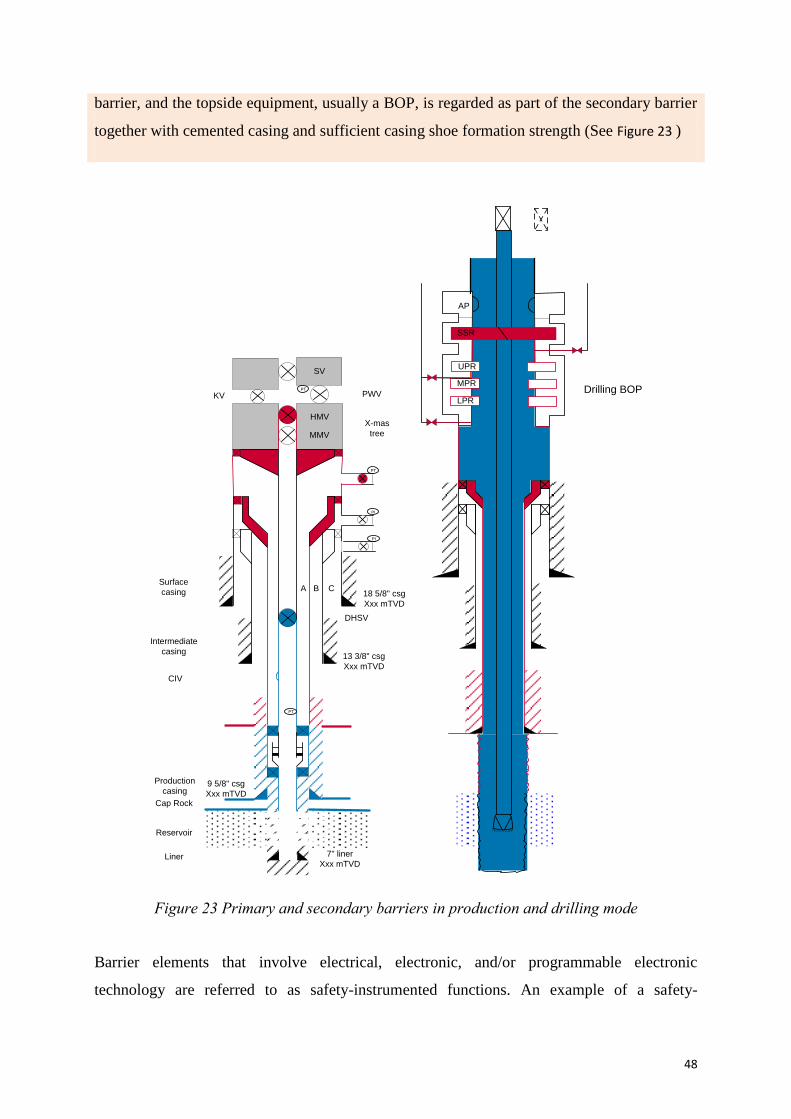
48
barrier, and the topside equipment, usually a BOP, is regarded as part of the secondary barrier
together with cemented casing and sufficient casing shoe formation strength (See Figure 23 )
WELL BARRIER SCHEMATICPlanned/As built
8.8.1a) Typical platform production/injection well capable of flowing
Well data Installation/Field name: xxxxx
Well no: xx/xx-xx Completed date: DD.MM.YYYY
Well type: Oil producer, water injector, etc.
MWDP: xxx bar
Revision no: x Date: DD.MM.YYYY
Well status: Eg. operational/temp. plugged etc.
Prepared: xxxxx (Name and signature)
Verified: xxxxx (Name and signature)
Well barrier elements Ref. WBEAC tables
Verification of barrier elements
PRIMARY - reservoir Cap rock 51 smin: x.xx sg EMW.
Method: XLOT/minifrac/field model
Liner cement 22 Length: xx mMD > res. Method: volume control/logs
Liner 2 PT: xxx bar with x.x sg
Liner top packer 43 PT: xxx bar with x.x sg
Formation at casing shoe n/a smin: x.xx sg EMW. Method: XLOT/minifrac/field model
Production casing cement * (shoe to prod.packer)
22 Length: xx mMD, shoe to prod.packer Method: volume control/logs and FIT/LOT to x.xx sg EMW at casing shoe
Production casing (below prod.packer)
2 PT: xxx bar with x.x sg
Production packer 7 IT: xxx bar (or PT: xxx bar with x.x sg)
Production tubing 25 PT: xxx bar with x.x sg
CIV 29 IT low: xxx bar, IT high: xxx bar
DHSV/Controllines 8 IT low: xxx bar , IT high: xxx bar
SECONDARY - reservoir Formation at prod.packer 51 smin: x.xx sg EMW.
Method: XLOT/minifrac/field model
Production casing cement * (above prod.packer)
22 Length: xx mMD > prod.packer Method: volume control/logs
Production casing (above prod.packer)
2 PT: xxx bar with x.x sg
Production casing hanger with seal assembly
5 PT: xxx bar with x.x sg
WH/Annulus valve 12 PT: xxx bar with x.x sg
Tubing hanger with seals 10 PT: xxx bar with x.x sg
WH/X-mas tree Connector 5 PT: xxx bar with x.x sg
Tubing hanger neck seal 10 PT: xxx bar with x.x sg
X-mas tree valves 33 PT: xxx bar with x.x sg
Noes:
Disp. no. well integrity issues
Comment
None
X-mas
tree
PWV
HMV
MMV
KV
SV
Surface
casing
Intermediate
casing
DHSV
Production
casing
PT
PT
PT
PI
PI
A B C
Cap Rock
Reservoir
CIV
Liner
18 5/8" csg
Xxx mTVD
13 3/8" csg
Xxx mTVD
9 5/8" csg
Xxx mTVD
7" liner
Xxx mTVD
WELL BARRIER SCHEMATIC5.8.1 Drilling, coring and tripping with shearable drill string
UPR
MPR
LPR
AP
SSR
Drilling BOP
Well data Installation/Field: xxxxx
Well no: xx/xx-xx Drilling start date:
DD.MM.YYYY
Well type: e.g. oil producer
MSDP: xxx bar
Revision no: x Date: DD.MM.YYYY
Well status: Drilling.
Prepared: xxxxx (Name and signature)
Verified: xxxxx (Name and signature)
Well barrier elements
Ref. WBEAC tables
Verification of barrier elements
PRIMARY - reservoir Well fluid 52 Flow checks/ stable fluid level
SECONDARY - reservoir Formation at casing shoe 51 FIT to x.xx sg EMW.
Production casing cement 22 Length: xx mMD > casing shoe Method: volume control/logs and FIT/LOT to x.xx sg EMW at casing shoe
Production casing 2 PT: xxx bar with x.x sg
Production casing hanger with seal assembly
5 PT: xxx bar with x.x sg
WH 5 PT: xxx bar with x.x sg
High pressure riser 26 PT: xxx bar with x.x sg
BOP 4 PT: xxx bar with x.x sg
Notes:
Disp. no. well integrity issues
Comment
None
Figure 23 Primary and secondary barriers in production and drilling mode
Barrier elements that involve electrical, electronic, and/or programmable electronic
technology are referred to as safety-instrumented functions. An example of a safety-
49
instrumented function is the DHSV, which is only activated upon signal from sensors or
manual pushbuttons. Safety-instrumented functions are carried out by a safety-instrumented
system with three main subsystems:
Input elements; sensors (for automatic activation) or push-buttons (for manual
activation)
Logic solver(s); an electronic or non-electronic device that process the signal(s) from
the input elements and send signals to the relevant final elements
Final elements; physical items that interact with the well, for example valves, such that
loss of containment is stopped or avoided.
Several safety-instrumented functions may be built into the same safety-instrumented system.
The same logic solver may, for example, be used to activate several isolation valves.
However, there are some important design considerations: Functions that shall respond to the
same event (e.g., well kick or choke collapse) should not share components. This means that
if the primary and secondary barriers have safety-instrumented functions, they need to be
placed in two different (and independent) safety-instrumented systems to avoid that a failure
of the logic solver causes simultaneous failure of the primary and the secondary barrier. On an
oil and gas installation, there are several safety-instrumented systems with names related to
their essential function: emergency shutdown systems, process shutdown systems, fire and
gas detection systems, and so on.
4.4 Well barrier schematics and diagrams
Well barriers and their role in preventing or acting upon leakages from wells may be
illustrated in many different ways. We distinguish between:
Well barrier schematics
Barrier diagrams
Well barrier schematics and well barrier diagrams are important tools for reliability and risk
assessments of the well in all phases of its life cycle – and for well integrity assessments.
Well life cycle: The time interval from a well’s conception until it is permanently abandoned.
50
4.4.1 Well barrier schematics
A well barrier schematic (WBS) is a static illustration of the well and its main barrier
elements, where all the primary and secondary well barrier elements are marked with different
colors. A well barrier schematic (WBS) is shown for a standard production well in Figure 23
This well has six primary well barrier elements:
Formation /cap rock above reservoir
Casing cement
Casing
Production packer
Completion string (below the DHSV)
Surface controlled subsurface safety valve (DHSV)
- and six secondary well barrier elements:
Formation above production packer
Casing cement
Casing with seal assembly
Wellhead
Tubing hanger with seals
Annulus access line and valve
Production tree (X-mas tree) with X-mas tree connection
Examples of well barrier schematics for a wide range of well situations are established and
evaluated in NORSOK D-010.
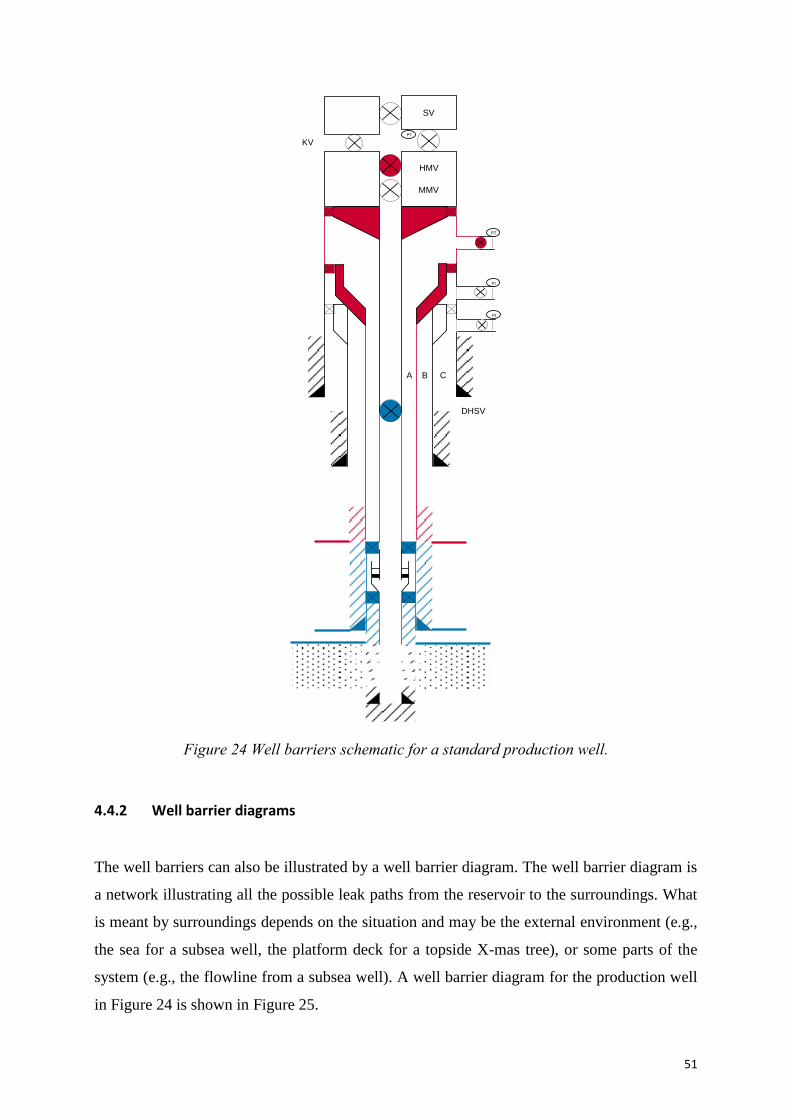
51
HMV
MMV
KV
SV
DHSV
PT
PT
PI
PI
A B C
Figure 24 Well barriers schematic for a standard production well.
4.4.2 Well barrier diagrams
The well barriers can also be illustrated by a well barrier diagram. The well barrier diagram is
a network illustrating all the possible leak paths from the reservoir to the surroundings. What
is meant by surroundings depends on the situation and may be the external environment (e.g.,
the sea for a subsea well, the platform deck for a topside X-mas tree), or some parts of the
system (e.g., the flowline from a subsea well). A well barrier diagram for the production well
in Figure 24 is shown in Figure 25.
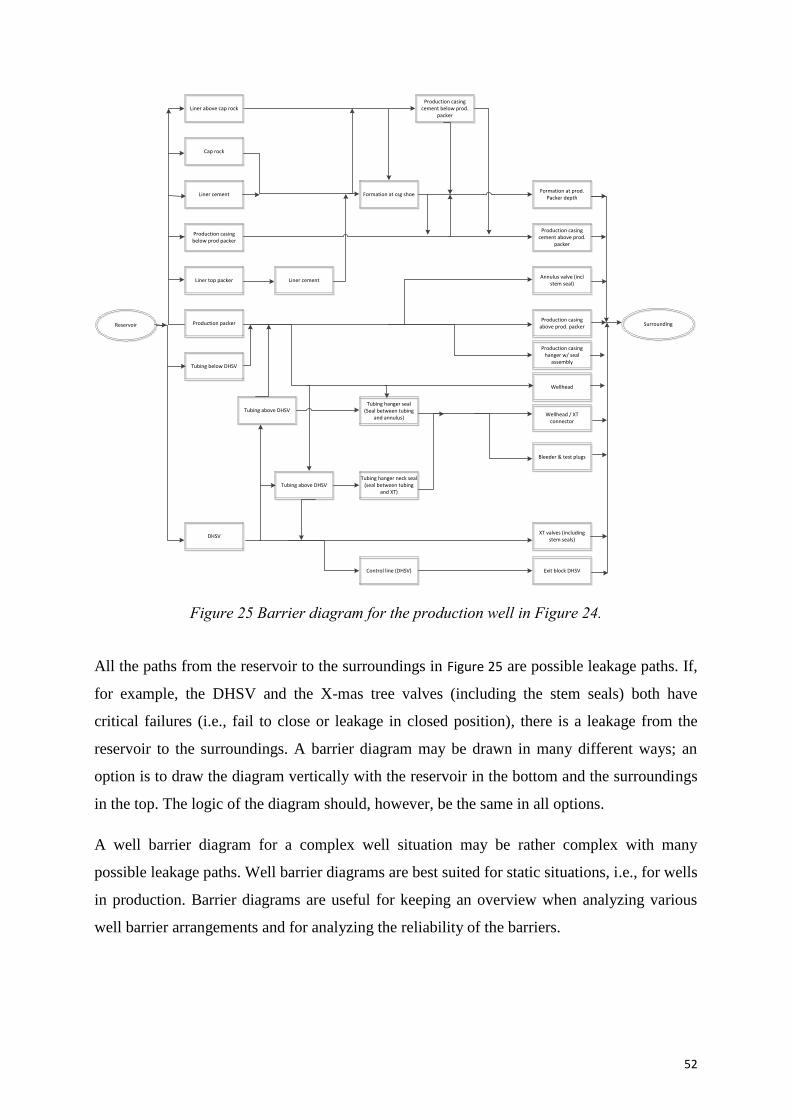
52
Cap rock
Liner cement Formation at csg shoeFormation at prod.
Packer depth
Production casing below prod packer
Production casing cement above prod.
packer
Liner top packer Liner cement
Production packerProduction casing
above prod. packer
Wellhead
Tubing hanger seal(Seal between tubing
and annulus)Wellhead / XT
connector
Bleeder & test plugs
Tubing above DHSVTubing hanger neck seal
(seal between tubing and XT)
Annulus valve (incl stem seal)
DHSV
Tubing above DHSV
Production casing hanger w/ seal
assembly
XT valves (including stem seals)
Control line (DHSV) Exit block DHSV
SurroundingReservoir
Production casing cement below prod.
packer
Tubing below DHSV
Liner above cap rock
Figure 25 Barrier diagram for the production well in Figure 24.
All the paths from the reservoir to the surroundings in Figure 25 are possible leakage paths. If,
for example, the DHSV and the X-mas tree valves (including the stem seals) both have
critical failures (i.e., fail to close or leakage in closed position), there is a leakage from the
reservoir to the surroundings. A barrier diagram may be drawn in many different ways; an
option is to draw the diagram vertically with the reservoir in the bottom and the surroundings
in the top. The logic of the diagram should, however, be the same in all options.
A well barrier diagram for a complex well situation may be rather complex with many
possible leakage paths. Well barrier diagrams are best suited for static situations, i.e., for wells
in production. Barrier diagrams are useful for keeping an overview when analyzing various
well barrier arrangements and for analyzing the reliability of the barriers.
53
4.5 Reliability analysis and methods
The term reliability conveys failure-free operation and confidence in the equipment. Formally,
reliability is defined as the ability of a system to perform its intended functions, under given
environmental and operational conditions and for a stated period of time (IEC 600050-191).
The ability can be studied qualitatively, for example by identifying the combination of
component failures that may lead to system failure, or quantitatively, by calculating the
probability or frequency of system failures.
4.5.1 Reliability analysis of well barriers
In the context of well integrity, we will introduce reliability analysis methods that can be used
to identify and assess the impact of failures of well barrier elements. Such analyses are useful
for:
Comparing different well completion alternatives with respect to blowout probabilities
Evaluating the blowout risk for specific well arrangements
Identifying potential barrier problems in specific well completions
Assessing the effect of various risk reduction methods
Identifying potential barrier problems during well interventions
After many incidents and accidents in relation to well integrity, more focus has been directed
towards assessing the reliability of well barriers. The purpose of this section is to describe
some of the methods that can be used to analyze well integrity – qualitatively as well as
quantitatively. To be able to perform quantitative analysis it is necessary to have a
background in system reliability theory. The quantitative part is therefore limited to giving a
small practical example with basis in available well performance data. To give a thorough
basis for system reliability theory is outside the scope of this compendium. Readers who want
to get a deeper understanding of this subject may consult Rausand and Høyland (2004) or
some other textbook on reliability theory.
4.5.2 Analysis steps
A well barrier analysis should be structured and may include the following steps:
54
1. Define and become familiar with the system.
This step includes the definition of the operational situation, review of well
schematics, construction of barrier diagram, and listing of barriers and their barrier
functions.
2. Identify failure modes and failure causes
The main method for failure identification is the failure modes, effects, and
criticality analysis (FMECA). The objective of the FMECA is to identify all the
failure modes, their causes, and effects for each of the barrier elements of a well
barrier system.
3. Construct a reliability model of the well barrier system
There are several alternative models available, and the choice of models should be
based on what type of system states we want to study and the access to relevant
data to support the models. We recommend, however, fault tree analysis, since this
method is intuitive and easy to understand (at least for the qualitative parts) for
those who do not have a background in system reliability theory. A fault tree is a
graphical model that illustrates all the combinations of failure events that may lead
to a system failure (i.e., leakage to the surroundings). The fault tree is easy to
establish from the well barrier diagram.
4. Perform a qualitative analysis of the fault tree
All the information about the causes of system can be summarized in the minimal
cut sets of the fault tree. A minimal cut set is (a smallest) combination of failure
events that may give a system failure. A system failure occurs when all the failure
event of a minimal cut set occurs, and minimal cut sets with few failure events are
therefore more important than minimal cut sets with many failure events.
Algorithms for identification of minimal cut sets are available. With basis in the
minimal cut sets, we can discuss issues such as critical components or elements,
vulnerability to common cause failures. This type of information may be useful
when planning well operations, well barrier maintenance, and training of
personnel.
55
5. Perform quantitative analysis of the fault tree
By combining reliability theory and reliability data with a fault tree, we can
determine a number of reliability parameters of interest, for example the
probability of primary barrier failure, failure rates for primary and secondary
barriers, time to first failure of primary and/or secondary barrier, and so on.
System reliability analysis is based on statistical models and methods. This means
that the results are subject to uncertainty, due to modeling assumptions, adequacy
of data, and the spread in possible outcomes that follows the distribution of, e.g.,
time to failure that is recorded for similar systems and components.
6. Report results
It is important to document all results, including assumptions and limitations that
have been made. Recommendations that require further follow-up, whether it
points back to necessity to redesign or to update planning, operating, or
maintenance procedures need to be sufficiently highlighted. Recommendations
should always be assigned responsible persons or departments.
4.6 Identification of barrier functions
In order to understand how a system can fail, it is necessary to first identify the system
functions. A well barrier system may have several functions, and it is often useful to
distinguish between essential functions, information functions, and protective functions.
The essential function of a well barrier is more or less obvious. This is the function that
corresponds to the main purpose of the barrier, that is, the reason why the barrier is installed.
For any well barrier we may state that the essential function is to separate the well fluids from
the environment/surroundings. Loss of this function gives a possible leakage path to the
environment.
Information functions provide information about the state and/or status of a well barrier. The
information may, for example, be the position of a gate valve in a X-mas tree, provided by the
position indicator of the valve. Various sensors may give information about temperature,
pressure, flow rate, and so on. Loss of information functions may give the operating personnel
56
insufficient information about degradation of the main function and thereby prevent necessary
maintenance from being performed, or lack of required information to manage an abnormal
situation.
Instrumented well barriers often involve electrical, electronic, or programmable electronic
technology with protective functions to avoid that any electrical arc result in ignition of
hydrocarbon gases. Loss of the protective functions may generate new hazards and hazardous
events at the rig, even if the well integrity as such may be unaffected. It should be noted that
some well barriers, such as for well intervention, are not designed “fail-safe”1. Loss of
electrical power, for example, as the result of lost overpressure in a work-over container, may
result in a disconnection of power to all electrical equipment in the container, including the
programmable electronic controller used to operate valves and rams in the lower riser
package.
The main function of instrumented well barriers is partly implemented by hardware (e.g.,
valves, solenoid valves) and software. While hardware functions normally are rather
straightforward to test for conformity to requirements, the software functions are more
complex and it can be difficult to reveal any unwanted side effects of unfortunate software
instructions. This is the case, even if the hardware containing the software, such as a
programmable electronic controller (PLC), is supplied with a safety certificate. Instrumented
well barriers should be subject to proper qualification before installation and a management of
change system while in use. This also applies to systems that are temporary used at the rig for
one specific activity, e.g., well intervention.
4.7 Failure and failure analysis
4.7.1 Key terms and definitions
All well barrier elements are installed to perform one or more functions. A function is usually
accompanied by performance criteria. These criteria may, for example, be related to closing
1 Design principle that ensures that the item, upon predefined fault situations like loss of electrical power,
responds in a way that will cause no harm or minimum of harm to personnel, environment, and/or facility. A
shutdown valve is often designed to close upon loss of electrical power, while blow-down valves may be
designed to open in the same situation.
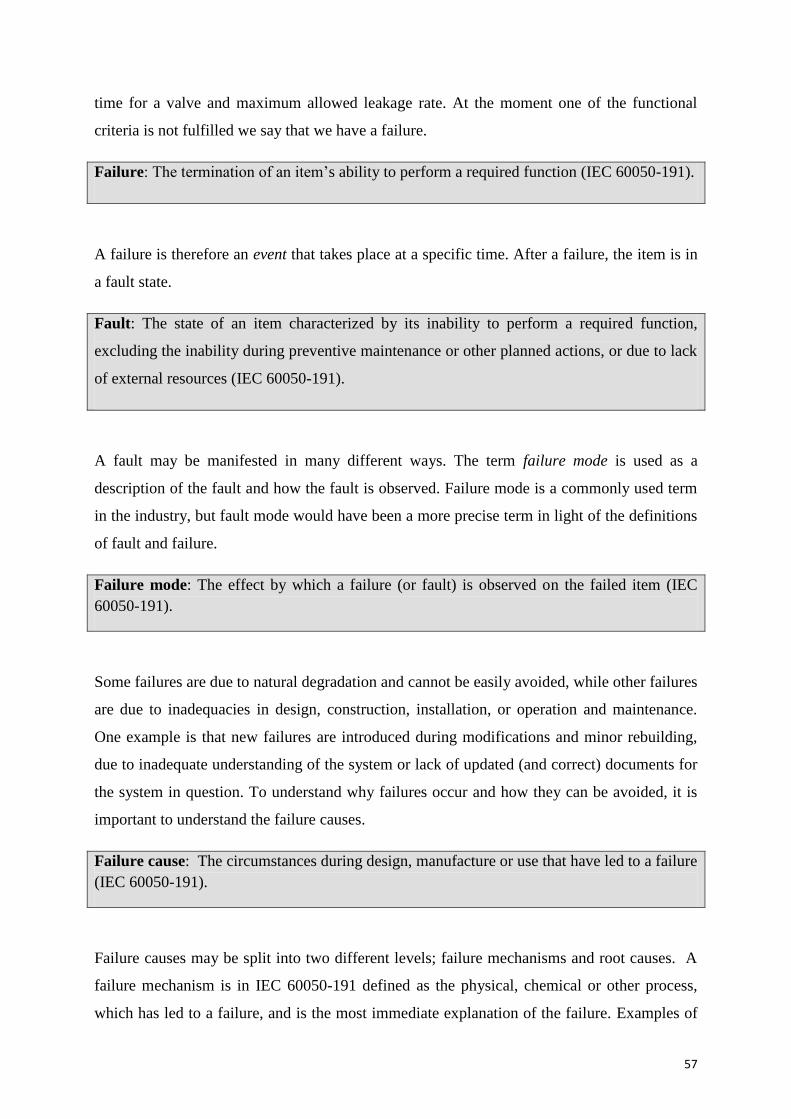
57
time for a valve and maximum allowed leakage rate. At the moment one of the functional
criteria is not fulfilled we say that we have a failure.
Failure: The termination of an item’s ability to perform a required function (IEC 60050-191).
A failure is therefore an event that takes place at a specific time. After a failure, the item is in
a fault state.
Fault: The state of an item characterized by its inability to perform a required function,
excluding the inability during preventive maintenance or other planned actions, or due to lack
of external resources (IEC 60050-191).
A fault may be manifested in many different ways. The term failure mode is used as a
description of the fault and how the fault is observed. Failure mode is a commonly used term
in the industry, but fault mode would have been a more precise term in light of the definitions
of fault and failure.
Failure mode: The effect by which a failure (or fault) is observed on the failed item (IEC
60050-191).
Some failures are due to natural degradation and cannot be easily avoided, while other failures
are due to inadequacies in design, construction, installation, or operation and maintenance.
One example is that new failures are introduced during modifications and minor rebuilding,
due to inadequate understanding of the system or lack of updated (and correct) documents for
the system in question. To understand why failures occur and how they can be avoided, it is
important to understand the failure causes.
Failure cause: The circumstances during design, manufacture or use that have led to a failure
(IEC 60050-191).
Failure causes may be split into two different levels; failure mechanisms and root causes. A
failure mechanism is in IEC 60050-191 defined as the physical, chemical or other process,
which has led to a failure, and is the most immediate explanation of the failure. Examples of
58
failure mechanisms are corrosion, erosion and fatigue. The failure mechanism is the cause to
look for in order to make an immediate repair/restoration of the failed item.
Correcting a failure based on the failure mechanism alone seldom prevents similar failures
from reoccurrence. For long term and permanent defense measures against failures, it is
necessary to look for the underlying and fundamental causes, often called the root causes.
Many methods are available for this purpose under names, such as root cause analysis.
4.7.2 Classification of failure modes
Failure modes may be classified in many different ways, depending on their criticality and
extensiveness. Rausand and Høyland (2004) distinguish between:
Intermittent failures; failures that result in lack of some function only for a very short
period of time. An intermittent failure will normally “disappear”, and the item will
restore itself to a full operating state. This category of failures is common with
programmed functions, and a relevant failure mode for drilling and well control and
shutdown systems.
Extended failures; failures that result in the lack of some or all functions and which
will continue until the item is repaired or replaced. Here, we may introduce two sub-
categories of extended failures:
o Complete failures
o Partial failures
Failure modes may also be classified into sudden failures and gradual failures. Gradual
failure is perhaps a confusing term (either it should be a failure or not a failure), but the
notation is used with system states that are starting to drift out of the normal and expected
values. Sensor signals that are drifting off or corrosion that is developing over time are
examples of gradual failure (modes).
Extended failures that are complete may have two effects, on the item level (locally) and on
the system (rig or platform) level. It can be distinguished between (OREDA, 2009):
Critical failures, which are the immediate and complete loss of an item’s capability of
providing its output. An example may be a valve that does not start to close when
requested.
59
Degraded failures, which are not critical, but prevents equipment from providing its
output within specifications. An example could be a shutdown valve that uses slightly
longer closure time than what is specified.
Incipient failure: A failure which is not critical, but which, if not attended to, could
result in a critical or degraded failure in the near future.
Standards for design and operation of safety-instrumented systems, such as IEC 61508 and
IEC 61511, use the classification of safe and dangerous failures.
Safe failure: Failure of an element and/or subsystem and/or system that plays a part in
implementing the safety function that:
Results in the spurious operation of the safety function to put the system under
protection (e.g., the well) into a safe state or maintain a safe state; or
Increases the probability of the spurious operation of the safety function to put the
system under protection (e.g., the well) into a safe state or maintain a safe state
Dangerous failure: Failure of an element and/or subsystem and/or system that plays a part in
implementing the safety function that:
Prevents a safety function from operating when required (demand mode) or causes a
safety function to fail (continuous mode) such that the system under protection (e.g.,
the well) is put into a hazardous or potentially hazardous state; or
Reduces the probability that the safety function operates correctly when required
Safe and dangerous failures may be split further into detected and undetected failures. A
detected failure is a failure that is evident (during non-demand situations) or is detected by
online diagnostics. It is assumed that a detected failure is revealed shortly after it has
occurred. An undetected failure is a failure that is hidden under non-demand situations and is
only revealed by a proof test or while responding to a demand. A failure, which is both
dangerous and undetected, is referred to as a dangerous undetected (DU) failure. A failure
that is dangerous and detected is called (DD). The similar notations apply for safe failures
(SU- and SD-failures).
60
Example.
The failure modes of an DHSV may be classified as:
Fail to close on demand (FTC): DU
Leakage in closed position: DU
Fail to open (FTO): SU
Spurious (premature) closure: SU
Our main concern is obviously directed to DU- and DD-failures in relation to maintaining
well integrity. The presence of DU- and DD-failures reduces the safety performance of the
system, making it less capable of performing or maintaining the well integrity. The negative
impact of DD-failures on system safety is reduced if the DD-failures are corrected within
short time. In this case, the DU failures remain as our main concern with respect to safety
performance.
4.8 FMECA
Failure modes, effects, and criticality analysis (FMECA) is a widely used method for system
reliability assessment. The method provides an intuitive and structured approach to failure
analysis, and FMECA is therefore adopted in many industry sectors. An FMECA is carried
out to answer the following questions:
a. In what ways can system components fail?
b. What are the underlying causes of failures?
c. How can failures be detected?
d. What are the failure effects, on the failed component and on the system as such?
e. How critical are the failure effects, in terms of damage to humans, the environment, or
material assets?
61
An FMECA performed without considering question (e) is sometimes referred to as a failure
modes and effect analysis (FMEA). In practice, FMECA and FMEA are used interchangeably
without reflecting any difference in the scope of the analysis.
The core of an FMECA is the FMECA worksheet, which is filled in during an FMECA
session, a meeting where relevant personnel are gathered. There is no unique and widely
accepted layout of the FMECA worksheet, and many variants are therefore found in
companies and in standards and textbooks. The main elements are, however, the same in all
variants. In some cases, it is important to highlight failures that are classified as DU, DD, and
so on. In this case, the failure effects should be classified accordingly.
4.8.1 FMECA procedure
An FMECA is easy to conduct and easy to comprehend without any advanced analytical
skills. The easiness of using the method may become a false comfort, if not performed or led
by qualified persons. An FMECA is not a one person’s task, but requires the involvement of
persons with overall system knowledge, persons with detailed knowledge on the construction
of the individual components, and a FMECA facilitator. The person facilitating the FMECA
session should have a basic knowledge of the failure concepts and analysis, including the
understanding of main terms such as:
Failure modes
Failure mechanisms
Root causes
Failure classification strategies that are commonly used in the industry
Modes of operation
The main steps in an FMECA are described in the following. It is assumed that an FMECA
facilitator has been identified and that this person is responsible for the preparation, execution,
and documentation of the results.
1. Preparation
a. Identify relevant persons (according to competence) for the FMECA session
62
b. Identify relevant documentation of the system that is to be analyzed
c. Identify supporting information, such as reported failures of similar systems,
experience transfer from other FMECA sessions.
d. If necessary, perform a pre-meeting with some of the identified persons to
participate in the FMECA session to verify that relevant information has been
collected.
e. Select a FMECA worksheet with appropriate columns.
f. Decide if a pre-FMECA session is needed to perform steps 2a)—2e), as an
input to more detailed FMECA session(s) that covers steps 2f) – 2h).
g. Send out the invitation to the participants, including a brief selection of
documentation, and a clear statement about the purpose of the session.
2. Execution of FMECA session(s)
a. Define the system and its boundaries.
i. This step concerns the identification of what components to include
(and which ones to exclude) in the FMECA. This is not always an easy
task, as most systems are not stand-alone but interfacing other systems.
Care should be taken to not exclude components that could be very
determinative for the system performance. Such components may, for
example, be associated with utility supplies (e.g., hydraulics, power).
Excluded components and systems should be commented in the list of
assumptions and limitations of the study.
b. Define the main function (or mission) of the system.
i. This step concerns the overall description of system mission. The
function may be described in terms of a verb plus a noun, e.g., to
activate shear-ram. It is also useful to add some criteria that would
describe the successful performance of this function, e.g., to activate
shear ram within 10 seconds upon drillers (manually initiated)
command.
c. Describe the operational modes (modes of operation), including operational
and environmental stresses.

63
i. The causes and effects of failures may be different in different modes of
operation. Each operating mode may also be subject to different
operational and environmental stresses. For example, the ability of the
pipe ram to perform isolation is highly impacted by what is going
through the BOP.
ii. In some cases, an operational mode may be broken down into several
sub-modes. In a demand situation (where a closure of the shear ram is
required), the sub-modes may be: open, moving (towards closed
position) and closed.
d. Break down the system into subsystems and prepare a complete component
list.
i. It is possible to fill in the FMECA table for the overall system function.
However, in many cases it is required to perform a more detailed
analysis of the various system components. A well barrier comprising
several barrier elements may therefore be studied in separate FMECA
worksheets. The purpose of this step is to identify these system
elements.
e. Define the interrelationship between the various subsystems (and sub-
functions), using, for example, a functional block diagram.
i. This step is important in order to relate the detailed assessment results
(i.e., results of FMECA for each subsystem) to the overall performance
of the system.
f. Fill in the FMECA worksheet
i. See an example of an FMECA setup inFeil! Fant ikke referansekilden..
g. Review the results
i. The purpose of this step is to review the results in light of the main
objective of the session. Have all relevant limitations been sufficiently
documented

64
h. Agree upon follow-up of identified design deficiencies, important test criteria
and so on.

65
Description of item Description of failure Effect of failure
Failure rate
Severity ranking
Risk reducing measure Comments
Ref. no
Function Operational mode
Failure mode
Failure cause or mechanism
Detection of failure
One the subsystem
On the overall system
Table 2 FMECA worksheet
Ref.no The ref.no provides a unique reference to the item that is to be analyzed. If a tag number system has been established for the system, the ref.no may be a tag number, but may also be a label referencing to a particular drawing
Function Overall function or sub-function, according to the item selected
Operational mode Relevant operating modes may be normal production, well intervention, and so on. Each mode, e.g., normal operation, may be split into sub-modes, such as well integrity maintained, well integrity degraded, and well integrity is lost.
Failure mode Failure modes associated with the item in question. A valve failure mode may, for example, be fail to close, fail to open, spurious closure, leakage in closed position, leakage to environment, and so on.
Failure cause or mechanism
Failure causes may be physical (e.g., corrosion, erosion, fatigue) or human errors.
Detection of failure Detection may be defined as undetected or detected, alternatively as hidden or evident.
Effects on the subsystem (item)
Effect may be classified as either safe (does not lead to an unsafe state) or dangerous (does lead to an unsafe state due to e.g., the item function not being carried out). Other classifications may also apply, depending on the type of item.
Effects on the system Same classification as for subsystem, but the effect is on the overall function, or alternatively for the whole plant/rig.
Failure rate Failure rate may be identified in relevant data sources or according to Table 12.3.
Severity ranking Severity ranking may be according to Table 12.3.
Risk reducing measure Risk reducing measures may be identified that may prevent the failure, or reduce the severity of the failure effects.
Table 3 FMECA explanation
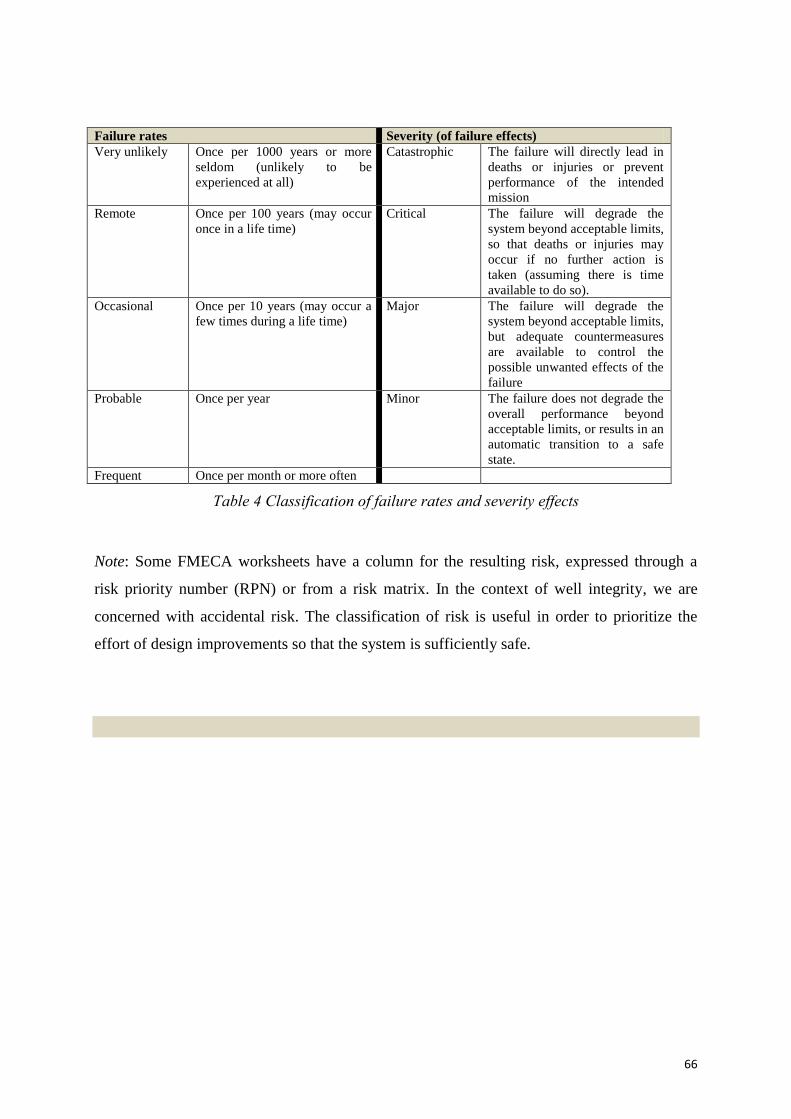
66
Failure rates Severity (of failure effects)
Very unlikely Once per 1000 years or more
seldom (unlikely to be
experienced at all)
Catastrophic The failure will directly lead in
deaths or injuries or prevent
performance of the intended
mission
Remote Once per 100 years (may occur
once in a life time)
Critical The failure will degrade the
system beyond acceptable limits,
so that deaths or injuries may
occur if no further action is
taken (assuming there is time
available to do so).
Occasional Once per 10 years (may occur a
few times during a life time)
Major The failure will degrade the
system beyond acceptable limits,
but adequate countermeasures
are available to control the
possible unwanted effects of the
failure
Probable Once per year Minor The failure does not degrade the
overall performance beyond
acceptable limits, or results in an
automatic transition to a safe
state.
Frequent Once per month or more often
Table 4 Classification of failure rates and severity effects
Note: Some FMECA worksheets have a column for the resulting risk, expressed through a
risk priority number (RPN) or from a risk matrix. In the context of well integrity, we are
concerned with accidental risk. The classification of risk is useful in order to prioritize the
effort of design improvements so that the system is sufficiently safe.
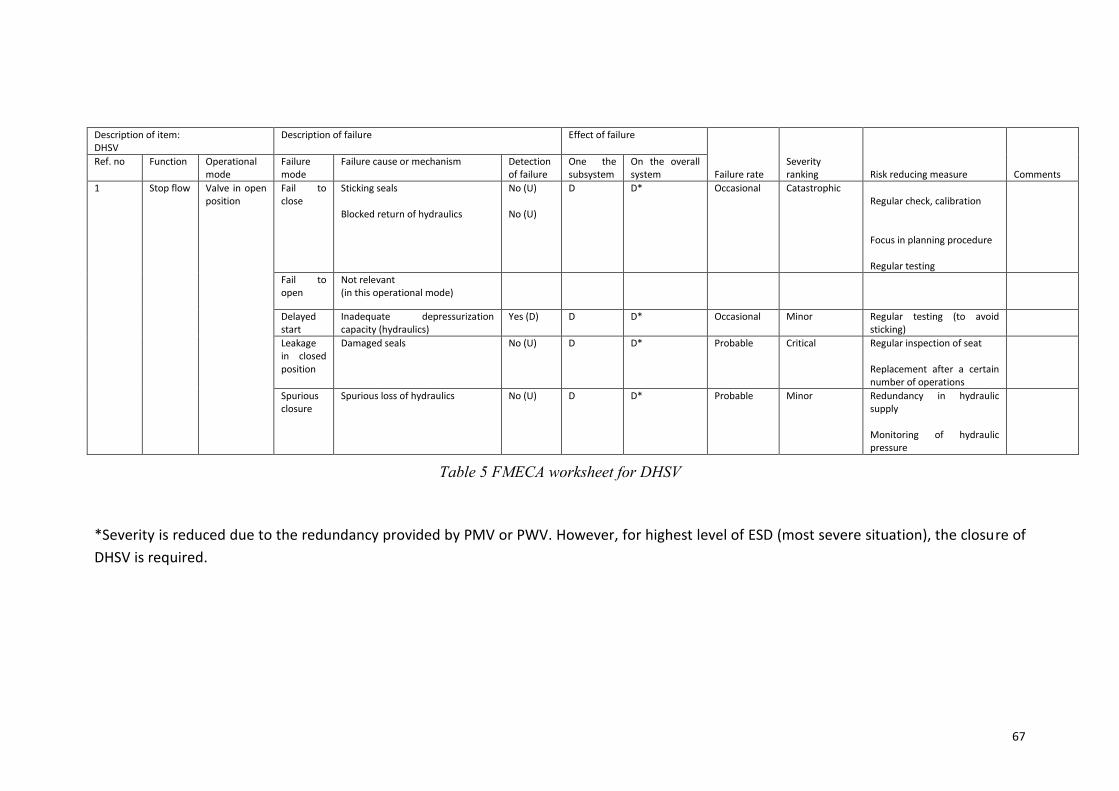
67
Description of item: DHSV
Description of failure Effect of failure
Failure rate
Severity ranking Risk reducing measure Comments
Ref. no Function Operational mode
Failure mode
Failure cause or mechanism Detection of failure
One the subsystem
On the overall system
1 Stop flow Valve in open position
Fail to close
Sticking seals Blocked return of hydraulics
No (U) No (U)
D D* Occasional Catastrophic Regular check, calibration Focus in planning procedure Regular testing
Fail to open
Not relevant (in this operational mode)
Delayed start
Inadequate depressurization capacity (hydraulics)
Yes (D) D D* Occasional Minor Regular testing (to avoid sticking)
Leakage in closed position
Damaged seals No (U) D D* Probable Critical Regular inspection of seat Replacement after a certain number of operations
Spurious closure
Spurious loss of hydraulics No (U) D D* Probable Minor Redundancy in hydraulic supply Monitoring of hydraulic pressure
Table 5 FMECA worksheet for DHSV
*Severity is reduced due to the redundancy provided by PMV or PWV. However, for highest level of ESD (most severe situation), the closure of
DHSV is required.
68
4.9 Fault tree analysis
A fault tree can be used for qualitative as well as quantitative analysis of system reliability2.
The main purpose of a fault tree is to explain why a system failure can occur. In our context,
the system failure may be “leakage to environment” in a particular operating situation. In the
fault tree terminology, this system failure is called the TOP event of the fault tree. The causes
of the TOP event are identified and combined by logic gates.
Fault tree construction is a deductive approach. With basis in the defined system failure, we
ask iteratively what type of events (component failures, human errors, etc.) that may result in
the system failure. A fault tree comprises the following main elements:
The TOP event: This is a precise description of the system failure, and should explain
what the system failure is (e.g., leakage to environment), where the failure occurs or is
observed (e.g., from the wellhead), and when the failure may occur (i.e., the
operational situation we are looking at). In our context, the TOP event may be
“leakage to environment through the wellhead during normal production”.
OR and AND gates: A fault tree applies two main types of logic gates: OR gates and
AND gates. Most fault trees suffice with these two logic gates, but several other gates
are available for specific purposes. In this compendium, however, we only consider
OR- and AND gates.
2 An alternative to constructing a fault tree is to use a reliability block diagram. In a reliability block diagram,
we take the opposite approach and ask for events and conditions that ensure a successful performance of a
system function.
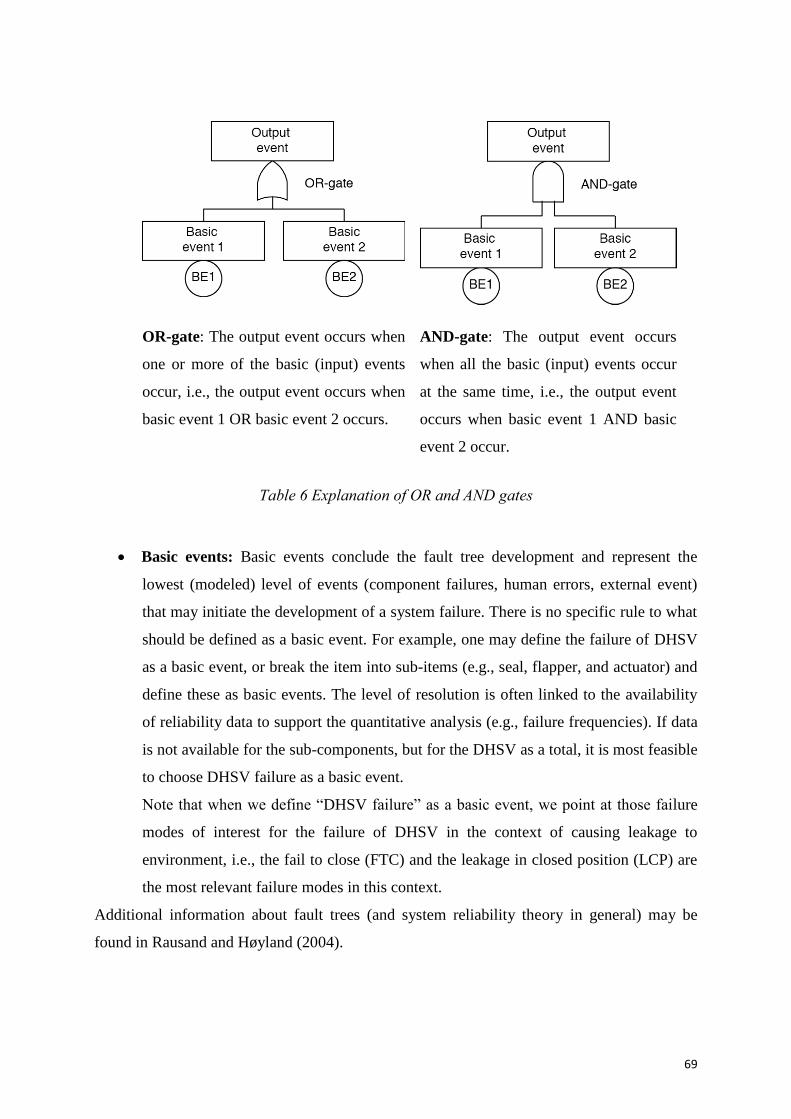
69
OR-gate: The output event occurs when
one or more of the basic (input) events
occur, i.e., the output event occurs when
basic event 1 OR basic event 2 occurs.
AND-gate: The output event occurs
when all the basic (input) events occur
at the same time, i.e., the output event
occurs when basic event 1 AND basic
event 2 occur.
Table 6 Explanation of OR and AND gates
Basic events: Basic events conclude the fault tree development and represent the
lowest (modeled) level of events (component failures, human errors, external event)
that may initiate the development of a system failure. There is no specific rule to what
should be defined as a basic event. For example, one may define the failure of DHSV
as a basic event, or break the item into sub-items (e.g., seal, flapper, and actuator) and
define these as basic events. The level of resolution is often linked to the availability
of reliability data to support the quantitative analysis (e.g., failure frequencies). If data
is not available for the sub-components, but for the DHSV as a total, it is most feasible
to choose DHSV failure as a basic event.
Note that when we define “DHSV failure” as a basic event, we point at those failure
modes of interest for the failure of DHSV in the context of causing leakage to
environment, i.e., the fail to close (FTC) and the leakage in closed position (LCP) are
the most relevant failure modes in this context.
Additional information about fault trees (and system reliability theory in general) may be
found in Rausand and Høyland (2004).
70
4.9.1 Fault tree programs
Fault trees for practical systems will usually become rather comprehensive and it is therefore
beneficial to use a dedicated fault tree program. Several programs for fault tree construction
and analysis have been developed. In Norway, two such programs are commonly used:
CARA FaultTree, which is available from ExproSoft
(www.exprosoft.com/products/Cara.aspx)
RiskSpectrum, which is available from Scandpower (www.riskspectrum.com)
Links to several other programs for fault tree construction and analyses may be found on
(www.ntnu.edu/ross/info/software).
4.9.2 Fault tree construction
The events in a fault tree are described in rectangles. For basic events, a circle is drawn
beneath the rectangle and a unique identificator of the basic event is entered into the circle.
The identificator is an alpha-numeric code and the maximum number of symbols is
determined by the computer program used. It is wise to select a code that gives a meaningful
reference to the basic event.
The barrier diagram is a good starting point for constructing a fault tree and the
transformation from a barrier diagram to a fault tree is fairly simple. We will illustrate the
procedure by using the well barrier diagram in Figure 25.
We always start with the TOP event, which in this case is “Leakage to the
surroundings” In the well barrier diagram in Figure 25 this is represented by the
node “Surroundings” which is the terminal node of the diagram
As seen from Figure 25, there are ten different arrows (representing flow paths)
pointing into the terminal node. For simplicity, we refer to these flow paths as flow
path 1, flow path 2, and so on, where we number the paths from 1 to 10, beginning
from the top of the diagram.
If at least one of the flow paths is leaking, then we have leakage to the
surroundings. This means that there is an OR-relationship: Hydrocarbons will
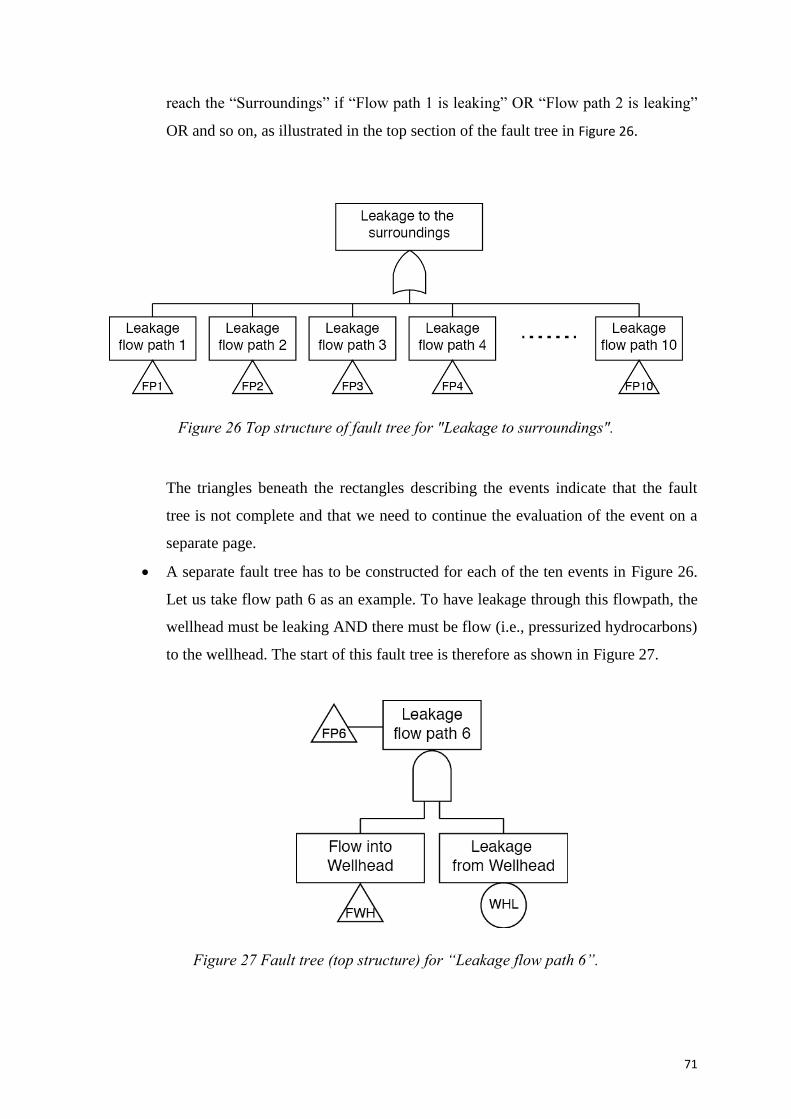
71
reach the “Surroundings” if “Flow path 1 is leaking” OR “Flow path 2 is leaking”
OR and so on, as illustrated in the top section of the fault tree in Figure 26.
Figure 26 Top structure of fault tree for "Leakage to surroundings".
The triangles beneath the rectangles describing the events indicate that the fault
tree is not complete and that we need to continue the evaluation of the event on a
separate page.
A separate fault tree has to be constructed for each of the ten events in Figure 26.
Let us take flow path 6 as an example. To have leakage through this flowpath, the
wellhead must be leaking AND there must be flow (i.e., pressurized hydrocarbons)
to the wellhead. The start of this fault tree is therefore as shown in Figure 27.
Figure 27 Fault tree (top structure) for “Leakage flow path 6”.

72
The triangle in the top of Figure 27 indicates where this fault tree shall be input
(appended) to the top structure fault tree in Figure 26. The event on the left-hand
side “Flow into Wellhead” need further development and is therefore marked with
a triangle. The event “Leakage from Wellhead” is here considered to be a basic
event and is therefore marked with a circle with the alpha-numeric code WHL
(i.e., abbreviation for wellhead leak). We might have developed this event further,
for example by distinguishing between the wellhead seals that may be leaking.
The event “Flow into Wellhead” must be developed further. From the well barrier
diagram in Figure 25, we note that if the production packer OR the tubing below
the DHSV OR the tubing above the DHSV leaks, then there is “Flow into
Wellhead”. This can be drawn as a separate fault tree or we can extend the fault
tree in Figure 27. Here, we chose the lat option and the resulting fault tree is
shown in Figure 28.
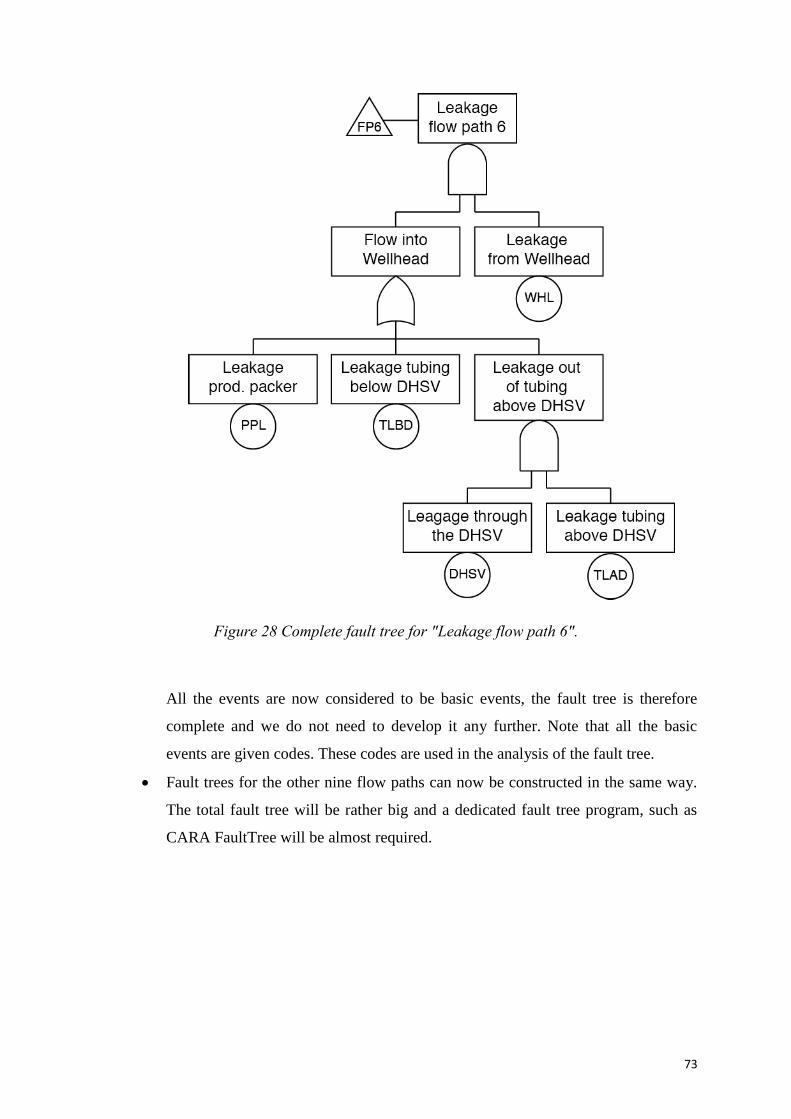
73
Figure 28 Complete fault tree for "Leakage flow path 6".
All the events are now considered to be basic events, the fault tree is therefore
complete and we do not need to develop it any further. Note that all the basic
events are given codes. These codes are used in the analysis of the fault tree.
Fault trees for the other nine flow paths can now be constructed in the same way.
The total fault tree will be rather big and a dedicated fault tree program, such as
CARA FaultTree will be almost required.
74
4.9.3 Fault tree pros and cons
The fault tree can be constructed directly, or based on a well barrier diagram. The fault tree is
always started by the TOP event that we want to investigate. For well integrity studies, this
event will usually be “Leakage to the surroundings”. The fault tree is developed step by step
from the TOP event by repeatedly asking: “How can this event happen?” The answer to this
question for the TOP event is found by identifying all the possible places the leakage can
come out, i.e., the ten flow paths. Then we study each and every of these flow paths and again
ask: “How can this happen?” and so on. The fault tree construction is based on a very simple
procedure and it is therefore suitable for brainstorming sessions involving people that have
not been trained in fault tree construction.
A negative point is that the resulting fault tree often becomes big and many pages of paper are
needed to draw the complete fault tree. It is therefore easy to lose oversight. One should,
however, remember that the fault tree is a logic structure and that it is fully okay to have the
same event many places in the fault tree. In the further analysis, this taken care of by the fault
tree logic.
We may ask why we should use fault tree analysis and not suffice with a well barrier diagram
– since the well barrier diagram is more compact and it is easier to see the leakage paths. The
main reason is the intuitive logic of the fault tree and its capabilities for both qualitative and
quantitative analysis.
4.9.4 Qualitative analysis of the fault tree
A complete fault tree shows all the failure combinations or causes that lead to a specified
failure or dangerous situation. These combinations can be investigated for the TOP event or
for one of the intermediate events (e.g., “Leakage flow path 6”). Most computer programs for
fault tree analysis can list all these combinations, which are referred to as cut sets. Some cut
sets will contain basic events that are superfluous and if these are removed from the set, the
set will still be a cut set. When all of the superfluous basic events are removed, the cut set is
called a minimal cut set. For big fault trees, it is a hard job to identify all the minimal cut sets
manually.
75
Cut set: A cut set in a fault tree is a set of basic events whose (simultaneous) occurrence
ensures that the TOP event occurs.
Minimal cut set: A cut set that cannot be reduced (Rausand and Høyland, 2004)
The minimal cut sets related to the event “Leakage flow path 6” in Figure 28 are seen to be
{WHL, PPL} i.e., wellhead is leaking AND production packer is leaking
{WHL,TLBD} i.e., wellhead is leaking and the tubing below the DHSV is leaking.
{WHL, DHSV,TLAD} i.e., wellhead is leaking AND the DHSV is leaking (or cannot be
closed) AND the tubing above the DHSV is leaking.
A minimal cut fails if and only if all the basic events of the minimal cut set occur. This means
that if at least one of the basic events does not occur, then the minimal cut does not fail. If at
least one of the minimal cuts fails, the TOP event will automatically occur. It is obvious that a
minimal cut set with few events is more important than a minimal cut set with many events. A
minimal cut set with only one basic events means that there is only one barrier between the
reservoir and event we are studying. A minimal cut set of two basic events means that two
barriers have to fail to give the event we are studying.
4.9.5 Failure rate, mean time to failure, and survival probability
The term failure rate has been mention several times without any proper definition or
explanation. Failure rate is a rather complex concept, but is here used in a rather simple
manner. In this compendium, the failure rate of an item is denoted l and indicates how often
the item is expected to fail. The failure rate l is given as number of failure per time unit in
service. The time unit is often given a million hours (or 106 hours). A failure rate of, for
example, l = 5.5 ×10⁻⁶ per hour, means that we, on the average, should expect 5.5 failures
during a period of one million hours in service.
A related concept is the mean time to failure (MTTF), which is the expected (or average) time
from start-up of an item until the first failure of this item occurs. The MTTF is given by
76
MTTF =1
l (0.1)
We may also write l =1/ MTTF , such that we can determine the failure rate from the MTTF
(the average time to failure). This means that an item that has an average lifetime of half a
year will have a failure rate of 2 per year.
An item with failure rate l = 5.5 ×10⁻⁶ per hour will hence have an MTTF of
MTTF =1
l=
1
5.5 ×10-6= 181818 hours (0.2)
That is, approximately 21 years in continuous service. This means that the item, on the
average, will fail after 21 years in continuous service.
Another important concept is the survival probability R(t), which is the probability that an
item will survive a specified time period of length t without failure. The survival probability
is given by
R(t) = e-lt (0.3)
An item with failure rate l = 5.5 ×10⁻⁶ per hour will therefore survive a period of 5 years (i.e.,
43800 hours) with probability R(t) = e-5.5×10-6
×43800 = 0.786 . This means that after 5 years in
service, the item will still be functioning with probability 78.6% and have failed before 5
years with probability 21.4%.
4.9.6 Well barrier performance data
Quantitative analyses about well integrity cannot be made without access to relevant
reliability data such as failure rates and MTTFs for technical components, human error
probabilities, and so on. Data collection initiatives are therefore needed in order to collect
information about how frequent well barrier elements fail and why.
The main source of reliability data for well equipment is the WellMaster database, which is
operated by ExproSoft (http://www.exprosoft.com). The database provides:
Failure causes for each specific component and failure mode
77
Mean time to failure (MTTF) for each failure mode
Failure rate estimates for each failure mode
Survival probabilities, i.e., the functions describing the probability of surviving a
certain time t .
Another valuable source of reliability data for XT components and downstream equipment is
the OREDA database (http://www.oreda.com). OREDA does not supply reliability data for
well equipment, so these two databases supplement each other. The data in OREDA is based
on maintenance records and provides the same type of data as WellMaster. The presentation
formats are, however, different.
For safety-instrumented systems (if relevant), the best reliability data source is the PDS Data
Handbook (http://www.sintef.no/Projectweb/PDS-Main-Page/PDS-Handbooks/PDS-Data-
Handbook/).
Reliability data for general mechanical equipment may be found in the MechRel database
(http://www.mechrel.com/).
A survey of available reliability data sources may be found on the web page
http://www.ntnu.edu/ross/info/data.
4.9.7 Quantitative analysis
Quantitative fault tree analysis would require some basic knowledge in system reliability
theory. The purpose of this section is not to provide this knowledge, but to show how some
reliability measures can be calculated and what type of input data that is needed to support
such calculations.
The formulas given below are based on the assumption that all the basic events are
statistically independent. This implies that if one basic event has occurred, this will not
influence the probability that other basic events occur. This is not always realistic since the
same stresses or same events may influence several items in the well barrier system. If, for
example, the production wing valve fails to close due to formation of hydrates, it is very
likely that the production master valve will have the same problem. In this case, the formation
78
of hydrates is a common cause and if both valves fail due to this cause, we have a common
cause failure. Analysis of common cause failures is an important aspect of the reliability of
the well barrier system, but is beyond the scope of this compendium.
Let TOP denote the TOP event of the fault tree. The probability that the TOP event occurs at
time t is denoted Q0(t). Further, let qi (t) denote that basic event i occurs at time t . Since a
minimal cut set fails only when all the basic events of the minimal cut set occurs, the
probability that minimal cut set j fails at time t is given by
Qj (t) = qi (t)iÎCj
Õ (0.4)
Equation (1.1) may seem difficult, but is in fact rather simple. It only says that you must
multiply the probabilities of all the basic events of minimal cut set j .
The TOP event occurs when at least one of the minimal cut sets fails. The probability of the
TOP event Q0(t) can be written
Q0 (t) £1- (1-Qj (t))
j=1
k
Õ (0.5)
Equation (1.2) is called the “upper bound approximation” formula and the development of
this formula is too complicated to be fully explained in this compendium3. The formula is,
however, easy to use and is also used by almost all computer programs for fault tree analysis.
If we can find the probabilities qi (t) of all the basic events ( i =1,2, ,k), we can use
equations (1.1) and (1.2) to determine the TOP event probability.
The problem is now how we can find the probabilities of the basic events. This will depend on
the type of the basic event, and we distinguish between the following types:
a) Non-repairable. This type means that we consider an item that is not repaired upon
failure – except by a full workover intervention. In this case, the probability of the
basic event is
qi (t) =1- e-lit » lit (0.6)
3 Interested readers may consult Rausand and Høyland (2004) for further information.
79
b) Repairable. This type means that we consider an item that is repaired upon failure.
The failure is detected immediately and the mean downtime for the item is MTTR
(mean time to repair). In this case, the probability of basic event is
qi »MTTRi
MTTFi + MTTRi
» li MTTRi (0.7)
c) Periodic testing. Many of the barrier elements are passive items where dangerous
failures are only detected by a proof test (e.g., the failure mode “fail to close” for a
DHSV or a XT gate valve). When the time between two consecutive proof tests is t
(e.g., 6 months), the probability of the basic event is
qi »lit
2 (0.8)
d) On-demand. Some basic events are so-called on-demand events, meaning that a
specific event occurs in a specific situation. This event may be a human error, an
environmental condition, or a specific well event. The probability of such an event is
usually given as a fixed probability qi. An example may be that the driller fails to
activate a specific pushbutton
When CARA FaultTree has been used to construct the fault tree, you can double-click on a
basic event symbol to enter the required data. You will then first be asked to choose the type
of event and thereafter be prompted for the required input values. When all the required data
has been entered, the TOP event probability is calculated by pressing a button. CARA
FaultTree and the other fault tree programs can also provide many other reliability measures,
such as
The mean time until the TOP event occurs
The importance of the various basic events for the TOP event probability
The uncertainty of the TOP event probability based on the uncertainty of input data
and so on

80
5. Technical well barriers
5.1 Well barrier philosophy
It is a general philosophy that the wells are to be equipped with sufficient mechanical well
barriers preventing uncontrolled outflow from the reservoir. In addition it is a general rule that
no single failure of a component is to lead to unacceptable consequences.
For wells this means in practical terms that a well is to be equipped with two well barriers
against the reservoir, and that the well barriers are to be as independent of each other as
possible. In addition it will be required to have sufficient barriers in place against limited
volumes as e.g. against outflow from annulus A in gas lifted wells.
For wells in operation and plugged wells, two independent well barriers are to be in place. For
wells that are being drilled or intervened, it is not always possible to assure complete
independence. For wells without complete independence of the well barriers, extra reliability
of the common well barrier elements will be required as well as stronger requirements in
emergency response plans.
5.1.1 Fail-safe functions:
For a well in operation some barrier elements need to be in an open position to be able to
produce the well. This is typically the DHSV, PMV and PWV. It is therefore critical that
these valves automatically close in situations when power or hydraulic supply is lost, or if a
fire should occur. It is a general requirement that these valves are to be fail-safe, meaning that
the valve is designed to move to the safe position when such a failure occurs.
To ensure the fail-safe function, it is critical that correct design calculations are done. An
example is for instance that a DHSV needs to have strong enough spring ensuring the valve
will close with the highest possible pressure on the control line after control line failure.

81
5.1.2 Safety systems
Safety systems are needed both to ensure operational limits are not exceeded, and to ensure
that the well is closed in potentially dangerous situations.
Typically safety systems are needed to ensure that any injection in the well will not be with
higher pressure than the well barriers are constructed for. In this case it is very important to
safeguard the well barrier that two levels of safety system are implemented:
1. Automatic shut in of the well when a certain pressure is reached.
2. Automatic bleed-off of the injection pressure to a safe area if a certain injection
pressure is reached.
As unintended shut down is to be avoided, there will be implemented alarms at certain
pressure levels, allowing time to manually take action and regulate the pressure.
Other typically safety systems are safeguarding against thermal effects on closed volumes, ref
Chapter 6. When the annulus pressure becomes too high due to warming up during well
startup, a safety system ensuring that the well is closed in automatically at a certain annulus
pressure will then prevent the risk of barrier failure due to the temperature effect and lack of
manual pressure regulation.
It is critical to have safety systems to ensure that the well is closed in when emergency
situations occur on the installation. Also safety systems closing the well in when the pressure
in the well becomes too low are to be implemented, as such low pressure would indicate a
leak.
There can be need for more or less safety systems than the examples mentioned above. The
general need for safety systems is very much dependent on the risk.
5.1.3 Fire resistance
It is crucial that the well barrier envelope is fire resistant in case a fire occurs in the wellhead
area. Therefore all the barrier valves shall automatically move to safe position ensuring fire
resistance in such cases. In addition all XT and wellhead seals that are part of the barrier
envelope shall be fire resistant.

82
Any lack of fire resistance will increase the risk of a fire, as the risk of putting the whole well
on fire will become evident.
5.1.4 Well barrier schematics
Well barrier schematics, according to NORSOK D-010, are developed as a practical method
to demonstrate and illustrate the presence, or non-presence of the required primary and
secondary well barriers. An example of a well barrier schematic of a production well is shown
in Figure 29. This is a template typically used for illustrating the well barrier schematic. In the
real barrier schematic for a specific well all the data are given
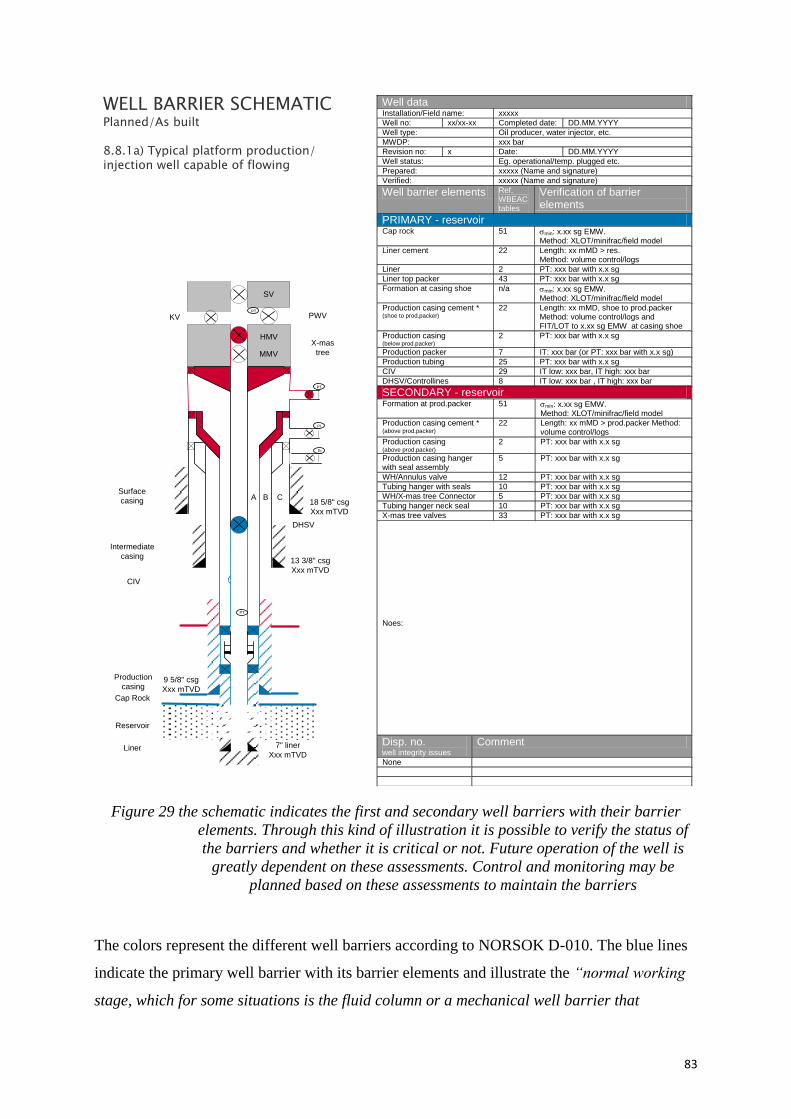
83
WELL BARRIER SCHEMATICPlanned/As built
8.8.1a) Typical platform production/injection well capable of flowing
Well data Installation/Field name: xxxxx
Well no: xx/xx-xx Completed date: DD.MM.YYYY
Well type: Oil producer, water injector, etc.
MWDP: xxx bar
Revision no: x Date: DD.MM.YYYY
Well status: Eg. operational/temp. plugged etc.
Prepared: xxxxx (Name and signature)
Verified: xxxxx (Name and signature)
Well barrier elements Ref. WBEAC tables
Verification of barrier elements
PRIMARY - reservoir Cap rock 51 smin: x.xx sg EMW.
Method: XLOT/minifrac/field model
Liner cement 22 Length: xx mMD > res. Method: volume control/logs
Liner 2 PT: xxx bar with x.x sg
Liner top packer 43 PT: xxx bar with x.x sg
Formation at casing shoe n/a smin: x.xx sg EMW. Method: XLOT/minifrac/field model
Production casing cement * (shoe to prod.packer)
22 Length: xx mMD, shoe to prod.packer Method: volume control/logs and FIT/LOT to x.xx sg EMW at casing shoe
Production casing (below prod.packer)
2 PT: xxx bar with x.x sg
Production packer 7 IT: xxx bar (or PT: xxx bar with x.x sg)
Production tubing 25 PT: xxx bar with x.x sg
CIV 29 IT low: xxx bar, IT high: xxx bar
DHSV/Controllines 8 IT low: xxx bar , IT high: xxx bar
SECONDARY - reservoir Formation at prod.packer 51 smin: x.xx sg EMW.
Method: XLOT/minifrac/field model
Production casing cement * (above prod.packer)
22 Length: xx mMD > prod.packer Method: volume control/logs
Production casing (above prod.packer)
2 PT: xxx bar with x.x sg
Production casing hanger with seal assembly
5 PT: xxx bar with x.x sg
WH/Annulus valve 12 PT: xxx bar with x.x sg
Tubing hanger with seals 10 PT: xxx bar with x.x sg
WH/X-mas tree Connector 5 PT: xxx bar with x.x sg
Tubing hanger neck seal 10 PT: xxx bar with x.x sg
X-mas tree valves 33 PT: xxx bar with x.x sg
Noes:
Disp. no. well integrity issues
Comment
None
X-mas
tree
PWV
HMV
MMV
KV
SV
Surface
casing
Intermediate
casing
DHSV
Production
casing
PT
PT
PT
PI
PI
A B C
Cap Rock
Reservoir
CIV
Liner
18 5/8" csg
Xxx mTVD
13 3/8" csg
Xxx mTVD
9 5/8" csg
Xxx mTVD
7" liner
Xxx mTVD
Figure 29 the schematic indicates the first and secondary well barriers with their barrier
elements. Through this kind of illustration it is possible to verify the status of
the barriers and whether it is critical or not. Future operation of the well is
greatly dependent on these assessments. Control and monitoring may be
planned based on these assessments to maintain the barriers
The colors represent the different well barriers according to NORSOK D-010. The blue lines
indicate the primary well barrier with its barrier elements and illustrate the “normal working
stage, which for some situations is the fluid column or a mechanical well barrier that

84
provides closure of the well barrier envelope” (NORSOK D-010). The red lines indicate the
secondary well barrier with its barrier elements and illustrate the “ultimate stage, which in
most cases describes a situation where the shear ram/shear valve is closed” (NORSOK D-
010). Well barrier schematics shall be complemented by tables showing the WBEs that are
found as primary or secondary barriers. A production well barrier schematics with indicated
WBEs and envelops is illustrated in Figure 30. The schematic presents a well shut in and
capable to produce. The blue line indicates the primary barriers: production packer,
completion string (tubing section between the downhole safety valve and production packer),
and the valve itself. The red line envelope includes the casing cement, casing, wellhead,
tubing hanger, annulus master valve and production tree with the production master valves.
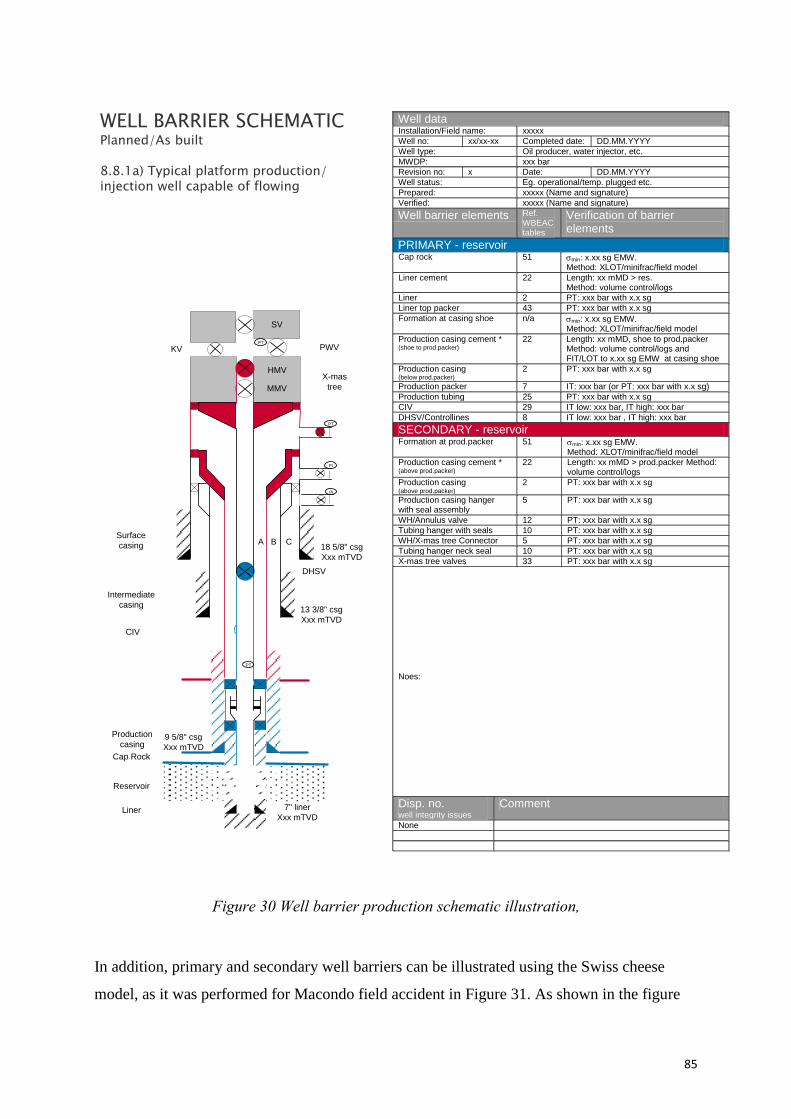
85
WELL BARRIER SCHEMATICPlanned/As built
8.8.1a) Typical platform production/injection well capable of flowing
Well data Installation/Field name: xxxxx
Well no: xx/xx-xx Completed date: DD.MM.YYYY
Well type: Oil producer, water injector, etc.
MWDP: xxx bar
Revision no: x Date: DD.MM.YYYY
Well status: Eg. operational/temp. plugged etc.
Prepared: xxxxx (Name and signature)
Verified: xxxxx (Name and signature)
Well barrier elements Ref. WBEAC tables
Verification of barrier elements
PRIMARY - reservoir Cap rock 51 smin: x.xx sg EMW.
Method: XLOT/minifrac/field model
Liner cement 22 Length: xx mMD > res. Method: volume control/logs
Liner 2 PT: xxx bar with x.x sg
Liner top packer 43 PT: xxx bar with x.x sg
Formation at casing shoe n/a smin: x.xx sg EMW. Method: XLOT/minifrac/field model
Production casing cement * (shoe to prod.packer)
22 Length: xx mMD, shoe to prod.packer Method: volume control/logs and FIT/LOT to x.xx sg EMW at casing shoe
Production casing (below prod.packer)
2 PT: xxx bar with x.x sg
Production packer 7 IT: xxx bar (or PT: xxx bar with x.x sg)
Production tubing 25 PT: xxx bar with x.x sg
CIV 29 IT low: xxx bar, IT high: xxx bar
DHSV/Controllines 8 IT low: xxx bar , IT high: xxx bar
SECONDARY - reservoir Formation at prod.packer 51 smin: x.xx sg EMW.
Method: XLOT/minifrac/field model
Production casing cement * (above prod.packer)
22 Length: xx mMD > prod.packer Method: volume control/logs
Production casing (above prod.packer)
2 PT: xxx bar with x.x sg
Production casing hanger with seal assembly
5 PT: xxx bar with x.x sg
WH/Annulus valve 12 PT: xxx bar with x.x sg
Tubing hanger with seals 10 PT: xxx bar with x.x sg
WH/X-mas tree Connector 5 PT: xxx bar with x.x sg
Tubing hanger neck seal 10 PT: xxx bar with x.x sg
X-mas tree valves 33 PT: xxx bar with x.x sg
Noes:
Disp. no. well integrity issues
Comment
None
X-mas
tree
PWV
HMV
MMV
KV
SV
Surface
casing
Intermediate
casing
DHSV
Production
casing
PT
PT
PT
PI
PI
A B C
Cap Rock
Reservoir
CIV
Liner
18 5/8" csg
Xxx mTVD
13 3/8" csg
Xxx mTVD
9 5/8" csg
Xxx mTVD
7" liner
Xxx mTVD
Figure 30 Well barrier production schematic illustration,
In addition, primary and secondary well barriers can be illustrated using the Swiss cheese
model, as it was performed for Macondo field accident in Figure 31. As shown in the figure
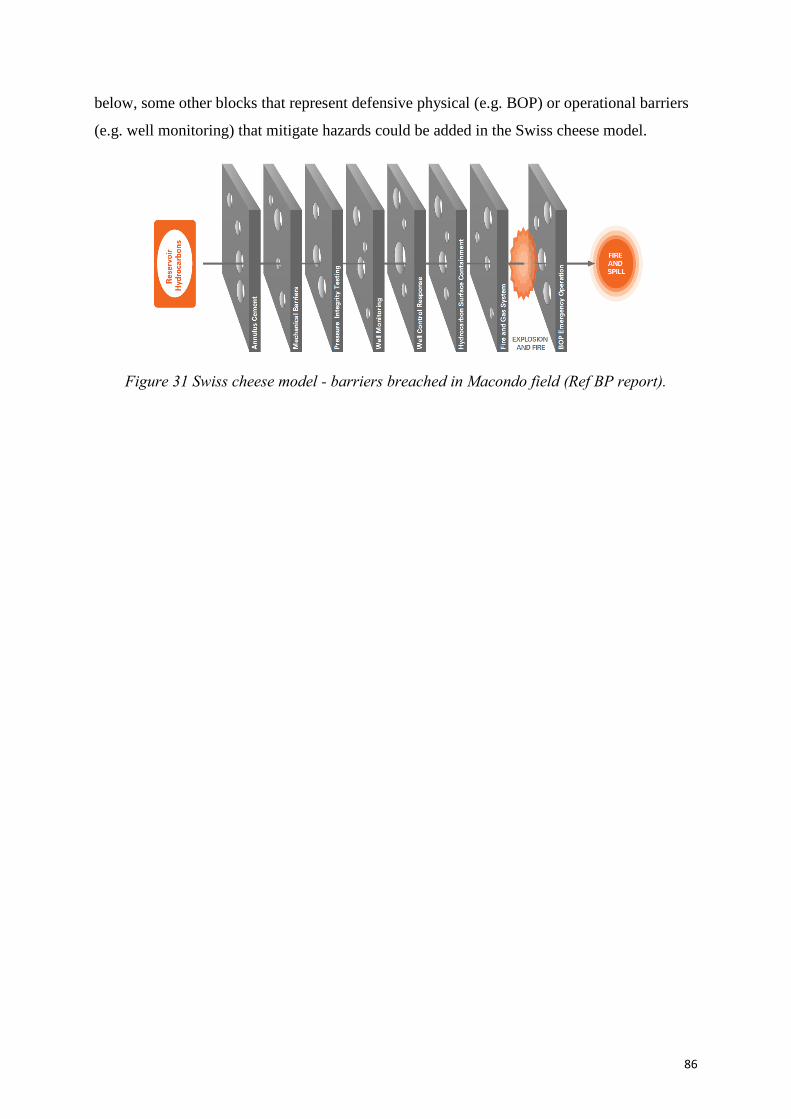
86
below, some other blocks that represent defensive physical (e.g. BOP) or operational barriers
(e.g. well monitoring) that mitigate hazards could be added in the Swiss cheese model.
Figure 31 Swiss cheese model - barriers breached in Macondo field (Ref BP report).
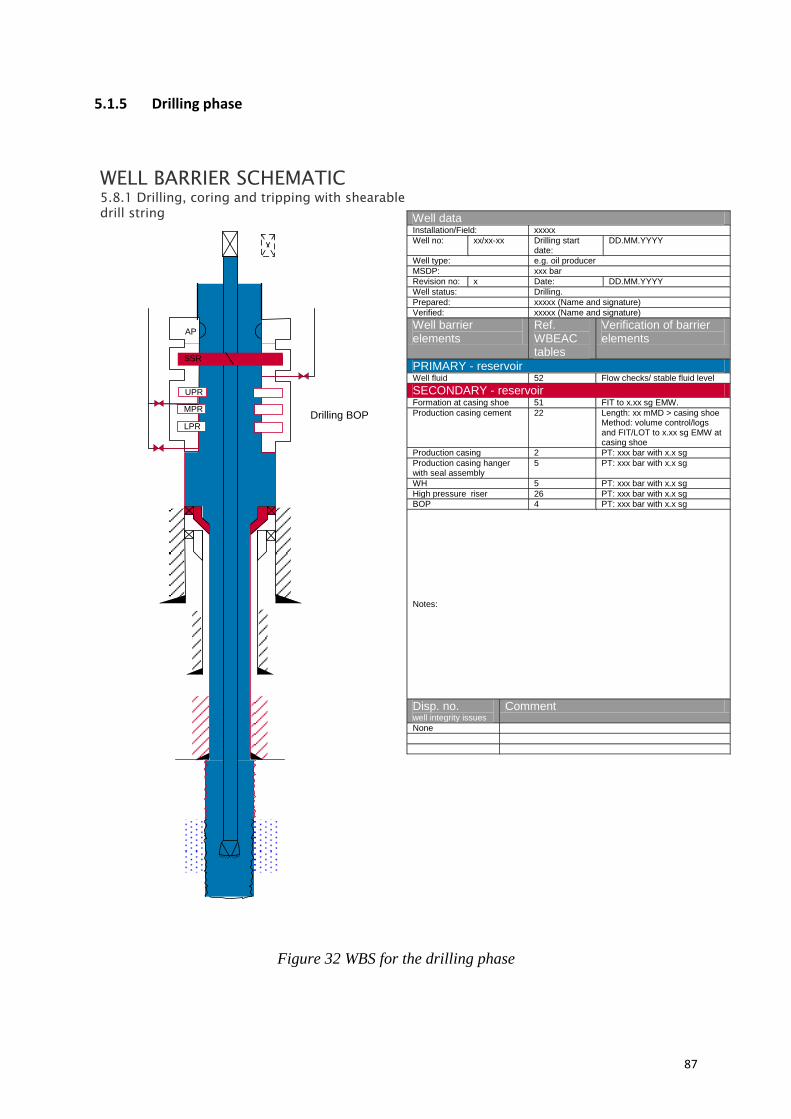
87
5.1.5 Drilling phase
WELL BARRIER SCHEMATIC5.8.1 Drilling, coring and tripping with shearable drill string
UPR
MPR
LPR
AP
SSR
Drilling BOP
Well data Installation/Field: xxxxx
Well no: xx/xx-xx Drilling start date:
DD.MM.YYYY
Well type: e.g. oil producer
MSDP: xxx bar
Revision no: x Date: DD.MM.YYYY
Well status: Drilling.
Prepared: xxxxx (Name and signature)
Verified: xxxxx (Name and signature)
Well barrier elements
Ref. WBEAC tables
Verification of barrier elements
PRIMARY - reservoir Well fluid 52 Flow checks/ stable fluid level
SECONDARY - reservoir Formation at casing shoe 51 FIT to x.xx sg EMW.
Production casing cement 22 Length: xx mMD > casing shoe Method: volume control/logs and FIT/LOT to x.xx sg EMW at casing shoe
Production casing 2 PT: xxx bar with x.x sg
Production casing hanger with seal assembly
5 PT: xxx bar with x.x sg
WH 5 PT: xxx bar with x.x sg
High pressure riser 26 PT: xxx bar with x.x sg
BOP 4 PT: xxx bar with x.x sg
Notes:
Disp. no. well integrity issues
Comment
None
Figure 32 WBS for the drilling phase
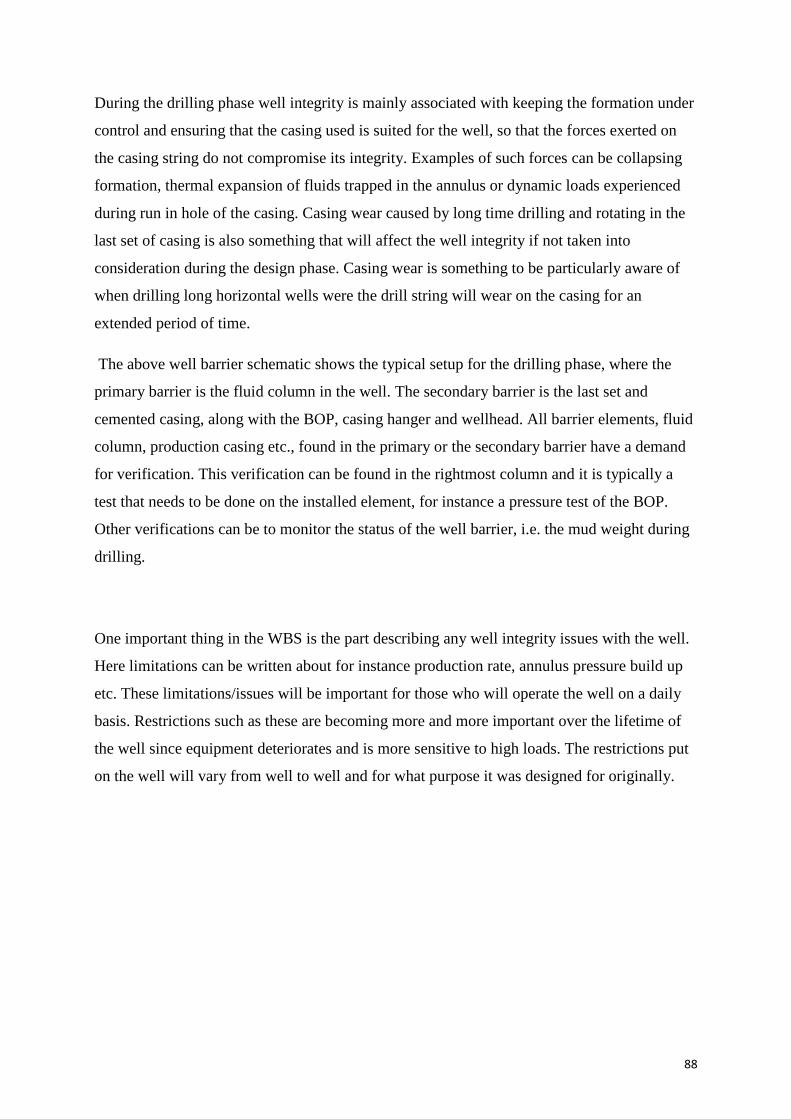
88
During the drilling phase well integrity is mainly associated with keeping the formation under
control and ensuring that the casing used is suited for the well, so that the forces exerted on
the casing string do not compromise its integrity. Examples of such forces can be collapsing
formation, thermal expansion of fluids trapped in the annulus or dynamic loads experienced
during run in hole of the casing. Casing wear caused by long time drilling and rotating in the
last set of casing is also something that will affect the well integrity if not taken into
consideration during the design phase. Casing wear is something to be particularly aware of
when drilling long horizontal wells were the drill string will wear on the casing for an
extended period of time.
The above well barrier schematic shows the typical setup for the drilling phase, where the
primary barrier is the fluid column in the well. The secondary barrier is the last set and
cemented casing, along with the BOP, casing hanger and wellhead. All barrier elements, fluid
column, production casing etc., found in the primary or the secondary barrier have a demand
for verification. This verification can be found in the rightmost column and it is typically a
test that needs to be done on the installed element, for instance a pressure test of the BOP.
Other verifications can be to monitor the status of the well barrier, i.e. the mud weight during
drilling.
One important thing in the WBS is the part describing any well integrity issues with the well.
Here limitations can be written about for instance production rate, annulus pressure build up
etc. These limitations/issues will be important for those who will operate the well on a daily
basis. Restrictions such as these are becoming more and more important over the lifetime of
the well since equipment deteriorates and is more sensitive to high loads. The restrictions put
on the well will vary from well to well and for what purpose it was designed for originally.
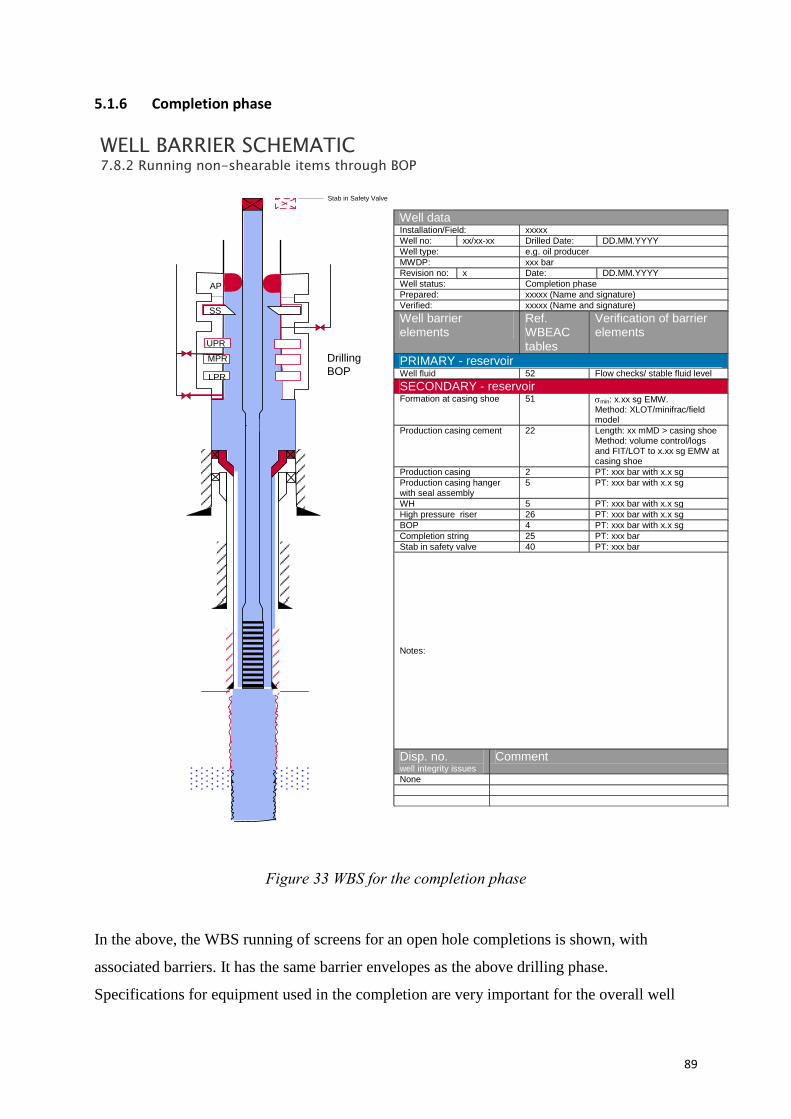
89
5.1.6 Completion phase
WELL BARRIER SCHEMATIC7.8.2 Running non-shearable items through BOP
AP
Drilling
BOP
Stab in Safety Valve
MPR
LPR
UPR
SS
Well data Installation/Field: xxxxx
Well no: xx/xx-xx Drilled Date: DD.MM.YYYY
Well type: e.g. oil producer
MWDP: xxx bar
Revision no: x Date: DD.MM.YYYY
Well status: Completion phase
Prepared: xxxxx (Name and signature)
Verified: xxxxx (Name and signature)
Well barrier elements
Ref. WBEAC tables
Verification of barrier elements
PRIMARY - reservoir Well fluid 52 Flow checks/ stable fluid level
SECONDARY - reservoir Formation at casing shoe 51 smin: x.xx sg EMW.
Method: XLOT/minifrac/field model
Production casing cement 22 Length: xx mMD > casing shoe Method: volume control/logs and FIT/LOT to x.xx sg EMW at casing shoe
Production casing 2 PT: xxx bar with x.x sg
Production casing hanger with seal assembly
5 PT: xxx bar with x.x sg
WH 5 PT: xxx bar with x.x sg
High pressure riser 26 PT: xxx bar with x.x sg
BOP 4 PT: xxx bar with x.x sg
Completion string 25 PT: xxx bar
Stab in safety valve 40 PT: xxx bar
Notes:
Disp. no. well integrity issues
Comment
None
Figure 33 WBS for the completion phase
In the above, the WBS running of screens for an open hole completions is shown, with
associated barriers. It has the same barrier envelopes as the above drilling phase.
Specifications for equipment used in the completion are very important for the overall well

90
integrity, since this equipment is most exposed to the well fluids over the life of the well. So if
the selected completion equipment is not properly designed well integrity problems will arise
because of this. When selecting the components for a completion many things have to be
taken into consideration, such as lifetime of the well, fluid composition, pressure and
temperature. All these things will influence the well integrity and make the life of the well
shorter or longer. In general for new field developments one can say that the completion
equipment is designed for a working life of roughly 20 years, though this might vary from
field to field and with the purpose of the well. A good job in pre-engineering and design of
wells will prevent future well integrity problems.
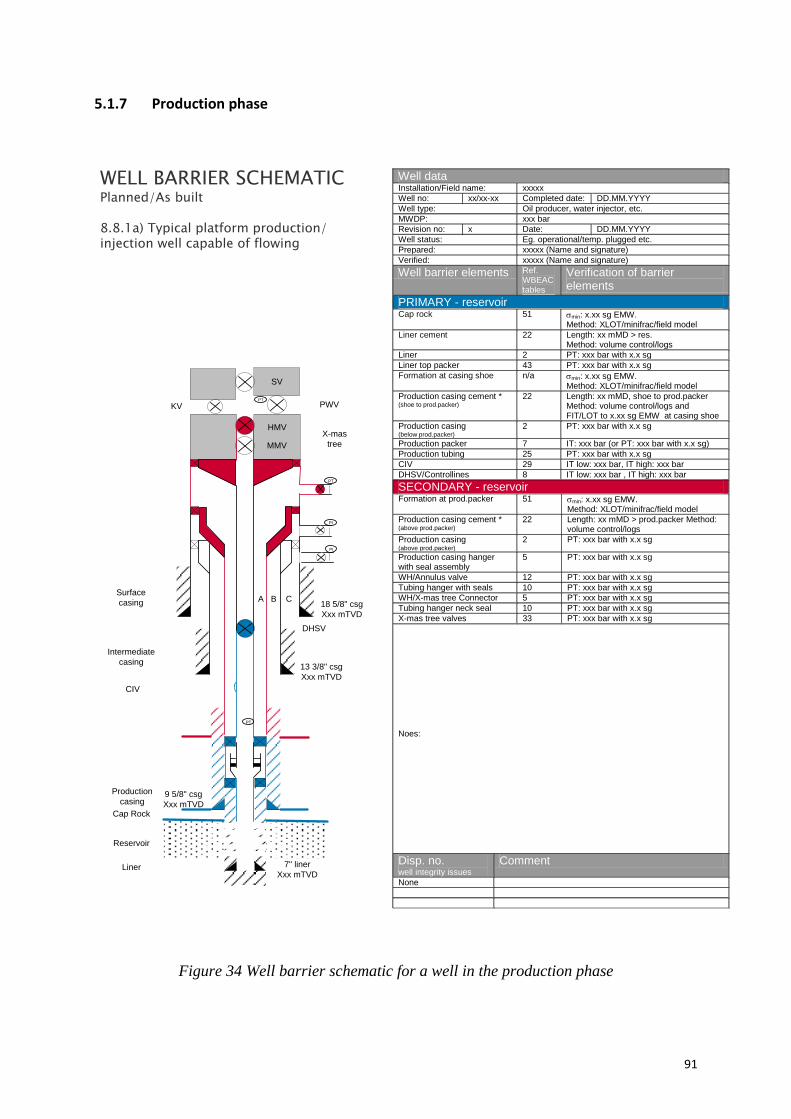
91
5.1.7 Production phase
WELL BARRIER SCHEMATICPlanned/As built
8.8.1a) Typical platform production/injection well capable of flowing
Well data Installation/Field name: xxxxx
Well no: xx/xx-xx Completed date: DD.MM.YYYY
Well type: Oil producer, water injector, etc.
MWDP: xxx bar
Revision no: x Date: DD.MM.YYYY
Well status: Eg. operational/temp. plugged etc.
Prepared: xxxxx (Name and signature)
Verified: xxxxx (Name and signature)
Well barrier elements Ref. WBEAC tables
Verification of barrier elements
PRIMARY - reservoir Cap rock 51 smin: x.xx sg EMW.
Method: XLOT/minifrac/field model
Liner cement 22 Length: xx mMD > res. Method: volume control/logs
Liner 2 PT: xxx bar with x.x sg
Liner top packer 43 PT: xxx bar with x.x sg
Formation at casing shoe n/a smin: x.xx sg EMW. Method: XLOT/minifrac/field model
Production casing cement * (shoe to prod.packer)
22 Length: xx mMD, shoe to prod.packer Method: volume control/logs and FIT/LOT to x.xx sg EMW at casing shoe
Production casing (below prod.packer)
2 PT: xxx bar with x.x sg
Production packer 7 IT: xxx bar (or PT: xxx bar with x.x sg)
Production tubing 25 PT: xxx bar with x.x sg
CIV 29 IT low: xxx bar, IT high: xxx bar
DHSV/Controllines 8 IT low: xxx bar , IT high: xxx bar
SECONDARY - reservoir Formation at prod.packer 51 smin: x.xx sg EMW.
Method: XLOT/minifrac/field model
Production casing cement * (above prod.packer)
22 Length: xx mMD > prod.packer Method: volume control/logs
Production casing (above prod.packer)
2 PT: xxx bar with x.x sg
Production casing hanger with seal assembly
5 PT: xxx bar with x.x sg
WH/Annulus valve 12 PT: xxx bar with x.x sg
Tubing hanger with seals 10 PT: xxx bar with x.x sg
WH/X-mas tree Connector 5 PT: xxx bar with x.x sg
Tubing hanger neck seal 10 PT: xxx bar with x.x sg
X-mas tree valves 33 PT: xxx bar with x.x sg
Noes:
Disp. no. well integrity issues
Comment
None
X-mas
tree
PWV
HMV
MMV
KV
SV
Surface
casing
Intermediate
casing
DHSV
Production
casing
PT
PT
PT
PI
PI
A B C
Cap Rock
Reservoir
CIV
Liner
18 5/8" csg
Xxx mTVD
13 3/8" csg
Xxx mTVD
9 5/8" csg
Xxx mTVD
7" liner
Xxx mTVD
Figure 34 Well barrier schematic for a well in the production phase

92
During the production phase the WBS will be quite different from when drilling/completing
the well. In this phase more equipment is installed down in the well and the X-mas tree is
present on the top of the well. Although more equipment is present for keeping the well under
control during production, most of the well integrity issues arise when the well is producing.
That is because the drilling and completion phase is a small part of the life of a well compared
to the production phase. Also in the production phase fluid flows through the well with
different temperatures, pressures and viscosity than what was used for drilling the well.
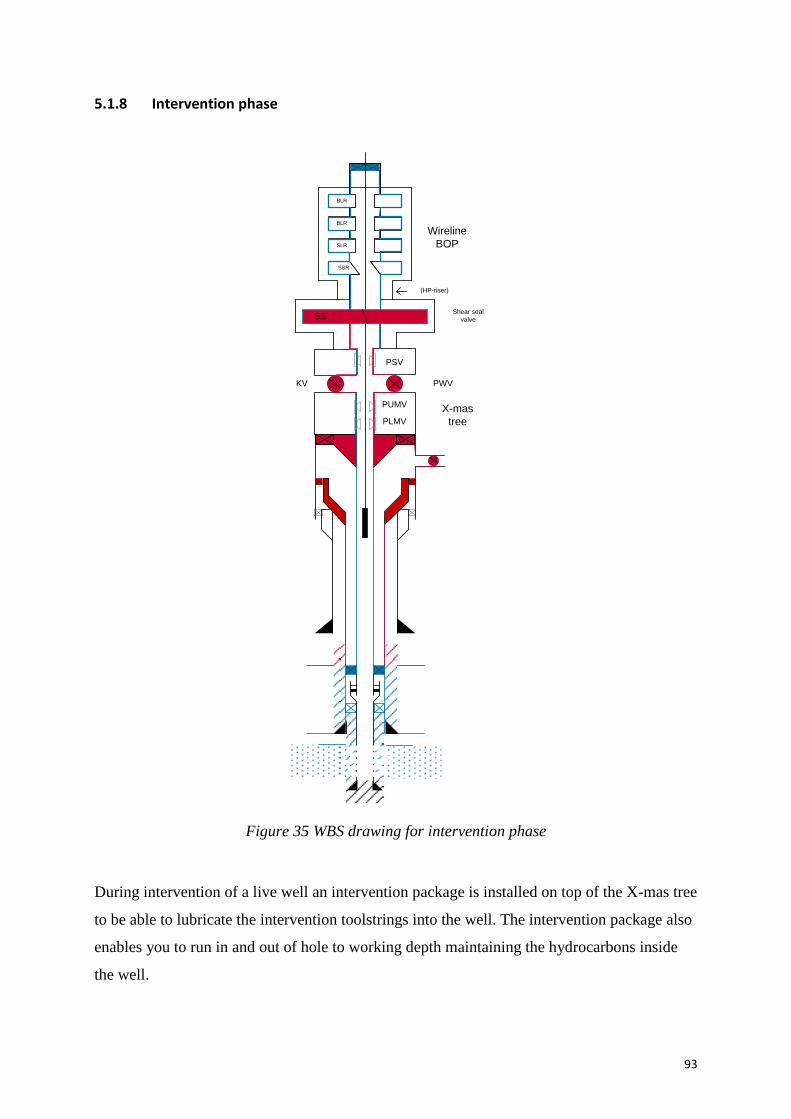
93
5.1.8 Intervention phase
X-mas
tree
PWV
(HP-riser)
Wireline
BOP
BLR
SLR
BLR
SSR
PUMV
PLMV
KV
PSV
BLR
SLR
BLR
SSR
SSShear seal
valve
Figure 35 WBS drawing for intervention phase
During intervention of a live well an intervention package is installed on top of the X-mas tree
to be able to lubricate the intervention toolstrings into the well. The intervention package also
enables you to run in and out of hole to working depth maintaining the hydrocarbons inside
the well.

94
The WBS for the well intervention utilizes most of the well barrier elements used for the
production phase but the primary barrier is extended into the well intervention package as the
downhole safety valve is out of function as a barrier if you have e.g. wireline cable or coiled
tubing across it.
Typical for a well intervention WBS is the number of common well barrier elements are
increasing due to the common elements in tubing hanger and the X-mas tree. It is very
important to perform a detailed risk assessment for the actual job and implement risk reducing
measures to reduce the risk to a minimum.
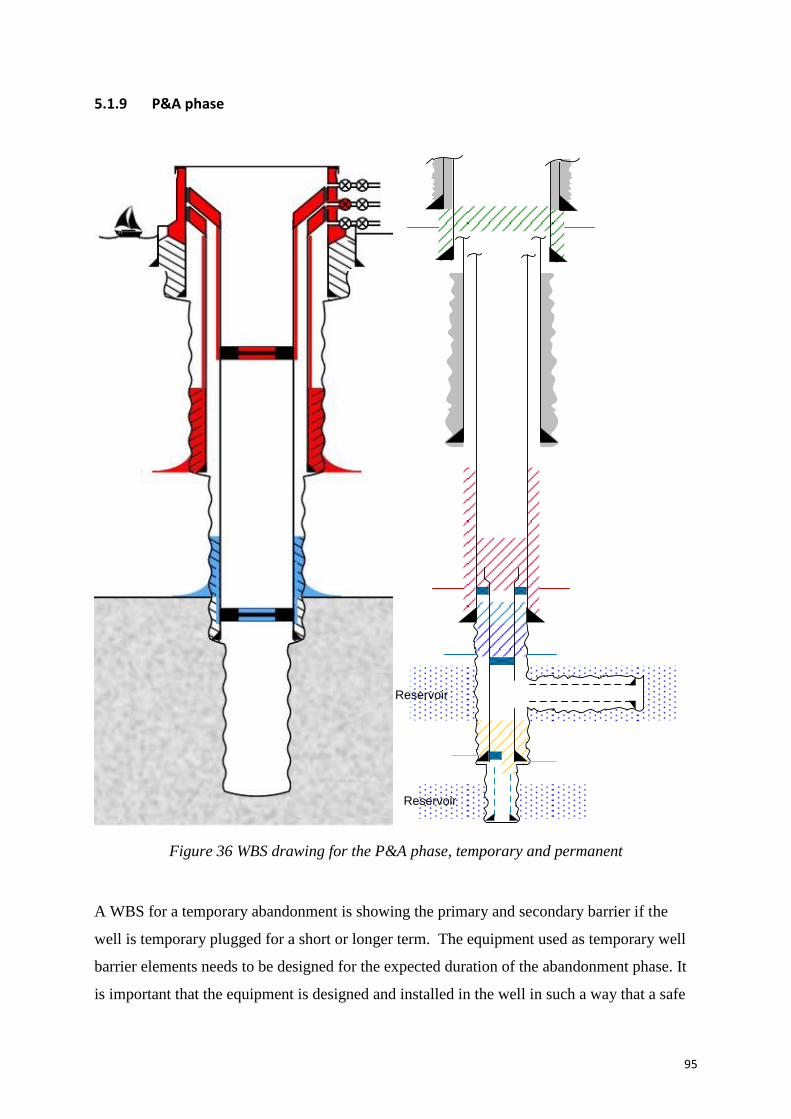
95
5.1.9 P&A phase
Reservoir
Reservoir
Figure 36 WBS drawing for the P&A phase, temporary and permanent
A WBS for a temporary abandonment is showing the primary and secondary barrier if the
well is temporary plugged for a short or longer term. The equipment used as temporary well
barrier elements needs to be designed for the expected duration of the abandonment phase. It
is important that the equipment is designed and installed in the well in such a way that a safe

96
re-entry is possible after the abandonment period. Qualified mechanical barriers are allowed
to be used as barrier elements for temporary abandonment.
A permanent abandonment differs from temporary abandonment as it has an eternal
perspective. Mechanical barrier elements are not allowed to be used as barrier elements alone
as they can degrade over time. Permanent well barriers as shown on the WBS shall be placed
as close to the source of inflow as possible and as a minimum at a depth which have sufficient
formation strength. It is important that the cement or alternative plugging material is covering
the full cross section of the well including all annuli and seal both vertically and horizontally.
As the wellhead and casings will be cut below seabed as a part of the permanent abandonment
it will be very difficult to re-enter the well afterwards
97
5.2 Barrier design, construction and qualification of barriers for life cycle
When the well is constructed it is important to focus on the well barriers for the whole well
life cycle. Therefore well barrier schematics illustrating the well barriers for the different life
cycle phases are to be developed for all the different phases. The drawings must also have
information about how the different well barrier elements will be tested and verified, and how
they will be monitored which is especially relevant for the operational phase.
NORSOK D-010 defines well integrity requirements for the different life cycle phases, and
also has a chapter with a well barrier acceptance criteria table for each of the typically well
barrier elements defining specific design, construction and monitoring requirements. The
tables also contain important references to existing standards to be used in addition.
A general and important principle for all barrier elements is that they are to be designed to
withstand all the possible loads they can be exerted to during the well lifecycle. For the
different load cases minimum design factors or other equivalent acceptance criteria are to be
pre-defined for:
Burst loads
Collapse loads
Axial loads
Tri-axial loads
5.2.1 MWDP or MSDP
In addition to verifying that the well is designed for the load cases, all well barrier elements
are to be pressure tested to the maximum pressure that the barrier elements may be exerted to
when a well kill operation is ongoing, or during injection (whichever is the highest pressure).
For control lines, the test pressure will be the highest possible operating pressure. For valves
the test pressure for closed valves will be the highest possible differential pressure.
For a well completed for operation, all the well barrier elements then need to be qualified for
the maximum well design pressure (MWDP). The MWDP is the same as the highest pressure
of the following:
98
Kill pressure. The kill pressure chosen is to be the highest possible kill pressure
needed. This means the highest possible wellhead shut-in pressure plus the additional
pressure needed to be able to kill the well. When calculating the highest possible shut-
in pressure it is important to calculate with the highest possible reservoir pressure
through the whole well lifecycle, and with the lightest fluid density (usually the
reservoir gas) filling the wellbore.
Injection pressure. This is to be the highest possible injection pressure that the
wellhead can be exerted to. If the compressors or pumps are able to feed very high
pressures, safety systems need to be implemented ensuring that there is a maximum
level that can be reached. The maximum injection pressure is then to be the highest
possible pressure after the PSV has opened. The PSV is a pressure safety valve that
will automatically open at a certain pressure level and start bleeding-off the pressure.
For a well that is drilled the term MSDP (Maximum section design pressure) is used. Each
well barrier element needs to be verified and tested to minimum MSDP before drilling out the
shoe and starting on a new section. For barrier elements that also are to be a part of the barrier
envelope for a well in production, the barrier elements will be tested to MWDP before drilling
out the shoe. The MSDP will be the highest possible pressure the barrier elements will be
exerted to if a kick occurs and killing of the well is needed. In the drilling phase it is not
possible to have sufficient formation strength for a gas filled hole and kill margin for all the
sections, and for these sections it is therefore crucial to detect the kick as early as possible and
within the calculated kick margin to avoid a possible underground blowout.
5.3 Description of typical barrier elements and important qualification issues
In this section the focus will only be on some of the typical well barrier elements that are
important in the operational phase and permanent plug and abandonment phase.
5.3.1 Formation
In most all barrier envelope drawings you will see that the formation is part of the envelope.
Not all formations are necessarily suitable for this purpose. In order to use the formation as

99
part of the barrier envelope it is important that it will not allow gas or fluids to percolate
through within the time span it is used as part of the barrier. This means that the formation
property must be (for its purpose) impermeable and not contain vertical, open fractures or
faults across the sealing interval.
There is general consensus in the oil industry that we have two different scenarios where two
different requirements to formation integrity apply.
1. You have access to the well and you can observe the pressure behavior, typically in
the drilling phase.
2. You have no ready access to the well and may not be able to monitor all pressure
changes, typically in the production / injection phase.
During (1) you can act on demand and to some extent manipulate the downhole conditions,
through changing the wellbore pressure, adding particles or chemicals, changing temperature
conditions etc. Therefore somewhat loosely defined terms like “Fracture Pressure / Fracture
gradient” are used to address the formation integrity. In this context it basically means the
wellbore pressure you think the wellbore wall can withstand without breaking down and
creating a loss situation.
Where the well is not easily accessible or you may not be able to monitor changes in the
situation as in (2) you need to be more precise about how you define the formation integrity.
The minimum formation stress as the fundamental formation integrity together with the
formation properties are therefore the safest to use. In this case the formation will not allow
undetected leaks of reservoir fluids to develop into uncontrolled underground migration of
reservoir fluids.
Information about the minimum formation stress is gained through extended leak off tests.
Field models may be used if sufficient data are obtained for the field.
The minimum formation stress will as a minimum need to be the same or higher than the
reservoir pressure or any higher well pressure. For injection wells, the injection pressure will
also need to be considered to avoid any out of zone injection.

100
Figure 37: Example of leak to seabed due to injection pressure being higher than the re-
opening pressure of deep faults, allowing faults to propagate to the seafloor
Formation replacing casing cement
The formation may also in some cases replace casing cement as barrier element. It is a well-
established fact that some rock has the ability to creep, due to their plastic properties. The best
known example is deeply buried rock salt, but also other formations, like clay, has this
property.
The plastic properties allow clay to creep into the wellbore where it is no longer held back by
the pressure exerted by the mud column. Over time the formation may bond onto the casing
and form a barrier against flow outside the casing.
Clay as barrier material has some benefits compared with cement: It is natural part of the
succession, it is inert to chemical corrosion and it is ductile.
101
If you need a barrier and for some reason casing cement is not present, formation creep may
provide you with a good alternative. However, this is only possible if you are able to prove
bonding and pressure integrity.
Confirmation of formation barrier replacing casing cement:
The interval must have a formation stress higher than the pressure it can be exposed
to, which typically is the extrapolated reservoir pressure.
The same requirement as for cement applies for the interval length of bonded
formation.
Two independent logging tools must be run inside the casing and both verify the
formation bonds against the casing. At present a cement bond log (CBL) and a sonic
tool (USIT) have been the preferred logging tools.
If the logged response is indicative of bonding formation, then a pressure test through
perforation might be required. This could possibly be done by testing the logging
response for all new formations with a LOT through a perforation at least 5 m above
the base of the bonded interval. The stable pressure during the shut-in phase of the
LOT must be above the required pressure the barrier is to withhold.
5.3.2 Casing Cement
Casing cement used as a well barrier is an extremely important well barrier element as this
has to act as a well barrier element throughout the operational phase and later when the well is
permanently plugged and abandoned. In order to ensure integrity it is crucial that the cement
is bonding to the formation with integrity, as well as to the casing. To verify that the cement is
bonding to the casing without channels, two logging tools are needed. These tools are
typically cement bond log (CBL) and a sonic tool (USIT). For wells that are permanently
abandoned it is important that such logging is performed to verify the integrity before the
inside cement plug is set for permanent abandonment. For wells in operation it is critical to
log the cement if the casing cement is acting as both the primary and secondary barrier, due to
the fact that a pressure test of the cement will not verify the integrity of the cement except at
the csg shoe depth, ref Figure 38. The distance between the primary and secondary barrier
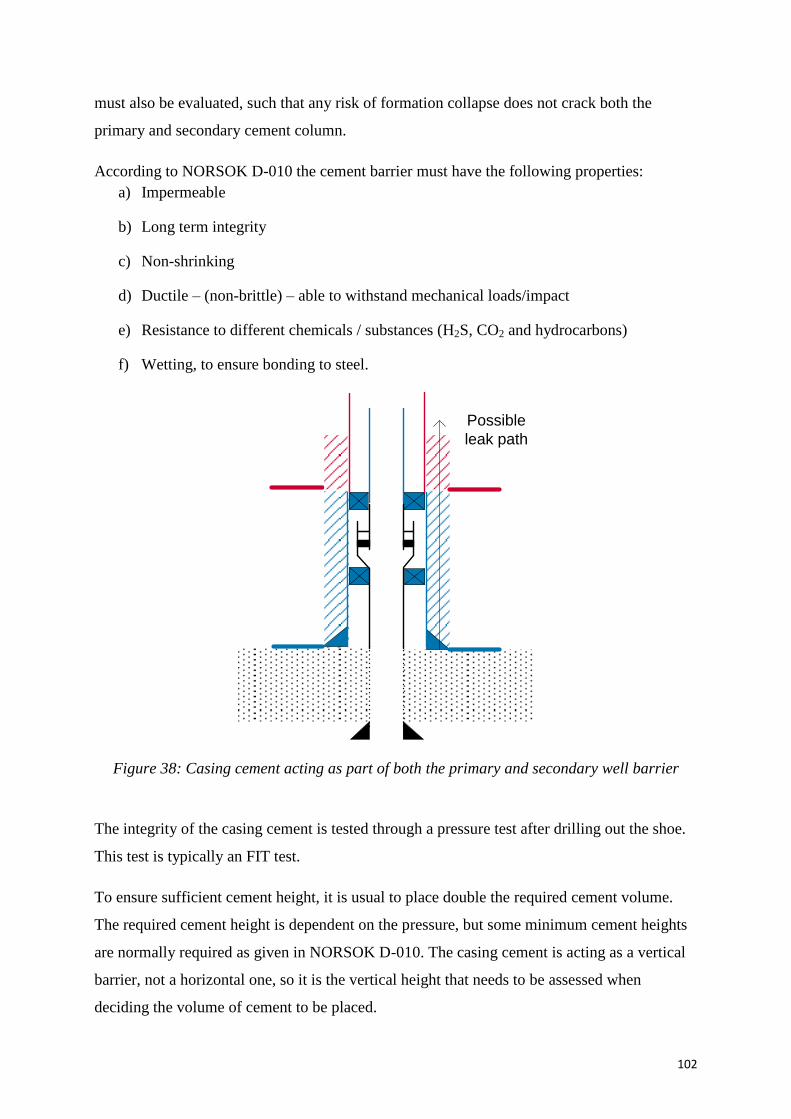
102
must also be evaluated, such that any risk of formation collapse does not crack both the
primary and secondary cement column.
According to NORSOK D-010 the cement barrier must have the following properties:
a) Impermeable
b) Long term integrity
c) Non-shrinking
d) Ductile – (non-brittle) – able to withstand mechanical loads/impact
e) Resistance to different chemicals / substances (H2S, CO2 and hydrocarbons)
f) Wetting, to ensure bonding to steel.
Possible
leak path
Figure 38: Casing cement acting as part of both the primary and secondary well barrier
The integrity of the casing cement is tested through a pressure test after drilling out the shoe.
This test is typically an FIT test.
To ensure sufficient cement height, it is usual to place double the required cement volume.
The required cement height is dependent on the pressure, but some minimum cement heights
are normally required as given in NORSOK D-010. The casing cement is acting as a vertical
barrier, not a horizontal one, so it is the vertical height that needs to be assessed when
deciding the volume of cement to be placed.
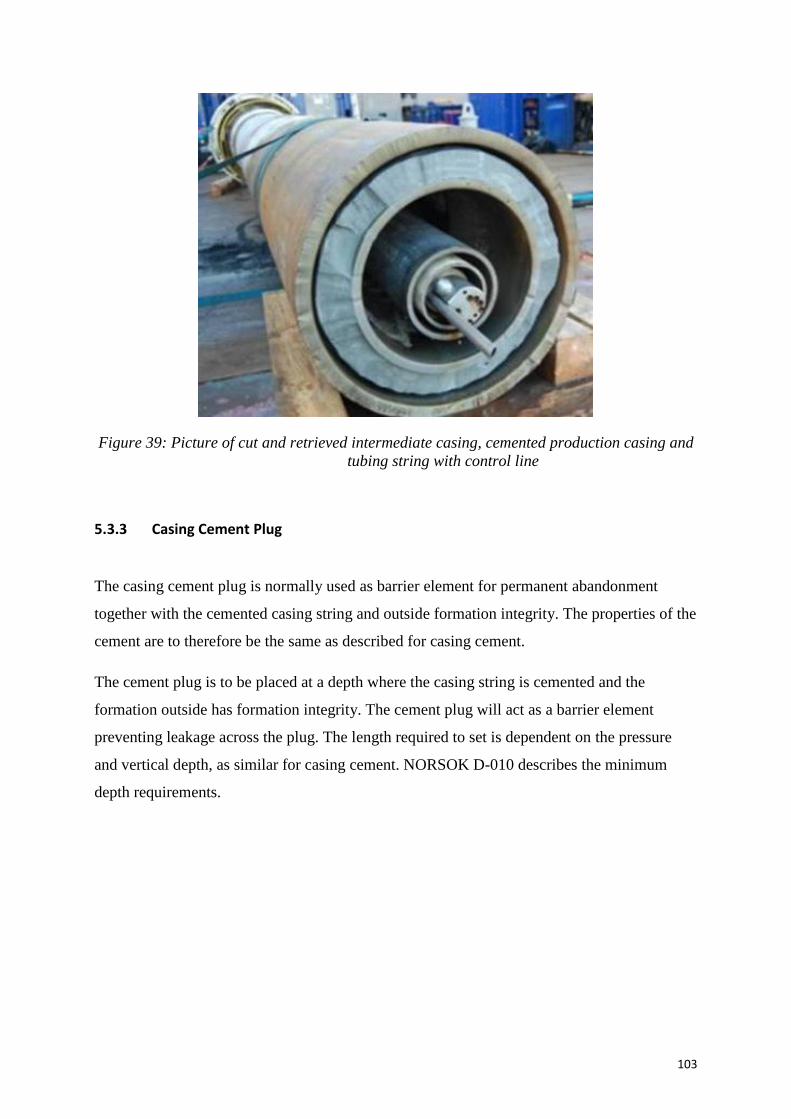
103
Figure 39: Picture of cut and retrieved intermediate casing, cemented production casing and
tubing string with control line
5.3.3 Casing Cement Plug
The casing cement plug is normally used as barrier element for permanent abandonment
together with the cemented casing string and outside formation integrity. The properties of the
cement are to therefore be the same as described for casing cement.
The cement plug is to be placed at a depth where the casing string is cemented and the
formation outside has formation integrity. The cement plug will act as a barrier element
preventing leakage across the plug. The length required to set is dependent on the pressure
and vertical depth, as similar for casing cement. NORSOK D-010 describes the minimum
depth requirements.
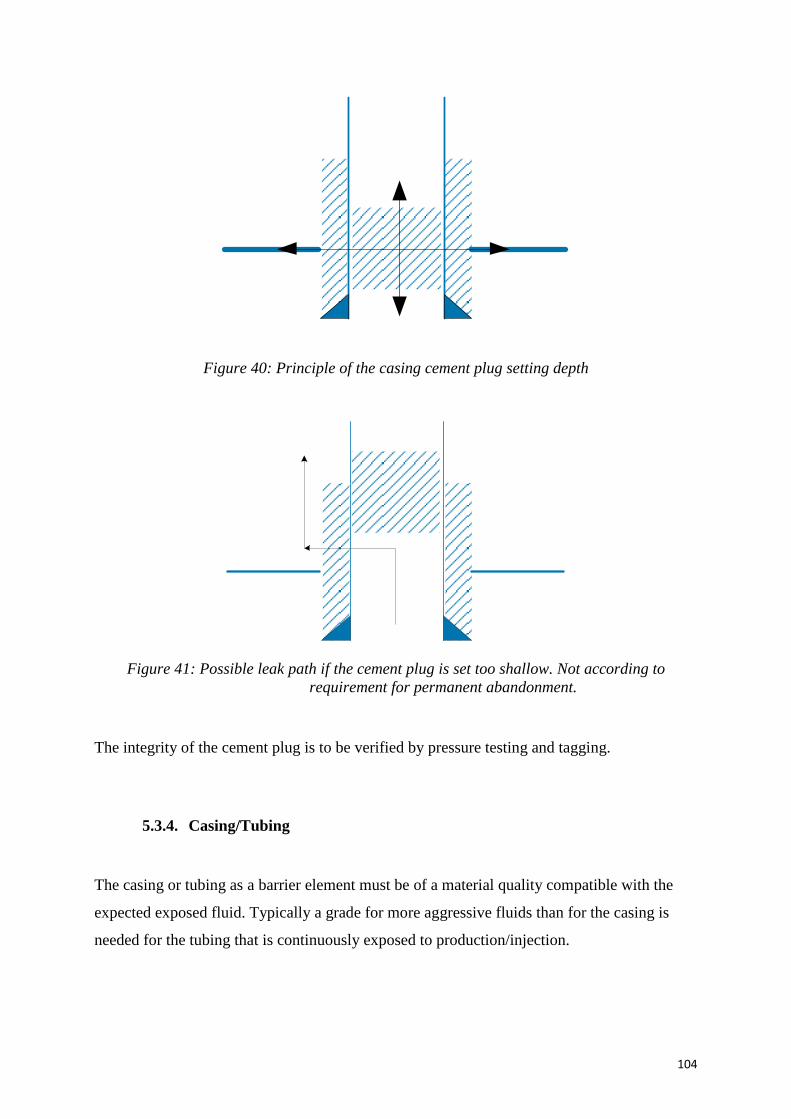
104
Figure 40: Principle of the casing cement plug setting depth
Figure 41: Possible leak path if the cement plug is set too shallow. Not according to
requirement for permanent abandonment.
The integrity of the cement plug is to be verified by pressure testing and tagging.
5.3.4. Casing/Tubing
The casing or tubing as a barrier element must be of a material quality compatible with the
expected exposed fluid. Typically a grade for more aggressive fluids than for the casing is
needed for the tubing that is continuously exposed to production/injection.
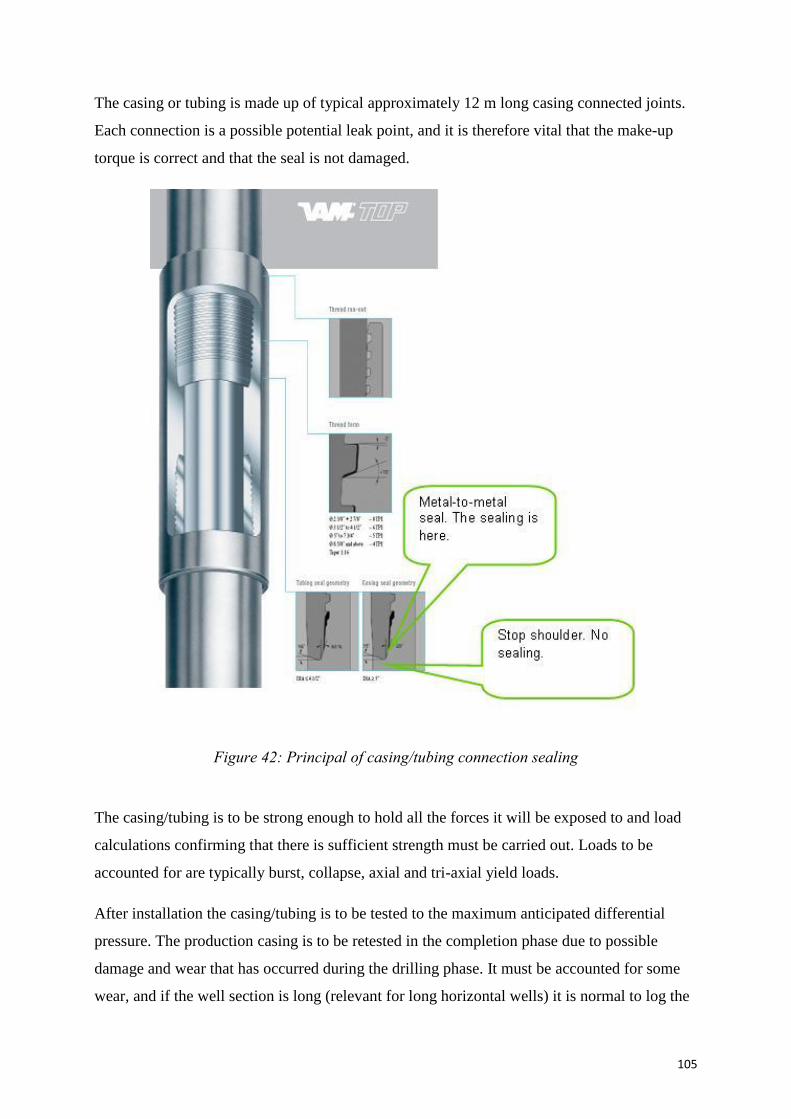
105
The casing or tubing is made up of typical approximately 12 m long casing connected joints.
Each connection is a possible potential leak point, and it is therefore vital that the make-up
torque is correct and that the seal is not damaged.
Figure 42: Principal of casing/tubing connection sealing
The casing/tubing is to be strong enough to hold all the forces it will be exposed to and load
calculations confirming that there is sufficient strength must be carried out. Loads to be
accounted for are typically burst, collapse, axial and tri-axial yield loads.
After installation the casing/tubing is to be tested to the maximum anticipated differential
pressure. The production casing is to be retested in the completion phase due to possible
damage and wear that has occurred during the drilling phase. It must be accounted for some
wear, and if the well section is long (relevant for long horizontal wells) it is normal to log the
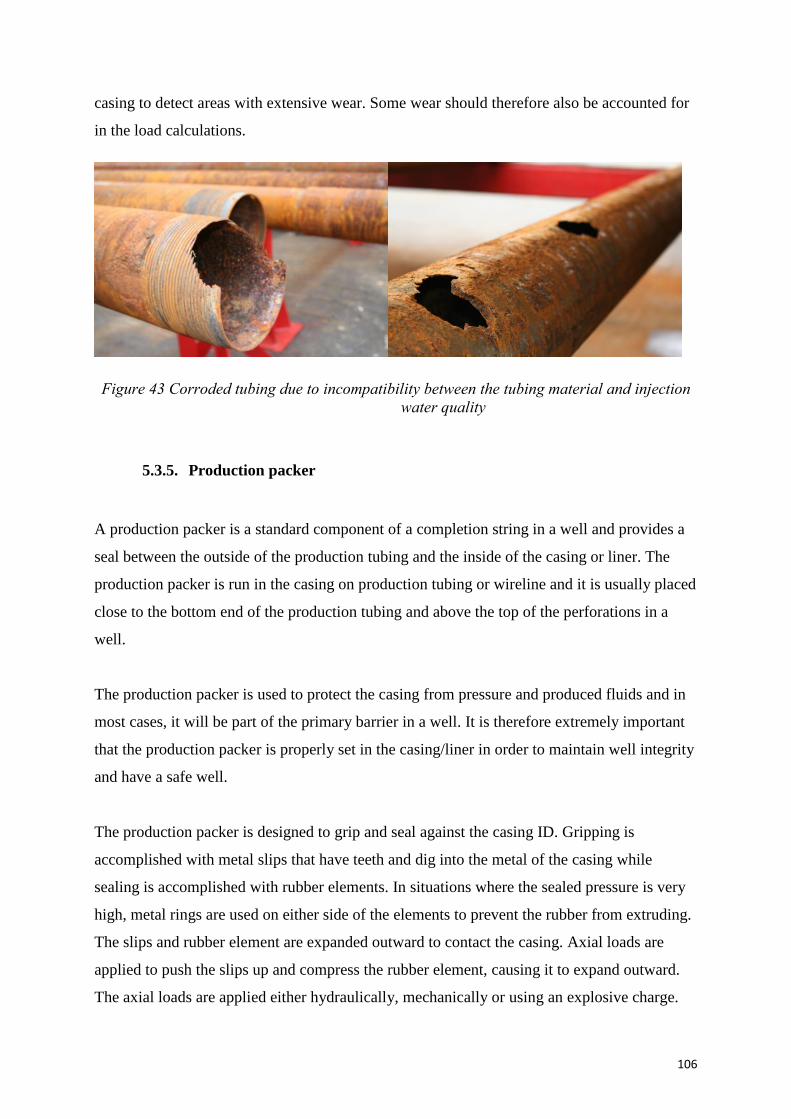
106
casing to detect areas with extensive wear. Some wear should therefore also be accounted for
in the load calculations.
Figure 43 Corroded tubing due to incompatibility between the tubing material and injection
water quality
5.3.5. Production packer
A production packer is a standard component of a completion string in a well and provides a
seal between the outside of the production tubing and the inside of the casing or liner. The
production packer is run in the casing on production tubing or wireline and it is usually placed
close to the bottom end of the production tubing and above the top of the perforations in a
well.
The production packer is used to protect the casing from pressure and produced fluids and in
most cases, it will be part of the primary barrier in a well. It is therefore extremely important
that the production packer is properly set in the casing/liner in order to maintain well integrity
and have a safe well.
The production packer is designed to grip and seal against the casing ID. Gripping is
accomplished with metal slips that have teeth and dig into the metal of the casing while
sealing is accomplished with rubber elements. In situations where the sealed pressure is very
high, metal rings are used on either side of the elements to prevent the rubber from extruding.
The slips and rubber element are expanded outward to contact the casing. Axial loads are
applied to push the slips up and compress the rubber element, causing it to expand outward.
The axial loads are applied either hydraulically, mechanically or using an explosive charge.
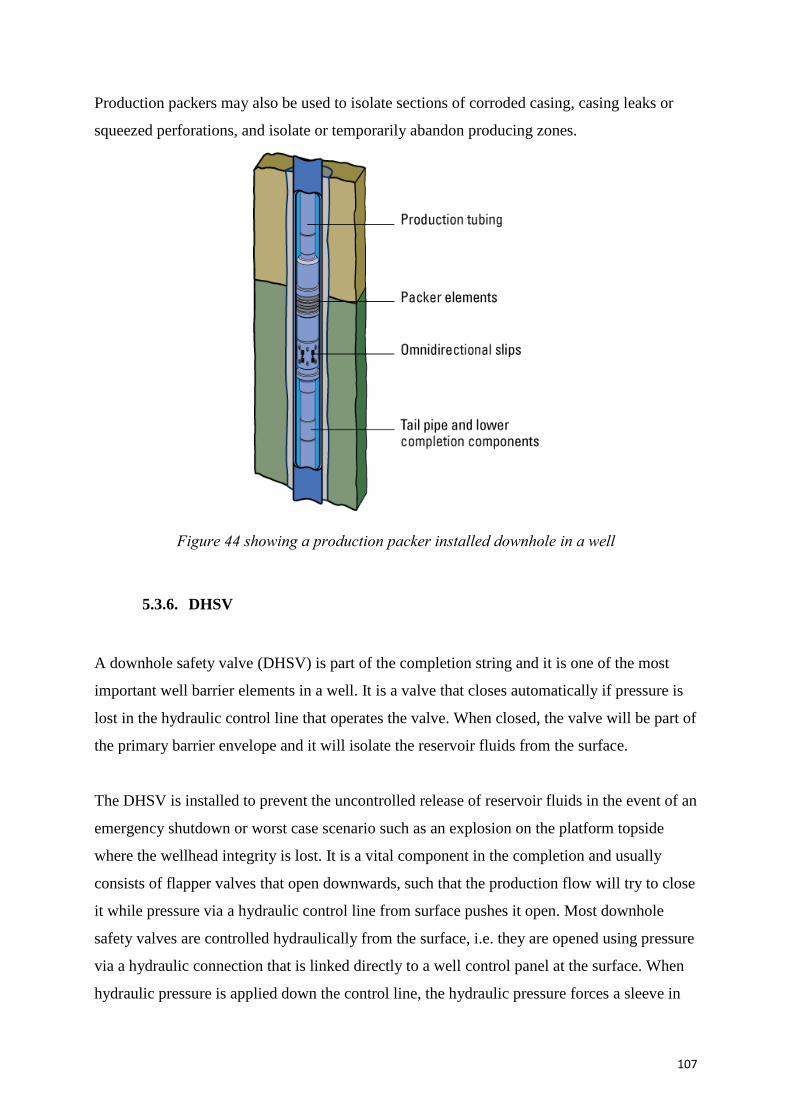
107
Production packers may also be used to isolate sections of corroded casing, casing leaks or
squeezed perforations, and isolate or temporarily abandon producing zones.
Figure 44 showing a production packer installed downhole in a well
5.3.6. DHSV
A downhole safety valve (DHSV) is part of the completion string and it is one of the most
important well barrier elements in a well. It is a valve that closes automatically if pressure is
lost in the hydraulic control line that operates the valve. When closed, the valve will be part of
the primary barrier envelope and it will isolate the reservoir fluids from the surface.
The DHSV is installed to prevent the uncontrolled release of reservoir fluids in the event of an
emergency shutdown or worst case scenario such as an explosion on the platform topside
where the wellhead integrity is lost. It is a vital component in the completion and usually
consists of flapper valves that open downwards, such that the production flow will try to close
it while pressure via a hydraulic control line from surface pushes it open. Most downhole
safety valves are controlled hydraulically from the surface, i.e. they are opened using pressure
via a hydraulic connection that is linked directly to a well control panel at the surface. When
hydraulic pressure is applied down the control line, the hydraulic pressure forces a sleeve in
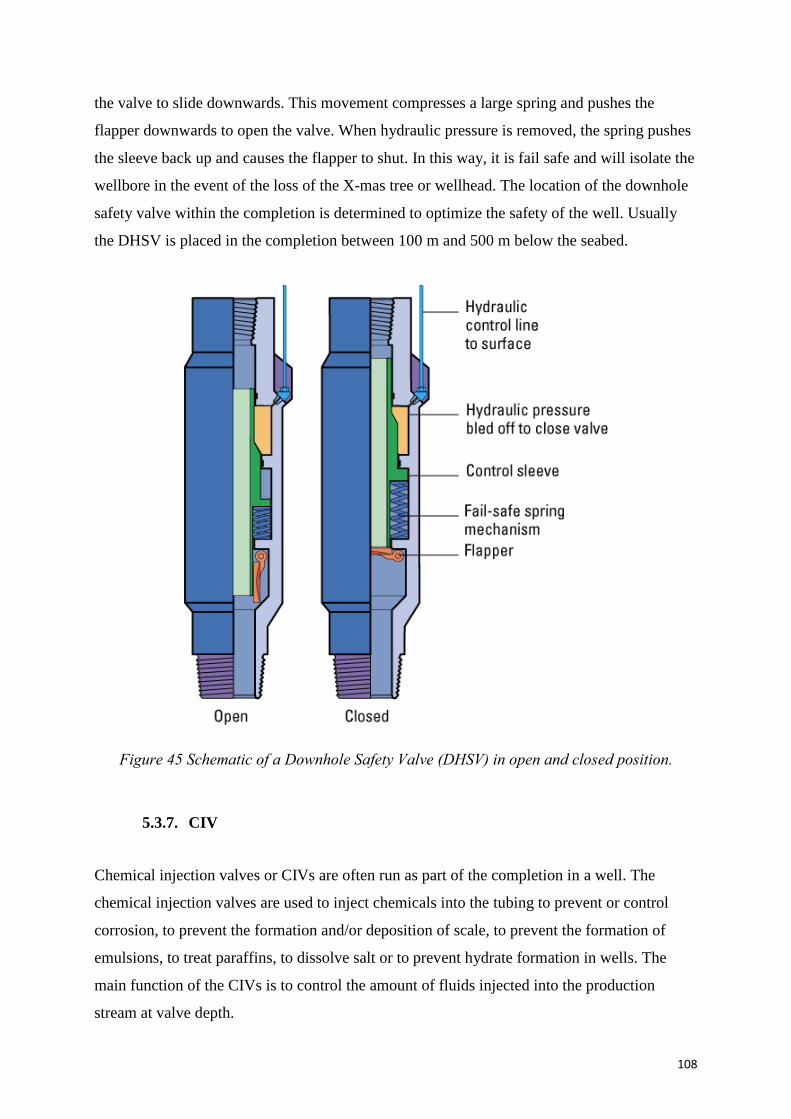
108
the valve to slide downwards. This movement compresses a large spring and pushes the
flapper downwards to open the valve. When hydraulic pressure is removed, the spring pushes
the sleeve back up and causes the flapper to shut. In this way, it is fail safe and will isolate the
wellbore in the event of the loss of the X-mas tree or wellhead. The location of the downhole
safety valve within the completion is determined to optimize the safety of the well. Usually
the DHSV is placed in the completion between 100 m and 500 m below the seabed.
Figure 45 Schematic of a Downhole Safety Valve (DHSV) in open and closed position.
5.3.7. CIV
Chemical injection valves or CIVs are often run as part of the completion in a well. The
chemical injection valves are used to inject chemicals into the tubing to prevent or control
corrosion, to prevent the formation and/or deposition of scale, to prevent the formation of
emulsions, to treat paraffins, to dissolve salt or to prevent hydrate formation in wells. The
main function of the CIVs is to control the amount of fluids injected into the production
stream at valve depth.
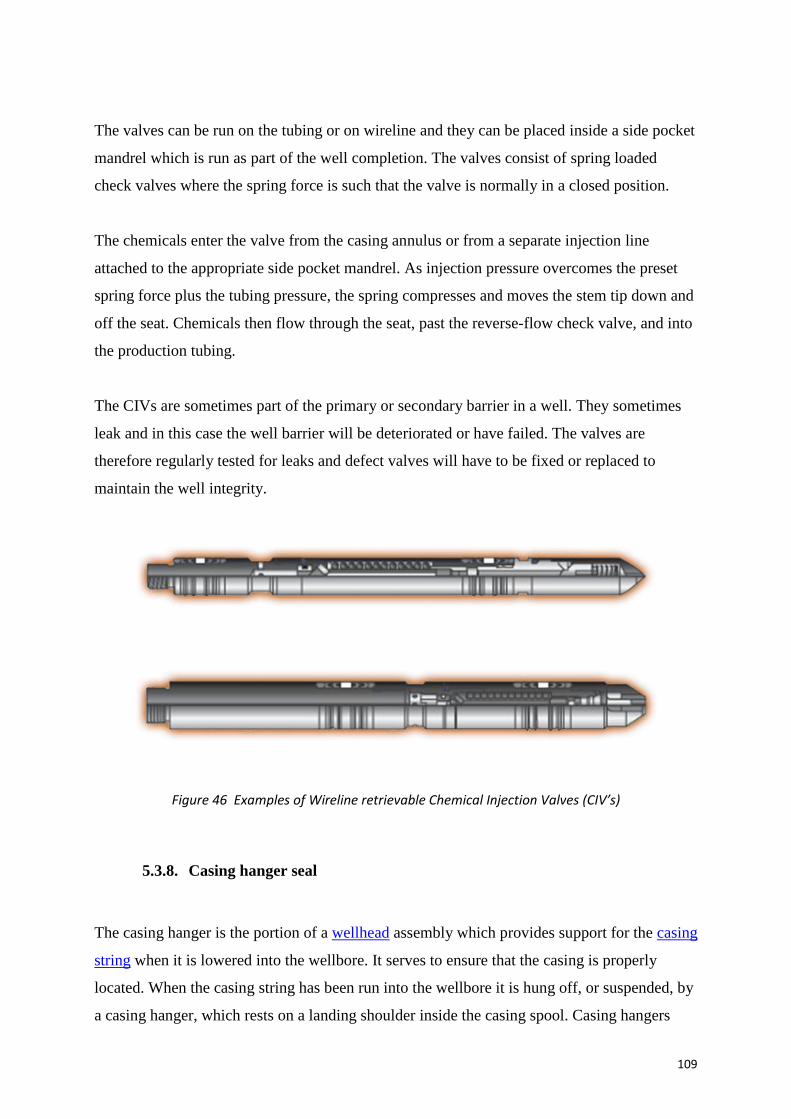
109
The valves can be run on the tubing or on wireline and they can be placed inside a side pocket
mandrel which is run as part of the well completion. The valves consist of spring loaded
check valves where the spring force is such that the valve is normally in a closed position.
The chemicals enter the valve from the casing annulus or from a separate injection line
attached to the appropriate side pocket mandrel. As injection pressure overcomes the preset
spring force plus the tubing pressure, the spring compresses and moves the stem tip down and
off the seat. Chemicals then flow through the seat, past the reverse-flow check valve, and into
the production tubing.
The CIVs are sometimes part of the primary or secondary barrier in a well. They sometimes
leak and in this case the well barrier will be deteriorated or have failed. The valves are
therefore regularly tested for leaks and defect valves will have to be fixed or replaced to
maintain the well integrity.
Figure 46 Examples of Wireline retrievable Chemical Injection Valves (CIV’s)
5.3.8. Casing hanger seal
The casing hanger is the portion of a wellhead assembly which provides support for the casing
string when it is lowered into the wellbore. It serves to ensure that the casing is properly
located. When the casing string has been run into the wellbore it is hung off, or suspended, by
a casing hanger, which rests on a landing shoulder inside the casing spool. Casing hangers
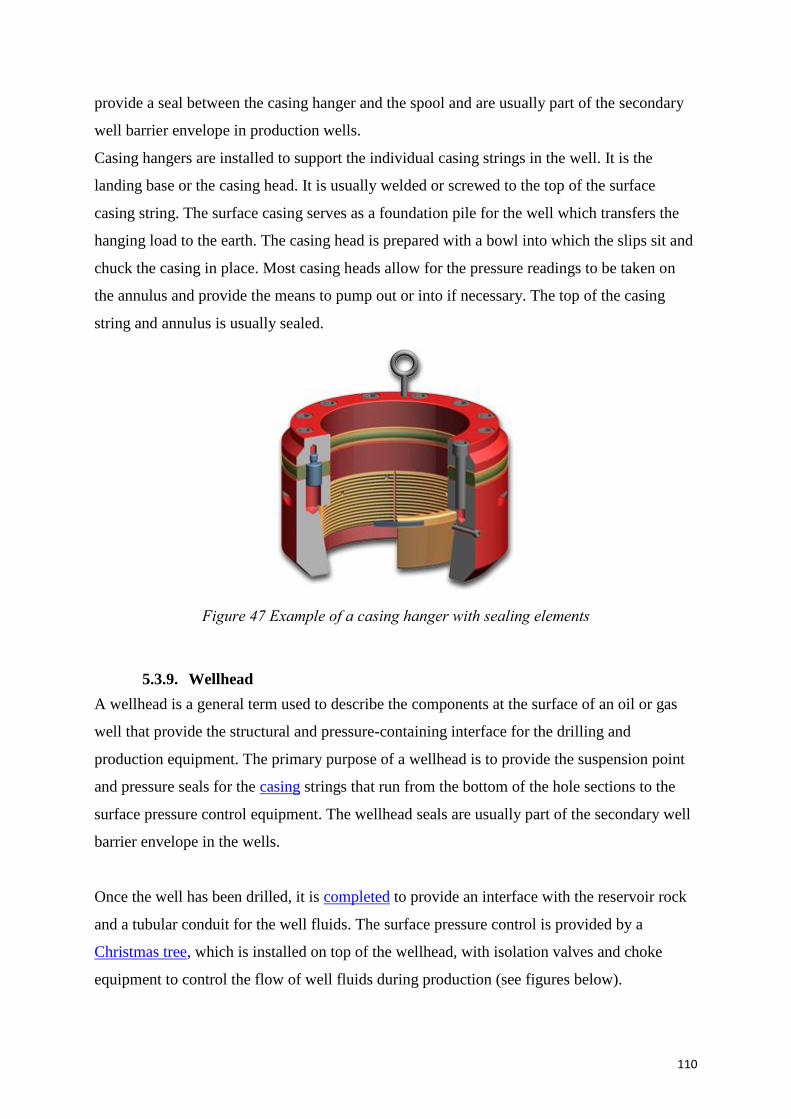
110
provide a seal between the casing hanger and the spool and are usually part of the secondary
well barrier envelope in production wells.
Casing hangers are installed to support the individual casing strings in the well. It is the
landing base or the casing head. It is usually welded or screwed to the top of the surface
casing string. The surface casing serves as a foundation pile for the well which transfers the
hanging load to the earth. The casing head is prepared with a bowl into which the slips sit and
chuck the casing in place. Most casing heads allow for the pressure readings to be taken on
the annulus and provide the means to pump out or into if necessary. The top of the casing
string and annulus is usually sealed.
Figure 47 Example of a casing hanger with sealing elements
5.3.9. Wellhead
A wellhead is a general term used to describe the components at the surface of an oil or gas
well that provide the structural and pressure-containing interface for the drilling and
production equipment. The primary purpose of a wellhead is to provide the suspension point
and pressure seals for the casing strings that run from the bottom of the hole sections to the
surface pressure control equipment. The wellhead seals are usually part of the secondary well
barrier envelope in the wells.
Once the well has been drilled, it is completed to provide an interface with the reservoir rock
and a tubular conduit for the well fluids. The surface pressure control is provided by a
Christmas tree, which is installed on top of the wellhead, with isolation valves and choke
equipment to control the flow of well fluids during production (see figures below).
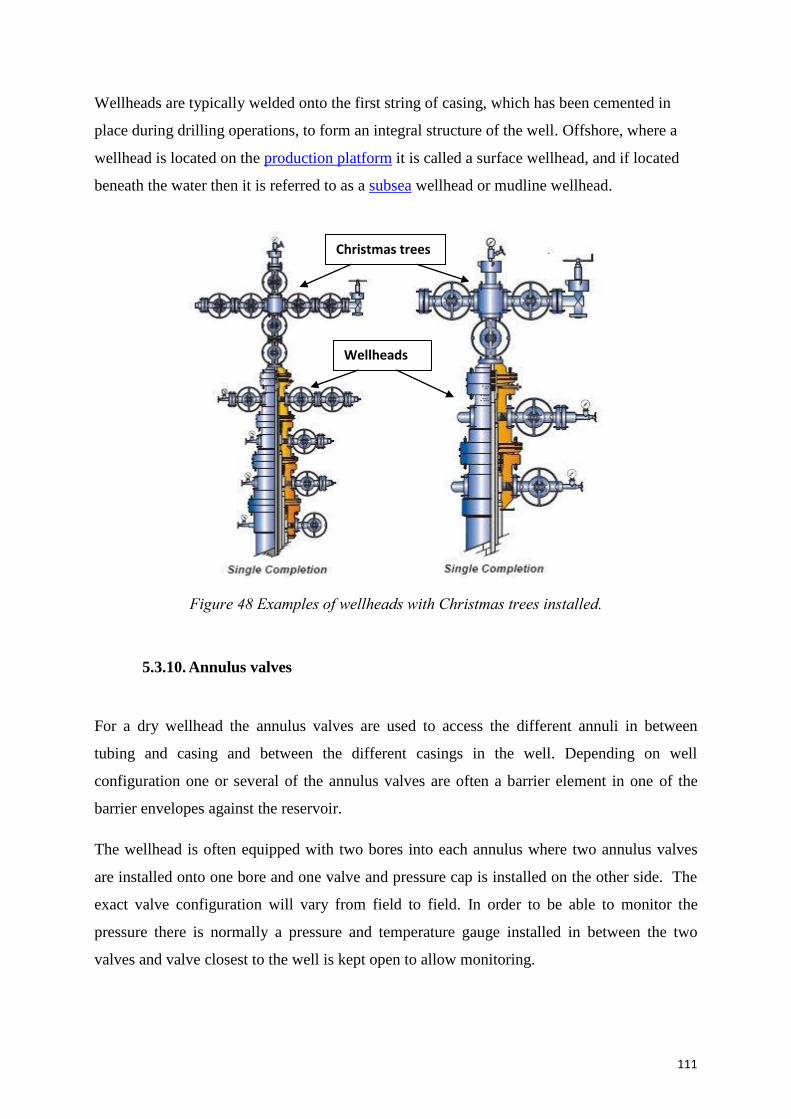
111
Wellheads are typically welded onto the first string of casing, which has been cemented in
place during drilling operations, to form an integral structure of the well. Offshore, where a
wellhead is located on the production platform it is called a surface wellhead, and if located
beneath the water then it is referred to as a subsea wellhead or mudline wellhead.
Figure 48 Examples of wellheads with Christmas trees installed.
5.3.10. Annulus valves
For a dry wellhead the annulus valves are used to access the different annuli in between
tubing and casing and between the different casings in the well. Depending on well
configuration one or several of the annulus valves are often a barrier element in one of the
barrier envelopes against the reservoir.
The wellhead is often equipped with two bores into each annulus where two annulus valves
are installed onto one bore and one valve and pressure cap is installed on the other side. The
exact valve configuration will vary from field to field. In order to be able to monitor the
pressure there is normally a pressure and temperature gauge installed in between the two
valves and valve closest to the well is kept open to allow monitoring.
Christmas trees
Wellheads
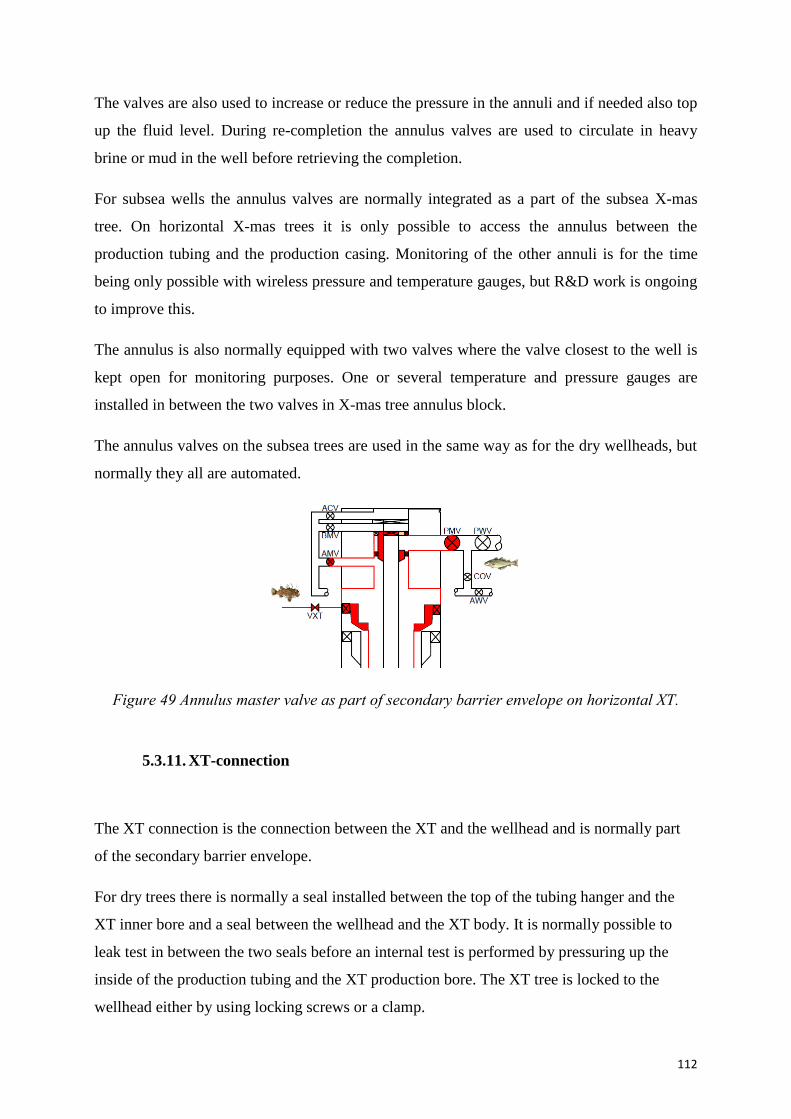
112
The valves are also used to increase or reduce the pressure in the annuli and if needed also top
up the fluid level. During re-completion the annulus valves are used to circulate in heavy
brine or mud in the well before retrieving the completion.
For subsea wells the annulus valves are normally integrated as a part of the subsea X-mas
tree. On horizontal X-mas trees it is only possible to access the annulus between the
production tubing and the production casing. Monitoring of the other annuli is for the time
being only possible with wireless pressure and temperature gauges, but R&D work is ongoing
to improve this.
The annulus is also normally equipped with two valves where the valve closest to the well is
kept open for monitoring purposes. One or several temperature and pressure gauges are
installed in between the two valves in X-mas tree annulus block.
The annulus valves on the subsea trees are used in the same way as for the dry wellheads, but
normally they all are automated.
Figure 49 Annulus master valve as part of secondary barrier envelope on horizontal XT.
5.3.11. XT-connection
The XT connection is the connection between the XT and the wellhead and is normally part
of the secondary barrier envelope.
For dry trees there is normally a seal installed between the top of the tubing hanger and the
XT inner bore and a seal between the wellhead and the XT body. It is normally possible to
leak test in between the two seals before an internal test is performed by pressuring up the
inside of the production tubing and the XT production bore. The XT tree is locked to the
wellhead either by using locking screws or a clamp.
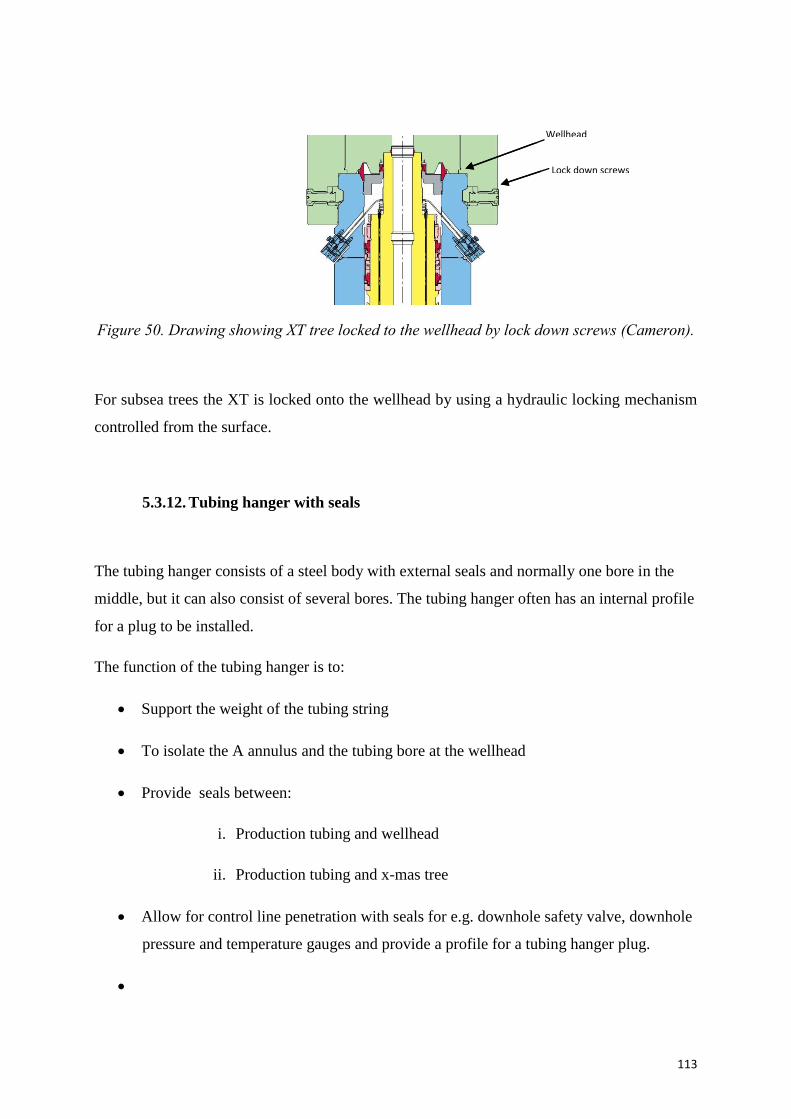
113
Figure 50. Drawing showing XT tree locked to the wellhead by lock down screws (Cameron).
For subsea trees the XT is locked onto the wellhead by using a hydraulic locking mechanism
controlled from the surface.
5.3.12. Tubing hanger with seals
The tubing hanger consists of a steel body with external seals and normally one bore in the
middle, but it can also consist of several bores. The tubing hanger often has an internal profile
for a plug to be installed.
The function of the tubing hanger is to:
Support the weight of the tubing string
To isolate the A annulus and the tubing bore at the wellhead
Provide seals between:
i. Production tubing and wellhead
ii. Production tubing and x-mas tree
Allow for control line penetration with seals for e.g. downhole safety valve, downhole
pressure and temperature gauges and provide a profile for a tubing hanger plug.
Wellhead
Lock down screws
crews
Wellhead
Lock down screws
crews
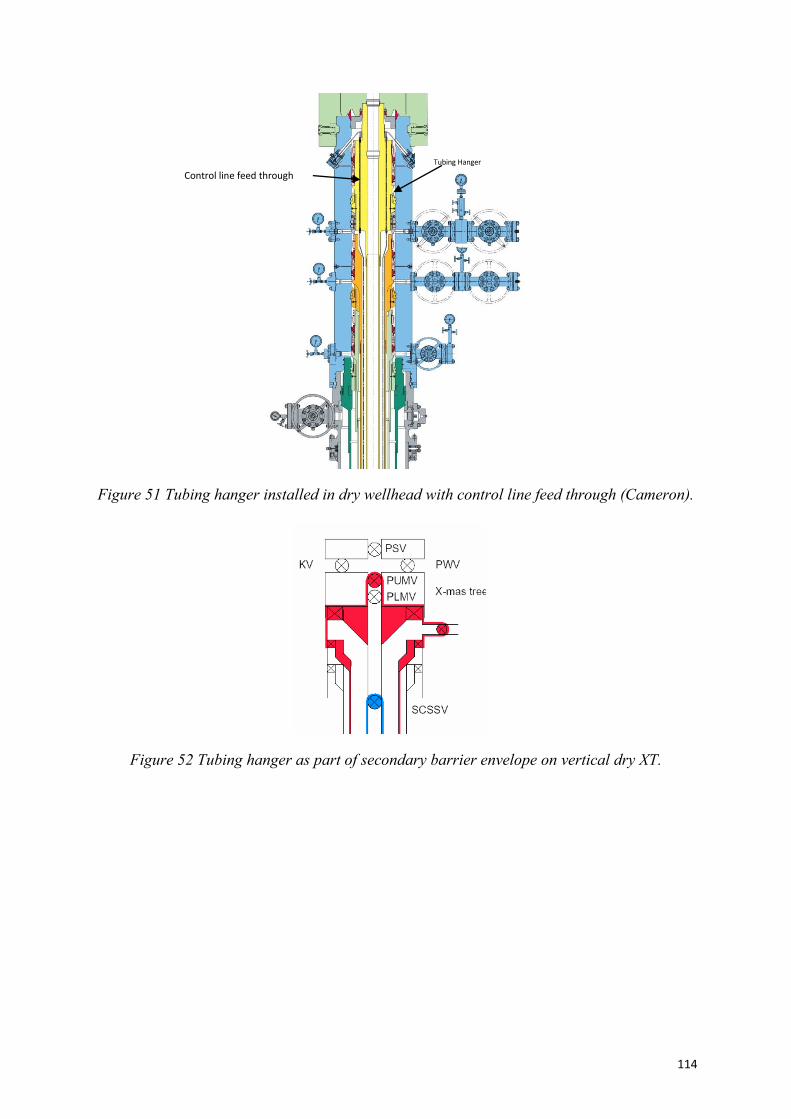
114
Figure 51 Tubing hanger installed in dry wellhead with control line feed through (Cameron).
Figure 52 Tubing hanger as part of secondary barrier envelope on vertical dry XT.
Tubing Hanger
Control line feed through
crews
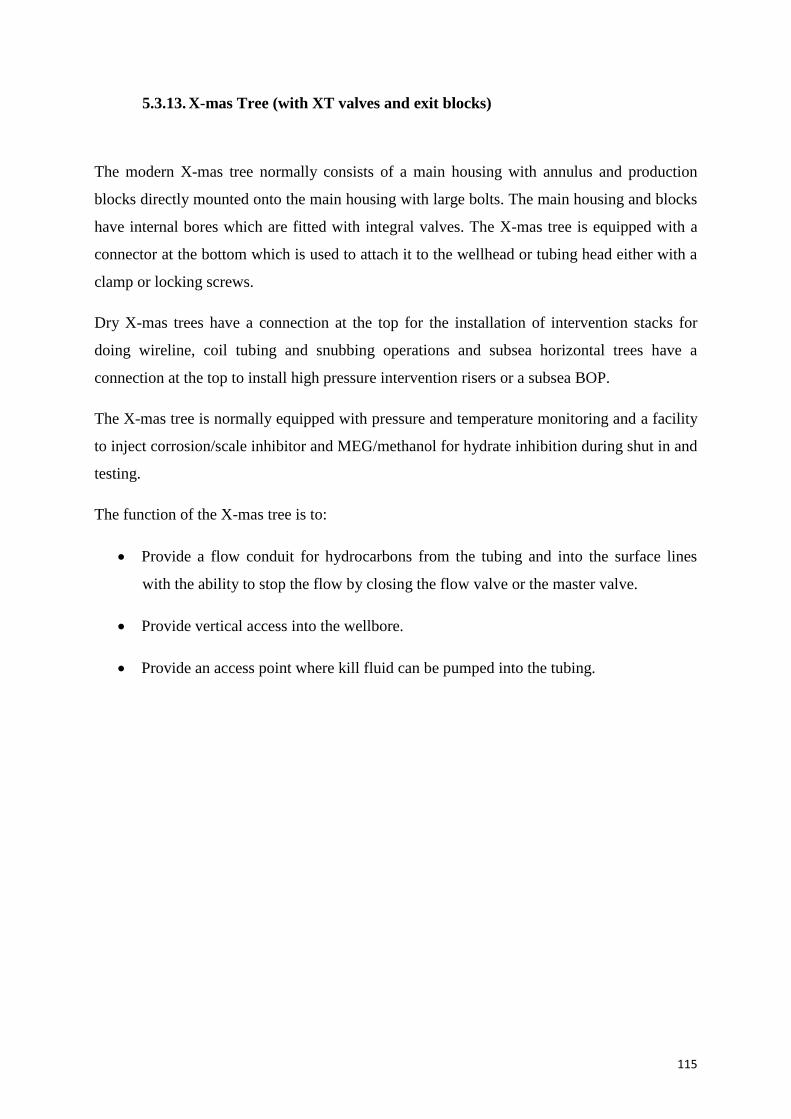
115
5.3.13. X-mas Tree (with XT valves and exit blocks)
The modern X-mas tree normally consists of a main housing with annulus and production
blocks directly mounted onto the main housing with large bolts. The main housing and blocks
have internal bores which are fitted with integral valves. The X-mas tree is equipped with a
connector at the bottom which is used to attach it to the wellhead or tubing head either with a
clamp or locking screws.
Dry X-mas trees have a connection at the top for the installation of intervention stacks for
doing wireline, coil tubing and snubbing operations and subsea horizontal trees have a
connection at the top to install high pressure intervention risers or a subsea BOP.
The X-mas tree is normally equipped with pressure and temperature monitoring and a facility
to inject corrosion/scale inhibitor and MEG/methanol for hydrate inhibition during shut in and
testing.
The function of the X-mas tree is to:
Provide a flow conduit for hydrocarbons from the tubing and into the surface lines
with the ability to stop the flow by closing the flow valve or the master valve.
Provide vertical access into the wellbore.
Provide an access point where kill fluid can be pumped into the tubing.
116
Figure 53 Different types of dry X-mas trees (Cameron).
Figure 54 X-mas tree and production upper master valve as part of secondary barrier
envelope on vertical dry XT.
6. Operational
6.1. General
The status of well barriers is to be known by monitoring the individual Well Barrier Elements
(WBE) of the Well Barrier Envelopes during the production life of the well.
Well barrier integrity is commonly monitored by registration of annulus pressure and
frequent leak testing of well barrier elements.
117
The following requirements have been specified in NORSOK D-010:
a) Downhole safety valves, production tree valves and annulus valves shall be regularly
leak tested. Leak test acceptance criteria shall be established and be available.
b) The pressure in all accessible annuli (A, B and/or C annuli) shall be monitored and
maintained within minimum and maximum pressure range limits as defined in the
completion design and presented in the hand-over or other relevant field
documentation for the well.
c) Registered anomalies shall be investigated to determine the source of anomaly and if
relevant, quantify any leak rate across the well barrier.
d) Upon confirmation of loss of the defined well barrier, the production or injection shall
be suspended and shall not re-commence before the well barrier or an alternative well
barrier re-established
Individual well barrier elements are to be regularly function and leak tested in accordance
with given test criteria. Generally, all well barrier elements are to be tested for leaks while
valves that are included in the well barrier envelopes, e.g. downhole safety valves and
Christmas tree valves are also to be function tested regularly as per a pre-defined frequency.
There are to be no leaks to the environment from the wellhead, X-mas tree, valves or
instrument connections.
Primary and secondary well barriers installed to facilitate the removal of a X-mas tree; the
BOP or suspension flange are to have been tested and confirmed as leak tight.
Testing of a barrier should be in the direction of anticipated flow if possible.
‘
‘
6.2. Valves and Christmas Trees
6.2.4. Valve Test Criteria
The acceptable leak rate of a valve or well barrier element is to be zero, unless specified
otherwise.
The petroleum industry has only one defined leak rate, which is the maximum leak rate for SSSVs.
This is defined in API Recommended Practice 14B, Design, Installation, Repair and Operation of
118
Subsurface Safety Valve Systems (5th edition, October 2005 (ISO10417 of 2004)). According to API
14B, the allowable leak rate of SSSVs has been defined as:
0.42 Sm3/min (25.5 Sm3/hr) (900 scf/hr) for gas
0.4 l/min for liquid
The API 14B criteria can also be used as allowable leak rates when testing other valves such
as production tree valves, annulus access valves, and CIVs providing the observation volume
is adequately large to give meaningful tests and the valves are connected to a closed system.
For situations where the leak-rate cannot be monitored or measured, a criterion for maximum
allowable pressure fluctuation is to be established.
The commonly accepted way of determining leak rates through SSSV and X-mas tree valves
is by:
Bleeding down pressure above (downstream of) the valve
Closing in the volume above the valve and then monitoring the rate of pressure build
up in that volume
Converting the pressure rise into a volume leak rate
When testing valves for leaks, the status of all the valves in the system must be known, the
temperature has to be stable and the differential pressures between the valves should be known. A
minimum differential pressure should also be specified.
Function testing of the valves is to be performed:
After installations
After having been subjected to abnormal loads
After repairs
Routinely (as defined in the NORSOK standard)
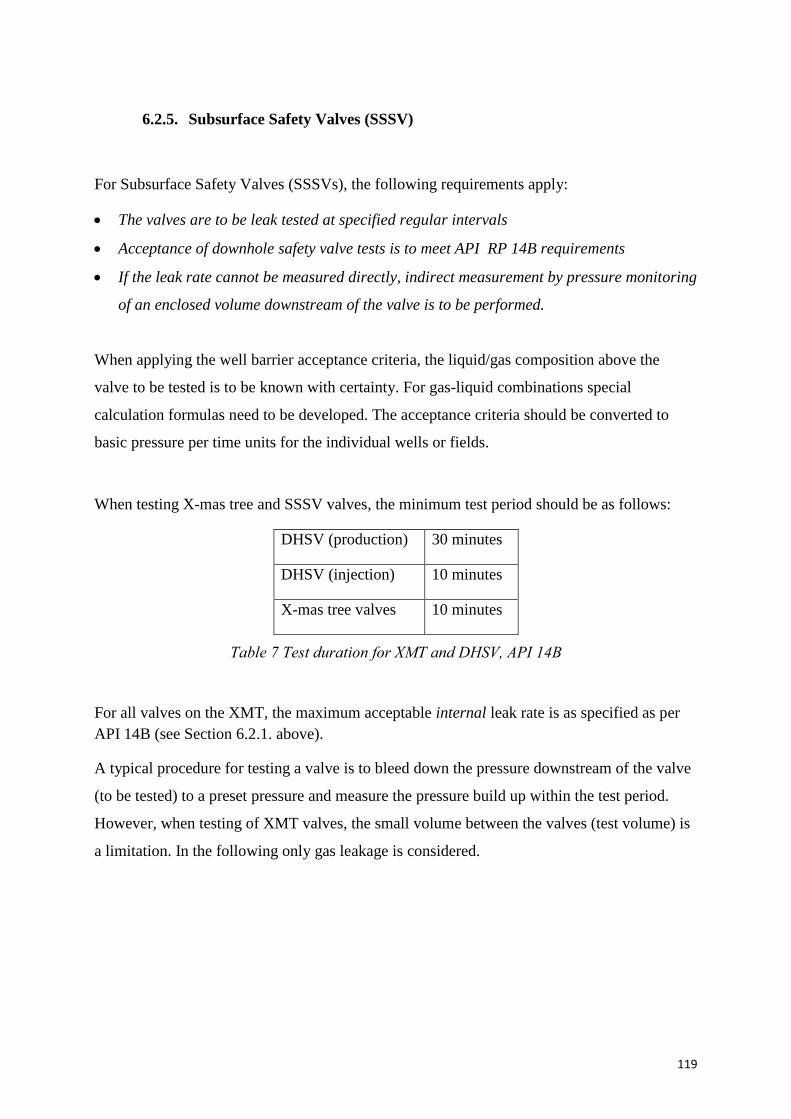
119
6.2.5. Subsurface Safety Valves (SSSV)
For Subsurface Safety Valves (SSSVs), the following requirements apply:
The valves are to be leak tested at specified regular intervals
Acceptance of downhole safety valve tests is to meet API RP 14B requirements
If the leak rate cannot be measured directly, indirect measurement by pressure monitoring
of an enclosed volume downstream of the valve is to be performed.
When applying the well barrier acceptance criteria, the liquid/gas composition above the
valve to be tested is to be known with certainty. For gas-liquid combinations special
calculation formulas need to be developed. The acceptance criteria should be converted to
basic pressure per time units for the individual wells or fields.
When testing X-mas tree and SSSV valves, the minimum test period should be as follows:
DHSV (production) 30 minutes
DHSV (injection) 10 minutes
X-mas tree valves 10 minutes
Table 7 Test duration for XMT and DHSV, API 14B
For all valves on the XMT, the maximum acceptable internal leak rate is as specified as per
API 14B (see Section 6.2.1. above).
A typical procedure for testing a valve is to bleed down the pressure downstream of the valve
(to be tested) to a preset pressure and measure the pressure build up within the test period.
However, when testing of XMT valves, the small volume between the valves (test volume) is
a limitation. In the following only gas leakage is considered.
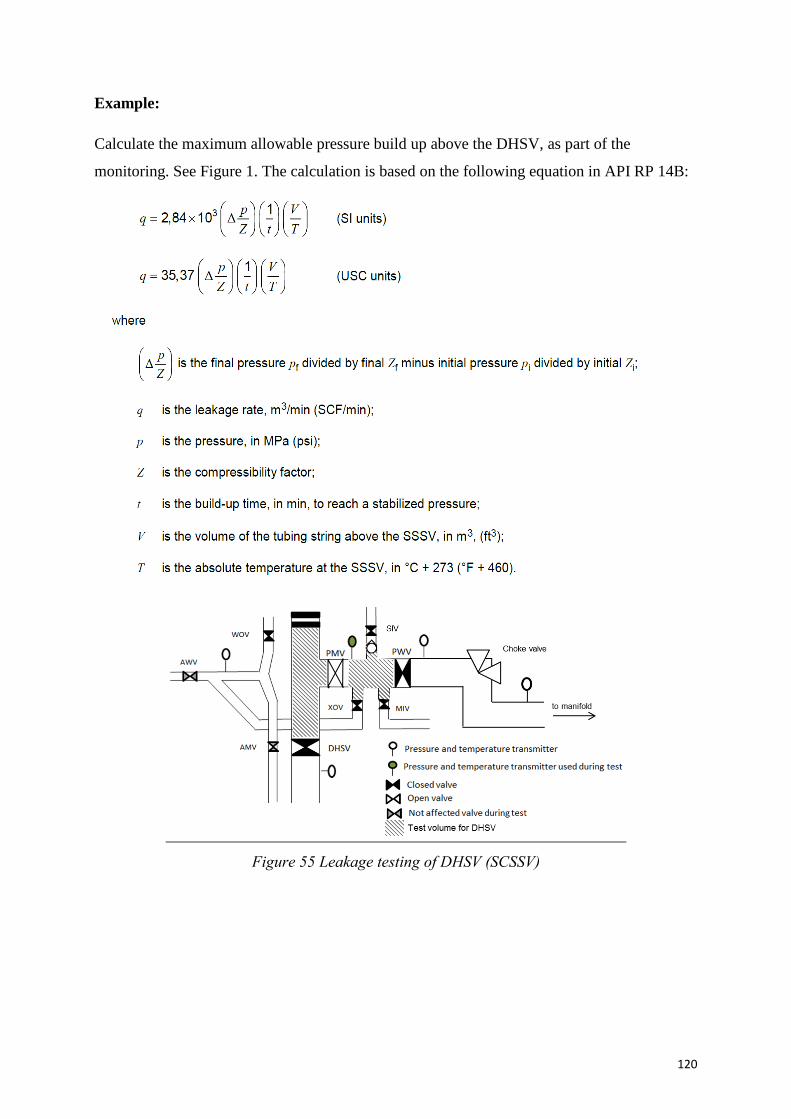
120
Example:
Calculate the maximum allowable pressure build up above the DHSV, as part of the
monitoring. See Figure 1. The calculation is based on the following equation in API RP 14B:
Figure 55 Leakage testing of DHSV (SCSSV)
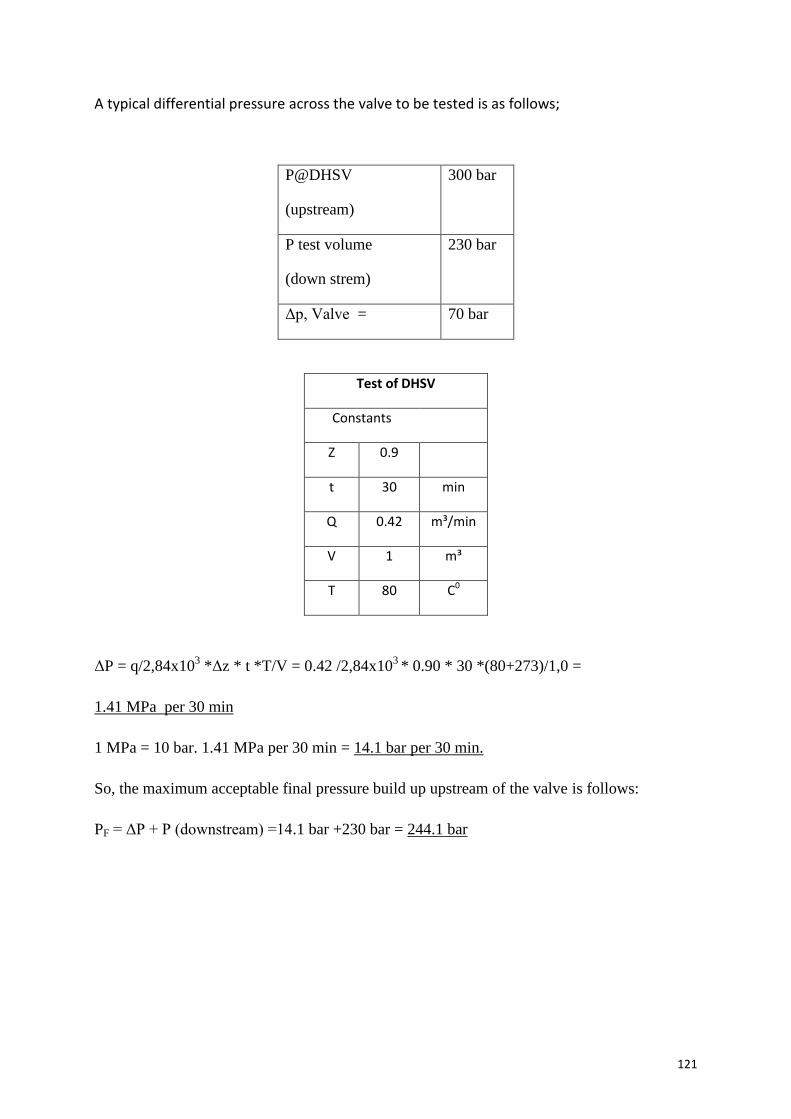
121
A typical differential pressure across the valve to be tested is as follows;
P@DHSV
(upstream)
300 bar
P test volume
(down strem)
230 bar
Δp, Valve = 70 bar
Test of DHSV
Constants
Z 0.9
t 30 min
Q 0.42 m³/min
V 1 m³
T 80 C0
ΔP = q/2,84x103 *Δz * t *T/V = 0.42 /2,84x10
3 * 0.90 * 30 *(80+273)/1,0 =
1.41 MPa per 30 min
1 MPa = 10 bar. 1.41 MPa per 30 min = 14.1 bar per 30 min.
So, the maximum acceptable final pressure build up upstream of the valve is follows:
PF = ΔP + P (downstream) =14.1 bar +230 bar = 244.1 bar
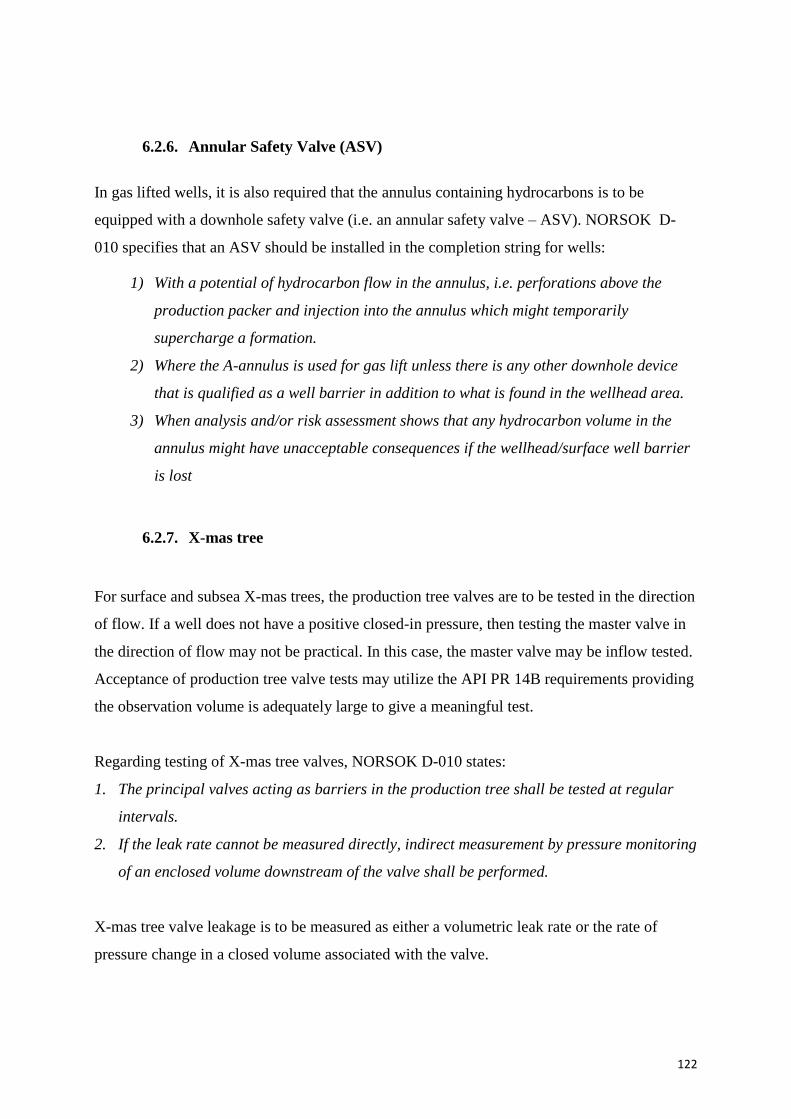
122
6.2.6. Annular Safety Valve (ASV)
In gas lifted wells, it is also required that the annulus containing hydrocarbons is to be
equipped with a downhole safety valve (i.e. an annular safety valve – ASV). NORSOK D-
010 specifies that an ASV should be installed in the completion string for wells:
1) With a potential of hydrocarbon flow in the annulus, i.e. perforations above the
production packer and injection into the annulus which might temporarily
supercharge a formation.
2) Where the A-annulus is used for gas lift unless there is any other downhole device
that is qualified as a well barrier in addition to what is found in the wellhead area.
3) When analysis and/or risk assessment shows that any hydrocarbon volume in the
annulus might have unacceptable consequences if the wellhead/surface well barrier
is lost
6.2.7. X-mas tree
For surface and subsea X-mas trees, the production tree valves are to be tested in the direction
of flow. If a well does not have a positive closed-in pressure, then testing the master valve in
the direction of flow may not be practical. In this case, the master valve may be inflow tested.
Acceptance of production tree valve tests may utilize the API PR 14B requirements providing
the observation volume is adequately large to give a meaningful test.
Regarding testing of X-mas tree valves, NORSOK D-010 states:
1. The principal valves acting as barriers in the production tree shall be tested at regular
intervals.
2. If the leak rate cannot be measured directly, indirect measurement by pressure monitoring
of an enclosed volume downstream of the valve shall be performed.
X-mas tree valve leakage is to be measured as either a volumetric leak rate or the rate of
pressure change in a closed volume associated with the valve.
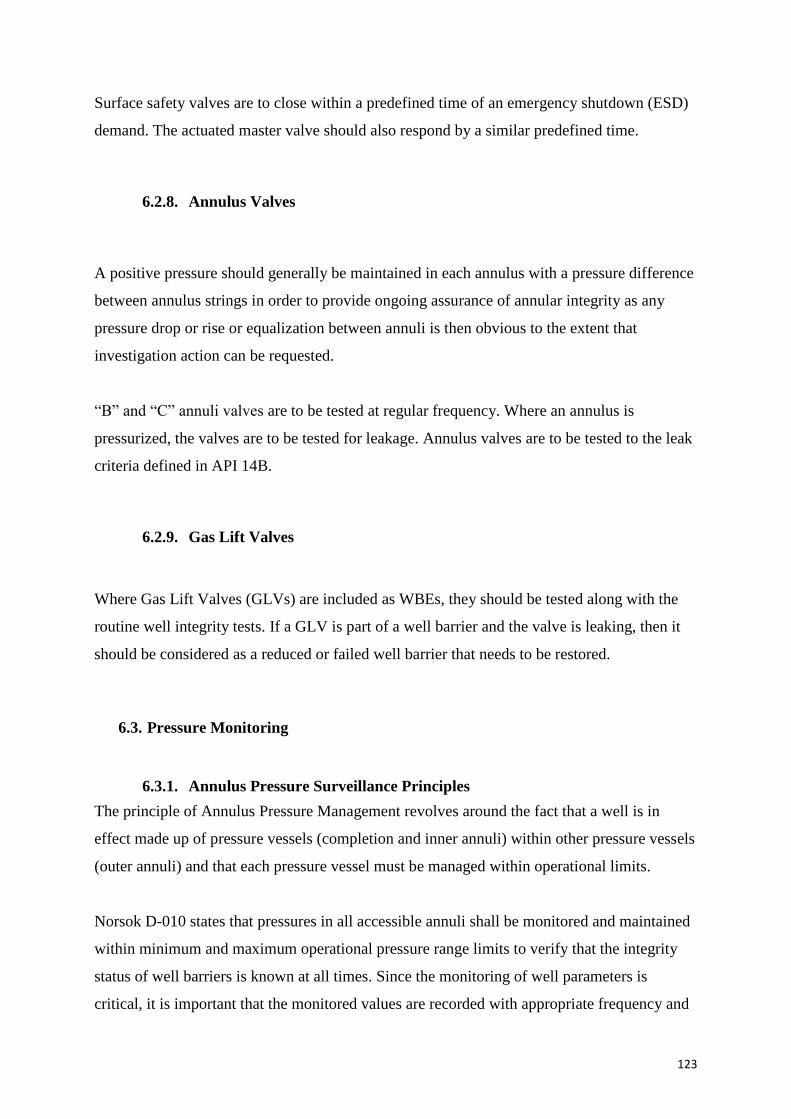
123
Surface safety valves are to close within a predefined time of an emergency shutdown (ESD)
demand. The actuated master valve should also respond by a similar predefined time.
6.2.8. Annulus Valves
A positive pressure should generally be maintained in each annulus with a pressure difference
between annulus strings in order to provide ongoing assurance of annular integrity as any
pressure drop or rise or equalization between annuli is then obvious to the extent that
investigation action can be requested.
“B” and “C” annuli valves are to be tested at regular frequency. Where an annulus is
pressurized, the valves are to be tested for leakage. Annulus valves are to be tested to the leak
criteria defined in API 14B.
6.2.9. Gas Lift Valves
Where Gas Lift Valves (GLVs) are included as WBEs, they should be tested along with the
routine well integrity tests. If a GLV is part of a well barrier and the valve is leaking, then it
should be considered as a reduced or failed well barrier that needs to be restored.
6.3. Pressure Monitoring
6.3.1. Annulus Pressure Surveillance Principles
The principle of Annulus Pressure Management revolves around the fact that a well is in
effect made up of pressure vessels (completion and inner annuli) within other pressure vessels
(outer annuli) and that each pressure vessel must be managed within operational limits.
Norsok D-010 states that pressures in all accessible annuli shall be monitored and maintained
within minimum and maximum operational pressure range limits to verify that the integrity
status of well barriers is known at all times. Since the monitoring of well parameters is
critical, it is important that the monitored values are recorded with appropriate frequency and
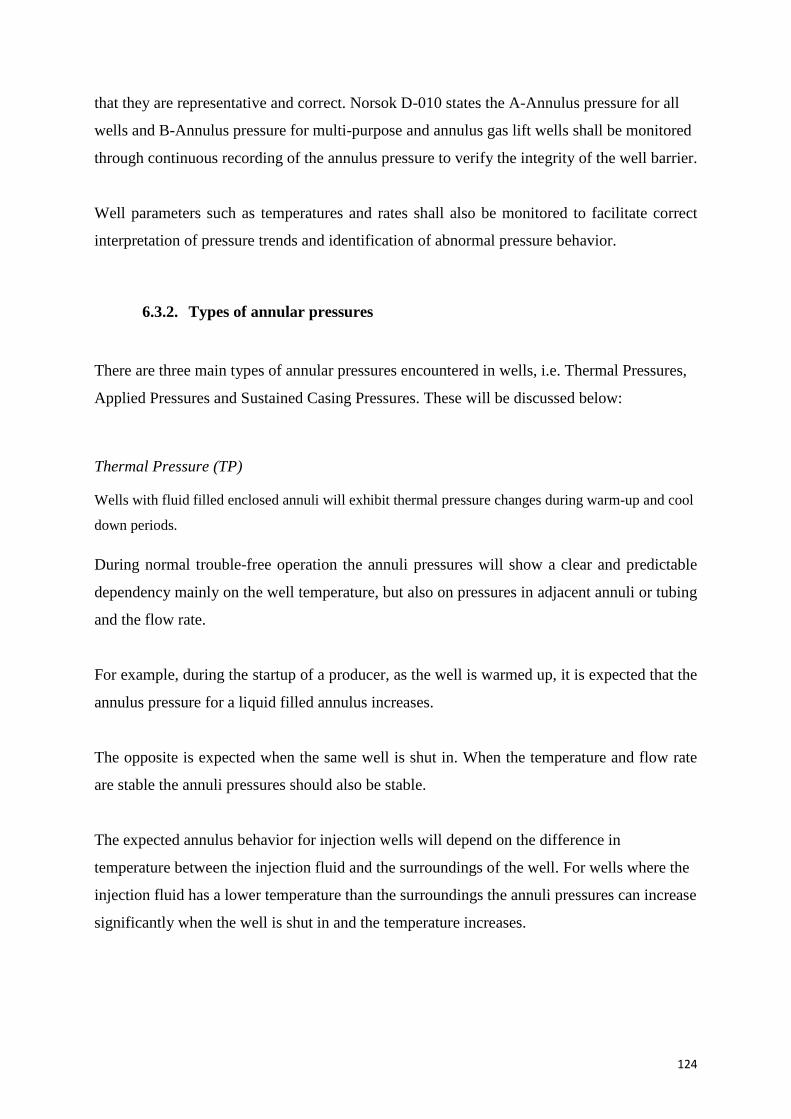
124
that they are representative and correct. Norsok D-010 states the A-Annulus pressure for all
wells and B-Annulus pressure for multi-purpose and annulus gas lift wells shall be monitored
through continuous recording of the annulus pressure to verify the integrity of the well barrier.
Well parameters such as temperatures and rates shall also be monitored to facilitate correct
interpretation of pressure trends and identification of abnormal pressure behavior.
6.3.2. Types of annular pressures
There are three main types of annular pressures encountered in wells, i.e. Thermal Pressures,
Applied Pressures and Sustained Casing Pressures. These will be discussed below:
Thermal Pressure (TP)
Wells with fluid filled enclosed annuli will exhibit thermal pressure changes during warm-up and cool
down periods.
During normal trouble-free operation the annuli pressures will show a clear and predictable
dependency mainly on the well temperature, but also on pressures in adjacent annuli or tubing
and the flow rate.
For example, during the startup of a producer, as the well is warmed up, it is expected that the
annulus pressure for a liquid filled annulus increases.
The opposite is expected when the same well is shut in. When the temperature and flow rate
are stable the annuli pressures should also be stable.
The expected annulus behavior for injection wells will depend on the difference in
temperature between the injection fluid and the surroundings of the well. For wells where the
injection fluid has a lower temperature than the surroundings the annuli pressures can increase
significantly when the well is shut in and the temperature increases.
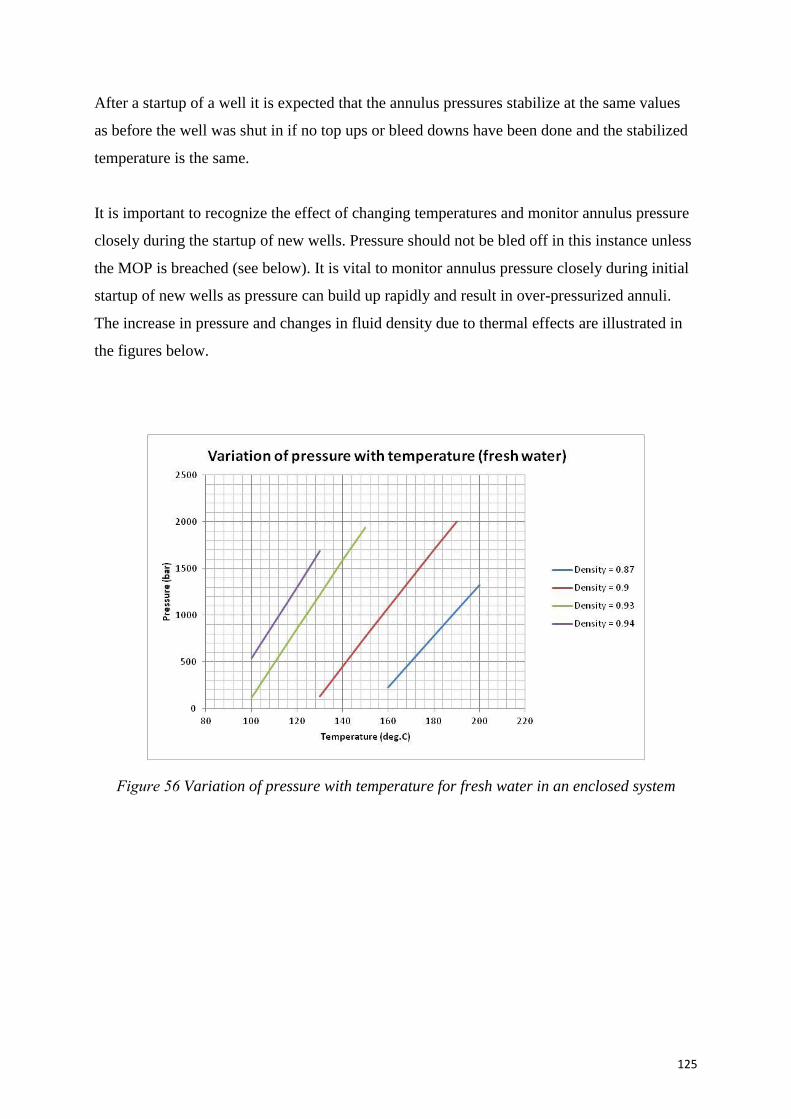
125
After a startup of a well it is expected that the annulus pressures stabilize at the same values
as before the well was shut in if no top ups or bleed downs have been done and the stabilized
temperature is the same.
It is important to recognize the effect of changing temperatures and monitor annulus pressure
closely during the startup of new wells. Pressure should not be bled off in this instance unless
the MOP is breached (see below). It is vital to monitor annulus pressure closely during initial
startup of new wells as pressure can build up rapidly and result in over-pressurized annuli.
The increase in pressure and changes in fluid density due to thermal effects are illustrated in
the figures below.
Figure 56 Variation of pressure with temperature for fresh water in an enclosed system
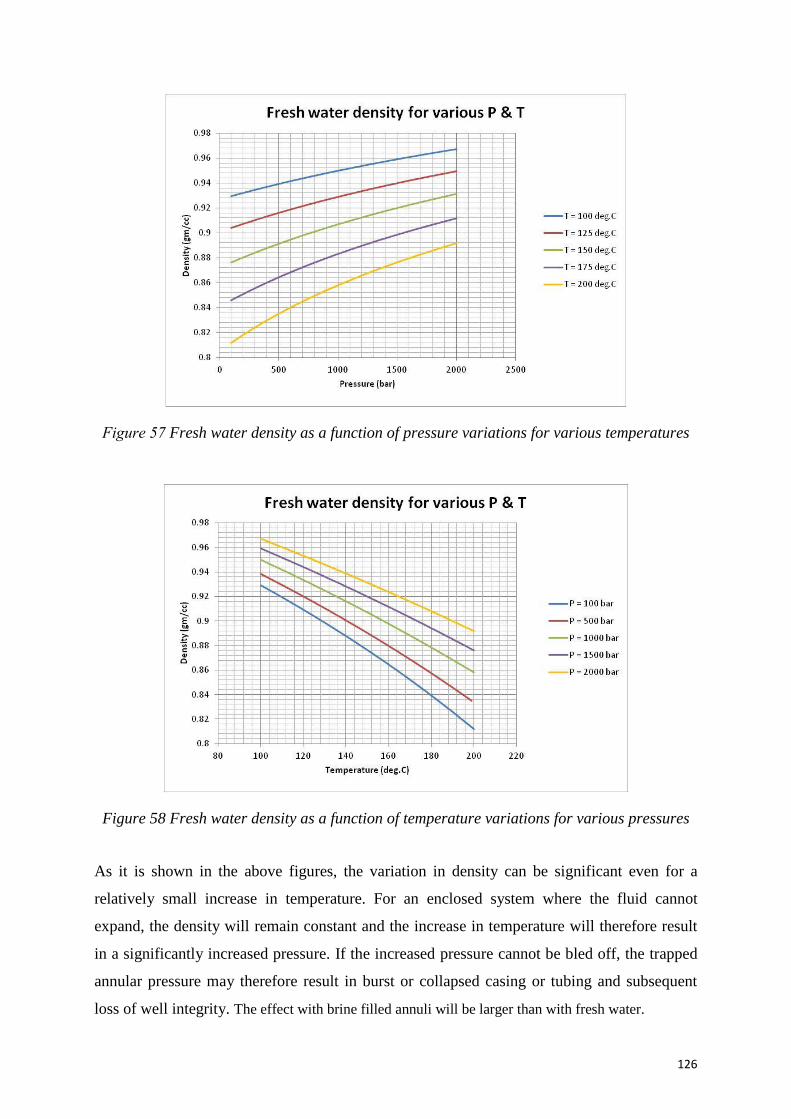
126
Figure 57 Fresh water density as a function of pressure variations for various temperatures
Figure 58 Fresh water density as a function of temperature variations for various pressures
As it is shown in the above figures, the variation in density can be significant even for a
relatively small increase in temperature. For an enclosed system where the fluid cannot
expand, the density will remain constant and the increase in temperature will therefore result
in a significantly increased pressure. If the increased pressure cannot be bled off, the trapped
annular pressure may therefore result in burst or collapsed casing or tubing and subsequent
loss of well integrity. The effect with brine filled annuli will be larger than with fresh water.
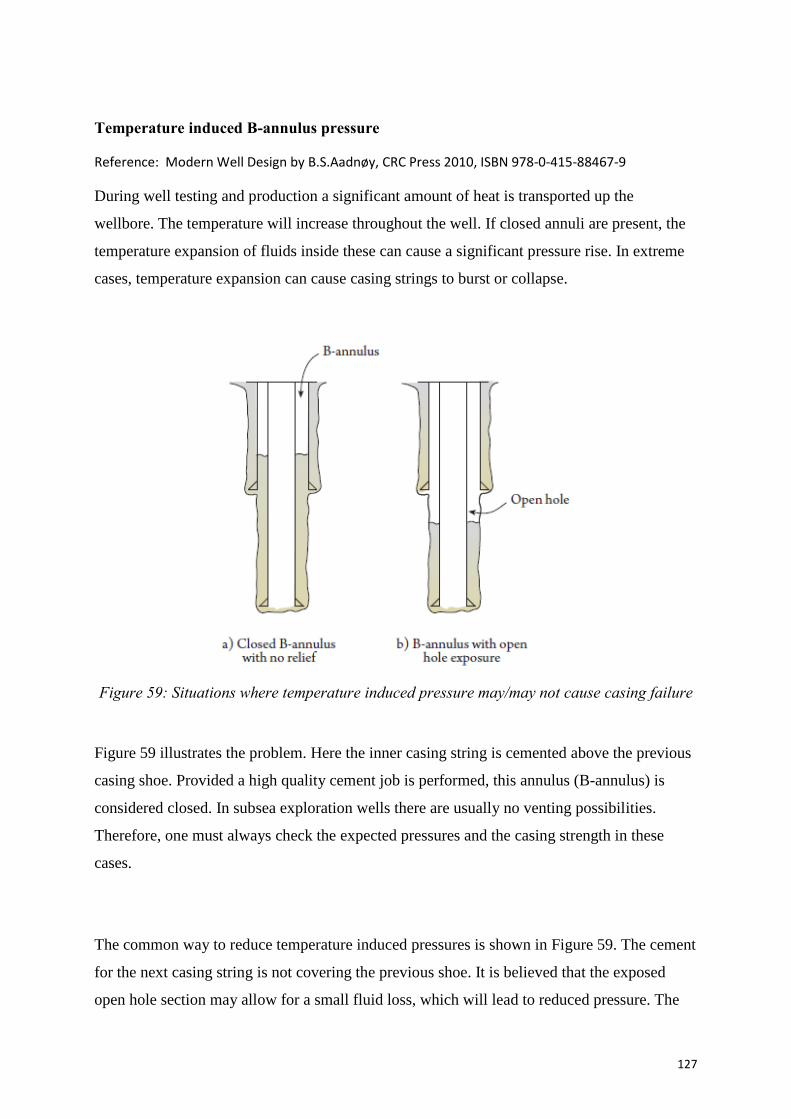
127
Temperature induced B-annulus pressure
Reference: Modern Well Design by B.S.Aadnøy, CRC Press 2010, ISBN 978-0-415-88467-9
During well testing and production a significant amount of heat is transported up the
wellbore. The temperature will increase throughout the well. If closed annuli are present, the
temperature expansion of fluids inside these can cause a significant pressure rise. In extreme
cases, temperature expansion can cause casing strings to burst or collapse.
Figure 59: Situations where temperature induced pressure may/may not cause casing failure
Figure 59 illustrates the problem. Here the inner casing string is cemented above the previous
casing shoe. Provided a high quality cement job is performed, this annulus (B-annulus) is
considered closed. In subsea exploration wells there are usually no venting possibilities.
Therefore, one must always check the expected pressures and the casing strength in these
cases.
The common way to reduce temperature induced pressures is shown in Figure 59. The cement
for the next casing string is not covering the previous shoe. It is believed that the exposed
open hole section may allow for a small fluid loss, which will lead to reduced pressure. The
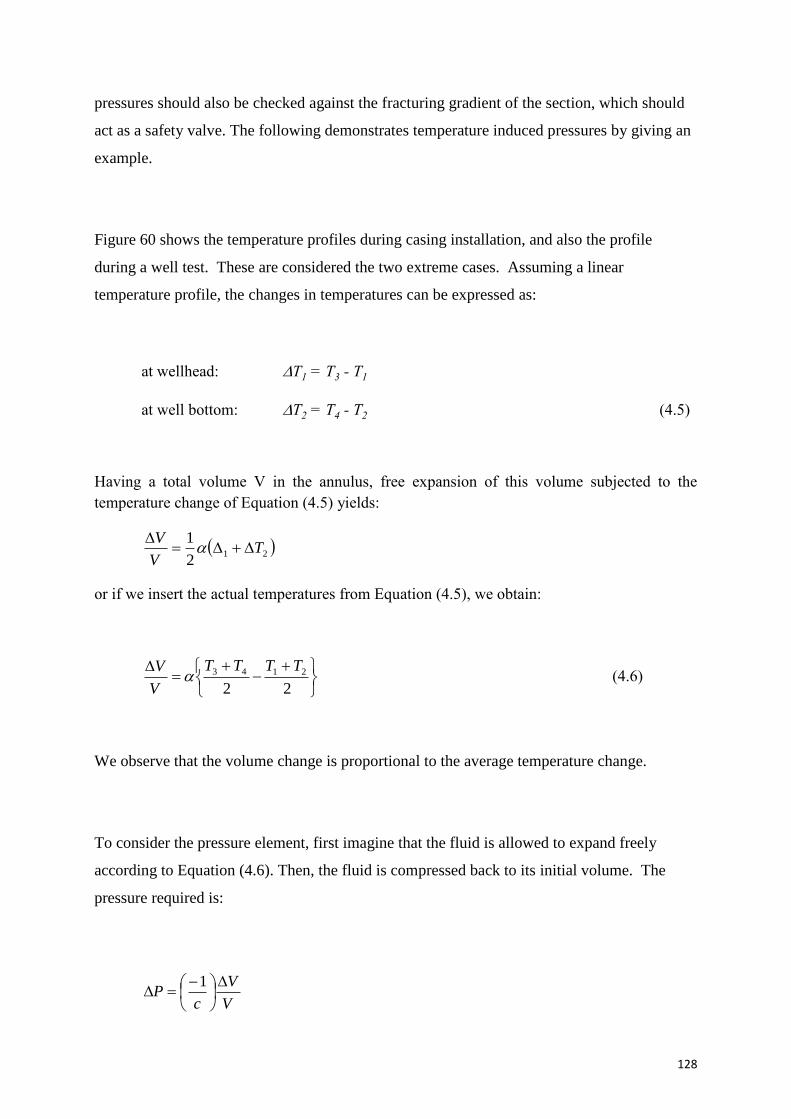
128
pressures should also be checked against the fracturing gradient of the section, which should
act as a safety valve. The following demonstrates temperature induced pressures by giving an
example.
Figure 60 shows the temperature profiles during casing installation, and also the profile
during a well test. These are considered the two extreme cases. Assuming a linear
temperature profile, the changes in temperatures can be expressed as:
at wellhead: T1 = T3 - T1
at well bottom: T2 = T4 - T2 (4.5)
Having a total volume V in the annulus, free expansion of this volume subjected to the
temperature change of Equation (4.5) yields:
212
1T
V
V
or if we insert the actual temperatures from Equation (4.5), we obtain:
22
2143 TTTT
V
V (4.6)
We observe that the volume change is proportional to the average temperature change.
To consider the pressure element, first imagine that the fluid is allowed to expand freely
according to Equation (4.6). Then, the fluid is compressed back to its initial volume. The
pressure required is:
V
V
cP
1
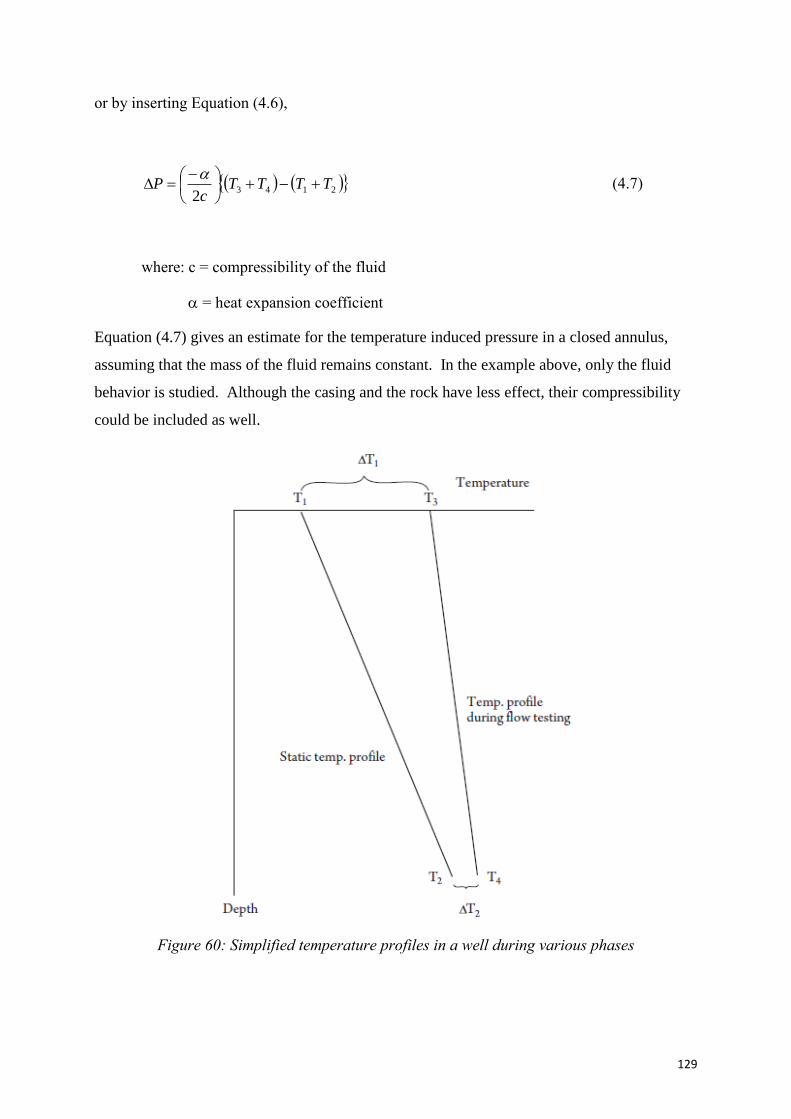
129
or by inserting Equation (4.6),
21432
TTTTc
P
(4.7)
where: c = compressibility of the fluid
= heat expansion coefficient
Equation (4.7) gives an estimate for the temperature induced pressure in a closed annulus,
assuming that the mass of the fluid remains constant. In the example above, only the fluid
behavior is studied. Although the casing and the rock have less effect, their compressibility
could be included as well.
Figure 60: Simplified temperature profiles in a well during various phases

130
Figure 61a shows an example from an exploration well. Figure 61b shows the estimated
temperature profiles before and after testing. The expected pressure increase from Equation
(4.7) is:
P = (3 x 10⁻⁴/2 x 3 x 10-5)(134+180 - (4+180) = 650 bar
Comparing this excessive pressure to the strength of the casings, results in:
Collapse strength of 7-5/8 in casing: 985 bar > 650 bar
Burst strength of 10-3/4 in. casing: 835 bar > 650 bar
We conclude that the design is acceptable because both casing strengths exceed the expected
pressure increase. Also, the 7-5/8” production casing is considered most critical, and we
observed that failure would in any case occur in the outer intermediate string before the
production casing.
Halal & Michell (1994) propose a casing design procedure for trapped annular pressure
buildup.
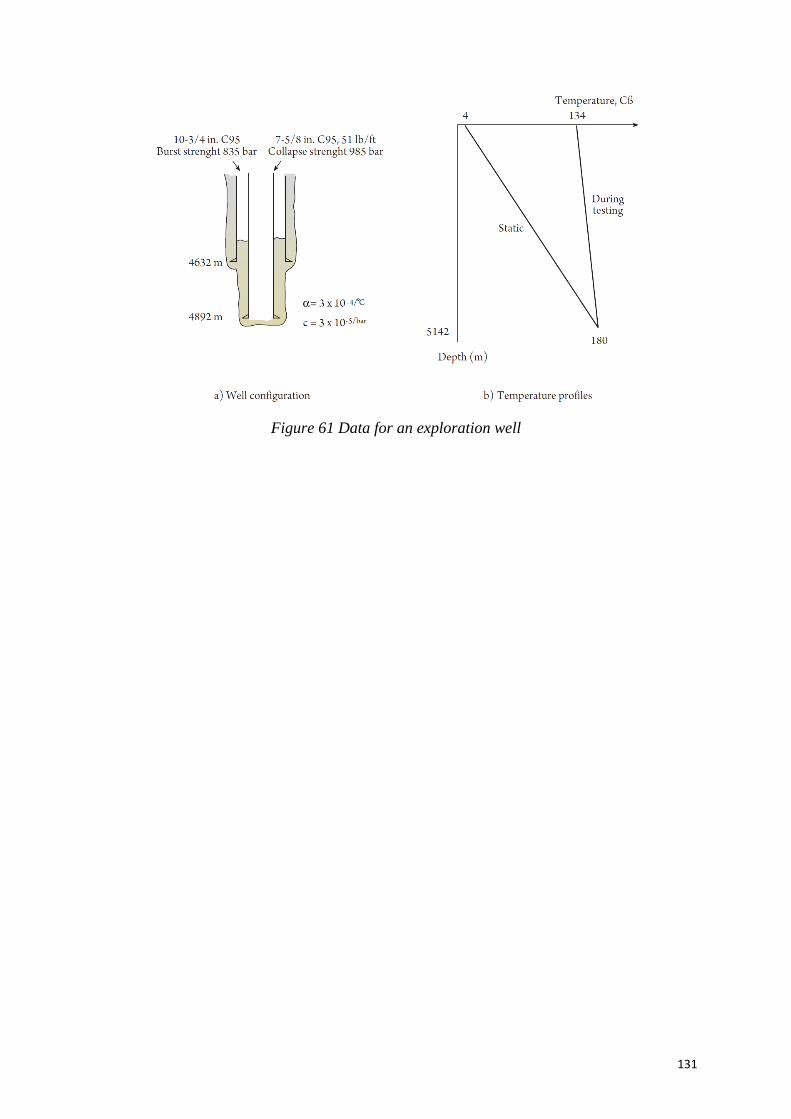
131
Figure 61 Data for an exploration well
132
Applied Pressure (AP)
Pressure may be applied to an annulus for various purposes, including gas lift, cuttings re-
injection (CRI), compensating for bullheading loads or assisting in annulus monitoring.
The applied pressure may also come from pressure containment tests. Care must be taken to
ensure this pressure is bled down after testing to a suitable value to ensure that thermal
pressure does not result in MOP being exceeded.
Sustained Casing Pressures (SCP)
Any deviations from the expected annulus pressure behavior can indicate the presence of
Sustained Casing Pressure (SCP). SCP comes from a pressure source such as the reservoir or
an adjacent annulus and is to be investigated whenever suspected or where the origin of the
observed pressure is not known.
SCP can arise for a variety of causes, including degradation or failure of well barriers, and can
occur throughout the lifetime of the well. SCP may be the result of leaks e.g. through casing
or tubing, through cement or through wellhead seals, but it can also be leaks directly from the
formation.
Figure 62 illustrates some of the potential leak paths that can be present in a well. The figure
is an example for illustrative purposes only.
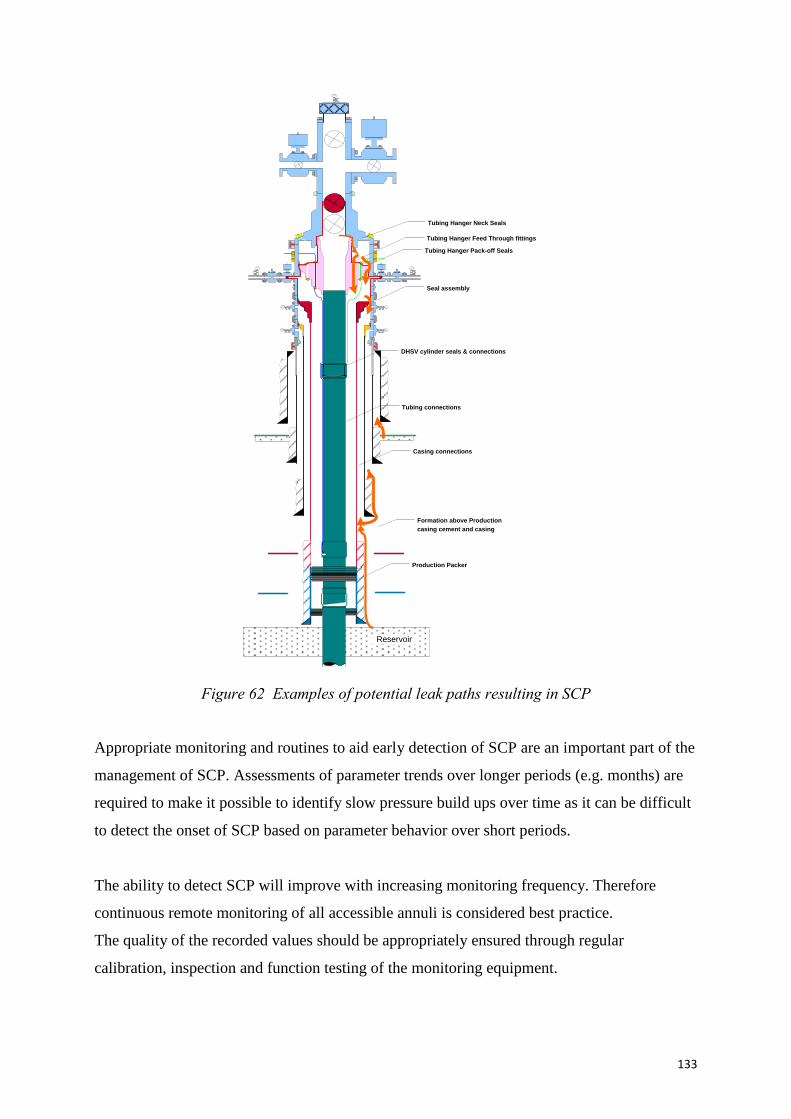
133
Tubing Hanger Neck Seals
Tubing Hanger Pack-off Seals
Formation above Production
casing cement and casing
Tubing connections
Tubing Hanger Feed Through fittings
Production Packer
DHSV cylinder seals & connections
Reservoir
Casing connections
Seal assembly
Figure 62 Examples of potential leak paths resulting in SCP
Appropriate monitoring and routines to aid early detection of SCP are an important part of the
management of SCP. Assessments of parameter trends over longer periods (e.g. months) are
required to make it possible to identify slow pressure build ups over time as it can be difficult
to detect the onset of SCP based on parameter behavior over short periods.
The ability to detect SCP will improve with increasing monitoring frequency. Therefore
continuous remote monitoring of all accessible annuli is considered best practice.
The quality of the recorded values should be appropriately ensured through regular
calibration, inspection and function testing of the monitoring equipment.

134
Bleed downs and top ups should be recorded to facilitate:
correct interpretation of annulus pressure behavior
detection of foreign fluids
annulus content is known
The minimum information that should be recorded is:
annulus pressure before and after the activity
duration of the activity
the fluid type
volume introduced or removed from the annulus (if practical)
pressure behavior of other annuli and tubing
Operating wells with positive annuli pressures and differences in tubing and annuli wellhead
pressures will facilitate detection of abnormal pressures.
Trapped Annular Pressure (TAP)
In some cases the annulus pressure is allowed to build due to thermally induced or sustained
pressures (e.g. subsea wells) and is controlled only by venting to an open subsurface
formation or entirely trapped by cemented casings. This will have to be taken into account in
the well design to prevent the occurrence of excessive pressure that may have an impact on
well integrity.
6.3.3. Calculation of MAASP
There is to be a continuous surveillance program of all accessible annuli in the well (flowing,
closed-in or suspended) to ensure their safe operation and the maintenance of well integrity.
Well annuli pressures are to be monitored and maintained within the maximum allowable
annular surface pressure (MAASP).
The MAASP is the absolute maximum pressure for a given annulus that is not to be exceeded
at any time, since it represents the integrity limit for that annulus.
135
For each annulus, the initial values for the MAASP need to be calculated. An example for A-
annulus MAASP calculation is given below. Key parameters for calculation are the minimum
values of mechanical properties (casing/tubing collapse & burst, accessory- and packer rating,
pressure on casing hanger area etc.) and formation strength at shoe.
Calculation Method
The mechanical integrity of the five components that define the boundary of an
annulus will limit its MAASP:
Collapse of inner casing
Burst of outer casing
Wellhead rating
Formation strength.
Completion components – where applicable
An example of A-annulus MAASP calculation with the formulas for the various calculation
points is given in the figure below.
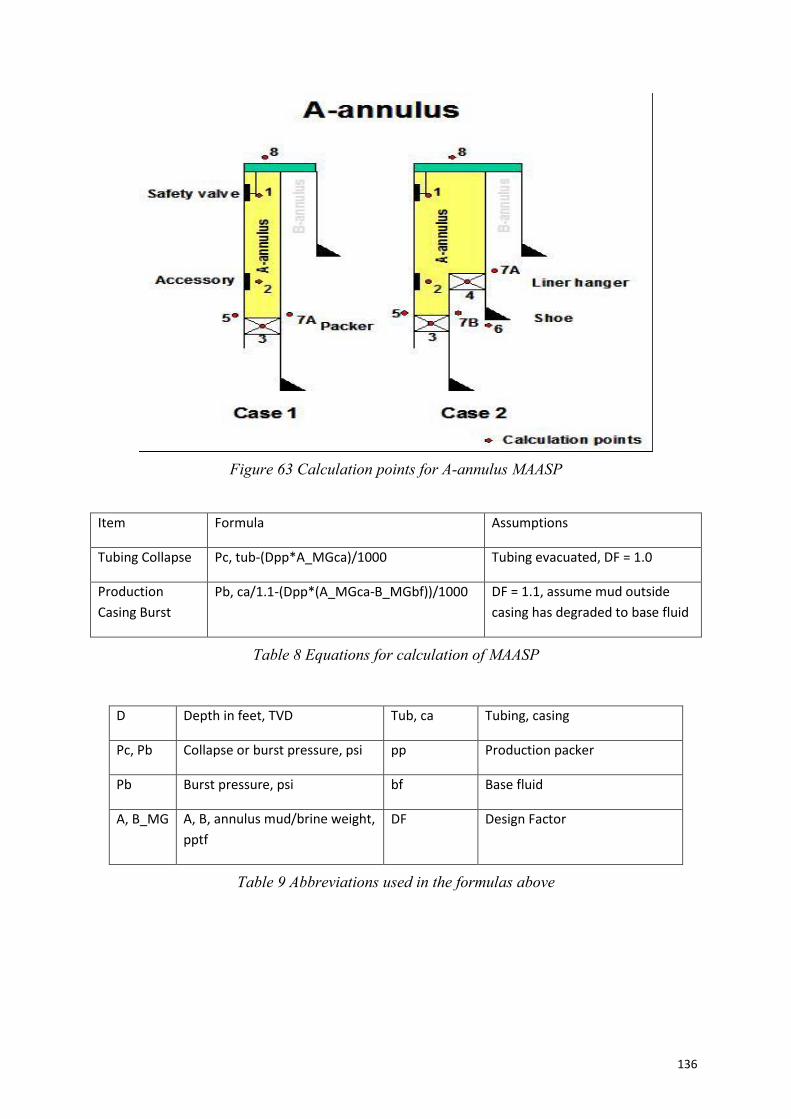
136
Figure 63 Calculation points for A-annulus MAASP
Item Formula Assumptions
Tubing Collapse Pc, tub-(Dpp*A_MGca)/1000 Tubing evacuated, DF = 1.0
Production
Casing Burst
Pb, ca/1.1-(Dpp*(A_MGca-B_MGbf))/1000 DF = 1.1, assume mud outside
casing has degraded to base fluid
Table 8 Equations for calculation of MAASP
D Depth in feet, TVD Tub, ca Tubing, casing
Pc, Pb Collapse or burst pressure, psi pp Production packer
Pb Burst pressure, psi bf Base fluid
A, B_MG A, B, annulus mud/brine weight,
pptf
DF Design Factor
Table 9 Abbreviations used in the formulas above
137
6.3.4. Setting of Maximum Operational Pressure (MOP)
In addition to an acceptance criteria for annulus pressure, MAASP, a maximum operational
pressure (MOP) should also be defined for an annulus.
The MOP is a measure of how much pressure that can safely be applied to an annulus on a
sustained basis. The MOP is measured relative to the ambient pressure at the wellhead for any
particular annulus. It establishes a safety threshold when considering the ultimate integrity
limit for a given annulus. In general, the MOP is not to exceed 80 % of MAASP.
A high pressure alarm with a trigger may be used to assist in controlling the operating
pressure boundary and this is usually the MOP. When the pressure reaches this level, then
action should be taken. The intention of the MOP is to reduce the probability of exceeding the
MAASP and providing appropriate response time to manage pressures which approach these
acceptance criteria.
Most wells are designed for operation with zero annulus pressure and even some vacuum in
annuli. However, for some well designs it may be required to define a minimum operational
pressure to reduce the risk of failure. This can be e.g. subsea wells where annulus pressures
outside the A-Annulus cannot be monitored or vented, which may make it necessary to
implement a minimum A-Annulus operating pressure to avoid collapsing the production
casing.
When determining minimum operational pressures the same failure modes as examined for
determination of MAASP should be considered, and similar assumptions should be applied.
In general, operating wells with modest positive annulus pressures are preferable.
6.3.5. ‘A’ Annulus MINAP (gas lifted wells)
Gas lifted wells that do not have a full liquid column inside the ‘A’ annulus and are allowed
to bleed down the gas lift pressure, may be exposed to the risk of production casing collapse
or tubing burst with insufficient applied pressure on the ‘A’ annulus. In such cases setting of a
Minimum Annular Pressure (MINAP) for the ‘A’ annulus is advised. Gas lifted wells will
therefore have to be designed to allow bleeding-off the gas lift pressure.
138
Impact of a gas cap on the MAASP and MOP calculation
In the event that the sustained casing pressure is supported by gas influx into the annulus, this
may require adjustment of the MAASP (to account for the presence of a variable gas column),
which would subsequently impact upon the MOP.
Some of the considerations that will come into play in this context include the consequences
of a breach of annulus containment at surface, in particular:
The potential for continuous hydrocarbon flow, and
The risk associated with the release of the hydrocarbon inventory in the gas cap.
6.3.6. Management and Control
Reaching High Pressure Alarm (HPA) values
Timely alarm in case of pressure build up should ensure that pressures are bled-off in time.
The High Pressure Alarm (HPA) should be set at the MOP but can be set lower. When the
annulus pressure reaches the HPA, an assessment should be made as to whether the pressure
is thermally induced or sustained from a leak or influx. The pressure is then to be bled down
to below the MOP.
It is not advisable to bleed down the pressure to zero. The rationale for this is to limit bleed-
offs to a minimum and comes from the fact that bleeding-off annular pressures may
exacerbate the problem.
In the event of sustained annular pressure, operating the well at less than 50 % of MOP is
considered good practice (i.e. in the lower half pressure band but above zero – see the figure
below). The MAASP of the outer annuli will also have to be considered.
If an annular pressure is bled down, the following parameters are to be recorded:
Pressure before / after
Type and estimate of volume of fluid (gas/brine/oil/condensate)
Density of fluid in case of liquid.
Fluid chemical analysis to identify source
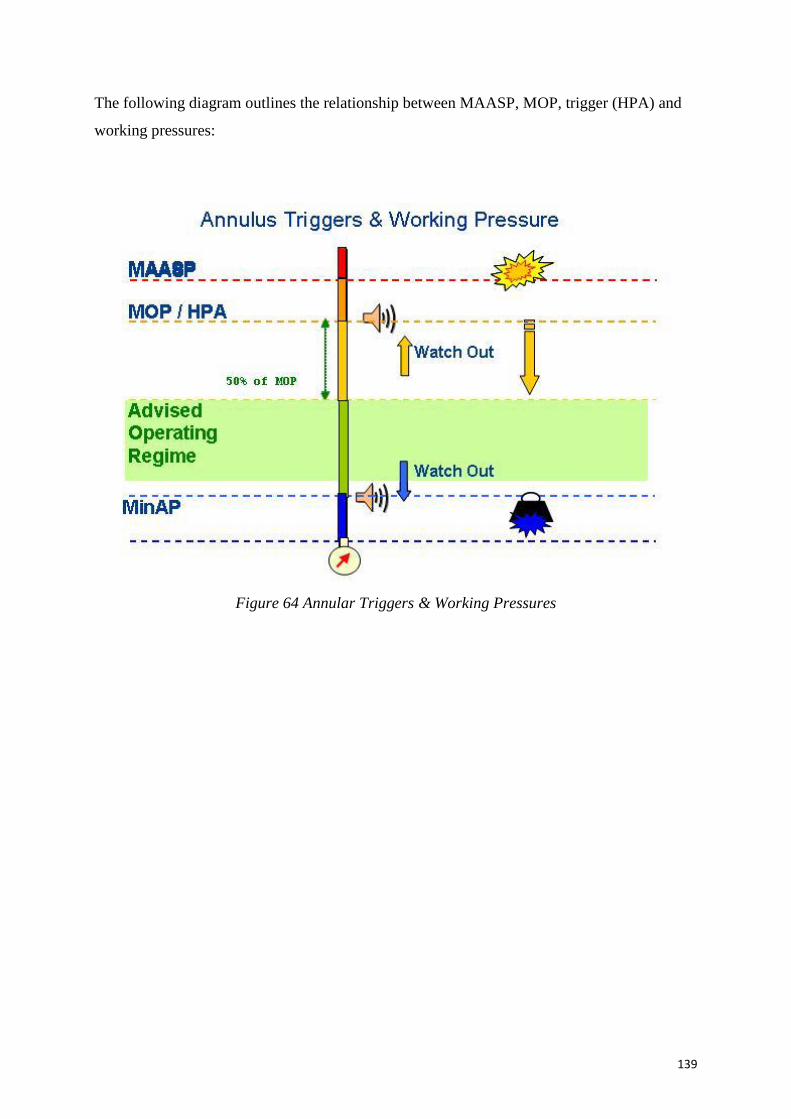
139
The following diagram outlines the relationship between MAASP, MOP, trigger (HPA) and
working pressures:
Figure 64 Annular Triggers & Working Pressures
140
7. Organizational
7.1. Roles and responsibilities
In a license we have an operator and usually one or several partners; this is outlined in the
Petroleum Act. Both the operator and the partners have an obligation to ensure that the
regulations are followed and that the work being done is in accordance with the regulations.
The operator has the sole responsible for the day-to-day activities and the one that has the
overall responsibility for the facility and operations undertaken. With that responsibility the
operator has the duty to ensure that the sub-contractors are performing the work correctly and
that they are following the relevant regulations and standards. The partners on the other hand
have a duty to follow up the work of the operator and make sure that the regulations and
license agreements are followed. This is done through various license committees and through
audits of the operator. These duties are clearly defined in the regulations. Poor follow up by
partners may lead to cost escalations and delays in projects and operations, and high risk of
failures or accidents. PSA is also following up the operators and their activities to see if they
are in line with the current regulations and standards.
All companies operating on the Norwegian Continental Shelf (NCS) are obliged by the
regulations to have a management system and a system for controlling the HSE level of their
operations. This management system is to reflect how the company operates and how the
activities are carried out. Within the system there are to be clearly defined roles,
responsibilities, interactions between departments and governmental organizations, governing
documents, applicable standards and reporting routes. Management systems can be divided
into two main categories of systems; one for oil companies that are operators and one for
those who are only partners. The latter requires a different organization than the operator that
will manage all activities required for field development including offshore operations.
Partner reporting to the authorities is not as significant as for the operating company.
For the operators on the NCS it is a requirement that they have a system in place for
managing the well integrity for the life cycle of all their wells. The intention with this system
is to control and reduce the risk of incidents related to the wells. A description of elements
required in a well integrity management system can be found in Norsk Olje og Gass guideline
117.
141
7.2. Competence and training
In the regulations and NORSOK D-010 there are specified requirements for competence and
training for personnel involved in drilling and well operations. These requirements are not
only limited to well integrity, but also well control and various other operations taking place
on a rig/platform. The reason for this is that one wants to ensure that the personnel
participating in these operations have adequate competence and are up to the job. Among all
the positions on the rig there is a varying requirement for competence in accordance with
what position they have in the organization. Personnel working hands-on on the drill floor
have different competence requirements than the drilling supervisor, who is supposed to have
an overview of the entire operation. It is also worth noting that people working with wells in
production have a need for a different type of competence as the situation is different from
drilling a well and they have to function in the rest of the production facility.
For personnel working on the drill floor an Norsk Olje og Gass guideline has been
issued, Norsk Olje og Gass guideline no. 24. For well integrity Norsk Olje og Gass guideline
117 applies, this also deals more with the production phase of a well and not only drilling. In
addition NORSOK D-010 sets forth some requirements about competence for personnel
involved in drilling and well operations.
142
8. Appendix A - Homework problems
8.1. Exercise 1
Oil production is planned on a platform. Top reservoir at 2827 mTVD. The maximum
expected reservoir pressure is 350 bar at 3100 mTVD. The gas gradient is 0.15s.g.EMW. The
wellhead depth is 6 m.
a) Calculate Maximum expected SIWHP
The maximum expected kill margin for this well is 70 bar.
b) What is the MWDP for this well?
The well is planned to be constructed with a 30”conductor, 20”” surface casing, 13 3/8”
intermediate casing, 9 5/8” production casing, and a 7” liner set through the reservoir.
Perforations are planned at the interval 2898 – 3050 mTVD. The planned setting depths and
mud weights are indicated on the wellbore stability plot. The maximum control line pressure
is 520 bar.
c) Plan the well barriers, required and planned cement heights, required test
pressures, as well as monitoring methods for the operational phase. Describe
through setting up planned well barrier schematics. Calculate the maximum
allowable pressure build up above the DHSV, as part of the monitoring. The
volume above DHSV is set to 1.88 m3, Δz-factor: 0.90 and middle temperature:
900C.
d) Also describe how you will permanent plug the same well by setting up a well
barrier schematic. Define cement lengths and test pressures.
e) Do you have suggestions for another casing program to make the well barriers
more robust?
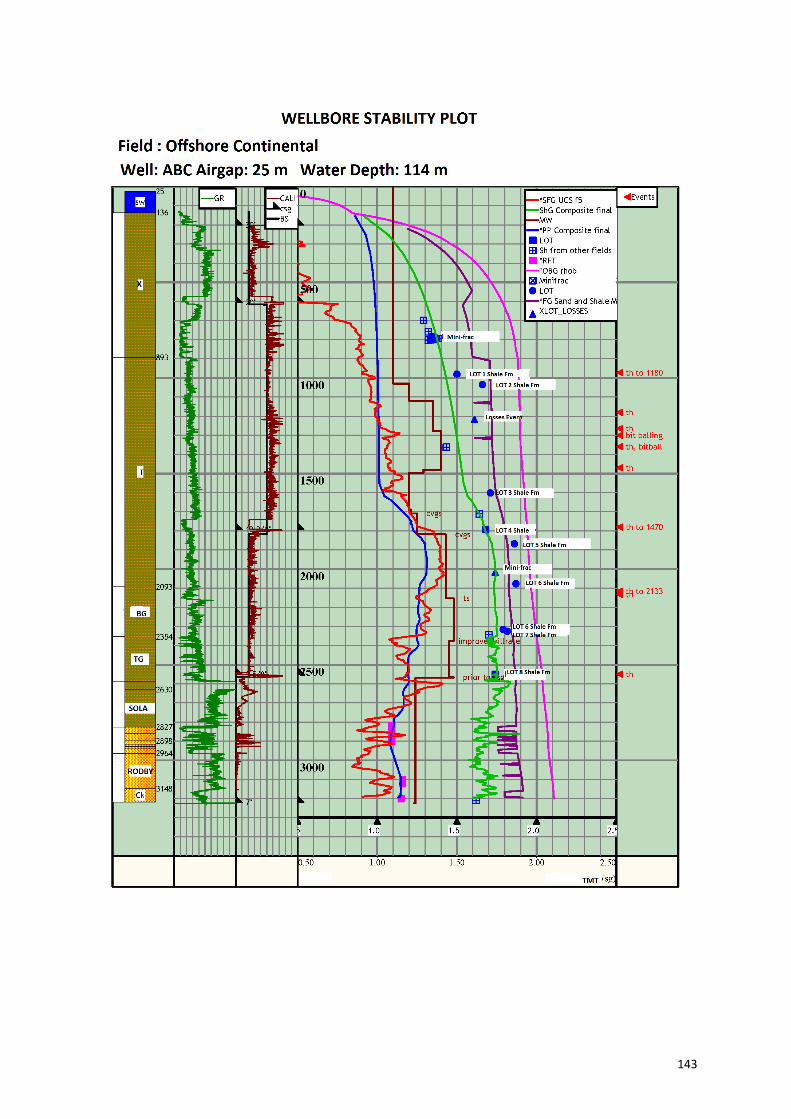
143

144
8.2. Exercise 2
Well 1 a) above (in Exercise 1) has a leak through the production packer. The leak rate is 0.03
kg/min with HC gas. Is this an acceptable situation? What risk factors do you need to
evaluate? What do you recommend to do? (Use Norsk Olje og Gass 117 and understand the
different risk factors to evaluate)
8.3. Exercise 3:
A gas lift well was completed with well barriers as defined on the well barrier schematic
below. The MWDP was set to 345 bar based on the maximum kill pressure of the reservoir.
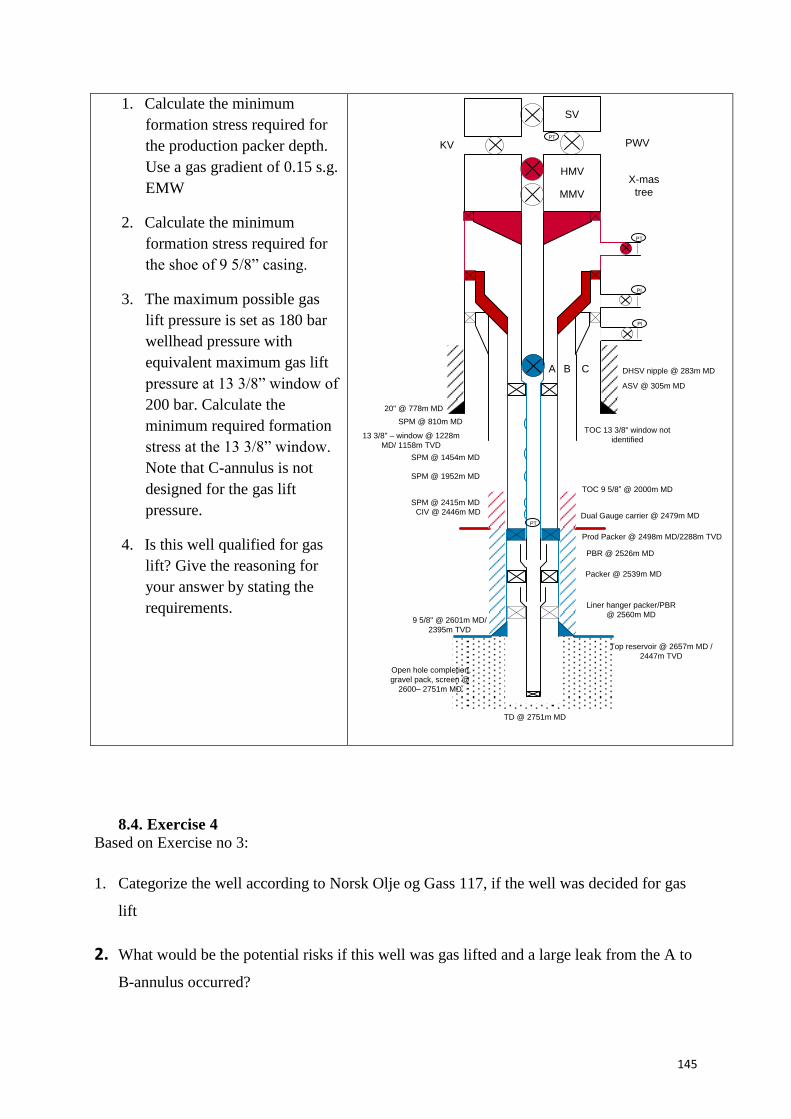
145
1. Calculate the minimum
formation stress required for
the production packer depth.
Use a gas gradient of 0.15 s.g.
EMW
2. Calculate the minimum
formation stress required for
the shoe of 9 5/8” casing.
3. The maximum possible gas
lift pressure is set as 180 bar
wellhead pressure with
equivalent maximum gas lift
pressure at 13 3/8” window of
200 bar. Calculate the
minimum required formation
stress at the 13 3/8” window.
Note that C-annulus is not
designed for the gas lift
pressure.
4. Is this well qualified for gas
lift? Give the reasoning for
your answer by stating the
requirements.
X-mas
tree
PWV
HMV
MMV
KV
SV
PT
PT
PT
PI
PI
A B C DHSV nipple @ 283m MD
20" @ 778m MD
13 3/8" – window @ 1228m
MD/ 1158m TVD
9 5/8" @ 2601m MD/
2395m TVD
TOC 9 5/8” @ 2000m MD
TD @ 2751m MD
ASV @ 305m MD
SPM @ 810m MD
SPM @ 1454m MD
CIV @ 2446m MD
SPM @ 1952m MD
Dual Gauge carrier @ 2479m MD
Liner hanger packer/PBR
@ 2560m MD
Prod Packer @ 2498m MD/2288m TVD
Open hole completion,
gravel pack, screen @
2600– 2751m MD
Packer @ 2539m MD
PBR @ 2526m MD
SPM @ 2415m MD
Top reservoir @ 2657m MD /
2447m TVD
TOC 13 3/8" window not
identified
8.4. Exercise 4
Based on Exercise no 3:
1. Categorize the well according to Norsk Olje og Gass 117, if the well was decided for gas
lift
2. What would be the potential risks if this well was gas lifted and a large leak from the A to
B-annulus occurred?
146
9. References
1) Rausand, M. and A. Høyland (2004). System Reliability Theory: Models, Statistical
Methods, and Applications, 2nd edition, Wiley, Hoboken, NJ.
2) IEC60050-191 (1990). International Electrotechnical Vocabulary, chapter 191,
Dependability and Quality of Service, International Electrotechnical Commission,
Geneva.
3) IEC61508 (2010). Functional Safety of Electrical/Electronic/Programmable Electronic
Safety-Related Systems, Parts 1-7. International Electrotechnical Commission, Geneva.
4) IEC61511 (2003). Functional Safety: Safety Instrumented Systems for the Process
Industry Sector, Parts 1-3. International Electrotechnical Commission, Geneva.
5) Modern Well Design by B.S.Aadnøy, CRC Press 2010, ISBN 978-0-415-88467-9
6) Norsok D-010 Rev3, Aug 2044, Standard Norge
http://www.standard.no/PageFiles/1315/D-010r3.pdf
7) Investigation report summary from PSA;
http://www.ptil.no/getfile.php/z%20Konvertert/Health%2C%20safety%20and%20enviro
nment/Supervision/Dokumenter/granskingsrapportutdrag.pdf
8) PSA well integrity survey, 2006,
http://www.ptil.no/getfile.php/z%20Konvertert/Helse%2C%20milj%C3%B8%20og%20sik
kerhet/Sikkerhet%20og%20arbeidsmilj%C3%B8/Dokumenter/nettpsawellintegritysurvey
phase1reportrevision3006.pdf
9) Norsk Olje og Gass guideline no 117, rev 4, 06.06.2011
http://www.norskoljeoggass.no/PageFiles/1166/117%20OLF%20recommended%20guid
elines%20Well%20integrity%20rev4,%2006.06.%2011.pdf?epslanguage=no