Embed Size (px)
Citation preview

B. List 1.8.2007 An Introduction to C++ Page 1
An Introduction to ROOT
Benno List
DESY Summer Student Tutorial1.8.2007

B. List 1.8.2007 An Introduction to C++ Page 2
Introduction
ROOT is a Package for Data Analysis
ROOT Provides:
● Several C++ Libraries
– To store data in histograms
– To store data in n-tuples, called “ROOT Trees”
– To visualize histograms and n-tuples
– To perform fits
● An Interactive Environment
– To run C++ programs interactively
– To visualize data
– To perform fits

B. List 1.8.2007 An Introduction to C++ Page 3
The Analysis Chain in High Energy Physics
Monte CarloGeneratorRaw Data
4-Vectors
Simulation
Simulated Raw Data
Reconstruction
High-LevelReconstruction
Reconstructed Data (DST)
Condensed Data(ROOT Trees)
Analysis Code Histograms,Plots
Journal Pub lication

B. List 1.8.2007 An Introduction to C++ Page 4
Histograms are Important in HEP

B. List 1.8.2007 An Introduction to C++ Page 5
What is a Cross Section?
● Imagine small area on proton's surfaceIf area is hit by electron, an event of a certain type happensUnit of : cm2, or barn: 1 barn = 10-24 cm2 = (10fm)2 Area of proton: approx 0.02 barn (radius 0.8fm)Typical cross sections at HERA: pb (10-36 cm2)
● Instantaneous luminosity L: Number of events per second per cross sectionUnit of L: cm-2 s-1, or nb-1 s-1
HERA-II Design Lumi: 5·1031 cm-2 s-1, or 50 μb-1 s-1
● Integrated luminosity: ∫ L dtNumber of events per cross sectionUnit of ∫ L dt: cm-2, or pb-1
HERA-II values: order 100pb-1 Hit here forep -> e' + 2 jets + X
Hit here forep -> eX (50<Q2<100GeV)
The Proton

B. List 1.8.2007 An Introduction to C++ Page 6
How Do we Measure a Cross Section?● The Master Formula:
Number of events: N = σ · L dt
● We count events for a given data sample => observed number of events Nobs
● For this data sample, we know the integrated luminosity L dt
● We are generally interested for cross sections for theoreticaly well defined processes, e.g. for ep->e' X, 0.001<x<0.002, 5<Q2<6GeV2
● But we can only count events which we have observed, and where we have reconstructed certain x, Q2 values, which are not exact
● => We have to correct the observed number of events for background, trigger and reconstruction inefficiencies, and resolution effects

B. List 1.8.2007 An Introduction to C++ Page 7
How Do we Correct for Detector Effects?
● Analytical calculations generally not possible
● The Monte Carlo Method: “Generate events” randomly, which have the expected distributions of relevantproperties (x, Q2, number of tracks, vertex position...)
● Simulate detector response to each suchevent (hits in chambers, energy in calo)
● Pass events through same reconstruction chain as data
● Now we have events where we can count events that truly fulfill our cross section criteria, and those which pass the selection criteria. The ratio is called “efficiency” and is used to correct the data
Measuring π with the Monte Carlo method:The fraction f of random points withinthe circle is π/4.We measure: f = 16/20 = 0.8Uncertainty on f: sqrt(f*(1-f)/N) = 0.09So: π/4 ~ f = 0.80 ± 0.09 andπ ~ 4f = 3.2 ± 0.3

B. List 1.8.2007 An Introduction to C++ Page 8
How Do we Count Events?
Typically: Write (and run) a program that
● Selects events with certain properties, e.g.:
– Scattered electron with energy E'e>10GeV
– Tracks visible that come from a reconstructed vertex with -35<z<35cm
– Reconstructed Bjorken-x > 0.001
● Counts events in “bins” of some quantity, e.g. Q2:Q2 = 10...20, 20...30, 30...40, ...
● Shows the number of events as a histogram

B. List 1.8.2007 An Introduction to C++ Page 9
The Sketch of an Analysis Program
int main() { // some initializations here: // reading steering parameters // open event files
// Book histograms
for (int i = 0; i < events; ++i) { // Load event number i into memory // Get/calculate event properties if (selection_is_filfilled) { // fill histograms } }
// draw the histograms // write out histogram file // write out info like number of events etc... return 0;}
The skeleton of such an analysis programwill typically be provided to you by yoursupervisor

B. List 1.8.2007 An Introduction to C++ Page 10
Linking with ROOT
● Will normally be done by a Makefile
● Command “root-config” tells you necessary compiler flags:$> root-config --incdir/opt/products/root/4.00.08/include$> root-config --libs-L/opt/products/root/4.00.08/lib -lCore -lCint -lHist -lGraf -lGraf3d -lGpad -lTree -lRint -lPostscript -lMatrix -lPhysics -pthread -lm -ldl -rdynamic
● To compile a file Example.C that uses root, use:$> g++ -c -I `root-config --incdir` Example.C
● To compile and link a file examplemain.C that uses root, use:$> g++ -I `root-config --incdir` -o examplemain examplemain.C `root-config --libs`
● The inverted quotes tell the shell to run a command and paste the output into the corresponding place

B. List 1.8.2007 An Introduction to C++ Page 11
ROOT Information
● Web page: http://root.cern.ch/
● We use ROOT 4.00/08: http://root.cern.ch/root/Version400.html
● You can download ROOT yourself and install it,also for MacOS and Windows (though I never tried it...)
● There is a User's guide atftp://root.cern.ch/root/doc/Users_Guide_4_04.pdf
● A complete overview over all classes is available athttp://root.cern.ch/root/Reference.html

B. List 1.8.2007 An Introduction to C++ Page 12
Remark: ROOT Coding Conventions
ROOT uses some unusual coding conventionsjust get used to them...
● Class names start with capital T: TH1F, TVector
● Names of non-class data types end with _t: Int_t
● Class method names start with a capital letter: TH1F::Fill()
● Class data member names start with an f: TH1::fXaxis
● Global variable names start with a g: gPad
● Constant names start with a k: TH1::kNoStats
● Seperate words with in names are capitalized: TH1::GetTitleOffset()
● Two capital characters are normally avoided: TH1::GetXaxis(),not TH1::GetXAxis()
B. List 1.8.2007 An Introduction to C++ Page 13
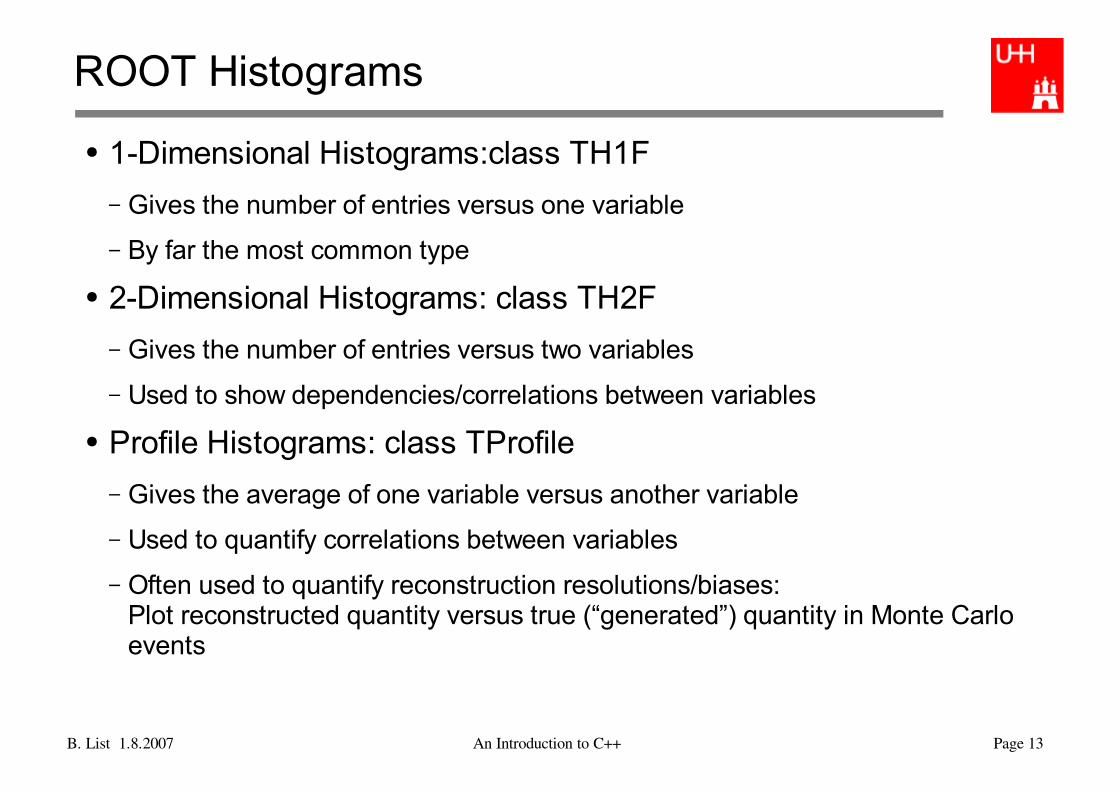
ROOT Histograms
● 1-Dimensional Histograms:class TH1F
– Gives the number of entries versus one variable
– By far the most common type
● 2-Dimensional Histograms: class TH2F
– Gives the number of entries versus two variables
– Used to show dependencies/correlations between variables
● Profile Histograms: class TProfile
– Gives the average of one variable versus another variable
– Used to quantify correlations between variables
– Often used to quantify reconstruction resolutions/biases:Plot reconstructed quantity versus true (“generated”) quantity in Monte Carlo events

B. List 1.8.2007 An Introduction to C++ Page 14
A 1-Dimensional Histogram Example
file gausexample.C:
#include <TH1.h>#include <TFile.h>#include <TRandom.h>
int main() { TH1F *histo = new TH1F (“hgaus”, “A Gauss Function”, 100, -5.0, 5.0); TRandom rnd;
for (int i = 0; i < 10000; ++i) { double x = rnd.Gaus (1.5, 1.0); histo->Fill (x); }
TFile outfile (“gaus.root”, “RECREATE”); histo->Write(); outfile.Close(); return 0;}
Compile and run:
$> g++ -I `root-config --incdir` -o gausexample gausexample.C `root-config --libs`$> ./gausexample
Here we “book” the histogram●ID is “hgaus” (must be unique, short, no spaces)●Title is “A Gauss Function”●100 bins between -5 and 5
Open the ROOT output fileWrite the histogram to itClose the output file
rnd is an object of type TRandom,a random number generator.rnd.Gaus returns a new Gaussian distributedrandom number each time it is called.

B. List 1.8.2007 An Introduction to C++ Page 15
What TH1F Histograms Can Do
● BookingTH1F(const char* name, const char* title, int nbinsx, double xlow, double xup);TH1F(const char* name, const char* title, int nbinsx, const double* xbins);
● Fillingvirtual int Fill(double x);virtual int Fill(double x, double w);
● Getting informationvirtual double GetBinContent(int bin) const;virtual double GetMaximum(double maxval = FLT_MAX) const;virtual double GetMaximum(double maxval = FLT_MAX) const;
● Adding etc.virtual void Add(TF1* h1, Double_t c1 = 1, Option_t* option);likewise: Multiply, Divide
● Drawingvirtual void Draw(Option_t* option);
● Writing to a file (inherited from TObject)virtual int Write(const char* name = "0", int option = 0, int bufsize = 0);

B. List 1.8.2007 An Introduction to C++ Page 16
Looking at the Histogram: Interactive ROOT
● Start ROOT interactively with$> root
● A DESY specialty: You can chose a special ROOT version with$> ini ROOT40008(other versions: ROOT40402, ROOT51200 etc)
● At the ROOT prompt, enterroot [1] TBrowser t;
● this opens a browser

B. List 1.8.2007 An Introduction to C++ Page 17
Clicking
Click here toopen a file
Click here todisplay a histogram
Enter thisto get thebrowserwindow

B. List 1.8.2007 An Introduction to C++ Page 18
No Clicking
$> root
root [0] TFile *file0 = TFile::Open("gaus.root")root [1] hgaus.Draw()root [2] hgaus.Draw(“E”)root [3] hgaus.Draw(“C”)root [4] gStyle->SetOptStat(1111111)root [5] hgaus.GetXaxis()->SetTitle("Abscissa")root [6] hgaus.GetYaxis()->SetTitle("Ordinate")root [7] gPad->SetLogx(1)root [8] hgaus.Draw(“E2”)root [9] hgaus.SetLineColor(3)root [10] hgaus.SetLineStyle(2)root [11] hgaus.SetLineWidth(2)root [12] hgaus.SetMarkerStyle(20)root [13] hgaus.SetMarkerSize(1.5)root [14] hgaus.SetMarkerColor(4)root [15] hgaus.Draw(“E1”)root [16] hgaus.SetFillColor(4)root [17] hgaus.Draw(“C”)root [18] gPad->Print(“gaus1.ps”)root [19] .q

B. List 1.8.2007 An Introduction to C++ Page 19
Drawing Options for 1D-Histograms
"AXIS" Draw only axis "AH" Draw histogram, but not the axis labels and tick marks"]["
"B" Bar chart option"C" Draw a smooth Curve througth the histogram bins"E" Draw error bars"E0" Draw error bars including bins with o contents"E1" Draw error bars with perpendicular lines at the edges"E2" Draw error bars with rectangles"E3" Draw a fill area througth the end points of the vertical error bars"E4" Draw a smoothed filled area through the end points of the error bars"L" Draw a line througth the bin contents"P" Draw current marker at each bin except empty bins"P0" Draw current marker at each bin including empty bins"*H" Draw histogram with a * at each bin"LF2”
When this option is selected the first and last vertical lines of the histogram are not drawn.
Draw histogram like with option "L" but with a fill area. Note that "L" draws also a fill area if the hist fillcolor is set but the fill area corresponds to the histogram contour.

B. List 1.8.2007 An Introduction to C++ Page 20
Drawing Options for 2D-Histograms
AXIS Draw only axisARR arrow mode. Shows gradient between adjacent cellsBOX a box is drawn for each cell with surface proportional to contentsCOL a box is drawn for each cell with a color scale varying with contentsCOLZ same as "COL". In addition the color palette is also drawnCONT Draw a contour plot (same as CONT0)CONT0 Draw a contour plot using surface colors to distinguish contoursCONT1 Draw a contour plot using line styles to distinguish contoursCONT2 Draw a contour plot using the same line style for all contoursCONT3 Draw a contour plot using fill area colorsCONT4 Draw a contour plot using surface colors (SURF option at theta = 0)CONT5 Draw a contour plot using Delaunay trianglesLIST Generate a list of TGraph objects for each contourFB Draw current marker at each bin including empty binsBB Draw histogram with a * at each bin
SCAT Draw a scatter-plot (default)TEXT Draw bin contents as textTEXTnn Draw bin contents as text at angle nn (0 < nn < 90)[cutg] Draw only the sub-range selected by the TCutG named "cutg"

B. List 1.8.2007 An Introduction to C++ Page 21
CINT
● ROOT uses a C++ interpreter CINT for interactive use
● You can enter any C++ command; trailing “;” is not required
● Resetting the interpreter (erasing variables etc):root[] gROOT->Reset()Do that often! But often a restart of ROOT is needed...
● Special commands:.q Quit.x script.C Execute script “script.C”.L script.C Load script “script.C” (if script.C contains class definitions)
● More in Chapter 7: “CINT the C++ Interpreter” of ROOT manual

B. List 1.8.2007 An Introduction to C++ Page 22
Two kinds of scripts
● Un-named scripts:{ #include <iostream.h> cout << “Hello, World!\n”;}
– Code must be enclosed in curly braces!
– Execute with root[] .x script.C
● Named scripts:#include <iostream.h>int main() { cout << “Hello, World!\n”;}
– More like normal C++ programs, recommended form!
– Execute with:root[] .L script.Croot[] main()
B. List 1.8.2007 An Introduction to C++ Page 23
CINT Extensions to C++
● If you create a pointer and assign to it with “new”, you don't need to declare the pointer type:h = new TH1F (“h”, “histogram”, 100, 0, 1)
– h is automatically of type TH1F*
● “.” can be used instead of “->”=> Don't do that habitually!
● If you use a variable that has not been declared earlier,ROOT tries to create one for you from all named objects it knows=> If you have opened a file that contains a histogram “hgaus”,you can directly usehgaus->Draw()
– But be careful: Sometimes you get a different object than you thought :-(

B. List 1.8.2007 An Introduction to C++ Page 24
TF1 Functions and Fitting
file tf1example.C:
#include <TH1F.h>#include <TF1.h>#include <TFile.h>
Double_t mygauss (Double_t *x, Double_t *par) { // A gauss function, par[0] is integral, par[1] mean, par[2] sigma return 0.39894228*par[0]/par[2]*exp(-0.5*pow(( *x -par[1])/par[2], 2));}
int main() { TF1 *gaussfun = new TF1 ("gaussfun", mygauss, -10, 10, 3); gaussfun->SetParameters (100, 0., 1.); gaussfun->SetParNames ("Area", "Mean", "Sigma"); TFile *file = new TFile ("gaus.root"); TH1F *hgaus = dynamic_cast<TH1F *>(file->Get("hgaus")); if (hgaus) { hgaus->Fit(gaussfun); }}
Defines a Gauss functionNote that the argument must be handed over by a pointer!!!
Defines a TF1 function object● ID is “gaussfun”● It executes function mygauss● It is valid for x between -10 and 10● It has 3 parameters
Here we load the histogram “hgaus” from the file “gaus.root”,and if it was found, we fit it.
file->Get() returns only a pointer to a TObject, which is a base class of TH1F.With dynamic_cast we convert the pointer to the correct type.If the object pointed to is not a TH1F (it could something completely different!), the dynamic_castreturns a null pointer.

B. List 1.8.2007 An Introduction to C++ Page 25
Five Minutes on ROOT Trees
● A ROOT Tree holds many data records of the same type, similar to an n-tuple. One record is described by a C++ Class:class EventData { public: Int_t run; Int_t event; Float_t x; Float_t Q2;};
● The ROOT Tree knows how many enries (here: events) it contains.It can fill one instance (one object) of class EventData at a time with data, which we then can use to plot the data.TH1F *histox = new TH1F (“histox”, “Bjorken x”, 1000, 0., 1.);TFile *file (“eventdata.root”);TTree *tree = dynamic_cast<TTree *>(file->Get(“eventdata”));EventData *thedata = new EventData;TBranch *branchx = tree->GetBranch(“x”);branchx->SetAddress (&(event->x));for (int i = 0; i < tree->GetEntries(); ++i) { branchx->GetEntry(i); histox->Fill (x);}

B. List 1.8.2007 An Introduction to C++ Page 26
Trees, Branches, and Leaves
● The Tree is the whole data set
● A Branch contains the data of one or several variables, e.g. the x and Q2 values of all events.
– A Tree consists of several Branches.
– How the Branches are set up is determined by the program that writes the Tree
● A Leaf is the data of a single variable (like x)
– A Branch consists of several Leaves

B. List 1.8.2007 An Introduction to C++ Page 27
Using Trees
● You will surely given a program by your advisor which reads in a ROOT Tree so don't worry how to create a ROOT Tree.
● You will have an “event loop” which loops over all entries of the tree. Within the loop, you'll find all data that you need in some object.
● Use this data to select “good” events and plot their properties in histograms