Embed Size (px)
Citation preview

SRK Consulting
Engineers and Scientists
SRK Consulting
Engineers and Scientists
An Introduction to Mining Business Improvement Initiatives – Mapping the Steps to Increased
Profits Mike Beare, Minex Conference 2009

SRK Consulting
Engineers and Scientists
WHAT IS BUSINESS IMPROVEMENT?
• Achieving more with less. Utilise existing equipment and people more effectively to
impact the bottom line of a business. Its about identifying and improving efficiency
• Large subject, has various names e.g. Continuous Improvement, Kaizen, Six Sigma,
Barrick Operating System, etc
• Based on applying various principles to analyse, diagnose and implement
improvements to production system or organisation
• Uses a structured approach and covers strategic, technical and operational matters
• Various tools can be applied to assist in the process – eg RCPS, decision trees,
focused interviews, time studies, work studies etc
• Despite jargon, it is not technically complicated or difficult - process driven

SRK Consulting
Engineers and Scientists
WHY DO WE NEED TO APPLY BUSINESS IMPROVEMENT (2)?
• Increase return on investment for share holders
• Cost curve position. Cyclical nature of industry means that every 4-7 years
prices slump and its beyond our control, our efficiency is something we can
control – cannot gamble on the commodity prices going up
• Our competitors are doing it and they will force us up the cost curve if we
don‟t (eg British Coal efficiency drives in 1980s)
• Our strategy will be out of date if we don‟t review regularly – this could
result in us losing out to competitors
• Ethical reasons – a green perspective can be attractive to investors or even
a prerequisite for some. There can be strong financial incentives to going
green

SRK Consulting
Engineers and Scientists
ALCOA PROFITS INCREASE DESPITE A LONG SLUMP IN METAL PRICES
Adjusted net income in $ millions (left axis), and spot price of aluminium in $/lb on the
London Metal Exchange (right axis)
$300
200
100
0
-100
$1.20
1.00
0.80
0.60
0.401982 199983 84 85 86 87 88 89 90 91 92 93 94 95 96 97 98
* Alcoa‟s quarterly net income adjusted for special items
Source: Platt‟s Metals Week; Wall Street Journal; McKinsey Metals Practice

SRK Consulting
Engineers and Scientists
SUCCESSFUL COMPANIES “PULL” IMPROVEMENTS FROM THE FRONT LINE
VS. “PUSHING” THEM
Management
communicates
themes for
the year
Objectives
set by front-
line teams
Objectives
translated
into $/tonne
Mobilization
to generate
ideas
Monthly
review of
progress on
technical
indicators
Review of
financial
impact
Current
perf
Obj.
Gap
Tech.
limit
Heavy communication
• Business needs/
results
• Customer
expectations
• Competitors
Front-line training
Indicator 3
Indicator 2
• Prizes for best
teams
• 30% senior
manager time for
review
team progressLink
to pay
Twice
a year
Reve-
nues
Cost
Profit
2006 07 08Team 1
Team 2
Indicator 1

SRK Consulting
Engineers and Scientists
WHAT IS A TYPICAL BUSINESS IMPROVEMENT PROCESS ?
• Review Phase – analyse
and diagnose the
sources of losses
• Value losses
• Identify solutions
• Prioritize solutions
• Prepare implementation
plans
Diagnosis, analysis,
planningImplementation Perpetuation
Phase 1 Phase 2 Phase 3
3-Step Process
• Make the implementation
plans happen
• Change management –
strategy , policy,
enhanced working
practices, better
supervision, training,
new technology
• Ensure the improvements are
maintained and enhanced
through ongoing review and
support
• Instill a culture of continuous
improvement
• Re-set technical limits – „raise
the bar‟

SRK Consulting
Engineers and Scientists
DIAGNOSIS AND ANALYSIS PHASE
Objectives
• Need to find out what is
wrong with the operation
and what is the most
efficient way to fix it.
• Find out where working time
is being lost and how more
work can be achieved in the
time available.
• An analysis of costs is
usually required to complete
the assessment.
• The inefficiencies are what
are normally termed
„avoidable losses‟ – it‟s a
loss of opportunity but can
translate to a direct cash
loss
Activities
• Data collection. This is key. The more accurate data that is
available the more analyses can be conducted – a good
reporting system is required. Data can also be gathered by
interviews and meetings – employees often hold the answers
• Analysis of data. The analysis will show where the
problems lie and their magnitude
• Generate technical limits for top line key performance
indicators (KPIs) – target operational improvements
• Solutions. After the key losses are identified then solutions
are assessed and valued. A matrix approach is applied where
solutions that have high impact and high value are
implemented

SRK Consulting
Engineers and Scientists
DIAGNOSING THE OPPORTUNITY/SETTING GOALS
Build a fact base to
understand operations
Operating equipment
effectiveness
Historical performance
Process maps
Use appropriate tools
to set targets
• Theoretical/design limits of
equipment (adjust + for
safety factor)
• Benchmarking
• Repeated best
• Observations/trial
• Management consensus
• Solid
understanding
current
operating
situation
• Prioritized set of
KPIs that drive
value
• Specific limits
and targets for
highest value
KPIs
Key end products
SRK Consulting
Engineers and Scientists
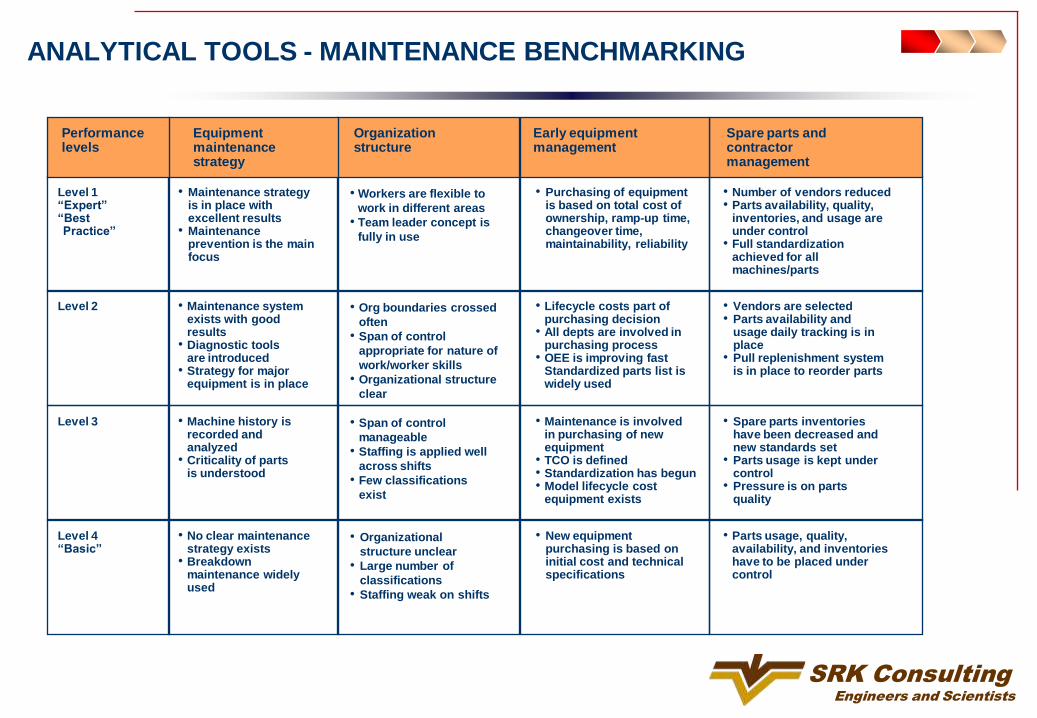
ANALYTICAL TOOLS - MAINTENANCE BENCHMARKING
Performance levels
Organization structure
Spare parts and contractor management
Equipment maintenance strategy
• Maintenance strategy is in place with excellent results
• Maintenance prevention is the main focus
• Workers are flexible to
work in different areas
• Team leader concept is
fully in use
• Purchasing of equipment is based on total cost of ownership, ramp-up time, changeover time, maintainability, reliability
• Number of vendors reduced• Parts availability, quality,
inventories, and usage are under control
• Full standardization achieved for all machines/parts
• Org boundaries crossed
often
• Span of control
appropriate for nature of
work/worker skills
• Organizational structure
clear
• Lifecycle costs part of purchasing decision
• All depts are involved in purchasing process
• OEE is improving fastStandardized parts list is widely used
• Maintenance system exists with good results
• Diagnostic toolsare introduced
• Strategy for major equipment is in place
• Machine history is recorded and analyzed
• Criticality of partsis understood
• Spare parts inventorieshave been decreased and new standards set
• Parts usage is kept under control
• Pressure is on parts quality
• Span of control
manageable
• Staffing is applied well
across shifts
• Few classifications
exist
• Maintenance is involvedin purchasing of new equipment
• TCO is defined• Standardization has begun• Model lifecycle cost
equipment exists
• Parts usage, quality, availability, and inventories have to be placed under control
• No clear maintenance strategy exists
• Breakdown maintenance widely used
• Organizational
structure unclear
• Large number of
classifications
• Staffing weak on shifts
• New equipment purchasing is based on initial cost and technical specifications
• Vendors are selected• Parts availability and
usage daily tracking is in place
• Pull replenishment system is in place to reorder parts
Early equipment management
Level 1“Expert”“Best Practice”
Level 3
Level 4“Basic”
Level 2
SRK Consulting
Engineers and Scientists1
0
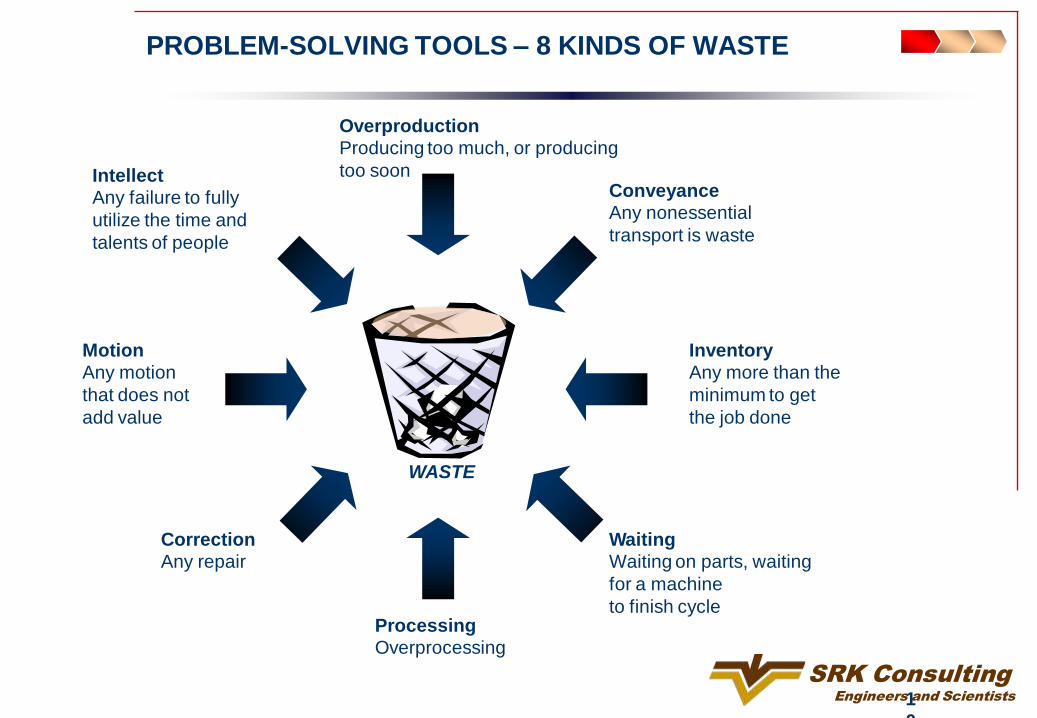
Overproduction
Producing too much, or producing
too soon
Processing
Overprocessing
Intellect
Any failure to fully
utilize the time and
talents of people
Motion
Any motion
that does not
add value
Correction
Any repair
Conveyance
Any nonessential
transport is waste
Inventory
Any more than the
minimum to get
the job done
Waiting
Waiting on parts, waiting
for a machine
to finish cycle
PROBLEM-SOLVING TOOLS – 8 KINDS OF WASTE
WASTE

SRK Consulting
Engineers and Scientists
ANALYTICAL TOOLS - TECHNICAL LIMITS
Target
performance
Avoidable
losses
Technical
limit
Theoretical
limit
• Unavoidable
losses, e.g.,
– Required PMs
– Losses from local
conditions (e.g.
ore hardness)
– Safety/logistical
constraints
• Avoidable losses or
waste e.g.,
– Excessive
downtime
– Speed losses
– Idle time
• Targeted gap to
close
– Typically set at
~50% of gap to
technical limit
Unavoidable
losses
Current
performance
Target
improvement
Utopian‟ limit or
„perfection‟, interesting
but not achievable
Utopian‟ limit less
unavoidable losses – what is
technically achievable
• Technical limit is
not the theoretical
limit
• Estimating
„unavoidable‟
losses is often the
key issue
• Improvement
target based on
gap between
current and
technically
achievable
performance
%

SRK Consulting
Engineers and Scientists
Distribution of working time
Hours/shift/loader
3.1
3.21.7
0.2
3.2
0.6
4.0
12
Total hours
(theoretical)
Unavoidable
losses
Avoidable
losses
Excess
SOS/EOS
Unadjusted
metered
engine hrs
Engine
hours on
ore
Other tasks
correction
Includes:
•11-12hr diff.
•PM‟s
•EOS/SOS
100minsIncludes:
•Breakdowns
•no operator
• workplace av.
•Planning &
supervision
Includes:
•Share with dev
•Fix ventilation
•Load trucks
•Rehandle
1.7hrs gap must be
combination of:
•Excess EOS/SOS
•Lunch
•Poor reporting
•Breaks
Tramming
correction
Includes:
•for 20mins travel to & from
workplace
ANALYTICAL TOOLS - EXAMPLE OF TIME LOSSES ON LOADERS
NB EOS represents End of Shift and SOS represents Start of Shift
PM is Preventative Maintenance

SRK Consulting
Engineers and Scientists
mins/shift
Analysis of contractor drilling crew in ore
480
360
70
50
10
225
120
Total shift
length
SOS/EOS
travel time
Total time
available
Maintenance Drilling time
EXCESS DUE TO:
• Late start, early finish
• Blasting
• „Achieved target‟ mentality – stopped work because
face was drilled and a separate (unnecessary)
charging crew arrived
Face
preparation
Excess
ANALYTICAL TOOLS - EXAMPLE OF TIME LOSSES ON DRILLING

SRK Consulting
Engineers and Scientists
TOOLS FOR ROOT CAUSE PROBLEM SOLVING: 5-WHY ANALYSIS
Old and new
parts mixed
Why No. 1
Why No. 2
Why No. 3
Why No. 4
Why No. 5 AccountabilityNo parts
available
PMs not
deep enough
Poor PM
compliance
No parts room
5S programmePoor training
No
accountability
No set-up
procedures
Broken oil linesNonfunctional
oilersLack of skill
No
standardisatio
n
Poor lubrication Old parts Incorrect setup
Incorrect
alignment
Out of
alignment
Worn parts
No post set-up
documentation
Root cause

SRK Consulting
Engineers and Scientists
PRIORITIZATION OF IMPROVEMENT IDEASP
ote
nti
al
valu
e
Ease of Implementation
Difficult Easy
Low
High
“Defer”
“Go Do”“High Priority”
“Second Priority
„Go Do‟s‟”
• Operational Risks (irreversible?)
• Need for capital
• Timing/resources required
• Second wave• Evaluate these
first & implement
ASAP
• Evaluate later • Second wave
• Action Plans
can be
generated
based on
priorities
• Prioritized list
of ideas to be
further
evaluated
Grinding Media
Recovery
Maintenance strategy
(Availability)
Underground
Production
Power
Throughput
Maintenance Costs
Process Availability

SRK Consulting
Engineers and Scientists
IMPLEMENTATION PHASE
• Take improvement ideas /
solutions and make them
happen
• Sustain the improvements in
the medium to long term
• Roll out to other operations
• Start to build continuous
improvement culture
Objectives
• Planning, trialing, communication of
benefits, following up, reporting
• This involves change – new technology,
enhanced designs, different working
practices, change in organization, change
in planning, changing strategy and focus
• Hardest part of an improvement initiative,
communication is key
• Requires commitment from the top down
and bottom up – workforce is key
Activities

SRK Consulting
Engineers and Scientists
Flow
chart
Gantt
chart
Flow charts are utilized to show logical steps involved in implementing plan
Gantt charts organize steps to be implemented and timing for each activity
Developplan
Kick offmeeting Run trial
Modify
Modifyequipment
Reviewresults
Confirmparts
Standardise
Develop implementation plan1
What
Hold kick off meeting
Start machine modification
Run trial
Confirm parts
Report status
Modify if necessary
Standardized8
7
6
5
4
3
2
Who Timeline
PLANNING SOLUTION IMPLEMENTATION

SRK Consulting
Engineers and Scientists
KEY ELEMENTS FOR SUCCESSFUL IMPLEMENTATION
• Develops explicit action plan for each
idea with well-understood actions,
accountabilities, and milestones
• Integrates approved ideas
into master plan for unit
– Sequences ideas to maximize
cash flow given the difficulty
of implementation
– Reprioritizes current activities
(as appropriate) to account for
new activities/responsibilities
• Builds understanding and
commitment to plans among
all relevant managers/stakeholders
• Monitoring process to ensure
full implementation
– Tracking of KPIs and actions
– Regularly scheduled
review meetings
• Identifies gaps vs. planned
performance and ensures
corrective actions taken
Comprehensive action plans Ongoing tracking process
Integrated into
performance management
“No-escape” process to make improvements happen!
+
SRK Consulting
Engineers and Scientists
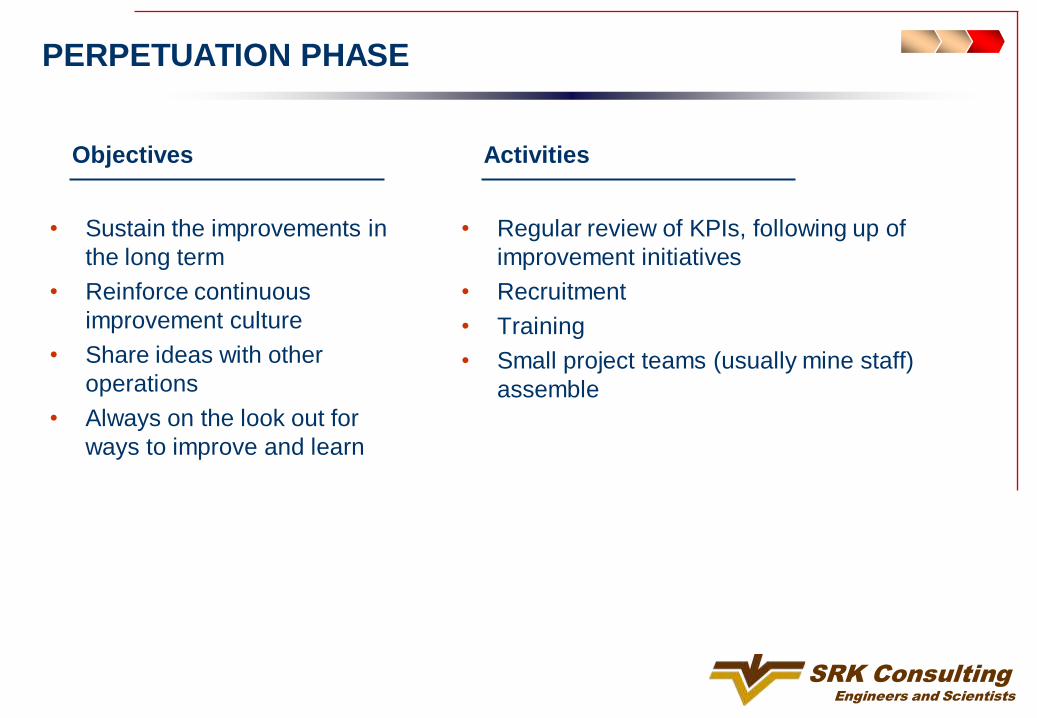
PERPETUATION PHASE
• Sustain the improvements in
the long term
• Reinforce continuous
improvement culture
• Share ideas with other
operations
• Always on the look out for
ways to improve and learn
Objectives
• Regular review of KPIs, following up of
improvement initiatives
• Recruitment
• Training
• Small project teams (usually mine staff)
assemble
Activities

SRK Consulting
Engineers and Scientists
PERPETUATION PHASE
Regular review meetings focused on
activities and impact. . . . . .by asking 4 key questions
1. Did we do what we said we would
do?
2. Are we getting the impact?
3. What are we going to do about it?
4. What else can we do?

SRK Consulting
Engineers and Scientists
HOW IS BUSINESS IMPROVEMENT APPLIED ?
• Review team visits
site and prepares a
Phase 1 plan in
conjunction with mine
staff
• A joint consultant /
mine staff team
carries out the Phase
1 work
• 3 to 9 months
Diagnosis, analysis,
planningImplementation Perpetuation
Phase 1 Phase 2 Phase 3
3-Step Process
• The focus for
implementation is on
the mine staff with
training and support
from consultants
• 6 months to 2 years
• Perpetuation is the
responsibility of mine staff
with periodic reviews by
external consultants
• ongoing

SRK Consulting
Engineers and Scientists
WHAT CAN GO WRONG?
• Insufficient „buy-in‟ from senior management leading to apathy and low motivation in the
improvement teams
• Insufficient „buy-in‟ from workers and middle management leading to complaints like “why weren‟t
we consulted?”
• Poorly performing staff / departments can be rapidly pinpointed by enhanced reporting systems, this
can lead to severe disruption if personnel changes are made during the project
• Fix everything today. Divide solution into easily manageable steps that can be monitored
• Breakdown of communication – everyone affected by the solution must be included in the
implementation process. Keep everyone informed about what is happening – the plan, the goal, and
how effectively things are being done. In Russia, language and prevailing culture can be an issue
• Mismanaged expectations. Be sure everyone knows what they have to do and stay in close touch
with your manager
• Slow progress. Develop ways to streamline procedures, policies etc.
• Jargon. Some management consultants use jargon which can confuse and alienate
• Tangible deliverables. Important to focus on results in short, medium and long term
• Cultural differences. Agents of change must accept where they are and what is the norm
• Lack of technical knowledge. Many management consultants target work in the mining industry
using specialists from manufacturing backgrounds who do not understand the technical aspects of
mining – must go on a learning curve

SRK Consulting
Engineers and Scientists
WHAT IS THE SRK APPROACH?
• SRK philosophy – technically based, business focused, „hands
on‟ approach, providing the means by which mines can help
themselves
• What do we like to see:
- Commitment to change – reject the status quo
- Strategy fully understood through every level
- Well qualified people in the right positions
- Ordered organization chart – spans of control and intervals of control
- Strong management operating system – KPI reporting, reconciliation
- Performance management – operational equipment effectiveness
- Well planned maintenance – focus on metrics, no unplanned downtime
- Strong technical dept – grade control, measurement, LoM plans and cash
flow models, proper cut off grades
- Motivation – effective supervision, incentive schemes that relate reward to
achievements, good discipline