Embed Size (px)
Citation preview
ISPRS Workshop on Service and Application of Spatial Data Infrastructure, XXXVI (4/W6), Oct.14-16, Hangzhou, China
155
AN INTEGRATED MULTI-GOAL REGIONAL PLANNING PLATFORM BASED ON REMOTE SENSING AND GIS
Xinhui Ma, Bingfang Wu *, Zhiming Luo, Lan Zeng
Institute of Remote Sensing Applicat ions, Chinese Academy of Sciences, datun Road No. 3, P. O. Box 9718, 100101, Beijing, P.R. China. [email protected]
KEY WORDS: Multi-goal regional planning, Remote sensing, Platform, Chong Qing
* Corresponding author: Tel. +86-10-64889564. E-mail: [email protected] (Prof. WU).
ABSTRACT: The paper studies the design and construction of multi-goal regional planning integrated platform based on remote sensing and GIS, and it mainly discusses planning data integration method, structure of the platform and regional planning decision support application based on the platform. It analyzes comprehensive indicators and information systems for multi-goal regional planning at first, which is the theory foundation of the platform. Then, the paper describes the integration solutions, data process models and geocoding in detail, which are applied to integrate all planning information. Finally, the paper introduces a case study of multi-goal regional planning integrated platform. Three study areas at different scales were selected, which are Chong Qing city, Yong Chuan city and Yu Zhong district.
1. INTRODUCTION
In China, national economy and social planning, land use planning, urban planning, sector planning and important special planning constitute the whole planning system. As in most countries of the world, economic and social demands are often in conflict with environmental issues, and these types of planning (especially economy and social planning and land use planning, urban planning) are sometimes inconsistent with each other, from the constitution of planning goals at the beginning, the execution of the planning to the results. However, there are some other direct reasons for the conflict of these types of planning in China(Hu, 2002; Zhu and Ji, 2000; Luo,2004). For example, different departments execute planning respectively, and the execution of the planning is lack of law security. Above all, discrepant data sources and indicators system which these types of planning use are the keys of the problem. Comparatively speaking, national economy and social planning plan forecast regional economy based on statistical indicators without definite spatial relationship. It emphasizes time progress and department harmony and seldom considers space. Land use planning and urban planning are leaded by national economy and social planning plan’s controlled indicators and goal indicators, and arrange economy spatially based on spatial data. Because statistical indicators and spatial data do not match each other, these types of planning are inconsistent. Moreover, one kind of data can be acquired by different methods. As far as land use data is concerned, it can be obtained by three ways, which are statistical survey, measurement and remote sensing. With the development of Geographic Information System (GIS) and multi-scale (spatial, spectral, temporal) remote sensing, the application of them on regional planning is effective to integrate these types of planning(Luo, 2004; Wu and Zhang, 2003). Remote sensing can provide much fundamental data for planning, monitor change and examine planning implementation. GIS can be applied in spatial distribution
analysis, simulation analysis, data management and information proclamation, etc. In this paper, multi-goal regional planning means integration of three types of important planning, national economy and social planning, land use planning and urban planning. The paper studies the design and construction of multi-goal regional planning integrated platform based on remote sensing and GIS, and it mainly discusses planning data integration method, structure of the platform and regional planning decision support application based on the platform. The research is supported by one of subjects of 863 Project.
2. MULTI-GOAL REGIONAL PLANNING INDICATORS AND INFORMATION SYSTEMS
Economic and social information, remote sensing information and fundamental geo-information constitute multi-goal regional planning information system. They are important and indispensable to multi-goal regional planning. The study summarizes the integrated indicators system for multi-goal regional planning after detailed analysis on the information systems at national economy and social planning, land use planning and urban planning.
2.1. Comprehensive indicators system
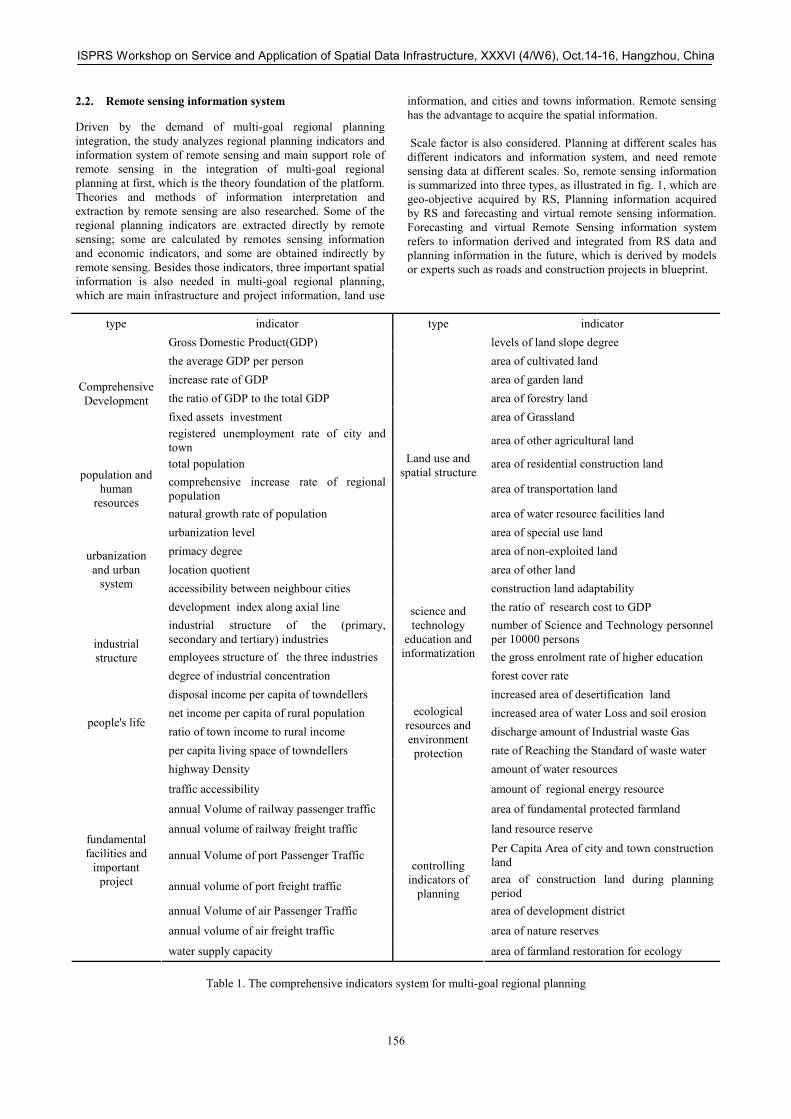
The comprehensive indicators system is a compromise among the three types of planning. The study gives the highest priority to the demand of national economic and social planning and also gives attention to the other two types of planning. On the other hand, it considers scale factor and emphasizes the information and contents for the planning at province level while it takes land use planning and urban planning into account. The indicators system involves 10 types and about 90 indicators, which provides the foundation of the integrated platform. Table 1 lists main indicators in each type.
ISPRS Workshop on Service and Application of Spatial Data Infrastructure, XXXVI (4/W6), Oct.14-16, Hangzhou, China
156
2.2. Remote sensing information system
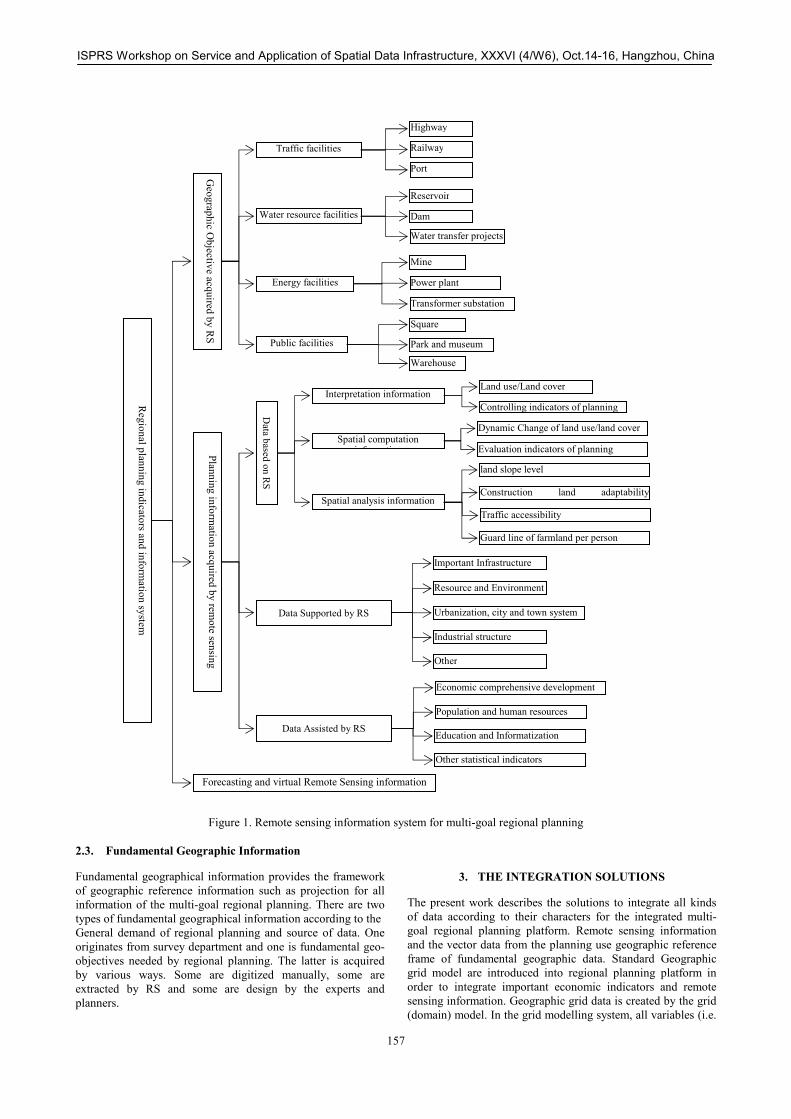
Driven by the demand of multi-goal regional planning integration, the study analyzes regional planning indicators and information system of remote sensing and main support role of remote sensing in the integration of multi-goal regional planning at first, which is the theory foundation of the platform. Theories and methods of information interpretation and extraction by remote sensing are also researched. Some of the regional planning indicators are extracted directly by remote sensing; some are calculated by remotes sensing information and economic indicators, and some are obtained indirectly by remote sensing. Besides those indicators, three important spatial information is also needed in multi-goal regional planning, which are main infrastructure and project information, land use
information, and cities and towns information. Remote sensing has the advantage to acquire the spatial information. Scale factor is also considered. Planning at different scales has different indicators and information system, and need remote sensing data at different scales. So, remote sensing information is summarized into three types, as illustrated in fig. 1, which are geo-objective acquired by RS, Planning information acquired by RS and forecasting and virtual remote sensing information. Forecasting and virtual Remote Sensing information system refers to information derived and integrated from RS data and planning information in the future, which is derived by models or experts such as roads and construction projects in blueprint.
Table 1. The comprehensive indicators system for multi-goal regional planning
type indicator type indicator Gross Domestic Product(GDP) levels of land slope degree the average GDP per person area of cultivated land increase rate of GDP area of garden land the ratio of GDP to the total GDP area of forestry land fixed assets investment area of Grassland
Comprehensive Development
registered unemployment rate of city and town area of other agricultural land
total population area of residential construction land comprehensive increase rate of regional population area of transportation land
population and human
resources natural growth rate of population area of water resource facilities land urbanization level area of special use land primacy degree area of non-exploited land location quotient area of other land accessibility between neighbour cities
Land use and spatial structure
construction land adaptability
urbanization and urban
system
development index along axial line the ratio of research cost to GDP industrial structure of the (primary, secondary and tertiary) industries
number of Science and Technology personnel per 10000 persons
employees structure of the three industries
science and technology
education and informatization the gross enrolment rate of higher education
industrial structure
degree of industrial concentration forest cover rate disposal income per capita of towndellers increased area of desertification land net income per capita of rural population increased area of water Loss and soil erosion ratio of town income to rural income discharge amount of Industrial waste Gas
people's life
per capita living space of towndellers rate of Reaching the Standard of waste water highway Density amount of water resources
traffic accessibility
ecological resources and environment protection
amount of regional energy resource
annual Volume of railway passenger traffic area of fundamental protected farmland
annual volume of railway freight traffic land resource reserve
annual Volume of port Passenger Traffic Per Capita Area of city and town construction land
annual volume of port freight traffic area of construction land during planning period
annual Volume of air Passenger Traffic area of development district
annual volume of air freight traffic area of nature reserves
fundamental facilities and
important project
water supply capacity
controlling indicators of
planning
area of farmland restoration for ecology
ISPRS Workshop on Service and Application of Spatial Data Infrastructure, XXXVI (4/W6), Oct.14-16, Hangzhou, China
157
Figure 1. Remote sensing information system for multi-goal regional planning
2.3. Fundamental Geographic Information
Fundamental geographical information provides the framework of geographic reference information such as projection for all information of the multi-goal regional planning. There are two types of fundamental geographical information according to the General demand of regional planning and source of data. One originates from survey department and one is fundamental geo-objectives needed by regional planning. The latter is acquired by various ways. Some are digitized manually, some are extracted by RS and some are design by the experts and planners.
3. THE INTEGRATION SOLUTIONS
The present work describes the solutions to integrate all kinds of data according to their characters for the integrated multi-goal regional planning platform. Remote sensing information and the vector data from the planning use geographic reference frame of fundamental geographic data. Standard Geographic grid model are introduced into regional planning platform in order to integrate important economic indicators and remote sensing information. Geographic grid data is created by the grid (domain) model. In the grid modelling system, all variables (i.e.
Planning information acquired by rem
ote sensing
Regional planning indicators and inform
ation system
Geographic O
bjective acquired by RS
Highway
Railway
Port
Traffic facilities
Reservoir
Dam
Water transfer projects
Water resource facilities
Mine
Power plant
Transformer substation
Energy facilities
Square
Park and museum
Warehouse
Public facilities
Interpretation information
Spatial computation i f ti
Spatial analysis information
Important Infrastructure
Resource and Environment
Urbanization, city and town system Data Supported by RS
Industrial structure
Other
Economic comprehensive development
Population and human resources
Education and InformatizationData Assisted by RS
Other statistical indicators
Forecasting and virtual Remote Sensing information
Data based on R
S
Land use/Land cover
Controlling indicators of planning
Dynamic Change of land use/land cover
Evaluation indicators of planning
land slope level
Construction land adaptability
Traffic accessibility
Guard line of farmland per person
ISPRS Workshop on Service and Application of Spatial Data Infrastructure, XXXVI (4/W6), Oct.14-16, Hangzhou, China
158
indicators, land use, elevation, etc.) are defined at the centre of each grid cell. The model processes and spatially discretizes multi- temporal, multi-spatial remote sensing data, economic statistical indicators and fundamental geographic data in the same grid system. If each grid cell is seen as geographic entity object, remote sensing information, economic statistical indicators and some fundamental geo-information become the attributes of each grid cell. In the same geographic reference frame and grid system, many spatial analysis and computation among the three types information can be realized on the platform for multi-goal regional planning. It is important to note that not any economic statistical indicators and fundamental geo-information can be spatially processed in the geographic grid model. Only those have quantitative or definite spatial relationship can be processed in the model. Administrative division cell is very important for the three types of planning, which derives from fundamental geo-information. It can be seen as another kind of geographic entity object. Most economic statistical indicators base on the Administrative area and some base on special division cell in China. So, economic statistical indicators including those couldn’t be processed in the grid model can be integrated with remote sensing data in the same Administrative division cell. In a conclusion, multi-goal regional planning information can be integrated by the following methods:
1. All data use the same geographic reference frame of fundamental geographic data. 2. Remote sensing data and some economic statistical indicators are integrated in the same geographic grid system. 3. Some economic statistical indicators and remote sensing information are integrated in the same administrative division cell. 4. Some other information are integrated in the same special division cell.
Thus, Remote sensing data, economic statistical indicators, fundamental geo-information and special planning information are matched spatially and integrated together thoroughly in the platform.
4. DATA MODELLING AND GEOCODING
There are both Vector data and raster data in the platform. Therefore, mixed data structure models are applied to the databases. Because multi-goal regional planning must be supported by various and abundant data and it is impossible that one department provide and accomplish all kinds of data, several main related departments participate in the construction of the corporate databases, which are regional geomatic center, urban planning department and land resources department and
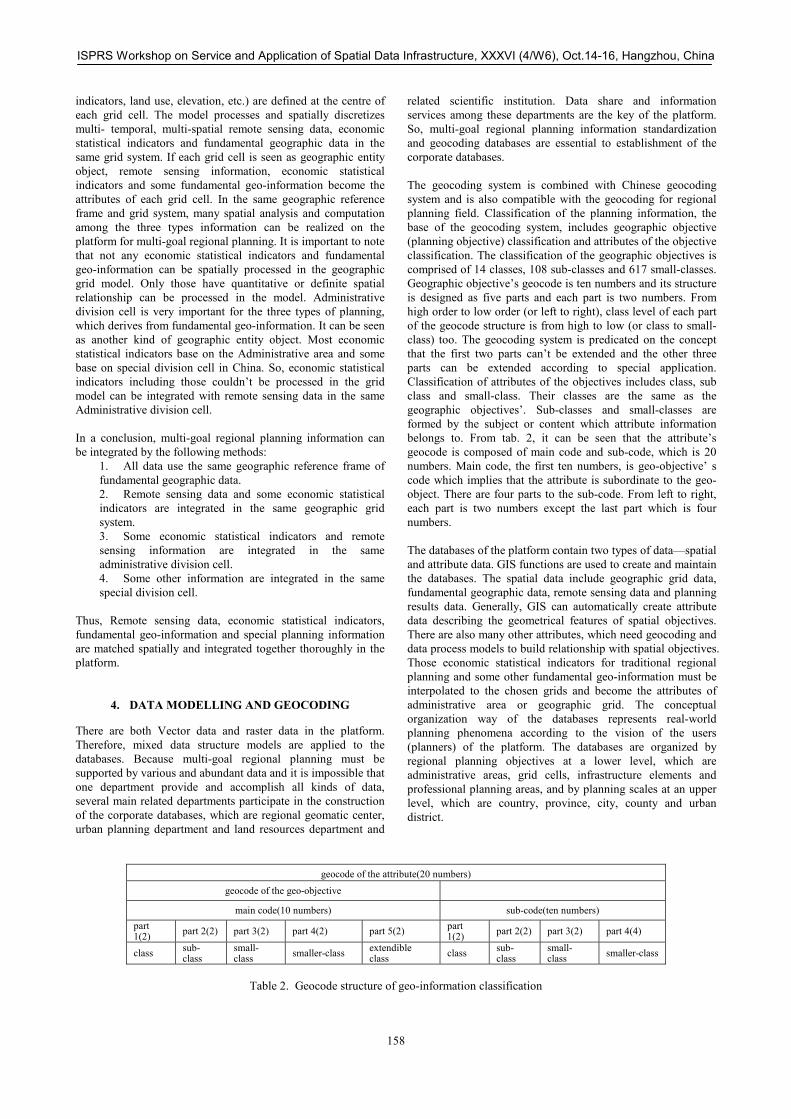
related scientific institution. Data share and information services among these departments are the key of the platform. So, multi-goal regional planning information standardization and geocoding databases are essential to establishment of the corporate databases. The geocoding system is combined with Chinese geocoding system and is also compatible with the geocoding for regional planning field. Classification of the planning information, the base of the geocoding system, includes geographic objective (planning objective) classification and attributes of the objective classification. The classification of the geographic objectives is comprised of 14 classes, 108 sub-classes and 617 small-classes. Geographic objective’s geocode is ten numbers and its structure is designed as five parts and each part is two numbers. From high order to low order (or left to right), class level of each part of the geocode structure is from high to low (or class to small-class) too. The geocoding system is predicated on the concept that the first two parts can’t be extended and the other three parts can be extended according to special application. Classification of attributes of the objectives includes class, sub class and small-class. Their classes are the same as the geographic objectives’. Sub-classes and small-classes are formed by the subject or content which attribute information belongs to. From tab. 2, it can be seen that the attribute’s geocode is composed of main code and sub-code, which is 20 numbers. Main code, the first ten numbers, is geo-objective’ s code which implies that the attribute is subordinate to the geo-object. There are four parts to the sub-code. From left to right, each part is two numbers except the last part which is four numbers. The databases of the platform contain two types of data—spatial and attribute data. GIS functions are used to create and maintain the databases. The spatial data include geographic grid data, fundamental geographic data, remote sensing data and planning results data. Generally, GIS can automatically create attribute data describing the geometrical features of spatial objectives. There are also many other attributes, which need geocoding and data process models to build relationship with spatial objectives. Those economic statistical indicators for traditional regional planning and some other fundamental geo-information must be interpolated to the chosen grids and become the attributes of administrative area or geographic grid. The conceptual organization way of the databases represents real-world planning phenomena according to the vision of the users (planners) of the platform. The databases are organized by regional planning objectives at a lower level, which are administrative areas, grid cells, infrastructure elements and professional planning areas, and by planning scales at an upper level, which are country, province, city, county and urban district.
geocode of the attribute(20 numbers)
geocode of the geo-objective
main code(10 numbers) sub-code(ten numbers) part 1(2) part 2(2) part 3(2) part 4(2) part 5(2) part
1(2) part 2(2) part 3(2) part 4(4)
class sub-class
small-class smaller-class extendible
class class sub-class
small-class smaller-class
Table 2. Geocode structure of geo-information classification
ISPRS Workshop on Service and Application of Spatial Data Infrastructure, XXXVI (4/W6), Oct.14-16, Hangzhou, China
159
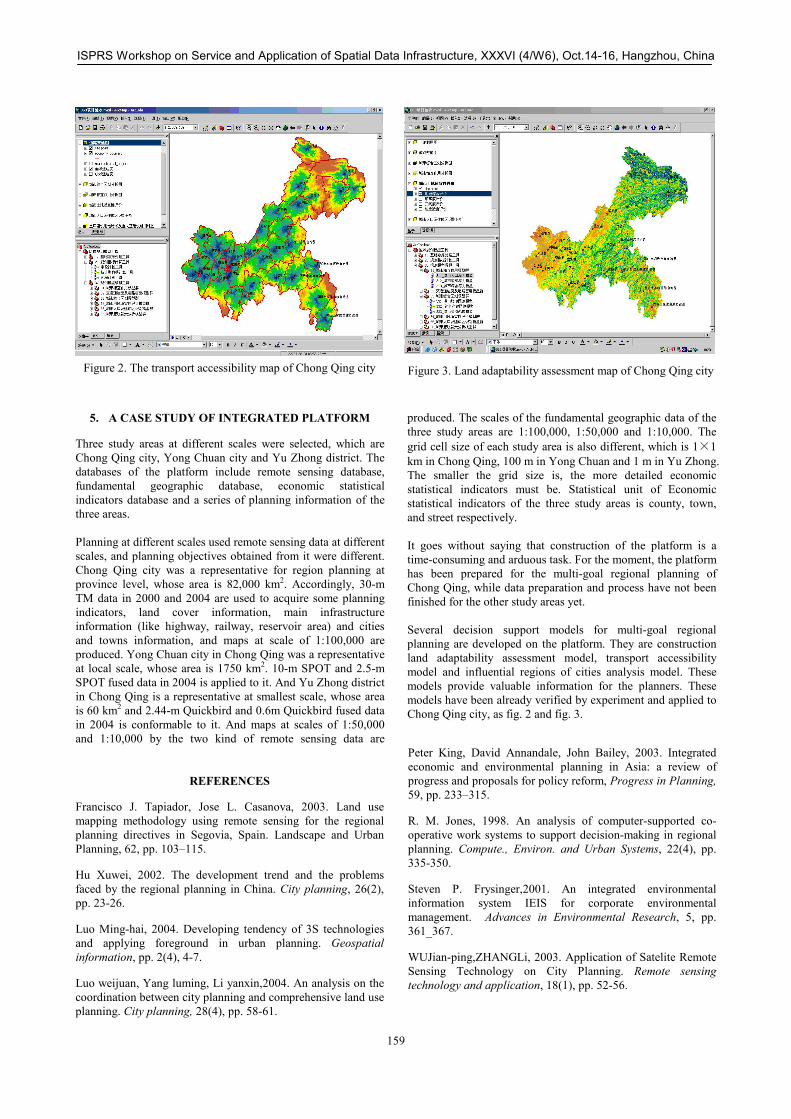
5. A CASE STUDY OF INTEGRATED PLATFORM
Three study areas at different scales were selected, which are Chong Qing city, Yong Chuan city and Yu Zhong district. The databases of the platform include remote sensing database, fundamental geographic database, economic statistical indicators database and a series of planning information of the three areas. Planning at different scales used remote sensing data at different scales, and planning objectives obtained from it were different. Chong Qing city was a representative for region planning at province level, whose area is 82,000 km2. Accordingly, 30-m TM data in 2000 and 2004 are used to acquire some planning indicators, land cover information, main infrastructure information (like highway, railway, reservoir area) and cities and towns information, and maps at scale of 1:100,000 are produced. Yong Chuan city in Chong Qing was a representative at local scale, whose area is 1750 km2. 10-m SPOT and 2.5-m SPOT fused data in 2004 is applied to it. And Yu Zhong district in Chong Qing is a representative at smallest scale, whose area is 60 km2 and 2.44-m Quickbird and 0.6m Quickbird fused data in 2004 is conformable to it. And maps at scales of 1:50,000 and 1:10,000 by the two kind of remote sensing data are
produced. The scales of the fundamental geographic data of the three study areas are 1:100,000, 1:50,000 and 1:10,000. The grid cell size of each study area is also different, which is 1×1 km in Chong Qing, 100 m in Yong Chuan and 1 m in Yu Zhong. The smaller the grid size is, the more detailed economic statistical indicators must be. Statistical unit of Economic statistical indicators of the three study areas is county, town, and street respectively. It goes without saying that construction of the platform is a time-consuming and arduous task. For the moment, the platform has been prepared for the multi-goal regional planning of Chong Qing, while data preparation and process have not been finished for the other study areas yet. Several decision support models for multi-goal regional planning are developed on the platform. They are construction land adaptability assessment model, transport accessibility model and influential regions of cities analysis model. These models provide valuable information for the planners. These models have been already verified by experiment and applied to Chong Qing city, as fig. 2 and fig. 3.
REFERENCES
Francisco J. Tapiador, Jose L. Casanova, 2003. Land use mapping methodology using remote sensing for the regional planning directives in Segovia, Spain. Landscape and Urban Planning, 62, pp. 103–115.
Hu Xuwei, 2002. The development trend and the problems faced by the regional planning in China. City planning, 26(2), pp. 23-26.
Luo Ming-hai, 2004. Developing tendency of 3S technologies and applying foreground in urban planning. Geospatial information, pp. 2(4), 4-7.
Luo weijuan, Yang luming, Li yanxin,2004. An analysis on the coordination between city planning and comprehensive land use planning. City planning, 28(4), pp. 58-61.
Peter King, David Annandale, John Bailey, 2003. Integrated economic and environmental planning in Asia: a review of progress and proposals for policy reform, Progress in Planning, 59, pp. 233–315.
R. M. Jones, 1998. An analysis of computer-supported co-operative work systems to support decision-making in regional planning. Compute., Environ. and Urban Systems, 22(4), pp. 335-350.
Steven P. Frysinger,2001. An integrated environmental information system IEIS for corporate environmental management. Advances in Environmental Research, 5, pp. 361_367.
WUJian-ping,ZHANGLi, 2003. Application of Satelite Remote Sensing Technology on City Planning. Remote sensing technology and application, 18(1), pp. 52-56.
Figure 2. The transport accessibility map of Chong Qing city Figure 3. Land adaptability assessment map of Chong Qing city

ISPRS Workshop on Service and Application of Spatial Data Infrastructure, XXXVI (4/W6), Oct.14-16, Hangzhou, China
160
Zhu Caibin, Ji Guangheng, 2000. Study on comprehensive city planning and comprehensive land use planning from the point of planning system. Planners, 16(3), pp. 10-13.
ACKNOWLEDGEMENT
The study was funded by one of subjects of National 863 Program Project (No. 2003AA131090-4) and also benefited a lot from ecology and environment monitoring information system construction project for Three Gorges Project (SX[2002]-003).

![Integrated Platform for Motor Stator Sound … Platform for Motor...Integrated Platform for Motor Stator Sound Power Simulation W. Huang, ... Resonance at 7200Hz ... LLC. • [3]](https://img.pdfslide.us/doc/110x75/5b40a9fc7f8b9a91078d7cc1/integrated-platform-for-motor-stator-sound-platform-for-motorintegrated-platform.jpg)


![Oracle Communications Platform® Communications Platform TPD Initial Product ... [2] Oracle Integrated](https://img.pdfslide.us/doc/110x75/5afcad0d7f8b9a994d8c6cf9/oracle-communications-platform-communications-platform-tpd-initial-product-2.jpg)