Embed Size (px)
Citation preview
NASP 2013 Seattle ‐ Justin Potts & Karen Apgar 2/12/2013
NASP Session MS013 1
Eugene 4J SDEugene, OR
Justin Potts, MS, NCSPKaren Apgar, MA/CAGS NCSP
AN INTEGRATED MODELTHE “CUTTING EDGE” OF SLD
IDENTIFICATION
pswpro.wordpress.com
For more information, please visit:
WHAT ARE PEOPLE TALKING ABOUT?
59
47
39
36
34
27
24
22
22
19
How to define weaknesses and strengths in cognitive...
School Psychologist salary/extended days
RTI VS. Testing for IDing SLD
Communique: Phonological Awareness Testing
need a teaching certificate to be a school psychologist?
What I wish private practitioners knew about schools...
skipping a grade
Dyslexia - IEP or 504 in high school?
Processing and SLD
school psychologist use of title
NASP Member Exchange - 1 Year Top 10 RepliesNumber of Replies
NASP 2013 Seattle ‐ Justin Potts & Karen Apgar 2/12/2013
NASP Session MS013 2
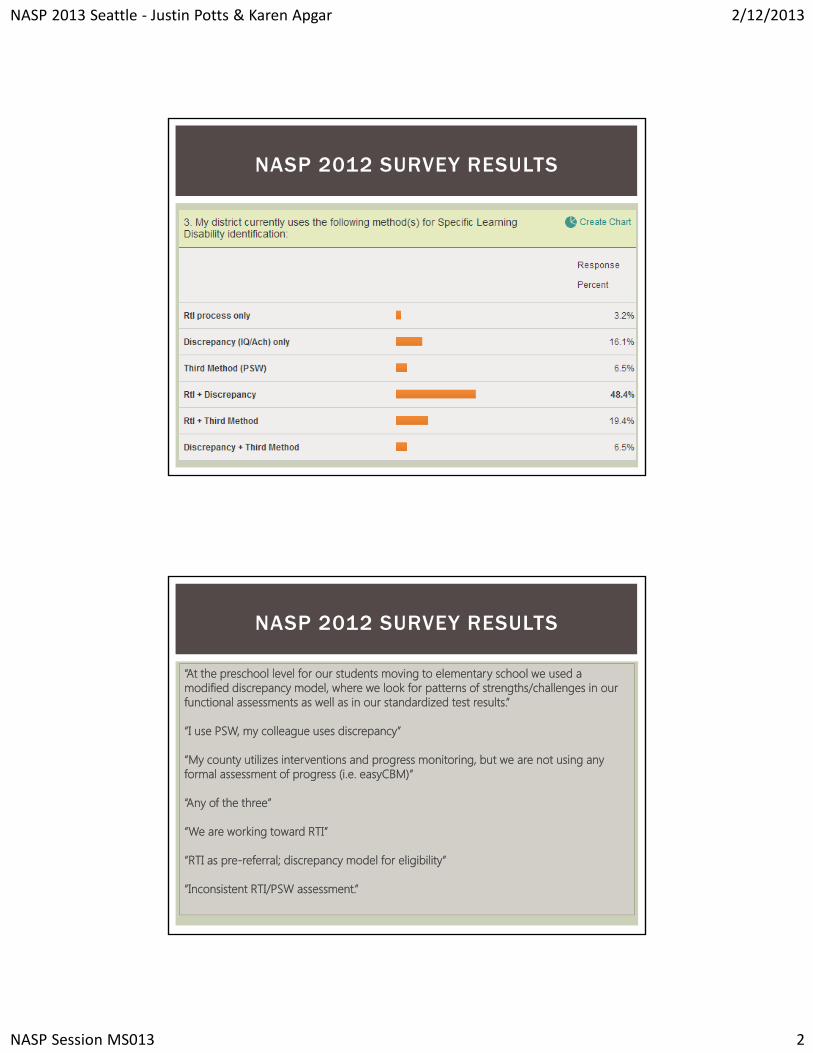
NASP 2012 SURVEY RESULTS
NASP 2012 SURVEY RESULTS
“At the preschool level for our students moving to elementary school we used a modified discrepancy model, where we look for patterns of strengths/challenges in our functional assessments as well as in our standardized test results.”
“I use PSW, my colleague uses discrepancy”
“My county utilizes interventions and progress monitoring, but we are not using any formal assessment of progress (i.e. easyCBM)”
“Any of the three”
“We are working toward RTI”
“RTI as pre-referral; discrepancy model for eligibility”
“Inconsistent RTI/PSW assessment.”
NASP 2013 Seattle ‐ Justin Potts & Karen Apgar 2/12/2013
NASP Session MS013 3
A WORD ON DISCREPANCY…
“The questionable reliability associated with some tests used in determining discrepancy almost ensures the presence of regression effects (Coles, 1978; Thurlow & Ysseldyke, 1979). “
The test validity question is captured in what Kelley (1927) long ago labeled the “jingle and jangle” fallacy—the assumption that tests with the same names measure similar functions, or that tests with different names measure different functions.”
“The many associated problems made the expectancy approach a less than optimal means of determining and interpreting a “significant” discrepancy (Davis & Shepard, 1983).”
“L. R. Wilson, Cone, Busch, and Allee (1983) discussed the incorrect assumption thatachievement follows a linear growth pattern which results in an inherent bias when discrepancy is defined as a fraction of some expected achievement value because of different slopes in the patterns.”
“Finally, O’Donnell (1980) found that a discrepancy derived from an expectancy formula was not a distinctive characteristic of LD and was equally likely to be found among other students with disabilities.”
Kavale, K.A. (2001) Discrepancy models in the identification of learning disabilities. Executive summary. Paper presented at the Learning Disabilities Summit (Washington, DC, Aug 27-28, 2001)
“In actuality, the resulting prevalence rates ranged from 1% to 37% (Sinclair, Guthrie, & Forness, 1984). Confounding this variability was the additional finding that in a sample of students deemed eligible for LD programs, 64% were not identified by any expectancy formula (Sinclair & Alexson, 1986).”
OSEP Letter to Zirkel, 2008
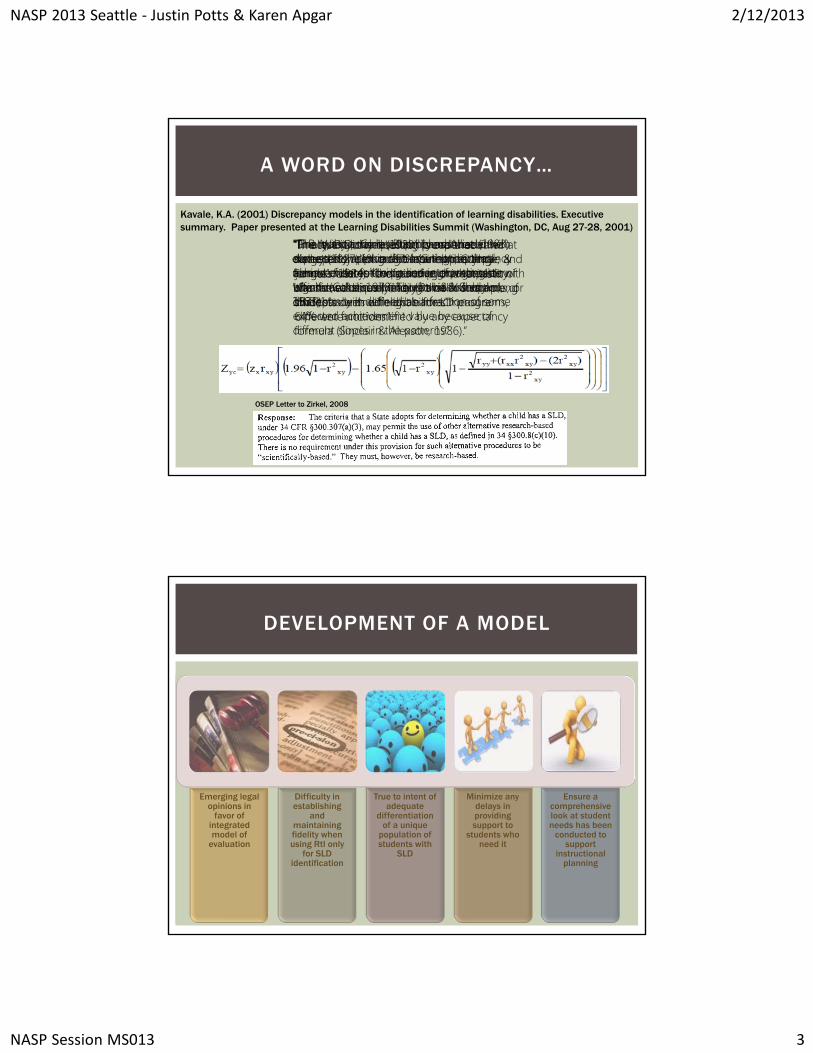
DEVELOPMENT OF A MODEL
Emerging legal opinions in
favor of integrated model of
evaluation
Difficulty in establishing
and maintaining fidelity when using RtI only
for SLD identification
True to intent of adequate
differentiation of a unique
population of students with
SLD
Minimize any delays in providing support to
students who need it
Ensure a comprehensive look at student needs has been
conducted to support
instructional planning
NASP 2013 Seattle ‐ Justin Potts & Karen Apgar 2/12/2013
NASP Session MS013 4
What informat ion would you l ike to rev iew the most?
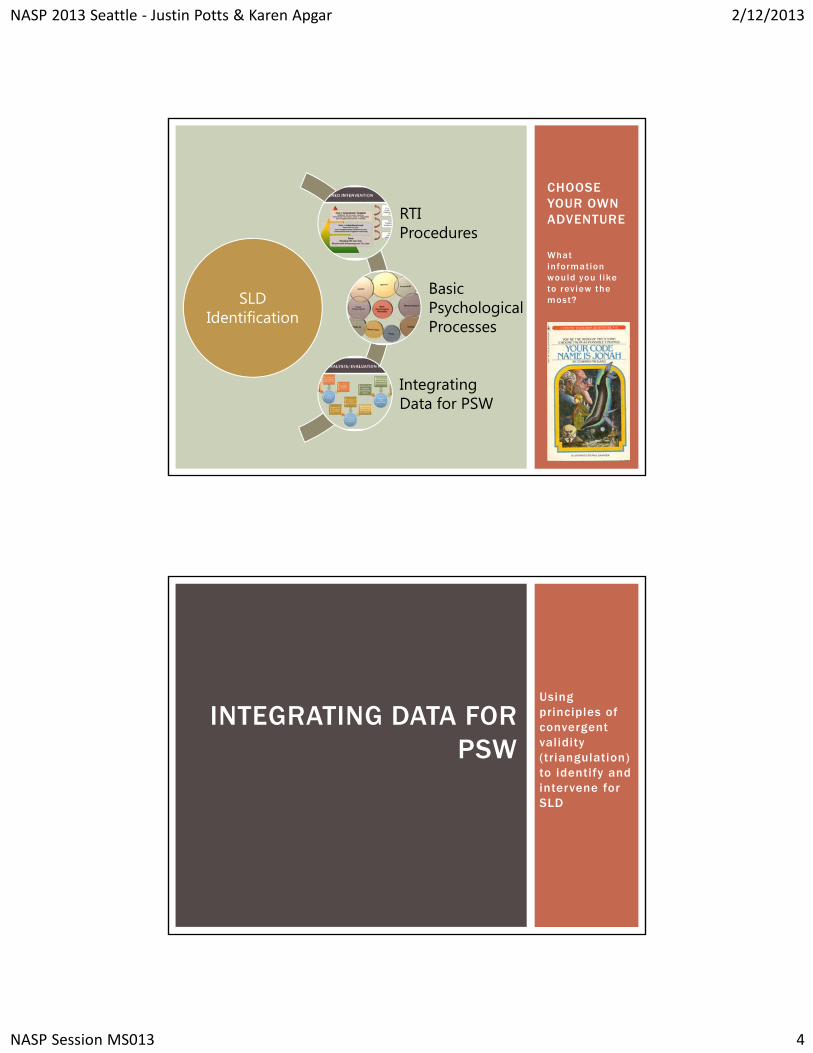
CHOOSE YOUR OWN ADVENTURE
SLD Identification
RTI Procedures
BasicPsychologicalProcesses
Integrating Data for PSW
Using principles of convergent validity (triangulation) to identify and intervene for SLD
INTEGRATING DATA FOR PSW
NASP 2013 Seattle ‐ Justin Potts & Karen Apgar 2/12/2013
NASP Session MS013 5
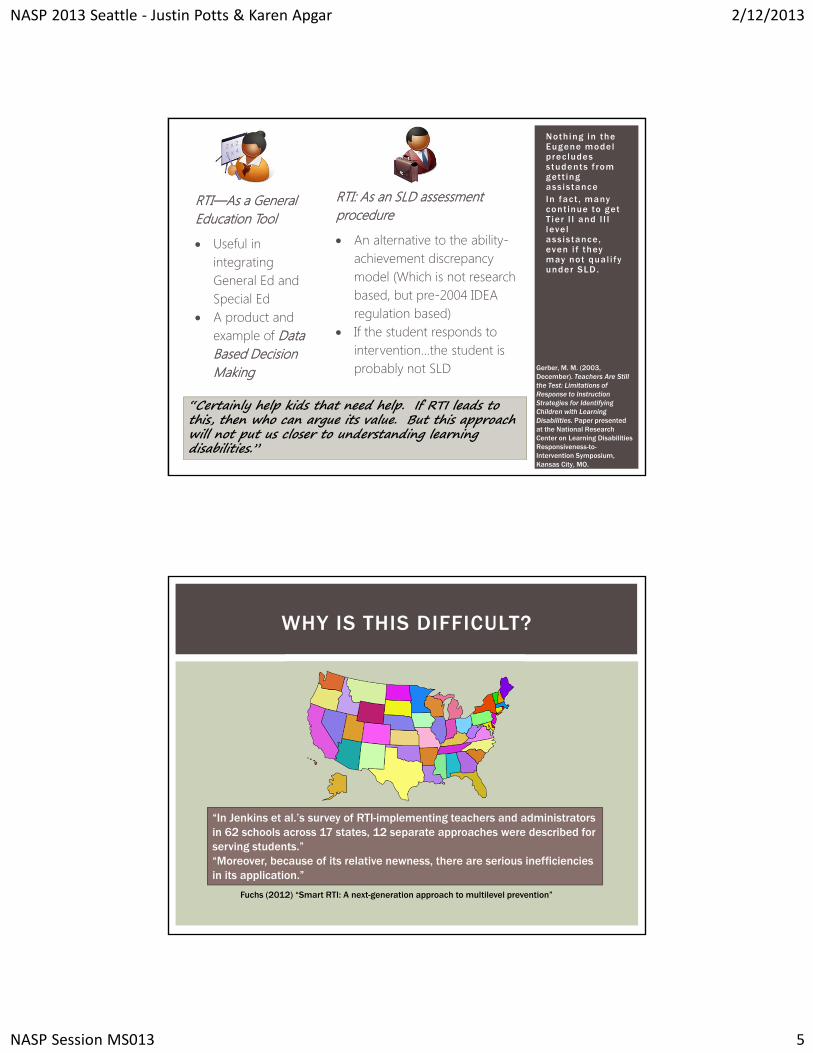
Nothing in the Eugene model prec ludes s tudents f rom get t ing ass is tanceIn fact , many cont inue to get T ier I I and I I I leve l ass is tance, even i f they may not qual i fy under SLD.
“Certainly help kids that need help. If RTI leads to this, then who can argue its value. But this approach will not put us closer to understanding learning disabilities.”
RTI—As a General Education Tool
Useful in integrating General Ed and Special Ed
A product and example of Data Based Decision Making
RTI: As an SLD assessment procedure
An alternative to the ability-achievement discrepancy model (Which is not research based, but pre-2004 IDEA regulation based)
If the student responds to intervention…the student is probably not SLD Gerber, M. M. (2003,
December). Teachers Are Still the Test: Limitations of Response to Instruction Strategies for Identifying Children with Learning Disabilities. Paper presented at the National Research Center on Learning Disabilities Responsiveness-to-Intervention Symposium, Kansas City, MO.
WHY IS THIS DIFFICULT?
“In Jenkins et al.’s survey of RTI-implementing teachers and administrators in 62 schools across 17 states, 12 separate approaches were described for serving students.”“Moreover, because of its relative newness, there are serious inefficiencies in its application.”
Fuchs (2012) “Smart RTI: A next-generation approach to multilevel prevention”
NASP 2013 Seattle ‐ Justin Potts & Karen Apgar 2/12/2013
NASP Session MS013 6
OREGON IMPLEMENTATIONS
QUICK QUIZ
The IDEA requires the use of RTI for eligibility under Specific Learning Disability. T/F
What are the primary components of RTI?
What are the TIERS of RTI? What happens at each TIER?
IDEA describes what an appropriate RTI process or model should have. T/F
What method are you using in your district?
NASP 2013 Seattle ‐ Justin Potts & Karen Apgar 2/12/2013
NASP Session MS013 7
QUICK QUIZ - ANSWERS
IDEA describes what an appropriate RTI process or model should have.
Answer: False…but
In January, 2011, the Office of Special Education Programs (OSEP) provided a memorandum in response to issues of delay/deny evaluations for Special Education. Thismemo was important in clarifying the “core characteristics that underpin all RTI models:”
1) Students receive high-quality research-based instruction in their general education setting;2) Continuous monitoring of student performance; 3) All students are screened for academic and behavioral problems; and,4) Multiple levels (tiers) of instruction that are progressively more intense, based on thestudent’s response to instruction.
(OSEP, Letter to State Directors of Special Education, 1-21-2011)
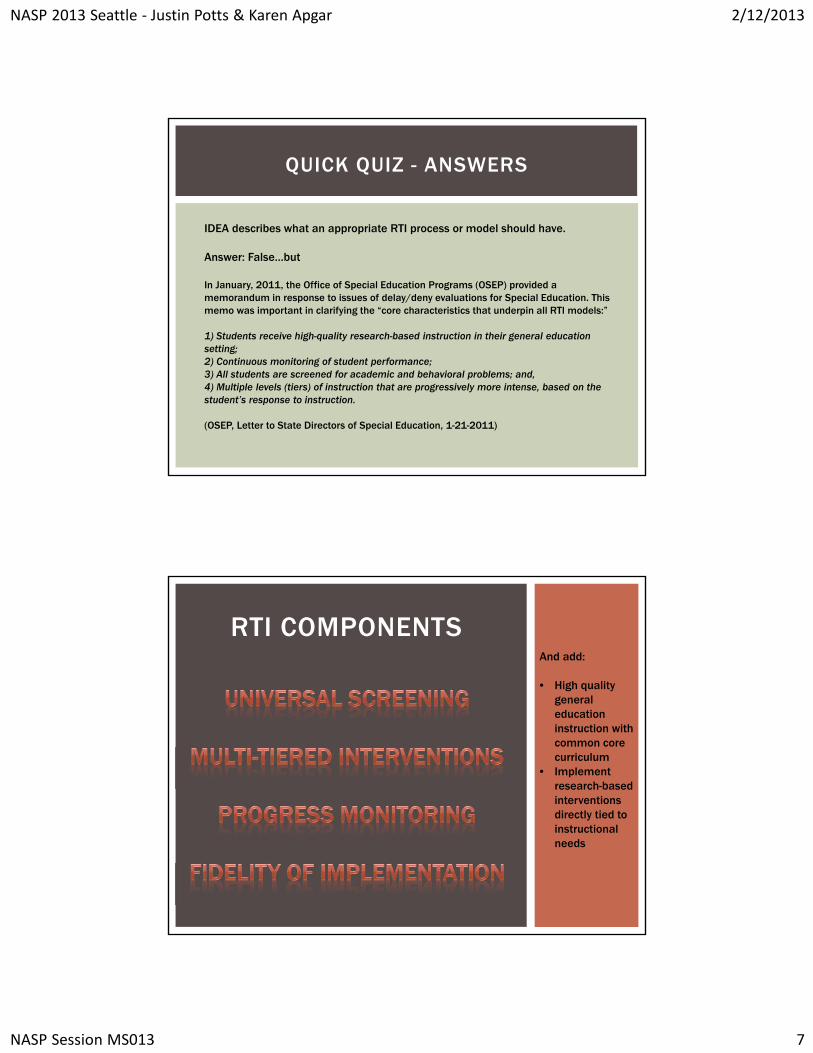
RTI COMPONENTSAnd add:
• High quality general education instruction with common core curriculum
• Implement research-based interventions directly tied to instructional needs
NASP 2013 Seattle ‐ Justin Potts & Karen Apgar 2/12/2013
NASP Session MS013 8
UNIVERSAL SCREENING
3 Tiers
Risk Pool
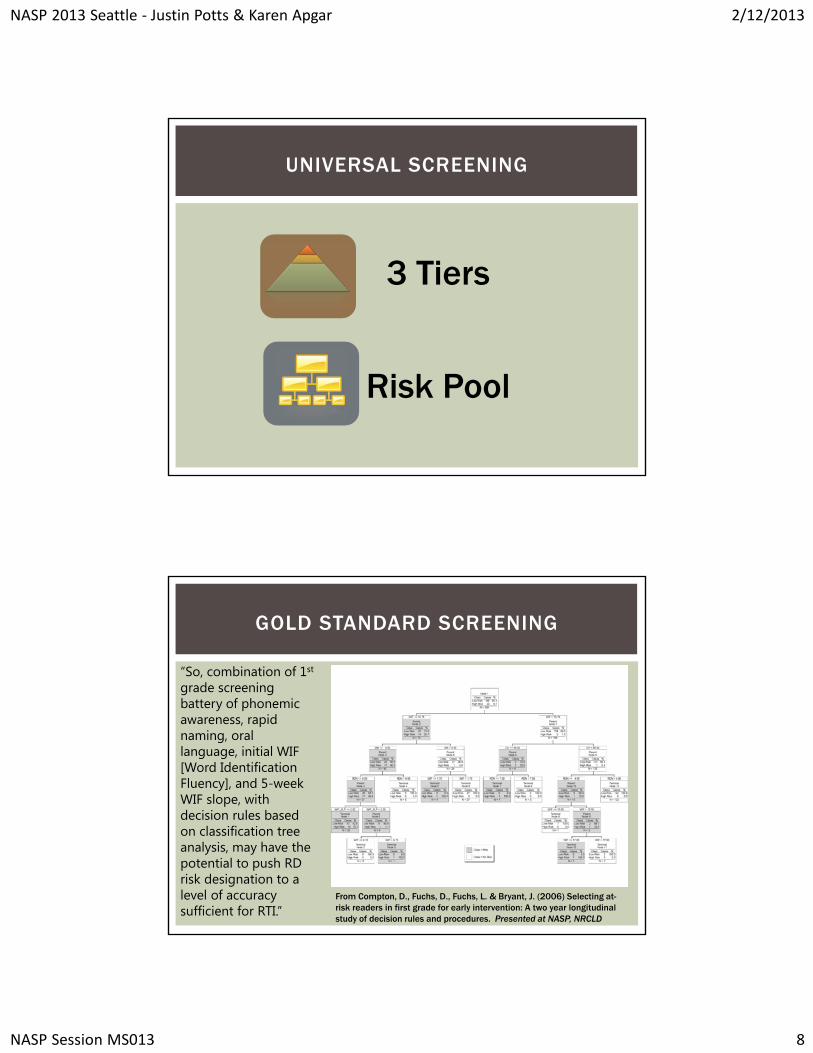
GOLD STANDARD SCREENING
From Compton, D., Fuchs, D., Fuchs, L. & Bryant, J. (2006) Selecting at-risk readers in first grade for early intervention: A two year longitudinal study of decision rules and procedures. Presented at NASP, NRCLD
“So, combination of 1st
grade screening battery of phonemic awareness, rapid naming, oral language, initial WIF [Word Identification Fluency], and 5-week WIF slope, with decision rules based on classification tree analysis, may have the potential to push RD risk designation to a level of accuracy sufficient for RTI.”
NASP 2013 Seattle ‐ Justin Potts & Karen Apgar 2/12/2013
NASP Session MS013 9
GOLD STANDARD RISK POOL
Vanderheyden, A.M. (2011) Technical adequacy of response to intervention decisions. Exceptional Children, 77 (3), 335-350.
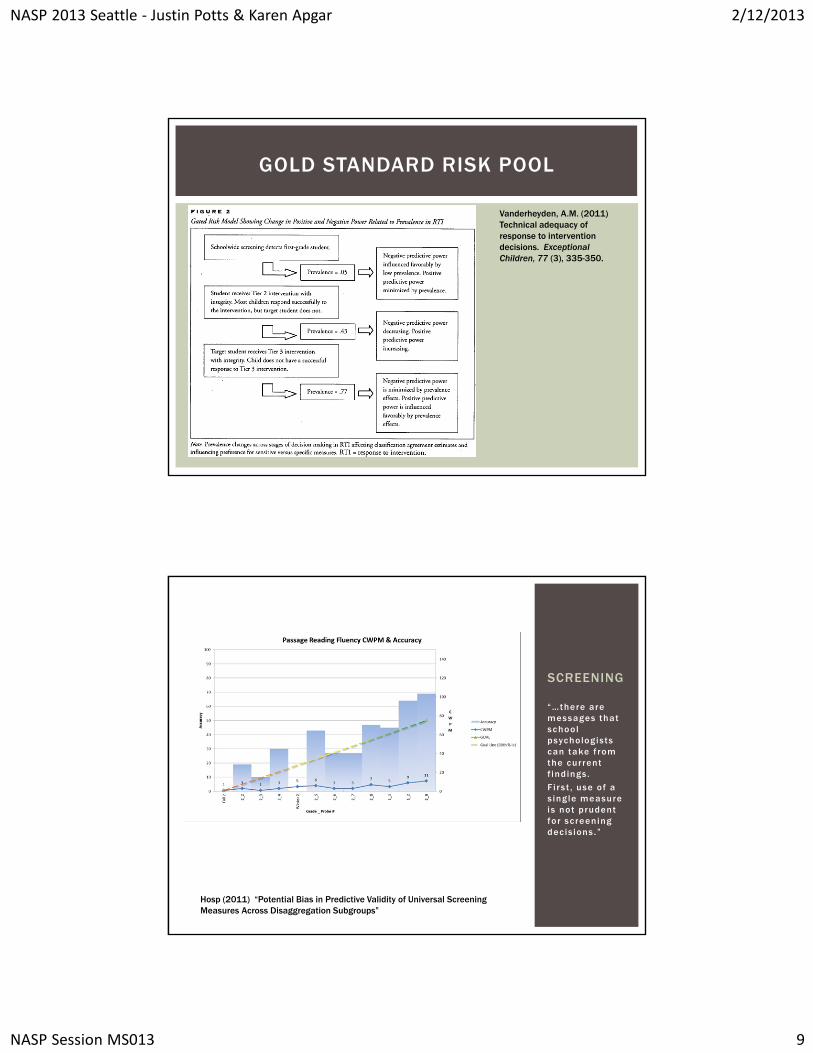
“…there are messages that school psychologists can take f rom the current f ind ings.
F i r s t , use of a s ing le measure i s not prudent for sc reening dec is ions . ”
SCREENING
Hosp (2011) “Potential Bias in Predictive Validity of Universal Screening Measures Across Disaggregation Subgroups”
NASP 2013 Seattle ‐ Justin Potts & Karen Apgar 2/12/2013
NASP Session MS013 10
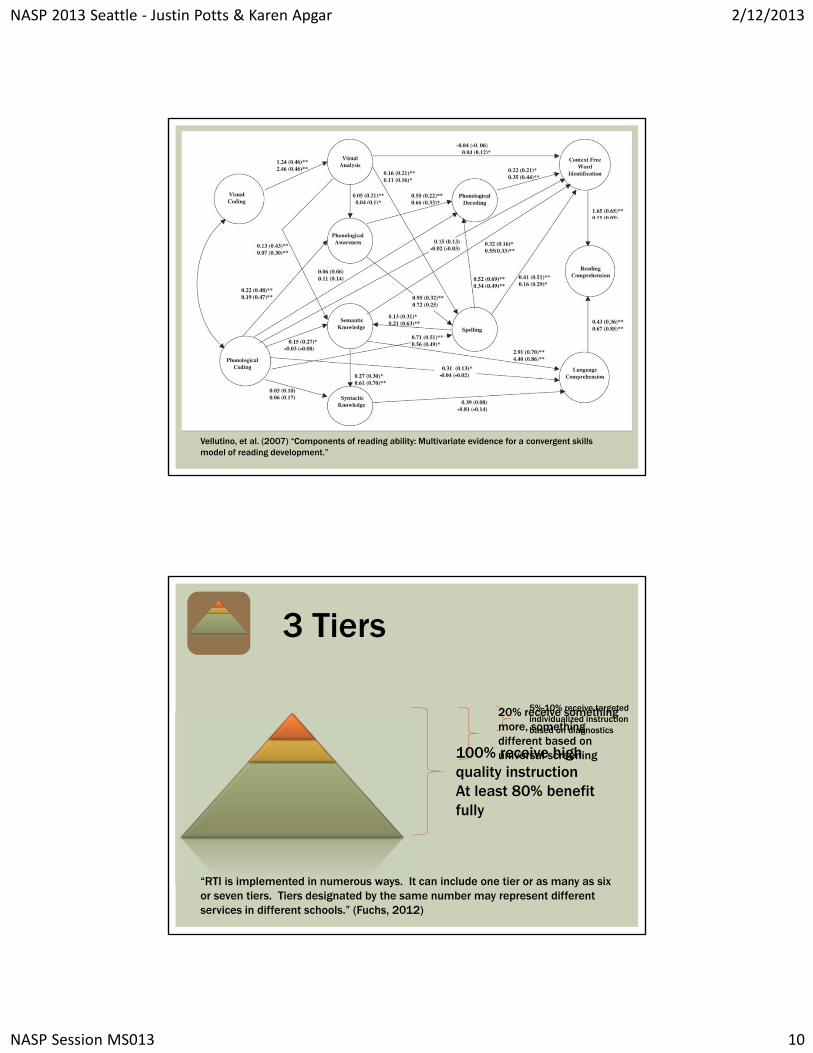
Vellutino, et al. (2007) “Components of reading ability: Multivariate evidence for a convergent skills model of reading development.”
3 Tiers
100% receive high quality instructionAt least 80% benefit fully
20% receive something more, something different based on universal screening
5%-10% receive targeted individualized instruction based on diagnostics
“RTI is implemented in numerous ways. It can include one tier or as many as six or seven tiers. Tiers designated by the same number may represent different services in different schools.” (Fuchs, 2012)
NASP 2013 Seattle ‐ Justin Potts & Karen Apgar 2/12/2013
NASP Session MS013 11
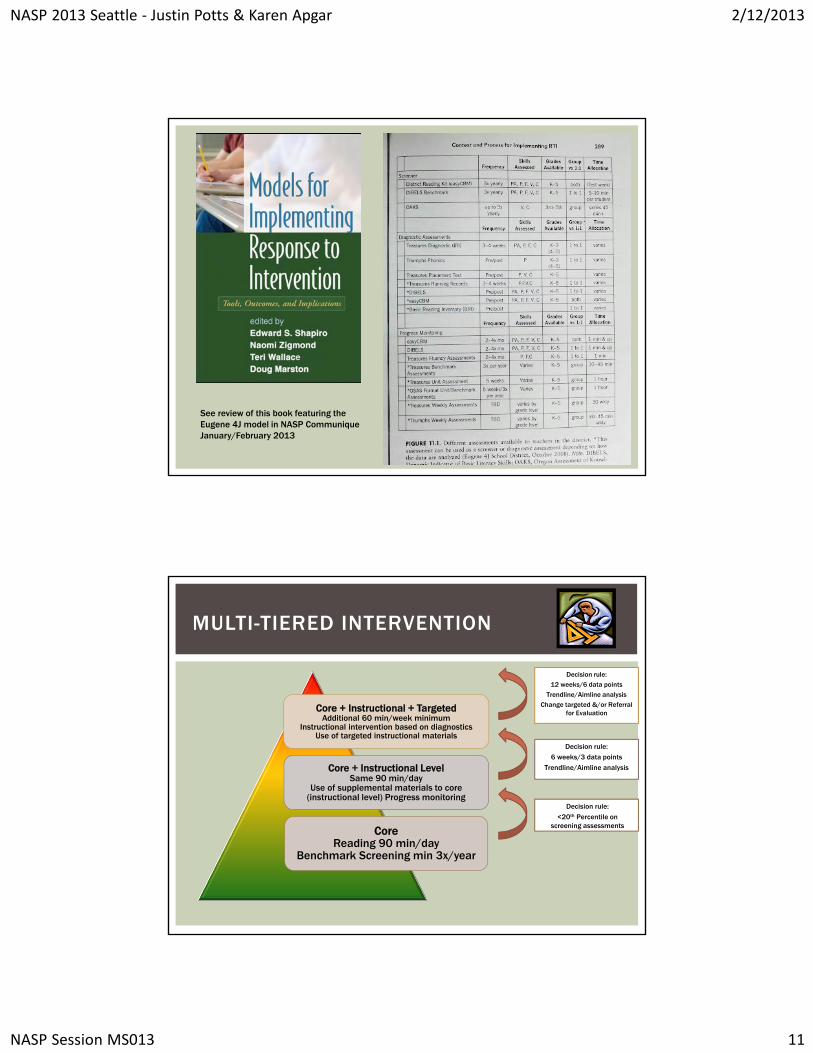
See review of this book featuring the Eugene 4J model in NASP CommuniqueJanuary/February 2013
MULTI-TIERED INTERVENTION
Core + Instructional + TargetedAdditional 60 min/week minimum
Instructional intervention based on diagnosticsUse of targeted instructional materials
Core + Instructional LevelSame 90 min/day
Use of supplemental materials to core (instructional level) Progress monitoring
CoreReading 90 min/day
Benchmark Screening min 3x/year
Decision rule:
<20th Percentile on screening assessments
Decision rule:
6 weeks/3 data points
Trendline/Aimline analysis
Decision rule:
12 weeks/6 data points
Trendline/Aimline analysis
Change targeted &/or Referral for Evaluation
NASP 2013 Seattle ‐ Justin Potts & Karen Apgar 2/12/2013
NASP Session MS013 12
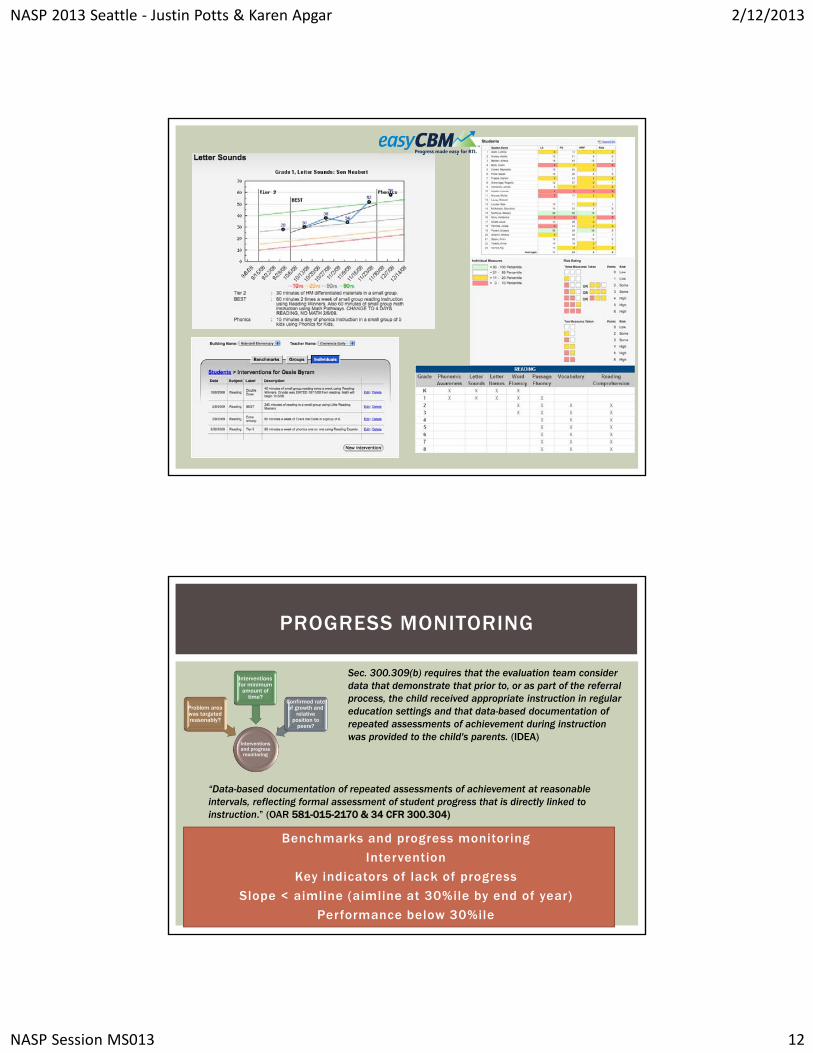
PROGRESS MONITORING
Benchmarks and progress monitoring
Intervention
Key indicators of lack of progress
Slope < aimline (aimline at 30%ile by end of year)
Performance below 30%ile
Sec. 300.309(b) requires that the evaluation team consider data that demonstrate that prior to, or as part of the referral process, the child received appropriate instruction in regular education settings and that data-based documentation of repeated assessments of achievement during instruction was provided to the child's parents. (IDEA)
“Data-based documentation of repeated assessments of achievement at reasonable intervals, reflecting formal assessment of student progress that is directly linked to instruction.” (OAR 581-015-2170 & 34 CFR 300.304)
Interventions and progress monitoring
Problem area was targeted reasonably?
Interventions for minimum
amount of time?
Confirmed rate of growth and
relative position to
peers?
NASP 2013 Seattle ‐ Justin Potts & Karen Apgar 2/12/2013
NASP Session MS013 13
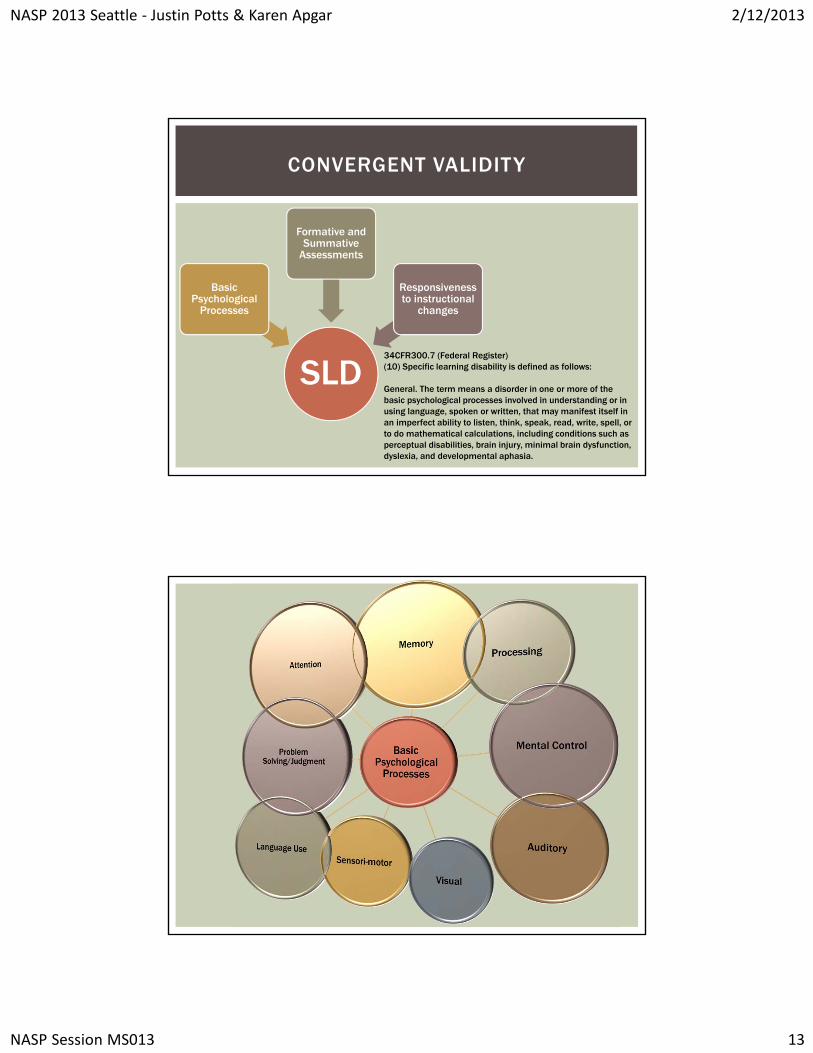
CONVERGENT VALIDITY
SLD
Basic Psychological
Processes
Formative and Summative
Assessments
Responsiveness to instructional
changes
34CFR300.7 (Federal Register)(10) Specific learning disability is defined as follows:
General. The term means a disorder in one or more of the basic psychological processes involved in understanding or in using language, spoken or written, that may manifest itself in an imperfect ability to listen, think, speak, read, write, spell, or to do mathematical calculations, including conditions such as perceptual disabilities, brain injury, minimal brain dysfunction, dyslexia, and developmental aphasia.
NASP 2013 Seattle ‐ Justin Potts & Karen Apgar 2/12/2013
NASP Session MS013 14
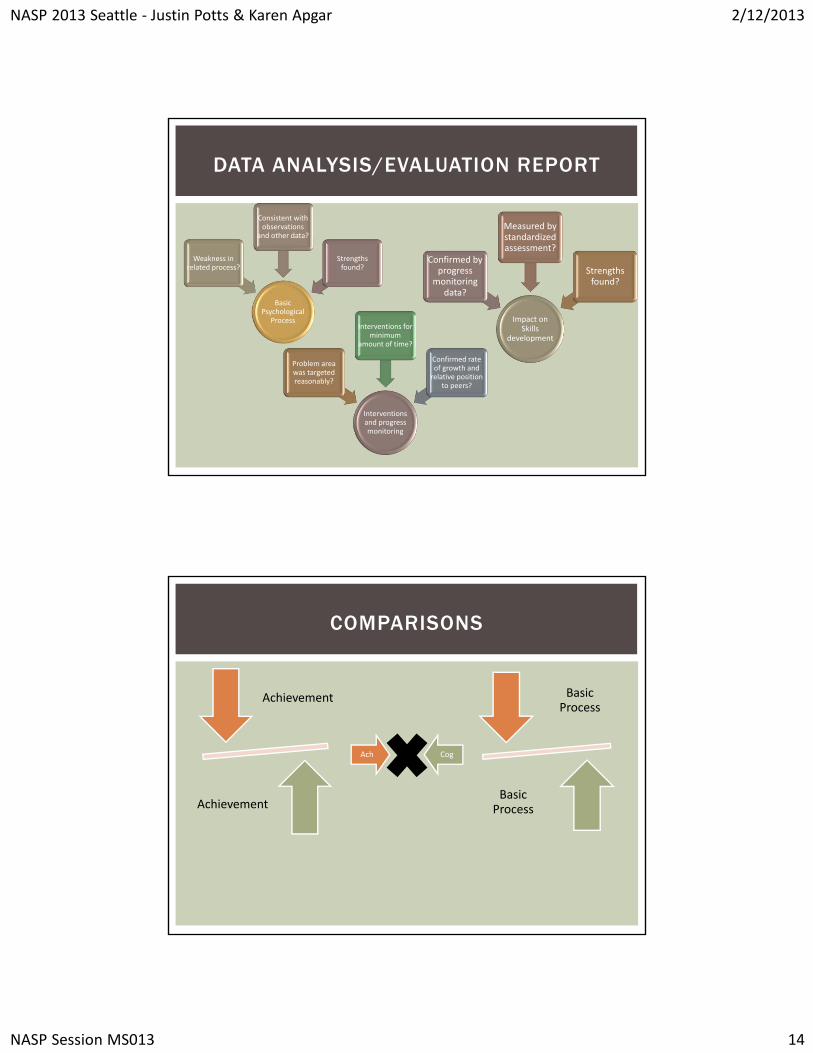
DATA ANALYSIS/EVALUATION REPORT
Basic Psychological
Process
Weakness in related process?
Consistent with observations
and other data?
Strengths found?
Impact on Skills
development
Confirmed by progress
monitoring data?
Measured by standardized assessment?
Strengths found?
Interventions and progress monitoring
Problem area was targeted reasonably?
Interventions for minimum
amount of time?
Confirmed rate of growth and relative position
to peers?
COMPARISONS
Achievement
Achievement
Basic Process
Basic Process
Ach Cog
NASP 2013 Seattle ‐ Justin Potts & Karen Apgar 2/12/2013
NASP Session MS013 15
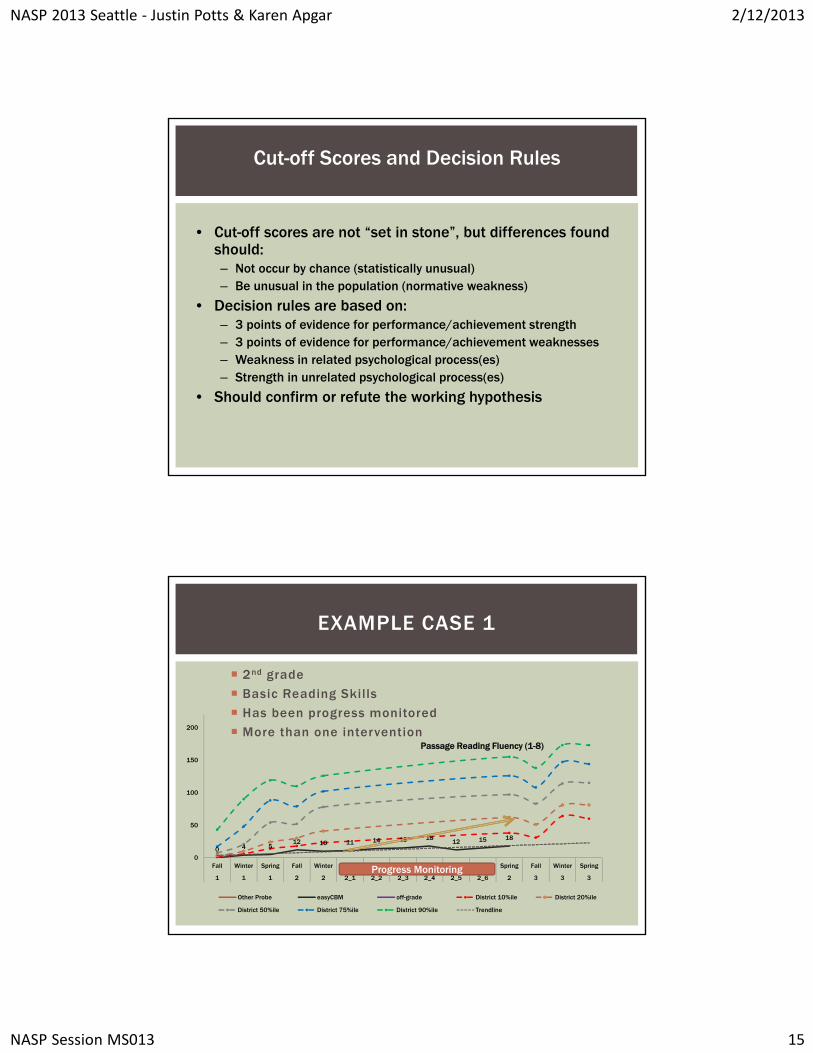
Cut-off Scores and Decision Rules
• Cut-off scores are not “set in stone”, but differences found should:– Not occur by chance (statistically unusual)– Be unusual in the population (normative weakness)
• Decision rules are based on:– 3 points of evidence for performance/achievement strength– 3 points of evidence for performance/achievement weaknesses– Weakness in related psychological process(es)– Strength in unrelated psychological process(es)
• Should confirm or refute the working hypothesis
EXAMPLE CASE 1
2nd grade
Basic Reading Skills
Has been progress monitored
More than one intervention
0 4 512 10 11 14 15 18
12 15 18
0
50
100
150
200
Fall Winter Spring Fall Winter Spring Fall Winter Spring
1 1 1 2 2 2_1 2_2 2_3 2_4 2_5 2_6 2 3 3 3
Passage Reading Fluency (1-8)
Other Probe easyCBM off-grade District 10%ile District 20%ile
District 50%ile District 75%ile District 90%ile Trendline
Progress Monitoring
NASP 2013 Seattle ‐ Justin Potts & Karen Apgar 2/12/2013
NASP Session MS013 16
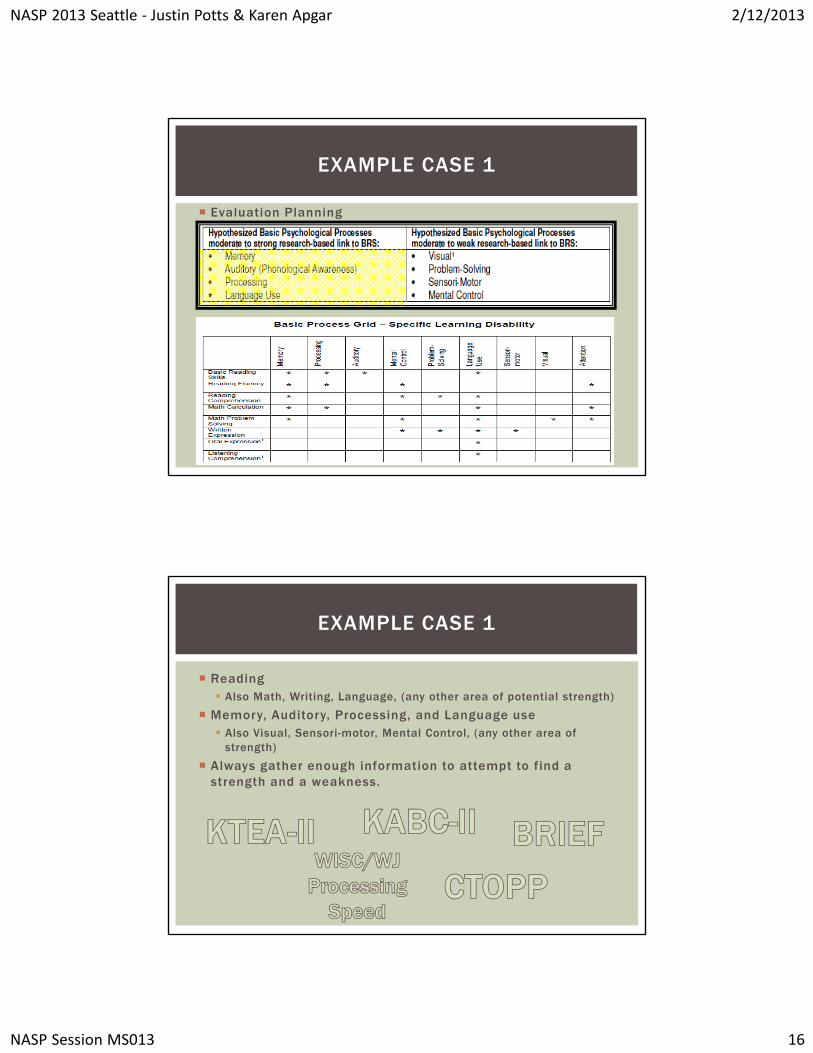
EXAMPLE CASE 1
Evaluation Planning
EXAMPLE CASE 1
Reading Also Math, Writing, Language, (any other area of potential strength)
Memory, Auditory, Processing, and Language use Also Visual, Sensori-motor, Mental Control, (any other area of
strength)
Always gather enough information to attempt to find a strength and a weakness.
NASP 2013 Seattle ‐ Justin Potts & Karen Apgar 2/12/2013
NASP Session MS013 17
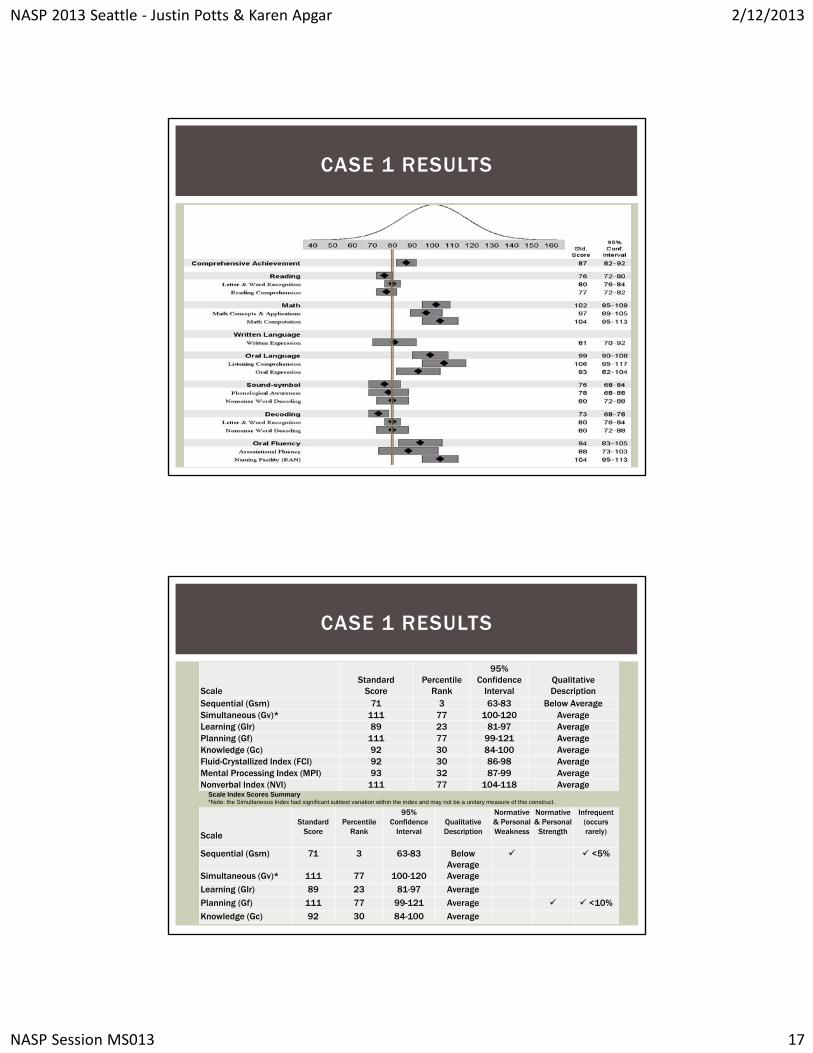
CASE 1 RESULTS
CASE 1 RESULTS
ScaleStandard
ScorePercentile
Rank
95% Confidence
IntervalQualitativeDescription
Sequential (Gsm) 71 3 63-83 Below AverageSimultaneous (Gv)* 111 77 100-120 AverageLearning (Glr) 89 23 81-97 AveragePlanning (Gf) 111 77 99-121 AverageKnowledge (Gc) 92 30 84-100 AverageFluid-Crystallized Index (FCI) 92 30 86-98 AverageMental Processing Index (MPI) 93 32 87-99 AverageNonverbal Index (NVI) 111 77 104-118 Average
Scale
StandardScore
PercentileRank
95% Confidence
IntervalQualitativeDescription
Normative & Personal Weakness
Normative & Personal
Strength
Infrequent (occurs rarely)
Sequential (Gsm) 71 3 63-83 Below Average
<5%
Simultaneous (Gv)* 111 77 100-120 Average
Learning (Glr) 89 23 81-97 Average
Planning (Gf) 111 77 99-121 Average <10%
Knowledge (Gc) 92 30 84-100 Average
Scale Index Scores Summary*Note: the Simultaneous Index had significant subtest variation within the index and may not be a unitary measure of this construct.
NASP 2013 Seattle ‐ Justin Potts & Karen Apgar 2/12/2013
NASP Session MS013 18
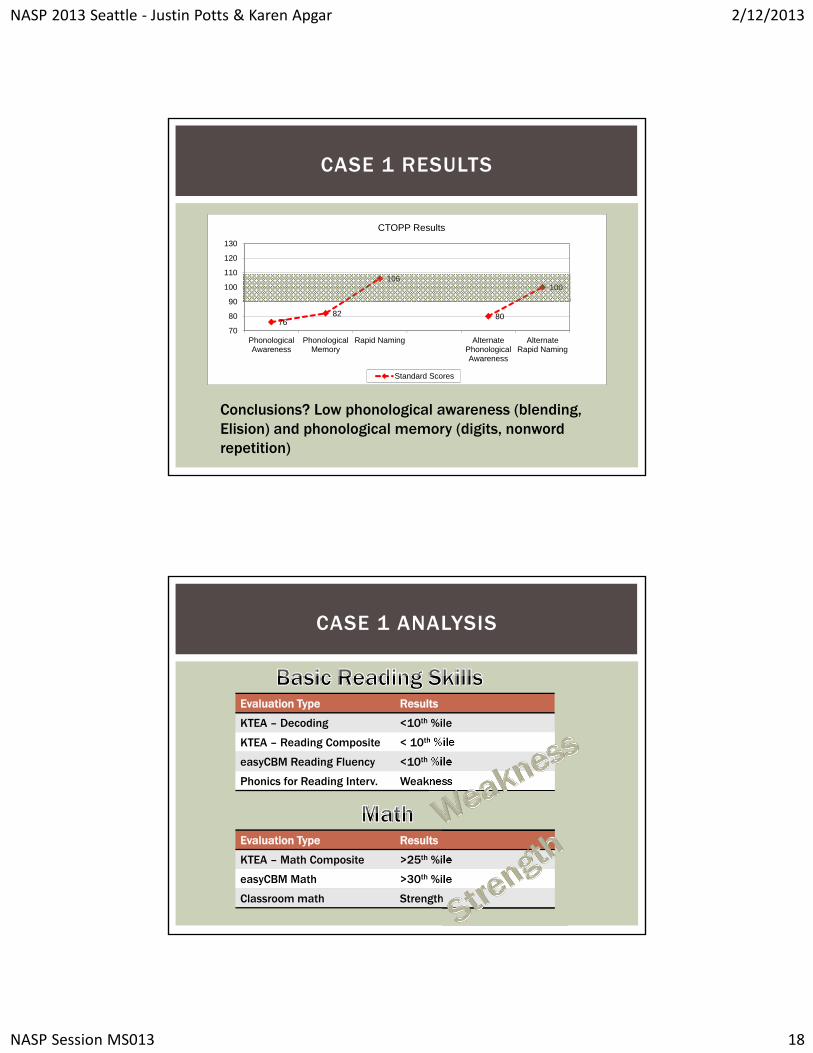
CASE 1 RESULTS
7682
106
80
100
70
80
90
100
110
120
130
PhonologicalAwareness
PhonologicalMemory
Rapid Naming AlternatePhonologicalAwareness
AlternateRapid Naming
CTOPP Results
Standard Scores
Conclusions? Low phonological awareness (blending, Elision) and phonological memory (digits, nonword repetition)
CASE 1 ANALYSIS
Evaluation Type Results
KTEA – Decoding <10th %ile
KTEA – Reading Composite < 10th %ile
easyCBM Reading Fluency <10th %ile
Phonics for Reading Interv. Weakness
Evaluation Type Results
KTEA – Math Composite >25th %ile
easyCBM Math >30th %ile
Classroom math Strength
NASP 2013 Seattle ‐ Justin Potts & Karen Apgar 2/12/2013
NASP Session MS013 19
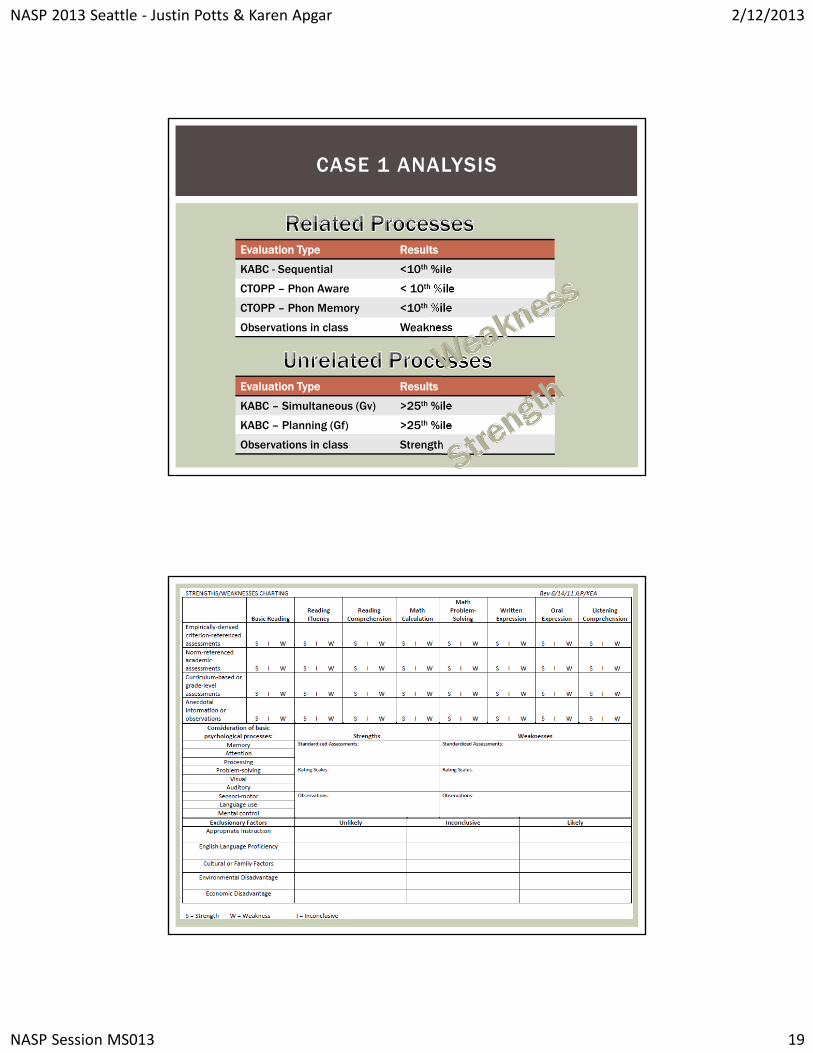
CASE 1 ANALYSIS
Evaluation Type Results
KABC - Sequential <10th %ile
CTOPP – Phon Aware < 10th %ile
CTOPP – Phon Memory <10th %ile
Observations in class Weakness
Evaluation Type Results
KABC – Simultaneous (Gv) >25th %ile
KABC – Planning (Gf) >25th %ile
Observations in class Strength
NASP 2013 Seattle ‐ Justin Potts & Karen Apgar 2/12/2013
NASP Session MS013 20
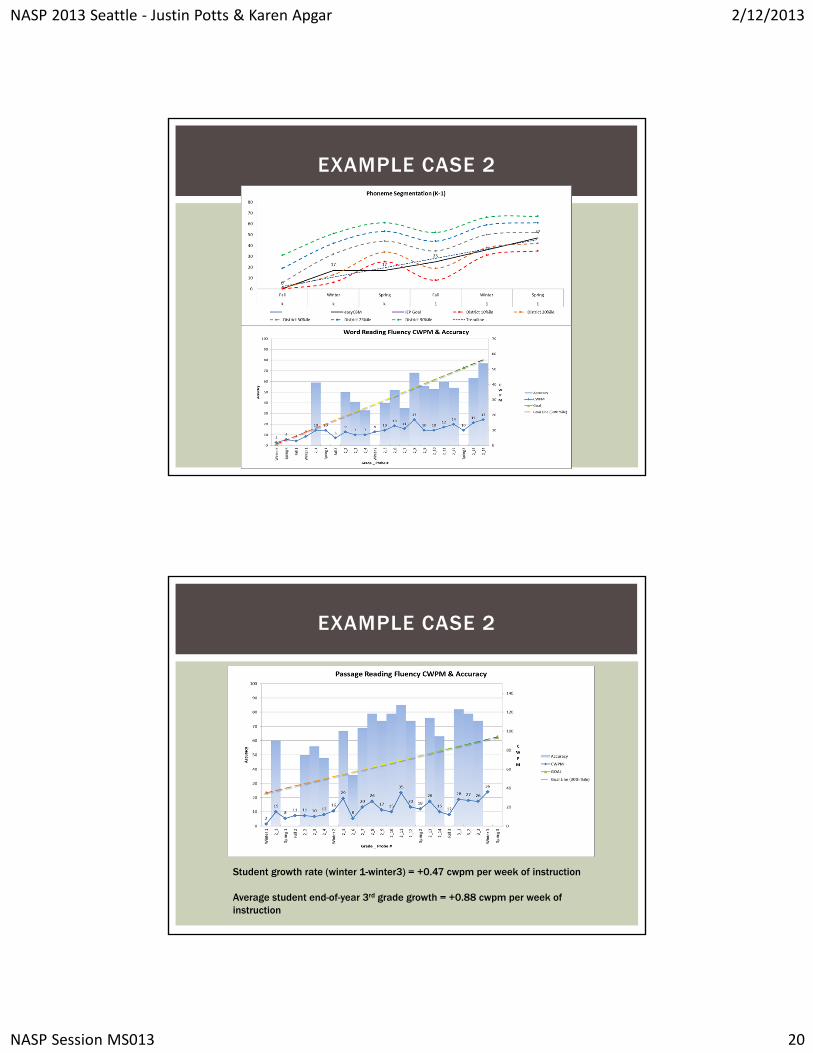
EXAMPLE CASE 2
Student growth rate (winter 1-winter3) = +0.47 cwpm per week of instruction
Average student end-of-year 3rd grade growth = +0.88 cwpm per week of instruction
EXAMPLE CASE 2
NASP 2013 Seattle ‐ Justin Potts & Karen Apgar 2/12/2013
NASP Session MS013 21
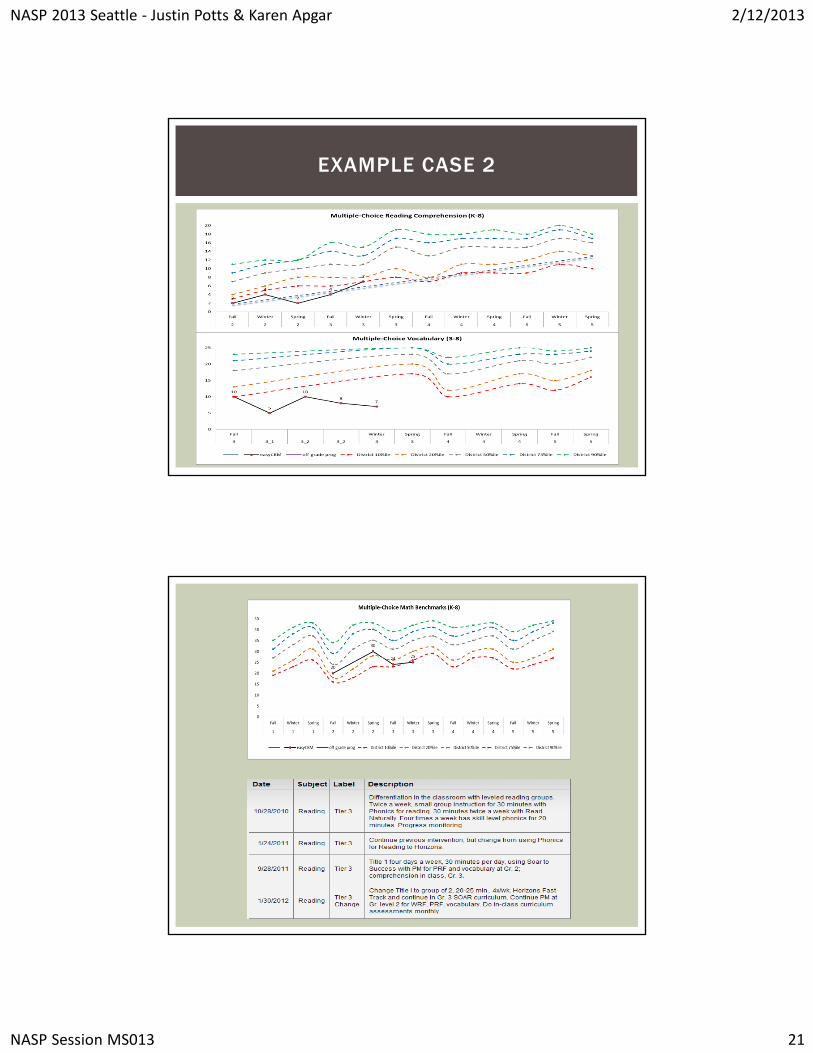
EXAMPLE CASE 2
NASP 2013 Seattle ‐ Justin Potts & Karen Apgar 2/12/2013
NASP Session MS013 22
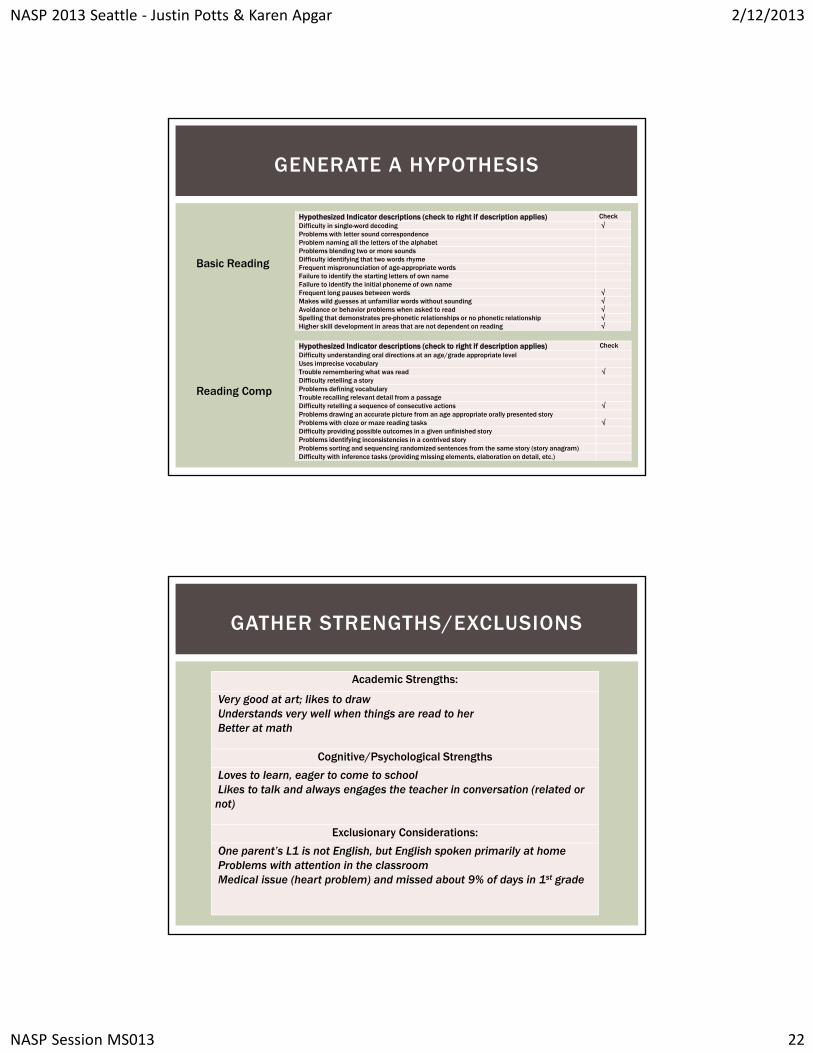
GENERATE A HYPOTHESIS
Hypothesized Indicator descriptions (check to right if description applies) CheckDifficulty understanding oral directions at an age/grade appropriate levelUses imprecise vocabularyTrouble remembering what was read √Difficulty retelling a story Problems defining vocabularyTrouble recalling relevant detail from a passageDifficulty retelling a sequence of consecutive actions √Problems drawing an accurate picture from an age appropriate orally presented storyProblems with cloze or maze reading tasks √Difficulty providing possible outcomes in a given unfinished storyProblems identifying inconsistencies in a contrived storyProblems sorting and sequencing randomized sentences from the same story (story anagram)Difficulty with inference tasks (providing missing elements, elaboration on detail, etc.)
Reading Comp
Hypothesized Indicator descriptions (check to right if description applies) CheckDifficulty in single-word decoding √Problems with letter sound correspondenceProblem naming all the letters of the alphabetProblems blending two or more soundsDifficulty identifying that two words rhymeFrequent mispronunciation of age-appropriate wordsFailure to identify the starting letters of own nameFailure to identify the initial phoneme of own nameFrequent long pauses between words √Makes wild guesses at unfamiliar words without sounding √Avoidance or behavior problems when asked to read √Spelling that demonstrates pre-phonetic relationships or no phonetic relationship √Higher skill development in areas that are not dependent on reading √
Basic Reading
GATHER STRENGTHS/EXCLUSIONS
Academic Strengths:
Very good at art; likes to drawUnderstands very well when things are read to herBetter at math
Cognitive/Psychological Strengths
Loves to learn, eager to come to schoolLikes to talk and always engages the teacher in conversation (related or not)
Exclusionary Considerations:
One parent’s L1 is not English, but English spoken primarily at homeProblems with attention in the classroomMedical issue (heart problem) and missed about 9% of days in 1st grade
NASP 2013 Seattle ‐ Justin Potts & Karen Apgar 2/12/2013
NASP Session MS013 23
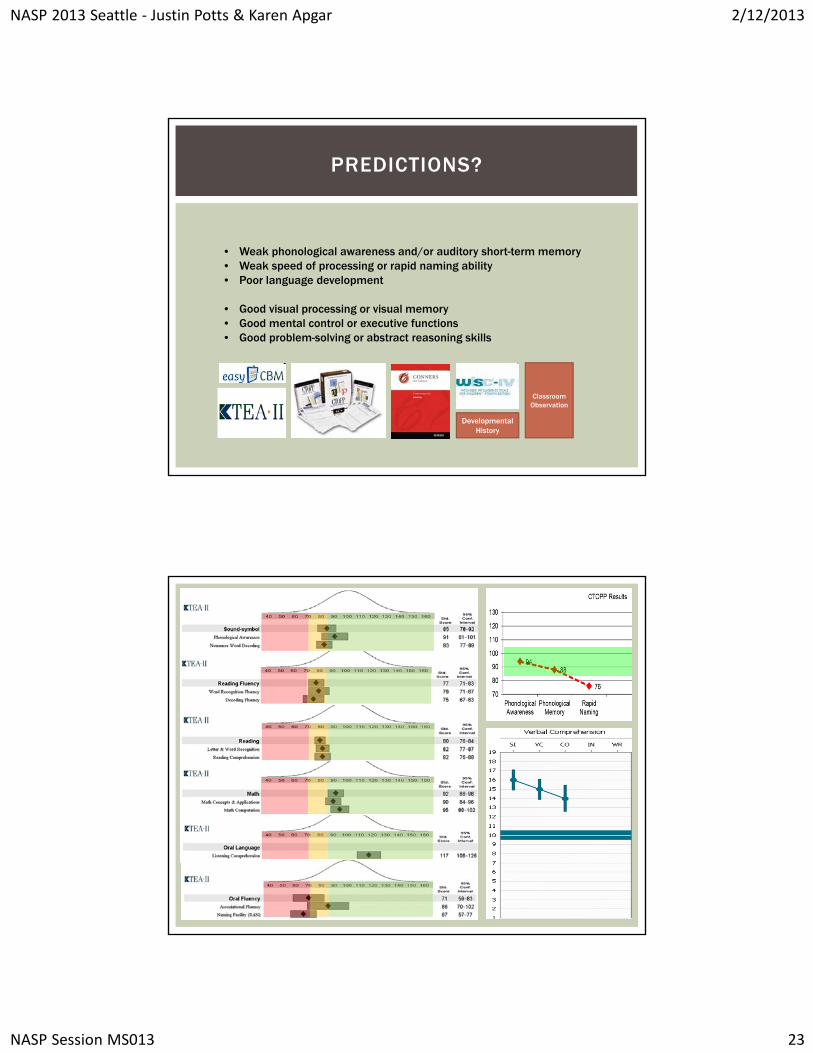
PREDICTIONS?
• Weak phonological awareness and/or auditory short-term memory• Weak speed of processing or rapid naming ability• Poor language development
• Good visual processing or visual memory• Good mental control or executive functions• Good problem-solving or abstract reasoning skills
Developmental History
Classroom Observation
NASP 2013 Seattle ‐ Justin Potts & Karen Apgar 2/12/2013
NASP Session MS013 24
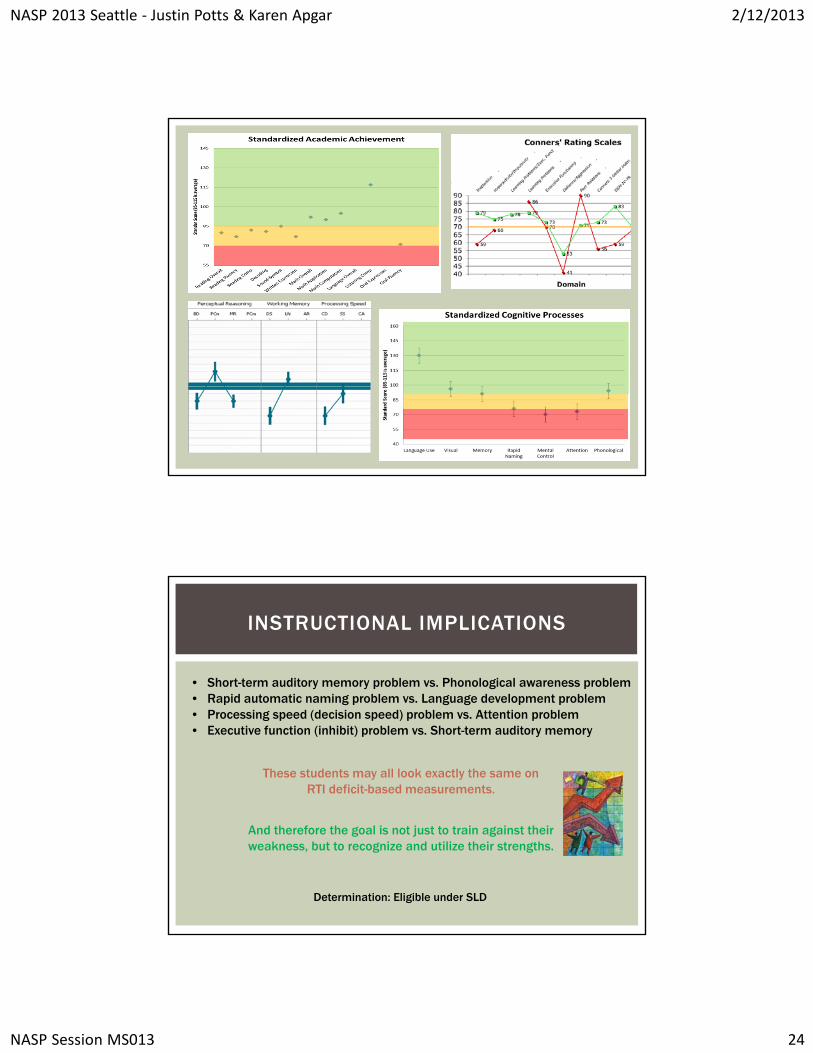
INSTRUCTIONAL IMPLICATIONS
• Short-term auditory memory problem vs. Phonological awareness problem• Rapid automatic naming problem vs. Language development problem• Processing speed (decision speed) problem vs. Attention problem• Executive function (inhibit) problem vs. Short-term auditory memory
These students may all look exactly the same on RTI deficit-based measurements.
And therefore the goal is not just to train against their weakness, but to recognize and utilize their strengths.
Determination: Eligible under SLD
NASP 2013 Seattle ‐ Justin Potts & Karen Apgar 2/12/2013
NASP Session MS013 25
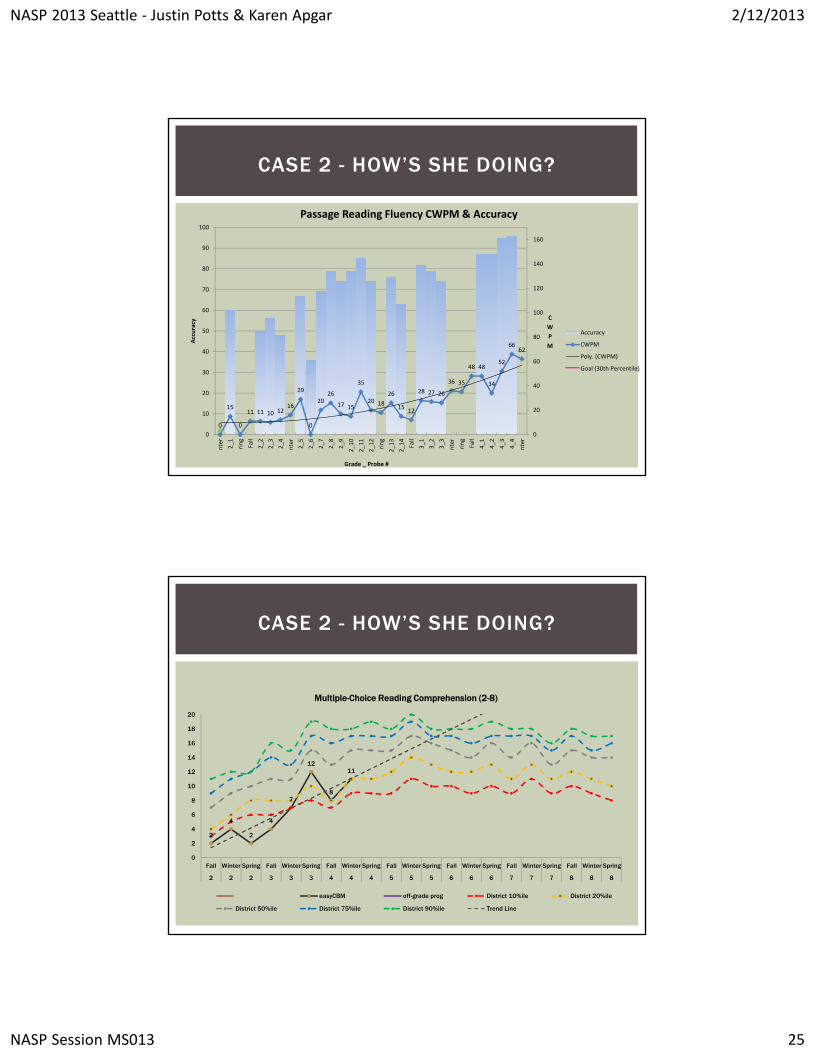
CASE 2 - HOW’S SHE DOING?
0
15
0
11 11 10 1216
29
0
2026
17 15
35
20 18
26
1512
28 27 26
36 35
48 48
34
52
6662
0
20
40
60
80
100
120
140
160
0
10
20
30
40
50
60
70
80
90
100nter
2_1
ring
Fall
2_2
2_3
2_4
nter
2_5
2_6
2_7
2_8
2_9
2_10
2_11
2_12
ring
2_13
2_14
Fall
3_1
3_2
3_3
nter
ring
Fall
4_1
4_2
4_3
4_4
nter
C
W
P
M
Accuracy
Grade _ Probe #
Passage Reading Fluency CWPM & Accuracy
Accuracy
CWPM
Poly. (CWPM)
Goal (30th Percentile)
CASE 2 - HOW’S SHE DOING?
2
4
2
4
7
12
8
11
0
2
4
6
8
10
12
14
16
18
20
Fall Winter Spring Fall Winter Spring Fall Winter Spring Fall Winter Spring Fall Winter Spring Fall Winter Spring Fall Winter Spring
2 2 2 3 3 3 4 4 4 5 5 5 6 6 6 7 7 7 8 8 8
Multiple-Choice Reading Comprehension (2-8)
easyCBM off-grade prog District 10%ile District 20%ile
District 50%ile District 75%ile District 90%ile Trend Line
NASP 2013 Seattle ‐ Justin Potts & Karen Apgar 2/12/2013
NASP Session MS013 26
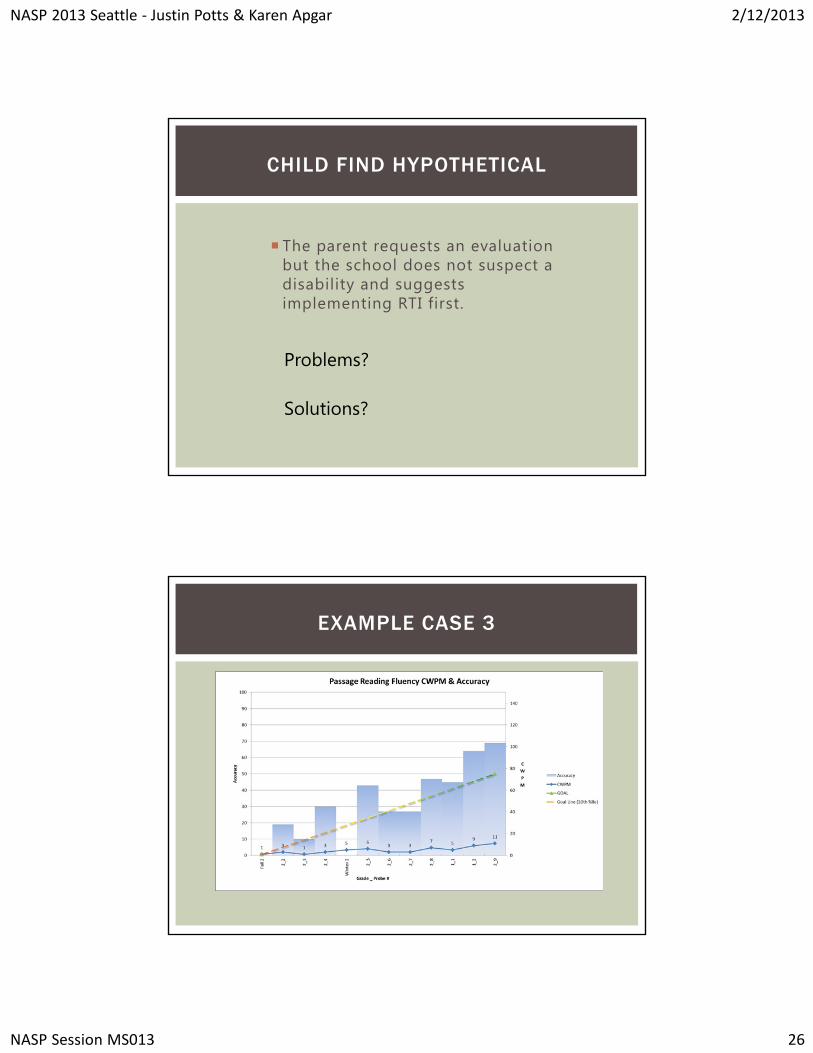
CHILD FIND HYPOTHETICAL
The parent requests an evaluation but the school does not suspect a disability and suggests implementing RTI first.
Problems?
Solutions?
EXAMPLE CASE 3
NASP 2013 Seattle ‐ Justin Potts & Karen Apgar 2/12/2013
NASP Session MS013 27
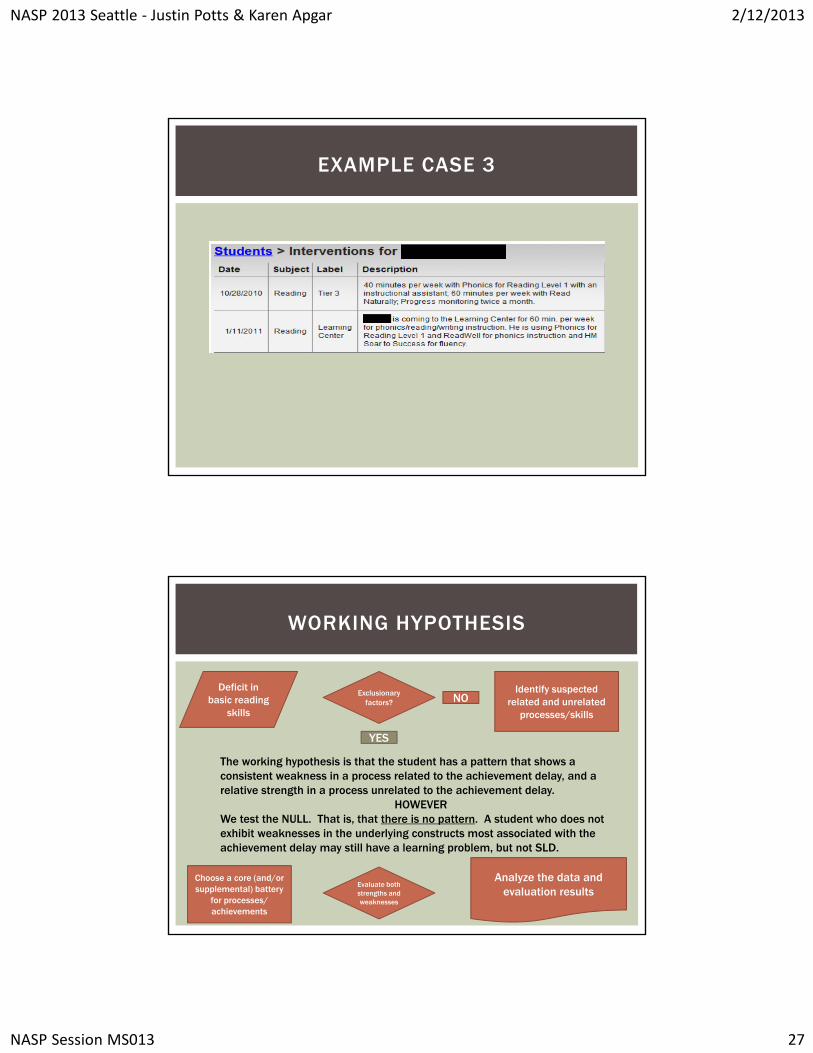
EXAMPLE CASE 3
WORKING HYPOTHESIS
Deficit in basic reading
skills
Exclusionary factors?
YES
NOIdentify suspected
related and unrelated processes/skills
The working hypothesis is that the student has a pattern that shows a consistent weakness in a process related to the achievement delay, and a relative strength in a process unrelated to the achievement delay.
HOWEVERWe test the NULL. That is, that there is no pattern. A student who does not exhibit weaknesses in the underlying constructs most associated with the achievement delay may still have a learning problem, but not SLD.
Choose a core (and/or supplemental) battery
for processes/ achievements
Evaluate both strengths and weaknesses
Analyze the data and evaluation results
NASP 2013 Seattle ‐ Justin Potts & Karen Apgar 2/12/2013
NASP Session MS013 28
Aca
dem
ic R
eadi
ng A
chie
vem
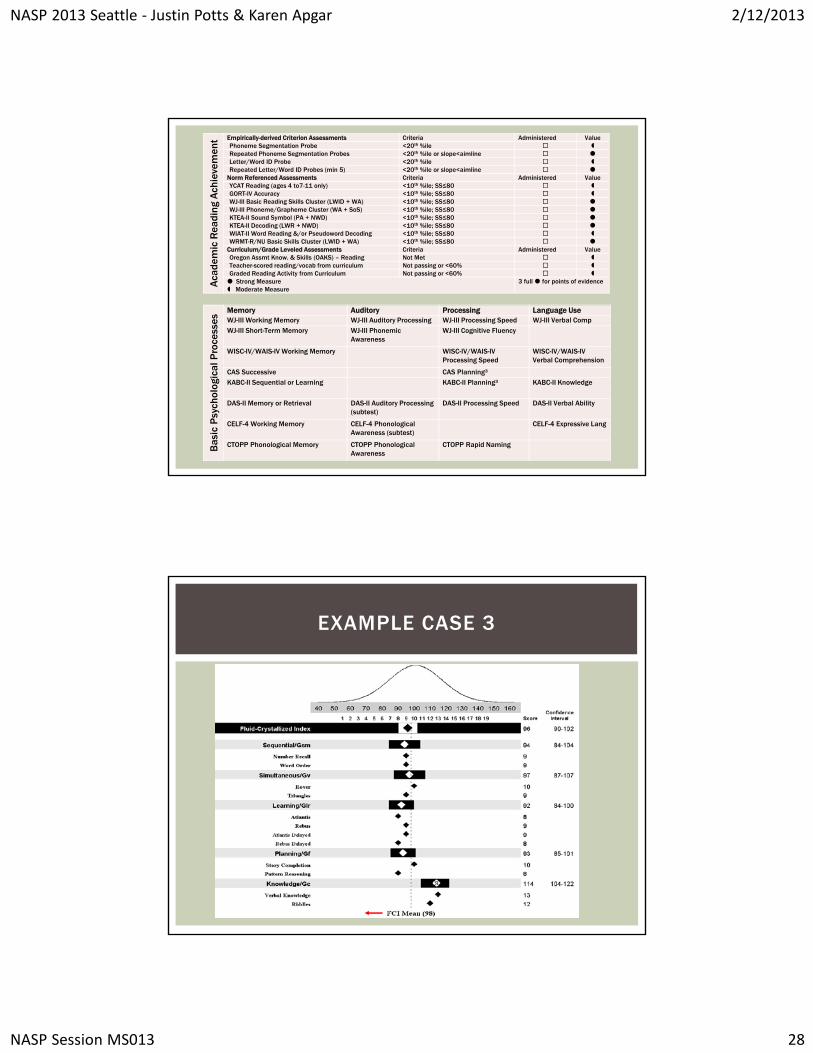
ent Empirically-derived Criterion Assessments Criteria Administered Value
Phoneme Segmentation Probe <20th %ile Repeated Phoneme Segmentation Probes <20th %ile or slope<aimline Letter/Word ID Probe <20th %ile Repeated Letter/Word ID Probes (min 5) <20th %ile or slope<aimline
Norm Referenced Assessments Criteria Administered ValueYCAT Reading (ages 4 to7-11 only) <10th %ile; SS≤80 GORT-IV Accuracy <10th %ile; SS≤80 WJ-III Basic Reading Skills Cluster (LWID + WA) <10th %ile; SS≤80 WJ-III Phoneme/Grapheme Cluster (WA + SoS) <10th %ile; SS≤80 KTEA-II Sound Symbol (PA + NWD) <10th %ile; SS≤80 KTEA-II Decoding (LWR + NWD) <10th %ile; SS≤80 WIAT-II Word Reading &/or Pseudoword Decoding <10th %ile; SS≤80 WRMT-R/NU Basic Skills Cluster (LWID + WA) <10th %ile; SS≤80
Curriculum/Grade Leveled Assessments Criteria Administered ValueOregon Assmt Know. & Skills (OAKS) – Reading Not Met Teacher-scored reading/vocab from curriculum Not passing or <60% Graded Reading Activity from Curriculum Not passing or <60% Strong Measure Moderate Measure
3 full for points of evidence
Bas
ic P
sych
olog
ical
Pro
cess
es
Memory Auditory Processing Language UseWJ-III Working Memory WJ-III Auditory Processing WJ-III Processing Speed WJ-III Verbal CompWJ-III Short-Term Memory WJ-III Phonemic
AwarenessWJ-III Cognitive Fluency
WISC-IV/WAIS-IV Working Memory WISC-IV/WAIS-IV Processing Speed
WISC-IV/WAIS-IV Verbal Comprehension
CAS Successive CAS Planning³KABC-II Sequential or Learning KABC-II Planning³ KABC-II Knowledge
DAS-II Memory or Retrieval DAS-II Auditory Processing (subtest)
DAS-II Processing Speed DAS-II Verbal Ability
CELF-4 Working Memory CELF-4 Phonological Awareness (subtest)
CELF-4 Expressive Lang
CTOPP Phonological Memory CTOPP Phonological Awareness
CTOPP Rapid Naming
EXAMPLE CASE 3
NASP 2013 Seattle ‐ Justin Potts & Karen Apgar 2/12/2013
NASP Session MS013 29
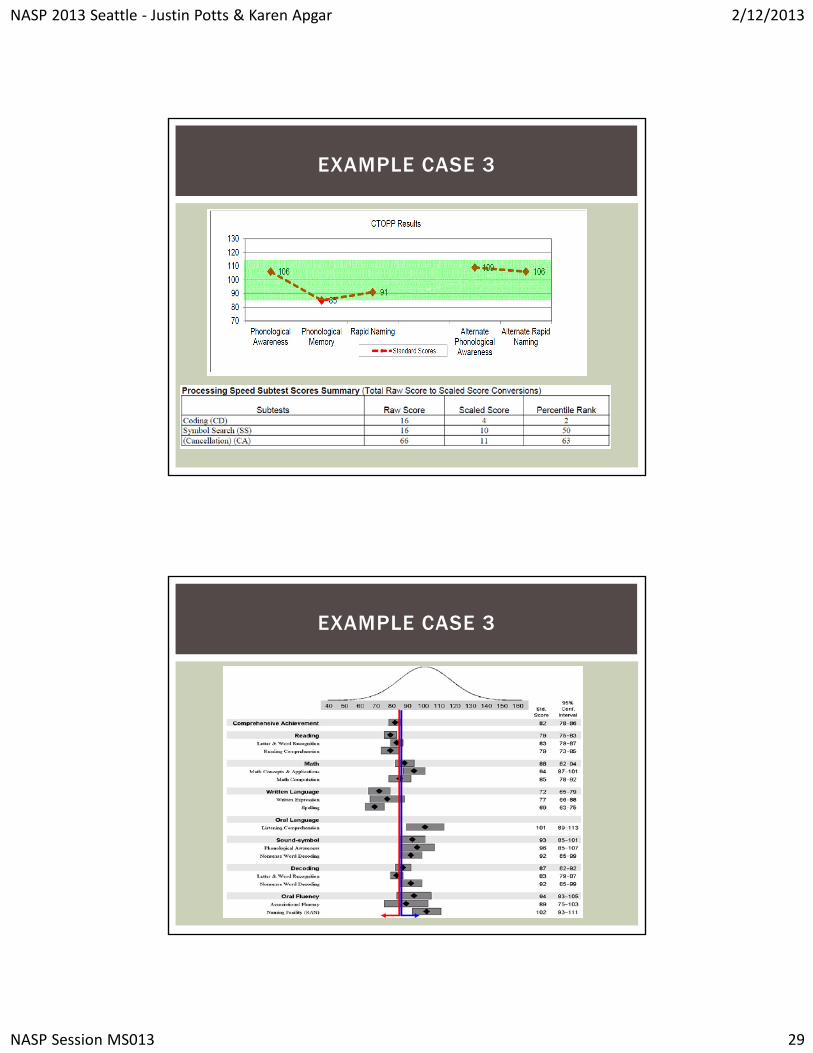
EXAMPLE CASE 3
EXAMPLE CASE 3
NASP 2013 Seattle ‐ Justin Potts & Karen Apgar 2/12/2013
NASP Session MS013 30
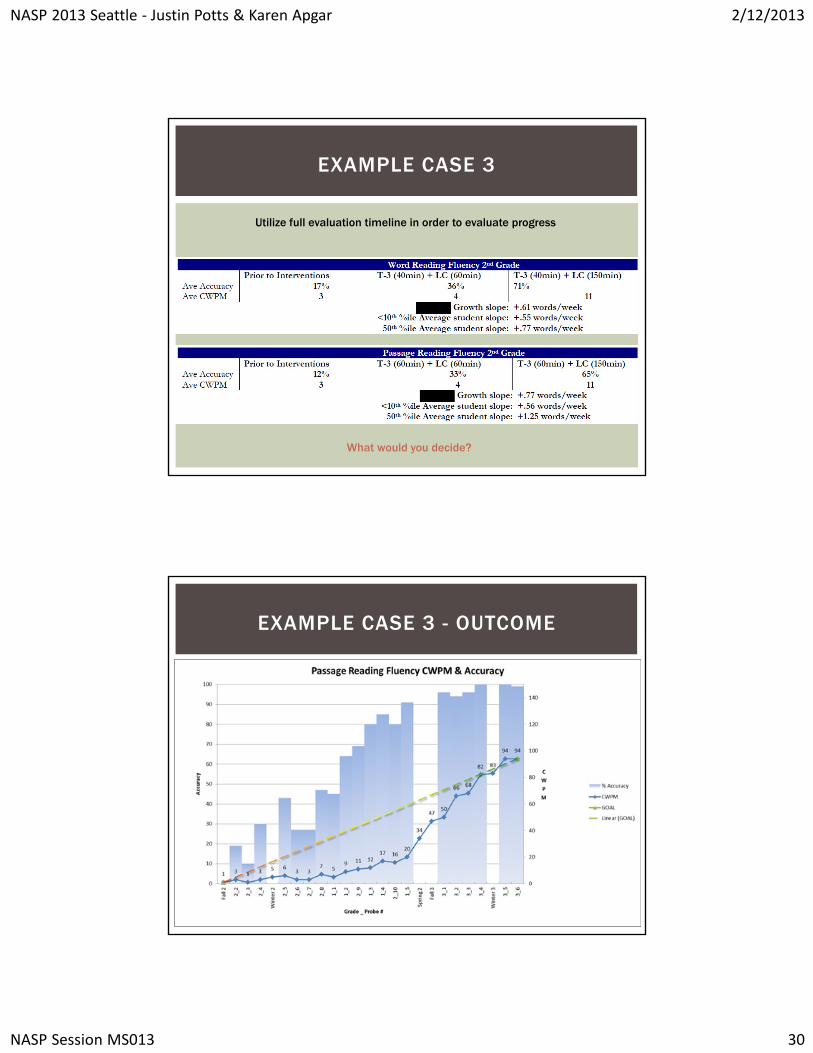
EXAMPLE CASE 3
Utilize full evaluation timeline in order to evaluate progress
What would you decide?
EXAMPLE CASE 3 - OUTCOME
NASP 2013 Seattle ‐ Justin Potts & Karen Apgar 2/12/2013
NASP Session MS013 31
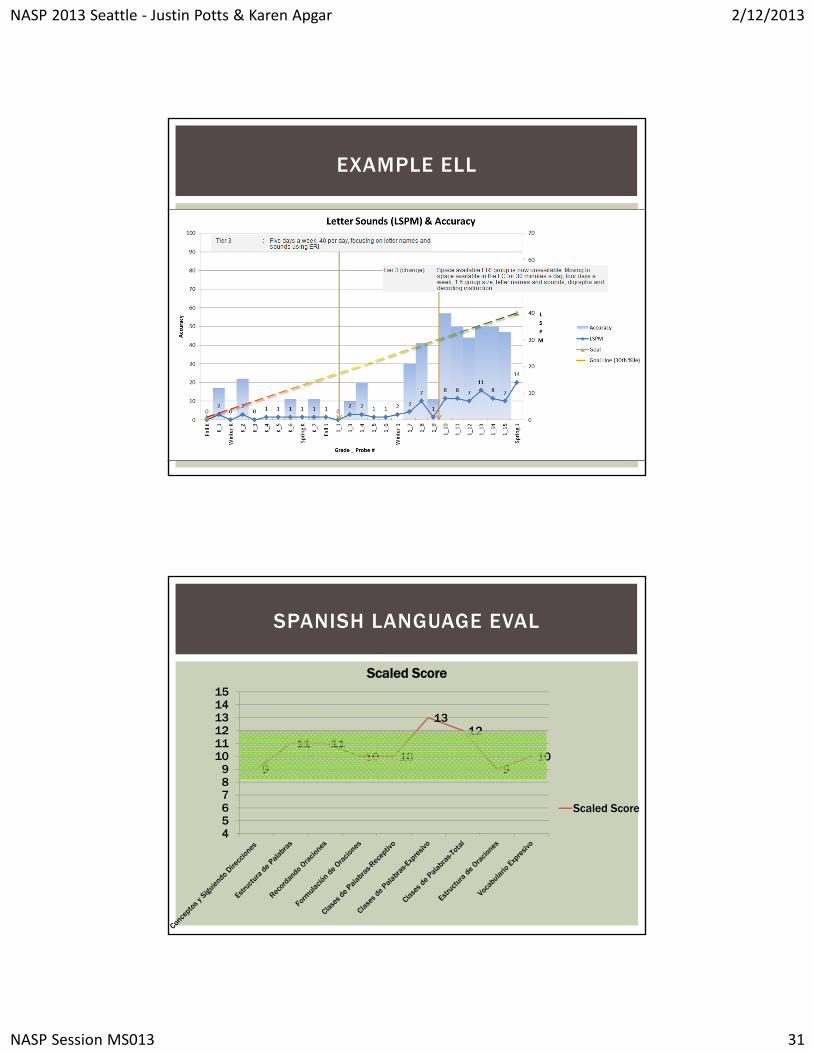
EXAMPLE ELL
SPANISH LANGUAGE EVAL
9
11 1110 10
1312
910
456789
101112131415
Scaled Score
Scaled Score
NASP 2013 Seattle ‐ Justin Potts & Karen Apgar 2/12/2013
NASP Session MS013 32
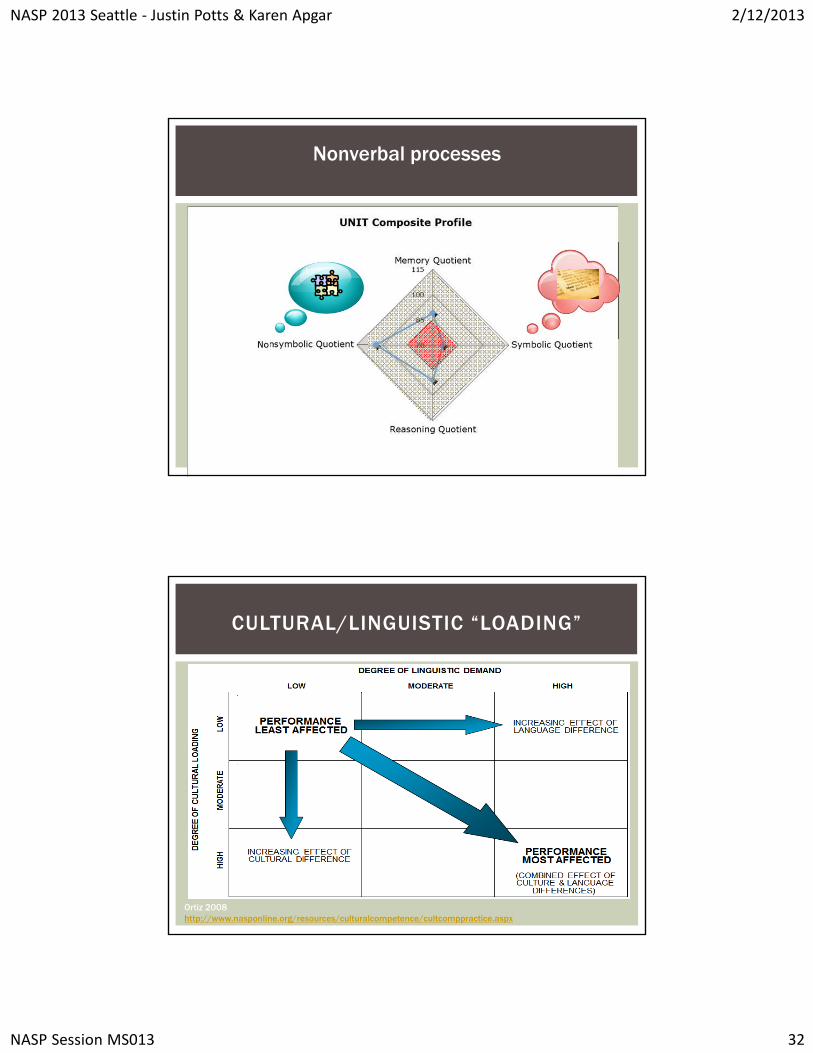
Nonverbal processes
CULTURAL/LINGUISTIC “LOADING”
Ortiz 2008http://www.nasponline.org/resources/culturalcompetence/cultcomppractice.aspx
NASP 2013 Seattle ‐ Justin Potts & Karen Apgar 2/12/2013
NASP Session MS013 33
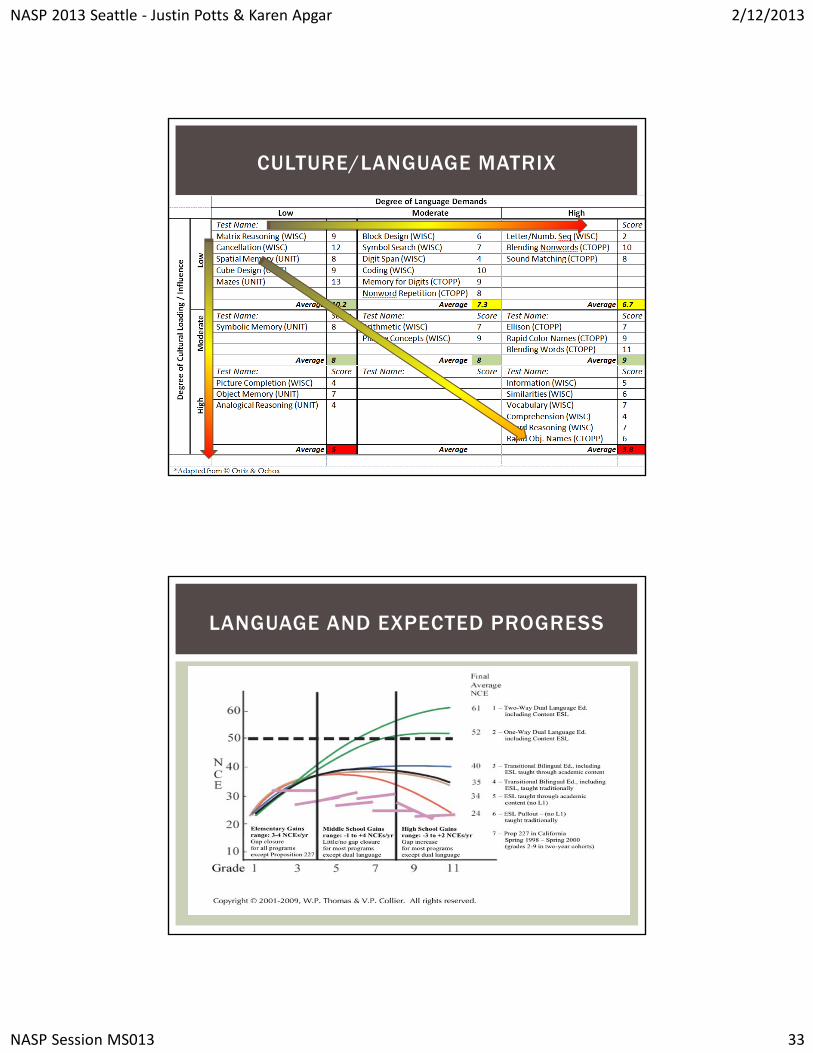
CULTURE/LANGUAGE MATRIX
LANGUAGE AND EXPECTED PROGRESS
NASP 2013 Seattle ‐ Justin Potts & Karen Apgar 2/12/2013
NASP Session MS013 34
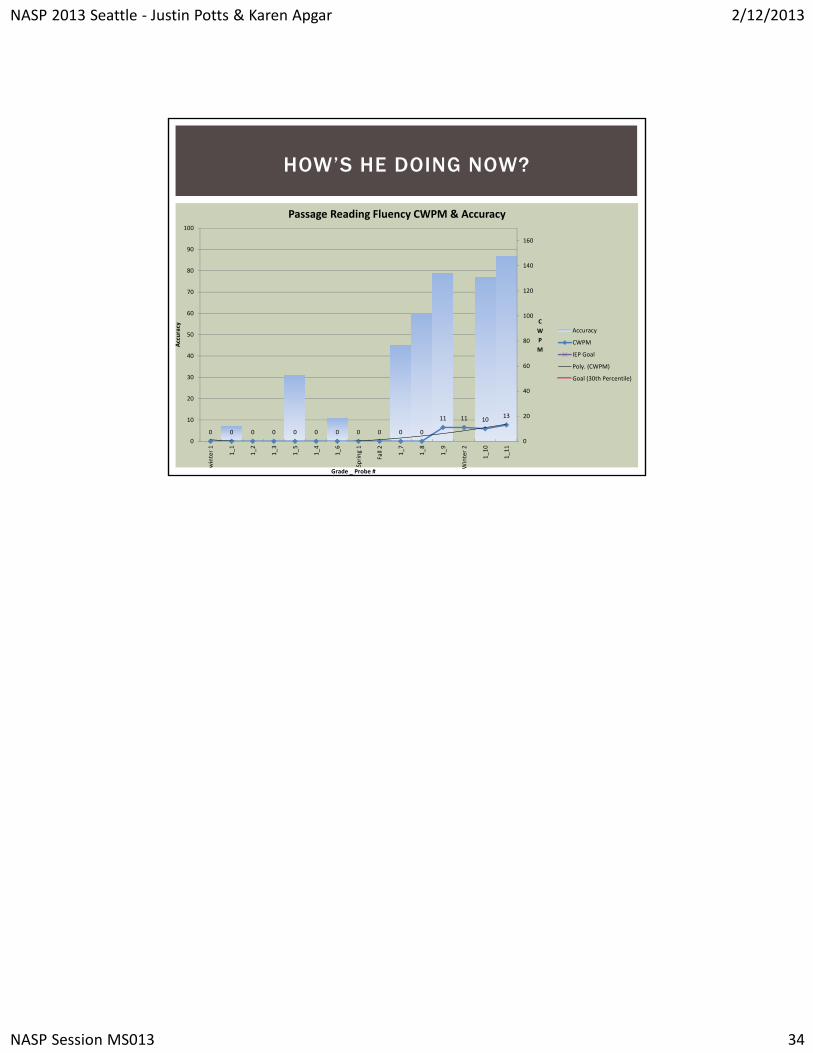
HOW’S HE DOING NOW?
0 0 0 0 0 0 0 0 0 0 0
11 11 1013
0
20
40
60
80
100
120
140
160
0
10
20
30
40
50
60
70
80
90
100
winter 1
1_1
1_2
1_3
1_5
1_4
1_6
Spring 1
Fall 2
1_7
1_8
1_9
Winter 2
1_10
1_11
C
W
P
M
Accuracy
Grade _ Probe #
Passage Reading Fluency CWPM & Accuracy
Accuracy
CWPM
IEP Goal
Poly. (CWPM)
Goal (30th Percentile)