Embed Size (px)
Citation preview

TSINGHUA SCIENCE AND TECHNOLOGYISSNll1007-0214ll0?/??llpp???-???
Volume 19, Number 2, April 2014
An Integrated Cyber-Physical Simulation Environment for Smart GridApplications
Yuxin Wan, Junwei Cao�, Shuqing Zhang, Guoyu Tu, Chao Lu, Xingtao Xu, and Keqin Li
Abstract: The concept of Cyber-Physical Systems (CPSs), which combine computation, networking, and physical
processes, is considered to be beneficial to smart grid applications. This study presents an integrated simulation
environment to provide a unified platform for the investigation of smart grid applications involving power grid
monitoring, communication, and control. In contrast to the existing approaches, this environment allows the network
simulator to operate independently, importing its results to the power system simulation. This resolves conflicts
between discrete event simulation and continuous simulation. In addition, several data compensation methods are
proposed and investigated under different network delay conditions. A case study of wide-area monitoring and
control is provided, and the efficiency of the proposed simulation framework has been evaluated based on the
experimental results.
Key words: control; cyber-physical system; simulation; smart grid; wide-area monitoring
1 Introduction
Cyber-Physical Systems (CPS) are considered amongthe leading technological innovations of recent yearsand have been referred to as the next revolution ininformation technology[1]. CPSs combine computation,communication, and control techniques to providereliable and robust integration of computing andphysical processes. The intrinsic characteristics that
�Yuxin Wan, Junwei Cao, and Guoyu Tu are with theDepartment of Automation, Research Institute of InformationTechnology, Tsinghua National Laboratory for InformationScience and Technology, Tsinghua University, Beijing100084, China. E-mail: [email protected];[email protected]; [email protected].� Shuqing Zhang, Chao Lu are with the Department of Electrical
Engineering, Tsinghua University, Beijing 100084, China. E-mail: [email protected]; [email protected].�Xingtao Xu is with State Grid Jiangsu Electric
Power Company, Nanjing 210024, China. E-mail:[email protected].�Keqin Li is with Department of Computer Science, State
University of New York, New Paltz, NY 12561, USA. E-mail:[email protected].�To whom correspondence should be addressed.
Manuscript received: 2014-02-18; revised: 2014-02-24;accepted: 2014-02-25
distinguish CPSs from other systems are their real-time responses and high reliability[2]. CPSs can beapplied in many areas, such as medicine, aerospace,transportation, and defense[3]. Electrical power grids,which are among the largest and most complexphysical systems, are typical CPS case studies. Thesesystems are known as Cyber-Physical Energy Systems(CPES)[4] or smart grids.
Reliability and efficiency are the most importantproblems encountered in the modern power grid[5]. Theimpetus driving the development of the smart gridis the unobservability, unreliability, low resiliency,and low efficiency of the existing power grid. Thesmart grid offers a self-monitoring and self-healing power delivery architecture[6] with two-waycommunication. Its foundation is a reliable and stabletwo-way communication infrastructure that satisfiesboth real-time and off-line applications[7, 8]. Smartgrid applications are sensitive to network delayand packet losses; therefore, the influence of acommunication network on such applications mustbe investigated. This study presents an integratedsimulation environment developed for both the powergrid and the communication network that supports themodeling and simulation of smart grid applications.

2 Tsinghua Science and Technology, June 2013, 18(3): 000-000
The integrated simulation platform consists of threemodules, i.e., power grid simulation, communicationnetwork simulation, and control simulation forapplications. The power grid simulation module,TH-STBLT[9], is a power system simulator designedby Tsinghua University that is capable of simulatingthe transient states of a power system with more than1000 nodes. The communication network simulationmodule is currently based on queuing systems thatinteract with databases and is compatible with othernetwork simulation tools, such as NS2[10]. The controlsimulation module is developed based on Matlab and isable to process data in the presence of network delaysor lost packets. These three modules run independentlyand are connected through network programs, whichmakes it easy to replace any of the elements. Thesemodules also share the same virtual clock, forming aclosed-loop system. To evaluate the effectiveness of theproposed simulation platform, Wide-Area Monitoringand Control (WAMC) systems[11] are considered asa study case. Several data compensation methods areproposed corresponding to different communicationnetwork conditions, and the experimental results areanalyzed for their effectiveness. Additionally, thisenvironment has revealed a cyber-impact on powersystems.
2 Literature Review
The smart grid refers to the integration of electrical gridand information technologies to provide a better energysupply infrastructure[12]. The communication networkis employed to link these two elements. Because muchof the existing work on the smart grid focuses onthe impact of communication network performance onpower grid control effectiveness[13, 14], it is urgent tobuild an integrated environment for both power grid andcommunication network simulations.
A modeling and simulation framework is proposedin Ref. [15] to analyze the performance of an IP-based communication network to support PhasorMeasurement Unit (PMU)-based WAMCs. Theauthors used OPNET tools to analyze the impact ofcommunication network capacity and backgroundnoise traffic on PMU data delays in WAMCs. However,this study focuses on the analysis of network delayswithout performing closed-loop experiments and tests.
Early work on closed-loop simulation can befound in Ref. [16], which describes the difficulties of
simulating both the power grid and the communicationnetwork. The power grid requires real-timesimulation based on a continuous simulator, whilecommunication network simulation uses discreteevents. Consequently, a high-level synchronizationprogram was developed to set synchronization pointsto solve the problem. However, this solution may causeerrors to accumulate, as the method tends to convertdiscrete simulation to continuous simulation. Theapproach to simulation presented in Ref. [17] relies onthe same principle.
A simulation platform based on OpenDSS andNS2 is described in Ref. [18]. The influence ofaverage message delays on PV (photovoltaic) voltagemagnitude in a wireless network environment isanalyzed in the context of solar ramping problems insolar PV systems. However, due to the independentstructures of OpenDSS and the NS2 simulator, theplatform is not well integrated, and a separate script fileis required.
The problem of synchronizing simulated clocksbetween two different simulators is addressed inRef. [19]. UNIX pipes are used to communicate, andinternal events in NS2 are used to trigger the powergrid simulator, Modelica. NS2 controls Modelicassimulation time. However, certain events triggeredexclusively in physical systems cannot be discovered,which may lead to simulation errors.
In Ref. [20], a dynamic power grid simulation ismodified into discrete events. A global scheduler isimported to record the event list of the power grid andthe network simulator. In addition, the two simulatorsshare a timeline. This platform can capture all the eventsof the two simulators and remove any accumulatederrors introduced by process synchronization. However,there is still a chance of simulation errors, forexample, when one simulator encounters an error,the other simulator is not informed until the eventarrives. Simulation errors may be introduced during thisinterval.
As noted above, the primary difficulty ofintegrating power grid and network simulation isthe synchronization between discrete event simulationand continuous simulation. However, this issue arisesonly if we combine the two different types of simulatorsinto a cyber-physical co-simulation environment. Thepresent work proposes a new approach to this problem,which is introduced below.
Yuxin Wan et al.: An Integrated Cyber-Physical Simulation Environment for Smart Grid Applications 3
3 Integrated Cyber-Physical Simulation
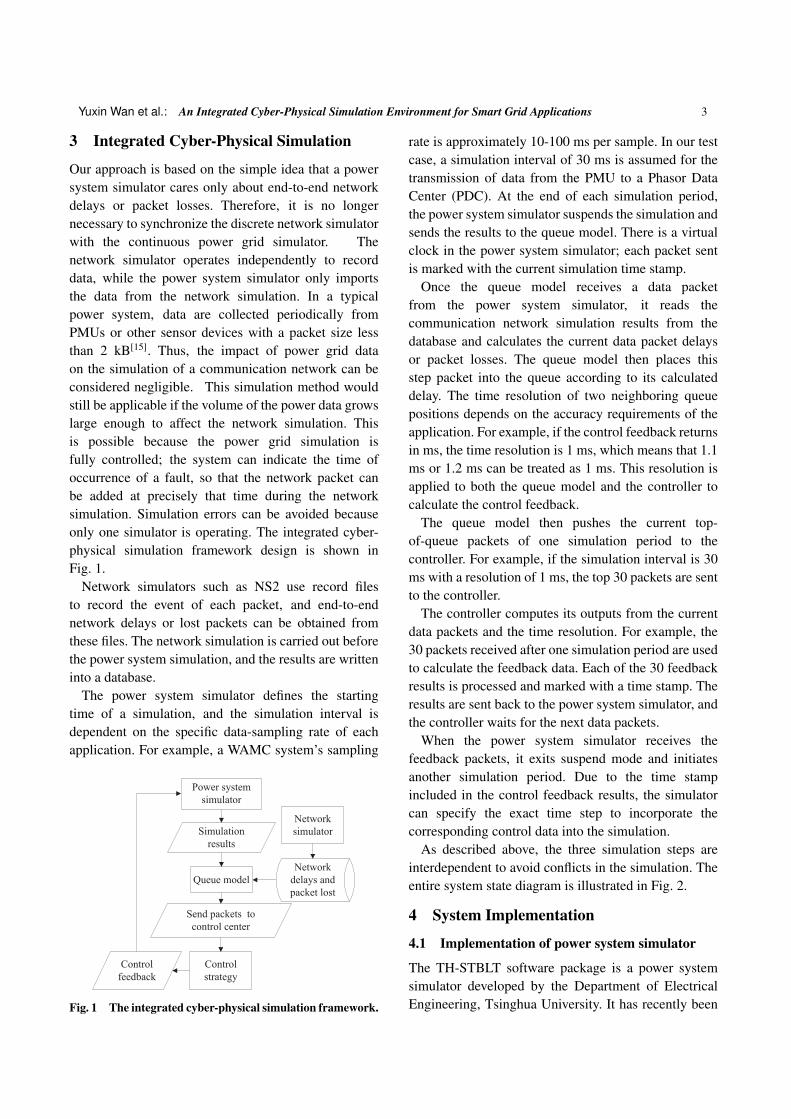
Our approach is based on the simple idea that a powersystem simulator cares only about end-to-end networkdelays or packet losses. Therefore, it is no longernecessary to synchronize the discrete network simulatorwith the continuous power grid simulator. Thenetwork simulator operates independently to recorddata, while the power system simulator only importsthe data from the network simulation. In a typicalpower system, data are collected periodically fromPMUs or other sensor devices with a packet size lessthan 2 kB[15]. Thus, the impact of power grid dataon the simulation of a communication network can beconsidered negligible. This simulation method wouldstill be applicable if the volume of the power data growslarge enough to affect the network simulation. Thisis possible because the power grid simulation isfully controlled; the system can indicate the time ofoccurrence of a fault, so that the network packet canbe added at precisely that time during the networksimulation. Simulation errors can be avoided becauseonly one simulator is operating. The integrated cyber-physical simulation framework design is shown inFig. 1.
Network simulators such as NS2 use record filesto record the event of each packet, and end-to-endnetwork delays or lost packets can be obtained fromthese files. The network simulation is carried out beforethe power system simulation, and the results are writteninto a database.
The power system simulator defines the startingtime of a simulation, and the simulation interval isdependent on the specific data-sampling rate of eachapplication. For example, a WAMC system’s sampling
Network
simulator
Power system
simulator
Simulation
results
Queue model
Send packets to
control center
Control
strategy
Control
feedback
Network
delays and
packet lost
Fig. 1 The integrated cyber-physical simulation framework.
rate is approximately 10-100 ms per sample. In our testcase, a simulation interval of 30 ms is assumed for thetransmission of data from the PMU to a Phasor DataCenter (PDC). At the end of each simulation period,the power system simulator suspends the simulation andsends the results to the queue model. There is a virtualclock in the power system simulator; each packet sentis marked with the current simulation time stamp.
Once the queue model receives a data packetfrom the power system simulator, it reads thecommunication network simulation results from thedatabase and calculates the current data packet delaysor packet losses. The queue model then places thisstep packet into the queue according to its calculateddelay. The time resolution of two neighboring queuepositions depends on the accuracy requirements of theapplication. For example, if the control feedback returnsin ms, the time resolution is 1 ms, which means that 1.1ms or 1.2 ms can be treated as 1 ms. This resolution isapplied to both the queue model and the controller tocalculate the control feedback.
The queue model then pushes the current top-of-queue packets of one simulation period to thecontroller. For example, if the simulation interval is 30ms with a resolution of 1 ms, the top 30 packets are sentto the controller.
The controller computes its outputs from the currentdata packets and the time resolution. For example, the30 packets received after one simulation period are usedto calculate the feedback data. Each of the 30 feedbackresults is processed and marked with a time stamp. Theresults are sent back to the power system simulator, andthe controller waits for the next data packets.
When the power system simulator receives thefeedback packets, it exits suspend mode and initiatesanother simulation period. Due to the time stampincluded in the control feedback results, the simulatorcan specify the exact time step to incorporate thecorresponding control data into the simulation.
As described above, the three simulation steps areinterdependent to avoid conflicts in the simulation. Theentire system state diagram is illustrated in Fig. 2.
4 System Implementation
4.1 Implementation of power system simulator
The TH-STBLT software package is a power systemsimulator developed by the Department of ElectricalEngineering, Tsinghua University. It has recently been

4 Tsinghua Science and Technology, June 2013, 18(3): 000-000
Fig. 2 System state diagram.
employed as the computational core component of apower system real-time hybrid simulation[9].
TH-STBLT is a typical and traditional simulatorfor large power systems. It is capable of providingdynamic simulation of power systems, includingelectrical distribution networks, generators and loads,motion of the interconnected generators, and coupledelectromagnetic and mechanical phenomena afterdisturbances or faults.
In TH-STBLT, a power system is modeled usinga set of ordinary differential equations and a largesparse algebraic equation[24]. The differential equationsnumerically describe the dynamic power components,while the algebraic equation characterizes the powernetwork to investigate node voltages, branch currentsand injected currents, etc.
TH-STBLT uses the implicit trapezoidal integrationmethod to numerically solve the model of a powersystem. This method has been widely used in powersystem simulation due to its good convergence andstability. The LU factorization algorithm is employed tosolve high-order polynomial equations with increasedcomplexity. To improve the efficiency of processingfault or disturbance events, we propose adopting amethod based on synthesis fault port admittance insteadof the traditional approaches.
As Fig. 3 shows, the simulation begins by loadingmodels of the system components and the dynamicparameters of each device. The steady-state loadflow is then calculated, and the dynamic scenario isinitialized. A fault/disturbance can be added to thesystem at a specified time, and the simulation proceeds
Fig. 3 The computational flow of the power systemsimulator.
to its core function. Differential Algebraic Equations(DAE) are applied to calculate the transient state ofthe system based on iterative computations. In Fig. 3,U1 is the initial value, U.k/ and U.k C 1/ refer toiteration steps, and tol is the convergence criterion. Thesimulation results are then collected and dispatched tothe communication network. Then, the next simulationstep begins, where t is the simulation time, dt refersto the simulation step size, and ts is the simulationstop time set by the user. TH-STBLT has been widelyemployed and assessed in practice, and its performanceand accuracy have been confirmed. We adopted theChina Southern Power Grid in 2008 as an example forevaluation of TH-STBLT. This sample system contains1393 nodes, 2371 branches, 244 generators, and 620loads. The controllers include 244 types of exciters,244 prime movers and governors, and 31 power systemstabilizers.
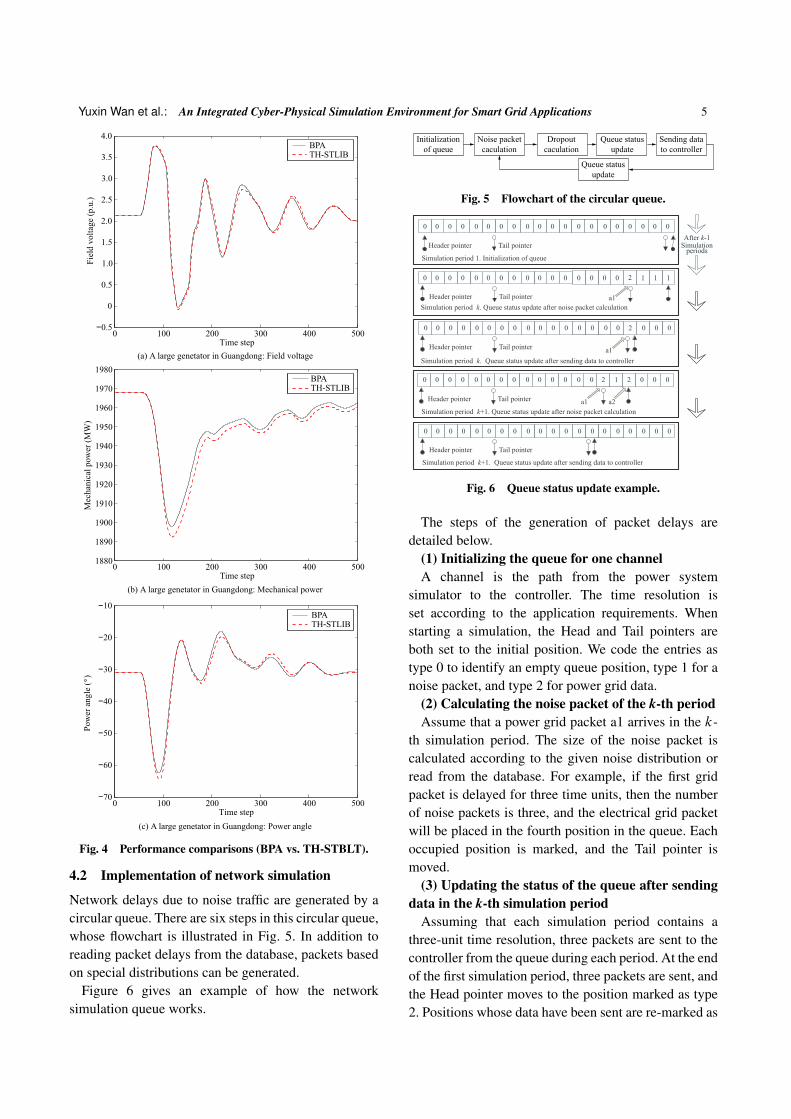
The results of the simulation of a three-phasefault at a substation using TH-STBLT are presentedin Fig. 4, compared with results obtained via thecommercial software BPA, which is widely employedin power system dispatching, operating mode analysis,power system planning, etc. The simulation resultsdemonstrate the effective and stable performance ofTH-STBLT compared to BPA.
The transient characteristics of large powergrids are indicated by oscillations after a fault ordisturbance. Four parameters of these oscillations areused: amplitude, frequency, phase, and damping. AsFig. 4 shows, the frequency, phase, and dampingproduced by TH-STBLT are consistent with BPA,while the maximum amplitude difference is 0.42% ofBPAs output.
Yuxin Wan et al.: An Integrated Cyber-Physical Simulation Environment for Smart Grid Applications 5
Fig. 4 Performance comparisons (BPA vs. TH-STBLT).
4.2 Implementation of network simulation
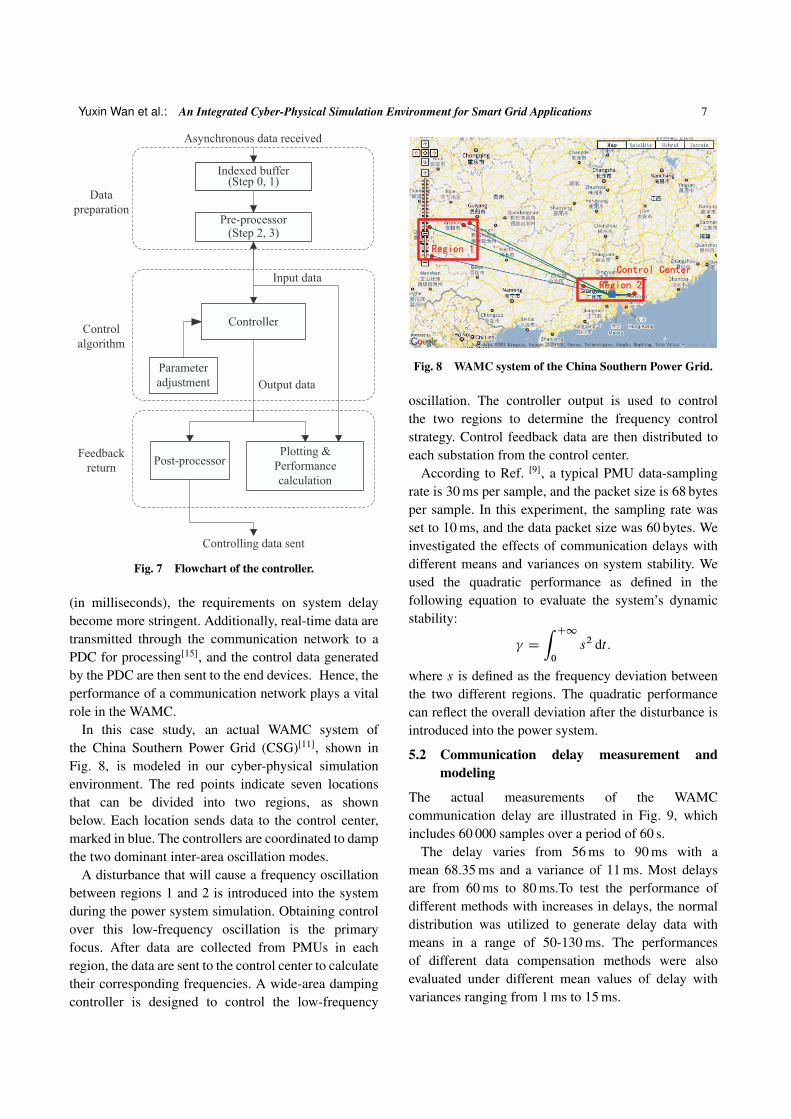
Network delays due to noise traffic are generated by acircular queue. There are six steps in this circular queue,whose flowchart is illustrated in Fig. 5. In addition toreading packet delays from the database, packets basedon special distributions can be generated.
Figure 6 gives an example of how the networksimulation queue works.
Fig. 5 Flowchart of the circular queue.
Fig. 6 Queue status update example.
The steps of the generation of packet delays aredetailed below.
(1) Initializing the queue for one channelA channel is the path from the power system
simulator to the controller. The time resolution isset according to the application requirements. Whenstarting a simulation, the Head and Tail pointers areboth set to the initial position. We code the entries astype 0 to identify an empty queue position, type 1 for anoise packet, and type 2 for power grid data.
(2) Calculating the noise packet of the k-th periodAssume that a power grid packet a1 arrives in the k-
th simulation period. The size of the noise packet iscalculated according to the given noise distribution orread from the database. For example, if the first gridpacket is delayed for three time units, then the numberof noise packets is three, and the electrical grid packetwill be placed in the fourth position in the queue. Eachoccupied position is marked, and the Tail pointer ismoved.
(3) Updating the status of the queue after sendingdata in the k-th simulation period
Assuming that each simulation period contains athree-unit time resolution, three packets are sent to thecontroller from the queue during each period. At the endof the first simulation period, three packets are sent, andthe Head pointer moves to the position marked as type2. Positions whose data have been sent are re-marked as

6 Tsinghua Science and Technology, June 2013, 18(3): 000-000
type 0.(4) Calculating the noise packet of the k-th periodAssume that power grid packet a2 arrives during the
second simulation period and that its calculated delayis two time units. Packet a2 is then placed in the sixthposition in the queue. The Tail pointer moves back twopositions.
(5) Updating the status of the queue on dropoutsIn scenarios in which the calculated delay is larger
than a defined threshold, the packet is regarded aslost. For example, in a normal distribution with mean �and variance � , the packet is lost if the calculated delayis larger than � C 3� . The lost packet is not placed inthe queue.
(6) Calculating the noise packet of the k-th periodAt the end of the second simulation period, three
packets are sent. Both a1 and a2 are sent. The Headpointer then moves back three positions. Positionswhose information was sent are marked as type 0.
4.3 Implementation of the controller
As Fig. 7 shows, the controller is implemented as threemodules, i.e., data preparation, control algorithm withchangeable parameter settings, and feedback return.
(1) Data preparationIn this module, asynchronous input data from all
PMUs are synchronized, or compensated for if missing.One major challenge in wide-area monitoring is thatthe controller cannot provide outputs until input datafrom all the PMUs are collected, some of which may bedelayed or even missing. As a trade-off between timeand accurate control, data from each individual PMUare collected and sorted in an index buffer by theircorresponding time stamps. The missing data must befilled in. Three steps are necessary to completing thistask, which are described as follows.
Step 0 Initialize the clock label Latest-Time,indicating the latest time stamp of the data that havebeen utilized.
Step 1 Read data into the buffer during eachperiod. As mentioned above, this buffer is used for datacompensation. Three sub-steps comprise this processare as follows:
Step 1.1 When new data arrive, they are comparedwith the clock label Latest-Time. If their time stampsare less than Latest-Time, these data were collectedearlier than the latest utilized data and should not beused as controller input. They are either stored for futureuse or simply discarded.
Step 1.2 Check the time stamps from differentcommunication channels and place the data with thesame time stamp into the correct position in the inputbuffer.
Step 1.3 Check to determine whether all the data withthe latest time stamp have arrived. If yes, proceed toStep 3; otherwise, proceed to Step 2.
Step 2 Compensate for the missing data.Three methods are designed to compensate for
missing data and data without synchronization.Single Channel History (SCH): When data from one
channel are delayed or missing, they will be filled withthe last consecutive data used in the previous period.
Full Channel Compensation (FCC): The time stampsof the latest data arrivals from different channels arerecorded. The data from the last three sets in theprevious periods are used to estimate the data with thepresent time stamp.
Single Channel Compensation (SCC): During onesimulation period, the newly arrived data from eachchannel are used immediately. The missing data areestimated from the last three sets in previous periods.
Step 3 Pass all the signals to the controller as itsinputs. Set Current Time as the time stamp of thosesignals.
(2) Control algorithmIn this module, with parameter adjustment, the
controller’s parameters can be adjusted correspondingto signal dynamics. The controller reads input dataand calculates control outputs according to the controlstrategy or algorithm, which can be changed fordifferent applications.
(3) Feedback returnIn this module, the control signals are
sent. Additionally, the controller’s dynamics areplotted, and corresponding stability metrics arecalculated.
5 A Case Study
In this section, WAMC in a smart grid is consideredas a case study to evaluate the performance of thissimulation environment.
5.1 WAMC of China Southern Power Grid
Synchronized PMU-based WAMC is an importantfunction in the current power grid[22]. Compared witha traditional SCADA system, a PMU-based systemcan provide more detailed data on the power grid inreal time[23]. As the sampling interval becomes smaller
Yuxin Wan et al.: An Integrated Cyber-Physical Simulation Environment for Smart Grid Applications 7
Fig. 7 Flowchart of the controller.
(in milliseconds), the requirements on system delaybecome more stringent. Additionally, real-time data aretransmitted through the communication network to aPDC for processing[15], and the control data generatedby the PDC are then sent to the end devices. Hence, theperformance of a communication network plays a vitalrole in the WAMC.
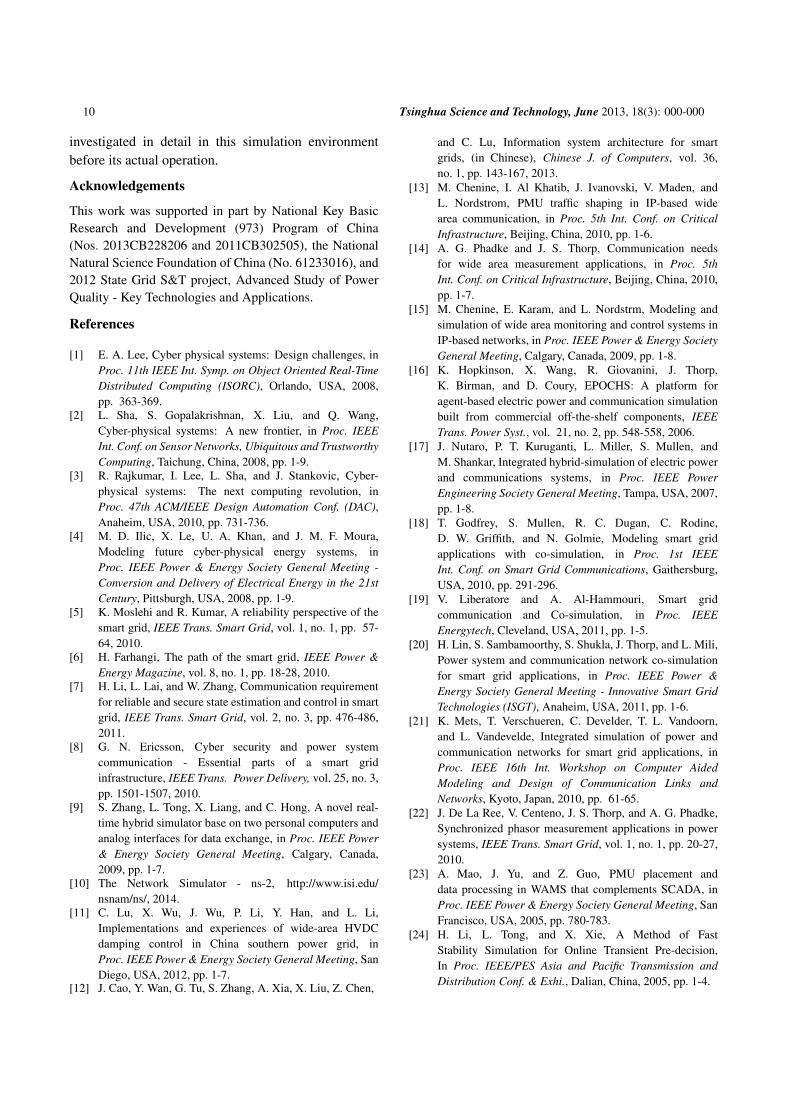
In this case study, an actual WAMC system ofthe China Southern Power Grid (CSG)[11], shown inFig. 8, is modeled in our cyber-physical simulationenvironment. The red points indicate seven locationsthat can be divided into two regions, as shownbelow. Each location sends data to the control center,marked in blue. The controllers are coordinated to dampthe two dominant inter-area oscillation modes.
A disturbance that will cause a frequency oscillationbetween regions 1 and 2 is introduced into the systemduring the power system simulation. Obtaining controlover this low-frequency oscillation is the primaryfocus. After data are collected from PMUs in eachregion, the data are sent to the control center to calculatetheir corresponding frequencies. A wide-area dampingcontroller is designed to control the low-frequency
Fig. 8 WAMC system of the China Southern Power Grid.
oscillation. The controller output is used to controlthe two regions to determine the frequency controlstrategy. Control feedback data are then distributed toeach substation from the control center.
According to Ref. [9], a typical PMU data-samplingrate is 30 ms per sample, and the packet size is 68 bytesper sample. In this experiment, the sampling rate wasset to 10 ms, and the data packet size was 60 bytes. Weinvestigated the effects of communication delays withdifferent means and variances on system stability. Weused the quadratic performance as defined in thefollowing equation to evaluate the system’s dynamicstability:
D
Z C10
s2 dt:
where s is defined as the frequency deviation betweenthe two different regions. The quadratic performancecan reflect the overall deviation after the disturbance isintroduced into the power system.
5.2 Communication delay measurement andmodeling
The actual measurements of the WAMCcommunication delay are illustrated in Fig. 9, whichincludes 60 000 samples over a period of 60 s.
The delay varies from 56 ms to 90 ms with amean 68.35 ms and a variance of 11 ms. Most delaysare from 60 ms to 80 ms.To test the performance ofdifferent methods with increases in delays, the normaldistribution was utilized to generate delay data withmeans in a range of 50-130 ms. The performancesof different data compensation methods were alsoevaluated under different mean values of delay withvariances ranging from 1 ms to 15 ms.

8 Tsinghua Science and Technology, June 2013, 18(3): 000-000
Fig. 9 Communication delay measurement from the actualWAMC system.
5.3 Experimental results
The experimental results are depicted in Figs. 10-14,where different communication delays, variances, anddata compensation methods lead to different systemperformances. According to its definition, a higherindicates a worse performance.
As Figs. 10-12 show, system performance with
Fig. 10 Experimental results with SCH method.
Fig. 11 Experimental results with FCC method.
Fig. 12 Experimental results with SCC method.
Fig. 13 Performance improvements with different methods.
Fig. 14 Average performance improvements with meandelay increase.
WAMC presents a dramatic improvement over theperformance of no control scenarios, especially whenno communication delay is involved. With increasedcommunication delays, the system performancebecomes worse for all the data compensation methods.
We have also investigated the system performancewith WAMC compared to the traditionalsynchronization framework. In the traditional method,

Yuxin Wan et al.: An Integrated Cyber-Physical Simulation Environment for Smart Grid Applications 9
a synchronization point is required between thenetwork and the power grid simulators. As previouslymentioned, a simulation error will occur during thissynchronization. This may delay the data transmissionfrom the power grid to the controller, and the feedbackdata would subsequently be delayed as well. Theseevents will lead to a worse performance in theWAMC experiments. The system performance wasassessed with mean delay values varying from 50 msto 130 ms. For each mean value, we tested the variancefrom 1 ms to 15 ms with steps of two, i.e., a total ofeight points.
As Fig. 13 shows, the performance of thedesigned system can be effectively improved inmost cases. Figure 14 illustrates the average percentageof improvement in system performance compared tothe traditional framework. With increases in meandelays, the difference between methods becomes lesssignificant. It is reasonable to assume that the systemperformance of WAMC will drop in response to theincreased delay and, therefore, that the correctionof simulation errors will exert less influence on thesystem.
This experiment resulted in some additionalfindings. It can be observed that the systemperformances of different methods vary with increasedvariances in the delay. Most methods lead to bettersystem performance when the delay variance increaseswithin a certain range. The overall variation in systemperformance within a single method is consistent whenthe mean delay changes. This means that performanceunder different delay variances is more dependent onthe method itself than on the mean delay. If the varianceof delay has little impact on system performance, thesame characteristics may be revealed with variousvalues of mean delay.
When the delay variance is small, methods requiringno data synchronization, such as SCC, exhibit abetter performance. However, with an increased delayvariance, methods such as FCC with synchronizationperform better. This is because when the delay varianceis small, the input data are likely to be alreadysynchronized, and interpolation estimations in thesynchronization step may lead to errors. However,when the delay variance increases, the input dataare more random, and data synchronization becomesnecessary. This result indicates that data compensationmethods should depend on different network delayscenarios.
We conclude from these experimental results thatthe proposed simulation method provides betterperformance than the traditional synchronizationframework. Data compensation methods play animportant role in WAMC systems, which are importantparts of smart grids. Data compensation methods shouldbe chosen according to network delay variations. Toidentify the best method in an unstable networkenvironment with a large variance in delays, theperformance should be tested under a particularnetwork delay mean.
6 Conclusions
Cyber-physical systems focus on close interactionsbetween cyberspace and the physical world. The impactof cyber-systems (e.g., communication networks) onphysical systems (e.g., power grid systems) can beinvestigated via simulations. This study is a preliminaryattempt to develop an integrated cyber-physicalsimulation environment, especially for smart gridapplications. The implementation uses communicationnetwork simulation, power grid simulation, and WAMCcontrol simulation. An existing well-developed andimproved power system simulator, TH-STBLT, wasadopted in this work.
The difference between our proposed simulationframework and others is that our framework solvesthe synchronization problem between discrete eventsimulation and continuous simulation by running thetwo simulators asynchronously. However, becausethe two simulation tools run asynchronously in theproposed framework, it will be difficult to apply itin real-time simulations for online application. Thissimulation framework can be used in the assessmentof any power grid system designs. In our experiment,this simulation platform was tested using the WAMCsystem in a smart grid as a case study. Severaldata compensation methods were developed andinvestigated under different network delay conditionswith or without data synchronization. The experimentalresults are useful toward WAMC system design andimplementation.
The network model in this experiment is simple,as only a normal distribution is used to generatethe delay means. In future studies, more networkmodels will be investigated and integrated into thisenvironment. Furthermore, the existing WAMC forCSG, with hundreds of nodes, will be added and
10 Tsinghua Science and Technology, June 2013, 18(3): 000-000
investigated in detail in this simulation environmentbefore its actual operation.
Acknowledgements
This work was supported in part by National Key BasicResearch and Development (973) Program of China(Nos. 2013CB228206 and 2011CB302505), the NationalNatural Science Foundation of China (No. 61233016), and2012 State Grid S&T project, Advanced Study of PowerQuality - Key Technologies and Applications.
References
[1] E. A. Lee, Cyber physical systems: Design challenges, inProc. 11th IEEE Int. Symp. on Object Oriented Real-TimeDistributed Computing (ISORC), Orlando, USA, 2008,pp. 363-369.
[2] L. Sha, S. Gopalakrishnan, X. Liu, and Q. Wang,Cyber-physical systems: A new frontier, in Proc. IEEEInt. Conf. on Sensor Networks, Ubiquitous and TrustworthyComputing, Taichung, China, 2008, pp. 1-9.
[3] R. Rajkumar, I. Lee, L. Sha, and J. Stankovic, Cyber-physical systems: The next computing revolution, inProc. 47th ACM/IEEE Design Automation Conf. (DAC),Anaheim, USA, 2010, pp. 731-736.
[4] M. D. Ilic, X. Le, U. A. Khan, and J. M. F. Moura,Modeling future cyber-physical energy systems, inProc. IEEE Power & Energy Society General Meeting -Conversion and Delivery of Electrical Energy in the 21stCentury, Pittsburgh, USA, 2008, pp. 1-9.
[5] K. Moslehi and R. Kumar, A reliability perspective of thesmart grid, IEEE Trans. Smart Grid, vol. 1, no. 1, pp. 57-64, 2010.
[6] H. Farhangi, The path of the smart grid, IEEE Power &Energy Magazine, vol. 8, no. 1, pp. 18-28, 2010.
[7] H. Li, L. Lai, and W. Zhang, Communication requirementfor reliable and secure state estimation and control in smartgrid, IEEE Trans. Smart Grid, vol. 2, no. 3, pp. 476-486,2011.
[8] G. N. Ericsson, Cyber security and power systemcommunication - Essential parts of a smart gridinfrastructure, IEEE Trans. Power Delivery, vol. 25, no. 3,pp. 1501-1507, 2010.
[9] S. Zhang, L. Tong, X. Liang, and C. Hong, A novel real-time hybrid simulator base on two personal computers andanalog interfaces for data exchange, in Proc. IEEE Power& Energy Society General Meeting, Calgary, Canada,2009, pp. 1-7.
[10] The Network Simulator - ns-2, http://www.isi.edu/nsnam/ns/, 2014.
[11] C. Lu, X. Wu, J. Wu, P. Li, Y. Han, and L. Li,Implementations and experiences of wide-area HVDCdamping control in China southern power grid, inProc. IEEE Power & Energy Society General Meeting, SanDiego, USA, 2012, pp. 1-7.
[12] J. Cao, Y. Wan, G. Tu, S. Zhang, A. Xia, X. Liu, Z. Chen,
and C. Lu, Information system architecture for smartgrids, (in Chinese), Chinese J. of Computers, vol. 36,no. 1, pp. 143-167, 2013.
[13] M. Chenine, I. Al Khatib, J. Ivanovski, V. Maden, andL. Nordstrom, PMU traffic shaping in IP-based widearea communication, in Proc. 5th Int. Conf. on CriticalInfrastructure, Beijing, China, 2010, pp. 1-6.
[14] A. G. Phadke and J. S. Thorp, Communication needsfor wide area measurement applications, in Proc. 5thInt. Conf. on Critical Infrastructure, Beijing, China, 2010,pp. 1-7.
[15] M. Chenine, E. Karam, and L. Nordstrm, Modeling andsimulation of wide area monitoring and control systems inIP-based networks, in Proc. IEEE Power & Energy SocietyGeneral Meeting, Calgary, Canada, 2009, pp. 1-8.
[16] K. Hopkinson, X. Wang, R. Giovanini, J. Thorp,K. Birman, and D. Coury, EPOCHS: A platform foragent-based electric power and communication simulationbuilt from commercial off-the-shelf components, IEEETrans. Power Syst., vol. 21, no. 2, pp. 548-558, 2006.
[17] J. Nutaro, P. T. Kuruganti, L. Miller, S. Mullen, andM. Shankar, Integrated hybrid-simulation of electric powerand communications systems, in Proc. IEEE PowerEngineering Society General Meeting, Tampa, USA, 2007,pp. 1-8.
[18] T. Godfrey, S. Mullen, R. C. Dugan, C. Rodine,D. W. Griffith, and N. Golmie, Modeling smart gridapplications with co-simulation, in Proc. 1st IEEEInt. Conf. on Smart Grid Communications, Gaithersburg,USA, 2010, pp. 291-296.
[19] V. Liberatore and A. Al-Hammouri, Smart gridcommunication and Co-simulation, in Proc. IEEEEnergytech, Cleveland, USA, 2011, pp. 1-5.
[20] H. Lin, S. Sambamoorthy, S. Shukla, J. Thorp, and L. Mili,Power system and communication network co-simulationfor smart grid applications, in Proc. IEEE Power &Energy Society General Meeting - Innovative Smart GridTechnologies (ISGT), Anaheim, USA, 2011, pp. 1-6.
[21] K. Mets, T. Verschueren, C. Develder, T. L. Vandoorn,and L. Vandevelde, Integrated simulation of power andcommunication networks for smart grid applications, inProc. IEEE 16th Int. Workshop on Computer AidedModeling and Design of Communication Links andNetworks, Kyoto, Japan, 2010, pp. 61-65.
[22] J. De La Ree, V. Centeno, J. S. Thorp, and A. G. Phadke,Synchronized phasor measurement applications in powersystems, IEEE Trans. Smart Grid, vol. 1, no. 1, pp. 20-27,2010.
[23] A. Mao, J. Yu, and Z. Guo, PMU placement anddata processing in WAMS that complements SCADA, inProc. IEEE Power & Energy Society General Meeting, SanFrancisco, USA, 2005, pp. 780-783.
[24] H. Li, L. Tong, and X. Xie, A Method of FastStability Simulation for Online Transient Pre-decision,In Proc. IEEE/PES Asia and Pacific Transmission andDistribution Conf. & Exhi., Dalian, China, 2005, pp. 1-4.

Yuxin Wan et al.: An Integrated Cyber-Physical Simulation Environment for Smart Grid Applications 11
Yuxin Wan is currently a PhD candidateof Department of Automation, TsinghuaUniversity, China. He received the BEngdegree from Tsinghua University in2008. His research interests includecyber-physical systems and smart gridapplications.
Junwei Cao is currently a professor anddeputy director of Research Instituteof Information Technology, TsinghuaUniversity, China. He is also the director ofOpen Platform and Technology Division,Tsinghua National Laboratory forInformation Science and Technology. Hisresearch interests include advanced
computing technology and applications. Before joining Tsinghuain 2006, Junwei Cao was a research scientist of MassachusettsInstitute of Technology, USA. Before that he worked as aresearch staff member of NEC Europe Ltd., Germany. JunweiCao got his PhD degree in computer science from University ofWarwick, UK in 2001. He got his MEng and BEng degrees fromTsinghua University in 1998 and 1996, respectively. Junwei Caohas published over 130 academic papers and books, cited byinternational researchers for over 3000 times. Junwei Cao is asenior member of the IEEE Computer Society and the memberof the ACM and CCF.
Shuqing Zhang is currently a researchassistant with the Department of ElectricalEngineering, Tsinghua University,China. He received his BEng and PhDdegrees from Tsinghua Universityin 2005 and 2010, respectively. Hisresearch interests include sub-synchronousresonance in power system, electro-
magnetic/electrical-mechanical hybrid real-time simulation, IoTapplied in powersystem, and power load modelling as well asidentification of dominant parameters.
Guoyu Tu is with Tsinghua NationalLaboratory for Information Scienceand Technology, Tsinghua University,China. She received the BEng and PhDdegrees from Tsinghua University in2002 and 2010, respectively. Her researchinterests include data mining, stochasticscheduling, and optimization for large
scale systems including smart grid, manufacturing and servicenetwork.
Chao Lu is currently an AssistantProfessor with the Department of ElectricalEngineering, Tsinghua University, China.He received the BEng and Ph.D. degreesfrom Tsinghua University in 1999 and2005, respectively. His research interestsinclude power system analysis and control,and intelligent control applications.
Xingtao Xu is the director of ElectricPower Quality Research Center, JiangSuElectric Power Company, senior engineer,expert enjoying special allowanceof the State Council. His researchinterests include theoretical researchand engineering application of electricalenergy quality monitoring and governance,
reactive voltage optimization and control field. He presided overthe State Grid, provincial, municipal science and technologyprojects of China, and has won 8 national invention patents, 26science and technology awards, including “the supply networkreactive voltage optimization centralized control system” whichwon the second prize of national scientific and technologicalprogress award.
Keqin Li is a SUNY DistinguishedProfessor of computer science at StateUniversity of New York. He is also anIntellectual Ventures endowed visitingchair professor at Tsinghua University,China. Keqin Li received his BEng degreein computer science from TsinghuaUniversity, China in 1985, and PhD degree
in computer science from the University of Houston, USA in1990. He was an assistant professor (1990-1996), an associateprofessor (1996-1999), a full professor (1999-2009), and hasbeen a SUNY distinguished professor of computer science since2009 in State University of New York at New Paltz. He wasthe acting chair of Department of Computer Science duringSpring 2004. His research interests are mainly in design andanalysis of algorithms, parallel and distributed computing,and computer networking. He has over 285 refereed researchpublications. He is currently or has served on the editorial boardof IEEE Transactions on Parallel and Distributed Systems, IEEETransactions on Computers, Journal of Parallel and DistributedComputing, International Journal of Parallel, Emergent andDistributed Systems, International Journal of High PerformanceComputing and Networking, International Journal of Big DataIntelligence, and Optimization Letters.