Embed Size (px)
Citation preview
International Journal of Applied Engineering Research ISSN 0973-4562 Volume 12, Number 21 (2017) pp. 10491-10504
© Research India Publications. http://www.ripublication.com
10491
An Insight into the Rotational Augmentation on HAWTs by means of CFD
Simulations – Part I: State of the Art and Numerical Results
Mauro S.1,*, Lanzafame R.2 and Messina M.3 1,2,3 Department of Industrial Engineering, University of Catania, Viale A. Doria, 6 – 95125 Catania, Italy.
1Orcid 0000-0002-5377-7628, 1Scopus Author ID: 55485143400, 1Researcher ID: F-3291-2013 * Corresponding author
Abstract
The scientific debate about the rotational augmentation is
currently quite open as there is no consensus on the rise and
development of this phenomenon. Centrifugal forces, Coriolis
effects and spanwise pressure distribution are recognized as
being responsible for the rise of the rotational augmentation
but, at present, their specific relevance has not been physically
demonstrated. Tens of empirical equations were in fact
proposed by several authors in order to take into account the
aforementioned phenomena inside simplified 1D design
codes. The results are quite different amongst each other and
seem to be related to particular conditions instead of giving a
generalized vision of the problem. The present paper starts
from the aforementioned assumptions and attempts to provide
a new global physical view of the phenomenon. Through the
use of validated CFD models, an experimental micro HAWT
was extensively analyzed. The model was based on a
calibrated RANS transition turbulence model, particularly
suitable for low Reynolds applications. In this first part, a
review of the CFD modeling strategy and validation is
presented. Sectional data of 3D lift and drag coefficients were
extrapolated depending on radial position, wind speed,
rotational speed and finally compared to 2D data.
Furthermore, 3D CFD simulations of a single fixed wing, with
a velocity profile equal to the one generated by rotation and a
momentum equal to that due to rotation was implemented.
This was done in order to try to separate the effect of
centrifugal and Coriolis forces from that caused by the
spanwise pressure distribution.
Keywords: HAWT, CFD Transition Modeling, Centrifugal
Pumping, Rotational Augmentation
INTRODUCTION
The Horizontal Axis Wind Turbine aerodynamics have been
studied in depth during the last fifty years, reaching noticeable
results in their design. The larger modern rotors demonstrate
the capability to extract about fifty per cent of the wind energy
thanks to accurate aerodynamic studies and controls.
However, not all of the 3D wind turbine aerodynamic
phenomena are clearly understood. Furthermore, the
increasing interest towards mini and micro rotors has lead to
the study of low Reynolds wind turbine aerodynamics.
Indeed, in these conditions, the 3D phenomena become ever
more important thus influencing the rotor design much more
than the larger rotors [1]. For this reason, an accurate
comprehension of the onset and development of 3D flows will
be a key step for the improvement of the design of mini and
micro wind turbines. These rotors, in fact, operate at low
Reynolds numbers and high rotational speed, mainly using a
passive stall regulation for power control. As the stall delay
and rotational augmentation are strictly related to the onset of
the stall, the importance of an accurate physical description of
these phenomena is clearly evident.
From the reviewed literature [2], it can be hypothesized that
the radial flow in rotating blades is due to three forces: the
centrifugal force, the Coriolis force and the spanwise pressure
gradient force. These forces act together on the suction side of
the blade, in incipient and deep stall conditions, generating a
complex radial flow and a strong depressurization. The
depressurization further modifies the flow field in the
boundary layer, causing a partial or total reattachment in the
incipient stall region (called stall delay) or a reduction and
flattening of the recirculation area in deep stall conditions.
Therefore, the overall depressurization of the suction side is
quite higher than in the case of the 2D flows.
As reported in a previous work by the authors [2] the
objective of all the research was mainly to quantify the
influence of rotational effects on the airfoil characteristics of a
rotating blade. This was of great importance so as to provide a
simplified model for use in 1D design codes. However, if all
the results in accordance with one another that the maximum
rotational effects are related to the inner part of the blade, they
are in contrast regarding the quantification of the
phenomenon.
In order to obtain simplified models of the centrifugal
pumping, most authors [1, 3 - 8] emphasize the chordwise
Coriolis effects on the rotational augmentation. They assert
that, in the chordwise direction, the adverse pressure gradient
is reduced by the streamwise Coriolis force component
generated by the radial flow, thus reducing the stall compared
to a 2D condition. Therefore, the centrifugal force and the
spanwise pressure gradient trigger the onset of a radial flow
and, as a consequence, the Coriolis acceleration decreases the
adverse pressure gradient in the chordwise direction. This
would lead to the widely known noticeable increase in
International Journal of Applied Engineering Research ISSN 0973-4562 Volume 12, Number 21 (2017) pp. 10491-10504
© Research India Publications. http://www.ripublication.com
10492
aerodynamic forces. This physical explanation is merely a
hypothesis and has not been clearly supported by results.
Moreover, many authors disagree on this supposition.
The numerous attempts to model the radial flow effects on
rotor aerodynamics, in fact, have demonstrated conflicting
results [4, 9]. Even the most advanced models, based on the
solution of boundary layer equations [1, 10], have shown
limited accuracy, in the sense that they allowed for a precise
prediction about the effects of rotation in specific operative
conditions or with specific rotors or airfoils. They are unable,
however, to give generalized reliable results. Therefore, the
breakdown of the boundary layer analysis under separated
flow conditions is probably an inherent problem with these
methods. This suggests that the philosophy, which underlies
these models, may not be correctly representing the real flow
physics.
The use of powerful CFD 3D computations has allowed the
researchers to better understand the philosophy of the rise and
development of the centrifugal pumping. As reported in [2],
however, the main objective of the reviewed CFD 3D models
as well as the experimental analyses [4, 6, 11] has been to
confirm and quantify the rotation effects.
Specifically, the work by Sørensen et al. [12] demonstrated
the strategy to extract the 3D airfoil characteristic based on
accurate CFD 3D computations. They emphasized the
rotational augmentation, leading the way to define more
reliable 1D BEM calculations. Using a CFD RANS modeling,
Carangiu et al. [13] showed the strong rotational effects on the
boundary layer, post processing the velocity profiles.
Recently, Herráez et al. [14] developed an interesting CFD
and PIV analysis in order to evaluate the rotational effects on
MEXICO rotor. They introduced the Rossby number for
taking into account the ratio between Coriolis and inertia
forces. They concluded that the radial flow, in this case, was
mainly caused by the centrifugal force in contrast with the
aforementioned results [1, 3 - 8]. Song et al. [15] simulated
the NREL PHASE VI rotor, showing the effects of the
rotation on the streamlines with a helical coherent structure
detached from the inner blade.
The present paper starts from the aforementioned literature
review and, based on the results obtained in previous works
[2, 16, 17], will attempt to give a global physical explanation
of the centrifugal pumping phenomenon, extending the CFD
analysis for a full characterization of an experimental micro
rotor.
Therefore, an accurate CFD 3D model was developed in order
to analyze an experimental micro rotor [16, 17]. This rotor
was designed, built and finally tested in the wind tunnel
owned by the University of Catania. The close proximity
between the experimental and numerical results allowed the
authors to validate the CFD 3D model. In the range of
validation of the model (between 500 and 4,500 r/min) the
rotor was analyzed in terms of torque, power and sectional
aerodynamic coefficients, evaluating the strong augmentation
of lift and drag coefficients compared to 2D simulation
results.
In order to carry out a thorough study of the rotational effects,
the aerodynamic coefficients were obtained for eleven radial
stations and for a wide range of angular speed and wind speed
combinations. The interesting results showed a substantial
independence from wind and rotational speeds and are
hereafter presented. Having noticed this particular trend, a
further post - processing study was implemented. Specifically,
2D and 3D streamlines, pressure, velocity, helicity contours as
well as pressure coefficient at different radial stations were
obtained. Furthermore, three specific conditions were
thoroughly evaluated: a stall delay condition (AoA < 20°), a
maximum lift augmentation condition (20° < AoA < 45°) and
a fully stalled condition at very high AoAs (AoA > 45°). From
this analysis the authors understood that the presence of a
coherent helical structure, detached from the inner part of the
blade, would responsible for the strong depressurization of the
suction side of the blade at 20° < AoA < 45°. This
depressurization was highlighted using Cp charts of the blade
sections, observing a strong acceleration of the fluid flow as
well. The helical structure was finally evidenced through the
use of a vortex core region post-processing tool.
In order to verify the source of this effect and single out the
individual contributions of the centrifugal force, Coriolis force
and spanwise pressure gradient, 3D CFD simulations of a
single fixed blade were implemented. A UDF (User Defined
Function) for obtaining a velocity profile boundary condition,
equal to the one generated by rotation was implemented.
Subsequently, a UDF for a momentum source, equal to the
centrifugal force generated by rotation, was added. Finally, a
momentum source equal to the Coriolis force was built. The
results demonstrated that the helical structure and its strong
effects on the flow field appeared only when these momenta
were activated.
The aforementioned results, presented in the part II of this
work, supported the thesis that it was the radial component of
the Coriolis force, and not the streamwise one, which
generated the helical structure and thus the strong forces
augmentation. Indeed, it is well known that the Coriolis force
can be decomposed into two components as it is given by two
times the cross product of angular speed and relative velocity
to the blade.
The weight of all the forces acting on a fluid element, in
relative motion compared to the blade, were analyzed (Part II)
with an accurate evaluation of the suction side radial velocity
profiles at different radial and chord positions, thus
demonstrating the particular behavior of the fluid element
within the separated layer. The essential role of the AoA on
the phenomenon and, specifically, the strong importance of
the radial component of the Coriolis force on the generation of
the aforesaid helical structure were then evaluated.
International Journal of Applied Engineering Research ISSN 0973-4562 Volume 12, Number 21 (2017) pp. 10491-10504
© Research India Publications. http://www.ripublication.com
10493
According to the authors’ ideas, the rotational augmentation
phenomenon can therefore be divided into three phases. In the
first phase, at lower AoAs, the stall delay and the slight force
augmentation are mainly caused only by the radial flow,
directed toward the tip. In this region, the reviewed literature
hypotheses are valid in first approximation and the simplified
models of stall delay are reliable enough. In the second phase,
the most interesting, the effect is guided by the generation of a
helical structure which strongly depressurizes the boundary
layer of the inner blade caused by the radial component (and
not the cordwise component) of the Coriolis force. In the third
phase, higher AoAs lead to a strong separation in such a way
that the rotational effects become less significant. The above
is related to the particular behavior of the separated boundary
layer that is entirely subjected to rotation effect. This
significantly differs from the attached boundary layer
behavior, as it will be explained hereinafter.
REVIEW AND VALIDATION OF THE CFD MODELS
HAWT CFD 3D models
The CFD 3D model used in this paper was developed and
validated in previous works by the authors [16, 17, 18]. To
keep things brief, only a summarization is reported, referring
to references [16 - 18] for more details. Specifically, the CFD
model was first of all implemented for the widely known
NREL PHASE VI HAWT, demonstrating great accuracy and
reliability [18]. The main features of the model are presented
in Tab.1. The 3D model was generated using ANSYS Fluent
with a steady state, pressure based, coupled solver. A grid
independence study was done and a Moving Reference Frame
model was used for rotation. The model was finally calibrated
by optimizing the SST Transition Turbulence Model by
Menter [19, 20]. The close proximity between numerical and
experimental data, demonstrated a good accuracy of the CFD
model when the Reynolds number led to a crucial importance
of the transition phenomena, which is the typical operative
Reynolds number of the PHASE VI rotor (5 · 105 < Re < 106).
The capabilities of the proposed CFD 3D model were
subsequently tested at lower Reynolds numbers (Re < 105),
where the boundary layer is mostly laminar and the separation
phenomena are predominant and impossible to predict with
fully turbulent models. With this in mind, a micro rotor was
designed for testing in the subsonic wind tunnel belonging to
the University of Catania [16, 17]. The experimental rotor was
a triple bladed, twisted and tapered. The characteristics of the
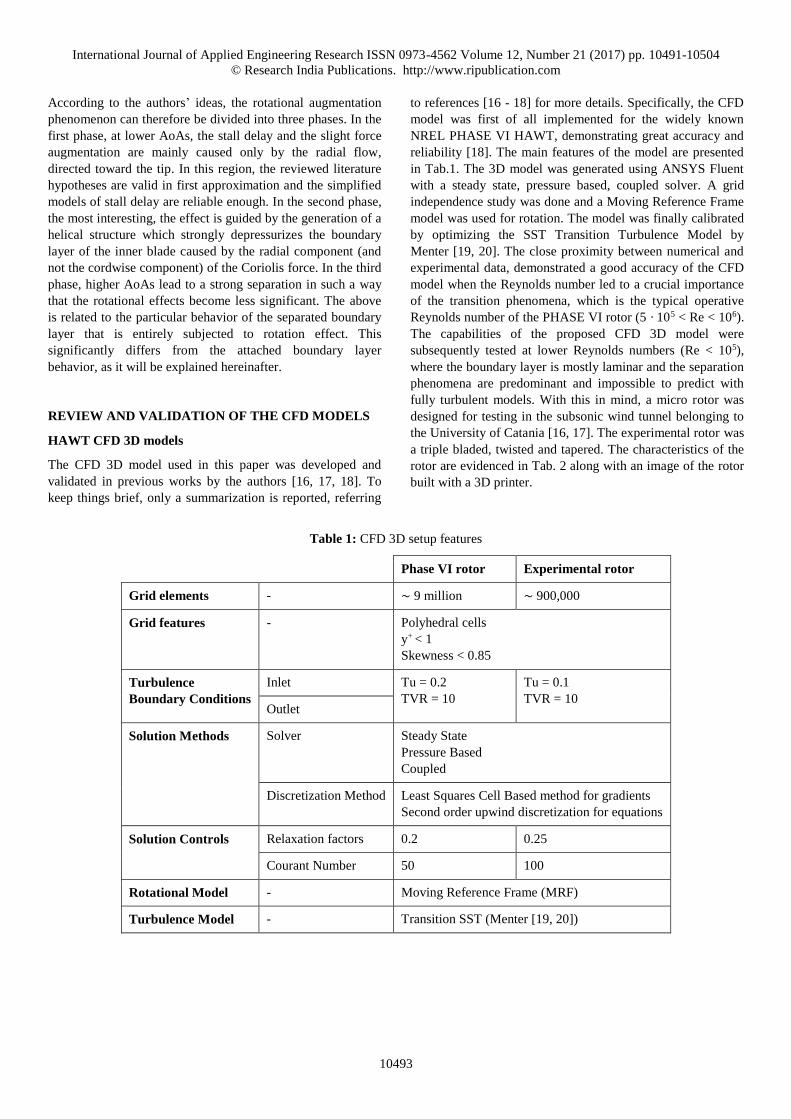
rotor are evidenced in Tab. 2 along with an image of the rotor
built with a 3D printer.
Table 1: CFD 3D setup features
Phase VI rotor Experimental rotor
Grid elements - ~ 9 million ~ 900,000
Grid features - Polyhedral cells
y+ < 1
Skewness < 0.85
Turbulence
Boundary Conditions
Inlet Tu = 0.2
TVR = 10
Tu = 0.1
TVR = 10 Outlet
Solution Methods Solver Steady State
Pressure Based
Coupled
Discretization Method Least Squares Cell Based method for gradients
Second order upwind discretization for equations
Solution Controls Relaxation factors 0.2 0.25
Courant Number 50 100
Rotational Model - Moving Reference Frame (MRF)
Turbulence Model - Transition SST (Menter [19, 20])
International Journal of Applied Engineering Research ISSN 0973-4562 Volume 12, Number 21 (2017) pp. 10491-10504
© Research India Publications. http://www.ripublication.com
10494
Table 2: Geometrical rotor characteristics
Experimental rotor features
Number of blades [-] 3
Blade Airfoil [-] NACA 4415
Rotor Diameter (D) [m] 0.225
Hub diameter (d) [m] 0.054
Rotational speed range (n) [r/min] 500 - 4,500
Wind speed (Vw) [m/s] 5 - 30
Tip Speed Ratio (λ) [-] 1 - 7
Chord (c) [m] variable
Twist [deg] variable
Figure 1: Details of the polyhedral mesh on the experimental rotor
Figure 2: Comparison between CFD and experimental power at different rotational speed
International Journal of Applied Engineering Research ISSN 0973-4562 Volume 12, Number 21 (2017) pp. 10491-10504
© Research India Publications. http://www.ripublication.com
10495
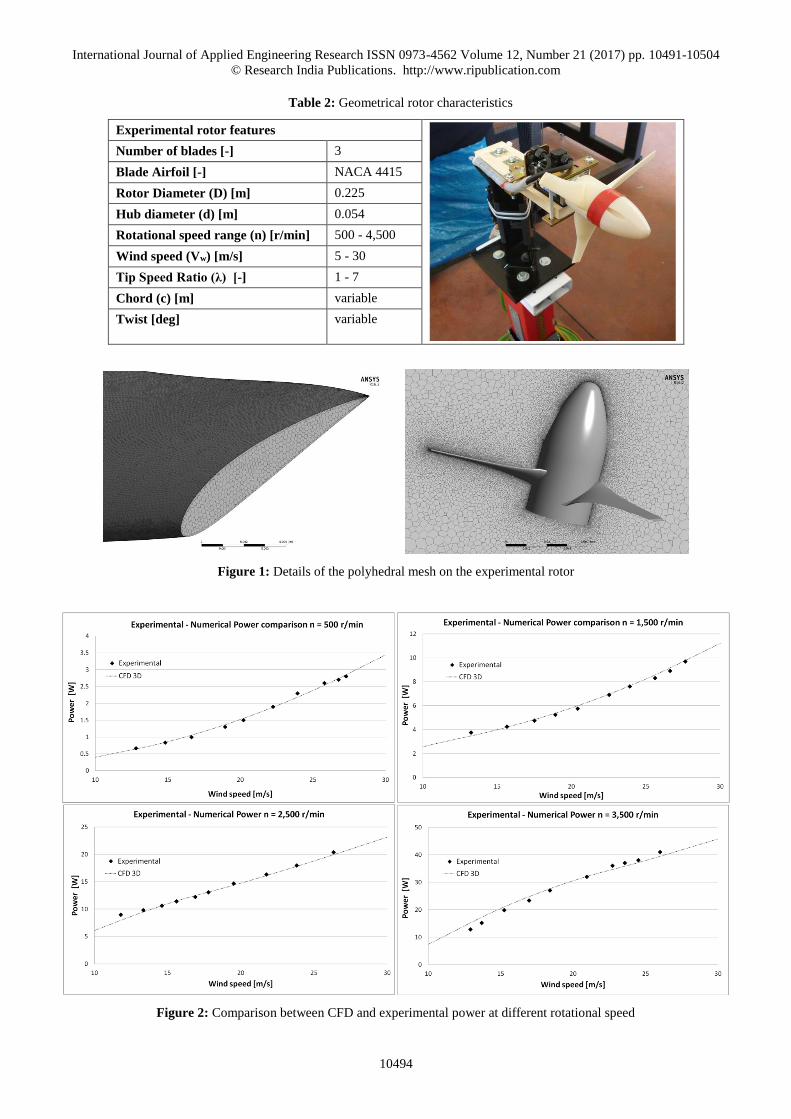
Figure 3: CFD 3D calculated performance for the experimental micro rotor
The micro rotor CFD model features are summarized in
Tab.1, while details of the polyhedral mesh are showed in Fig.
1. The close proximity between experimental and numerical
results confirmed the validity of the Transition CFD 3D model
at the lower Re as demonstrated in Fig. 2 where comparisons
between calculated and experimental generated power, at
different rotational speeds, are proposed. Further details on
the experimental set-up and numerical model can be found in
[17].
The range of validation is limited to 4,500 r/min due to the
maximum achievable rotational speed of the generator.
Therefore, all the following post-processing considerations
and extrapolations were done within this range. However the
CFD analyses allowed the authors to extend and verify the
maximum performance of the rotor, which may theoretically
exceed 14,000 r/min with a power peak of about 255 W and a
maximum power coefficient of 0.38 at a wind speed of 30
m/s. In relatively realistic operative conditions (5 < Vw < 15
m/s) the maximum achievable power would be near 26 W
with a maximum Cp ≈ 0.33. The results of the above are
shown in Fig.3.
In order to obtain a full set of data for the in depth analysis of
the centrifugal pumping phenomena, the experimental rotor
was simulated and fully post-processed from 500 to 4,500
r/min with a step of 500 r/min and for a wind speed from 5 to
30 m/s with a step of 5 m/s.
Fixed blade CFD 3D and 2D CFD airfoil models
As widely described in the introduction, the problem in the
comprehension of the rotational effects was the strong
codependence between the action of the spanwise pressure
gradient, the centrifugal and Coriolis forces. An accurate
knowledge of the rise and development of centrifugal
pumping cannot be disregarded from the evaluation of the
relative weight of these forces that trigger it inside the
separated layer. Furthermore, the important differences with
the simple 2D airfoil aerodynamic behavior must be
evidenced in order to better understand how the rotation
affects the flow field.
For this reason the idea was initially to implement a 2D CFD
model for the evaluation of the aerodynamic behavior of the
NACA 4415 airfoil at a Reynolds number equal to 40,000.
This was a medium value of the experimental rotor operative
conditions, which are 5,000 < Re < 75,000. The model was
based on a structured C-type mesh generated in ANSYS
ICEM. The Fluent solver set-up was equal to that shown in
Tab.1 in order to get comparable results. Lift and drag
coefficients as well as post-processing images were
extrapolated for AoAs from 0 to 90 degrees.
The second idea was to simulate a fixed single blade of the
experimental rotor in 3D, preserving the original twist, so as
to evaluate the single contribution of the spanwise pressure
gradient, centrifugal force and Coriolis force. To do this, the
CFD 3D model was developed generating an extruded C-type
domain similar to that used for the 2D simulations. The mesh
was created in ANSYS Meshing using identical settings to
those used for the rotor. A polyhedral cell conversion was
done in Fluent thus obtaining the same grid refinement. The
polyhedral mesh in this case consisted of approximately
300,000 cells therefore resulting in 20 minutes of simulation
to reach the convergence. In Fig. 4 the computational domain
along with a detail of the mesh are shown. The Fluent solver
settings were obviously the same as that of the rotor (Tab. 1).
International Journal of Applied Engineering Research ISSN 0973-4562 Volume 12, Number 21 (2017) pp. 10491-10504
© Research India Publications. http://www.ripublication.com
10496
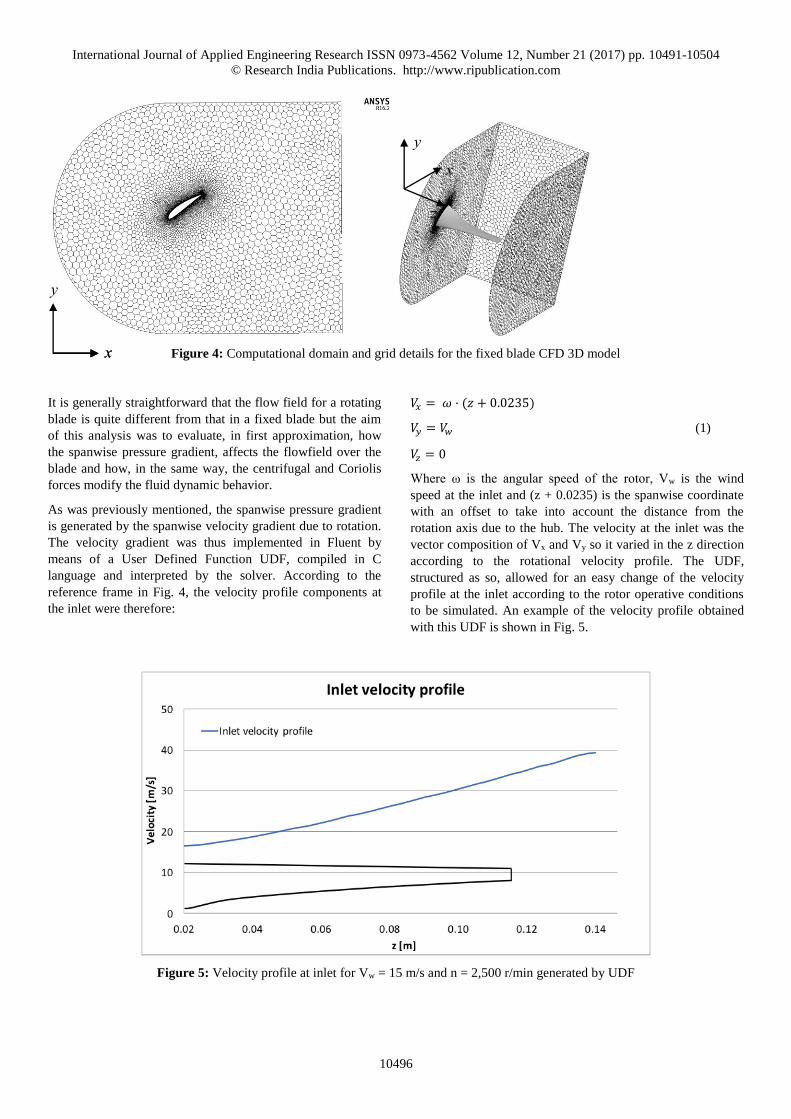
Figure 4: Computational domain and grid details for the fixed blade CFD 3D model
It is generally straightforward that the flow field for a rotating
blade is quite different from that in a fixed blade but the aim
of this analysis was to evaluate, in first approximation, how
the spanwise pressure gradient, affects the flowfield over the
blade and how, in the same way, the centrifugal and Coriolis
forces modify the fluid dynamic behavior.
As was previously mentioned, the spanwise pressure gradient
is generated by the spanwise velocity gradient due to rotation.
The velocity gradient was thus implemented in Fluent by
means of a User Defined Function UDF, compiled in C
language and interpreted by the solver. According to the
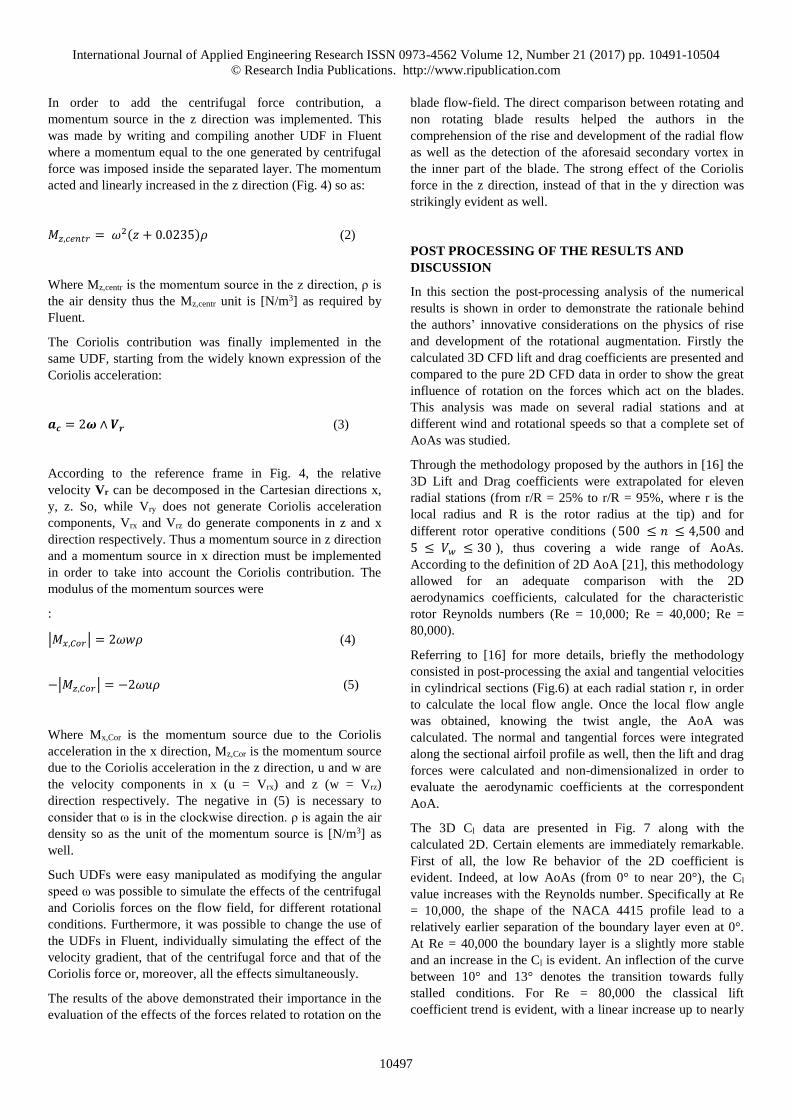
reference frame in Fig. 4, the velocity profile components at
the inlet were therefore:
𝑉𝑥 = 𝜔 · (𝑧 + 0.0235)
𝑉𝑦 = 𝑉𝑤 (1)
𝑉𝑧 = 0
Where ω is the angular speed of the rotor, Vw is the wind
speed at the inlet and (z + 0.0235) is the spanwise coordinate
with an offset to take into account the distance from the
rotation axis due to the hub. The velocity at the inlet was the
vector composition of Vx and Vy so it varied in the z direction
according to the rotational velocity profile. The UDF,
structured as so, allowed for an easy change of the velocity
profile at the inlet according to the rotor operative conditions
to be simulated. An example of the velocity profile obtained
with this UDF is shown in Fig. 5.
Figure 5: Velocity profile at inlet for Vw = 15 m/s and n = 2,500 r/min generated by UDF
x x
y
z
y
x
International Journal of Applied Engineering Research ISSN 0973-4562 Volume 12, Number 21 (2017) pp. 10491-10504
© Research India Publications. http://www.ripublication.com
10497
In order to add the centrifugal force contribution, a
momentum source in the z direction was implemented. This
was made by writing and compiling another UDF in Fluent
where a momentum equal to the one generated by centrifugal
force was imposed inside the separated layer. The momentum
acted and linearly increased in the z direction (Fig. 4) so as:
𝑀𝑧,𝑐𝑒𝑛𝑡𝑟 = 𝜔2(𝑧 + 0.0235)𝜌 (2)
Where Mz,centr is the momentum source in the z direction, ρ is
the air density thus the Mz,centr unit is [N/m3] as required by
Fluent.
The Coriolis contribution was finally implemented in the
same UDF, starting from the widely known expression of the
Coriolis acceleration:
𝒂𝒄 = 2𝝎 ∧ 𝑽𝒓 (3)
According to the reference frame in Fig. 4, the relative
velocity Vr can be decomposed in the Cartesian directions x,
y, z. So, while Vry does not generate Coriolis acceleration
components, Vrx and Vrz do generate components in z and x
direction respectively. Thus a momentum source in z direction
and a momentum source in x direction must be implemented
in order to take into account the Coriolis contribution. The
modulus of the momentum sources were
:
|𝑀𝑥,𝐶𝑜𝑟| = 2𝜔𝑤𝜌 (4)
−|𝑀𝑧,𝐶𝑜𝑟| = −2𝜔𝑢𝜌 (5)
Where Mx,Cor is the momentum source due to the Coriolis
acceleration in the x direction, Mz,Cor is the momentum source
due to the Coriolis acceleration in the z direction, u and w are
the velocity components in x (u = Vrx) and z (w = Vrz)
direction respectively. The negative in (5) is necessary to
consider that ω is in the clockwise direction. ρ is again the air
density so as the unit of the momentum source is [N/m3] as
well.
Such UDFs were easy manipulated as modifying the angular
speed ω was possible to simulate the effects of the centrifugal
and Coriolis forces on the flow field, for different rotational
conditions. Furthermore, it was possible to change the use of
the UDFs in Fluent, individually simulating the effect of the
velocity gradient, that of the centrifugal force and that of the
Coriolis force or, moreover, all the effects simultaneously.
The results of the above demonstrated their importance in the
evaluation of the effects of the forces related to rotation on the
blade flow-field. The direct comparison between rotating and
non rotating blade results helped the authors in the
comprehension of the rise and development of the radial flow
as well as the detection of the aforesaid secondary vortex in
the inner part of the blade. The strong effect of the Coriolis
force in the z direction, instead of that in the y direction was
strikingly evident as well.
POST PROCESSING OF THE RESULTS AND
DISCUSSION
In this section the post-processing analysis of the numerical
results is shown in order to demonstrate the rationale behind
the authors’ innovative considerations on the physics of rise
and development of the rotational augmentation. Firstly the
calculated 3D CFD lift and drag coefficients are presented and
compared to the pure 2D CFD data in order to show the great
influence of rotation on the forces which act on the blades.
This analysis was made on several radial stations and at
different wind and rotational speeds so that a complete set of
AoAs was studied.
Through the methodology proposed by the authors in [16] the
3D Lift and Drag coefficients were extrapolated for eleven
radial stations (from r/R = 25% to r/R = 95%, where r is the
local radius and R is the rotor radius at the tip) and for
different rotor operative conditions (500 ≤ 𝑛 ≤ 4,500 and
5 ≤ 𝑉 𝑤 ≤ 30 ), thus covering a wide range of AoAs.
According to the definition of 2D AoA [21], this methodology
allowed for an adequate comparison with the 2D
aerodynamics coefficients, calculated for the characteristic
rotor Reynolds numbers (Re = 10,000; Re = 40,000; Re =
80,000).
Referring to [16] for more details, briefly the methodology
consisted in post-processing the axial and tangential velocities
in cylindrical sections (Fig.6) at each radial station r, in order
to calculate the local flow angle. Once the local flow angle
was obtained, knowing the twist angle, the AoA was
calculated. The normal and tangential forces were integrated
along the sectional airfoil profile as well, then the lift and drag
forces were calculated and non-dimensionalized in order to
evaluate the aerodynamic coefficients at the correspondent
AoA.
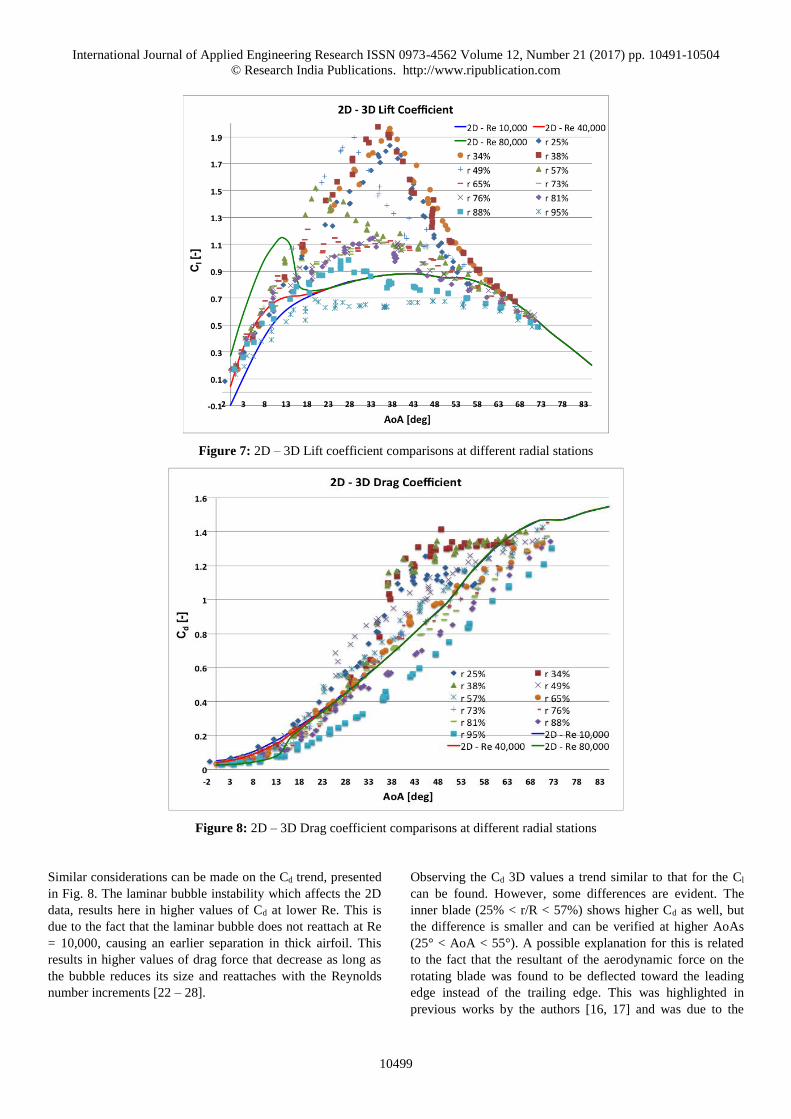
The 3D Cl data are presented in Fig. 7 along with the
calculated 2D. Certain elements are immediately remarkable.
First of all, the low Re behavior of the 2D coefficient is
evident. Indeed, at low AoAs (from 0° to near 20°), the Cl
value increases with the Reynolds number. Specifically at Re
= 10,000, the shape of the NACA 4415 profile lead to a
relatively earlier separation of the boundary layer even at 0°.
At Re = 40,000 the boundary layer is a slightly more stable
and an increase in the Cl is evident. An inflection of the curve
between 10° and 13° denotes the transition towards fully
stalled conditions. For Re = 80,000 the classical lift
coefficient trend is evident, with a linear increase up to nearly
International Journal of Applied Engineering Research ISSN 0973-4562 Volume 12, Number 21 (2017) pp. 10491-10504
© Research India Publications. http://www.ripublication.com
10498
12° and a drop which represents the transition to fully stalled
conditions. This behavior is typical for thick airfoils operating
at very low Re conditions due to laminar separation bubble
instability [22 - 28].
Figure 6: Example of cylindrical sections for AoAs and Aerodynamic coefficient calculations
The investigation of the 3D Cl trend was of utmost interest. As
can be seen in Fig. 7 the 3D data clearly follow those 2D at
low and high AoAs, that is from 0° to near 10° and over 60°.
This indicates that the 3D effects are not influencing the flow-
field so much. Over 10°, the 3D effects become predominant
with maximum Cl values between 30° and 40° in the inner
blade region (25% < r/R < 57%). Furthermore, the peaks
move towards lower AoAs as the radial position increases.
For example, at r/R 34% the peak is Clmax = 1.94 at AoA =
37.2°, at r/R = 49% Clmax = 1.82 at AoA = 29° and at r/R =
57% Clmax = 1.52 at AoA = 19.9°. At higher radial positions,
the tip effects gradually reduce the rotational augmentation as
can be evidenced by the Cl trends for r/R > 57%. However the
data show a well defined trend that clearly indicates three
areas of influence: the inner blade, up to r/R 57%, where the
rotational augmentation reaches the maximum effects; the
medium blade, 57% < r/R < 90%, where the rotational
augmentation gradually decreases with quite similar trends at
65% < r/R < 88%; the tip region, r/R > 90% where the widely
known tip effects become predominant and the lift forces fall
below the 2D values at r/R 95%. The flow-field, relating to all
these conditions, is analyzed in the part II of this work by
using post-processing images in order to demonstrate the
complexity of the 3D phenomena related to rotating wings.
International Journal of Applied Engineering Research ISSN 0973-4562 Volume 12, Number 21 (2017) pp. 10491-10504
© Research India Publications. http://www.ripublication.com
10499
Figure 7: 2D – 3D Lift coefficient comparisons at different radial stations
Figure 8: 2D – 3D Drag coefficient comparisons at different radial stations
Similar considerations can be made on the Cd trend, presented
in Fig. 8. The laminar bubble instability which affects the 2D
data, results here in higher values of Cd at lower Re. This is
due to the fact that the laminar bubble does not reattach at Re
= 10,000, causing an earlier separation in thick airfoil. This
results in higher values of drag force that decrease as long as
the bubble reduces its size and reattaches with the Reynolds
number increments [22 – 28].
Observing the Cd 3D values a trend similar to that for the Cl
can be found. However, some differences are evident. The
inner blade (25% < r/R < 57%) shows higher Cd as well, but
the difference is smaller and can be verified at higher AoAs
(25° < AoA < 55°). A possible explanation for this is related
to the fact that the resultant of the aerodynamic force on the
rotating blade was found to be deflected toward the leading
edge instead of the trailing edge. This was highlighted in
previous works by the authors [16, 17] and was due to the
International Journal of Applied Engineering Research ISSN 0973-4562 Volume 12, Number 21 (2017) pp. 10491-10504
© Research India Publications. http://www.ripublication.com
10500
noticeable depressurization, generated by rotation, near the
leading edge.
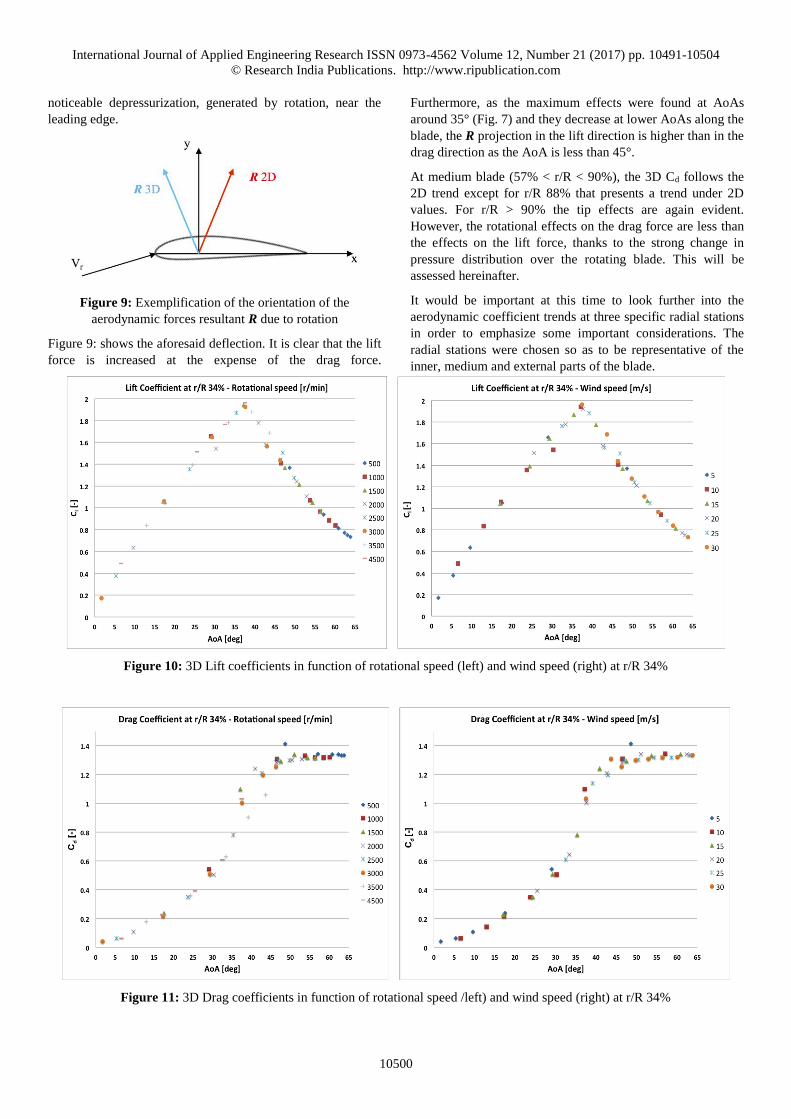
Figure 9: Exemplification of the orientation of the
aerodynamic forces resultant R due to rotation
Figure 9: shows the aforesaid deflection. It is clear that the lift
force is increased at the expense of the drag force.
Furthermore, as the maximum effects were found at AoAs
around 35° (Fig. 7) and they decrease at lower AoAs along the
blade, the R projection in the lift direction is higher than in the
drag direction as the AoA is less than 45°.
At medium blade (57% < r/R < 90%), the 3D Cd follows the
2D trend except for r/R 88% that presents a trend under 2D
values. For r/R > 90% the tip effects are again evident.
However, the rotational effects on the drag force are less than
the effects on the lift force, thanks to the strong change in
pressure distribution over the rotating blade. This will be
assessed hereinafter.
It would be important at this time to look further into the
aerodynamic coefficient trends at three specific radial stations
in order to emphasize some important considerations. The
radial stations were chosen so as to be representative of the
inner, medium and external parts of the blade.
Figure 10: 3D Lift coefficients in function of rotational speed (left) and wind speed (right) at r/R 34%
Figure 11: 3D Drag coefficients in function of rotational speed /left) and wind speed (right) at r/R 34%
International Journal of Applied Engineering Research ISSN 0973-4562 Volume 12, Number 21 (2017) pp. 10491-10504
© Research India Publications. http://www.ripublication.com
10501
In Fig. 10 and 11 the lift and drag coefficients were plotted
depending on the rotational and wind speeds at the inner blade
(r/R 34%). What is quite remarkable is that the data are
compact and follow a precise trend that does not depend on
rotational and wind speed, or on the Reynolds number like in
the 2D case either. Indeed, the Reynolds number was variable
between approximately 10,000 and 70,000. For example, the
peak is reached at AoA = 37° for a combination of n = 1,500,
Vw = 10 m/s; n = 3,000, Vw = 20m/s; n = 4,500, Vw = 30 m/s.
This was an unexpected result because it is widely known
from literature that the centrifugal and Coriolis forces are
mainly responsible for the rotational augmentation. Thus, one
expects that the higher the velocities are, the higher the
augmentation effects will be. Specifically, as the centrifugal
force increases with ω2, higher rotational speed should lead to
higher radial effects. The charts in Fig. 10 and 11 demostrate
that this assumption is incorrect. This led the authors to
further analyze the flow-field around the blade in order to
verify the idea that it is a particular combination of forces,
pressure distribution and AoA that trigger the same rotational
augmentation. The simple supposition of a radial flow along
the suction side of the blade is not sufficient to explain the
charts in Fig. 10 and 11.
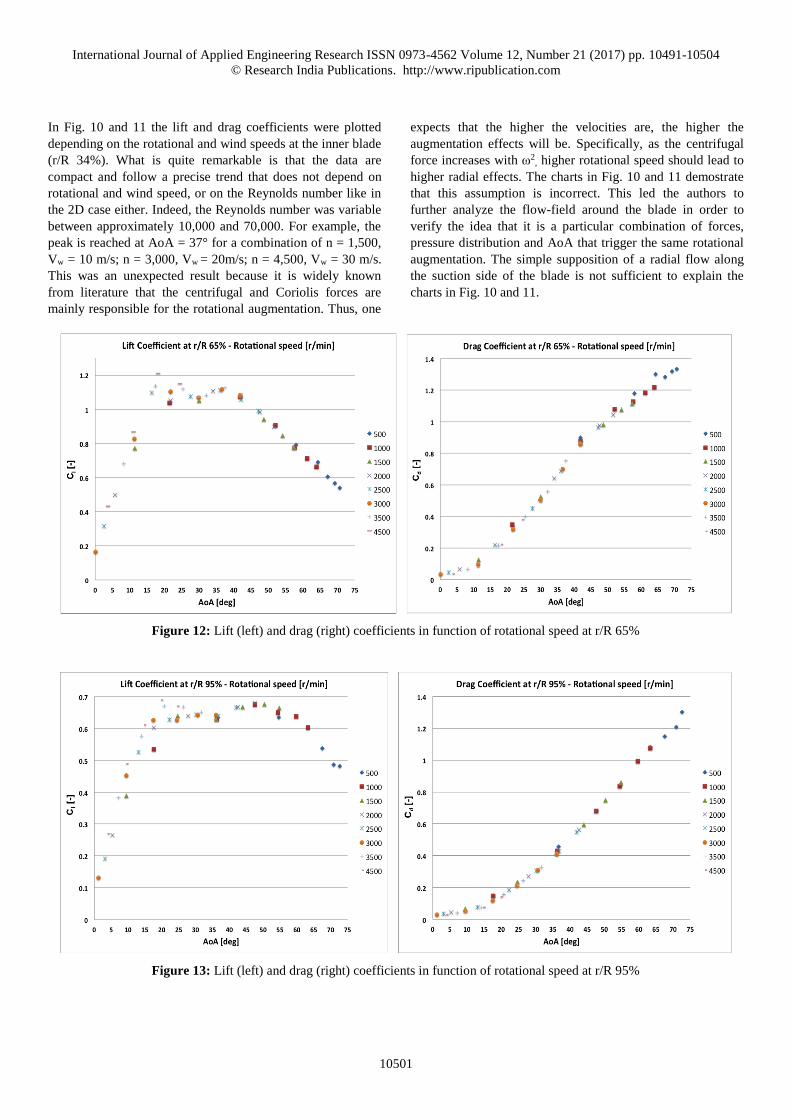
Figure 12: Lift (left) and drag (right) coefficients in function of rotational speed at r/R 65%
Figure 13: Lift (left) and drag (right) coefficients in function of rotational speed at r/R 95%
International Journal of Applied Engineering Research ISSN 0973-4562 Volume 12, Number 21 (2017) pp. 10491-10504
© Research India Publications. http://www.ripublication.com
10502
Similar considerations can be made regarding Fig. 12 and 13,
which are related to the 3D lift and drag coefficients at r/R
65% and r/R 95% respectively. As there are no differences in
plotting the data based on wind or rotational speed (Fig. 10,
11), for briefness, only the charts based on rotational speed
are presented. Even in these cases, the trend is clearly
independent from speed and thus from Reynolds number. The
values mainly depend on the AoA, thus confirming the
assumptions made for r/R 34%. In conclusion, due to the
rotational effects, the non-dimensional forces along the entire
blade were not directly dependent on rotational and wind
speeds but, instead, depend on a specific flow-field condition
generated by AoA and rotation.
CONCLUSIONS
The rotational augmentation is an extremely important
phenomenon that must be taken into account in the design and
optimization of HAWT. Based on the state of the art,
reviewed in the first section of this work, it is quite evident
that the rotation effects strongly modify the flow-field and the
loads acting on the blades. Specifically, all the authors agree
that the major effects occur in the inner part of the blade and
are generated by the combined action of the centrifugal force,
Coriolis force and spanwise pressure gradient. However, there
is no consensus on the physical mechanism that triggers the
centrifugal pumping in the suction side of the blade,
drastically increasing the aerodynamic forces as well. Many
authors tried to find a simplified model for the rotational
augmentation mainly in order to improve the reliability and
accuracy of the 1D design codes. The proposed empirical
corrections, although obtained from accurate solutions of the
boundary layer equations, gave good results but for a limited
operative condition range or for a specific type of rotor. The
authors themselves recognize that these corrections were not
sufficiently reliable so as to be applicable in every condition.
The present paper starts from the aforementioned basic idea
and attempts to provide an improved physical explanation of
the onset and development of the rotational augmentation. In
order to deeply analyze the phenomenon, an accurate CFD 3D
model was developed in ANSYS Fluent which was then
validated by using experimental data of the NREL PHASE VI
HAWT and an experimental micro rotor which was designed,
built and tested at the University of Catania. Specifically, the
micro rotor was extensively simulated due to the increasing
interest in the low Reynolds number machines. A very wide
range of rotor operative conditions were analyzed thus
obtaining a full set of lift and drag coefficients and AoAs at
numerous radial stations. In order to make a direct
comparison, a 2D CFD model for the NACA 4415 airfoil was
developed as well. The analysis of the aerodynamic
coefficient trends confirmed the strong increment of the forces
in the inner part of the blade due to the rotational
augmentation. Moreover, the maximum effects were found at
an AoA of approximately 37° where the 3D lift coefficient is
more than twice the 2D. In attached and fully separated flow
conditions instead, the aerodynamic coefficient trends were in
close proximity to the 2D, thus indicating that the rotational
effects were not of the utmost importance. Because in the
literature, the centrifugal flow and the consequent Coriolis
force are supposed to be mainly responsible for the rotational
augmentation, one would expect that the higher the rotational
speed is, the higher the augmentation will be. The sectional
lift coefficient trend presented in this paper, showed instead
that the 3D lift and drag coefficients were not dependent on
the rotational speed as the trends, for a specific section, are
well defined. This led the authors to hypothesize that it is only
the AoA and the precise force imbalance related to it, that are
mainly responsible for the rotational augmentation.
In order to further investigate the phenomenon and confirm
this supposition, the authors developed a 3D CFD model of a
fixed blade with the same geometrical features of those found
in the rotor. In this model, through the use of UDFs, the effect
of the spanwise pressure gradient and momentum equal to that
generated by rotation were simulated separately. In this way
the significance of the single contributions was investigated.
The highly interesting results are shown in the second part of
this work along with the complete post-processing analysis
results.
NOMENCLATURE
CFD Computational Fluid Dynamics
BEM Blade Element Momentum
RANS Reynolds Averaged Navier Stokes
PIV Particle Imaging Velocimetry
MRF Moving Reference Frame
AoA Angle of Attack
HAWT Horizontal Axis Wind Turbine
UDF User Defined Function
R Resultant of the Aerodynaic forces
Tu Turbulent Intensity [ % ]
TVR Turbulent Viscosity Ratio [ - ]
Re Reynolds Number[ - ]
c Cord [ m ]
ρ Air density [ kg/m3 ]
n Rotational speed[ r/min ]
International Journal of Applied Engineering Research ISSN 0973-4562 Volume 12, Number 21 (2017) pp. 10491-10504
© Research India Publications. http://www.ripublication.com
10503
ω Angular speed [ rad/s ]
r Local radius [ - ]
λ Tip speed ratio [ - ]
Vw Wind Speed [ m/s ]
Cl Lift coefficient [ - ]
Cd Drag coefficient [ - ]
Cp Coefficient of Performance [-]
y+ Non dimensional distance from wall [ - ]
R Rotor radius [ m ]
D Rotor diameter [ m ]
Vx, Vy, Vz Velocity components at inlet boundary [ m/s ]
Mz, centr Z Momentum due to centrifugal force [ N/m3]
Mz, cor Z Momentum due to Coriolis force [ N/m3 ]
Mx, cor X momentum due to Coriolis force [ N/m3]
Vr Blade relative velocity [ m/s ]
Vrx, Vry, Vrz Blade relative velocity components [ m/s ]
u, w Fluent local velocity components [ m/s ]
ac Coriolis acceleration [ m/s2 ]
REFERENCES
[1] Du Z., Selig M. S. The effect of rotation on the boundary layer of a wind turbine blade - Renewable
Energy (20) 2000 p. 167–181
[2] Lanzafame R., Mauro S., Messina M. Evaluation of the Radial Flow Effects on Micro HAWTs through the Use of a Transition CFD 3D Model – part I: State of the Art and Numerical Model Review - Energy Procedia
82(C):156 - 163 · December 2015 - DOI:
10.1016/j.egypro.2015.12.011
[3] Snel H., Van Holten Th. Review of recent aerodynamic research on wind turbines with relevance to rotorcraft, data and riddles on dynamic inflow, flowfield of yawed rotors and rotating 3-D stall - Proceedings of the 20th
European rotorcraft forum. Amsterdam; October 4-7,
1994
[4] C. Lindenburg Modelling of rotational augmentation based on engineering considerations and measurements -ECN-RX--04-131 EWEC, London
2004
[5] D. Hu, O. Hua, Z. Hu A study on stall-delay for horizontal axis wind turbine - Renewable Energy 31
(2006) 821–836 doi:10.1016/j.renene.2005.05.002
[6] C. Lindenburg Investigation into Rotor Blade Aerodynamics: Analysis of the stationary measurements on the UAE phase-VI rotor in the NASA-Ames wind tunnel - ECN-C--03-025
[7] I. Herraez, B. Stoevesandt, J. Peinke Insight into Rotational Effects on a Wind Turbine Blade Using Navier–Stokes Computations - Energies 2014, 7, 6798-
6822; doi:10.3390/en7106798
[8] W. G. Früh and A. C. W. Creech A criterion for rotational augmentation based on a boundary-layer analysis - Renewable Energy and Power Quality
Journal (RE&PQJ) ISSN 2172-038X, No.13, April
2015
[9] S. P. Breton, F. N. Coton, G. Moe A study on rotational effects and different stall delay models using a prescribed wake vortex scheme and NREL phase VI experiment data - Wind Energy Volume 11, Issue 5
September/October 2008 Pages 459–482 DOI:
10.1002/we.269
[10] Karimipanah M.T., Olsson E. Calculation of three-dimensional boundary layers on rotor blades using integral methods - Journal Turbomachinery 1993 -
115(2) p. 342-53.
[11] S. Schreck, M. Robinson Rotational Augmentation of Horizontal Axis Wind Turbine Blade Aerodynamic Response - Wind Energy 2002; 5:133–150 DOI:
10.1002/we.68
[12] J. Johansen, N. N. Sørensen Aerofoil Characteristics from 3D CFD Rotor Computations - Wind Energy
2004; 7:283–294 DOI: 10.1002/we.127
[13] C. E. Carangiu, J. N. Sørensen, F. Cambuli, N. Mandas
CFD–RANS analysis of the rotational effects on the boundary layer of wind turbine blades - Journal of
Physics: Conference Series 75 (2007)
doi:10.1088/1742-6596/75/1/012031
[14] I. Herráez, B. Stoevesandt, J. Peinke Insight into Rotational Effects on a Wind Turbine Blade Using Navier–Stokes Computations - Energies 2014, 7, 6798-
6822; doi:10.3390/en7106798
[15] Y. Song, J. B. Perot CFD Simulation of the NREL Phase VI Rotor - Wind Engineering June 2015 vol. 39
no. 3 299-309 Doi: 10.1260/0309-524X.39.3.299
[16] R. Lanzafame, S. Mauro, M. Messina Evaluation of the radial flow effects on micro HAWTs through the use of a transition CFD 3D model - Part II: Postprocessing and comparison of the results - Energy Procedia
82(C):164 - 171 December 2015 DOI:
10.1016/j.egypro.2015.12.013
[17] R. Lanzafame, S. Mauro, M. Messina Numerical and experimental analysis of micro HAWTs designed for wind tunnel applications - International Journal of
International Journal of Applied Engineering Research ISSN 0973-4562 Volume 12, Number 21 (2017) pp. 10491-10504
© Research India Publications. http://www.ripublication.com
10504
Energy and Environmental Engineering DOI
10.1007/s40095-016-0202-8
[18] R. Lanzafame, S. Mauro, M. Messina Wind turbine CFD modeling using a correlation-based transitional model - Renewable Energy 52 (2013) 31-39. Elsevier.
http://dx.doi.org/10.1016/j.renene.2012.10.007
[19] Langtry R.B., Menter F.R., Likki S.R., Suzen Y.B.,
Huang P.G., Völker S. A correlation based transition model using local variables part I: model formulation -
ASME J. of Turbomachinery 128(3), 413-422 (Mar 01,
2004) doi:10.1115/1.2184352
[20] Langtry R.B., Menter F.R., Likki S.R., Suzen Y.B.,
Huang P.G., Völker S. A correlation based transition model using local variables part II: test cases and industrial applications. ASME J. of Turbomachinery
128(3), 423-434 (Mar 01, 2004)
doi:10.1115/1.2184353
[21] J. D. Anderson Fundamentals of Aerodynamics
McGraw Hill 3rd edition ISBN 0-07-237335-0
[22] Md. Mahbub Alam, Y. Zhou, H. X. Yang, H. Guo, J.
Mi The ultra-low Reynolds number airfoil wake Exp.
Fluids (2010) 48:81–103 Springer DOI
10.1007/s00348-009-0713-7
[23] S. Wang, Y. Zhou, Md. Mahbub Alam, H. Yang
Turbulent intensity and Reynolds number effects on an airfoil at low Reynolds numbers Physics of Fluids
(1994-present) 26 , 115107 (2014); doi:
10.1063/1.4901969
[24] W. Chen, L. P. Bernal Design and Performance of Low Reynolds Number Airfoils for Solar-Powered Flight 46th AIAA Aerospace Sciences Meeting and Exhibit
http://dx.doi.org/10.2514/6.2008-316
[25] A. Dovgal, V. V. Kozlov, A. Michalke Laminar boundary layer separation: Instability and associated phenomena Progress in Aerospace Sciences 30(1):61-
94 · January 1994 DOI: 10.1016/0376-0421(94)90003-
5
[26] S. Sunada, A. Sakaguchi, K. Kawachi Airfoil Section Characteristics at a Low Reynolds Number Journal of
Fluids Engineering 119(1) · March 1997 DOI:
10.1115/1.2819098
[27] P. J. Kuntz Aerodynamics and Design for ultra-low Reynolds number flight Ph.D. Thesis Stanford
University (2003) Publication Number: AAI3104263;
ISBN: 9780496518319
[28] D. F. Kurtulus On the wake pattern of symmetric airfoils for different incidence angles at Re = 1000 International Journal of Micro Air Vehicles 8(2):109-
139 · June 2016 DOI: 10.1177/1756829316653700