Embed Size (px)
Citation preview

October 22, 2013
An Insiders Look at M&A

Overview
• Health Care Industry Trends
• Health Care M&A
• Strategic Alternatives

Health Care Industry Trends

3
Healthcare Providers
PPACA
Consumerism
Physician Shortages
Increased Payor
Leverage
Risk Assumption & Population Management
Limited Access to Capital
Competitor Consolidation
Value Based Purchasing of
Care
Health Care Industry Trends Pressure on Providers
Increased M&A Activity
4
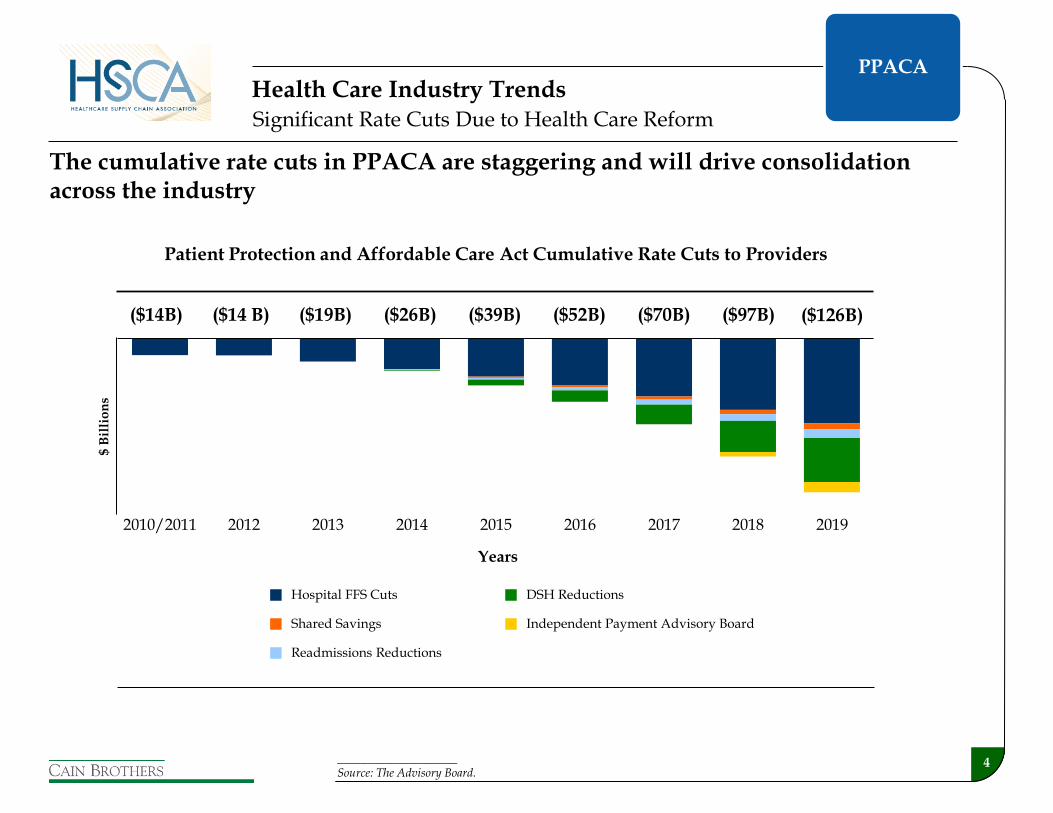
Patient Protection and Affordable Care Act Cumulative Rate Cuts to Providers
($14B) ($26B) ($39B) ($52B) ($70B) ($97B) ($126B) ($14 B) ($19B)
2010/2011 2012 2013 2014 2015 2016 2017 2018 2019
____________________ Source: The Advisory Board.
$ B
illi
on
s
Years
Hospital FFS Cuts
Shared Savings
Readmissions Reductions
DSH Reductions
Independent Payment Advisory Board
The cumulative rate cuts in PPACA are staggering and will drive consolidation across the industry
Significant Rate Cuts Due to Health Care Reform
Health Care Industry Trends PPACA
5
0%
5%
10%
15%
20%
25%
$0
$1,000
$2,000
$3,000
$4,000
$5,000
196
0
1964
196
8
1972
197
6
1980
198
4
198
8
199
2
199
6
200
0
200
4
200
8
201
2P
201
6P
202
0P
% o
f GD
P
$ B
illi
on
s
Expenditures ($ in billions) Expenditures as % of GDP
$0
$2,000
$4,000
$6,000
$8,000
$10,000
$12,000
$14,000
$16,000
196
0
196
4
1968
197
2
197
6
198
0
198
4
1988
199
2
199
6
200
0
200
4
200
8
2012
P
201
6P
202
0P
Per Capita Expenditures
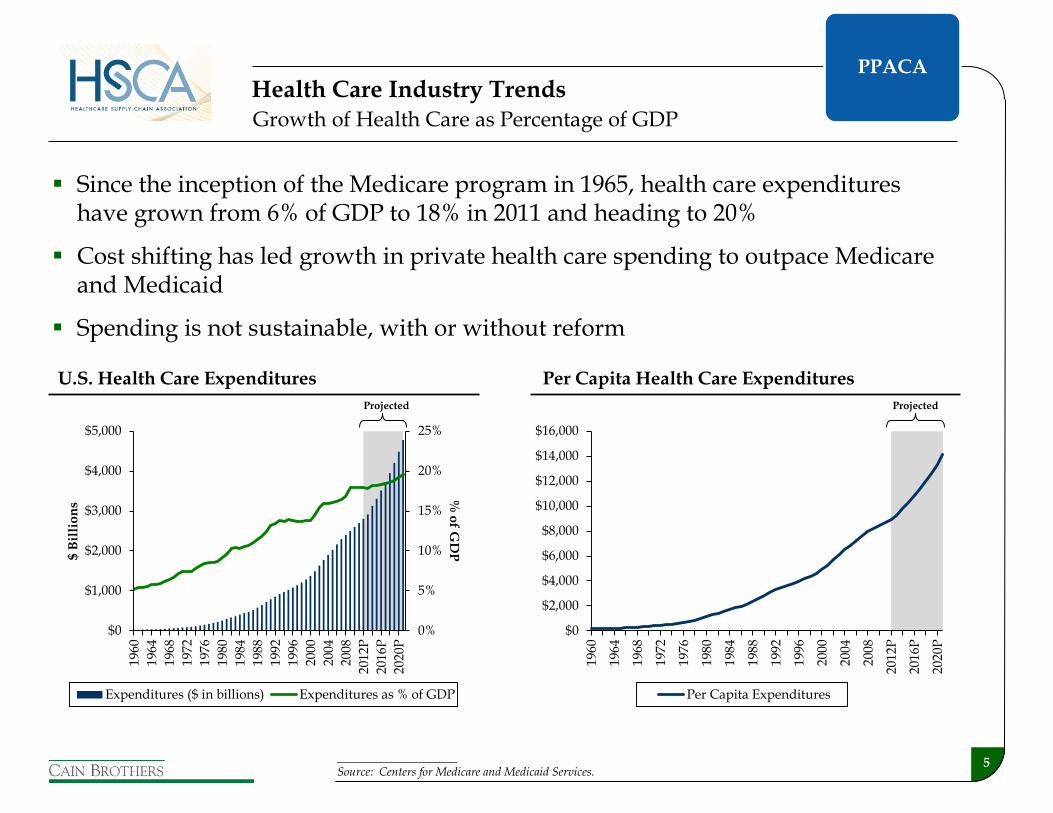
Since the inception of the Medicare program in 1965, health care expenditures have grown from 6% of GDP to 18% in 2011 and heading to 20%
Cost shifting has led growth in private health care spending to outpace Medicare and Medicaid
Spending is not sustainable, with or without reform
____________________ Source: Centers for Medicare and Medicaid Services.
Projected Projected
Growth of Health Care as Percentage of GDP
Health Care Industry Trends
U.S. Health Care Expenditures Per Capita Health Care Expenditures
PPACA
6
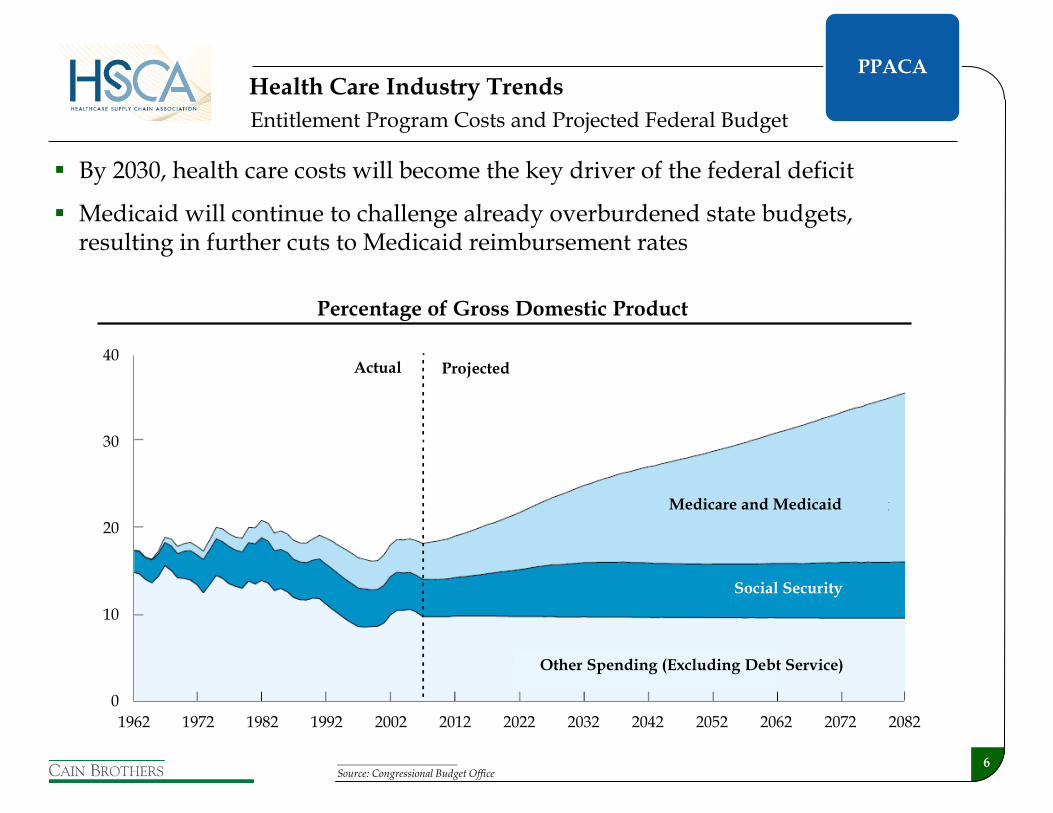
Entitlement Program Costs and Projected Federal Budget
By 2030, health care costs will become the key driver of the federal deficit
Medicaid will continue to challenge already overburdened state budgets, resulting in further cuts to Medicaid reimbursement rates
Health Care Industry Trends
____________________ Source: Congressional Budget Office
0
10
20
30
40
1962 1972 1982 1992 2002 2012 2022 2032 2042 2052 2062 2072 2082
Other Spending (Excluding Debt Service)
Projected Actual
Percentage of Gross Domestic Product
Medicare and Medicaid
Social Security
PPACA
7
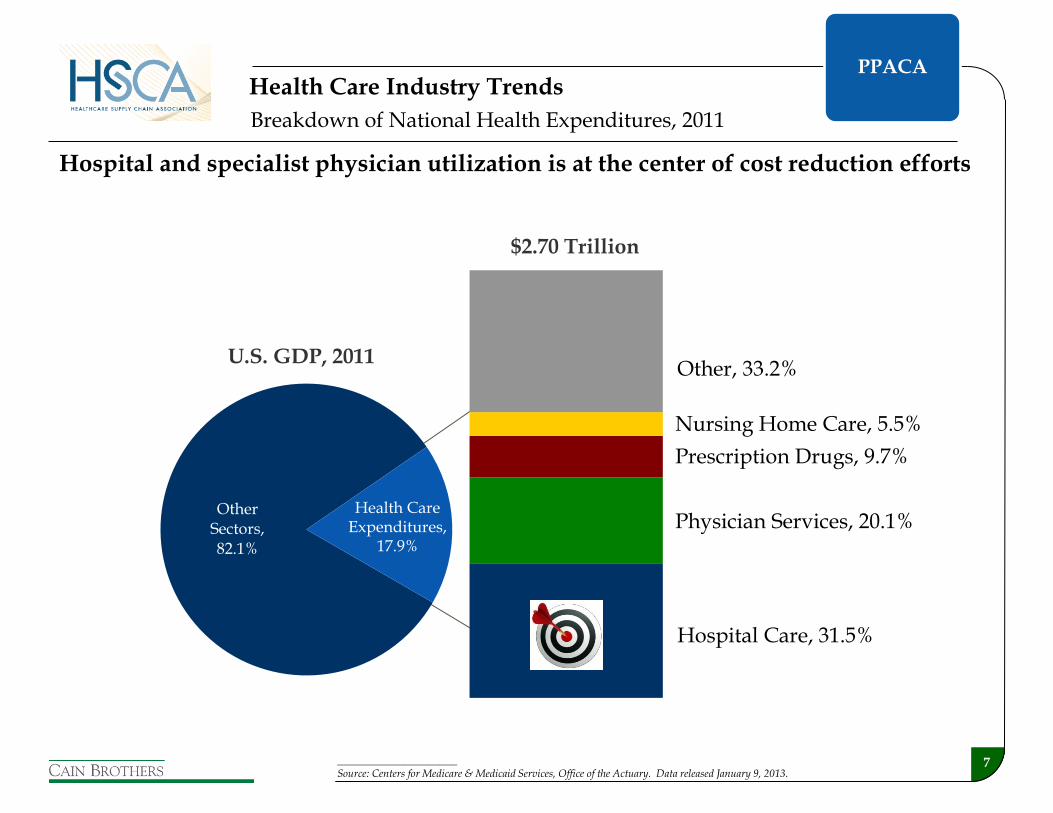
Health Care
Expenditure
s, 17.9%
$2.70 Trillion
Nursing Home Care, 5.5%
Physician Services, 20.1%
Other, 33.2%
Prescription Drugs, 9.7%
Hospital Care, 31.5%
Other Sectors, 82.1%
U.S. GDP, 2011
Health Care Expenditures,
17.9%
Breakdown of National Health Expenditures, 2011
____________________ Source: Centers for Medicare & Medicaid Services, Office of the Actuary. Data released January 9, 2013.
Hospital and specialist physician utilization is at the center of cost reduction efforts
Health Care Industry Trends PPACA

8
Health Care Industry Trends Consumerism
8
Traditional fee-for-service insured and
managed care
Consumerism
9 ____________________ Source: Kaiser/HRET Survey of Employer-Sponsored Health Benefits
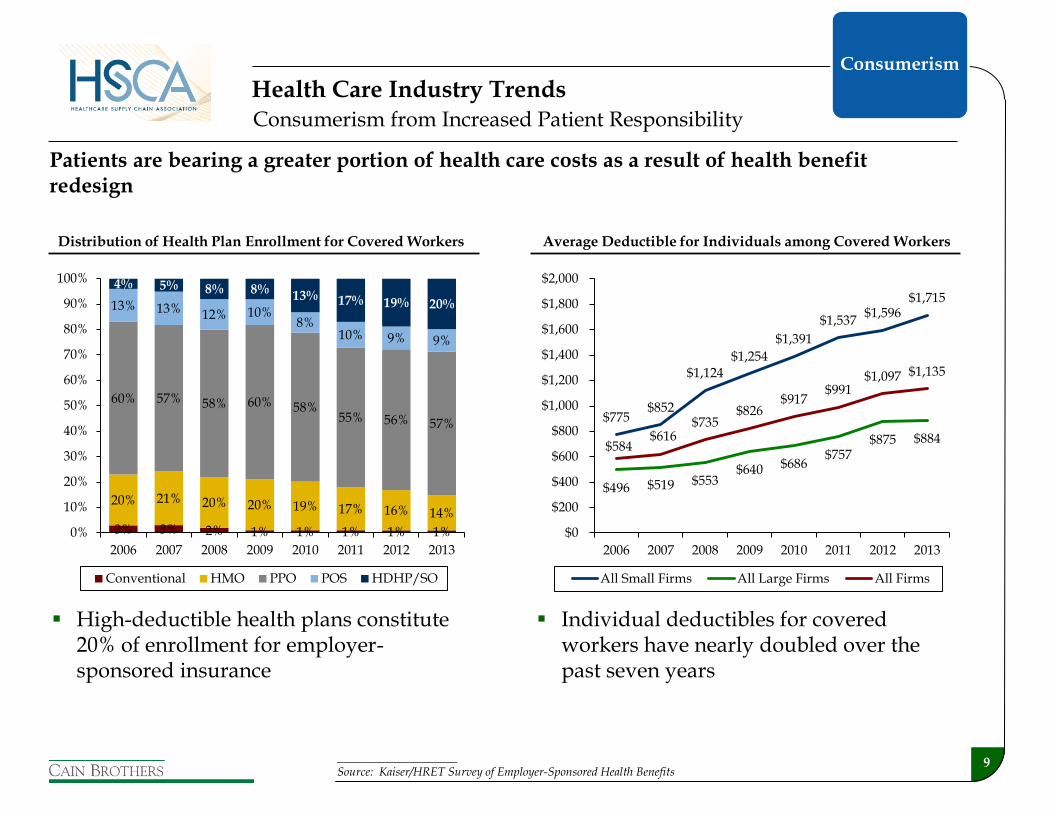
Consumerism from Increased Patient Responsibility
Health Care Industry Trends
Distribution of Health Plan Enrollment for Covered Workers Average Deductible for Individuals among Covered Workers
3% 3% 2% 1% 1% 1% 1% 1%
20% 21% 20% 20% 19% 17% 16% 14%
60% 57% 58% 60% 58%55% 56% 57%
13% 13% 12% 10%8%
10% 9% 9%
4% 5% 8% 8% 13% 17% 19% 20%
0%
10%
20%
30%
40%
50%
60%
70%
80%
90%
100%
2006 2007 2008 2009 2010 2011 2012 2013
Conventional HMO PPO POS HDHP/SO
$775 $852
$1,124 $1,254
$1,391
$1,537 $1,596
$1,715
$496 $519 $553 $640 $686
$757 $875 $884
$584 $616
$735 $826
$917 $991
$1,097 $1,135
$0
$200
$400
$600
$800
$1,000
$1,200
$1,400
$1,600
$1,800
$2,000
2006 2007 2008 2009 2010 2011 2012 2013
All Small Firms All Large Firms All Firms
High-deductible health plans constitute 20% of enrollment for employer-sponsored insurance
Individual deductibles for covered workers have nearly doubled over the past seven years
Patients are bearing a greater portion of health care costs as a result of health benefit redesign
Consumerism

10
Year-over-Year Same-Store Adjusted Admissions Trends for Publicly Traded Hospital Management Companies
2.6% 3.0%
2.3%
1.1% 1.5%
0.0%
0.6%
1.4%
(0.3%)
1.0%
0.5%
1.9%
0.4%
(0.2%)
1.9%
(3.2%)
(0.8%)
(4.0%)
(3.0%)
(2.0%)
(1.0%)
0.0%
1.0%
2.0%
3.0%
4.0%
Q2 Q3 Q4 Q1 Q2 Q3 Q4 Q1 Q2 Q3 Q4 Q1 Q2 Q3 Q4 Q1 Q2
2009 2010 2011 2012 2013
____________________ Source: UBS – “Q2 Recap, Expectations Low for 2H” – August 23, 2013. Results are based upon an average for the seven publicly traded hospital management companies.
Patient volumes are down, driven by many factors, including the economy, technology, beginnings of PPACA implementation and shift toward higher deductible health plans
Flat to Declining Patient Volumes
Health Care Industry Trends Consumerism
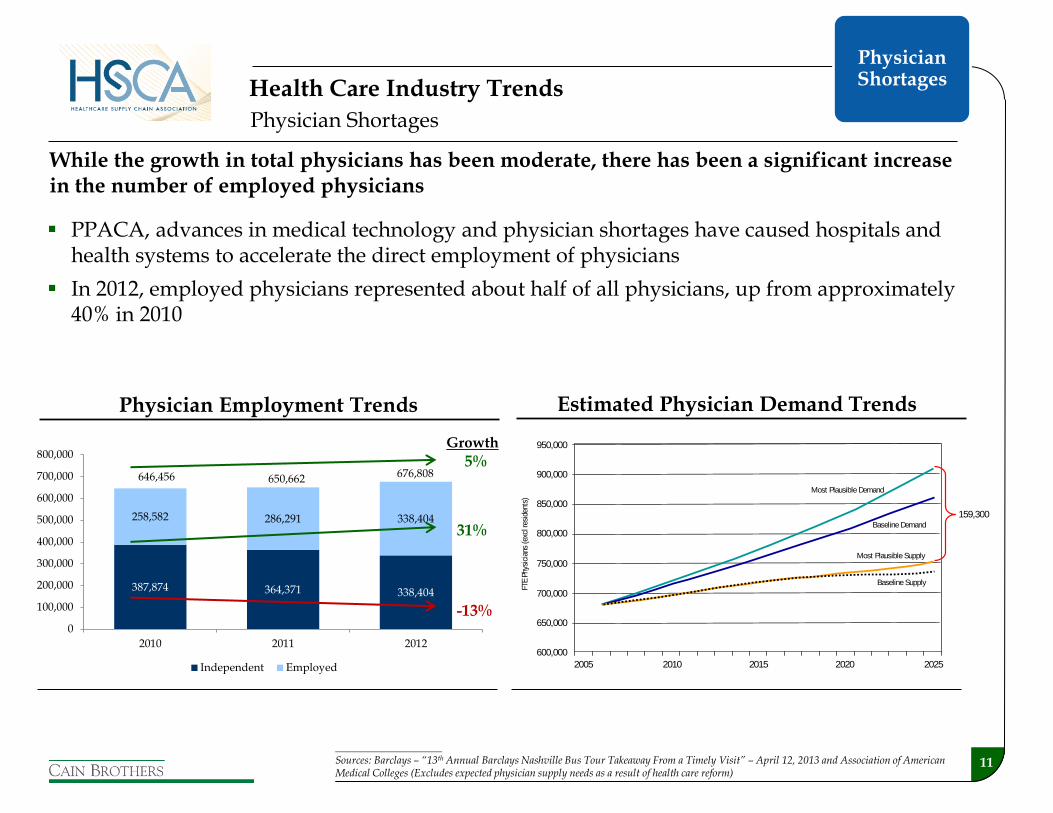
11 ____________________ Sources: Barclays – “13th Annual Barclays Nashville Bus Tour Takeaway From a Timely Visit” – April 12, 2013 and Association of American Medical Colleges (Excludes expected physician supply needs as a result of health care reform)
Physician Employment Trends
While the growth in total physicians has been moderate, there has been a significant increase in the number of employed physicians
PPACA, advances in medical technology and physician shortages have caused hospitals and health systems to accelerate the direct employment of physicians
In 2012, employed physicians represented about half of all physicians, up from approximately 40% in 2010
387,874 364,371 338,404
258,582 286,291 338,404
0
100,000
200,000
300,000
400,000
500,000
600,000
700,000
800,000
2010 2011 2012
Independent Employed
646,456 650,662 676,8085%
31%
-13%
Growth
Physician Shortages
950,000
900,000
850,000
800,000
750,000
700,000
650,000
600,000
FTE
Phy
sici
ans
(exc
l res
iden
ts)
2005 2010 2015 2020 2025
159,300
Baseline Supply
Most Plausible Supply
Baseline Demand
Most Plausible Demand
Estimated Physician Demand Trends
Health Care Industry Trends
Physician Shortages
12
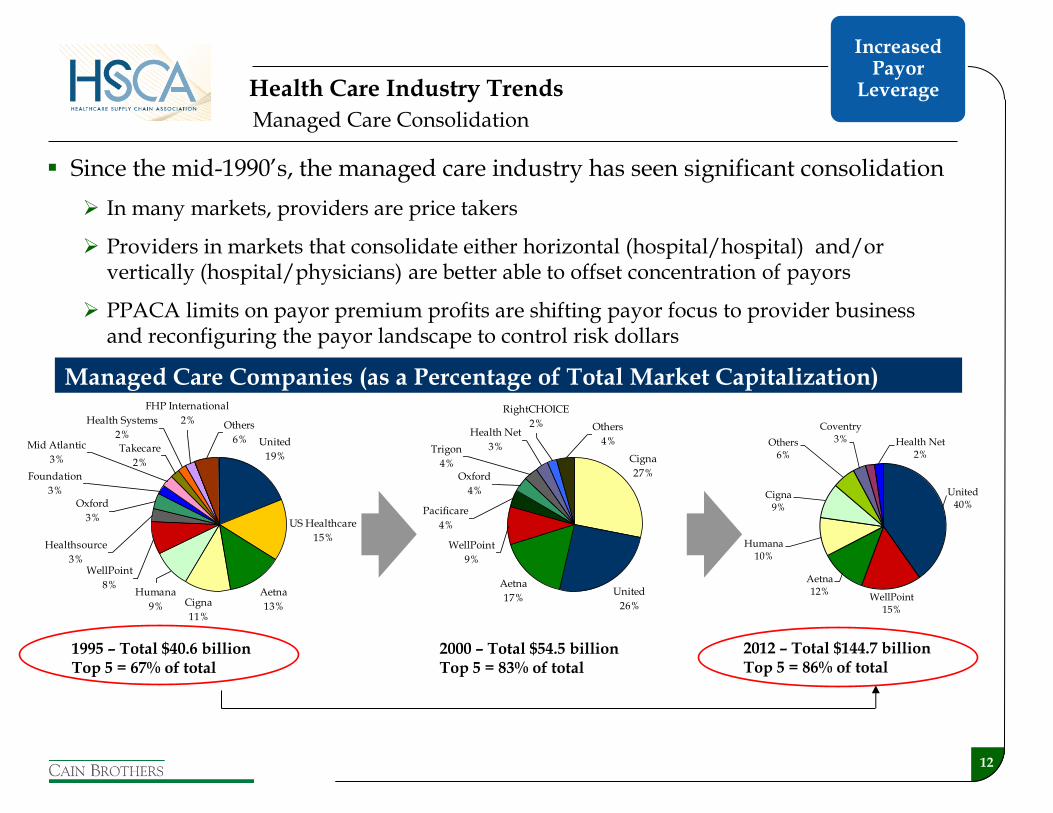
Since the mid-1990’s, the managed care industry has seen significant consolidation
In many markets, providers are price takers
Providers in markets that consolidate either horizontal (hospital/hospital) and/or vertically (hospital/physicians) are better able to offset concentration of payors
PPACA limits on payor premium profits are shifting payor focus to provider business and reconfiguring the payor landscape to control risk dollars
Managed Care Consolidation
Managed Care Companies (as a Percentage of Total Market Capitalization)
United
19%
US Healthcare
15%
Aetna
13%Cigna
11%
Takecare
2%
Health Systems
2%
FHP International
2% Others
6%
Foundation
3%
Mid Atlantic
3%
Oxford
3%
Healthsource
3%WellPoint
8%Humana
9%
1995 – Total $40.6 billion Top 5 = 67% of total
Cigna
27%
Aetna
17%
WellPoint
9%
Oxford
4%
Health Net
3%
RightCHOICE
2% Others
4%Trigon
4%
Pacificare
4%
United
26%
2000 – Total $54.5 billion Top 5 = 83% of total
2012 – Total $144.7 billion Top 5 = 86% of total
United40%
WellPoint15%
Aetna12%
Humana10%
Cigna9%
Others6%
Coventry3% Health Net
2%
Health Care Industry Trends
Increased Payor
Leverage
13
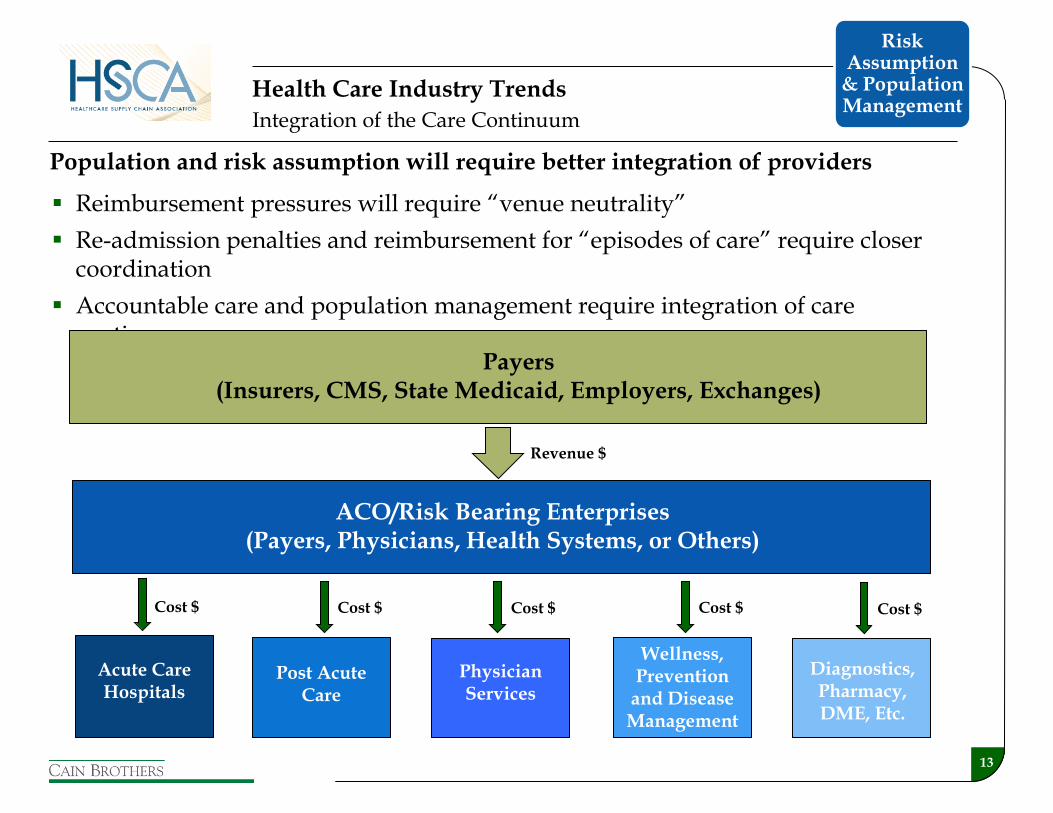
Population and risk assumption will require better integration of providers
Reimbursement pressures will require “venue neutrality”
Re-admission penalties and reimbursement for “episodes of care” require closer coordination
Accountable care and population management require integration of care continuum
Integration of the Care Continuum
Acute Care Hospitals
Post Acute Care
Physician Services
Wellness, Prevention
and Disease Management
Diagnostics, Pharmacy, DME, Etc.
ACO/Risk Bearing Enterprises (Payers, Physicians, Health Systems, or Others)
Payers (Insurers, CMS, State Medicaid, Employers, Exchanges)
Revenue $
Cost $ Cost $ Cost $ Cost $ Cost $
Health Care Industry Trends
Risk Assumption
& Population Management

14
Care Delivery Ecosystem
Physicians / Clinicians Managed
Care
Key Constituents of the Delivery Ecosystem
Providers in care delivery ecosystem have different incentives
FFS mechanisms incentivize admissions
Care of a patient is not tracked among providers
Bundled payments and ACO structures will drive coordination
Cost and outcomes will define where patients and $’s will go
Physicians/clinicians and managed care will all fight for a leading role
The Key Question Who will control the ultimate economics of the system?
Hospital
ALOS: 5.4 days Ave Cost Per Day: $1,752
LTAC
ALOS: 26.6 days Ave Cost Per Day: $1,451
IRF
ALOS: 13.1 days Ave Cost Per Day: $1.344
Skilled Nursing
ALOS: 27.1 days Ave Cost Per Day: $398
Home Health
VPPS: 36.7 visits Ave Cost Per Visit: $154
Hospital / Health System
Health Care Industry Trends
Risk Assumption
& Population Management

15
Nonprofits’ credit strength is driven by cash and leverage
Capital deployed has changed from PP&E to physician integration, IT and risk resources
Traditional tax-exempt capital is not effective for funding new needs
Hospital Sector Update: Size Matters
____________________ Source: S&P – “U.S. Not-For-Profit Health Care System: Stability in 2011 Fives Providers a Grim foundation to Face Industry Challenges ” Information as of 8/13/2012
S&P Not-For-Profit Health Care Ratings Distribution
Larger systems continue to benefit from a broader revenue base, economies of scale, and stronger operating margins
Health Care Industry Trends
18%
23%
20%
17%
12%
6%
1% 1% 2%3%
5%
14% 14%15% 15%
12%11%
10%
0%
5%
10%
15%
20%
25%
AA+/AA AA- A+ A A- BBB+ BBB BBB- SpeculativeGrade
Systems Stand-Alones
Limited Access to Capital

16
University of Michigan
Health System (“UMHS”)
Duke LifePoint Health Care
(“DLP”)
Strategic Alliance
• UMHS get minority equity
ownership in MMH
• 2 seats on MMH’s board
• U-M’s block “M” brand on
MMH’s logo and the expertise of
UMHS
• UMHS’s equity has the potential
to increasing to as much as 20%.
• LifePoint is a 97% owner of JV
• LifePoint provides access to
capital and operations resources
• Duke will enhance and develop
needed clinical services
• Duke provides access to highly
specialized medical services
• Long-term relationship to evolve
over time
• JV vehicle for acquisitions
• Cleveland Clinic and CHS will
remain independent
organizations
• Expands access and enhances the
level of care provided in the
multi-county region served by
MMH
• Expands UMHS’s presence
within the state of Michigan
• Provides LifePoint with scale
and strong brand recognition
• Makes LifePoint a more
palpable partner for not-for-
profit hospitals
• Duke will have no significant
capital exposure but share in
referral base without acquiring
hospitals and physician groups
• CCF extends its reach and
quality initiatives into new
regions served by CHS’s
network of 135 hospitals
• CHS will advance its clinical
programs through access to
CCF’s expertise in medical
specialties, best practices and
innovation in patient care
Transaction Summary
Transaction Rationale
Health Care Industry Trends Recent Partnerships
Limited Access to Capital
17
2,400
2,500
2,600
2,700
2,800
2,900
3,000
3,100
2001 2002 2003 2004 2005 2006 2007 2008 2009 2010 2011
Ho
spit
als
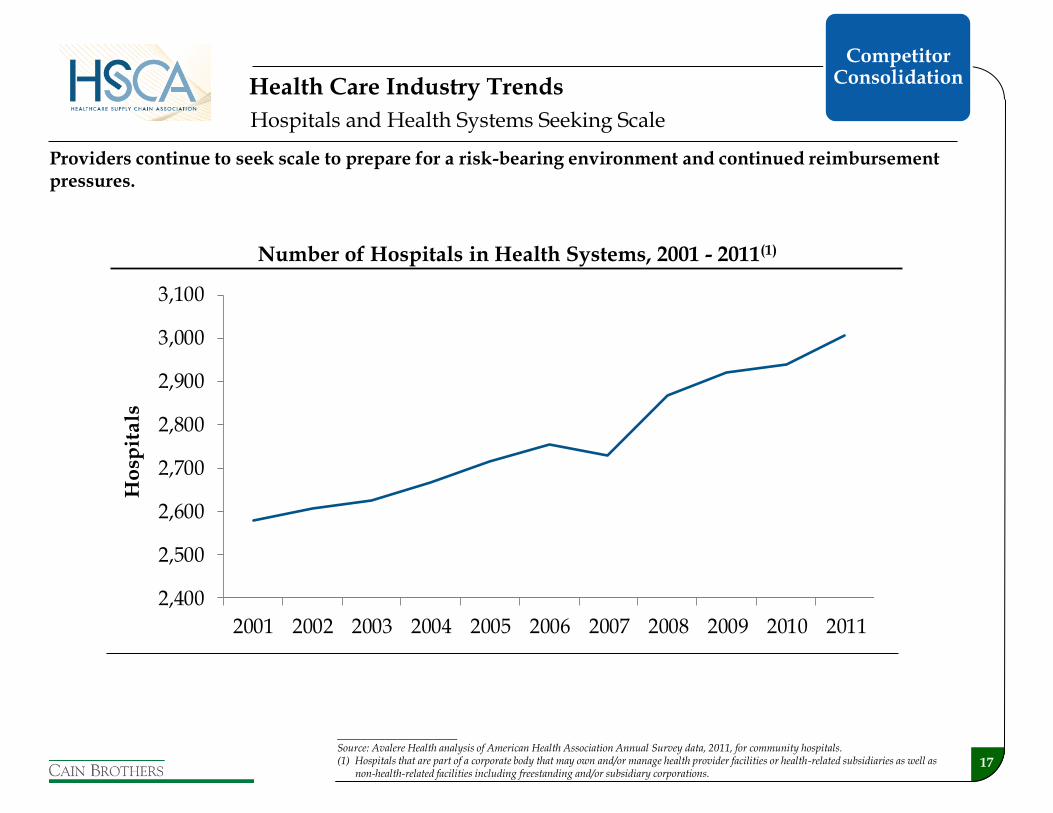
Hospitals and Health Systems Seeking Scale
Health Care Industry Trends
Number of Hospitals in Health Systems, 2001 - 2011(1)
____________________ Source: Avalere Health analysis of American Health Association Annual Survey data, 2011, for community hospitals. (1) Hospitals that are part of a corporate body that may own and/or manage health provider facilities or health-related subsidiaries as well as
non-health-related facilities including freestanding and/or subsidiary corporations.
Providers continue to seek scale to prepare for a risk-bearing environment and continued reimbursement pressures.
Competitor Consolidation

18
Increased transparency and regulation is driving industry towards commoditization
Convergence of Price and Quality:
Market Average Past Future
Health Care Industry Trends
Value Based Purchasing
of Care

19
Increasing focus on interrelationships across all points in the care continuum drives M&A
Pharmacy/ Dispensing
Radiology
Nursing
ICU/CCU
Psych. Lab
MDs
Cardiology
ED
+
Acute Care Value Pyramid
Value
Population Management + Reduced Reimbursement+ Market Characteristics
Clinical Outcomes
Cost Management
Infrastructure Development
Benchmarking / Decision Support
The “Integration” Mandate
Health Care M&A
Value Based Purchasing
of Care

Health Care M&A

21
IT systems
Purchasing
Back office
Human resources
Compliance
+ + + + Economies
of Scale
Human Capital and
Expertise
Risk Management
Capital Formation
Payor Contracting
Physician engagement
Recruiting
Quality and clinical protocols
Standardization
Best practice deployment
Reserves
Revenue, payor, and geographical diversification
Population health capabilities
Improved access to debt capital
Lower debt costs
Investment flexibility
Access to lives
Preferred provider arrangements
Ability to assume greater risk (and related rewards)
Most M&A activity is being driven by an attempt to realize the benefits of scale and to create coordinated care networks to manage population health
The Benefit of Scale
Foundation for Creating an Integrated and Coordinated System of Care
Health Care M&A
22
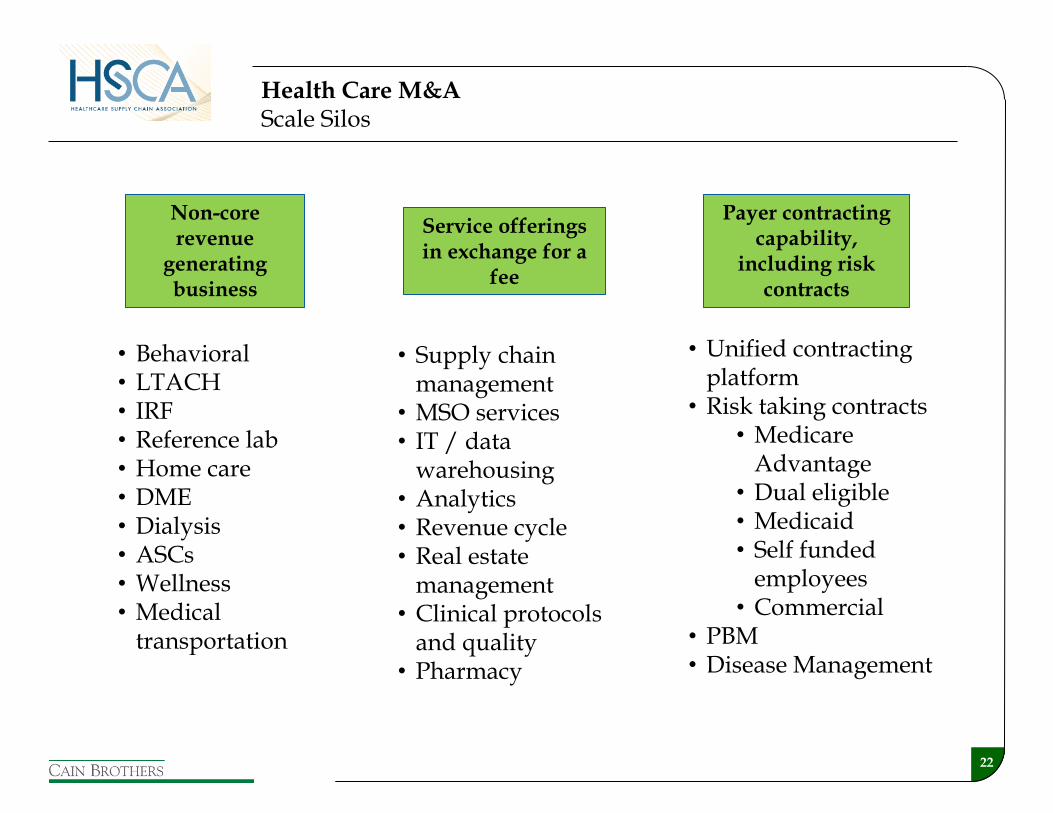
Non-core revenue
generating business
Service offerings in exchange for a
fee
Payer contracting capability,
including risk contracts
Health Care M&A Scale Silos
• Behavioral • LTACH • IRF • Reference lab • Home care • DME • Dialysis • ASCs • Wellness • Medical
transportation
• Supply chain management
• MSO services • IT / data
warehousing • Analytics • Revenue cycle • Real estate
management • Clinical protocols
and quality • Pharmacy
• Unified contracting platform
• Risk taking contracts • Medicare
Advantage • Dual eligible • Medicaid • Self funded
employees • Commercial
• PBM • Disease Management
23
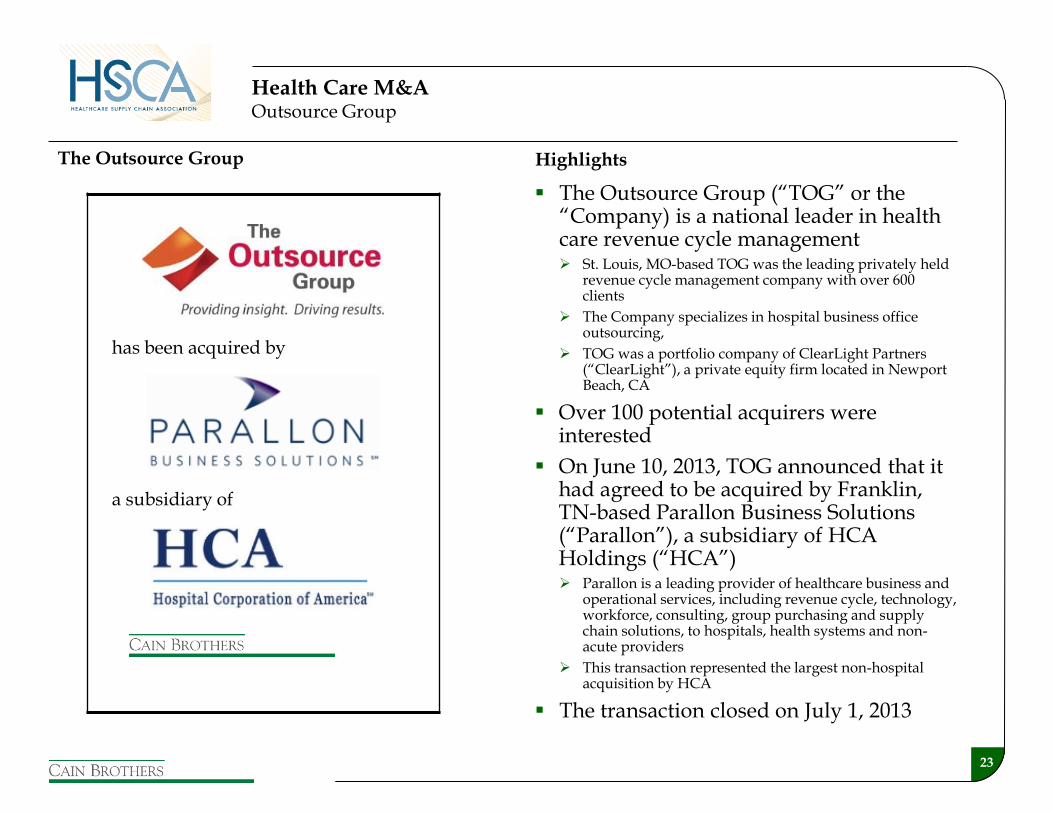
Highlights The Outsource Group
Health Care M&A Outsource Group
a subsidiary of
The Outsource Group (“TOG” or the “Company) is a national leader in health care revenue cycle management St. Louis, MO-based TOG was the leading privately held
revenue cycle management company with over 600 clients
The Company specializes in hospital business office outsourcing,
TOG was a portfolio company of ClearLight Partners (“ClearLight”), a private equity firm located in Newport Beach, CA
Over 100 potential acquirers were interested
On June 10, 2013, TOG announced that it had agreed to be acquired by Franklin, TN-based Parallon Business Solutions (“Parallon”), a subsidiary of HCA Holdings (“HCA”) Parallon is a leading provider of healthcare business and
operational services, including revenue cycle, technology, workforce, consulting, group purchasing and supply chain solutions, to hospitals, health systems and non-acute providers
This transaction represented the largest non-hospital acquisition by HCA
The transaction closed on July 1, 2013
has been acquired by
24
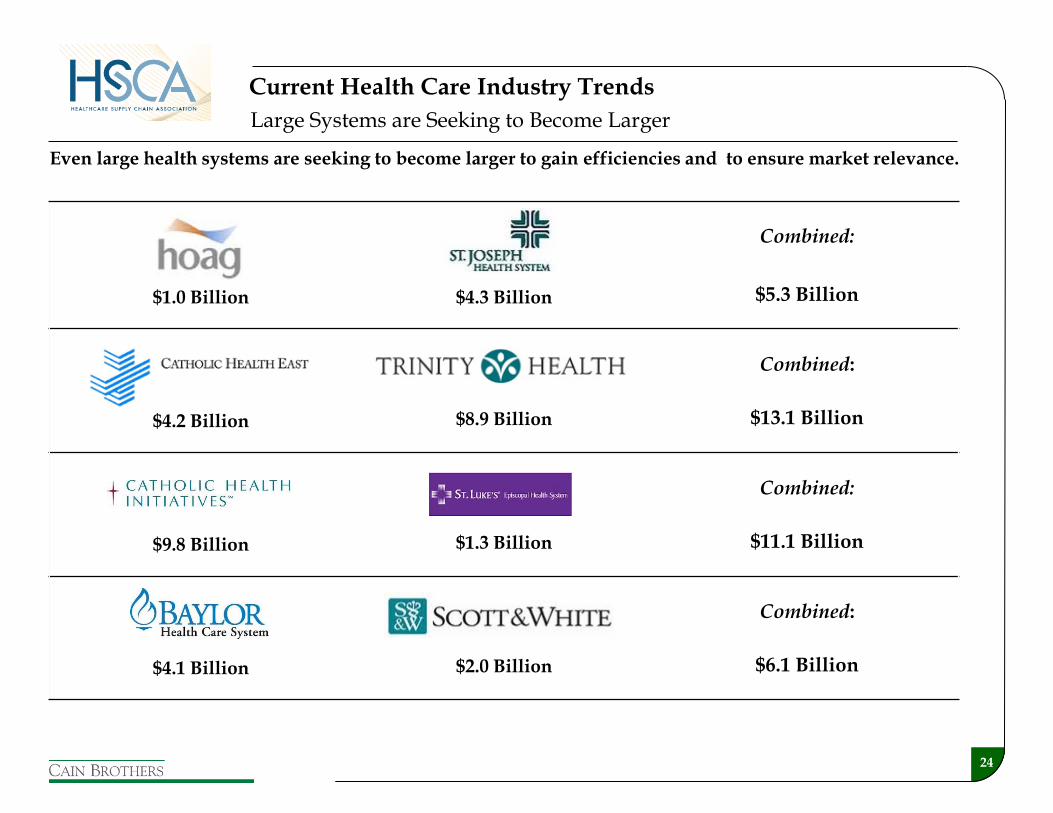
$1.0 Billion
$4.3 Billion
Combined:
$5.3 Billion
$4.2 Billion
$8.9 Billion
Combined:
$13.1 Billion
$9.8 Billion
$1.3 Billion
Combined:
$11.1 Billion
$4.1 Billion
$2.0 Billion
Combined:
$6.1 Billion
Large Systems are Seeking to Become Larger
Current Health Care Industry Trends
Even large health systems are seeking to become larger to gain efficiencies and to ensure market relevance.

25
$2.2 Billion
$4.5 Billion
Combined:
$6.7 Billion
Large Systems are Seeking to Become Larger
Current Health Care Industry Trends
Unsuccessful transactions can result from a myriad of issues.
Unclear objectives
Process failure
Poor management and communication with key constituents (particularly physicians)
Inflexibility
Regulatory process
Lack of imagination
Lack of cultural fit
Due diligence results
Economic changes
Material adverse changes due to internal or external factors
Competitor actions

26
M&A Activity Is Accelerating
Hospital transaction volume has been strong over the last three years
Booz & Company predicts that the number of independent hospitals will decrease from 5,000 to 4,000 over the next five to seven years due to consolidation
Affordable Care Act expectations will continue to drive consolidation over the next several years
Noteworthy recent transactions include:
Community Health Systems’ pending acquisition of Health Management Associates
Tenet’s pending acquisition of Vanguard Health Systems
Recently completed merger of Trinity Health and Catholic Health East
Merger of Scott & White Healthcare and Baylor Health Care System (Cain Brothers client)
Duke LifePoint’s acquisition of Marquette General Hospital
Health Care M&A Volume (# of Deals and Hospitals)(1)
Number of Acute Care Hospital Beds Acquired(1)
____________________ Sources: Irving Levin Associates, Inc. and Cain Brothers. (1) YTD statistics are as of June 30, 2013.
60 6053
7386
75
57
153
78
57
198
129
215
106
0
50
100
150
200
250
'07 '08 '09 '10 '11 '12 YTD
Deals Hospitals
22,010
5,282
10,668
19,030
23,527
41,344
21,193
0
5,000
10,000
15,000
20,000
25,000
30,000
35,000
40,000
45,000
'07 '08 '09 '10 '11 '12 YTD
Health Care M&A

27 ____________________ (1) Relationship consists of a risk-sharing agreement. Not an acquisition by Aetna.
Recent consolidation activity has been oriented to payor acquisitions of providers…
Acquiror /
Target
• Risk-sharing agreement
• Announced on November 21, 2011
• Affiliation with more than 2,000
employed and affiliated physicians
• Purchase Price = $475 MM
• Awaiting regulatory approval
• Acquisition of six 100+ bed
hospitals and related ancillary
businesses, which admit more than
79,000 patients
• Purchase Price = $790 MM
• Closed on December 21, 2010
• Acquisition of 300 medical
centers in 42 states
• Risk-sharing agreement will
compensate Banner on quality,
efficiency, and patient satisfaction
measures
• Members will pay less out of
pocket, receive more coordinated
care and have increased focus on
wellness
• Highmark to focus on quality and
efficient service, rather than revenue
growth
• Allows West Penn to keep open
West Penn Hospital (otherwise
slated to close)
• Maintains provider choice in region
• Driven by local market dynamics –
competitor is an integrated
provider/payor (UPMC)
• Will help Humana reduce costs
and enhance wellness programs
• Primary goal for Humana was to
obtain a physician-management
platform for occupational health
• Concentra has blue-chip work-
site clients: Hewlett Packard;
Whole Foods Market; and Hobby
Lobby
Transaction Summary
Transaction Rationale
(1)
Provider and Payor Integration
28
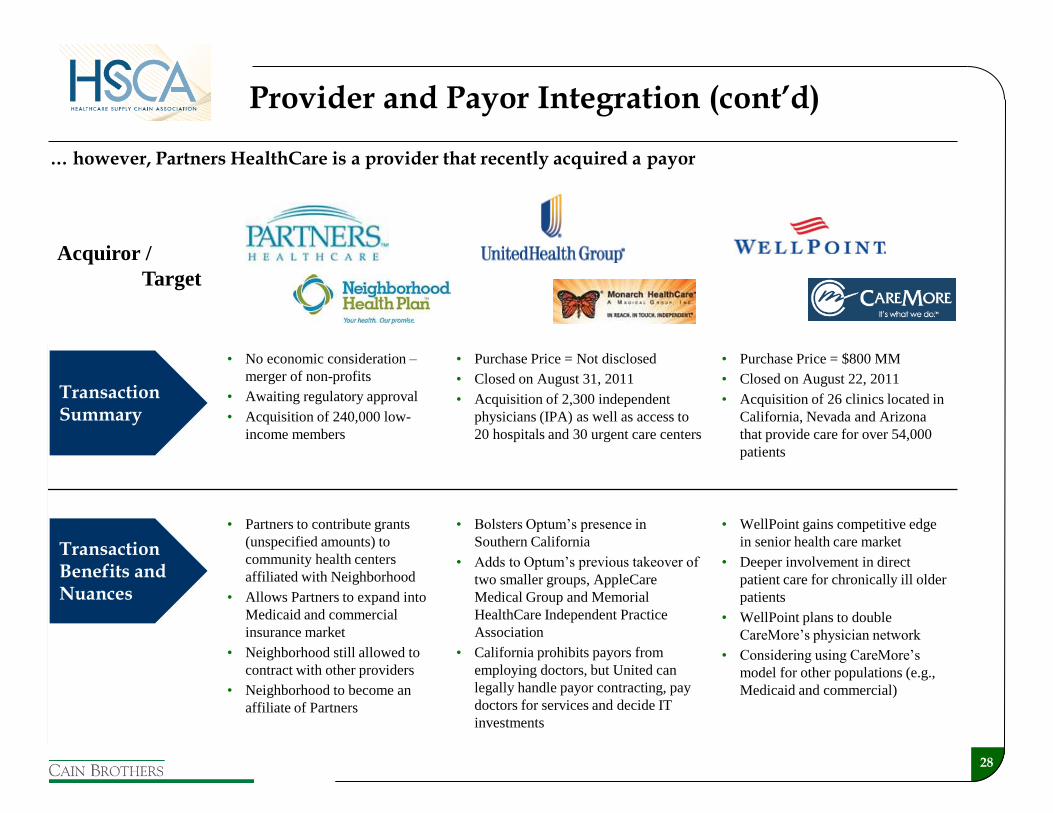
… however, Partners HealthCare is a provider that recently acquired a payor
Acquiror /
Target
• No economic consideration –
merger of non-profits
• Awaiting regulatory approval
• Acquisition of 240,000 low-
income members
• Purchase Price = Not disclosed
• Closed on August 31, 2011
• Acquisition of 2,300 independent
physicians (IPA) as well as access to
20 hospitals and 30 urgent care centers
• Purchase Price = $800 MM
• Closed on August 22, 2011
• Acquisition of 26 clinics located in
California, Nevada and Arizona
that provide care for over 54,000
patients
• Partners to contribute grants
(unspecified amounts) to
community health centers
affiliated with Neighborhood
• Allows Partners to expand into
Medicaid and commercial
insurance market
• Neighborhood still allowed to
contract with other providers
• Neighborhood to become an
affiliate of Partners
• Bolsters Optum’s presence in
Southern California
• Adds to Optum’s previous takeover of
two smaller groups, AppleCare
Medical Group and Memorial
HealthCare Independent Practice
Association
• California prohibits payors from
employing doctors, but United can
legally handle payor contracting, pay
doctors for services and decide IT
investments
• WellPoint gains competitive edge
in senior health care market
• Deeper involvement in direct
patient care for chronically ill older
patients
• WellPoint plans to double
CareMore’s physician network
• Considering using CareMore’s
model for other populations (e.g.,
Medicaid and commercial)
Transaction Summary
Transaction Benefits and Nuances
Provider and Payor Integration (cont’d)

Strategic Alternatives

30
Strategic Framework
Strategic Evaluation
• Define vision, mission and strategic
objectives
• Understand organizational risk
tolerance
• Understand environment
Internal
External
• Evaluate key activities
Hospital operations
Physician operations
Non-core operations
• Understand the tradeoffs in defending
and extending market share
• Obtain and quantify competitor
intelligence
• Formulate potential strategic
alternatives
• Develop financial forecasts to support
analyses of strategic alternatives
Every situation is different and
health care is still local
Funding Assessment
• Estimate funding requirements for
strategic alternatives considered
• Determine enterprise valuations and
business unit valuations
• Evaluate and prioritize funding options
to meet capital needs
Ability to generate cash from
operations
Debt capacity based on risk
thresholds
Ability to generate philanthropic
giving
Value from non-core asset sales
Value from joint ventures and other
contractual arrangements
Outright sale or merger
• Prioritize strategies based on accretive
opportunities, risk tolerance and
availability and cost of capital
Capital demands to pursue strategies
often exceed capital available thereby
creating a funding gap
Potential Strategic Responses
• Engage in operational improvement
initiatives
Cost efficiencies
Program realignment
Revenue cycle
• Adjust capital plans
Ensure hurdle rate discipline
• Consider acquisition/development
strategies
Hospitals
Outpatient facilities
Physician practices
Other
• Issue debt
• Enter into joint ventures
• Sell non-core operations
Real estate assets
• Pursue other affiliations
• Sell/merge
Balance strategies that can be
financed with strategies that achieve
organizational objectives
Strategic Alternatives
31
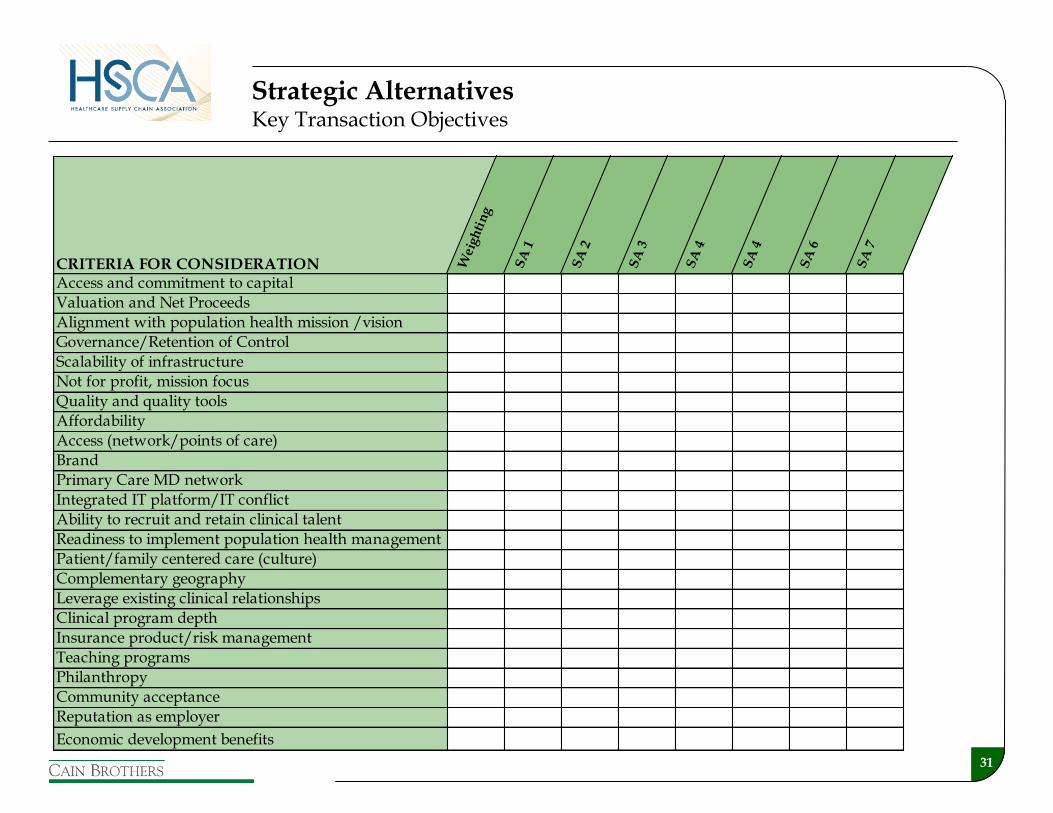
Strategic Alternatives Key Transaction Objectives
CRITERIA FOR CONSIDERATION Wei
ghti
ng
SA
1
SA
2
SA
3
SA
4
SA
4
SA
6
SA
7
Access and commitment to capital
Valuation and Net Proceeds
Alignment with population health mission /vision
Governance/Retention of Control
Scalability of infrastructure
Not for profit, mission focus
Quality and quality tools
Affordability
Access (network/points of care)
Brand
Primary Care MD network
Integrated IT platform/IT conflict
Ability to recruit and retain clinical talent
Readiness to implement population health management
Patient/family centered care (culture)
Complementary geography
Leverage existing clinical relationships
Clinical program depth
Insurance product/risk management
Teaching programs
Philanthropy
Community acceptance
Reputation as employer
Economic development benefits
32
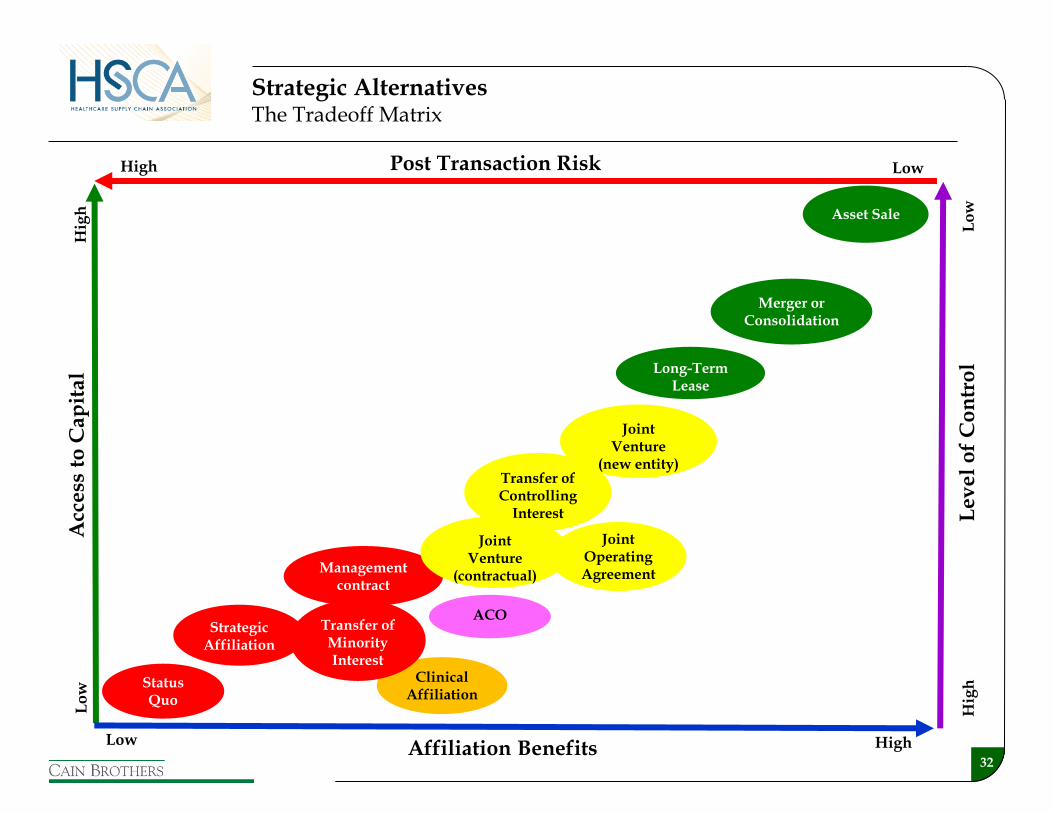
Post Transaction Risk
High Low
Lo
w
Hig
h
Hig
h
Lo
w
Acc
ess
to
Ca
pit
al
High Low
Joint Operating Agreement
Status Quo
Joint Venture
(new entity)
Management contract
Merger or Consolidation
Clinical Affiliation
Asset Sale
Affiliation Benefits
Le
ve
l o
f C
on
tro
l
Strategic Alternatives The Tradeoff Matrix
Strategic Affiliation
Long-Term Lease
Transfer of Controlling
Interest
Joint Venture
(contractual)
Transfer of Minority Interest
ACO
33
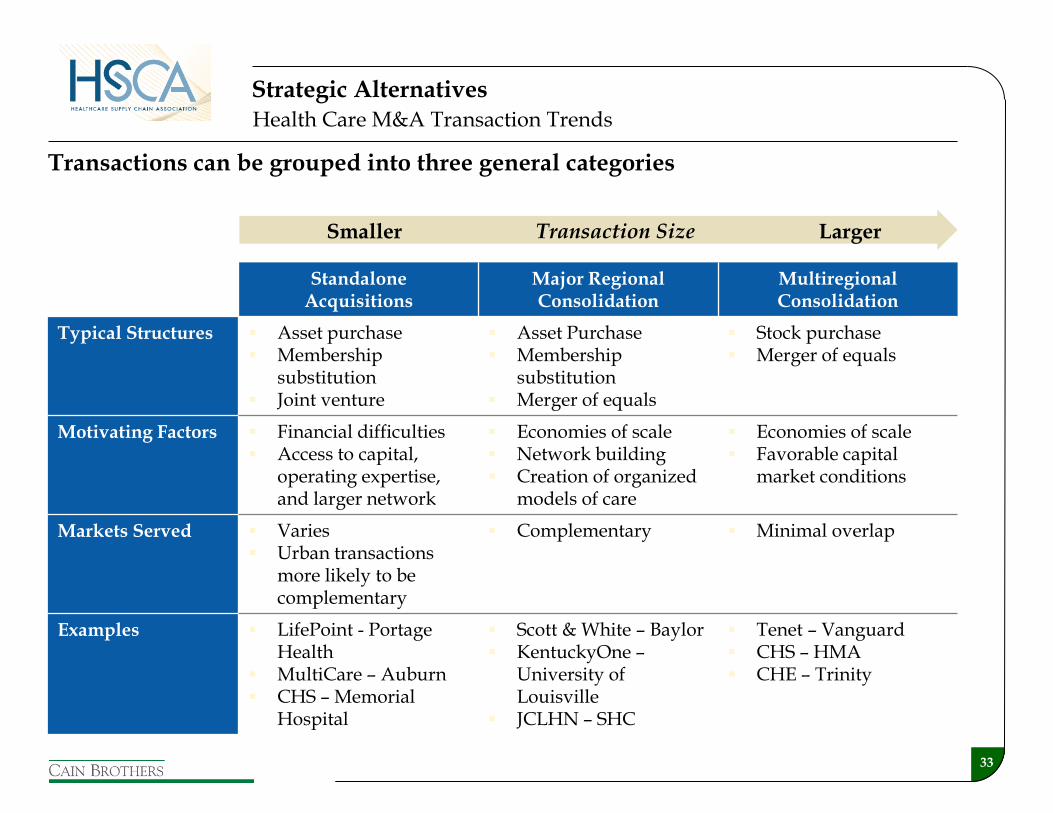
Transactions can be grouped into three general categories
Standalone Acquisitions
Major Regional Consolidation
Multiregional Consolidation
Typical Structures Asset purchase Membership
substitution Joint venture
Asset Purchase Membership
substitution Merger of equals
Stock purchase Merger of equals
Motivating Factors Financial difficulties Access to capital,
operating expertise, and larger network
Economies of scale Network building Creation of organized
models of care
Economies of scale Favorable capital
market conditions
Markets Served Varies Urban transactions
more likely to be complementary
Complementary Minimal overlap
Examples LifePoint - Portage Health
MultiCare – Auburn CHS – Memorial
Hospital
Scott & White – Baylor KentuckyOne –
University of Louisville
JCLHN – SHC
Tenet – Vanguard CHS – HMA CHE – Trinity
Health Care M&A Transaction Trends
Smaller Larger Transaction Size
Strategic Alternatives
34
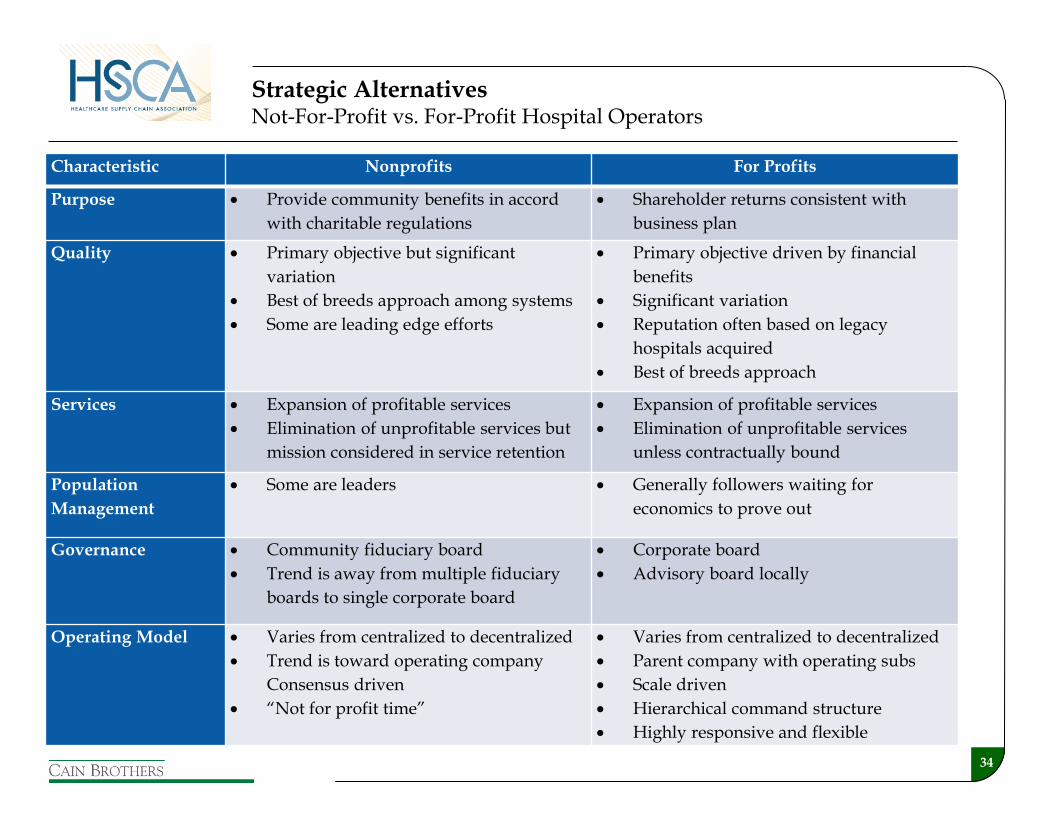
Characteristic Nonprofits For Profits
Purpose Provide community benefits in accord
with charitable regulations
Shareholder returns consistent with
business plan
Quality Primary objective but significant
variation
Best of breeds approach among systems
Some are leading edge efforts
Primary objective driven by financial
benefits
Significant variation
Reputation often based on legacy
hospitals acquired
Best of breeds approach
Services Expansion of profitable services
Elimination of unprofitable services but
mission considered in service retention
Expansion of profitable services
Elimination of unprofitable services
unless contractually bound
Population
Management
Some are leaders Generally followers waiting for
economics to prove out
Governance Community fiduciary board
Trend is away from multiple fiduciary
boards to single corporate board
Corporate board
Advisory board locally
Operating Model Varies from centralized to decentralized
Trend is toward operating company
Consensus driven
“Not for profit time”
Varies from centralized to decentralized
Parent company with operating subs
Scale driven
Hierarchical command structure
Highly responsive and flexible
Strategic Alternatives Not-For-Profit vs. For-Profit Hospital Operators
35
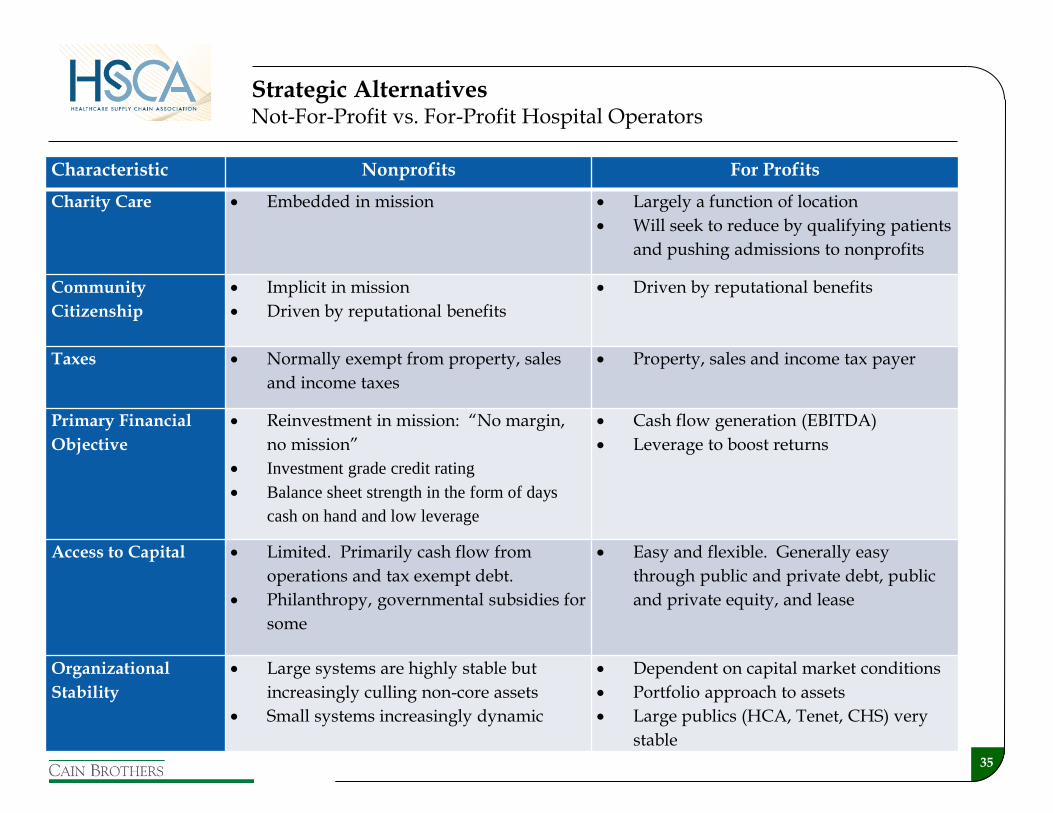
Characteristic Nonprofits For Profits
Charity Care Embedded in mission Largely a function of location
Will seek to reduce by qualifying patients
and pushing admissions to nonprofits
Community
Citizenship
Implicit in mission
Driven by reputational benefits
Driven by reputational benefits
Taxes Normally exempt from property, sales
and income taxes
Property, sales and income tax payer
Primary Financial
Objective
Reinvestment in mission: “No margin,
no mission”
Investment grade credit rating
Balance sheet strength in the form of days
cash on hand and low leverage
Cash flow generation (EBITDA)
Leverage to boost returns
Access to Capital Limited. Primarily cash flow from
operations and tax exempt debt.
Philanthropy, governmental subsidies for
some
Easy and flexible. Generally easy
through public and private debt, public
and private equity, and lease
Organizational
Stability
Large systems are highly stable but
increasingly culling non-core assets
Small systems increasingly dynamic
Dependent on capital market conditions
Portfolio approach to assets
Large publics (HCA, Tenet, CHS) very
stable
Strategic Alternatives Not-For-Profit vs. For-Profit Hospital Operators
36
Strategic Alternatives
Joint Operating Company (JOC) Case Study
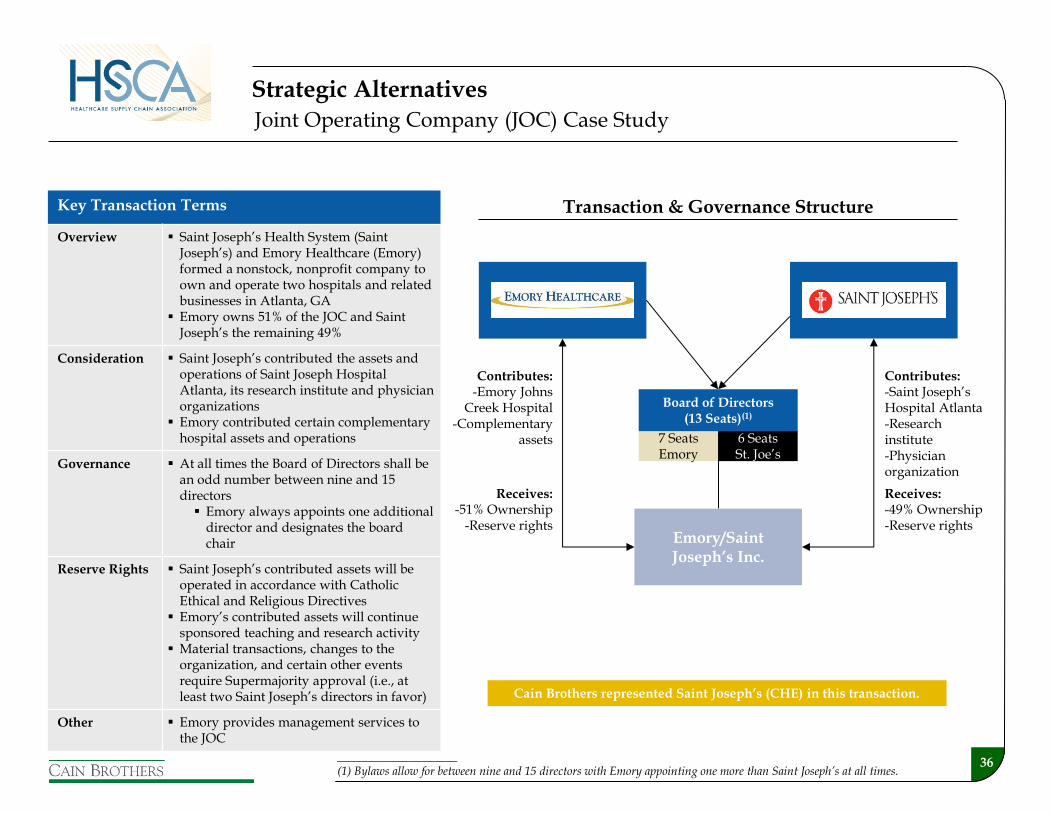
Key Transaction Terms
Overview Saint Joseph’s Health System (Saint Joseph’s) and Emory Healthcare (Emory) formed a nonstock, nonprofit company to own and operate two hospitals and related businesses in Atlanta, GA
Emory owns 51% of the JOC and Saint Joseph’s the remaining 49%
Consideration Saint Joseph’s contributed the assets and operations of Saint Joseph Hospital Atlanta, its research institute and physician organizations
Emory contributed certain complementary hospital assets and operations
Governance At all times the Board of Directors shall be an odd number between nine and 15 directors Emory always appoints one additional
director and designates the board chair
Reserve Rights Saint Joseph’s contributed assets will be operated in accordance with Catholic Ethical and Religious Directives
Emory’s contributed assets will continue sponsored teaching and research activity
Material transactions, changes to the organization, and certain other events require Supermajority approval (i.e., at least two Saint Joseph’s directors in favor)
Other Emory provides management services to the JOC
Contributes: -Emory Johns
Creek Hospital -Complementary
assets
Emory/Saint Joseph’s Inc.
Contributes: -Saint Joseph’s Hospital Atlanta -Research institute -Physician organization
7 Seats Emory
6 Seats St. Joe’s
Board of Directors (13 Seats)(1)
Receives: -49% Ownership -Reserve rights
Receives: -51% Ownership
-Reserve rights
Transaction & Governance Structure
____________________ (1) Bylaws allow for between nine and 15 directors with Emory appointing one more than Saint Joseph’s at all times.
Cain Brothers represented Saint Joseph’s (CHE) in this transaction.
37
Strategic Alternatives Joint Operating Agreement (JOA) Case Study
Key Transaction Terms
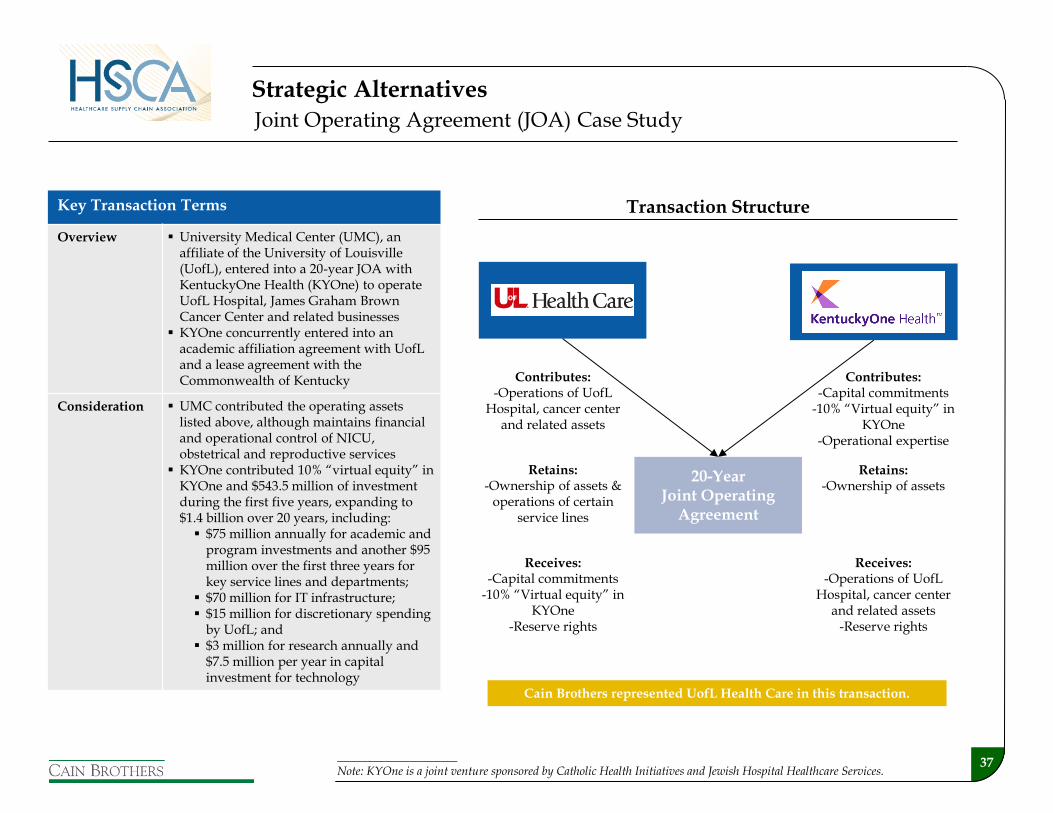
Overview University Medical Center (UMC), an affiliate of the University of Louisville (UofL), entered into a 20-year JOA with KentuckyOne Health (KYOne) to operate UofL Hospital, James Graham Brown Cancer Center and related businesses
KYOne concurrently entered into an academic affiliation agreement with UofL and a lease agreement with the Commonwealth of Kentucky
Consideration UMC contributed the operating assets listed above, although maintains financial and operational control of NICU, obstetrical and reproductive services
KYOne contributed 10% “virtual equity” in KYOne and $543.5 million of investment during the first five years, expanding to $1.4 billion over 20 years, including: $75 million annually for academic and
program investments and another $95 million over the first three years for key service lines and departments;
$70 million for IT infrastructure; $15 million for discretionary spending
by UofL; and $3 million for research annually and
$7.5 million per year in capital investment for technology
Contributes: -Operations of UofL
Hospital, cancer center and related assets
20-Year Joint Operating
Agreement
Receives: -Capital commitments
-10% “Virtual equity” in KYOne
-Reserve rights
Transaction Structure
Retains: -Ownership of assets &
operations of certain service lines
Contributes: -Capital commitments
-10% “Virtual equity” in KYOne
-Operational expertise
Receives: -Operations of UofL
Hospital, cancer center and related assets
-Reserve rights
Retains: -Ownership of assets
____________________ Note: KYOne is a joint venture sponsored by Catholic Health Initiatives and Jewish Hospital Healthcare Services.
Cain Brothers represented UofL Health Care in this transaction.
38
Strategic Alternatives
Joint Operating Agreement (JOA) Case Study (Cont’d)
Key Transaction Terms
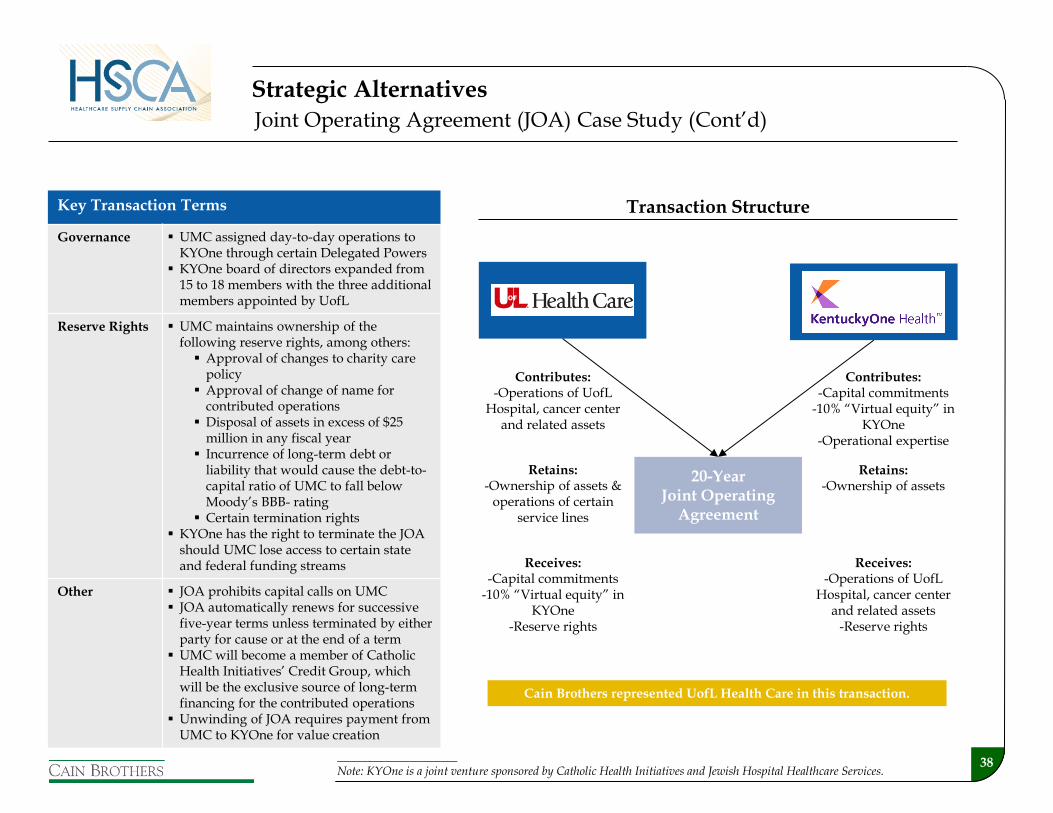
Governance UMC assigned day-to-day operations to KYOne through certain Delegated Powers
KYOne board of directors expanded from 15 to 18 members with the three additional members appointed by UofL
Reserve Rights UMC maintains ownership of the following reserve rights, among others: Approval of changes to charity care
policy Approval of change of name for
contributed operations Disposal of assets in excess of $25
million in any fiscal year Incurrence of long-term debt or
liability that would cause the debt-to-capital ratio of UMC to fall below Moody’s BBB- rating
Certain termination rights KYOne has the right to terminate the JOA
should UMC lose access to certain state and federal funding streams
Other JOA prohibits capital calls on UMC JOA automatically renews for successive
five-year terms unless terminated by either party for cause or at the end of a term
UMC will become a member of Catholic Health Initiatives’ Credit Group, which will be the exclusive source of long-term financing for the contributed operations
Unwinding of JOA requires payment from UMC to KYOne for value creation
Contributes: -Operations of UofL
Hospital, cancer center and related assets
20-Year Joint Operating
Agreement
Receives: -Capital commitments
-10% “Virtual equity” in KYOne
-Reserve rights
Transaction Structure
Retains: -Ownership of assets &
operations of certain service lines
Contributes: -Capital commitments
-10% “Virtual equity” in KYOne
-Operational expertise
Receives: -Operations of UofL
Hospital, cancer center and related assets
-Reserve rights
Retains: -Ownership of assets
____________________ Note: KYOne is a joint venture sponsored by Catholic Health Initiatives and Jewish Hospital Healthcare Services.
Cain Brothers represented UofL Health Care in this transaction.
39
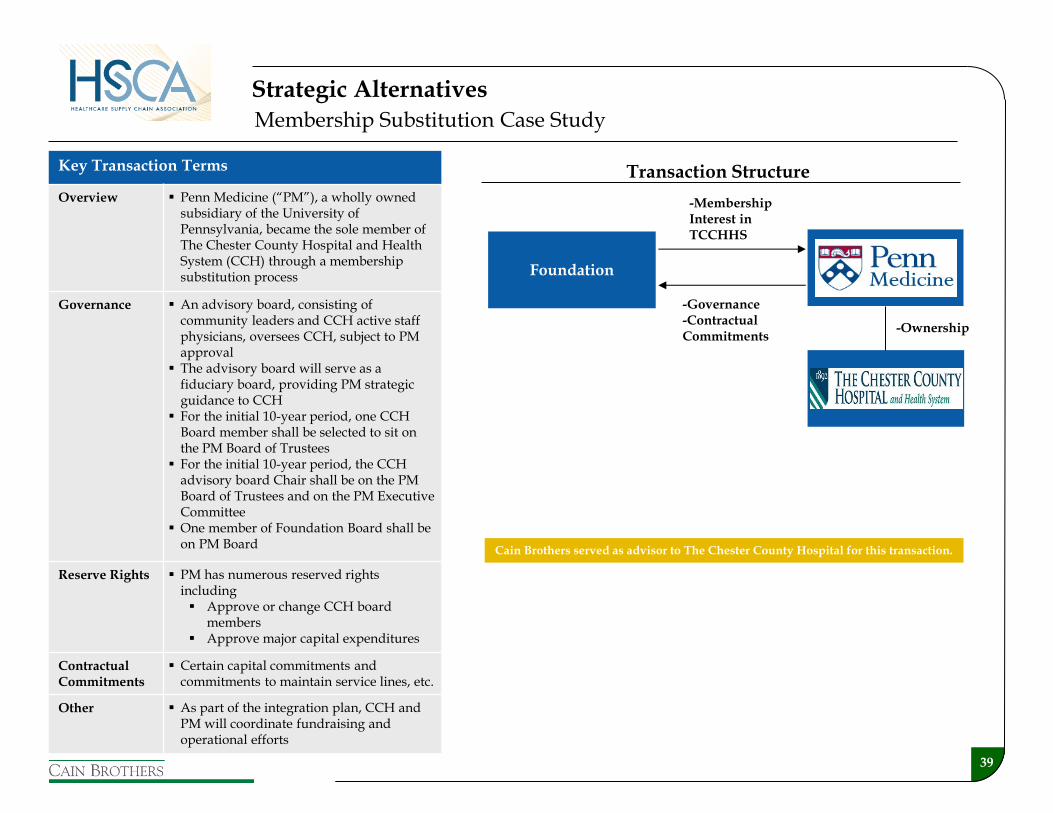
-Ownership
Strategic Alternatives
Membership Substitution Case Study
Key Transaction Terms
Overview Penn Medicine (“PM”), a wholly owned subsidiary of the University of Pennsylvania, became the sole member of The Chester County Hospital and Health System (CCH) through a membership substitution process
Governance An advisory board, consisting of community leaders and CCH active staff physicians, oversees CCH, subject to PM approval
The advisory board will serve as a fiduciary board, providing PM strategic guidance to CCH
For the initial 10-year period, one CCH Board member shall be selected to sit on the PM Board of Trustees
For the initial 10-year period, the CCH advisory board Chair shall be on the PM Board of Trustees and on the PM Executive Committee
One member of Foundation Board shall be on PM Board
Reserve Rights PM has numerous reserved rights including Approve or change CCH board
members Approve major capital expenditures
Contractual Commitments
Certain capital commitments and commitments to maintain service lines, etc.
Other As part of the integration plan, CCH and PM will coordinate fundraising and operational efforts
Transaction Structure
Cain Brothers served as advisor to The Chester County Hospital for this transaction.
Foundation
-Membership Interest in TCCHHS
-Governance -Contractual Commitments

40
Strategic Alternatives
Clinical Affiliation Case Study
Key Transaction Terms
Overview Through a Joint Powers Affiliation Agreement and related contracts, UC San Diego (UCSD) transferred virtually all of its pediatric operations to Children’s Hospital and Health Center (CHHC)
Consideration CHHC established an Academic Fund to replace the financial support traditionally provided by the UCSD Medical Center to the UCSD School of Medicine for peds
CHHC provided facilities to house UCSD personnel and a $5 million commitment for the construction of a research building
A new leadership position of Physician-In-Chief was established to guide the vision of creating a world-class academic children’s health center
Governance CHHC increased the size of its Board from 15 to 18 Trustees, of which a third of the positions are to be held by UCSD
Similar amendments were made to Children’s Hospital, San Diego’s Board
Reserve Rights CHHC’s governing documents were amended to include the clinical, research, and academic missions of UCSD Health Services as a purpose of the corporation
Other CHHC became the primary pediatric teaching and research site for UCSD
Pediatric specialty physicians of UCSD Medical Group became members of Children’s Specialists of San Diego
Transaction Structure
Cain Brothers represented UC San Diego in this transaction.
UCSD Pediatric
Operations
UCSD Pediatric
Operations
Contributes: -Pediatric operations
Receives: -Ongoing academic support payments -Governance rights
Contributes: -Ongoing academic support payments -Governance rights
Receives: -UCSD pediatric
operations