Embed Size (px)
Citation preview
The International Journal of Flexible Manufacturing Systems, 13 (2001): 177–193c© 2001 Kluwer Academic Publishers, Boston. Manufactured in The Netherlands.
An Innovative Approach for Using the GRAIMethodology for Reengineering the New ProductIntroduction Process
DAVID TUCKERDepartment of Business Information Technology, Manchester Metropolitan University, Manchester, U.K.
RAYMOND LEONARDDepartment of Total Technology, University of Manchester Institute of Science and Technology, Manchester, U.K.
Abstract. This paper represents the culmination of a four-year ethnographic research project in a leading U.K.manufacturing company. A number of organizational deficiencies in the new product introduction (NPI) processare identified. Proposals subsequently are implemented that enhance the effectiveness of this process. The paperidentifies the critical need for organizations to communicate effectively among different functional areas withrespect to new products. A review of modeling techniques identifies the GRAI grid as an effective model foranalyzing and improving cooperative business processes. The GRAI grid is set within the framework of a novelimplementation methodology and subsequently is applied to the NPI process within the collaborating company.The paper concludes by reporting the substantial benefits gained.
Key Words: new product introduction, concurrent engineering, business process reengineering, GRAI model
1. Introduction
Increasingly fierce global competition coupled with customer demand for higher-qualityproducts delivered in shorter lead times is forcing manufacturing organizations to adoptradical approaches to new product introduction (NPI). The ability to dramatically reducethe time from product conception to introduction in the marketplace now is a prime sourceof competitive advantage (Hartley, 1992). In recent years, manufacturing organizations havestarted to recognize that the inherent inefficiencies in the traditional sequential approach toNPI are a major obstacle to reducing lead times. Consequently, considerable interest hasarisen in the concept of concurrent engineering, in which the numerous implications of anew product are examined at the conceptual design stage (Winner et al., 1988).
Much attention has been given to the use of information technology to support the concur-rent engineering process (Tucker and Leonard, 1993). Technologies such as groupware andintranets enable people to work together despite spatial and temporal separation. The adop-tion of these technologies, however, does not guarantee successful concurrent engineering.Recent research has concentrated less on the technical issues and more on the organiza-tional issues pertaining to concurrent engineering (Tucker and Leonard, 1994). This isbecause it now is widely agreed that successful concurrent engineering is best achievedwith multidisciplinary teams, and the obstacles to success are not physical but cultural andorganizational.
178 DAVID TUCKER AND RAYMOND LEONARD
2. Research methodology
To gain in-depth knowledge of the factors that inhibit concurrent engineering requires a com-prehensive, long-term investigation. To achieve this, we selected to study a manufacturingorganization that typifies many U.K. companies in terms of size, structure, and process. Forconfidentiality, the organization shall be referred to as Harlow. Another reason for choosingHarlow was that it was about to embark on the process of designing and introducing a newproduct to the market. The product shall be referred to here as OH. Harlow traditionally usedthe sequential approach to new product introduction. Management was fully aware that thesequential approach is inherently inefficient, and it previously tried to adopt a concurrentengineering approach, which had been unsuccessful. Previously, this limitation was not sig-nificant because the market in which Harlow operates is relatively stable, and there are fewcompetitors. This situation changed dramatically during the 1990s, as foreign competitionstarted to erode Harlow’s traditional market share. The company realized that, to remainthe major force in the industry, it must adapt to these changed competitive circumstances.
The company wishes to become more responsive to the needs of its customers whilereducing costs. As a part of this process, Harlow required a major investigation into itsestablished working practices to discover if they are consistent with company goals. There-fore, one of us was to work in each department, including a significant period on the shopfloor. This was not to be a passive exercise, and significant tasks were to be undertaken ineach department. Not only would this generate a comprehensive knowledge of the company,it would ensure that practical benefits ensued within each department. The duration of theresearch project was four years.
3. Initial research outcomes
Eighteen months into the project some useful observations could be made:
1. There was a problem of coordination and synchronization of the transmission of in-formation from the various functional departments to the shop floor. This constituted asignificant inefficiency in the NPI process.
2. The sequential engineering release system encompassed several functional departments,and each signed its approval of each engineering release. Both the design manager andthe modification coordinator kept manual records of the state of each release. Therefore,the volume of changes, coupled with other duties, meant that an engineering releasetook significantly longer than was necessary. This adversely affected product develop-ment costs and resulted in delayed introduction of a new product, possibly resulting inlost market share. This again demonstrated the importance of coordination among thedifferent departments within the company.
3. The staff in one department was largely unaware of the processes and procedures usedin other departments. The general attitude was, “I do my job, what happens after that isnot my concern.” One senior engineer, responsible for vetting sales orders, stated that hehad no knowledge of what happened to the vetted orders once they left the EngineeringDepartment.
USING GRAI METHODOLOGY FOR NEW PRODUCT INTRODUCTION 179
4. The terminology used to refer to a particular process or document was different in eachdepartment. When departments operate independent of each other, commonality of termsis not critical; but for systems encompassing the whole company, this anomaly leads toconfusion.
5. Each department regarded its system requirements as paramount, with scant regard forother departments’ needs, let alone the requirements of priority to the company as awhole.
6. The Production Control Department’s goal was a production schedule that would resultin efficient utilization of the manufacturing facilities, whereas the Sales Department’sgoal was to maximize order intake. Therefore, the Sales Department, under pressureto generate additional sales, sometimes would bypass documented procedures so as tosecure orders. Hence, the prototype OH was scheduled for production against a plan thatwould distort manufacturing capacity.
4. Analysis of the empirical research findings
When organizations are fragmented both horizontally and vertically, a major problem arisesas to how to coordinate the different parts (e.g., Stoner, 1982). In their investigations intosuccessful manufacturing organizations, Lawrence and Lorsch (1986) highlighted the im-portance of integration and differentiation. Differentiation is defined as “the difference be-tween the cognitive and emotional orientation among managers in different departments.”Integration is “the quality of the state of collaboration that exists among departments thatare required to achieve unity of effort by the demands of the environment.” Lawrence andLorsch found that, the more diverse and dynamic was the company’s environment, the moredifferentiated sections became. When differentiation was based on “significant task and en-vironmental differences,” this contributed to good performance, but because different depart-ments viewed problems from different perspectives, conflicts were inevitable. Longeneckerand Pringle (1984) describe how members of specialist departments have different percep-tions and values and that the use of departmental jargon inhibits communication. Similarly,organizations have finite resources, so competition leads to interdepartmental conflict.
Mintzberg (1979) notes that specialization has led to humankind’s achievements butalso created specialists who tend not to see the organization from a holistic perspective.Furthermore, traditional manufacturing management tends to value the optimization ofindividual work (Paper, 1999). This can mean that individuals evaluate alternatives onlyin terms of subgoals, which might be in conflict with the goals of the organization asa whole. Individuals adopt a reference framework with which they become accustomed,and different departments interact with different environments and thereby gain differentperceptions. Allen (1985) shows how the physical separation of departments reduces theopportunity for interdepartmental communication and thereby exacerbates differences.
Concurrent engineering requires mechanisms for integrating the activities of the manu-facturing organization. Bureaucracies provide a hierarchical structure, which acts as a goodintegrating mechanism when time is not a critical factor and the external environment isstable (Child, 1984). This is because the degree of uncertainty of information is low anddecisions can be made in advance of their execution. Thus, the number of conflicts that
180 DAVID TUCKER AND RAYMOND LEONARD
require passing up the hierarchy for resolution is low and within the processing capacity ofthe organization. As environmental uncertainty increases, so does the number of decisionsreferred up the hierarchy. Eventually, these decisions exceed the organization’s ability toprocess them, leading to “information overload” (Simon, 1977).
Horizontal coordination among departments is required because each department under-takes only one of a number of subtasks that together constitute the process of new productintroduction. Vertical coordination is necessary to ensure that the requirements of the cus-tomer are translated correctly into actual products in a timely and cost-effective manner.In responding to these conditions, organizations tend to adopt bureaucratic organizationalstructures. The hierarchy of authority and the imposition of rules provide mechanisms forboth conflict resolution and organizational coordination.
At Harlow, the external environment was complex and uncertain. Customers demandedhigher-quality products delivered in shorter lead times. The traditional sequential engineer-ing approach was bureaucratic and so unsuitable to meet these requirements. Many depart-ments were intrinsically involved in the new product introduction process, including DesignEngineering, Production Engineering, Manufacturing, and Marketing. Because of the com-plexity of the product, the departments within Harlow were highly differentiated. They, how-ever, had not recognized that the traditional integration mechanisms employed within thecompany were causing considerable inefficiencies in the new product introduction process.
5. Modeling the organization
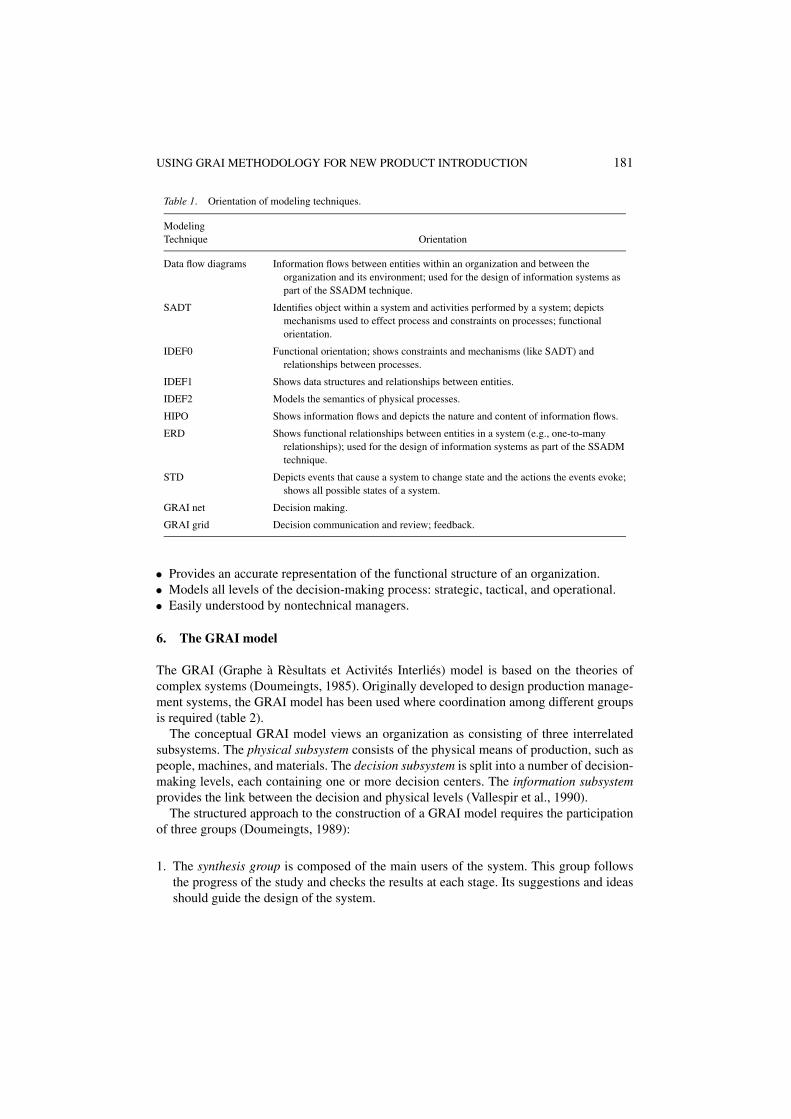
A high number of interdependencies among functional elements makes a holistic study ofthe physical organization immensely difficult. A model, which is a simplified representation,can be constructed and manipulated with less risk than making actual changes within theorganization. We investigated a wide range of existing modeling techniques and evaluatedtheir ability to accurately represent the situation at Harlow (table 1). The GRAI grid is theonly one to explicitly incorporate both the decision-making and decision-communicationprocesses (Doumeingts, 1985). Additionally, the GRAI grid explicitly models the timingaspects of decision making, physical activities, and information flows and thus models thedynamic aspects of the NPI process.
The main advantages of the GRAI grid over the other models are these:
• Specifically models the decision-making process.• Specifically models the timing aspects of the decision-communication process.• Specifically models the relationship between decisions and actions.• Acknowledges that decisions, once made, are subject to decay and must be reevaluated
periodically (review period).• Represents an organization as an entity with a continual existence through time.• Expresses the horizontal and vertical relationships between different elements in the
organization.• Incorporates essential information flows—the basis of decision making.• Through the GRAI rules, provides a sound base for analysis.• Top-down and bottom-up application to reveal inconsistencies in organizational structure.
USING GRAI METHODOLOGY FOR NEW PRODUCT INTRODUCTION 181
Table 1. Orientation of modeling techniques.
ModelingTechnique Orientation
Data flow diagrams Information flows between entities within an organization and between theorganization and its environment; used for the design of information systems aspart of the SSADM technique.
SADT Identifies object within a system and activities performed by a system; depictsmechanisms used to effect process and constraints on processes; functionalorientation.
IDEF0 Functional orientation; shows constraints and mechanisms (like SADT) andrelationships between processes.
IDEF1 Shows data structures and relationships between entities.
IDEF2 Models the semantics of physical processes.
HIPO Shows information flows and depicts the nature and content of information flows.
ERD Shows functional relationships between entities in a system (e.g., one-to-manyrelationships); used for the design of information systems as part of the SSADMtechnique.
STD Depicts events that cause a system to change state and the actions the events evoke;shows all possible states of a system.
GRAI net Decision making.
GRAI grid Decision communication and review; feedback.
• Provides an accurate representation of the functional structure of an organization.• Models all levels of the decision-making process: strategic, tactical, and operational.• Easily understood by nontechnical managers.
6. The GRAI model
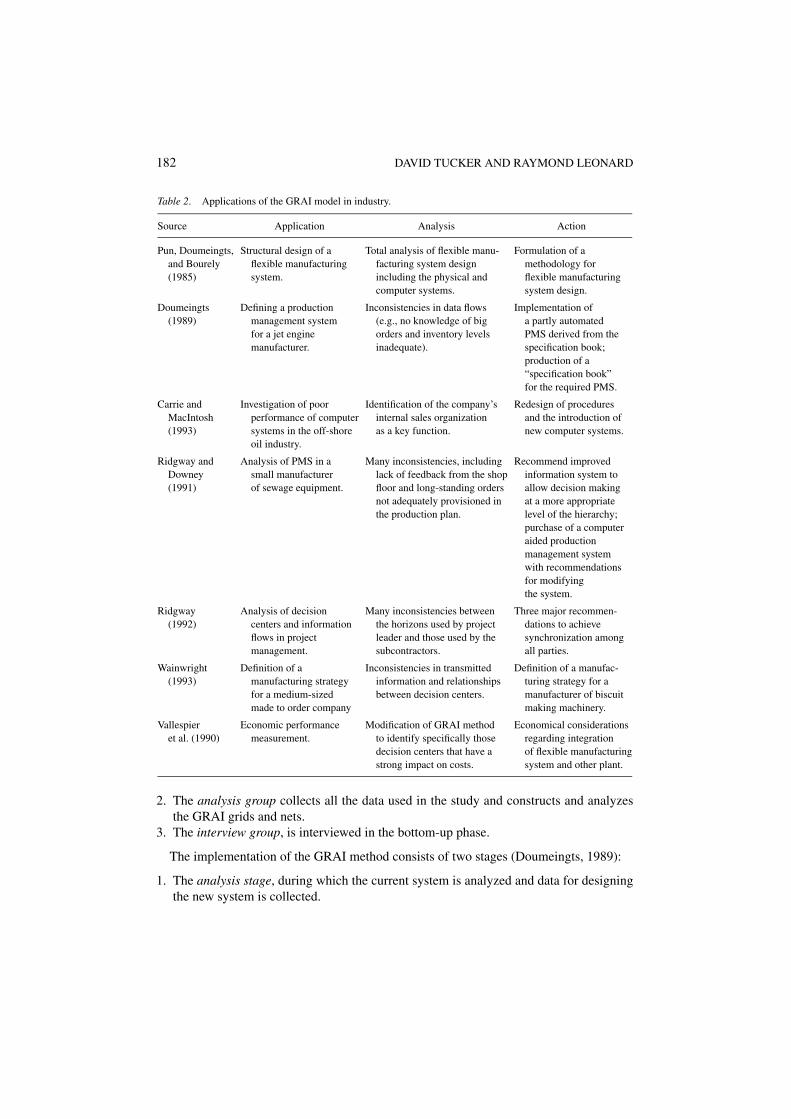
The GRAI (Graphe a Resultats et Activites Interlies) model is based on the theories ofcomplex systems (Doumeingts, 1985). Originally developed to design production manage-ment systems, the GRAI model has been used where coordination among different groupsis required (table 2).
The conceptual GRAI model views an organization as consisting of three interrelatedsubsystems. The physical subsystem consists of the physical means of production, such aspeople, machines, and materials. The decision subsystem is split into a number of decision-making levels, each containing one or more decision centers. The information subsystemprovides the link between the decision and physical levels (Vallespir et al., 1990).
The structured approach to the construction of a GRAI model requires the participationof three groups (Doumeingts, 1989):
1. The synthesis group is composed of the main users of the system. This group followsthe progress of the study and checks the results at each stage. Its suggestions and ideasshould guide the design of the system.
182 DAVID TUCKER AND RAYMOND LEONARD
Table 2. Applications of the GRAI model in industry.
Source Application Analysis Action
Pun, Doumeingts, Structural design of a Total analysis of flexible manu- Formulation of aand Bourely flexible manufacturing facturing system design methodology for(1985) system. including the physical and flexible manufacturing
computer systems. system design.
Doumeingts Defining a production Inconsistencies in data flows Implementation of(1989) management system (e.g., no knowledge of big a partly automated
for a jet engine orders and inventory levels PMS derived from themanufacturer. inadequate). specification book;
production of a“specification book”for the required PMS.
Carrie and Investigation of poor Identification of the company’s Redesign of proceduresMacIntosh performance of computer internal sales organization and the introduction of(1993) systems in the off-shore as a key function. new computer systems.
oil industry.
Ridgway and Analysis of PMS in a Many inconsistencies, including Recommend improvedDowney small manufacturer lack of feedback from the shop information system to(1991) of sewage equipment. floor and long-standing orders allow decision making
not adequately provisioned in at a more appropriatethe production plan. level of the hierarchy;
purchase of a computeraided productionmanagement systemwith recommendationsfor modifyingthe system.
Ridgway Analysis of decision Many inconsistencies between Three major recommen-(1992) centers and information the horizons used by project dations to achieve
flows in project leader and those used by the synchronization amongmanagement. subcontractors. all parties.
Wainwright Definition of a Inconsistencies in transmitted Definition of a manufac-(1993) manufacturing strategy information and relationships turing strategy for a
for a medium-sized between decision centers. manufacturer of biscuitmade to order company making machinery.
Vallespier Economic performance Modification of GRAI method Economical considerationset al. (1990) measurement. to identify specifically those regarding integration
decision centers that have a of flexible manufacturingstrong impact on costs. system and other plant.
2. The analysis group collects all the data used in the study and constructs and analyzesthe GRAI grids and nets.
3. The interview group, is interviewed in the bottom-up phase.
The implementation of the GRAI method consists of two stages (Doumeingts, 1989):
1. The analysis stage, during which the current system is analyzed and data for designingthe new system is collected.
USING GRAI METHODOLOGY FOR NEW PRODUCT INTRODUCTION 183
2. The design stage, when inconsistencies between the current and the ideal system areidentified. Information gathered during the analysis division is used to design the newsystem.
The GRAI method provides a dynamic model of an organization by focusing on decisionmaking and decision communication. The method supports enterprise analysis (Wortman,1993) but has been criticized for not dealing with the technological, financial, and economicfeasibility of any proposed reorganization and for not making reference to corporate strategy(Wu, 1994).
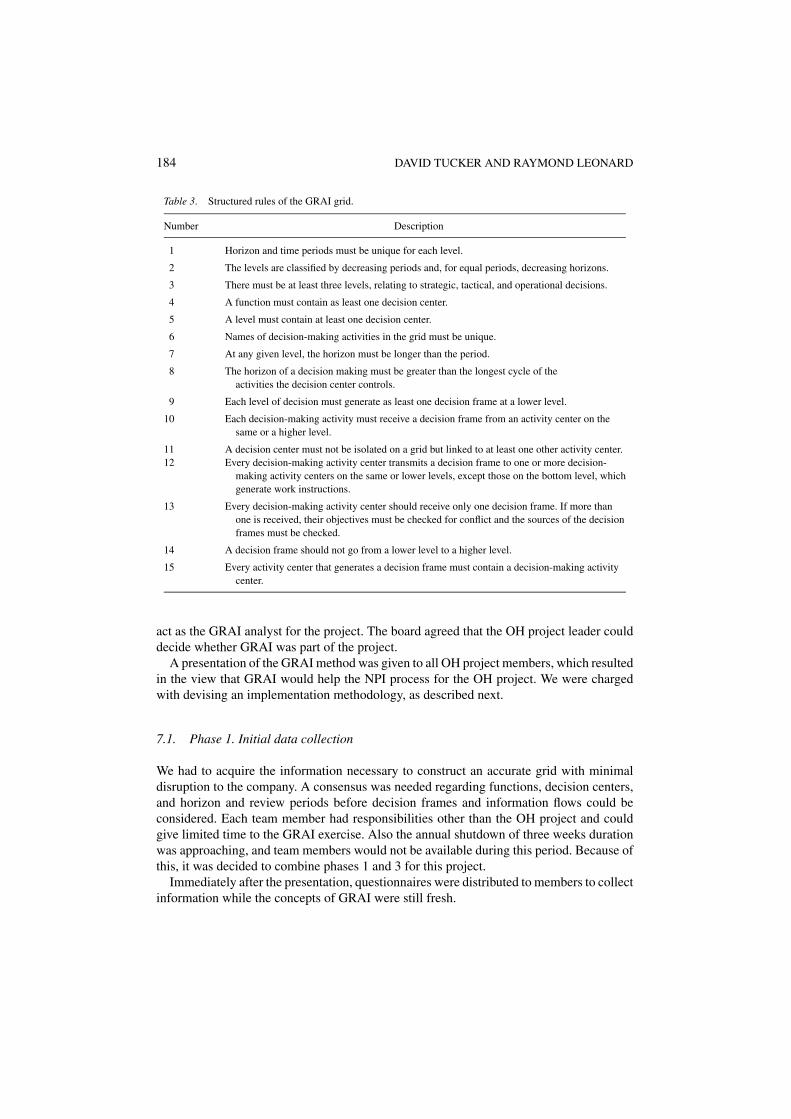
The analysis group uses the information from the analysis phase to construct the GRAIgrid. Inconsistencies in the transmission of information are detected by a structured set ofrules (table 3) and fall into three main categories (Doumeingts, 1989):
1. The transmission of information.2. Inconsistencies specific to a decision center.3. Coordination among decision centers.
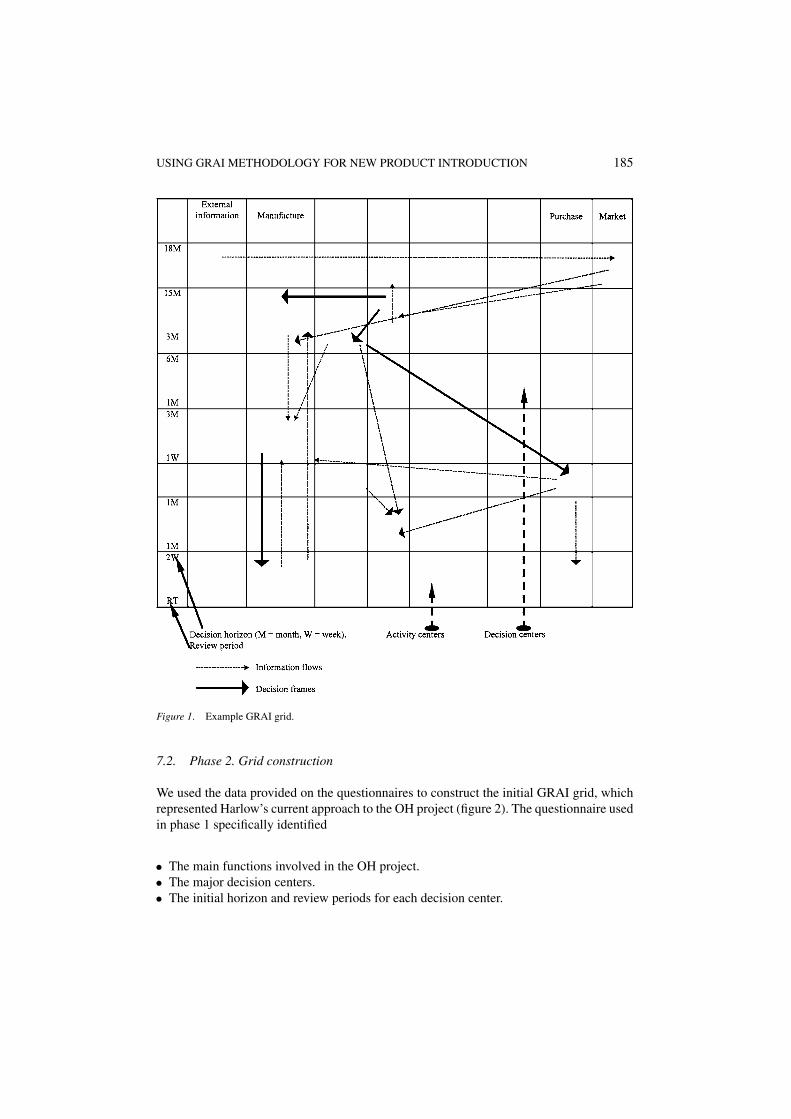
The construction of the GRAI grid commences in a top-down manner by first identifyingthe major functions undertaken in the NPI process. These functions form the first row of theGRAI grid. The cells, at the intersection of each row and column, are the decision centers,which form the core of the GRAI analysis method. Each decision center transmits one ormore decision frames to other centers on the grid. A decision frame specifies such factors asresources, responsibility, and expected action. Entering each decision center are one or moreinformation flows, which are the basis of the decision frame. These information flows canoriginate from outside the organization, such as customer requirements for new products,or from inside the organization, such as bills of materials or production schedules. Eachdecision center is allocated a horizon, that period of time during which the decision frameis deemed to be valid. Each center also is allocated a review period, that period of timeafter which the decision frame is checked for validity (figure 1). Once the GRAI grid hasbeen constructed, the structured rules are applied and inconsistencies in the NPI processidentified (Ridgway, 1992).
Having constructed the GRAI grid, the bottom-up phase of the analysis examines the wayin which individual decision centers are structured. This analysis is achieved by creatingGRAI nets (Wainwright, 1993) and the use of a set of structured rules (table 3).
7. Implementation methodology
The GRAI model was unfamiliar to the Harlow organization, introduced to the directors bya presentation. The directors’ initial reaction was that GRAI was applicable to organizationslarger than Harlow. We cited case studies in companies similar to Harlow and the positiveresults reported. We, therefore, suggested that the OH project, recently instigated by thecompany, seemed ideal for utilizing the GRAI model. There was some company concern thatthe GRAI method might cause more disruption than assistance. So, one of us volunteered to
184 DAVID TUCKER AND RAYMOND LEONARD
Table 3. Structured rules of the GRAI grid.
Number Description
1 Horizon and time periods must be unique for each level.
2 The levels are classified by decreasing periods and, for equal periods, decreasing horizons.
3 There must be at least three levels, relating to strategic, tactical, and operational decisions.
4 A function must contain as least one decision center.
5 A level must contain at least one decision center.
6 Names of decision-making activities in the grid must be unique.
7 At any given level, the horizon must be longer than the period.
8 The horizon of a decision making must be greater than the longest cycle of theactivities the decision center controls.
9 Each level of decision must generate as least one decision frame at a lower level.
10 Each decision-making activity must receive a decision frame from an activity center on thesame or a higher level.
11 A decision center must not be isolated on a grid but linked to at least one other activity center.12 Every decision-making activity center transmits a decision frame to one or more decision-
making activity centers on the same or lower levels, except those on the bottom level, whichgenerate work instructions.
13 Every decision-making activity center should receive only one decision frame. If more thanone is received, their objectives must be checked for conflict and the sources of the decisionframes must be checked.
14 A decision frame should not go from a lower level to a higher level.
15 Every activity center that generates a decision frame must contain a decision-making activitycenter.
act as the GRAI analyst for the project. The board agreed that the OH project leader coulddecide whether GRAI was part of the project.
A presentation of the GRAI method was given to all OH project members, which resultedin the view that GRAI would help the NPI process for the OH project. We were chargedwith devising an implementation methodology, as described next.
7.1. Phase 1. Initial data collection
We had to acquire the information necessary to construct an accurate grid with minimaldisruption to the company. A consensus was needed regarding functions, decision centers,and horizon and review periods before decision frames and information flows could beconsidered. Each team member had responsibilities other than the OH project and couldgive limited time to the GRAI exercise. Also the annual shutdown of three weeks durationwas approaching, and team members would not be available during this period. Because ofthis, it was decided to combine phases 1 and 3 for this project.
Immediately after the presentation, questionnaires were distributed to members to collectinformation while the concepts of GRAI were still fresh.
USING GRAI METHODOLOGY FOR NEW PRODUCT INTRODUCTION 185
Figure 1. Example GRAI grid.
7.2. Phase 2. Grid construction
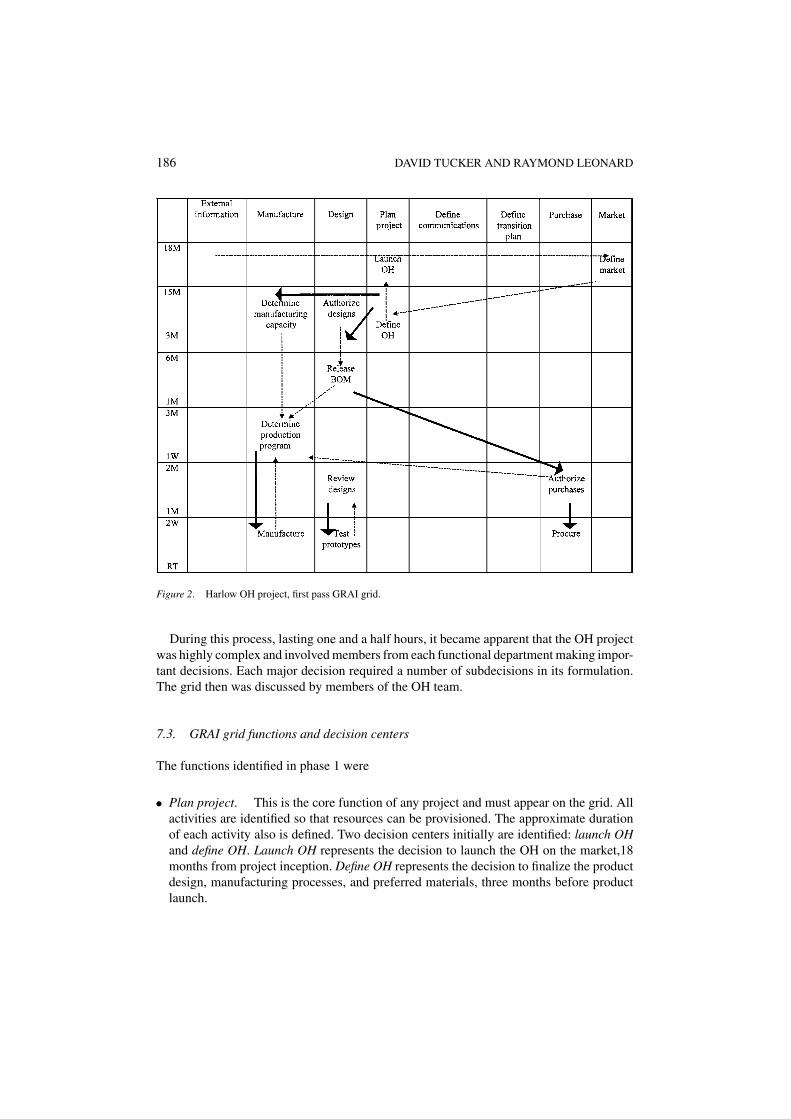
We used the data provided on the questionnaires to construct the initial GRAI grid, whichrepresented Harlow’s current approach to the OH project (figure 2). The questionnaire usedin phase 1 specifically identified
• The main functions involved in the OH project.• The major decision centers.• The initial horizon and review periods for each decision center.
186 DAVID TUCKER AND RAYMOND LEONARD
Figure 2. Harlow OH project, first pass GRAI grid.
During this process, lasting one and a half hours, it became apparent that the OH projectwas highly complex and involved members from each functional department making impor-tant decisions. Each major decision required a number of subdecisions in its formulation.The grid then was discussed by members of the OH team.
7.3. GRAI grid functions and decision centers
The functions identified in phase 1 were
• Plan project. This is the core function of any project and must appear on the grid. Allactivities are identified so that resources can be provisioned. The approximate durationof each activity also is defined. Two decision centers initially are identified: launch OHand define OH. Launch OH represents the decision to launch the OH on the market,18months from project inception. Define OH represents the decision to finalize the productdesign, manufacturing processes, and preferred materials, three months before productlaunch.
USING GRAI METHODOLOGY FOR NEW PRODUCT INTRODUCTION 187
• Design. This function relates to the conceptual and physical design processes. The de-cision center authorize designs represents the finalization of design work relating to theproject, with design modifications reviewed once every month. A 15-month horizon wasfixed (i.e., any change to this period implies a delay to product launch). The decisioncenter release BOM relates to the issuing of bill of materials for material procurementand production planning. BOM information is reviewed every month using informationgenerated in the authorize designs decision center. The six-month horizon represents theneed to complete BOM generation six months ahead of final design. The decision centerreview designs represents the review period relating to the decision center release BOM.Review design controls the activity center test prototypes, which is undertaken in realtime. A horizon of two weeks represents the biweekly progress report given the designmanager.
• Manufacture. This function relates to the physical activities involved in manufacturingand assembling the OH. The decision center determine manufacturing capacity has a fixedhorizon of 15 months, with changes to capacity reviewed every 3 months. Informationflows from the decision center determine manufacturing capacity into the decision centerdetermine production program, which represents the review period relating to determinemanufacturing capacity. This decision center controls the physical activity manufac-ture. Progress reports are generated every two weeks and transmitted to the productionmanager.
• Purchase. This function relates to the procurement of raw materials for the OH. Initially,one decision center, authorize purchases, was identified. Purchase decisions relating tothe following two months (horizon) were reviewed every month (review period). Thedecision regarding what to purchase was determined within the release BOM decisioncenter.
• Market. This function relates to the marketing activities of intelligence gathering andmarketing strategy formulation. Only one decision center, define market, was identified.The horizon of 18 months means that the decision regarding marketing strategy was tobe made in advance of project inception.
7.4. Phase 3. Grid analysis
Data analysis. Having constructed the grid, the data are analyzed. This reveals a numberof inconsistencies with the structure of the decisional subsystem:
1. The functions define communications and define transition plan have no decision centers,but two managers are allocated these tasks. We realized that the construction and analysisof the GRAI grid would perform these functions, so an immediate benefit was realizedin the release of the two managers to other tasks.
2. The decision center release BOM received no decision frames, so the decision centerauthorize designs acts concurrently with release BOM. This ensures consistency betweenthe current level of release of the engineering drawings and the current release of BOMrelating to the drawings. Furthermore, it is illogical to finalize BOM information ninemonths before designs are finalized, as design changes usually require BOM changes.
188 DAVID TUCKER AND RAYMOND LEONARD
A decision therefore is taken to combine the decision centers.3. The decision center determine manufacturing capacity transmitted no decision frames
and was an oversight in the initial data collection phase. An activity center, commis-sion manufacture, was added to the grid, which was controlled by the decision centerdetermine manufacturing capacity.
Synthesis group analysis. Discussion within the synthesis group revealed many problemsrelating to the coordination of functional elements:
1. The project team reports to the “top team,” the Harlow directors. The team membersexpress concern that the top team is making marketing decisions regarding existingproducts without communicating this to the project team. This results in a distortion ofmanufacturing capacity figures, with inaccurate delivery times quoted to Harlow cus-tomers. The problem was overcome by adding an information flow on the grid betweenthe Harlow top team and the OH team. A decision horizon and review periods are se-lected to ensure that changes which would effect production capacity for the OH wouldreach the OH team in advance, and operational decisions could be taken.
2. The initial grid showed no obvious focal point for coordinating all the activities in theproject. This problem was addressed by adding a further decision center, progress review,within the planning function. The horizon and review periods were set at one month,representing a monthly meeting of the complete OH team.
3. No information flow existed from the decision center determine manufacturing capacityto the decision center define market requirements; hence, sales forecasts were consideredonly at the strategic planning stage and could be out of date.
4. No feedback occurred from the decision center purchase material to the decision centerdesign review. Hence, information regarding purchase lead times for raw materials wasnot available at the progress review.
5. The decision center review designs has a horizon of two months, but the informationgenerated is acted on every two weeks in the decision center test prototypes. Hence,superfluous effort is expended, acting on information that had not been updated.
6. Reports regarding plant procurement and machinery commissioning are prepared everytwo weeks but used every three months in the determine manufacturing capacity decisioncenter. It was decided to coordinate these activities by producing only monthly reports,in time for the monthly capacity meeting. Hence, the time spent on producing unwantedreports is eliminated.
7. Reports are produced by the test prototypes activity center but used only bimonthly in thereview designs decision center. It was decided that test reports should be reviewed oncea month, and the review period for review designs was changed accordingly. A furtherbenefit is that the reports produced by the review designs decision center are coordinatedwith the progress review decision center.
8. Because of difficulties relating to the procurement of new raw materials, it was decidedto review progress every two weeks rather than every month. This resulted in the additionof a further row on the grid.
USING GRAI METHODOLOGY FOR NEW PRODUCT INTRODUCTION 189
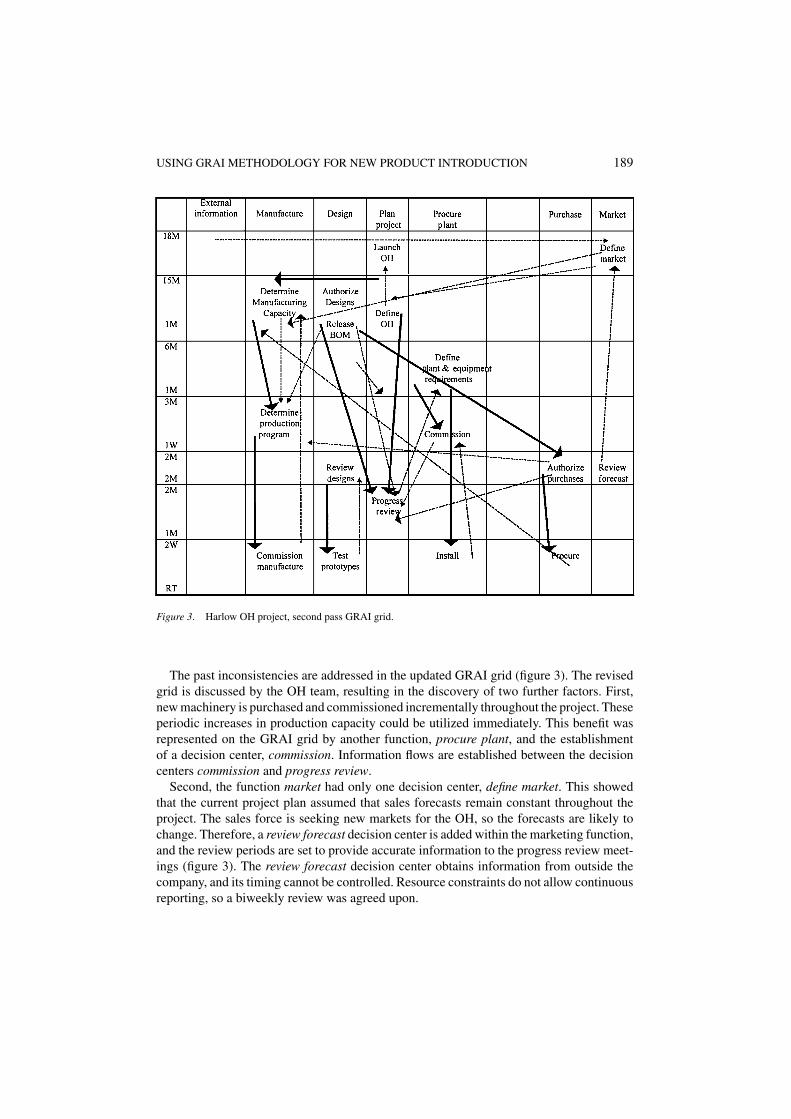
Figure 3. Harlow OH project, second pass GRAI grid.
The past inconsistencies are addressed in the updated GRAI grid (figure 3). The revisedgrid is discussed by the OH team, resulting in the discovery of two further factors. First,new machinery is purchased and commissioned incrementally throughout the project. Theseperiodic increases in production capacity could be utilized immediately. This benefit wasrepresented on the GRAI grid by another function, procure plant, and the establishmentof a decision center, commission. Information flows are established between the decisioncenters commission and progress review.
Second, the function market had only one decision center, define market. This showedthat the current project plan assumed that sales forecasts remain constant throughout theproject. The sales force is seeking new markets for the OH, so the forecasts are likely tochange. Therefore, a review forecast decision center is added within the marketing function,and the review periods are set to provide accurate information to the progress review meet-ings (figure 3). The review forecast decision center obtains information from outside thecompany, and its timing cannot be controlled. Resource constraints do not allow continuousreporting, so a biweekly review was agreed upon.
190 DAVID TUCKER AND RAYMOND LEONARD
7.5. Translating the grid into action plans
The agreed-on GRAI grid has to be translated into operational activities. Decision centersare implemented, via progress meetings, at times that correspond to the horizon periodpertaining to the decision level in which each decision center resided. Decision frames areimplemented via operational procedures issued from decision centers. Issues of operatingprocedures are in alignment with the review period of the corresponding decision center.Information feedback is in the form of activity reports, transmitted to the decision centers,as determined by the review period for the decision center controlling the individual activitycenters. Reports are prepared during the week in which the relevant review meeting is held.This ensures that reports contain current information.
8. Findings
This paper describes the use of the GRAI grid to improve the coordination of activities duringthe development of the Harlow OH project. The aim had been to establish the validity ofthe model in a manufacturing situation and provide information that would enable the OHproject group to improve coordination among functional units, thereby ensuring the newproduct is launched on time. Many parts of the company were unaware of the strategicsignificance of the project and tended not to give it a high priority. An additional problemwas that the company was attempting to introduce the OH in the traditional, sequentialmanner, which required numerous product changes. The lack of coordination inherent inthe sequential approach means that crucial decisions pertaining to the introduction of theOH are taken unilaterally by each department. The challenge was to enable Harlow toensure that future decisions are made by consensus. The mechanism for achieving this wasthe novel implementation framework, based on the GRAI grid, as described in this paper.
The mission for the company in this NPI undertaking is defined in a Marketing Departmentdocument that identified 10 essential features of the OH project. That document becamethe decision frame, flowing from the define OH decision center (figure 3), and, thus, thefocus of the entire project. The decision center progress review is used to ensure that themarket requirements are paramount in the design of OH. The importance of this decisioncenter immediately is apparent from a brief look as the GRAI grid, which shows numerousinformation flows and decision frames flowing through it.
The use of the GRAI grid, within the implementation framework, brought about sub-stantial changes to the OH project. First, the lack of communication between the top teamand the OH team caused concern to several senior managers for some time, but the prob-lem never was discussed formally. This omission caused conflict within Harlow as well asadversely affected customer delivery dates. The group discussion surrounding the originalGRAI grid (figure 2) ensured formal recognition of the problem and became the catalyst todefine an effective solution.
Second, the application of the GRAI grid led directly to establishment of the progressreview decision center. This decision center proved critical to the success of the wholeproject. For the progress review meetings to be effective, the timing of information flowsinto and out of the decision center had to be coordinated with the one month review period
USING GRAI METHODOLOGY FOR NEW PRODUCT INTRODUCTION 191
ascribed it. Similarly, the decisions from the decision center had to be acted on on a timelybasis, and the result of those actions needed to be monitored. The ability of the GRAI gridto model timing aspects of decisions and actions proved indispensable.
Third, the GRAI grid enabled identifying of the originators of decision frames and infor-mation flows, making it possible to accurately establish the composition of each progressreview meeting. GRAI rules are invaluable for defining appropriate horizon and reviewperiods for each decision level.
Fourth, as each iteration of the GRAI grid was studied by the synthesis team, the modelbecame more refined and detailed than its predecessor. This reflected the continuing changeof state of the project team. Initially, the team was functionally oriented, and so coordina-tion among elements was poor. Gradually, the orientation of team members shifted, andcoordination among elements increased substantially. The inclusion of the review forecastdecision center, within the marketing function and the addition of the procure plant functionprovided the basis for far greater coordination between the Manufacturing and Sales De-partments than had been attainable. The facility of the GRAI grid to explicitly show timinginformation is instrumental in achieving suitable horizon and review periods. This enabledthe sales force to take orders for the OH, confident that the manufacturing capacity couldfulfill the orders.
A further major benefit is achieved through the review forecast decision center. The inclu-sion of this decision center provides an important link between Harlow and its customers.Although this link already existed, the GRAI grid could incorporate timing aspects of deci-sion making. This ensured that information flowing through this external link was availableon a timely basis at the progress review meetings, whereas previously this information oftenwas out of date.
The major benefits to accrue to the OH project can be summarized as
• Improved coordination among functional elements.• Improved alignment between the needs of the environment and the NPI process.• Better dissemination of information throughout the organization.• Companywide focus on strategic objectives.• Concentration of resources on strategic objectives.• Adherence to time scales.
9. Concluding remarks
The GRAI grid does not offer solutions to all the problems inherent in the sequentialapproach to new product introduction, but a well-constructed grid provides a holistic per-spective and a framework for discussions among different departments. The data capturedin the grid describe the NPI process as seen from the perspective of each participant. Thus,the grid reveals inconsistencies in the transmission of decision frames and information flowsthroughout the organization.
Typically, the different perceptions of team members can lead to conflict, which is harmfulto the NPI process. Using the novel approach to the NPI process described in this paper,such perceptions are dealt with in a positive way. Using a GRAI grid as the focal point,
192 DAVID TUCKER AND RAYMOND LEONARD
the chance of establishing practices consistent with the long-term strategic objectives of thecompany are increased. Without such a framework, the resolution of conflict is likely to be along process, because dominant team members usually gain acquiescence from others. Theinformation depicted on the grid helps indicate areas of the organization that suffer frompoor coordination. Therefore, the GRAI grid provides the framework for the successfulimplementation of a concurrent NPI process and steers divergent functional aims towardthe objectives of the company. Although this initially may seem to reduce the efficiency ofindividual functional areas, the overall effect is to increase the effectiveness of the wholeorganization.
The OH was launched 11 months ahead of schedule. Therefore, Harlow enjoyed 11months additional revenue, which otherwise might have been lost to competitors. Addi-tionally, the greater efficiency of the NPI process, which resulted from the adoption of theapproach described in this paper, secured a significant reduction in NPI development costs.
References
Allen, T. J., Managing the Flow of Technology, MIT Press, Cambridge, MA (1985).Carrie, A. S. and MacIntosh, R., “Improving Integration in Manufacturing Systems,” in Advances in Production
Management Systems (B-13), I. A. Pappas and E. Tatsiopoulos (Eds.), pp. 161–168, Elsevier Science PublishersB.V., Amsterdam (1993).
Child, J., Organisation: A Guide to Problems and Practice, Harper and Row, London (1984).Doumeingts, G., “How to Decentralise Decisions Through GRAI Model in Production Management,” Computers
in Industry, No. 6, pp. 501–514 (1985).Doumeingts, G., “GRAI Approach to Designing and Controlling Advanced Manufacturing Systems in CIM
Environment,” Advanced Information Technologies for Industrial Material Flow Systems, S. Y. Nof and C. L.Moodie (Eds.), pp. 461–529, NATO ASI Series, Springer-Verlag, Berlin (1989).
Hartley, J. R., Concurrent Engineering: Shortening Lead Times, Raising Quality, and Lowering Costs, ProductivityPress, Cambridge, MA (1992).
Lawrence, P. R. and Lorsch, J. W., Organization and Environment: Managing Differentiation and Integration,Harvard Business School Press, Boston, MA (1986).
Longenecker, J. G. and Pringle, C. D., Management, Charles E. Merrill, Columbus, OH (1984).Mintzberg, H., The Structuring of Organizations, Prentice-Hall, Englewood Cliffs, NJ (1979).Paper, D., “The Enterprise Transformation Paradigm: The Case of Honywell’s Industrial Automation and Control
Unit,” Journal of Information Technology Cases and Applications, Vol 1, No. 1, pp. 4–23 (1999).Pun, L., Doumeingts, G., and Bourely, S., “The GRAI Approach to the Structural Design of Flexible Manufacturing
Systems,” International Journal of Production Research, Vol. 23, No.6, pp. 1197–1215 (1985).Ridgway, K., “Analysis of Decision Centres and Information Flow in Project Management,” International Journal
of Project Management, Vol 10, No.3, pp. 145–152 (1992).Ridgway, K. and Downey, S., “A Graphical Technique for Planning the Introduction of AMT: The GRAI Method,”
in Integration and Management of Technology for Manufacturing, E. H. Robson, H. M. Ryan, and D. Wilcock,(Eds.), IEE Management of Technology Series, Peter Pereginus Ltd., Stevenage UK (1991).
Simon, H. A., The New Science of Management Decisions, Prentice-Hall, Englewood Cliffs, NJ (1977).Stoner, J. A. F., Management, Prentice-Hall, Englewood Cliffs, NJ (1982).Tucker, D. E. and Leonard, R., “People and IT Implications of Adopting Concurrent Engineering Philosophies,”
in: Advances in Manufacturing Technology VII, A. Bramley and T. Mileham (Eds.), Bath University Press, Bath,England, pp. 292–295 (1993).
Tucker, D. E. and Leonard, R., “Overcoming the Cultural Barriers to Implementing Concurrent Engineering,”in Advances in Agile Manufacturing, P. T. Kidd and W. Karwowski (Eds.), IOS Press, Amsterdam, pp. 67–70(1994).
Vallespir, B., Doumeingts, M., Bitton, M., and Zanettin, M., “GRAI Method and Economic Performance Mea-surement System,” in Optimisation of Manufacturing Systems Design, D. L. Shunk (Ed.), pp. 149–170, Elsevier

USING GRAI METHODOLOGY FOR NEW PRODUCT INTRODUCTION 193
Science Publishers B.V., Amsterdam (1990).Wainwright, C. E. R., “Considerations Relating to the Formulation of Manufacturing Strategies,” Ph.D. thesis,
University of Manchester, Institute of Science and Technology (1993).Winner, R. I., Pennell, J. P., Bertrand, H. E., and Slusarezuk, M. M. G., “The Role of Concurrent Engineering in
Weapons System Acquisition,” IDA Report R-338, Institute for Defense Analyses, Alexandria, VA (1988).Wortman, J. C., “Enterprise Modelling: Purpose and Means,” in: Advances in Production Management Systems,
(B-13), pp. 613–623, Elsevier Science Publishers B.V., Amsterdam (1993).Wu, B., Manufacturing Systems Design and Analysis, Chapman and Hall, London (1992).