Embed Size (px)
Citation preview
NISTIR 8089
An Industrial Control System
Cybersecurity Performance Testbed
Richard Candell
Timothy Zimmerman
Keith Stouffer
This publication is available free of charge from:
http://dx.doi.org/10.6028/NIST.IR.8089

NISTIR 8089
An Industrial Control System
Cybersecurity Performance Testbed
Richard Candell
Timothy Zimmerman
Keith Stouffer
Intelligent System Division
Engineering Laboratory
This publication is available free of charge from:
http://dx.doi.org/10.6028/NIST.IR.8089
November 2015
U.S. Department of Commerce Penny Pritzker, Secretary
National Institute of Standards and Technology
Willie May, Under Secretary of Commerce for Standards and Technology and Director


i
Table of Contents 1 Introduction .......................................................................................................................................... 1
2 Testbed Design Approach ..................................................................................................................... 2
3 Testbed Design ...................................................................................................................................... 3
3.1 Tennessee Eastman Process ......................................................................................................... 3
3.1.1 Tennessee Eastman Process: Analog Simulation .................................................................. 3
3.1.1.1 Tennessee Eastman Process: C++ Derivative .................................................................... 5
3.1.2 Testbed Enclave: Hardware-in-the-Loop Simulator .............................................................. 5
3.1.2.1 Logical Architecture .......................................................................................................... 5
3.1.2.2 Physical Architecture ........................................................................................................ 7
3.1.2.3 TE Plant Software Architecture ......................................................................................... 7
3.1.2.4 TE Controller Software Architecture ................................................................................. 8
3.1.2.5 Theory of Operation .......................................................................................................... 9
3.1.3 Process Control with Faster Dynamics .................................................................................. 9
3.2 Cooperative Robotic Assembly for Smart Manufacturing .......................................................... 10
3.2.1 Computing Rack Design ...................................................................................................... 11
3.2.2 Mechanical Design .............................................................................................................. 11
3.2.2.1 Robot End-Effector .......................................................................................................... 11
3.2.3 Receptacle for Machining Stations ..................................................................................... 12
3.2.3.1 Robot Assembly Table ..................................................................................................... 12
3.2.4 Emergency Stop Operation ................................................................................................. 13
3.2.5 Software Architecture ......................................................................................................... 14
3.2.5.1 Control Layer ................................................................................................................... 14
3.2.5.2 PLC I/O Layer ................................................................................................................... 15
3.2.5.3 ROS Bags ......................................................................................................................... 15
3.2.5.4 ROS versus ROS Industrial ............................................................................................... 15
3.2.5.5 Theory of Operation ........................................................................................................ 15
3.2.6 Final Assembly ..................................................................................................................... 16
3.3 Third Enclave Concepts ............................................................................................................... 16
3.3.1 Intelligent Transportation System ...................................................................................... 16
3.3.2 Wide-area Networks with SCADA ....................................................................................... 16
ii
3.4 Measurement Data Collection .................................................................................................... 17
3.5 Attack Computers ....................................................................................................................... 18
3.5.1 Laptop Computer ................................................................................................................ 18
3.5.2 Ixia Traffic Generator .......................................................................................................... 18
3.5.3 Traffic Manipulation Server ................................................................................................ 18
3.5.4 ROS Replay using Bags ........................................................................................................ 19
4 Performance Metrics .......................................................................................................................... 19
5 ISA-99 Security .................................................................................................................................... 20
6 Conclusions ......................................................................................................................................... 21
7 Bibliography ........................................................................................................................................ 21
8 Appendix ............................................................................................................................................. 23
8.1 Glossary ....................................................................................................................................... 23
8.2 Testbed Network Architecture ................................................................................................... 25
8.3 Industrial Control Metrics ........................................................................................................... 26
8.4 NIST-SP 800-82 Security Overlay................................................................................................. 29
8.5 ISA/IEC-62443-3-3 Security Requirements ................................................................................. 29
8.6 Tennessee Eastman Simulation Case Study ................................................................................ 34
8.6.1 Description of the Simulation ............................................................................................. 34
8.6.2 Discussion of the Results ..................................................................................................... 35
8.6.3 Conclusions and Recommendations ................................................................................... 47

iii
List of Tables
Table 1. Traffic Manipulation Tools for Linux ............................................................................................ 18
Table 2. Categories of Industrial Processes ............................................................................................... 19
Table 3. List of Terms ................................................................................................................................. 23
Table 4. Performance Metrics for Continuous Processes .......................................................................... 26
Table 5. Performance Metrics for Discrete Processes ............................................................................... 26
Table 6. Metrics for Measuring System Performance ............................................................................... 27
Table 7. Nominal System Properties for Measuring System Performance ................................................ 27
Table 8. Metrics for Measuring Network Performance ............................................................................. 28
Table 9. ISA/IEC-62443-3-3 Requirements to Security Level Mapping ...................................................... 29
Table 10. Metrics Types Collected from the TE Simulation ....................................................................... 35
Table 11. Listing of the METRICS Table in the Results Database ............................................................... 36
iv
Table of Figures
Figure 1. Tennessee Eastman PROCESS MODEL .......................................................................................... 4
Figure 2. TE Process Enclave Network Diagram ........................................................................................... 6
Figure 3. TE Simulator Physical Architecture Deployment .......................................................................... 7
Figure 4. Software Architecture used for Communications between TE Plant and OPC............................. 8
Figure 5. Software Architecture used for OPC Communications with the Controller ................................. 9
Figure 6. Robotic Assembly System Network Diagram .............................................................................. 10
Figure 7. Robotics Enclave Rack View ........................................................................................................ 11
Figure 8. Spherical object end-effector for robotic enclave. ..................................................................... 12
Figure 9. Spherical part receptacle for machining station ......................................................................... 12
Figure 10. Robotic Assembly Table ............................................................................................................ 13
Figure 11. Emergency Stop Circuit ............................................................................................................. 13
Figure 12. Robotics Enclave Node Level Software Architecture ................................................................ 14
Figure 13. Fully assembled discrete manufacturing robotics enclave. ...................................................... 16
Figure 14. Measurement Enclave Rack Deployment ................................................................................. 17
Figure 15. ISA/IEC-62443 Organization of Standards Documents ............................................................. 20
Figure 16. System Context for the Tennessee Eastman Enclave ............................................................... 25
Figure 17. Tennessee Eastman Simulation Architecture using a Gilbert-Elliot Channel Model ................ 34
Figure 18. Simple Gilbert Channel Model for a Generic Network Device .................................................. 35
Figure 19. Reactor Pressure Metrics for All Disturbances ......................................................................... 41
Figure 20. Standard Deviation of the Maximum Reactor Pressure Deviation for All Disturbances .......... 43
Figure 21. Product Quality Metrics for All Disturbances ........................................................................... 44
Figure 22. Operating Cost Metric for All Disturbances .............................................................................. 45
Figure 23. Deviation of Operating Cost from Baseline .............................................................................. 46
1 of 49
1 Introduction The National Institute of Standards and Technology (NIST) is developing a cybersecurity
performance testbed for industrial control systems. 1 The goal of the testbed is to measure the
performance of industrial control systems (ICS) when instrumented with cybersecurity protections in
accordance with the best practices and requirements prescribed by national and international standards
and guidelines. Examples of such standards and guidelines include ISA/IEC-62443 and NIST Special
Publication 800-82 [1].
The purpose of the testbed is to emulate real-world industrial systems as closely as possible
without replicating an entire plant or assembly system. The testbed simulates a variety of industrial
scenarios that include processes with slow dynamics and others with fast dynamics. Classification of faster
versus slow is a relative determination and depends on the type of measurements being made. A slow
process is one in which changes to state occur gradually over time. Processes with fast dynamics will
exhibit a noticeable change of state soon after the system is perturbed.
Various industrial protocols are employed throughout the testbed including IP-routable and non-
IP-routable protocols. Routable protocols include Internet Protocol (IP)-based protocols (e.g.,
Transmission Control Protocol (TCP) and User Datagram Protocol (UDP)) as well as industrial application
layer protocols (e.g., EtherNet/IP, Open Platform Communication (OPC), and Modbus/TCP).
Non-IP-routable protocols include legacy fieldbus protocols, such as DeviceNet. The use of non-
routable protocols allows a deeper investigation of cybersecurity with fieldbus protocols and the
controllers that make use of them; however, it was determined during the NIST Road mapping Workshop
on Industrial Control Systems Cybersecurity that non-routable protocols were of lower priority than
routable protocols. Non-routable protocols were designed to be open conduits for data flow; they were
not designed for secure communications. It is unlikely that these types of legacy protocols will be
modified to include security protections such as authentication and encryption. This design “limitation”
makes these protocols good candidates for perimeter-based security mechanisms.
Each industrial scenario is a separate enclave within the testbed, as shown in Figure 16. The first
of these scenarios is the Tennessee Eastman (TE) problem presented by Downs and Vogel [2], which is a
well-known control systems problem in chemical process manufacturing. The TE problem is an ideal
candidate for cybersecurity investigation because it is an open-loop unstable process and requires closed-
loop control to maintain process stability and optimize operating costs. The TE process can be considered
a process with slow dynamics in relation to the information update rate of the control network. These
slow dynamics enable an adversarial agent to compromise the control infrastructure and remain
undetected for a significant duration. Attacks that actively evade detection (stealth attacks) or attacks
that exploit specific dynamic properties of the system (geometric attacks) [3] are particularly effective
against the TE process.
1 Disclaimer: Certain commercial equipment, instruments, or materials are identified in this paper in order to specify the experimental procedure adequately. Such identification is not intended to imply recommendation or endorsement by the National Institute of Standards and Technology, nor is it intended to imply that the materials or equipment identified are necessarily the best available for the purpose.

2 of 49
The second scenario is a robotic assembly system in which industrial robots work together
cooperatively to accomplish the task of moving parts through a simulated manufacturing operation. The
robots work cooperatively according to a plan that changes dynamically based on process feedback. The
robotic enclave includes two small industrial grade robots and a supervisory Programmable Logic
Controller (PLC) with safety processing.
The third enclave will be designed by Vanderbilt University under a cooperative research
agreement with NIST. Several concepts were proposed for the third enclave including a pipeline network
with a wide area network Supervisory Control and Data Acquisition (SCADA) infrastructure and an
intelligent transportation system with distributed infrastructure control. A wide area network would
complement the local area network scenarios covered by the other two enclaves.
2 Testbed Design Approach Industrial control systems (ICS) can be classified as networks that include process control systems,
robotic manufacturing systems, home and office building automation systems, intelligent transportation
systems, advanced aircraft, and spacecraft [1]. These types of networks are often composed of numerous
interconnected devices with centralized or decentralized control depending on the application. Modern
requirements of modularity, decentralization, ease of maintenance, and lower operational costs have
driven designers of network control systems toward the adoption of routable data communications
protocols traditionally found in home and office environments, such as Ethernet (IEEE 802.3) and Wi-Fi
(802.11). With this change, industrial control systems security has become increasingly important.
Traditional information technology (IT) security policies focus primarily on confidentiality with network
availability being least important. In contrast, ICSs that are part of critical infrastructure must maintain a
high level of system availability and operational resilience for many reasons including economic,
environmental, human safety, and national security. For many processes, it would be unacceptable to
degrade performance for the sake of security. A risk/benefit analysis is required for each system to make
such a determination. Security protections must be implemented in a way that maintains system integrity
during normal operation as well as during times of cyber-attack. Indeed, ICS security must include
elements of resilient physical design (e.g., redundancy and physical adaptability) in addition to network
security to maintain required system availability. Such requirements are determined by a process of
careful risk analysis and system engineering. The ICS testbed serves as a test platform to provide guidance
on how to implement security in an ICS, based on sound measurement science.
The ICS cybersecurity testbed is designed to demonstrate the application of security to a variety
of processes, such as control of a chemical plant, dynamic assembly using robots, and distributed
supervision and control of large wide-area networks (e.g., gas pipelines, water distribution pipelines, and
distributed intelligent transportation systems). As stated, the primary objective of the testbed is to
demonstrate the application of industrial control system security standards, such as NIST SP 800-82 [1] to
a networked control system and measure the performance degradation or improvement, if any, after
applying the protections. The testbed will also serve as a guide on how to implement security safeguards
effectively without negatively affecting process performance. In addition, while no system can be made
completely secure from network attacks [3], a secondary objective of the testbed is to measure the
performance of industrial control systems while undergoing cyber-attack. Resiliency will be a central
focus of systems under attacks. The testbed will be made available to academia, government, and
3 of 49
industry to conduct analysis of new technologies that are designed to improve intrusion detection
technologies and make processes more resilient to attacks. The testbed will support research for a period
of five years. Penetration testing will be conducted during the latter years of the ICS security research
project.
Various commercial products exist to protect systems that use industrial protocols. Products such
as the Tofino Security Appliance and the CISCO Adaptive Security Appliance (ASA) firewall devices provide
feature-rich security capabilities (e.g., content security, encryption, identity authentication, user
authorization, and intrusion prevention). These products are designed primarily to protect PLCs from
network perimeter exploitations. While these technologies do supply valuable network protection, they
do not provide (as per their designs) the ability to measure network performance as a function of packet
flight metrics. These metrics include average packet flight time (delay), packet flight time uncertainty
(jitter), and payload integrity (noise). Therefore, the initial measurement of each enclave will be based
on artificially induced delay, jitter, and noise; performance of the processes being studied will be
examined as a function of those parameters.
3 Testbed Design 3.1 Tennessee Eastman Process 3.1.1 Tennessee Eastman Process: Analog Simulation
The Tennessee Eastman (TE) control problem was chosen as the continuous process model for a
number of reasons. First, the TE model is a well-known plant model used in control systems research and
the dynamics of the plant process are well-understood. Second, the process must be controlled otherwise
perturbations will drive the system into an unstable state. The inherent unstable open-loop operation of
the TE process model presents a real-world scenario in which a cyber-attack could represent a real risk to
human safety, environmental safety, and economic viability. Third, the process is complex, nonlinear, and
has many degrees of freedom by which to control and perturb the dynamics of the process. And finally,
numerous simulations of the TE process have been developed with readily available reusable code. We
chose the University of Washington Simulink controller design by Ricker [2]. The Ricker Simulink model
was chosen for its multi-loop control architecture, making distributed control architectures viable. It
accurately matches the Downs and Vogel model, and the control code is easily separable from the plant
code.
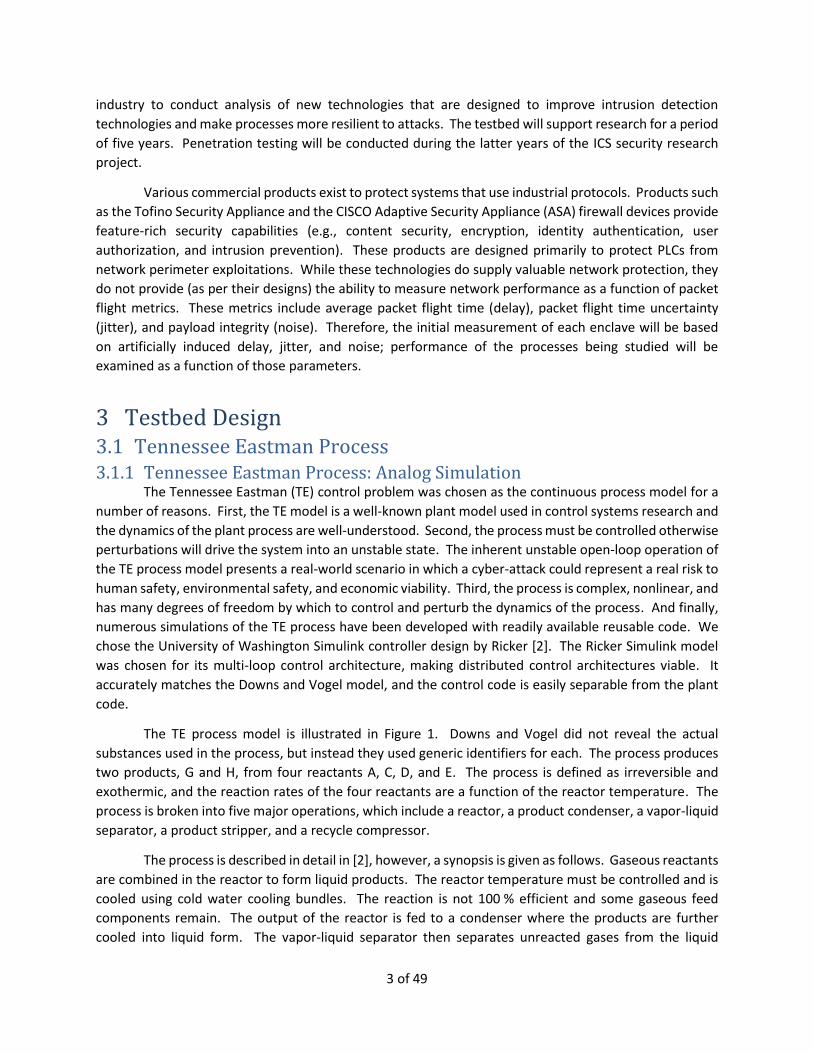
The TE process model is illustrated in Figure 1. Downs and Vogel did not reveal the actual
substances used in the process, but instead they used generic identifiers for each. The process produces
two products, G and H, from four reactants A, C, D, and E. The process is defined as irreversible and
exothermic, and the reaction rates of the four reactants are a function of the reactor temperature. The
process is broken into five major operations, which include a reactor, a product condenser, a vapor-liquid
separator, a product stripper, and a recycle compressor.
The process is described in detail in [2], however, a synopsis is given as follows. Gaseous reactants
are combined in the reactor to form liquid products. The reactor temperature must be controlled and is
cooled using cold water cooling bundles. The reaction is not 100 % efficient and some gaseous feed
components remain. The output of the reactor is fed to a condenser where the products are further
cooled into liquid form. The vapor-liquid separator then separates unreacted gases from the liquid

4 of 49
products. The unreacted gases are sent back to the reactor by a centrifugal recycle compressor. Again,
the separation process is not 100 % efficient, and the remaining reactants are removed in a stripping
column by stripping the mixture with C in feed stream four (4). The products, G and H, are then sent
downstream for further refining. Byproducts of the process are purged from the process through the
purge valve of stream nine (9).
FIGURE 1. TENNESSEE EASTMAN PROCESS MODEL
The process has six (6) different modes of operation which control the G/H mass ratio and the
production rate through stream eleven (11). Our primary use case for the system will be the base case,
indicated as Mode 1. Downs and Vogel provide heat and material balance data for the Mode 1 case. It is
important to note that the process is designed to shut down if the reactor pressure exceeds 3000 kPa;
however, as noted in [3], the reaction efficiency improves as the reactor pressure increases. This indicates
that the reactor pressure will be driven as close to the maximum threshold without exceeding the shutoff
limit. The reactor pressure set-point presents a security vulnerability. The reactor pressure will be driven
as close as possible to the maximum limit with little margin for error. It is conceivable that an attacker
could target the reactor pressure using a geometric attack or a surge attack combined with a human
5 of 49
machine interface (HMI) spoofing attack. Krotofil and Cardenas [3] provide an excellent discussion of the
TE process and potential security vulnerabilities.
The plant and controller have been separated such that the two processes may be executed on
separate machines with communications conducted via an arbitrary network protocol, such as TCP, UDP,
OPC, or EtherNet/IP. For an analog analysis of performance, a network connection is unnecessary, and
instead a basic delay system may be inserted to simulate the effects of the communication channel. The
communication channel is shown in the Simulink diagram between the TE Controller and the TE Plant.
The communications channel simulates the packet error rate and delay variation of the channel itself. By
introducing the channel, it will be possible to predict in simulation the effect of the channel on the
performance of the system. This analysis will be used to predict the performance of the TE chemical
process when cybersecurity protections are applied.
3.1.1.1 Tennessee Eastman Process: C++ Derivative In order to facilitate the transfer of the TE plant and controller models across different enclaves,
the original Fortran code of the plant model from Downs and Vogel and the Simulink controller by Ricker
were converted to C. Like the Simulink model, the plant and controller processes are separated, allowing
the execution of the two processes on separate hardware and simulation of the communications channel.
The C++ models are wrapped in a feature-rich, command-line application that allows modification
of run-time options and parameters, as well as enclave specific options. For example, for enclaves
requiring real-time operation of the model, the ‘-r’ switch is included on the command line at execution.
The high-level application layer and modular architecture of the C++ code allow for seamless integration
and software updates to all enclaves running the models.
The code is available on GitHub: https://github.com/usnistgov/tesim
3.1.2 Testbed Enclave: Hardware-in-the-Loop Simulator While a mathematical simulation is an important first step in the analysis of the performance of
any system, it is equally important to understand how a practical system behaves when instrumented
with security protections that will invariably insert packet flight uncertainty. A hardware-in-the-loop (HIL)
simulator was constructed to demonstrate the impacts of cybersecurity on the performance of a
manufacturing process [4].
3.1.2.1 Logical Architecture The simulator is intended to be reconfigurable such that various network topologies,
cybersecurity hardware, and simulation models may be hosted and evaluated. For the TE process, the
enclave is partitioned in accordance with the baseline case shown in Figure 2.
6 of 49
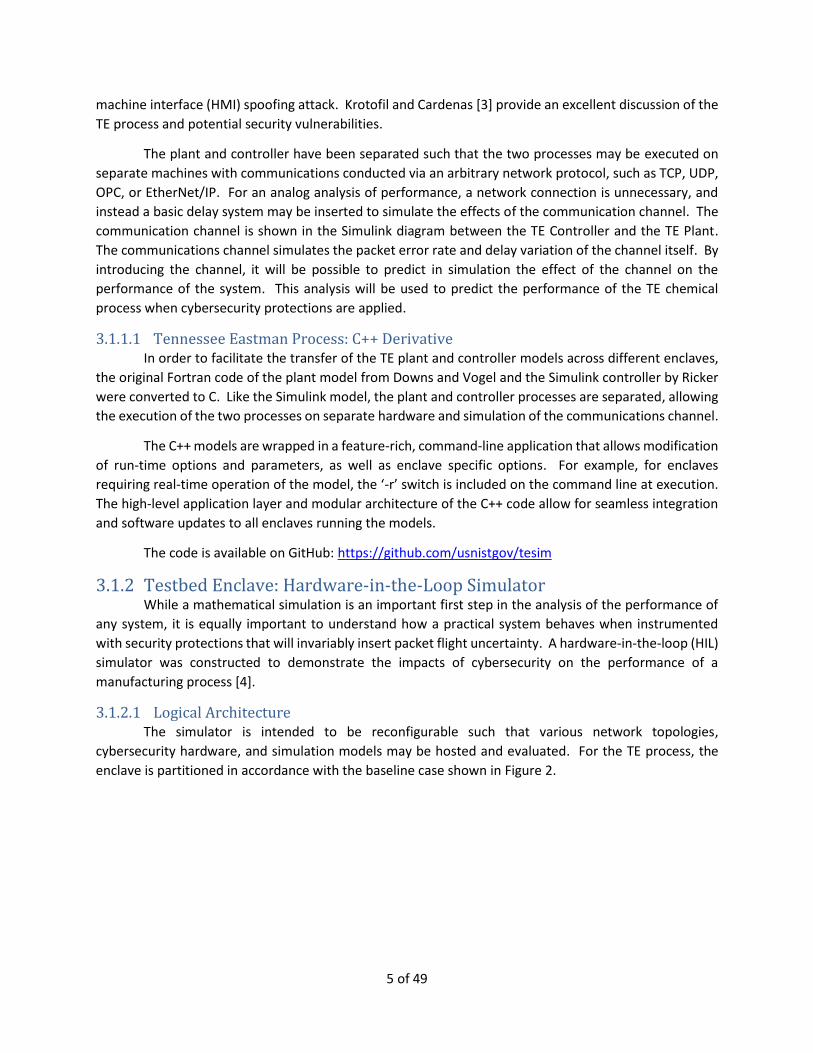
FIGURE 2. TE PROCESS ENCLAVE NETWORK DIAGRAM
The system is separated into three zones: a control zone, an operations zone, and demilitarized
zone (DMZ). The control zone hosts the TE plant and controller processes. The operations zone hosts the
human machine interface for visualizing the process data, and manipulating the simulation set-points and
parameters. The DMZ separates the control network from the business network, and contains a historian
to allow business-level access to plant and controller state data without allowing access to the control
network.
State data between the plant and controller processes is handled through the OPC server using
one or more industrial protocols via the PLC, such as the non-routable protocol DeviceNet, or the routable
protocol EtherNet/IP. Process states are transmitted from the PLC to the OPC server for distribution,
while the local historian records the state data and replicates it to the enterprise historian in the DMZ.
The firewall separating the operations zone from the control zone implements deep packet
inspection and device authentication (white listing), which will be used as a PLC cyber-protection
mechanism.
The TE enclave also contains network patches to the measurement enclave to facilitate packet
capture and the implementation of custom network delay mechanisms that serve to emulate the delays
introduced by security devices.
7 of 49
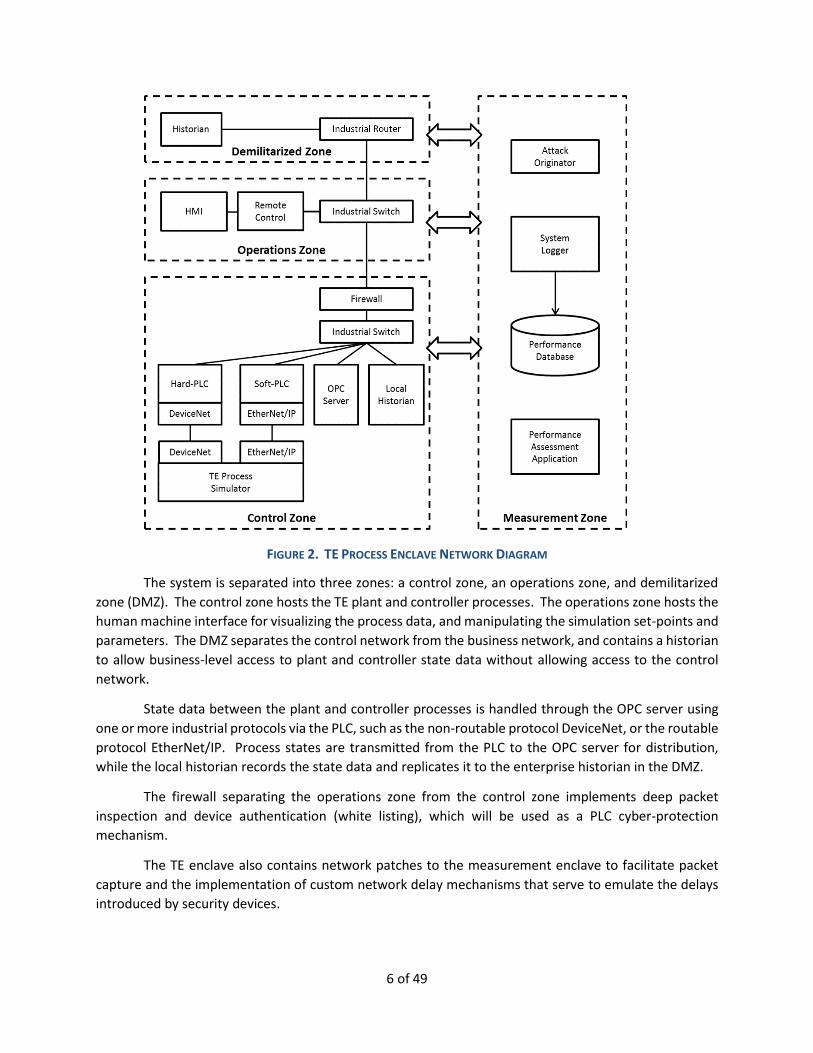
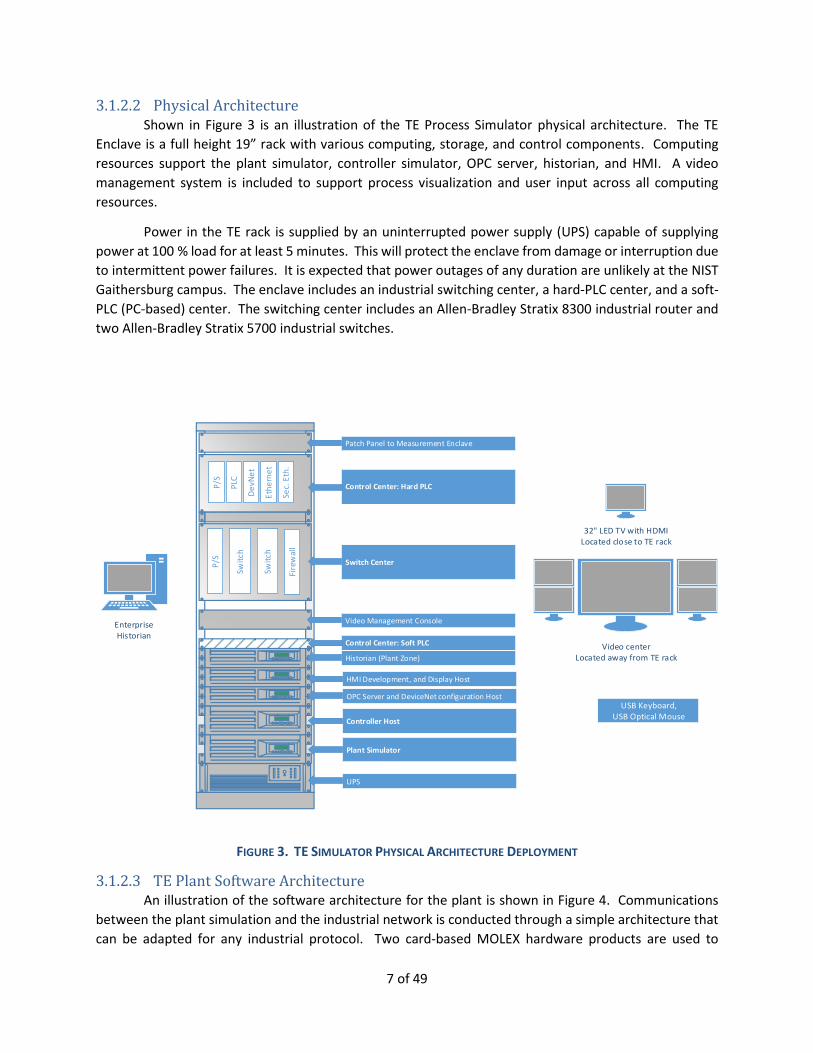
3.1.2.2 Physical Architecture Shown in Figure 3 is an illustration of the TE Process Simulator physical architecture. The TE
Enclave is a full height 19” rack with various computing, storage, and control components. Computing
resources support the plant simulator, controller simulator, OPC server, historian, and HMI. A video
management system is included to support process visualization and user input across all computing
resources.
Power in the TE rack is supplied by an uninterrupted power supply (UPS) capable of supplying
power at 100 % load for at least 5 minutes. This will protect the enclave from damage or interruption due
to intermittent power failures. It is expected that power outages of any duration are unlikely at the NIST
Gaithersburg campus. The enclave includes an industrial switching center, a hard-PLC center, and a soft-
PLC (PC-based) center. The switching center includes an Allen-Bradley Stratix 8300 industrial router and
two Allen-Bradley Stratix 5700 industrial switches.
P/S
Swit
ch
P/S
PLC
De
vNe
t
Eth
ern
et
Sec.
Eth
.
Plant Simulator
Controller Host
32" LED TV with HDMILocated close to TE rack
OPC Server and DeviceNet configuration Host
HMI Development, and Display Host
UPS
USB Keyboard,USB Optical Mouse
Switch Center
Control Center: Hard PLC
Historian (Plant Zone)
Swit
ch
Fire
wal
l
Control Center: Soft PLC
EnterpriseHistorian
Video centerLocated away from TE rack
Video Management Console
Patch Panel to Measurement Enclave
FIGURE 3. TE SIMULATOR PHYSICAL ARCHITECTURE DEPLOYMENT
3.1.2.3 TE Plant Software Architecture An illustration of the software architecture for the plant is shown in Figure 4. Communications
between the plant simulation and the industrial network is conducted through a simple architecture that
can be adapted for any industrial protocol. Two card-based MOLEX hardware products are used to

8 of 49
perform the DeviceNet and EtherNet/IP network emulation: a MOLEX SST-DN4MS-PCU DeviceNet Multi-
drop Slave (DNMSLAVE) and a MOLEX DRL-EIP-PCIE EtherNet/IP.
Comm. Card
Comm. Module
PLC
Chemical Process Model
Comm. Driver
Shared Memory
OPC
SensorReadings
ActuatorCommands
FIGURE 4. SOFTWARE ARCHITECTURE USED FOR COMMUNICATIONS BETWEEN TE PLANT AND OPC
The interface between the communications driver and the chemical process model is
implemented using shared memory. The PLC obtains the process states from the communication card;
each state is emulated as an individual device on the communication bus/network. For DeviceNet each
state has a media access control identifier, and for Ethernet/IP each state has a device identifier.
The PLC continuously polls the process states (sensor readings) from the communication
bus/network and updates the corresponding OPC tags for use by the controller process. The actuator
commands resulting from the controller process are received by the PLC via scanning the OPC tags, and
the states propagated back down through the architecture to emulated actuator devices on the
communication bus/network for use on the next iteration of the chemical process model.
3.1.2.4 TE Controller Software Architecture An illustration of the software architecture for the controller is shown in Figure 5.
Communications between the Simulink controller and the industrial network are conducted via OPC.
OPC communications are conducted using Simulink’s OPC Toolbox blocks, simplifying the
implementation. Connections to the OPC Server are configured using the OPC Configuration block. The
OPC Configuration block defines the OPC clients to be used in the model, configures pseudo real-time

9 of 49
behavior for the model, and defines behavior for OPC errors and events. All error handling and queuing
are handled by the toolbox.
On every control iteration, the controller pulls the current plant simulation states (sensor
readings) from the OPC server, processes these states through the controller model, and returns the new
controller states (actuator commands) to the OPC server for use by the plant model.
OPC Write(Simulink)
OPC Read(Simulink)
OPC Server
Configuration(Simulink)
Controller Model
sensorreadings
actuatorcommands
FIGURE 5. SOFTWARE ARCHITECTURE USED FOR OPC COMMUNICATIONS WITH THE CONTROLLER
3.1.2.5 Theory of Operation To begin the simulation, model parameters for the current simulation are loaded into state tags
within the OPC server via the HMI. Since the plant and controller are located on multiple machines, a
start/stop tag in the OPC server is used to initiate the simulation on both machines. Both the plant and
controller will monitor this tag and will begin their simulations once it is set. This tag is set by an operator
via the HMI.
Both the chemical process model and the controller receive the model states from the OPC server
for each integration time step. At the time of writing this paper, the integration time step is set to 1.8
seconds. Each simulation runs asynchronously until the configured simulation time is reached, at which
point both simulations will terminate.
3.1.3 Process Control with Faster Dynamics While the Tennessee Eastman process is well understood and a good model to use for the
implementation of security policies and technologies, the process itself is slow. The model operates with
such slow time constants that changes in the process dynamics caused by induced model disturbances
can take hours to display a noticeable effect.
The primary objective of the TE enclave is to validate security standards, measure their
performance impacts, and provide feedback to the standards bodies that support them; and the TE
10 of 49
process is well suited for this purpose. However, a secondary objective of the enclave is to create a system
with a broad attack surface through which security penetration testing may be conducted and the effects
researched. The slow dynamics of the TE process may present significant project management challenges,
and a process with faster dynamic responses (on the order of seconds) would be required to facilitate
more timely research.
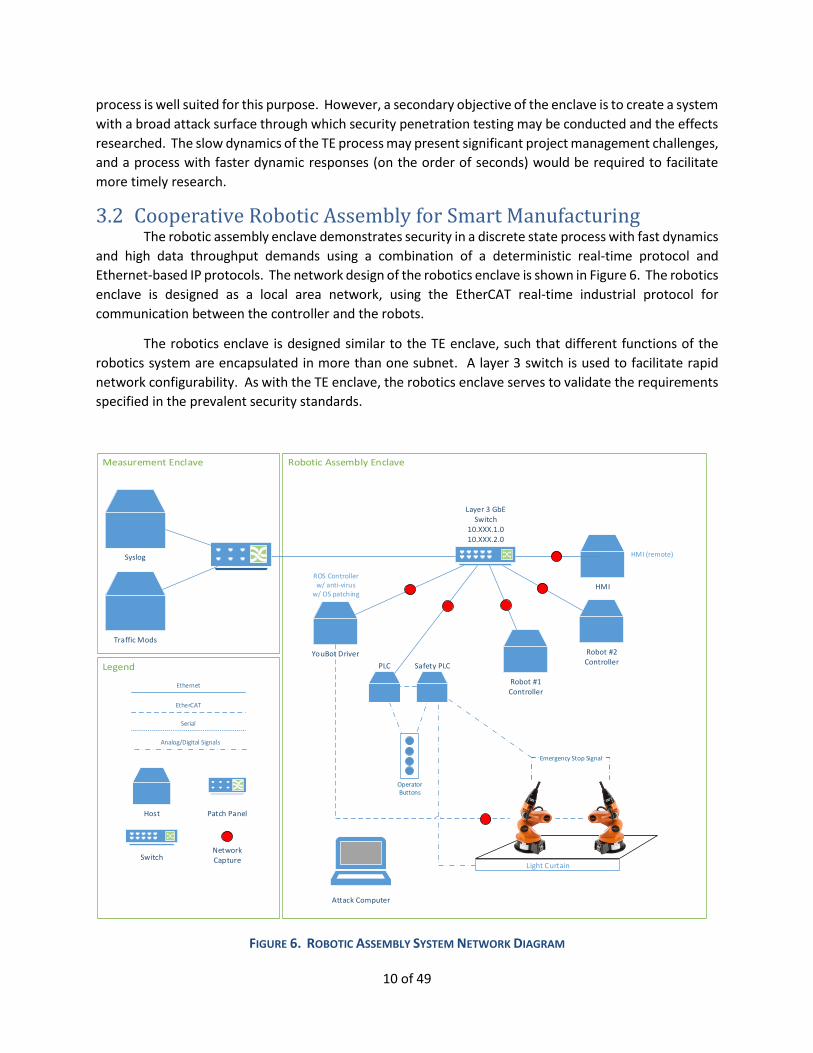
3.2 Cooperative Robotic Assembly for Smart Manufacturing The robotic assembly enclave demonstrates security in a discrete state process with fast dynamics
and high data throughput demands using a combination of a deterministic real-time protocol and
Ethernet-based IP protocols. The network design of the robotics enclave is shown in Figure 6. The robotics
enclave is designed as a local area network, using the EtherCAT real-time industrial protocol for
communication between the controller and the robots.
The robotics enclave is designed similar to the TE enclave, such that different functions of the
robotics system are encapsulated in more than one subnet. A layer 3 switch is used to facilitate rapid
network configurability. As with the TE enclave, the robotics enclave serves to validate the requirements
specified in the prevalent security standards.
Layer 3 GbE Switch
10.XXX.1.010.XXX.2.0
YouBot Driver
Traffic Mods
Syslog
Ethernet
EtherCAT
Host Patch Panel
Switch
Serial
ROS Controllerw/ anti-virus
w/ OS patching
Robot #2Controller
Analog/Digital Signals
Attack Computer
PLC
Light Curtain
HMI
HMI (remote)
NetworkCapture
Robot #1Controller
Safety PLC
Emergency Stop Signal
OperatorButtons
FIGURE 6. ROBOTIC ASSEMBLY SYSTEM NETWORK DIAGRAM

11 of 49
3.2.1 Computing Rack Design An illustration of the robotics rack is shown in Figure 7. A 42-U full-size 19” rack with UPS is used
to house the computing resources. The rack includes a 24-port Ethernet patch panel and Layer 3 industrial
switch. Security capabilities of the switch include integrated router/firewall/virtual private networking
(VPN); stateful firewall with network address translation (NAT) support; IPSec VPN; and VPN with 3DES,
AES128, AES256 support. Computing resources include rack-mounted servers for the two Robot
Operating System (ROS) controllers (one for each robot). A tower computer is used for the ROS Core,
robot driver, and remote shells.
Patch panel (CAT 6)
ROS Controller #1
UPS
Video ManagementConsole
ROS Controller #2
24" MonitorUSB Keyboard & Mouse
ROS CoreYouBot Driver
HMIDell 9020 AIO
USB Keyboard & Mouse
Layer 3 Switch
UPS Battery
PLC
Safe
tyPL
C
Dig
. In
pu
t
Dig
. O
ut.PS
FIGURE 7. ROBOTICS ENCLAVE RACK VIEW
The rack includes a control center that contains a PLC for enclave operations, a Safety PLC for
monitoring safety inputs/outputs (I/O), and I/O modules for normal enclave signals (e.g., sensors and
operator buttons).
3.2.2 Mechanical Design 3.2.2.1 Robot End-Effector
The robot end-effector is designed to pick-up spherical parts (e.g., golf balls) using a profile that
is specific to the shape and size of the part, and 3-D printed. A diagram of the end-effector is shown in
Figure 8. The shape allows for position repeatability of the part within the jaws relative to the end-
effector, and is also capable of lifting the part from the machining station while performing the closing
operation.
12 of 49
FIGURE 8. SPHERICAL OBJECT END-EFFECTOR FOR ROBOTIC ENCLAVE.
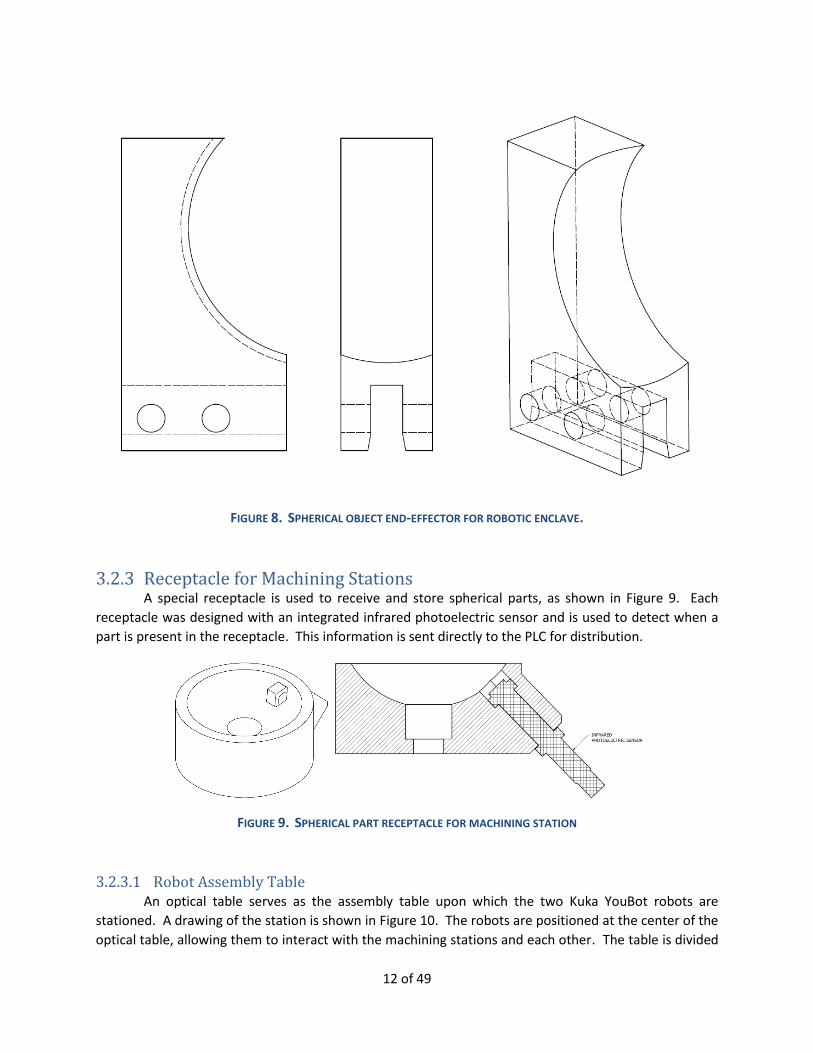
3.2.3 Receptacle for Machining Stations A special receptacle is used to receive and store spherical parts, as shown in Figure 9. Each
receptacle was designed with an integrated infrared photoelectric sensor and is used to detect when a
part is present in the receptacle. This information is sent directly to the PLC for distribution.
FIGURE 9. SPHERICAL PART RECEPTACLE FOR MACHINING STATION
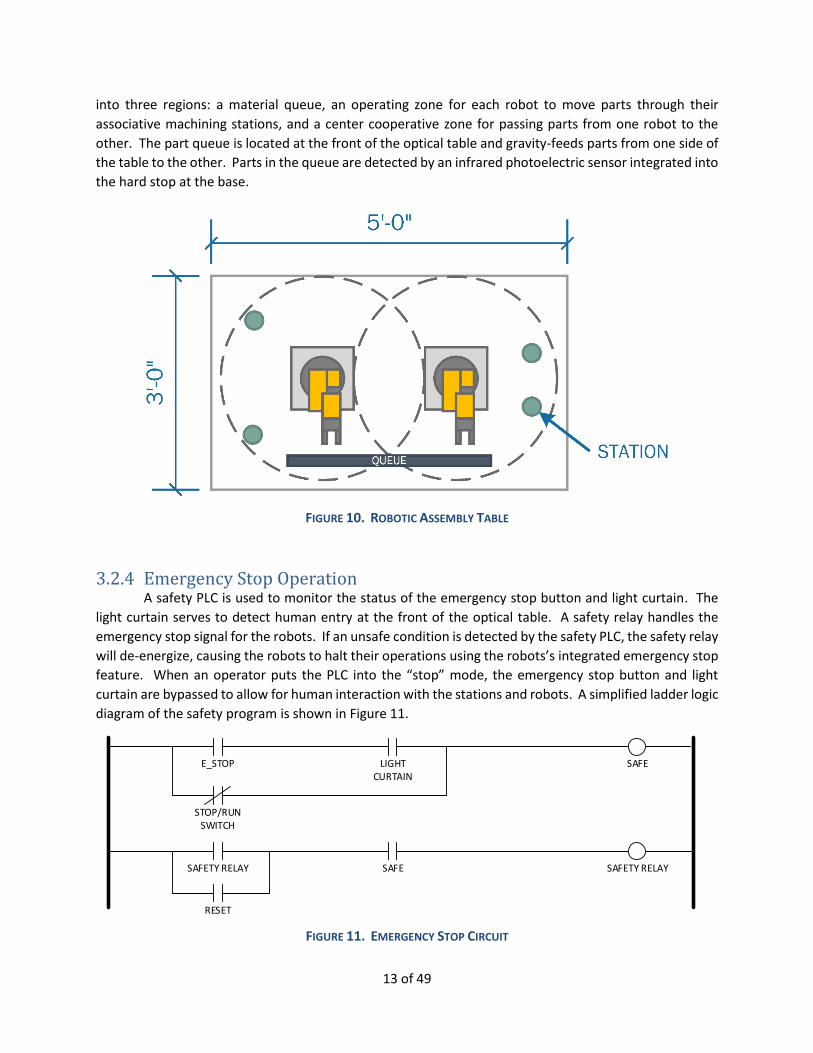
3.2.3.1 Robot Assembly Table An optical table serves as the assembly table upon which the two Kuka YouBot robots are
stationed. A drawing of the station is shown in Figure 10. The robots are positioned at the center of the
optical table, allowing them to interact with the machining stations and each other. The table is divided
13 of 49
into three regions: a material queue, an operating zone for each robot to move parts through their
associative machining stations, and a center cooperative zone for passing parts from one robot to the
other. The part queue is located at the front of the optical table and gravity-feeds parts from one side of
the table to the other. Parts in the queue are detected by an infrared photoelectric sensor integrated into
the hard stop at the base.
FIGURE 10. ROBOTIC ASSEMBLY TABLE
3.2.4 Emergency Stop Operation A safety PLC is used to monitor the status of the emergency stop button and light curtain. The
light curtain serves to detect human entry at the front of the optical table. A safety relay handles the
emergency stop signal for the robots. If an unsafe condition is detected by the safety PLC, the safety relay
will de-energize, causing the robots to halt their operations using the robots’s integrated emergency stop
feature. When an operator puts the PLC into the “stop” mode, the emergency stop button and light
curtain are bypassed to allow for human interaction with the stations and robots. A simplified ladder logic
diagram of the safety program is shown in Figure 11.
E_STOP SAFELIGHTCURTAIN
STOP/RUNSWITCH
SAFETY RELAYSAFESAFETY RELAY
RESET
FIGURE 11. EMERGENCY STOP CIRCUIT
14 of 49
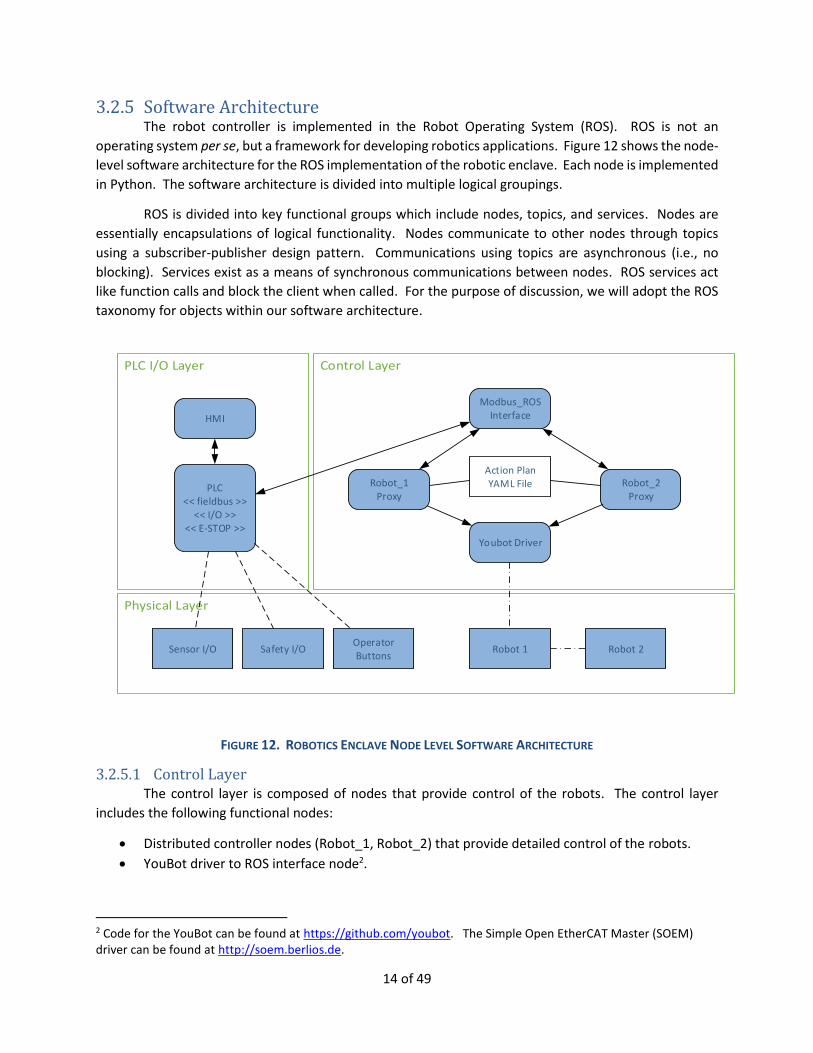
3.2.5 Software Architecture The robot controller is implemented in the Robot Operating System (ROS). ROS is not an
operating system per se, but a framework for developing robotics applications. Figure 12 shows the node-
level software architecture for the ROS implementation of the robotic enclave. Each node is implemented
in Python. The software architecture is divided into multiple logical groupings.
ROS is divided into key functional groups which include nodes, topics, and services. Nodes are
essentially encapsulations of logical functionality. Nodes communicate to other nodes through topics
using a subscriber-publisher design pattern. Communications using topics are asynchronous (i.e., no
blocking). Services exist as a means of synchronous communications between nodes. ROS services act
like function calls and block the client when called. For the purpose of discussion, we will adopt the ROS
taxonomy for objects within our software architecture.
Youbot Driver
PLC<< fieldbus >>
<< I/O >><< E-STOP >>
Robot 1
Robot_1Proxy
Robot_2Proxy
HMI
Modbus_ROSInterface
Robot 2
Action Plan YAML File
Sensor I/O Safety I/OOperatorButtons
FIGURE 12. ROBOTICS ENCLAVE NODE LEVEL SOFTWARE ARCHITECTURE
3.2.5.1 Control Layer The control layer is composed of nodes that provide control of the robots. The control layer
includes the following functional nodes:
Distributed controller nodes (Robot_1, Robot_2) that provide detailed control of the robots.
YouBot driver to ROS interface node2.
2 Code for the YouBot can be found at https://github.com/youbot. The Simple Open EtherCAT Master (SOEM) driver can be found at http://soem.berlios.de.

15 of 49
A Modbus interface for allowing any ROS node to monitor enclave sensors, operator buttons,
and states from the PLC.
3.2.5.2 PLC I/O Layer The PLC I/O layer serves as the bridge between ROS and the PLC. The PLC contains the supervisory
control software of the enclave, which the ROS nodes monitor through the Modbus interface. As stated
in 3.2.2, the emergency stop functionality is provided by the integrated safety PLC, and is activated by an
emergency stop button and a light curtain attached to the enclave.
The HMI will serve as a graphical representation of the current states of the robots and the control
system. The HMI will be developed using Python. The graphical user interface (GUI) will include controls,
such as program start and stop, system state indicators, safety state indicators, and program selection.
3.2.5.3 ROS Bags ROS provides a mechanism for recording and playing back ROS traffic called Bags. This feature
may be useful for evaluating security performance related to replay attacks. ROS Bags are described in
detail at http://wiki.ros.org/Bags. ROS Bags will also be very useful for replaying simulations for post-
mortem analysis.
3.2.5.4 ROS versus ROS Industrial While ROS Industrial (ROS-I) provides many benefits to the developer and supports increasingly
more industrial robots, currently no ROS-I support exists for the Kuka YouBot. Integration of the ROS
driver into ROS-I is possible; however, it is unnecessary to meet the goals of the ICS cybersecurity project.
It may be advantageous to transition to ROS-I in future releases of our robotics enclave to gain native
support for PLCs, EtherCAT I/O, and other industrial protocols. Transitioning to the ROS-I framework will,
at a minimum, require that the YouBot driver be encapsulated with a software wrapper that conforms to
the essential driver interfaces described in the ROS-I Industrial Robot Driver Specification [5].
3.2.5.5 Theory of Operation After initializing all required processes (e.g., ROS Core, YouBot driver, controllers, safety PLC, etc.),
the robot controllers wait for the supervisory PLC’s start/stop bit to be set. This is done via the operator
buttons located on the front of the enclave. This bit is checked before each robot operation is initiated.
There are two machining stations available to each robot, as well as a robot-to-robot transfer in
the middle of the table, and the queue. Parts move in a clockwise direction from the queue to each
machining station, before being placed back into the queue.
The controller scans the current state of all machining stations on the enclave, which are provided
by the PLC. The state of each machining station tells the controller whether: there is no part present,
there is a part present and is currently being processed, or there is a part present and is ready for pick-up.
Each machining station has a dedicated timer within the PLC which simulates the processing time for a
part at the station to be “machined”, which is started once the part is placed in the station. Once the
timer has completed, the part is ready for pickup.
After scanning the current state of the machining stations, the controller will decide which
operation it should complete from its available motions. There are only six required motions for the two
robots with the current machining station setup (one of each type per robot): two for transferring a part

16 of 49
to and from the queue, two for transferring the parts between stations, and two for the robot-to-robot
transfer.
3.2.6 Final Assembly A picture of the assembled robotics enclave is shown in Figure 13. The enclave includes a full 19”
rack (left) that houses the PLC, safety controller, and industrial-grade router. The optical table (right)
includes the two research-grade Kuka YouBot robots, machining pedestals, proximity sensors, control
switches, and light curtain. Control of the enclave is actuated by the operator using the switch panel. A
third station (not shown) includes a computer for the HMI, ROS master, and YouBot EtherCAT driver.
FIGURE 13. FULLY ASSEMBLED DISCRETE MANUFACTURING ROBOTICS ENCLAVE.
3.3 Third Enclave Concepts 3.3.1 Intelligent Transportation System
An intelligent transportation system that includes public infrastructure components, cooperative
real-time embedded components, and wireless components are envisioned. The transportation system
will be implemented by the Vanderbilt University Institute for Software Integrated Systems.
3.3.2 Wide-area Networks with SCADA The concept of industrial control system cybersecurity is often connected with systems that
employ Supervisory Control and Data Acquisition (SCADA) elements. Such systems operate as wide-area
networks covering large geographical areas. SCADA systems may be simulated using the reconfigurable
testbed currently allocated for the TE process or another enclave.
SCADA systems being considered for inclusion into the testbed include:
17 of 49
1. A mass transit rail system in which control of the trains and infrastructure are conducted by a
real-time SCADA system.
2. Liquid/Gas distribution systems that require real-time pressure control and monitoring, such as
oil or natural gas pipelines and water treatment and distribution systems.
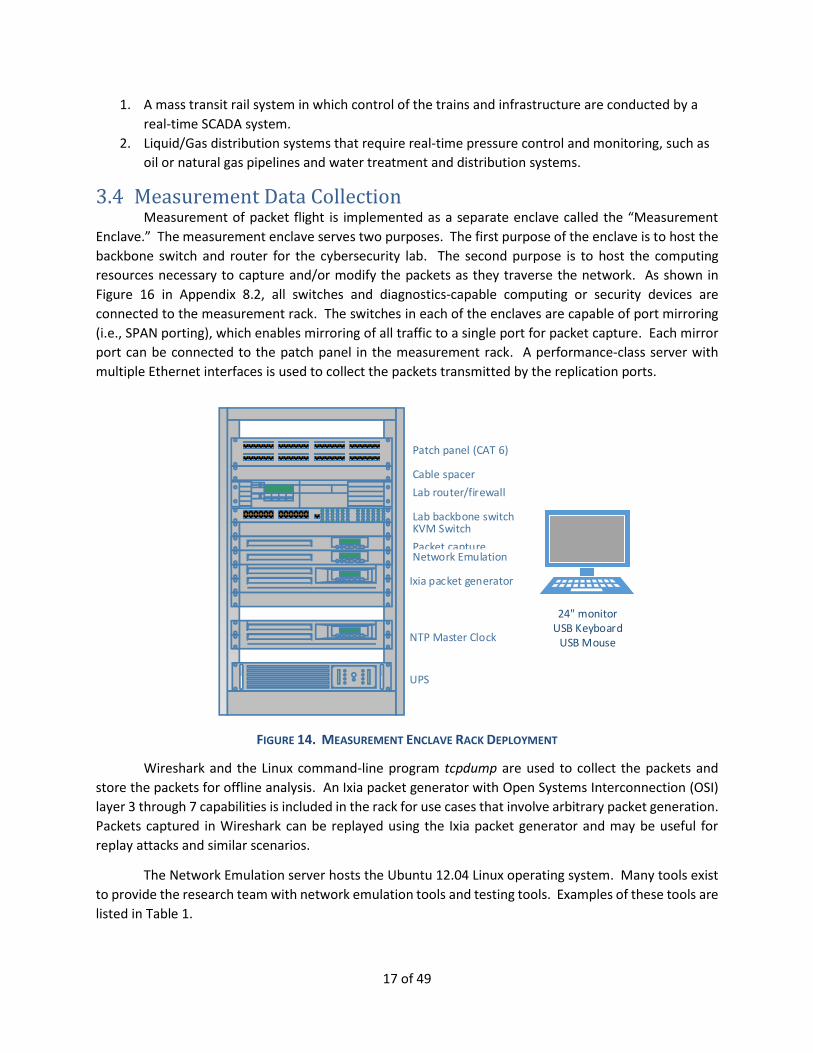
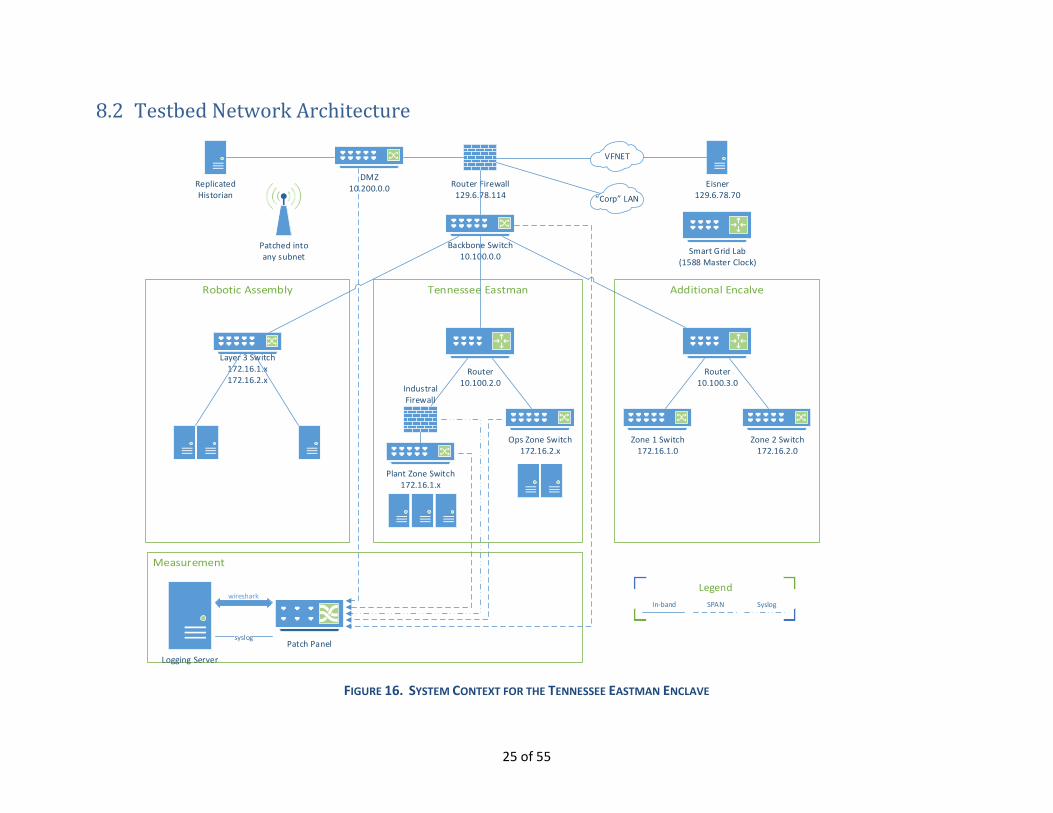
3.4 Measurement Data Collection Measurement of packet flight is implemented as a separate enclave called the “Measurement
Enclave.” The measurement enclave serves two purposes. The first purpose of the enclave is to host the
backbone switch and router for the cybersecurity lab. The second purpose is to host the computing
resources necessary to capture and/or modify the packets as they traverse the network. As shown in
Figure 16 in Appendix 8.2, all switches and diagnostics-capable computing or security devices are
connected to the measurement rack. The switches in each of the enclaves are capable of port mirroring
(i.e., SPAN porting), which enables mirroring of all traffic to a single port for packet capture. Each mirror
port can be connected to the patch panel in the measurement rack. A performance-class server with
multiple Ethernet interfaces is used to collect the packets transmitted by the replication ports.
Patch panel (CAT 6)
Lab router/firewall
Lab backbone switch
UPS
Cable spacer
KVM Switch
Ixia packet generator
24" monitorUSB Keyboard
USB Mouse
Packet captureNetwork Emulation
NTP Master Clock
FIGURE 14. MEASUREMENT ENCLAVE RACK DEPLOYMENT
Wireshark and the Linux command-line program tcpdump are used to collect the packets and
store the packets for offline analysis. An Ixia packet generator with Open Systems Interconnection (OSI)
layer 3 through 7 capabilities is included in the rack for use cases that involve arbitrary packet generation.
Packets captured in Wireshark can be replayed using the Ixia packet generator and may be useful for
replay attacks and similar scenarios.
The Network Emulation server hosts the Ubuntu 12.04 Linux operating system. Many tools exist
to provide the research team with network emulation tools and testing tools. Examples of these tools are
listed in Table 1.
18 of 49
In order to synchronize the time across all the machines in the enclaves, the measurement rack
also includes a LANTIME M900 Network Time Protocol (NTP) timeserver. Having all of the machines
source with this one master clock allows for accurate timestamping of logs and network captures across
multiple machines. The offset and jitter of each machine to the master clock is logged in order to track
and correct for time discrepancies between the machine logs.
TABLE 1. TRAFFIC MANIPULATION TOOLS FOR LINUX
Tool Description
Ixia Anue Commercial-grade traffic shaping appliance for network device/system testing.
netem netem provides Network Emulation functionality for testing protocols by emulating the properties of wide area networks. The current version emulates variable delay, loss, duplication, and re-ordering. http://www.linuxfoundation.org/collaborate/workgroups/networking/netem
Netem (MasterShaper)
MasterShaper is a network traffic shaper which provides a Web Interface for Quality of Service functions of newer Linux 2.4- and 2.6- kernels. http://www.mastershaper.org/
tc A traffic control utility
pf A firewall with state-aware packet filtering
3.5 Attack Computers Separate computers can be used for developing attack vectors on the various industrial processes
described in this document. Computing resources that will be used for penetration testing are described
in the following sections.
3.5.1 Laptop Computer A laptop PC will be used as the primary platform for executing penetration tests. The software
tool Metasploit (http://www.metasploit.com/) will be leveraged to execute penetration tests on the
simulated processes.
3.5.2 Ixia Traffic Generator The Ixia M2 can be leveraged for executing denial of service (DoS) and replay attacks on the
simulated networks. Denial of service attacks are typically executed on networking equipment exposed
to the internet; however, internally generated attacks are possible and will be investigated.
3.5.3 Traffic Manipulation Server The effect of traffic manipulation attacks such as man-in-the-middle (MITM) attacks and network
controls are simulated using an Ixia Anue appliance in the measurement enclave.
19 of 49
3.5.4 ROS Replay using Bags As described in 3.2.5.3, ROS Bags can be used to capture and replay ROS commands. This may be
a useful tool for generating DoS and replay attacks. ROS Bag replays can be conducted from any of the
machines that support ROS.
4 Performance Metrics Rating the performance of an industrial control system is a challenging exercise. While industrial
processes can be classified into general categories, no one set of metrics can be designed to cover all
possible scenarios. Even identical designs may be implemented with different sensors, actuators, and
control hardware. Top-level categories of processes include continuous processes, discrete processes,
and a hybrid of continuous and discrete processes. Continuous processes are those in which materials
flow through a system without pause or wait states. Discrete processes include those in which materials
flow in quantized bundles and pauses or wait states are frequent. Many processes which appear to be
mostly continuous are actually continuous processes with discrete elements and may be classified as
hybrid processes. Process categories and examples of each are given in Table 2.
TABLE 2. CATEGORIES OF INDUSTRIAL PROCESSES
Category Examples of processes
Highly continuous process Chemical manufacture Oil and Gas refineries Oil and Gas production and distribution Semiconductor manufacture Smelting Disinfection
Highly discrete process Robotic sorting & assembly Automotive assembly Building automation
Hybrid Continuous & Discrete
Candy manufacture Pharmaceutical manufacture Metal-alloy manufacture
A one size fits all approach to a data-based assessment of performance of an industrial control
system is very difficult and somewhat impractical. Much effort has been spent in identifying the technical
indicators for assessing process performance. Both security metrics and process performance metrics
exist and may be applied to industrial processes. Process performance metrics may include throughput,
product quality, product error rate, and operational cost. Security metrics are well-defined for
information technology in publications such as NIST SP 800-55 [4] and The Common Criteria for
Information Technology Security Evaluation (CC) [6].
For the purpose of assessing the impact security has on process performance, it is necessary to
measure the operational performance of the process. It makes little sense to measure security
performance without first understanding how security technologies impact the performance of the
process being protected. Therefore, for the purpose of assessing process performance, our approach is
20 of 49
to focus on the technical performance indicators of the processes rather than information security
metrics. Key metrics that will be analyzed are listed in Table 4 through Table 8 in the Appendix.
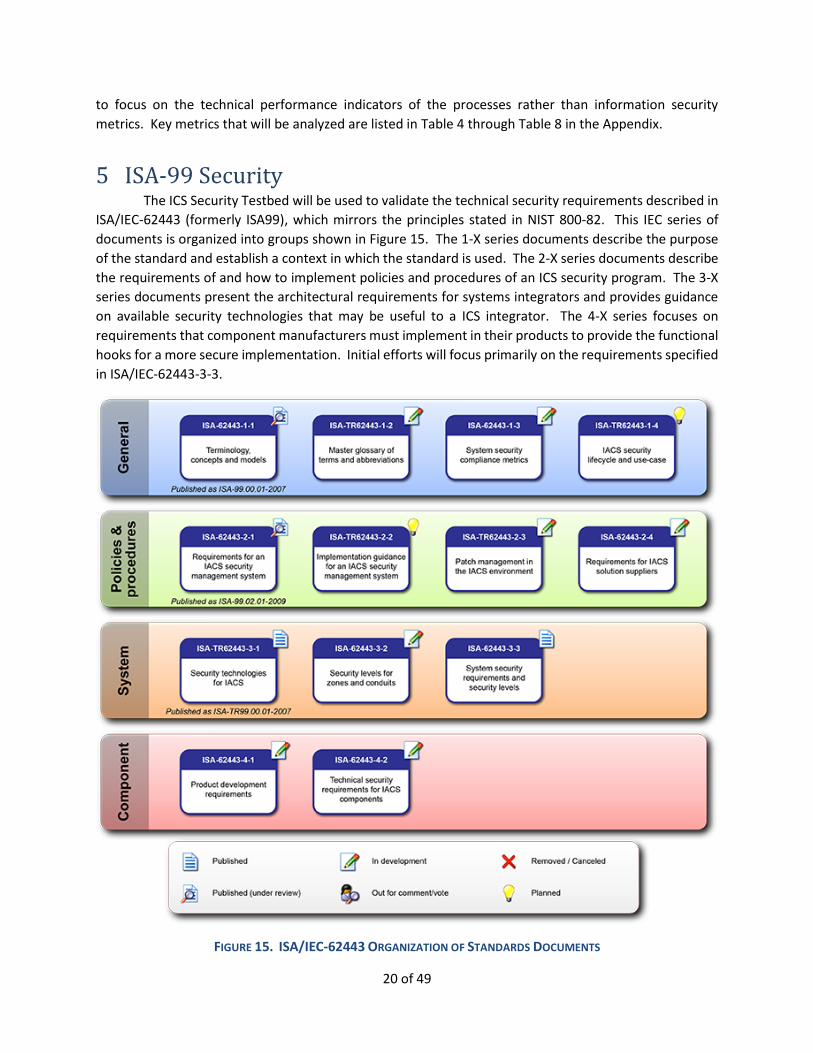
5 ISA-99 Security The ICS Security Testbed will be used to validate the technical security requirements described in
ISA/IEC-62443 (formerly ISA99), which mirrors the principles stated in NIST 800-82. This IEC series of
documents is organized into groups shown in Figure 15. The 1-X series documents describe the purpose
of the standard and establish a context in which the standard is used. The 2-X series documents describe
the requirements of and how to implement policies and procedures of an ICS security program. The 3-X
series documents present the architectural requirements for systems integrators and provides guidance
on available security technologies that may be useful to a ICS integrator. The 4-X series focuses on
requirements that component manufacturers must implement in their products to provide the functional
hooks for a more secure implementation. Initial efforts will focus primarily on the requirements specified
in ISA/IEC-62443-3-3.
FIGURE 15. ISA/IEC-62443 ORGANIZATION OF STANDARDS DOCUMENTS
21 of 49
The requirements specified in the 3-3 document are listed in Table 9 of the Appendix. A living
document will be maintained in Microsoft Excel that documents the mapping of security requirements to
use cases and technologies applied.
6 Conclusions The NIST Industrial Control Systems Cybersecurity Testbed will provide an outstanding
opportunity for the validation of existing security guidelines and standards as they pertain to critical
infrastructure, such as public works systems, critical manufacturing systems, and other industrial control
systems. By dividing the testbed into functional enclaves that represent multiple industrial interests, the
testbed will serve as a platform for government, academic, and commercial researchers to experiment
with security technologies and high assurance designs that make those systems more resilient to security
threats, such as malicious cyber-attacks, user errors, and common network failures. The research
produced from the use of the testbed will support the efforts of industry and government to develop
more secure industrial control systems as well as improve the security of existing infrastructure.
7 Bibliography
[1] K. Stouffer, V. Pillitteri, S. Lightman, M. Abrams, and A. Hahn, “NIST Special Publication 800-82: Guide to Industrial Control Systems (ICS) Security,” Gaithersburg, MD, Jun. 2015.
[2] J. J. Downs and E. F. Vogel, “A Plant-wide Industrial Problem Process,” Comput. Chem. Eng., vol. 17, no. 3, pp. 245–255, 1993.
[3] A. a Cárdenas, S. Amin, Z.-S. Lin, Y.-L. Huang, C.-Y. Huang, and S. Sastry, “Attacks against process control systems: Risk assessment, detection, and response,” Proc. 6th ACM Symp. Information, Comput. Commun. Secur., pp. 355–366, 2011.
[4] R. Candell, K. Stouffer, and D. Anand, “A Cybersecurity Testbed for Industrial Control Systems,” in Proceedings of the 2014 Process Control and Safety Symposium, 2014.
[5] “ROS Industrial Driver Specification.” [Online]. Available: http://wiki.ros.org/Industrial/Industrial_Robot_Driver_Spec.
[6] Ccra, “Common Criteria for Information Technology Security Evaluation Part 3 : Security assurance components,” Security, no. September, pp. 1–321, 2012.
[7] A. Ordys, D. Uduehi, and M. A. Johnson, Eds., Process Control Performance Assessment: From Theory to Implementation (Advances in Industrial Control). Springer, 2010.
[8] Rachad Baroudi, KPI Mega Library: 17,000 Key Performance Indicators. Scotts Valley, California: CreateSpace Independent Publishing Platform, 2010.

22 of 49
23 of 49
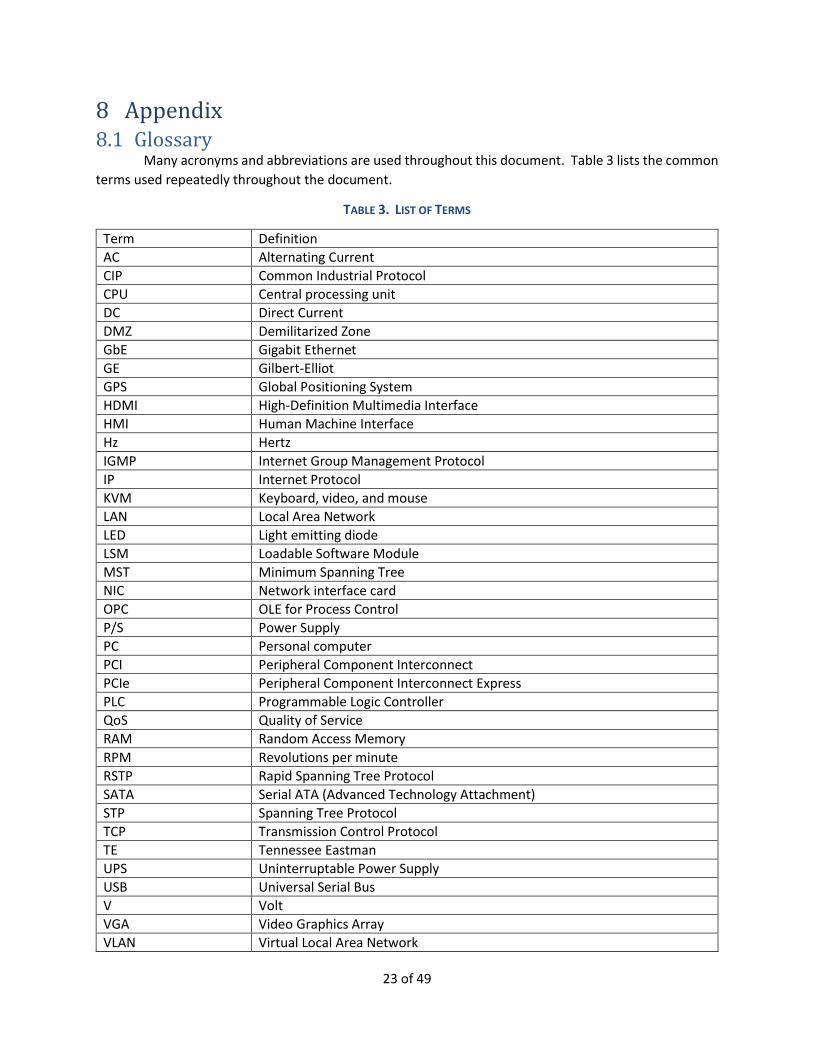
8 Appendix 8.1 Glossary
Many acronyms and abbreviations are used throughout this document. Table 3 lists the common
terms used repeatedly throughout the document.
TABLE 3. LIST OF TERMS
Term Definition
AC Alternating Current
CIP Common Industrial Protocol
CPU Central processing unit
DC Direct Current
DMZ Demilitarized Zone
GbE Gigabit Ethernet
GE Gilbert-Elliot
GPS Global Positioning System
HDMI High-Definition Multimedia Interface
HMI Human Machine Interface
Hz Hertz
IGMP Internet Group Management Protocol
IP Internet Protocol
KVM Keyboard, video, and mouse
LAN Local Area Network
LED Light emitting diode
LSM Loadable Software Module
MST Minimum Spanning Tree
NIC Network interface card
OPC OLE for Process Control
P/S Power Supply
PC Personal computer
PCI Peripheral Component Interconnect
PCIe Peripheral Component Interconnect Express
PLC Programmable Logic Controller
QoS Quality of Service
RAM Random Access Memory
RPM Revolutions per minute
RSTP Rapid Spanning Tree Protocol
SATA Serial ATA (Advanced Technology Attachment)
STP Spanning Tree Protocol
TCP Transmission Control Protocol
TE Tennessee Eastman
UPS Uninterruptable Power Supply
USB Universal Serial Bus
V Volt
VGA Video Graphics Array
VLAN Virtual Local Area Network

24 of 49
Term Definition
W Watt(s)
25 of 55
8.2 Testbed Network Architecture
Legend
Router Firewall129.6.78.114
DMZ10.200.0.0
Backbone Switch10.100.0.0
Patched into any subnet
Layer 3 Switch172.16.1.x 172.16.2.x
Plant Zone Switch172.16.1.x
Router10.100.2.0
Ops Zone Switch172.16.2.x
Zone 1 Switch172.16.1.0
Router10.100.3.0
Zone 2 Switch172.16.2.0
Smart Grid Lab(1588 Master Clock)
Logging Server
IndustralFirewall
ReplicatedHistorian
In-band SPAN Syslog
Patch Panelsyslog
“Corp” LAN
VFNET
wireshark
Eisner129.6.78.70
FIGURE 16. SYSTEM CONTEXT FOR THE TENNESSEE EASTMAN ENCLAVE

26 of 55
8.3 Industrial Control Metrics Industrial metrics are listed in Table 4 through Table 8. Metrics for continuous processes, discrete
processes, host performance, and network performance are organized into separate tables. The metrics
presented here were selected through study of [7] and [8], and may be considered a small subset of a
large number of different key performance indicators used in manufacturing and other industrial
processes. Each organization must select performance indicators that are meaningful to their own
operation.
TABLE 4. PERFORMANCE METRICS FOR CONTINUOUS PROCESSES
Metric Description
% Process Availability The ratio of process up-time to the sum of process up-time and down-time
Product Quality Statistical measures of product goodness or purity
Process Variability Statistical measurement of how much a process variable deviates or oscillates from its steady state value or set point.3
Steady State Error Oscillation over variability about a pre-determined set point and weights both transient and steady state responses equally.
Response Time A quantitative measurement of time to respond to a perturbation, such as a step stimulus.
Cost The economic cost for running the process measured in currency
Safety Margin Time taken to shutdown process after fault detection. This may be particularly important where human safety is concerned.
% Time Actuation at Limits
Measure of the amount of time a process control variable remains at a hard limit. A common example of such a limit includes valves at full open or full close.
Integrated Absolute Error (IAE)
Commonly used metric for evaluating the performance of a feedback control loop.
Integrated Time-weighted Absolute Error (ITAE)
Commonly used metric for evaluating the performance of a feedback control loop. This particular metric weights the steady state error more than the error introduced by the transient response.
TABLE 5. PERFORMANCE METRICS FOR DISCRETE PROCESSES
Metric Description
Product Quality A quantitative measurement of product goodness or purity
Defect Rate Rate at which a product fails quality control checks due to errors in the manufacturing process.
Defects per unit Statistical measures of the number of defects per unit
Process Restart Rate Number of times a process must be restarted in a given time interval.
3 Not all process state variables have pre-determined set points. Manual overrides are available in some control systems.

27 of 49
Metric Description
Variability of On-time Actuation
Statistical measure of time between command and actuation completion.
Process Duration Length of time to complete a sequence of tasks, such as a series of assembly tasks in a robotic assembly system.
TABLE 6. METRICS FOR MEASURING SYSTEM PERFORMANCE
Metric Description
Volatile Memory Utilization of system memory typically reported as a percentage of total RAM
Non-volatile Memory Utilization of system memory typically reported as a percentage of total system disk space
CPU Utilization Percentage of the total CPU usage time
I/O Read Load Total bytes read in the CPU I/O channel
I/O Write Load Total bytes written in the CPU I/O channel
Missed Scans (Rate) When using a device such as a PLC that scans all variables before executing the next iteration of control, the total number of sensor readings missed in a given time interval.
TABLE 7. NOMINAL SYSTEM PROPERTIES FOR MEASURING SYSTEM PERFORMANCE
Metric Description
Medium Type Examples include Copper, Fiber, Wireless and the associated protocol used such as CAT-6 copper or 802.11g wireless.
Physical Channel Bandwidth
The full bandwidth allocated to the channel. This can be useful for wireless channels such as IEEE 802.15.4 and modulated wired channels such as Ethernet.
Rated Channel Capacity
Rated capacity for transmitting and receiving elements in the network
Channel Encoding Algorithm or structure used to encode the transmissions to include interleaving, channel coding, modulation, and interference handling properties
Environmental Characteristics
Mechanical, electrical, and electromagnetic properties of the environment in which the system is deployed.
Channel Compression The data compression algorithm used for transmission
Rated Channel Throughput
The advertised theoretical throughput for a given transmitting or receiving device
Routing Algorithms Used
The type of routing algorithm employed. Knowing the routing algorithm is particularly useful for mobile ad-hoc networks and fully loaded ad-hoc networks.
28 of 49
Metric Description
Switching Algorithms Used
The type of layer 2 switching algorithm employed.
Determinism Boundaries
Real-time constraints of the system which is known a priori
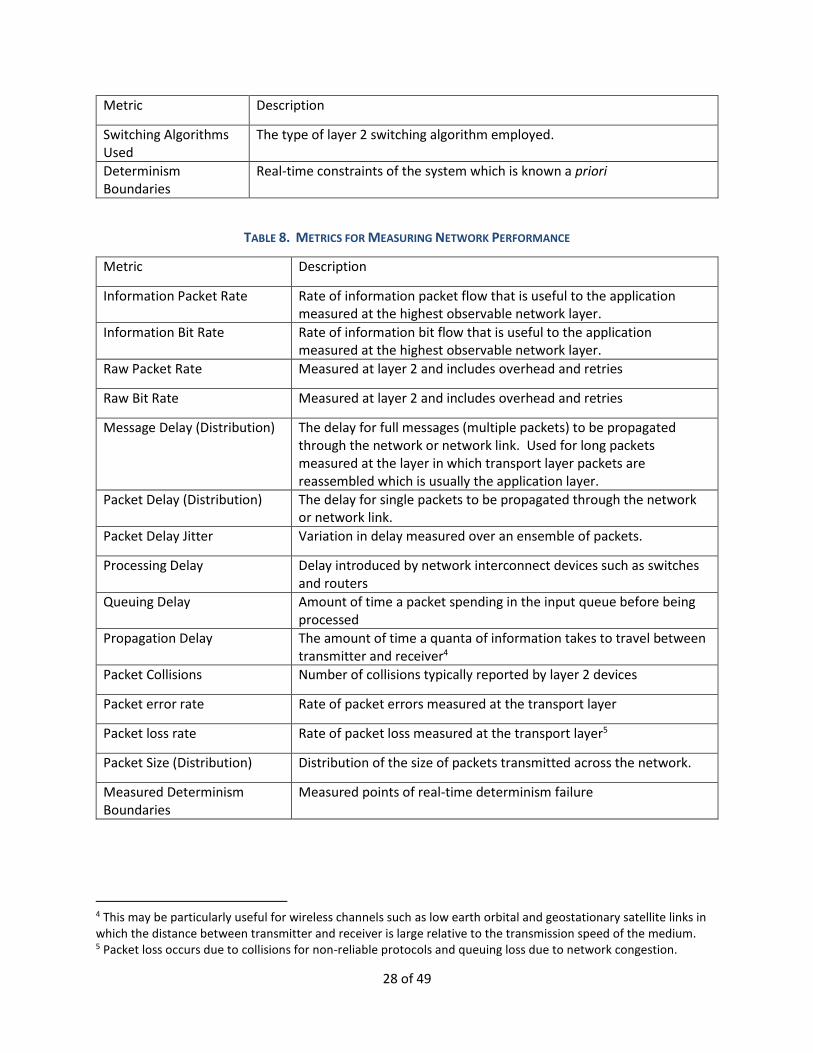
TABLE 8. METRICS FOR MEASURING NETWORK PERFORMANCE
Metric Description
Information Packet Rate Rate of information packet flow that is useful to the application measured at the highest observable network layer.
Information Bit Rate Rate of information bit flow that is useful to the application measured at the highest observable network layer.
Raw Packet Rate Measured at layer 2 and includes overhead and retries
Raw Bit Rate Measured at layer 2 and includes overhead and retries
Message Delay (Distribution) The delay for full messages (multiple packets) to be propagated through the network or network link. Used for long packets measured at the layer in which transport layer packets are reassembled which is usually the application layer.
Packet Delay (Distribution) The delay for single packets to be propagated through the network or network link.
Packet Delay Jitter Variation in delay measured over an ensemble of packets.
Processing Delay Delay introduced by network interconnect devices such as switches and routers
Queuing Delay Amount of time a packet spending in the input queue before being processed
Propagation Delay The amount of time a quanta of information takes to travel between transmitter and receiver4
Packet Collisions Number of collisions typically reported by layer 2 devices
Packet error rate Rate of packet errors measured at the transport layer
Packet loss rate Rate of packet loss measured at the transport layer5
Packet Size (Distribution) Distribution of the size of packets transmitted across the network.
Measured Determinism Boundaries
Measured points of real-time determinism failure
4 This may be particularly useful for wireless channels such as low earth orbital and geostationary satellite links in which the distance between transmitter and receiver is large relative to the transmission speed of the medium. 5 Packet loss occurs due to collisions for non-reliable protocols and queuing loss due to network congestion.
29 of 49
8.4 NIST-SP 800-82 Security Overlay NIST Special Publication 800-82 provides guidance in the application of security to industrial
control systems. Rev 2 of NIST 800-82 Appendix G provides an overlay of NIST 800-53 security controls
(requirements) to the industrial control systems. The risk management process and security controls
overlay of 800-82 will be applied to the scenarios described in this report.
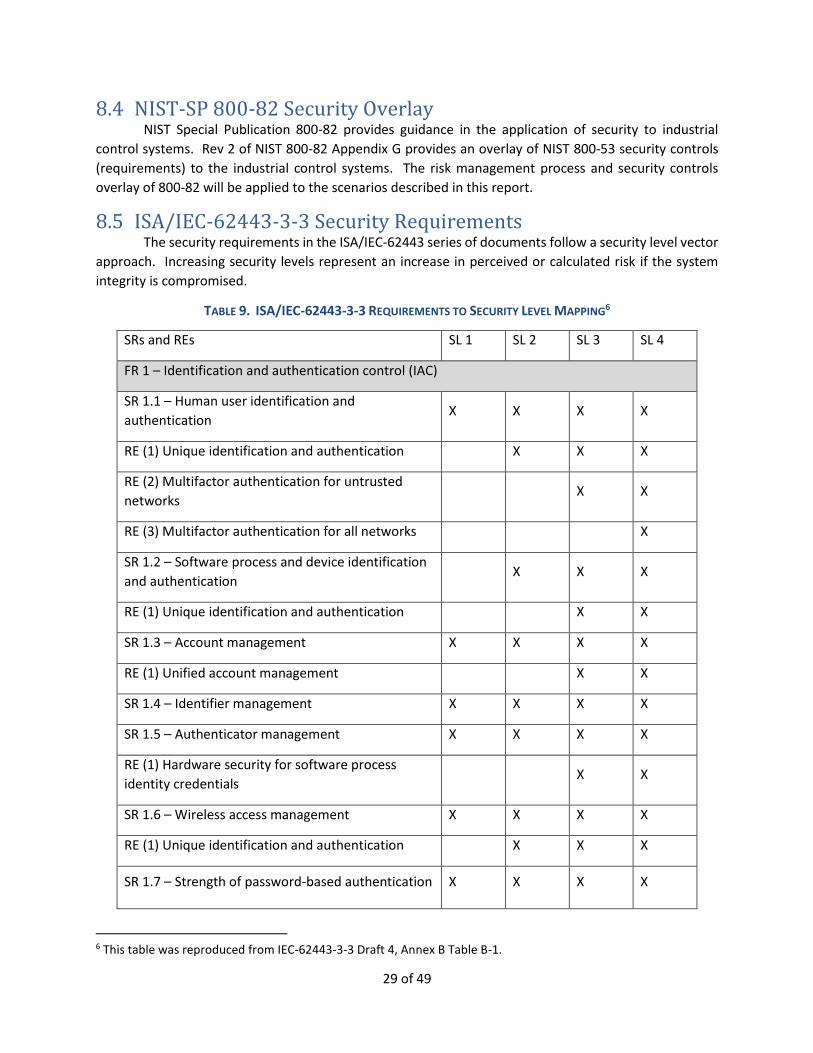
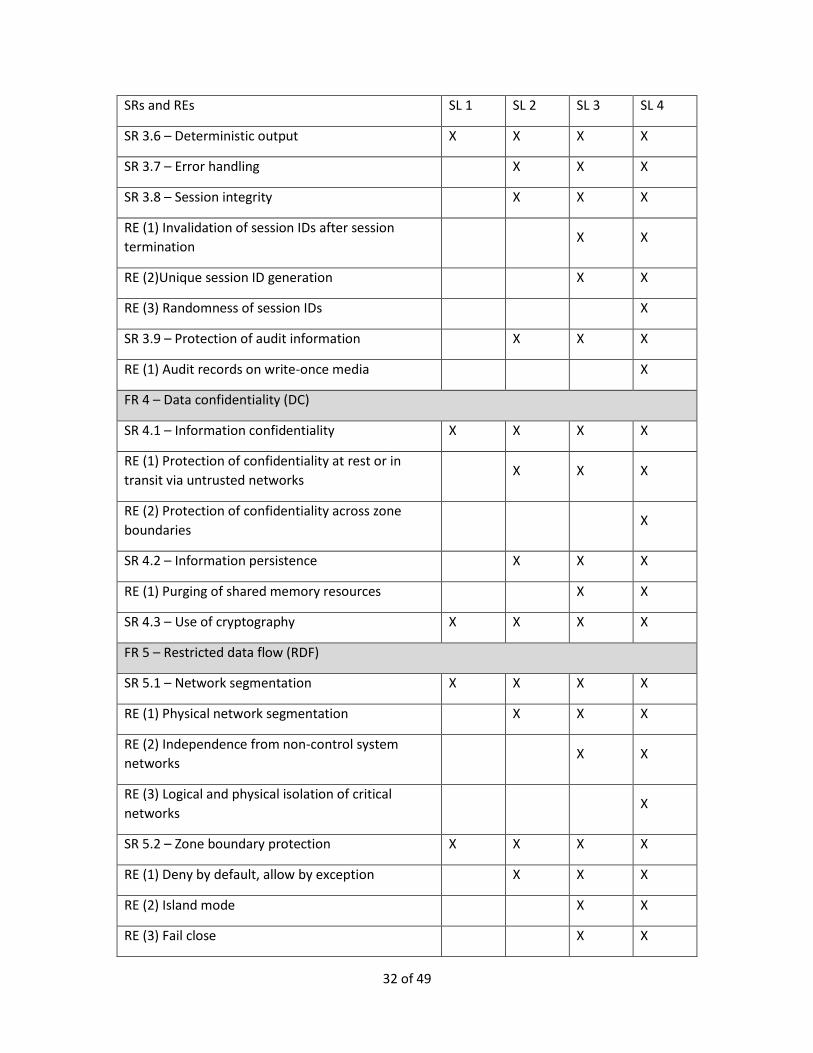
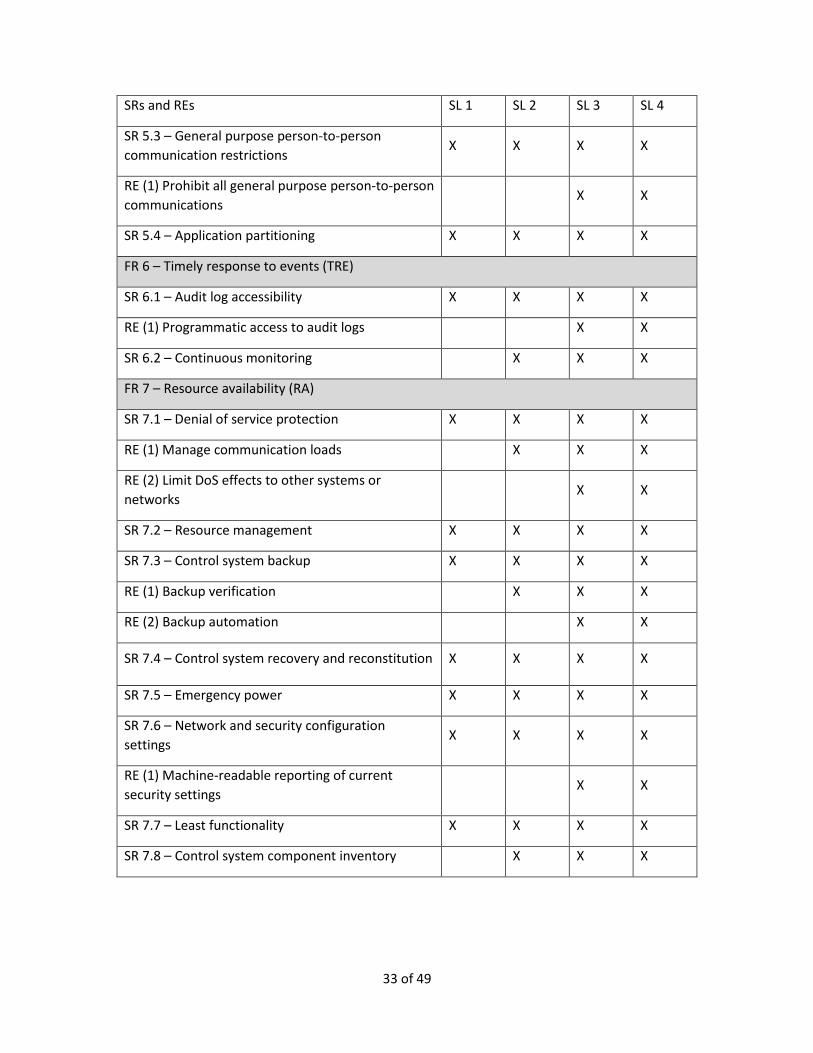
8.5 ISA/IEC-62443-3-3 Security Requirements The security requirements in the ISA/IEC-62443 series of documents follow a security level vector
approach. Increasing security levels represent an increase in perceived or calculated risk if the system
integrity is compromised.
TABLE 9. ISA/IEC-62443-3-3 REQUIREMENTS TO SECURITY LEVEL MAPPING6
SRs and REs SL 1 SL 2 SL 3 SL 4
FR 1 – Identification and authentication control (IAC)
SR 1.1 – Human user identification and
authentication X X X X
RE (1) Unique identification and authentication X X X
RE (2) Multifactor authentication for untrusted
networks X X
RE (3) Multifactor authentication for all networks X
SR 1.2 – Software process and device identification
and authentication X X X
RE (1) Unique identification and authentication X X
SR 1.3 – Account management X X X X
RE (1) Unified account management X X
SR 1.4 – Identifier management X X X X
SR 1.5 – Authenticator management X X X X
RE (1) Hardware security for software process
identity credentials X X
SR 1.6 – Wireless access management X X X X
RE (1) Unique identification and authentication X X X
SR 1.7 – Strength of password-based authentication X X X X
6 This table was reproduced from IEC-62443-3-3 Draft 4, Annex B Table B-1.

30 of 49
SRs and REs SL 1 SL 2 SL 3 SL 4
RE (1) Password generation and lifetime restrictions
for human users X X
RE (2) Password lifetime restrictions for all users X
SR 1.8 – Public key infrastructure certificates X X X
SR 1.9 – Strength of public key authentication X X X
RE (1) Hardware security for public key
authentication X X
SR 1.10 – Authenticator feedback X X X X
SR 1.11 – Unsuccessful login attempts X X X X
SR 1.12 – System use notification X X X X
SR 1.13 – Access via untrusted networks X X X X
RE (1)Explicit access request approval X X X
FR 2 – Use control (UC)
SR 2.1 – Authorization enforcement X X X X
RE (1) Authorization enforcement for all users X X X
RE (2) Permission mapping to roles X X X
RE (3) Supervisor override X X
RE (4) Dual approval X
SR 2.2 – Wireless use control X X X X
RE (1) Identify and report unauthorized wireless
devices X X
SR 2.3 – Use control for portable and mobile
devices X X X X
RE (1) Enforcement of security status of portable
and mobile devices X X
SR 2.4 – Mobile code X X X X
RE (1) Mobile code integrity check X X
SR 2.5 – Session lock X X X X
SR 2.6 – Remote session termination X X X

31 of 49
SRs and REs SL 1 SL 2 SL 3 SL 4
SR 2.7 – Concurrent session control X X
SR 2.8 – Auditable events X X X X
RE (1) Centrally managed, system-wide audit trail X X
SR 2.9 – Audit storage capacity X X X X
RE (1) Warn when audit record storage capacity
threshold reached X X
SR 2.10 – Response to audit processing failures X X X X
SR 2.11 – Timestamps X X X
RE (1)Internal time synchronization X X
RE (2) Protection of time source integrity X
SR 2.12 – Non-repudiation X X
RE (1) Non-repudiation for all users X
FR 3 – System integrity (SI)
SR 3.1 – Communication integrity X X X X
RE (1) Cryptographic integrity protection X X
SR 3.2 – Malicious code protection X X X X
RE (1) Malicious code protection on entry and exit
points X X X
RE (2) Central management and reporting for
malicious code protection X X
SR 3.3 – Security functionality verification X X X X
RE (1) Automated mechanisms for security
functionality verification X X
RE (2) Security functionality verification during
normal operation X
SR 3.4 – Software and information integrity X X X X
RE (1) Automated notification about integrity
violations X X
SR 3.5 – Input validation X X X X
32 of 49
SRs and REs SL 1 SL 2 SL 3 SL 4
SR 3.6 – Deterministic output X X X X
SR 3.7 – Error handling X X X
SR 3.8 – Session integrity X X X
RE (1) Invalidation of session IDs after session
termination X X
RE (2)Unique session ID generation X X
RE (3) Randomness of session IDs X
SR 3.9 – Protection of audit information X X X
RE (1) Audit records on write-once media X
FR 4 – Data confidentiality (DC)
SR 4.1 – Information confidentiality X X X X
RE (1) Protection of confidentiality at rest or in
transit via untrusted networks X X X
RE (2) Protection of confidentiality across zone
boundaries X
SR 4.2 – Information persistence X X X
RE (1) Purging of shared memory resources X X
SR 4.3 – Use of cryptography X X X X
FR 5 – Restricted data flow (RDF)
SR 5.1 – Network segmentation X X X X
RE (1) Physical network segmentation X X X
RE (2) Independence from non-control system
networks X X
RE (3) Logical and physical isolation of critical
networks X
SR 5.2 – Zone boundary protection X X X X
RE (1) Deny by default, allow by exception X X X
RE (2) Island mode X X
RE (3) Fail close X X
33 of 49
SRs and REs SL 1 SL 2 SL 3 SL 4
SR 5.3 – General purpose person-to-person
communication restrictions X X X X
RE (1) Prohibit all general purpose person-to-person
communications X X
SR 5.4 – Application partitioning X X X X
FR 6 – Timely response to events (TRE)
SR 6.1 – Audit log accessibility X X X X
RE (1) Programmatic access to audit logs X X
SR 6.2 – Continuous monitoring X X X
FR 7 – Resource availability (RA)
SR 7.1 – Denial of service protection X X X X
RE (1) Manage communication loads X X X
RE (2) Limit DoS effects to other systems or
networks X X
SR 7.2 – Resource management X X X X
SR 7.3 – Control system backup X X X X
RE (1) Backup verification X X X
RE (2) Backup automation X X
SR 7.4 – Control system recovery and reconstitution X X X X
SR 7.5 – Emergency power X X X X
SR 7.6 – Network and security configuration
settings X X X X
RE (1) Machine-readable reporting of current
security settings X X
SR 7.7 – Least functionality X X X X
SR 7.8 – Control system component inventory X X X
34 of 49
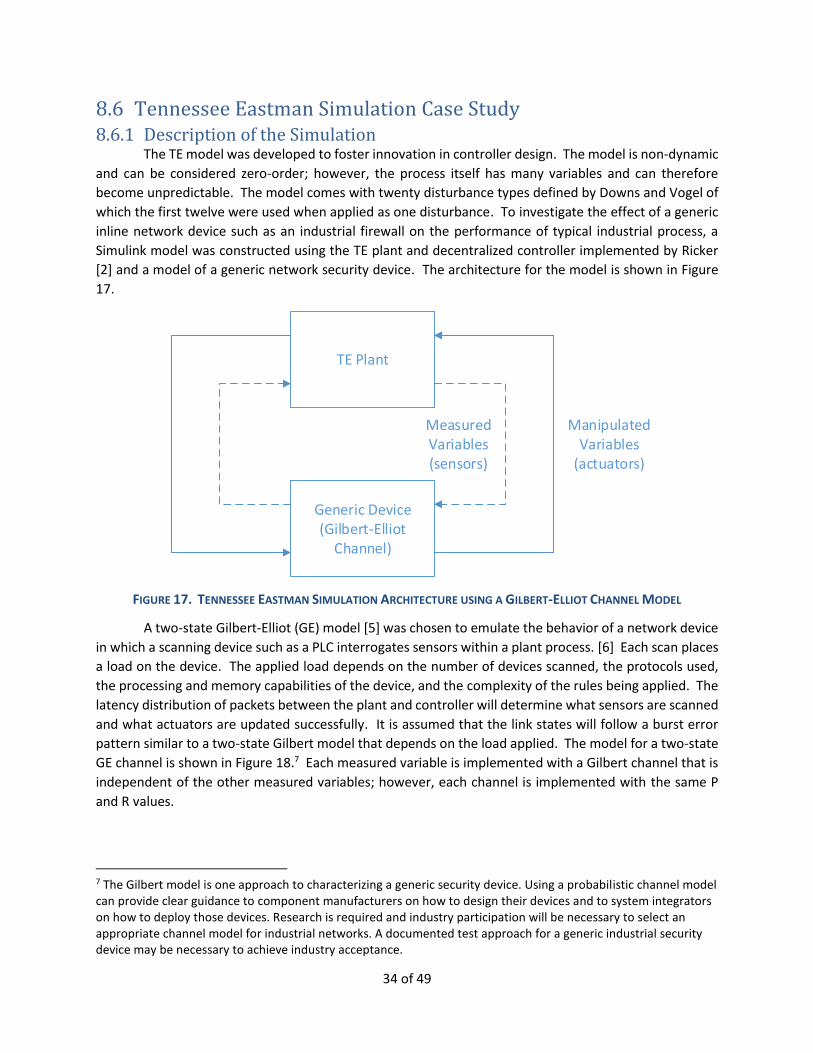
8.6 Tennessee Eastman Simulation Case Study 8.6.1 Description of the Simulation
The TE model was developed to foster innovation in controller design. The model is non-dynamic
and can be considered zero-order; however, the process itself has many variables and can therefore
become unpredictable. The model comes with twenty disturbance types defined by Downs and Vogel of
which the first twelve were used when applied as one disturbance. To investigate the effect of a generic
inline network device such as an industrial firewall on the performance of typical industrial process, a
Simulink model was constructed using the TE plant and decentralized controller implemented by Ricker
[2] and a model of a generic network security device. The architecture for the model is shown in Figure
17.
TE Plant
Generic Device(Gilbert-Elliot
Channel)
MeasuredVariables(sensors)
ManipulatedVariables
(actuators)
FIGURE 17. TENNESSEE EASTMAN SIMULATION ARCHITECTURE USING A GILBERT-ELLIOT CHANNEL MODEL
A two-state Gilbert-Elliot (GE) model [5] was chosen to emulate the behavior of a network device
in which a scanning device such as a PLC interrogates sensors within a plant process. [6] Each scan places
a load on the device. The applied load depends on the number of devices scanned, the protocols used,
the processing and memory capabilities of the device, and the complexity of the rules being applied. The
latency distribution of packets between the plant and controller will determine what sensors are scanned
and what actuators are updated successfully. It is assumed that the link states will follow a burst error
pattern similar to a two-state Gilbert model that depends on the load applied. The model for a two-state
GE channel is shown in Figure 18.7 Each measured variable is implemented with a Gilbert channel that is
independent of the other measured variables; however, each channel is implemented with the same P
and R values.
7 The Gilbert model is one approach to characterizing a generic security device. Using a probabilistic channel model can provide clear guidance to component manufacturers on how to design their devices and to system integrators on how to deploy those devices. Research is required and industry participation will be necessary to select an appropriate channel model for industrial networks. A documented test approach for a generic industrial security device may be necessary to achieve industry acceptance.
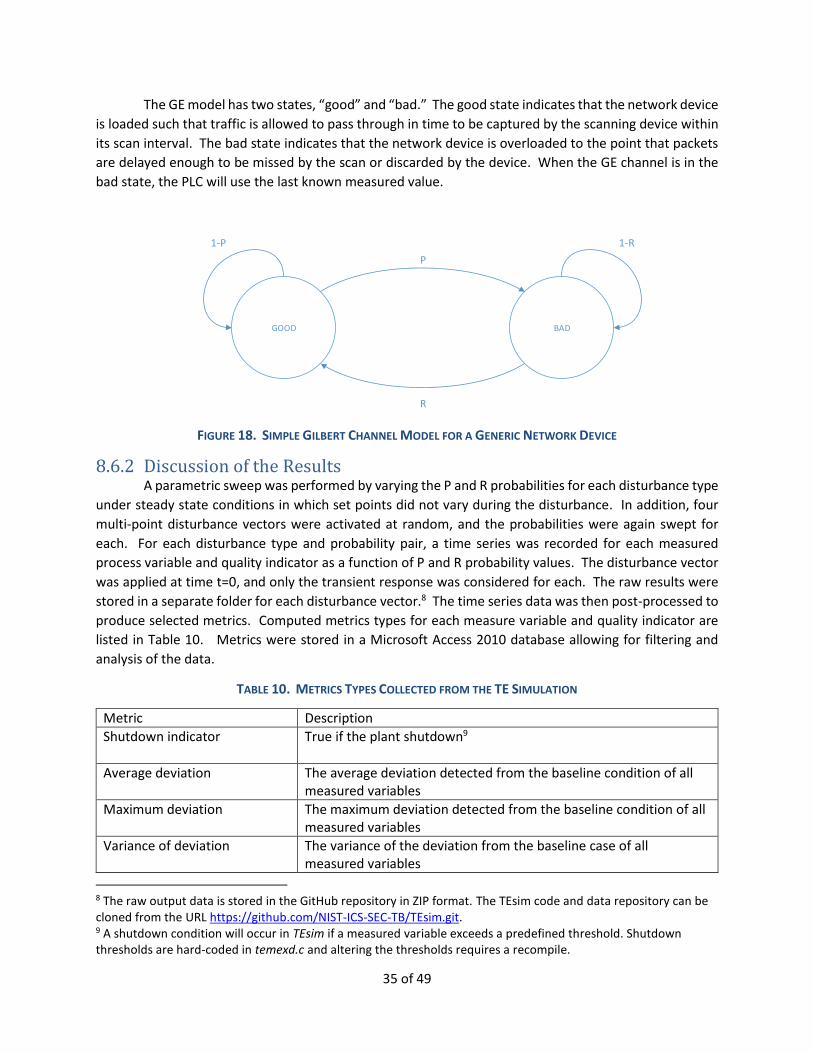
35 of 49
The GE model has two states, “good” and “bad.” The good state indicates that the network device
is loaded such that traffic is allowed to pass through in time to be captured by the scanning device within
its scan interval. The bad state indicates that the network device is overloaded to the point that packets
are delayed enough to be missed by the scan or discarded by the device. When the GE channel is in the
bad state, the PLC will use the last known measured value.
GOOD BAD
P
R
1-P 1-R
FIGURE 18. SIMPLE GILBERT CHANNEL MODEL FOR A GENERIC NETWORK DEVICE
8.6.2 Discussion of the Results A parametric sweep was performed by varying the P and R probabilities for each disturbance type
under steady state conditions in which set points did not vary during the disturbance. In addition, four
multi-point disturbance vectors were activated at random, and the probabilities were again swept for
each. For each disturbance type and probability pair, a time series was recorded for each measured
process variable and quality indicator as a function of P and R probability values. The disturbance vector
was applied at time t=0, and only the transient response was considered for each. The raw results were
stored in a separate folder for each disturbance vector.8 The time series data was then post-processed to
produce selected metrics. Computed metrics types for each measure variable and quality indicator are
listed in Table 10. Metrics were stored in a Microsoft Access 2010 database allowing for filtering and
analysis of the data.
TABLE 10. METRICS TYPES COLLECTED FROM THE TE SIMULATION
Metric Description
Shutdown indicator
True if the plant shutdown9
Average deviation The average deviation detected from the baseline condition of all measured variables
Maximum deviation The maximum deviation detected from the baseline condition of all measured variables
Variance of deviation The variance of the deviation from the baseline case of all measured variables
8 The raw output data is stored in the GitHub repository in ZIP format. The TEsim code and data repository can be cloned from the URL https://github.com/NIST-ICS-SEC-TB/TEsim.git. 9 A shutdown condition will occur in TEsim if a measured variable exceeds a predefined threshold. Shutdown thresholds are hard-coded in temexd.c and altering the thresholds requires a recompile.

36 of 49
Metric Description
Correlation to baseline The correlation of the measured variable to the baseline case of all measured variables
Operating Cost Correlation The correlation between operating cost and the baseline case
Operating Cost Max. Deviation The maximum deviation of operating cost to the baseline case
Percent G Correlation
The correlation of operating cost to the baseline case
Percent G Max. Deviation
The maximum deviation between operating cost and the baseline case
Percent G Variance of Deviation
The variance of the molar percentage of G from the baseline case
A full listing of the calculated metrics is given in Table 11.
TABLE 11. LISTING OF THE METRICS TABLE IN THE RESULTS DATABASE
Name Type
P Double
R Double
IDVnum Double
Shutdown Integer
AVGDEV from A feed stream 1 Double
AVGDEV from D feed stream 2 Double
AVGDEV from E feed stream 3 Double
AVGDEV from A and C feed stream 4 Double
AVGDEV from Recycle flow Stream 8 Double
AVGDEV from Reactor feed rate stream 6 Double
AVGDEV from Reactor pressure Double
AVGDEV from Reactor level Double
AVGDEV from Reactor temperature Double
AVGDEV from Purge rate stream 9 Double
AVGDEV from Product separator temperature Double
AVGDEV from Product separator level Double
AVGDEV from Product separator pressure Double
AVGDEV from Product separator underflow stream 10 Double
AVGDEV from stripper level Double
AVGDEV from stripper pressure Double
AVGDEV from Stripper underflow stream 11 Double
AVGDEV from stripper temperature Double
AVGDEV from strippx steam dew Double
AVGDEV from Compressor work Double
AVGDEV from Reactor cooling water outlet temperature Double
AVGDEV from separator cooling water outlet temperature Double
AVGDEV from Reactor feed A Double
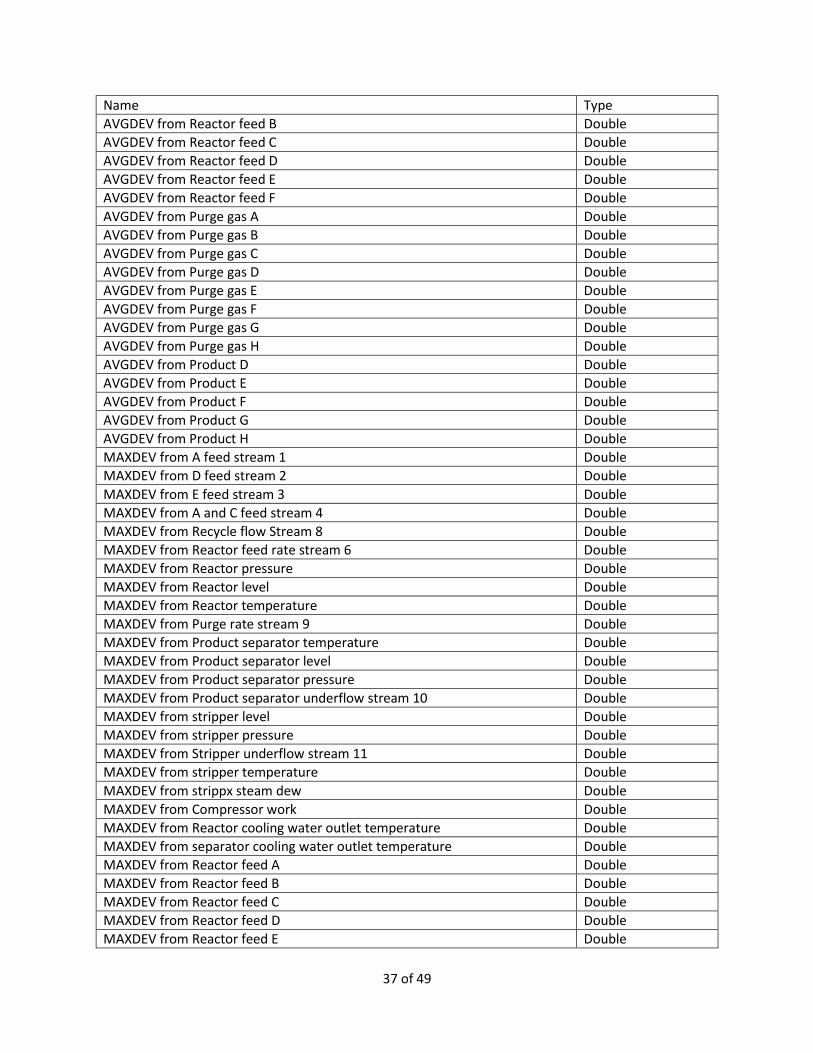
37 of 49
Name Type
AVGDEV from Reactor feed B Double
AVGDEV from Reactor feed C Double
AVGDEV from Reactor feed D Double
AVGDEV from Reactor feed E Double
AVGDEV from Reactor feed F Double
AVGDEV from Purge gas A Double
AVGDEV from Purge gas B Double
AVGDEV from Purge gas C Double
AVGDEV from Purge gas D Double
AVGDEV from Purge gas E Double
AVGDEV from Purge gas F Double
AVGDEV from Purge gas G Double
AVGDEV from Purge gas H Double
AVGDEV from Product D Double
AVGDEV from Product E Double
AVGDEV from Product F Double
AVGDEV from Product G Double
AVGDEV from Product H Double
MAXDEV from A feed stream 1 Double
MAXDEV from D feed stream 2 Double
MAXDEV from E feed stream 3 Double
MAXDEV from A and C feed stream 4 Double
MAXDEV from Recycle flow Stream 8 Double
MAXDEV from Reactor feed rate stream 6 Double
MAXDEV from Reactor pressure Double
MAXDEV from Reactor level Double
MAXDEV from Reactor temperature Double
MAXDEV from Purge rate stream 9 Double
MAXDEV from Product separator temperature Double
MAXDEV from Product separator level Double
MAXDEV from Product separator pressure Double
MAXDEV from Product separator underflow stream 10 Double
MAXDEV from stripper level Double
MAXDEV from stripper pressure Double
MAXDEV from Stripper underflow stream 11 Double
MAXDEV from stripper temperature Double
MAXDEV from strippx steam dew Double
MAXDEV from Compressor work Double
MAXDEV from Reactor cooling water outlet temperature Double
MAXDEV from separator cooling water outlet temperature Double
MAXDEV from Reactor feed A Double
MAXDEV from Reactor feed B Double
MAXDEV from Reactor feed C Double
MAXDEV from Reactor feed D Double
MAXDEV from Reactor feed E Double
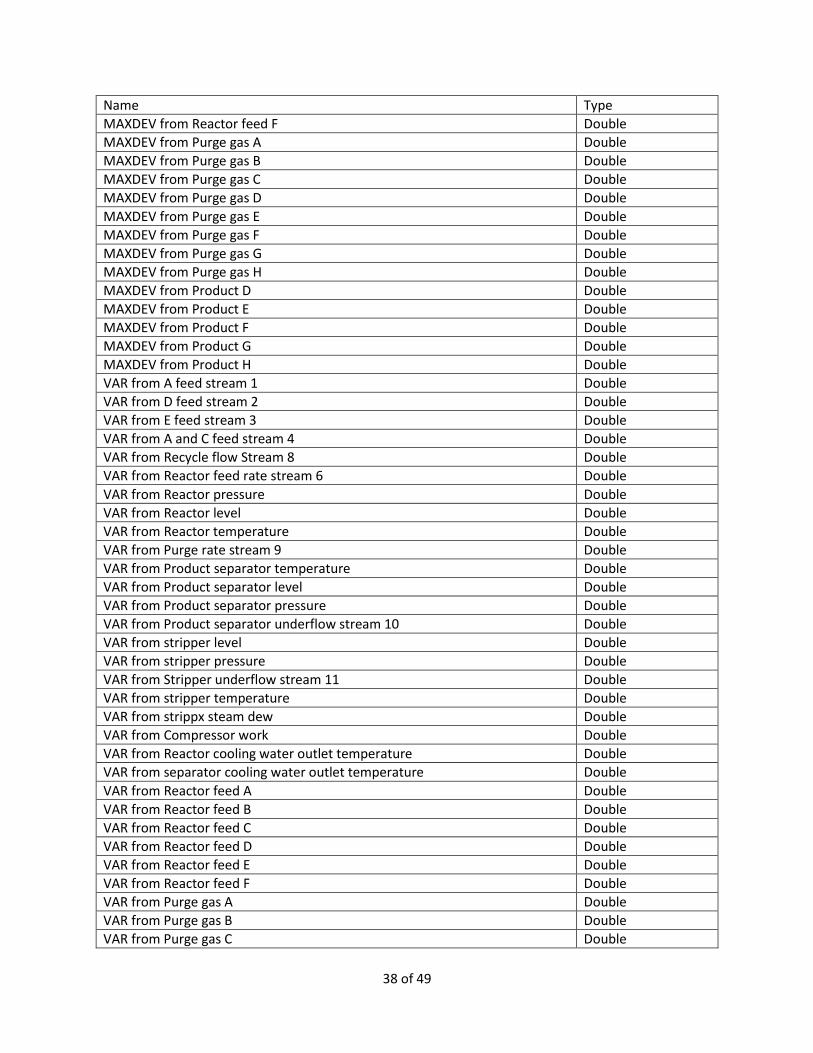
38 of 49
Name Type
MAXDEV from Reactor feed F Double
MAXDEV from Purge gas A Double
MAXDEV from Purge gas B Double
MAXDEV from Purge gas C Double
MAXDEV from Purge gas D Double
MAXDEV from Purge gas E Double
MAXDEV from Purge gas F Double
MAXDEV from Purge gas G Double
MAXDEV from Purge gas H Double
MAXDEV from Product D Double
MAXDEV from Product E Double
MAXDEV from Product F Double
MAXDEV from Product G Double
MAXDEV from Product H Double
VAR from A feed stream 1 Double
VAR from D feed stream 2 Double
VAR from E feed stream 3 Double
VAR from A and C feed stream 4 Double
VAR from Recycle flow Stream 8 Double
VAR from Reactor feed rate stream 6 Double
VAR from Reactor pressure Double
VAR from Reactor level Double
VAR from Reactor temperature Double
VAR from Purge rate stream 9 Double
VAR from Product separator temperature Double
VAR from Product separator level Double
VAR from Product separator pressure Double
VAR from Product separator underflow stream 10 Double
VAR from stripper level Double
VAR from stripper pressure Double
VAR from Stripper underflow stream 11 Double
VAR from stripper temperature Double
VAR from strippx steam dew Double
VAR from Compressor work Double
VAR from Reactor cooling water outlet temperature Double
VAR from separator cooling water outlet temperature Double
VAR from Reactor feed A Double
VAR from Reactor feed B Double
VAR from Reactor feed C Double
VAR from Reactor feed D Double
VAR from Reactor feed E Double
VAR from Reactor feed F Double
VAR from Purge gas A Double
VAR from Purge gas B Double
VAR from Purge gas C Double

39 of 49
Name Type
VAR from Purge gas D Double
VAR from Purge gas E Double
VAR from Purge gas F Double
VAR from Purge gas G Double
VAR from Purge gas H Double
VAR from Product D Double
VAR from Product E Double
VAR from Product F Double
VAR from Product G Double
VAR from Product H Double
CORR of A feed stream 1 Double
CORR of D feed stream 2 Double
CORR of E feed stream 3 Double
CORR of A and C feed stream 4 Double
CORR of Recycle flow Stream 8 Double
CORR of Reactor feed rate stream 6 Double
CORR of Reactor pressure Double
CORR of Reactor level Double
CORR of Reactor temperature Double
CORR of Purge rate stream 9 Double
CORR of Product separator temperature Double
CORR of Product separator level Double
CORR of Product separator pressure Double
CORR of Product separator underflow stream 10 Double
CORR of stripper level Double
CORR of stripper pressure Double
CORR of Stripper underflow stream 11 Double
CORR of stripper temperature Double
CORR of strippx steam dew Double
CORR of Compressor work Double
CORR of Reactor cooling water outlet temperature Double
CORR of separator cooling water outlet temperature Double
CORR of Reactor feed A Double
CORR of Reactor feed B Double
CORR of Reactor feed C Double
CORR of Reactor feed D Double
CORR of Reactor feed E Double
CORR of Reactor feed F Double
CORR of Purge gas A Double
CORR of Purge gas B Double
CORR of Purge gas C Double
CORR of Purge gas D Double
CORR of Purge gas E Double
CORR of Purge gas F Double
CORR of Purge gas G Double
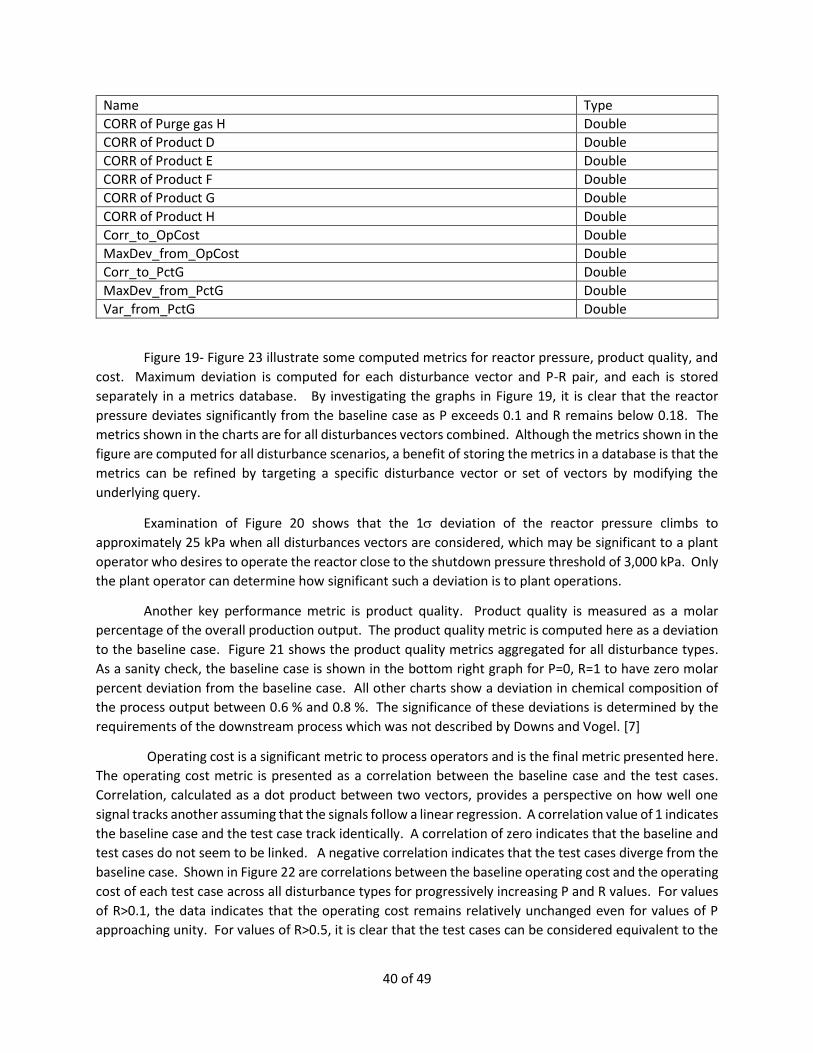
40 of 49
Name Type
CORR of Purge gas H Double
CORR of Product D Double
CORR of Product E Double
CORR of Product F Double
CORR of Product G Double
CORR of Product H Double
Corr_to_OpCost Double
MaxDev_from_OpCost Double
Corr_to_PctG Double
MaxDev_from_PctG Double
Var_from_PctG Double
Figure 19- Figure 23 illustrate some computed metrics for reactor pressure, product quality, and
cost. Maximum deviation is computed for each disturbance vector and P-R pair, and each is stored
separately in a metrics database. By investigating the graphs in Figure 19, it is clear that the reactor
pressure deviates significantly from the baseline case as P exceeds 0.1 and R remains below 0.18. The
metrics shown in the charts are for all disturbances vectors combined. Although the metrics shown in the
figure are computed for all disturbance scenarios, a benefit of storing the metrics in a database is that the
metrics can be refined by targeting a specific disturbance vector or set of vectors by modifying the
underlying query.
Examination of Figure 20 shows that the 1 deviation of the reactor pressure climbs to
approximately 25 kPa when all disturbances vectors are considered, which may be significant to a plant
operator who desires to operate the reactor close to the shutdown pressure threshold of 3,000 kPa. Only
the plant operator can determine how significant such a deviation is to plant operations.
Another key performance metric is product quality. Product quality is measured as a molar
percentage of the overall production output. The product quality metric is computed here as a deviation
to the baseline case. Figure 21 shows the product quality metrics aggregated for all disturbance types.
As a sanity check, the baseline case is shown in the bottom right graph for P=0, R=1 to have zero molar
percent deviation from the baseline case. All other charts show a deviation in chemical composition of
the process output between 0.6 % and 0.8 %. The significance of these deviations is determined by the
requirements of the downstream process which was not described by Downs and Vogel. [7]
Operating cost is a significant metric to process operators and is the final metric presented here.
The operating cost metric is presented as a correlation between the baseline case and the test cases.
Correlation, calculated as a dot product between two vectors, provides a perspective on how well one
signal tracks another assuming that the signals follow a linear regression. A correlation value of 1 indicates
the baseline case and the test case track identically. A correlation of zero indicates that the baseline and
test cases do not seem to be linked. A negative correlation indicates that the test cases diverge from the
baseline case. Shown in Figure 22 are correlations between the baseline operating cost and the operating
cost of each test case across all disturbance types for progressively increasing P and R values. For values
of R>0.1, the data indicates that the operating cost remains relatively unchanged even for values of P
approaching unity. For values of R>0.5, it is clear that the test cases can be considered equivalent to the

41 of 49
baseline case. This indicates that a high recovery probability is essential to maintaining expected
operating costs.
While correlation of operating cost between the baseline case and the test cases is an interesting
metric, an operator would still want to understand the cost deviation from baseline. Cost deviation from
baseline iss shown in Figure 23. Cost Deviation is calculated as the baseline cost minus the test case cost.
While one may expect operating costs to rise if the network is impacts, the opposite is actually true for
TEsim. Operating costs are primarily a function of the rate of consumption of raw materials. Raw
materials are lost in the purge gas, the product stream, and by two side reactions. A reduction in cost
could indicate an undesirable affect to product quality that may affect downstream processes and
ultimately increase costs.
FIGURE 19. REACTOR PRESSURE METRICS FOR ALL DISTURBANCES

42 of 49
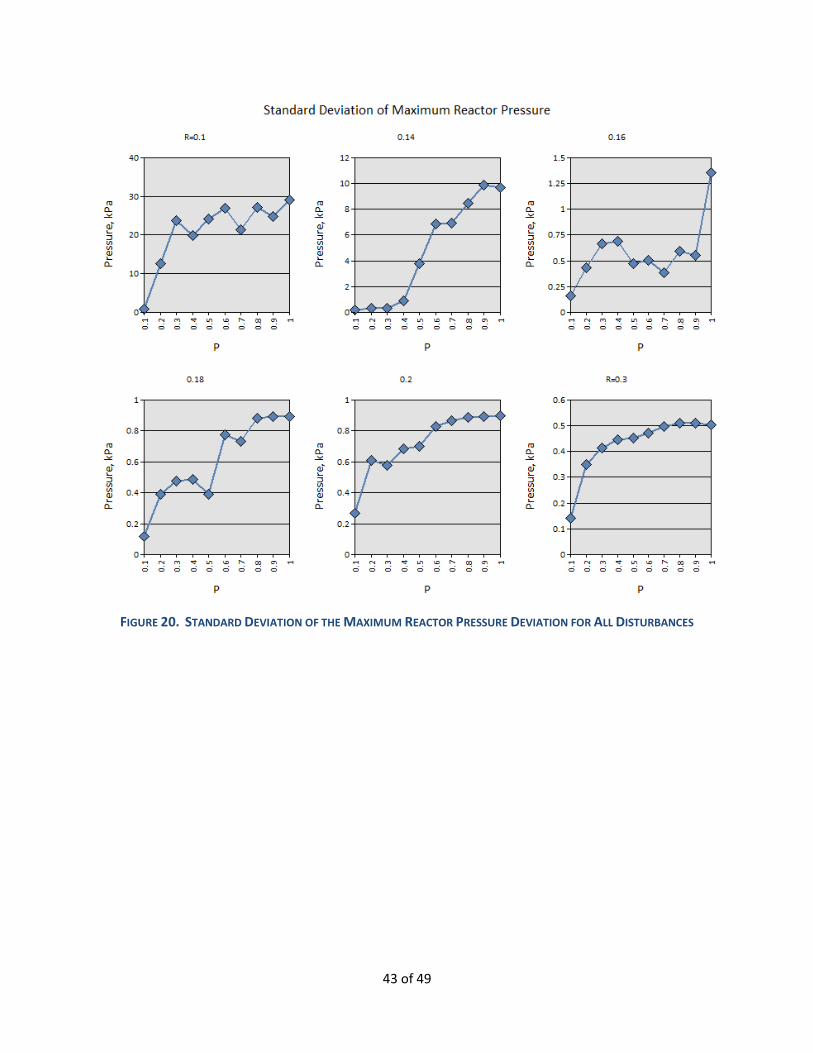
43 of 49
FIGURE 20. STANDARD DEVIATION OF THE MAXIMUM REACTOR PRESSURE DEVIATION FOR ALL DISTURBANCES
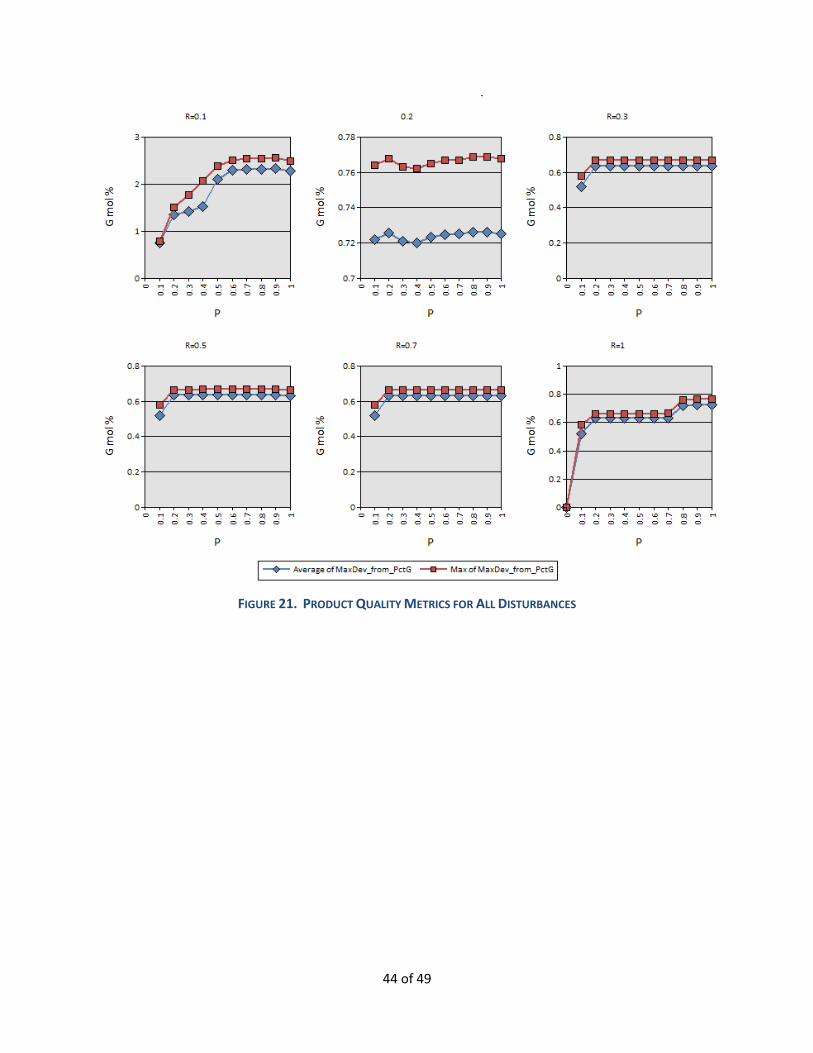
44 of 49
FIGURE 21. PRODUCT QUALITY METRICS FOR ALL DISTURBANCES

45 of 49
FIGURE 22. OPERATING COST METRIC FOR ALL DISTURBANCES

46 of 49
FIGURE 23. DEVIATION OF OPERATING COST FROM BASELINE

47 of 49
8.6.3 Conclusions and Recommendations The TE model provides a large number of variables by which to measure performance. By applying
various disturbances and channel model probabilities, over 2,000 different scenarios were executed. Time
series data sets for each of the 41 measured variables and several other indicators for each scenario were
generated. The raw output data for each disturbance vector and channel model was stored in a MATLAB
formatted data file (i.e., a “.mat” file). Scripts were developed to produce statistical metrics for the data
and collect the metrics in both a Microsoft® Excel spreadsheet and a Microsoft® Access database. All code
and metrics were stored for public use in the TEsim GitHub repository.
The Tennessee Eastman process can be said to exhibit slow dynamics properties, and much of the
model as it is implemented can be considered of zero order. However, this does not mean that the “real-
world” equivalent would have no dynamic properties. A real world process would exhibit physical
oscillations (temperature, pressure, and composition) due to physical and chemical processes.
Considering the widespread acceptance of the TE process model by industry and academia, the TE model
as it is implemented represents the real-world process accurately enough to measure the effects of a
generic network security control on the process.
The TEsim results indicate that a simple Gilbert channel between plant and controller does indeed
impact process performance when the probability of transition from the good state to the bad state
appreciably exceeds zero and the recovery probability, R, remains very low. It is incumbent upon the
system integrator to select a network configuration and device capabilities that can accommodate the
number of sensors, the number of actuators, and the security policies to be enforced. Enforcement of
security may include deep packet inspection, authentication, and encryption all of which will introduce a
processing load on the device. It can therefore be recommended that the devices be chosen such that
the communications channel between plant and controller is operated in a P-R region appropriate for the
application.
Deployment of perimeter security devices to existing industrial applications requires the operator
to first ascertain the need for security. This should be performed in accordance with NIST SP 800-82 or
an associated standard. If a security posture is required based on the outcome of the risk assessment,
the operator must ascertain the impact of security controls on the performance of the industrial process
being instrumented assuming that the deployed protocols are compatible with available security devices.
Many legacy operations may simply require security controls implemented at the boundary between the
ICS and the corporate network or public internet. Other ICSs may require security controls between
sensor/actuator space and the controller (i.e., the PLC) as was implemented in TEsim model. Once a set
of security controls is selected for the ICS, a network architecture must be developed (if the existing
architecture can be modified) and security devices must be selected. The security devices should be
selected with sufficient processing and memory capabilities to support the intended protocols, traffic,
scan rate (if applicable), algorithms, and set of security rules (if applicable). If it is unclear how
performance will be affected using the data provided by the device manufacturer, device characterization
and simulation is recommended.10 The GE channel method that was applied to the TE process is one
proposed method to measure performance in simulation. Using the TEsim method would require the
system integrator to characterize each security device with the protocols and rules intended. This
10 A standard test methodology does not yet exist for security device manufacturers and ICS system integrators to measure the performance of a security device as it relates to ICS performance impact assessment.
48 of 49
approach implies the need for a test method to characterize ICS security devices, yet no NIST-
recommended method yet exists for this purpose.
Using TEsim, it was demonstrated that for the Tennessee Eastman processes in which sensor and
actuators were scanned at a rate of 1 Hz that the channel could tolerate some congestion through the
security device if the recovery probability was high enough. As stated, the TE process is slow acting and
can tolerate some interruption between plant and controller. Other processes may not be as tolerant to
interruption. Examples of such processes may include a robotic assembly process, high-speed conveyor
operations, and safety applications. Only the plant operator has the knowledge to ascertain the impact
of channel congestion on plant performance.
As previously stated, the number of sensors and actuators will impact the load on any aggregating
network device including switches, router, and firewalls. Logically grouping networked devices that
communicate through a security device may serve as a method to alleviate congestion in a single firewall.
While this approach will increase the number of devices to be managed (e.g., rule deployment and key
distribution) it could facilitate the enforcement of a stronger security policy on the network or make the
network safer to operate.
From a security perspective, it is recommended that the network topology, security devices, and
policies be selected appropriate to the estimated security risk in accordance with NIST SP 800-82. It is
further recommended that the devices and network topology selected be deployed with sufficient
processing headroom should a network-based attack occur. Few industrial network attacks will add
significant load to a network channel. Denial-of-service (DoS) attacks are obvious attack types that add
significant load to the network as this is the strategy of the DoS attack. Other more stealthy attacks could
overload the network channel by putting the security device into a state in which specific rules are
executed excessively. Security rules should be designed in such a way that the device cannot be driven
into an overload state. Depending on the estimated risk, an accurate software-based simulation that
includes realistic estimates of the heuristics load of filtering devices may be used to ascertain the impact
of security controls on the performance of the industrial process. Estimating heuristic load is entirely
different topic of interest for the ICS cybersecurity community.