Embed Size (px)
Citation preview
©FUNPEC-RP www.funpecrp.com.brGenetics and Molecular Research 14 (3): 7771-7781 (2015)
An improved K-means clustering method for cDNA microarray image segmentation
T.N. Wang1, T.J. Li2,3, G.F. Shao4 and S.X. Wu4
1Innovation Center of Conceive Design Implement Operate, Xiamen Institute of Technology, Huaqiao University, Xiamen, China2Institution of Automation, Chongqing University, Chongqing, China3Information Engineering College, Jimei University, Xiamen, China4Department of Automation, Xiamen University, Xiamen, China
Corresponding author: G.F. ShaoE-mail: [email protected]
Genet. Mol. Res. 14 (3): 7771-7781 (2015)Received October 31, 2014Accepted April 28, 2015Published July 14, 2015DOI http://dx.doi.org/10.4238/2015.July.14.3
ABSTRACT. Microarray technology is a powerful tool for human genetic research and other biomedical applications. Numerous improvements to the standard K-means algorithm have been carried out to complete the image segmentation step. However, most of the previous studies classify the image into two clusters. In this paper, we propose a novel K-means algorithm, which first classifies the image into three clusters, and then one of the three clusters is divided as the background region and the other two clusters, as the foreground region. The proposed method was evaluated on six different data sets. The analyses of accuracy, efficiency, expression values, special gene spots, and noise images demonstrate the effectiveness of our method in improving the segmentation quality.
Key words: cDNA microarray; Segmentation; K-means clustering
7772T.N. Wang et al.
©FUNPEC-RP www.funpecrp.com.brGenetics and Molecular Research 14 (3): 7771-7781 (2015)
INTRODUCTION
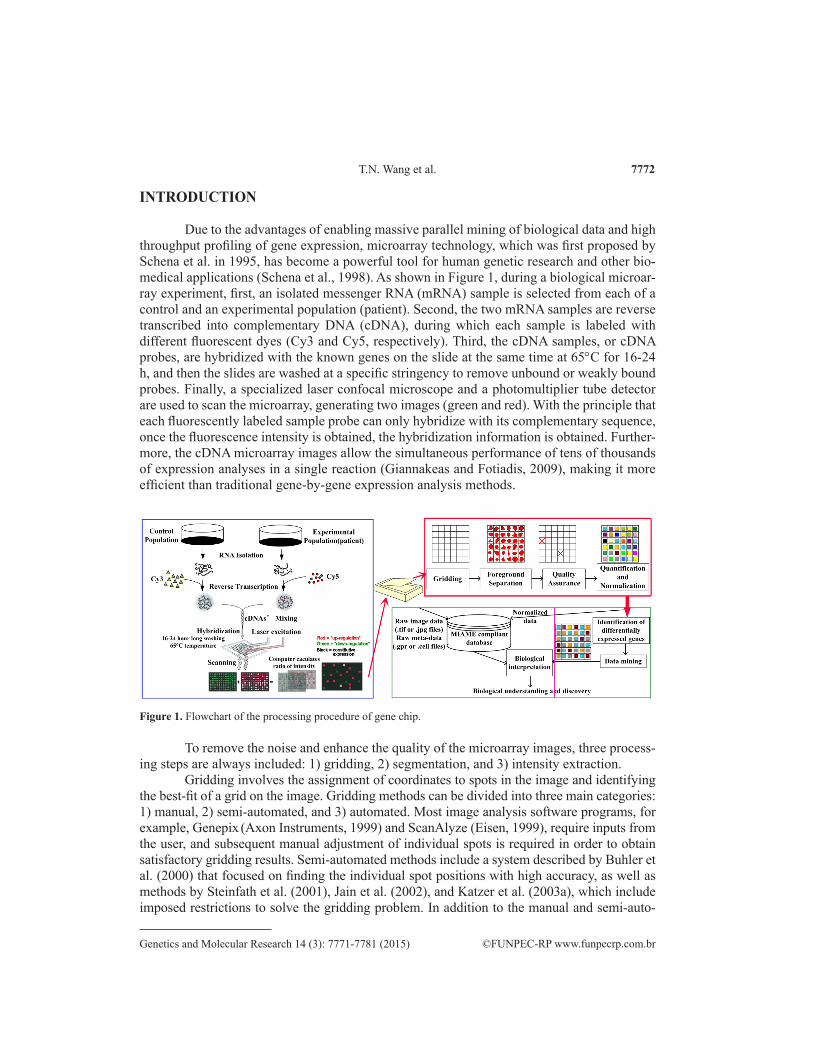
Due to the advantages of enabling massive parallel mining of biological data and high throughput profiling of gene expression, microarray technology, which was first proposed by Schena et al. in 1995, has become a powerful tool for human genetic research and other bio-medical applications (Schena et al., 1998). As shown in Figure 1, during a biological microar-ray experiment, first, an isolated messenger RNA (mRNA) sample is selected from each of a control and an experimental population (patient). Second, the two mRNA samples are reverse transcribed into complementary DNA (cDNA), during which each sample is labeled with different fluorescent dyes (Cy3 and Cy5, respectively). Third, the cDNA samples, or cDNA probes, are hybridized with the known genes on the slide at the same time at 65°C for 16-24 h, and then the slides are washed at a specific stringency to remove unbound or weakly bound probes. Finally, a specialized laser confocal microscope and a photomultiplier tube detector are used to scan the microarray, generating two images (green and red). With the principle that each fluorescently labeled sample probe can only hybridize with its complementary sequence, once the fluorescence intensity is obtained, the hybridization information is obtained. Further-more, the cDNA microarray images allow the simultaneous performance of tens of thousands of expression analyses in a single reaction (Giannakeas and Fotiadis, 2009), making it more efficient than traditional gene-by-gene expression analysis methods.
Figure 1. Flowchart of the processing procedure of gene chip.
To remove the noise and enhance the quality of the microarray images, three process-ing steps are always included: 1) gridding, 2) segmentation, and 3) intensity extraction.
Gridding involves the assignment of coordinates to spots in the image and identifying the best-fit of a grid on the image. Gridding methods can be divided into three main categories: 1) manual, 2) semi-automated, and 3) automated. Most image analysis software programs, for example, Genepix (Axon Instruments, 1999) and ScanAlyze (Eisen, 1999), require inputs from the user, and subsequent manual adjustment of individual spots is required in order to obtain satisfactory gridding results. Semi-automated methods include a system described by Buhler et al. (2000) that focused on finding the individual spot positions with high accuracy, as well as methods by Steinfath et al. (2001), Jain et al. (2002), and Katzer et al. (2003a), which include imposed restrictions to solve the gridding problem. In addition to the manual and semi-auto-
7773K-means clustering method for microarray image segmentation
©FUNPEC-RP www.funpecrp.com.brGenetics and Molecular Research 14 (3): 7771-7781 (2015)
mated approaches, a large number of automated approaches have been proposed to improve the efficiency of the process. Yang et al. (2002a) used template matching to facilitate gridding. Jain et al. (2002) proposed the incorporation of axis projections of image intensity. A Markov random field method was proposed by Katzer et al. (2003b). Morphological operators (Hirata et al., 2001) and smooth filtering (Lonardi and Luo, 2004) have also been used.
Segmentation, which is the separation of the foreground pixels from those in the back-ground, considerably affects the precision of microarray data. The methods for the segmenta-tion of microarray images can be divided into four categories: 1) fixed or adaptive circle seg-mentation, which considers the spots in a fixed or adaptive circle shape, and classifies the pixels within the circle as the foreground and those outside of the circle as background. Although this method is very simple, it yields poor results when the spot morphology is not circular. 2) The seed region growing (SRG) algorithm, which is based on the conventional region growing pos-tulate of the similarity of pixels within regions (Adams and Bischof, 1994; Yang et al., 2002b). SRG initially chooses a number of seeds, and then evolves inductively from the seeds based on a specific rule of growth. This algorithm can effectively separate the foreground pixels from the background pixels and can adapt to various spot shapes; however, SRG has two disadvantages: i) the choice of the initial seeds and the definition of the rule of growth are difficult, and ii) spots with low intensity are easily missed. 3) The histogram method, wherein Chen et al. (1997) used a circular target mask and computed a threshold by the Mann-Whitney test to classify pixels into either foreground or background. This method is simple because of the advantage that assump-tions on spot shape are not required; however, the results are unstable when a larger mask is set to compensate for spot size variation. 4) Machine Learning techniques including i) clustering algorithms and ii) classification algorithms. In a clustering algorithm, or K-means clustering, the idea is to group the objects that are most similar to each other; this method had been used in microarray image segmentation by Bozinov and Rahnenführer (2002). Traditionally, the number of clusters, k, is assigned as two to separate the microarray image into foreground and back-ground clusters. Because the K-means clustering algorithm is not restricted to a particular shape and size for the spots, it has been widely used. A number of improved methods based on the standard K-means algorithm have also been proposed (Wu and Yan, 2003; Rueda and Qin, 2004; Giannakeas and Fotiadis, 2009; Uslan and Bucak, 2010; Maguluri et al., 2013). On the other hand, classification algorithms, which are a supervised learning method, need training samples to obtain a model. For example, the Support Vector Machine (SVM) method has been applied for segmentation (Giannakeas et al., 2008; Shao et al., 2013).
After segmentation, an intensity extraction step is carried out to identify the differently expressed genes. With the results of this identification, data mining methods and biological in-terpretation are applied to obtain biological understanding and discovery, as shown in Figure 1.
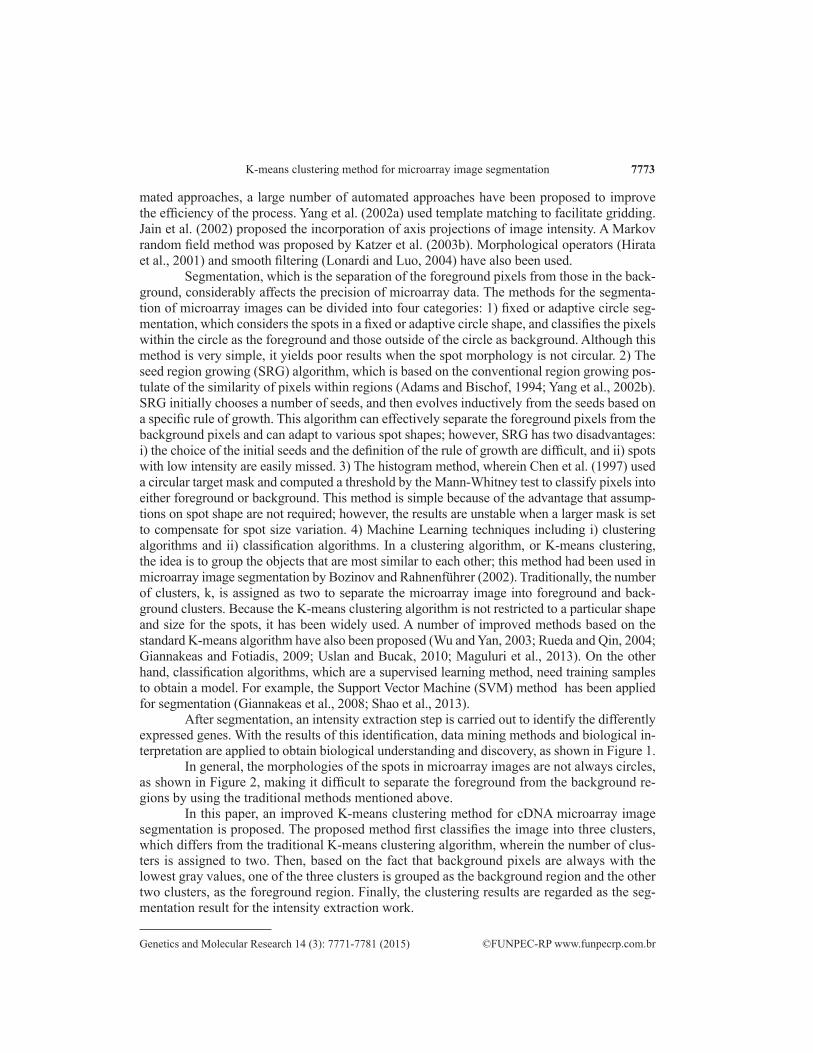
In general, the morphologies of the spots in microarray images are not always circles, as shown in Figure 2, making it difficult to separate the foreground from the background re-gions by using the traditional methods mentioned above.
In this paper, an improved K-means clustering method for cDNA microarray image segmentation is proposed. The proposed method first classifies the image into three clusters, which differs from the traditional K-means clustering algorithm, wherein the number of clus-ters is assigned to two. Then, based on the fact that background pixels are always with the lowest gray values, one of the three clusters is grouped as the background region and the other two clusters, as the foreground region. Finally, the clustering results are regarded as the seg-mentation result for the intensity extraction work.
7774T.N. Wang et al.
©FUNPEC-RP www.funpecrp.com.brGenetics and Molecular Research 14 (3): 7771-7781 (2015)
In this report, we introduce an improved K-means clustering method in the Methods section, and extensive experimental results and analysis are presented in Results and Discus-sion, where we present a concluding summary of the work carried out in this study.
MATERIAL AND METHODS
Materials
The experiments were implemented in Matlab 7.5 and were based on an Intel-based workstation with Windows XP OS (Microsoft Corp., Redmond, WA, USA). Microarray im-ages used in the experiments were obtained from six different data sets: Baylor College of Medicine (BCM), Swiss Institute of Bioinformatics (SIB), Joe DeRisi individual (DeRisi), University of California, San Francisco (UCSF), Gene Expression Omnibus (GEO), and Stan-ford Microarray Database (SMD). All of the images were stored in tiff files. Detailed informa-tion on the six different data sets is shown in Table 1.
Special morphology of spots
In microarray images, the spot morphologies are not always circles, that is, there exist various kinds of special spot morphologies in the same image. In Figure 2, we show 15 types of spot special morphologies along with the associated 3D effects. It is obvious that different spot morphologies produce different and complicated 3D results. Because of the complicated morphologies of the spots, the segmentation of microarray images became a challenging task.
Framework of the method proposed
Because of the special morphologies of spots in the microarray images, which have provided considerable challenges over the years, many methods have been introduced in the attempt to separate the foreground from the background regions more accurately.
In this paper, an improved K-means clustering algorithm is used. The method
Figure 2. Fifteen types of special morphology of spots.
7775K-means clustering method for microarray image segmentation
©FUNPEC-RP www.funpecrp.com.brGenetics and Molecular Research 14 (3): 7771-7781 (2015)
proposed begins with a median filtering step, and then image contrast enhancement is used to improve the image contrast. Third, the microarray image is segmented into either foreground or background regions with the improved K-means clustering algorithm. Fourth, owing to the existence of spots that could not be identified in the third step, fixed circle segmentation is added to the model. After completion of all of these steps, an intensity extraction step is implemented to identify the differentially expressed genes and finally to find the disease genes.
Selection of the cluster number
The K-means clustering algorithm, introduced by Bozinov in 2002, is aimed at grouping the objects that are more similar to each other and separating the objects that are more different from each other, and has been widely used in microarray image segmentation. Previous studies (Ergüt et al., 2003; Wu and Yan, 2003; Rueda and Qin, 2004; Giannakeas and Fotiadis, 2009; Us-lan and Bucak, 2010) have promoted the development of microarray image segmentation based on the K-means clustering algorithm. However, almost all of the improved methods assigned the number of clusters, k, to two, which might lead to dissatisfying segmentation results.
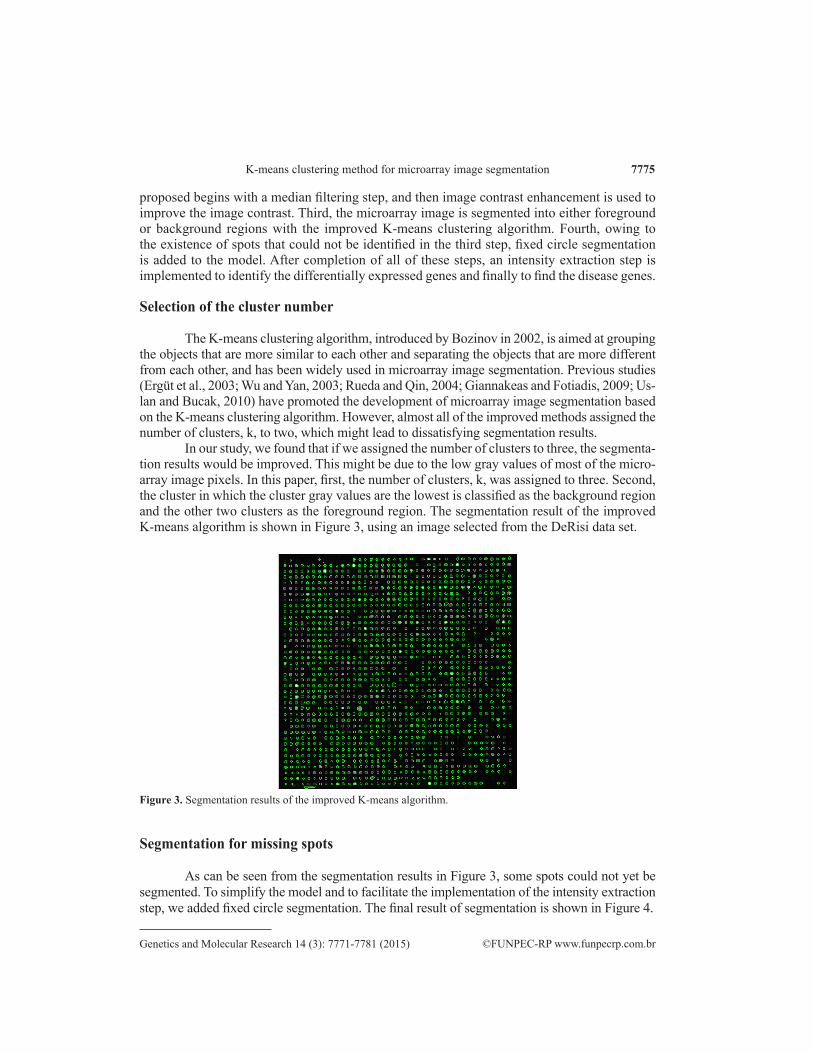
In our study, we found that if we assigned the number of clusters to three, the segmenta-tion results would be improved. This might be due to the low gray values of most of the micro-array image pixels. In this paper, first, the number of clusters, k, was assigned to three. Second, the cluster in which the cluster gray values are the lowest is classified as the background region and the other two clusters as the foreground region. The segmentation result of the improved K-means algorithm is shown in Figure 3, using an image selected from the DeRisi data set.
Figure 3. Segmentation results of the improved K-means algorithm.
Segmentation for missing spots
As can be seen from the segmentation results in Figure 3, some spots could not yet be segmented. To simplify the model and to facilitate the implementation of the intensity extraction step, we added fixed circle segmentation. The final result of segmentation is shown in Figure 4.
7776T.N. Wang et al.
©FUNPEC-RP www.funpecrp.com.brGenetics and Molecular Research 14 (3): 7771-7781 (2015)
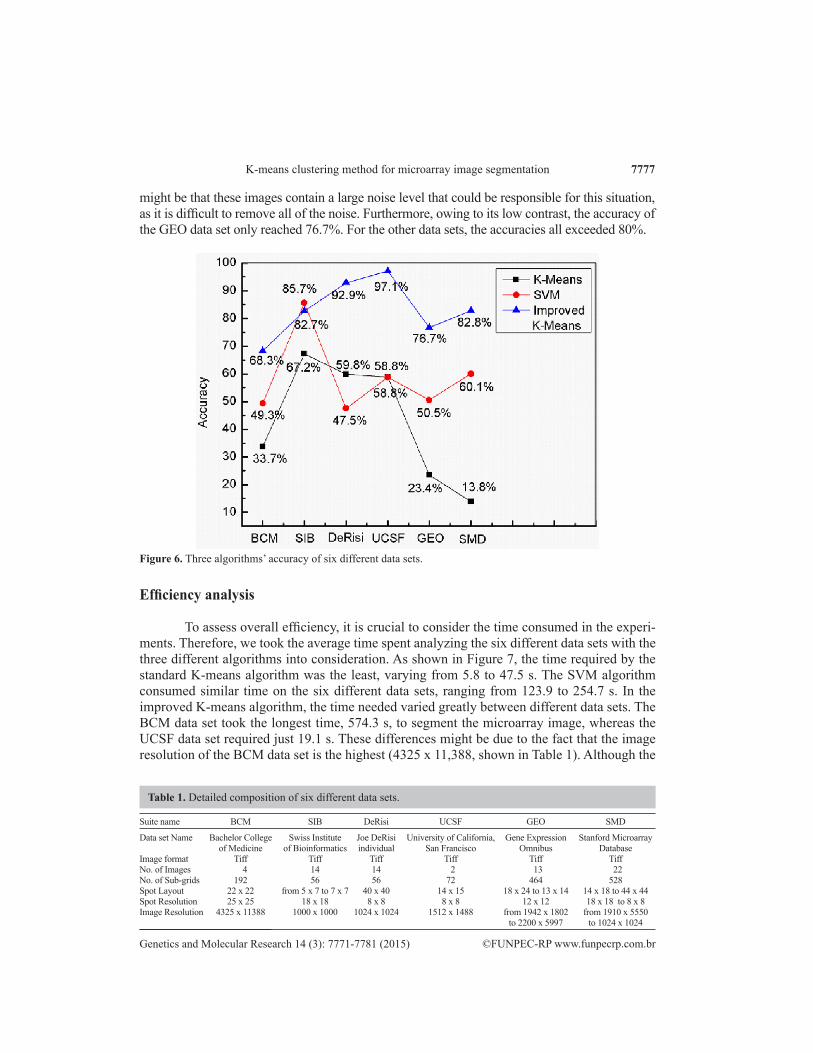
Figure 6 also illustrates the total performance of the three algorithms on the six different data sets. The accuracy of the improved K-means algorithm is the highest, except for results from the SIB data set, wherein the accuracy is slightly lower than that of the SVM algorithm. Compared with the standard K-means algorithm, the improved K-means algorithm significantly improves the accuracy in each data set, and in the UCSF data set, the accuracy hit as high as 97.1%. How-ever, in the BCM data set, the accuracy of the improved K-means algorithm was only 68.3%; it
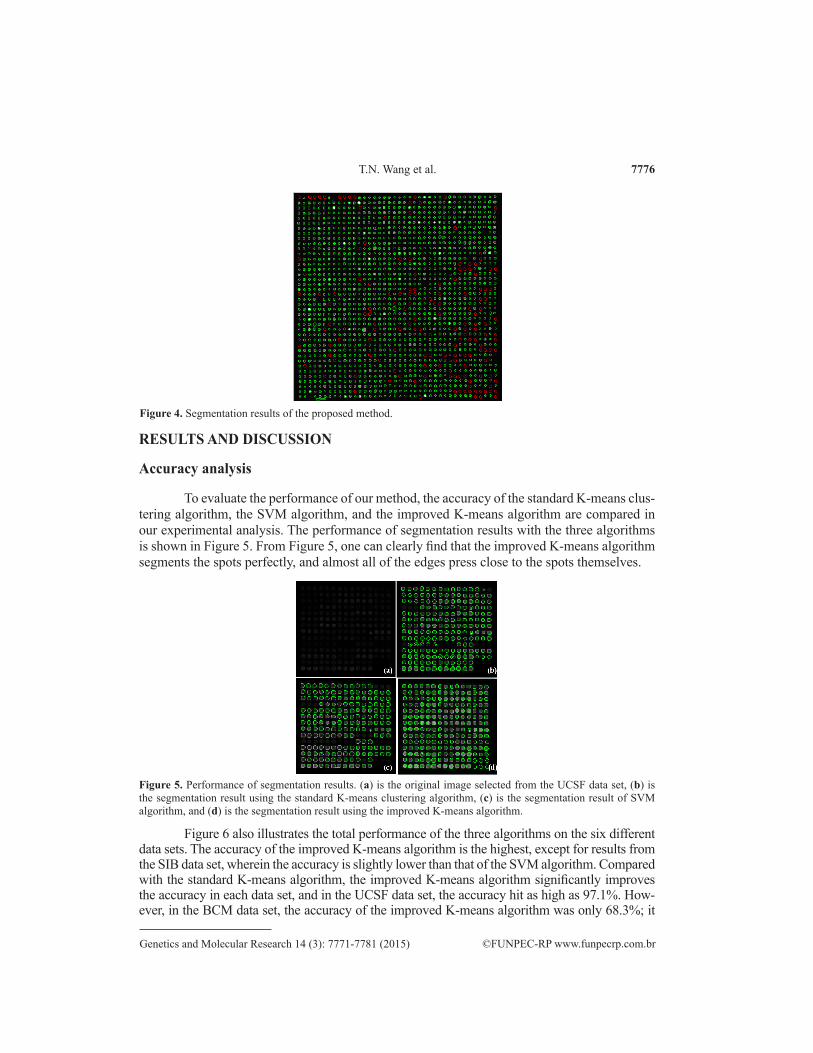
Figure 4. Segmentation results of the proposed method.
RESULTS AND DISCUSSION
Accuracy analysis
To evaluate the performance of our method, the accuracy of the standard K-means clus-tering algorithm, the SVM algorithm, and the improved K-means algorithm are compared in our experimental analysis. The performance of segmentation results with the three algorithms is shown in Figure 5. From Figure 5, one can clearly find that the improved K-means algorithm segments the spots perfectly, and almost all of the edges press close to the spots themselves.
Figure 5. Performance of segmentation results. (a) is the original image selected from the UCSF data set, (b) is the segmentation result using the standard K-means clustering algorithm, (c) is the segmentation result of SVM algorithm, and (d) is the segmentation result using the improved K-means algorithm.
7777K-means clustering method for microarray image segmentation
©FUNPEC-RP www.funpecrp.com.brGenetics and Molecular Research 14 (3): 7771-7781 (2015)
Figure 6. Three algorithms’ accuracy of six different data sets.
Efficiency analysis
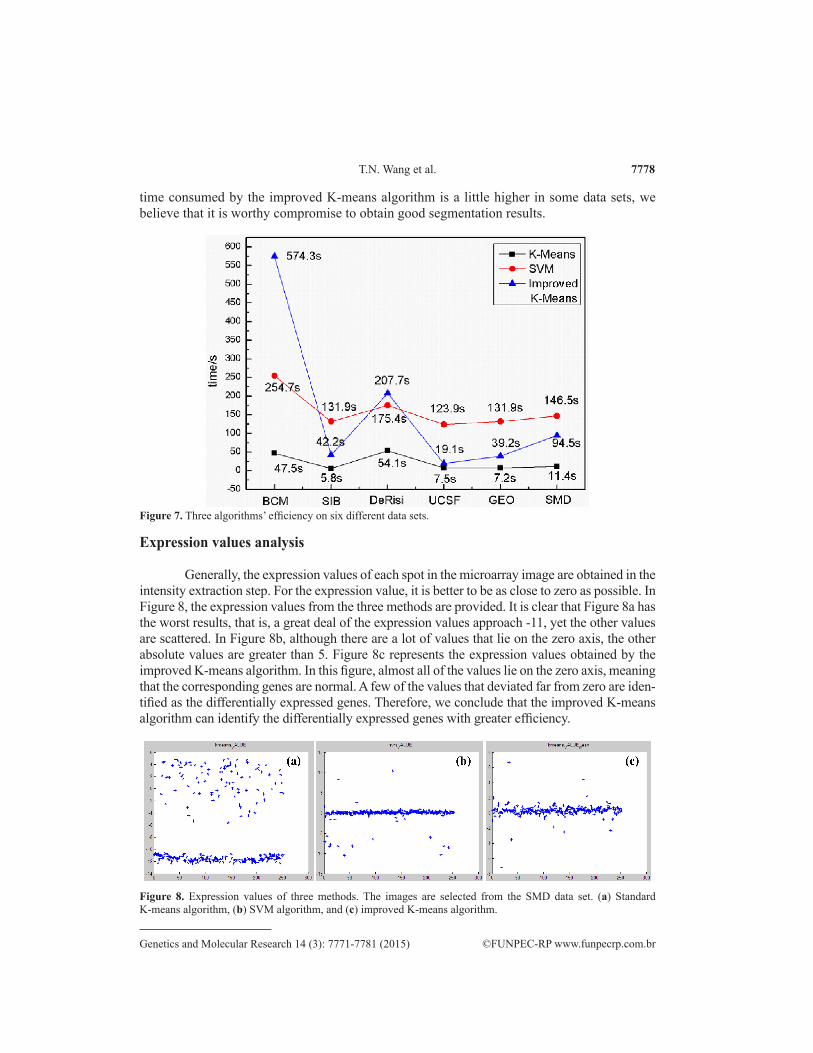
To assess overall efficiency, it is crucial to consider the time consumed in the experi-ments. Therefore, we took the average time spent analyzing the six different data sets with the three different algorithms into consideration. As shown in Figure 7, the time required by the standard K-means algorithm was the least, varying from 5.8 to 47.5 s. The SVM algorithm consumed similar time on the six different data sets, ranging from 123.9 to 254.7 s. In the improved K-means algorithm, the time needed varied greatly between different data sets. The BCM data set took the longest time, 574.3 s, to segment the microarray image, whereas the UCSF data set required just 19.1 s. These differences might be due to the fact that the image resolution of the BCM data set is the highest (4325 x 11,388, shown in Table 1). Although the
Suite name BCM SIB DeRisi UCSF GEO SMD
Data set Name Bachelor College Swiss Institute Joe DeRisi University of California, Gene Expression Stanford Microarray of Medicine of Bioinformatics individual San Francisco Omnibus DatabaseImage format Tiff Tiff Tiff Tiff Tiff TiffNo. of Images 4 14 14 2 13 22No. of Sub-grids 192 56 56 72 464 528Spot Layout 22 x 22 from 5 x 7 to 7 x 7 40 x 40 14 x 15 18 x 24 to 13 x 14 14 x 18 to 44 x 44Spot Resolution 25 x 25 18 x 18 8 x 8 8 x 8 12 x 12 18 x 18 to 8 x 8Image Resolution 4325 x 11388 1000 x 1000 1024 x 1024 1512 x 1488 from 1942 x 1802 from 1910 x 5550 to 2200 x 5997 to 1024 x 1024
Table 1. Detailed composition of six different data sets.
might be that these images contain a large noise level that could be responsible for this situation, as it is difficult to remove all of the noise. Furthermore, owing to its low contrast, the accuracy of the GEO data set only reached 76.7%. For the other data sets, the accuracies all exceeded 80%.
7778T.N. Wang et al.
©FUNPEC-RP www.funpecrp.com.brGenetics and Molecular Research 14 (3): 7771-7781 (2015)
Expression values analysis
Generally, the expression values of each spot in the microarray image are obtained in the intensity extraction step. For the expression value, it is better to be as close to zero as possible. In Figure 8, the expression values from the three methods are provided. It is clear that Figure 8a has the worst results, that is, a great deal of the expression values approach -11, yet the other values are scattered. In Figure 8b, although there are a lot of values that lie on the zero axis, the other absolute values are greater than 5. Figure 8c represents the expression values obtained by the improved K-means algorithm. In this figure, almost all of the values lie on the zero axis, meaning that the corresponding genes are normal. A few of the values that deviated far from zero are iden-tified as the differentially expressed genes. Therefore, we conclude that the improved K-means algorithm can identify the differentially expressed genes with greater efficiency.
Figure 7. Three algorithms’ efficiency on six different data sets.
Figure 8. Expression values of three methods. The images are selected from the SMD data set. (a) Standard K-means algorithm, (b) SVM algorithm, and (c) improved K-means algorithm.
time consumed by the improved K-means algorithm is a little higher in some data sets, we believe that it is worthy compromise to obtain good segmentation results.
7779K-means clustering method for microarray image segmentation
©FUNPEC-RP www.funpecrp.com.brGenetics and Molecular Research 14 (3): 7771-7781 (2015)
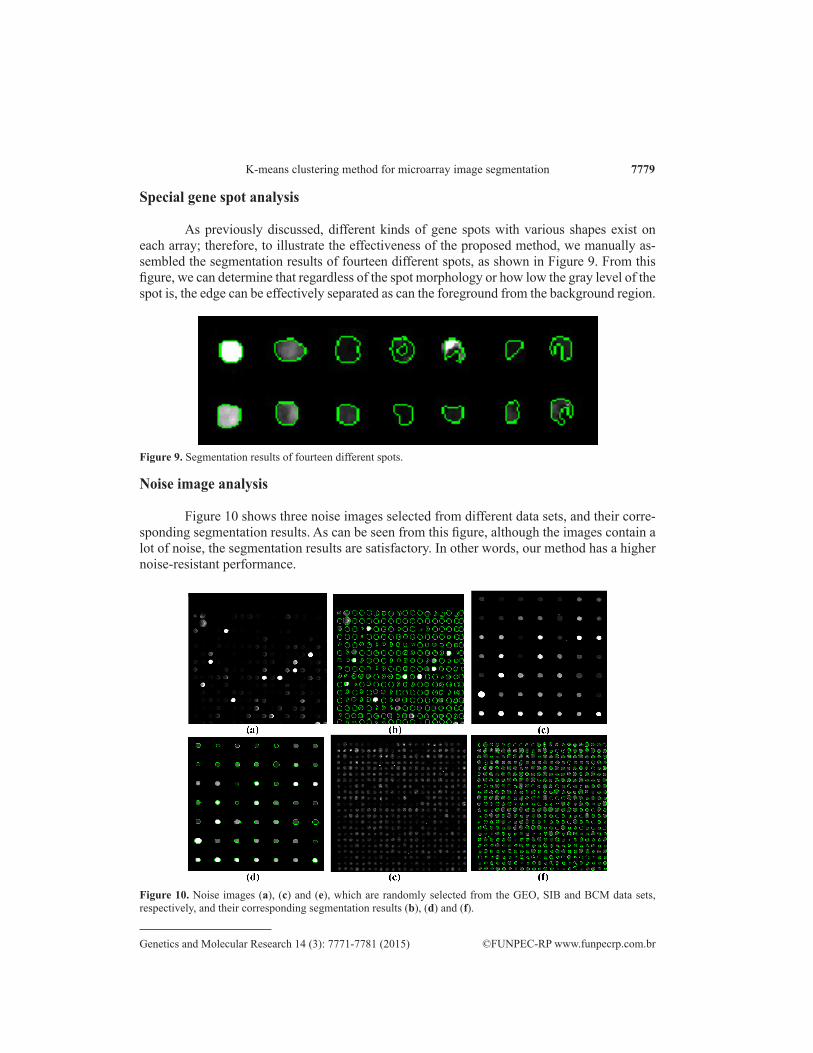
Special gene spot analysis
As previously discussed, different kinds of gene spots with various shapes exist on each array; therefore, to illustrate the effectiveness of the proposed method, we manually as-sembled the segmentation results of fourteen different spots, as shown in Figure 9. From this figure, we can determine that regardless of the spot morphology or how low the gray level of the spot is, the edge can be effectively separated as can the foreground from the background region.
Figure 9. Segmentation results of fourteen different spots.
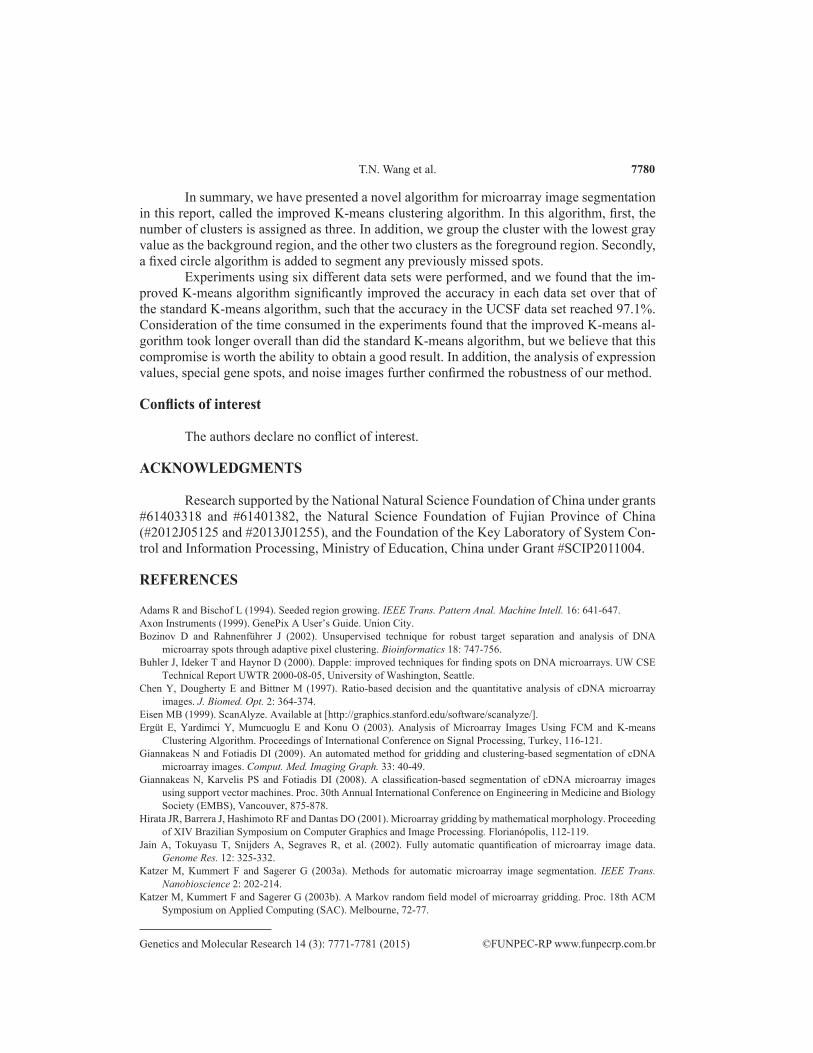
Noise image analysis
Figure 10 shows three noise images selected from different data sets, and their corre-sponding segmentation results. As can be seen from this figure, although the images contain a lot of noise, the segmentation results are satisfactory. In other words, our method has a higher noise-resistant performance.
Figure 10. Noise images (a), (c) and (e), which are randomly selected from the GEO, SIB and BCM data sets, respectively, and their corresponding segmentation results (b), (d) and (f).
7780T.N. Wang et al.
©FUNPEC-RP www.funpecrp.com.brGenetics and Molecular Research 14 (3): 7771-7781 (2015)
In summary, we have presented a novel algorithm for microarray image segmentation in this report, called the improved K-means clustering algorithm. In this algorithm, first, the number of clusters is assigned as three. In addition, we group the cluster with the lowest gray value as the background region, and the other two clusters as the foreground region. Secondly, a fixed circle algorithm is added to segment any previously missed spots.
Experiments using six different data sets were performed, and we found that the im-proved K-means algorithm significantly improved the accuracy in each data set over that of the standard K-means algorithm, such that the accuracy in the UCSF data set reached 97.1%. Consideration of the time consumed in the experiments found that the improved K-means al-gorithm took longer overall than did the standard K-means algorithm, but we believe that this compromise is worth the ability to obtain a good result. In addition, the analysis of expression values, special gene spots, and noise images further confirmed the robustness of our method.
Conflicts of interest
The authors declare no conflict of interest.
ACKNOWLEDGMENTS
Research supported by the National Natural Science Foundation of China under grants #61403318 and #61401382, the Natural Science Foundation of Fujian Province of China (#2012J05125 and #2013J01255), and the Foundation of the Key Laboratory of System Con-trol and Information Processing, Ministry of Education, China under Grant #SCIP2011004.
REFERENCES
Adams R and Bischof L (1994). Seeded region growing. IEEE Trans. Pattern Anal. Machine Intell. 16: 641-647.Axon Instruments (1999). GenePix A User’s Guide. Union City.Bozinov D and Rahnenführer J (2002). Unsupervised technique for robust target separation and analysis of DNA
microarray spots through adaptive pixel clustering. Bioinformatics 18: 747-756.Buhler J, Ideker T and Haynor D (2000). Dapple: improved techniques for finding spots on DNA microarrays. UW CSE
Technical Report UWTR 2000-08-05, University of Washington, Seattle.Chen Y, Dougherty E and Bittner M (1997). Ratio-based decision and the quantitative analysis of cDNA microarray
images. J. Biomed. Opt. 2: 364-374.Eisen MB (1999). ScanAlyze. Available at [http://graphics.stanford.edu/software/scanalyze/].Ergüt E, Yardimci Y, Mumcuoglu E and Konu O (2003). Analysis of Microarray Images Using FCM and K-means
Clustering Algorithm. Proceedings of International Conference on Signal Processing, Turkey, 116-121.Giannakeas N and Fotiadis DI (2009). An automated method for gridding and clustering-based segmentation of cDNA
microarray images. Comput. Med. Imaging Graph. 33: 40-49.Giannakeas N, Karvelis PS and Fotiadis DI (2008). A classification-based segmentation of cDNA microarray images
using support vector machines. Proc. 30th Annual International Conference on Engineering in Medicine and Biology Society (EMBS), Vancouver, 875-878.
Hirata JR, Barrera J, Hashimoto RF and Dantas DO (2001). Microarray gridding by mathematical morphology. Proceeding of XIV Brazilian Symposium on Computer Graphics and Image Processing. Florianópolis, 112-119.
Jain A, Tokuyasu T, Snijders A, Segraves R, et al. (2002). Fully automatic quantification of microarray image data. Genome Res. 12: 325-332.
Katzer M, Kummert F and Sagerer G (2003a). Methods for automatic microarray image segmentation. IEEE Trans. Nanobioscience 2: 202-214.
Katzer M, Kummert F and Sagerer G (2003b). A Markov random field model of microarray gridding. Proc. 18th ACM Symposium on Applied Computing (SAC). Melbourne, 72-77.
7781K-means clustering method for microarray image segmentation
©FUNPEC-RP www.funpecrp.com.brGenetics and Molecular Research 14 (3): 7771-7781 (2015)
Lonardi S and Luo Y (2004). Gridding and compression of microarray images. Proc. IEEE Comput. Syst. Bioinform. Conf. 2004: 122-130.
Maguluri LP, Rajapanthula K and Srinivasu PN (2013). A comparative analysis of clustering based segmentation algorithms in microarray images. Int. J. Emerg. Sci. Eng. 1:27-32.
Rueda L and Qin L (2004). An improved clustering-based approach for DNA microarray image segmentation. In: Image Analysis and Recognition, Lecture Notes in Computer Science, 3212: 17-24.
Schena M Shalon D, Davis RW and Brown PO (1995). Quantitative monitoring of gene expression patterns with a complementary DNA microarray. Science 270: 467-470.
Schena M, Heller RA, Theriault TP, Konrad K, et al. (1998). Microarrays: biotechnology’s discovery platform for functional genomics. Trends Biotechnol. 16: 301-306.
Shao GF, Wang TN, Hong WP and Chen ZG (2013). An improved SVM method for cDNA microarray image segmentation. 8th International Conference on Computer Science and Education, Colombo, 391-395.
Steinfath M, Wruck W, Seidel H, Lehrach H, et al. (2001). Automated image analysis for array hybridization experiments. Bioinformatics 17: 634-641.
Uslan V and Bucak IO (2010). Microarray image segmentation using clustering methods. Math. Comput. Appl. 15: 240-247.
Wu H and Yan H (2003). Microarray image processing based on clustering and morphological analysis. Proceedings of the First Asia Pacific Bioinformatics Conference, Adelaide, 19: 111-118.
Yang YH, Buckley MJ, Dudoit S and Speed TP (2002a). Comparison of methods for image analysis on cDNA microarray data. J. Comput. Graph. Stat. 11: 108-136.
Yang YH, Dudoit S, Luu P, Lin DM, et al. (2002b). Normalization for cDNA microarray data: a robust composite method addressing single and multiple slide systematic variation. Nucleic Acids Res. 30: e15.


![Clustering of Microarray Data Reveals Transcript Patterns · Clustering of Microarray Data Reveals Transcript Patterns Associated with Somatic Embryogenesis in Soybean1[w] Franc¸oise](https://img.pdfslide.us/doc/110x75/5ed2c7ccae2cb511b17808ae/clustering-of-microarray-data-reveals-transcript-clustering-of-microarray-data-reveals.jpg)