Embed Size (px)
Citation preview
An Exploratory Study of Log PlacementRecommendation in an Enterprise System
Jeanderson Cândido∗†, Jan Haesen†, Maurício Aniche∗, and Arie van Deursen∗∗Department of Software Technology
Delft University of Technology, The Netherlands{j.candido, m.f.aniche, arie.vandeursen}@tudelft.nl
†Adyen N.V., The Netherlands{jeanderson.candido, jan.haesen}@adyen.com
Abstract—Logging is a development practice that plays animportant role in the operations and monitoring of complexsystems. Developers place log statements in the source code anduse log data to understand how the system behaves in production.Unfortunately, anticipating where to log during development ischallenging. Previous studies show the feasibility of leveragingmachine learning to recommend log placement despite the dataimbalance since logging is a fraction of the overall code base.However, it remains unknown how those techniques apply to anindustry setting, and little is known about the effect of imbalanceddata and sampling techniques. In this paper, we study the logplacement problem in the code base of Adyen, a large-scalepayment company. We analyze 34,526 Java files and 309,527methods that sum up +2M SLOC. We systematically measure theeffectiveness of five models based on code metrics, explore theeffect of sampling techniques, understand which features modelsconsider to be relevant for the prediction, and evaluate whetherwe can exploit 388,086 methods from 29 Apache projects tolearn where to log in an industry setting. Our best performingmodel achieves 79% of balanced accuracy, 81% of precision,60% of recall. While sampling techniques improve recall, theypenalize precision at a prohibitive cost. Experiments with open-source data yield under-performing models over Adyen’s testset; nevertheless, they are useful due to their low rate of falsepositives. Our supporting scripts and tools are available to thecommunity.
Index Terms—Log Placement, Log Recommendation, LoggingPractices, Supervised Learning
I. INTRODUCTION
Logging is a popular development practice that plays animportant role in the operations and monitoring of complexsystems. Developers place log statements in the source code toexpose the internal state of the system as it runs in production.Usually, companies rely on a logging infrastructure (e.g.,Elastic Stack [1]) to collect and process that data either in-house or as a cloud service. Operations and monitoring relyon metrics and data collected at different layers of the stack,from hardware, operating system, and web server logs to theapplication logs themselves. That data is necessary for severallog analysis tasks, e.g., anomaly detection [2]–[4], root causeanalysis [5], [6], and performance monitoring [7].
In practice, developers still rely on their intuition to deter-mine which parts of the system require log statements [8]. Thisproblem is known as the “where to log” (or “log placement”)problem [9]–[12]. Empirical studies show that developers
continuously spend time fixing and adjusting log statementsin a trial-and-error manner [13], [14]. In addition, improperlogging also leads to several issues in production software andlogging infrastructure [15]. Deliberately placing log statementseverywhere in the source code might increase data throughput,resulting in more demand for storage and processing time fordata indexing. Conversely, missing log statements underminethe ability to diagnose failures and abnormal behavior. In anenterprise context, the issues associated with improper loggingmight not only reflect in costs with commodity or on-premiseresources but also in the company’s reputation since failing toprovide timely response to failures and abnormalities can beharmful to the business.
The research community has been proposing techniques tosupport developers in deciding what parts of the system to log.For instance, Jia et al. [16] proposed an approach based onassociation rule mining to place error logs on if statements;Li et al. [12] studied the use of topic modeling for logplacement at method-level, and; Li et al. [11] proposed a deeplearning-based approach to indicate the need for logging atblock-level. Those techniques rely mostly on code vocabularyto learn placement patterns in the source code, and experimentswith open-source data show their relevance on the placementproblem. Unfortunately, it remains unknown how existingapproaches apply in an enterprise setting. Zhu et al. [10]proposed a technique and evaluated it on two large-scale sys-tems; however, it operates on specific contexts: catch clauses(exception handling) and if statements with return values.In practice, there are many different types of logging (e.g.,exceptional and unexceptional cases) [9] and, in a business-critical application, every log is under scrutiny for monitoringand postmortem analysis. Furthermore, existing techniquesemploy over-sampling techniques (e.g., [10], [11]) to avoidbias towards the majority class; however, it remains unknownthe effect of imbalanced data and sampling techniques (i.e.,over-sampling of the minority class or under-sampling of themajority class) on log placement.
In this paper, we study the log placement problem in thecode base of Adyen, a large-scale payment company. Weanalyze 34,526 Java files and 309,527 methods that sum up toover two million lines of code. We address log placement as asupervised binary classification problem at method-level. We
arX
iv:2
103.
0175
5v3
[cs
.SE
] 1
0 M
ar 2
021
focus at method-level given the low prevalence of log state-ments on logged methods (up to 75% of logged methods con-tain no more than two log statements) and the diverse contextsof log placement (more details in Section II). Our intuitionis that we can trade the specificity of block-level predictionwithout losing awareness. We leverage object-oriented metricsand structural metrics as predictors to placement patterns sincethey are easy to compute via static analysis. In addition,they have been widely used in other domains (e.g., defectprediction [17]–[21]) but are under explored for log placement.We systematically measure the effectiveness of five machinelearning models, explore the effect of sampling techniques,understand which features models consider to be relevant forthe prediction, and evaluate whether we can leverage codemetrics and open-source data to learn log placement in anindustry setting.
Our results show that (i) our best performing model (Ran-dom Forest) achieves 79% of balanced accuracy, 81% of preci-sion, 60% of recall, and 1% of false positive rate, (ii) samplingtechniques improve recall (+26% up to +52%), but at aprohibitive cost in precision (−18% up to −40%), (iii) thedepth of a method, i.e., maximum number of nested blocks,is a key indicator of log placement, and (iv) models basedon open-source data yield lower performance on Adyen’s testset; nevertheless, they can be used to overcome the cold-startproblem due to their low rate of false positives. This paperprovides the following contributions:• A feature engineering process for machine learning based
on code metrics for log placement at method-level;• An empirical evaluation of five machine learning models
and their performance on a large-scale enterprise system;• An analysis of the effectiveness of transfer learning from
open-source data to overcome the cold-start problem inan industry setting;
• A fully functional toolkit for auditing and extension [22].
II. CONTEXT AND MOTIVATION
Adyen offers payment processing as a service and connectsshoppers to more than 4.5k merchants at global scale. At thecore of the business, there is a platform with more than 10years of development that is maintained and evolved by hun-dreds of developers around the globe. Technology plays a keyrole to scale hundreds of transactions per second in differentcurrencies and different payment channels (e.g., points of saleterminals and e-commerce). Only in 2019, Adyen processed240 billion euros in transaction volume1.
To ensure quality in a rapid growing business, developersfollow DevOps practices and are responsible for testing andmonitoring their changes on every release. Moreover, there arededicated infrastructure and monitoring teams responsible for,among other activities, building and maintaining data pipelinesto support system monitoring. In a monthly basis, the in-house clusters process billions of log events generated by
1https://www.adyen.com/investor-relations/H2-2019 (Accessed on Septem-ber 2020).
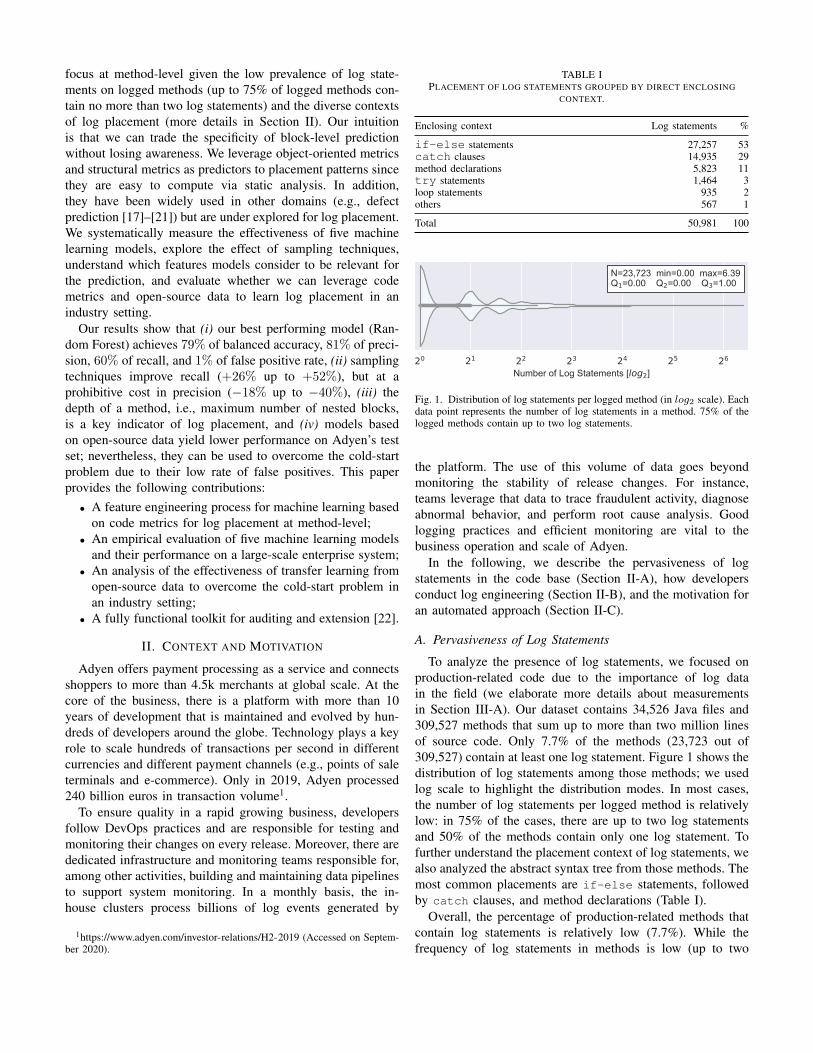
TABLE IPLACEMENT OF LOG STATEMENTS GROUPED BY DIRECT ENCLOSING
CONTEXT.
Enclosing context Log statements %
if-else statements 27,257 53catch clauses 14,935 29method declarations 5,823 11try statements 1,464 3loop statements 935 2others 567 1
Total 50,981 100
20 21 22 23 24 25 26
Number of Log Statements [log2]
N=23,723 min=0.00 max=6.39Q1=0.00 Q2=0.00 Q3=1.00
Fig. 1. Distribution of log statements per logged method (in log2 scale). Eachdata point represents the number of log statements in a method. 75% of thelogged methods contain up to two log statements.
the platform. The use of this volume of data goes beyondmonitoring the stability of release changes. For instance,teams leverage that data to trace fraudulent activity, diagnoseabnormal behavior, and perform root cause analysis. Goodlogging practices and efficient monitoring are vital to thebusiness operation and scale of Adyen.
In the following, we describe the pervasiveness of logstatements in the code base (Section II-A), how developersconduct log engineering (Section II-B), and the motivation foran automated approach (Section II-C).
A. Pervasiveness of Log Statements
To analyze the presence of log statements, we focused onproduction-related code due to the importance of log datain the field (we elaborate more details about measurementsin Section III-A). Our dataset contains 34,526 Java files and309,527 methods that sum up to more than two million linesof source code. Only 7.7% of the methods (23,723 out of309,527) contain at least one log statement. Figure 1 shows thedistribution of log statements among those methods; we usedlog scale to highlight the distribution modes. In most cases,the number of log statements per logged method is relativelylow: in 75% of the cases, there are up to two log statementsand 50% of the methods contain only one log statement. Tofurther understand the placement context of log statements, wealso analyzed the abstract syntax tree from those methods. Themost common placements are if-else statements, followedby catch clauses, and method declarations (Table I).
Overall, the percentage of production-related methods thatcontain log statements is relatively low (7.7%). While thefrequency of log statements in methods is low (up to two
in 75% of the cases), log statements occur in many differentcontexts in a method body (Table I).
B. Log Engineering in the Field
Adyen has internal guidelines to educate developers aboutlogging practices (e.g., log levels and message formats) andhow to use the in-house logging framework. These guidelineshelp to align the perception about logs for developers workingon different teams and with different backgrounds. A majorchallenge in this context is to add log statements with enoughcontextual information without overloading the data infrastruc-ture.
To better understand the maintenance effort on log state-ments, we conducted an exploratory analysis of log-relatedchanges in the repository from November 1st, 2019 to April30th, 2020. We used a keyword-based approach to identifylog-related commits and leveraged the structured titles fromcommits to identify associated tasks from the issue tracker foradditional context. Commit titles are in the format “<Task-id> <Title>”, where “<Task-id>” is a mandatory field. Wereport relative values to protect confidential company data. Inthe following we summarize our observations:• Log-related commits are recurrent: We grouped the
log-related commits per month and computed their rel-ative frequency to Java-related commits. On average,there were 7.0 ± 1.6% of commits focused exclusivelyon log-related changes (min=5.7% and max=9.7%). Thissuggests that there is a recurrent demand to improve log-related code.
• Most log-related commits are isolated small fixes: Weanalyzed the commits identified previously to understandwhat was the context of the change. We used the “<Task-id>” field to identify whether the change was associatedto an open task or an isolated fix (tagged as “FIX”). Thepercentage of isolated fixes was almost twice (×1.94) ashigh compared to task-related commits. Previous studieshave also observed the same phenomenon in open-sourceprojects [13], [14]. In an ideal setting, the developershould be able to anticipate the need of those small andisolated fixes to improve productivity.
C. The Need For an Automated Approach
Our observations about log engineering in the field suggestthat, while there is a company-wide effort to strike a balancebetween high-quality data and cost-effective usage of infras-tructure, there is a need for tooling support to make consistentlogging decisions. Unfortunately, while experts might provideassistance during code-review, this approach does not scale.Furthermore, it is unfeasible for a developer to have a contex-tual baseline of comparison between an ongoing task and thehidden patterns of log statements spread in a large code base.
As a first step towards alleviating the burden of implement-ing and maintaining logging code at Adyen, in this work, weexplore the feasibility of exploiting machine learning on thecomplex task of log placement. Our intuition is that non-trivialmethods are more likely to be logged but not necessarily all
complex methods should be logged. Ideally, if the developerintroduces a method similar in complexity to existing methodsthat contain log statements, then, the developer should beaware of this relationship. We believe this awareness mighthelp the developer to make informed decisions before the codedeploys to production.
We define the scope of prediction at method level sincewe observed that, in our context, log statements are notrecurrent in logged methods, e.g. 50% of the logged methodscontain only one log statement (Figure 1). In addition, asseen previously, log statements are spread in many differentcontexts (Table I).
III. METHODOLOGY
Our goal is to predict whether a method should be logged ornot in an enterprise system. To this end, we frame this problemas a supervised binary classification problem at method level.We analyze the feasibility of using code metrics as predic-tors, evaluate the performance of different machine learningmodels, the relevance of class balancing, and whether modelsbuilt on top of open-source data generalise to our domain.Concretely, we investigate the following research questions:
RQ1: What is the performance of machine learning modelsin predicting log placement in a large-scale enterprisesystem? This RQ addresses the feasibility of using codemetrics as predictors. Our initial assumption is that,given a sufficient number of training examples, a modelcan differentiate a method that should be logged ornot based on the distribution of features extracted frommethods and their enclosing class. Answering this RQis important to validate this assumption.
RQ2: What is the impact of different class balancing strate-gies on prediction? This RQ addresses the problem ofimbalanced data in classification problems [23], [24].Imbalanced data occurs when the frequency of oneclass is significantly smaller than the other(s). In ourcontext, only 7.7% of methods in the code base havelog statements (see Section II-A). This might introducea bias towards the majority class and result in an under-performing model. Answering this RQ is important toassess the impact of imbalanced data in our domain andthe trade-offs of different sampling techniques.
RQ3: What are the most recurring relevant features acrossmodels? This RQ addresses the relevance of featuresin the task of differentiating methods that have logstatements from methods without log statements. Inour experiments, we use machine learning algorithmsthat learn from data on different ways. Our goal isto understand if those differences cause the models tocapture different characteristics from data. Answeringthis research question is important to provide insightsabout what models learn after training.
RQ4: How well can a model trained with open-source datageneralize to the context of a large-scale enterprisesystem? This RQ addresses the feasibility of learning
from open-source data. Transfer learning has been ap-plied in other domains (e.g., defect prediction [18], [25]–[27] and performance modeling [28]–[30]) to overcomethe “cold-start problem”, i.e., when it is not possible totrain a model due to insufficient (or nonexistent) trainingdata. In our context, this relates to a project being in anearly stage of development, for instance. Answering thisRQ is important to understand transfer learning for logplacement.
Tooling Support: All supporting scripts and tools areavailable in our online appendix [22]. The README.md filelocated in the root directory describes the components and theminimum requirements.
In the following, we describe the data collection, labelling,feature extraction, learning algorithms, machine learning pro-cess, and how we address each research question.
A. Data Collection
The focus of our study is the code base of our industrypartner. In addition, we create a dataset based on 29 projectsfrom the Apache ecosystem to address the feasibility oflearning where to log from them. We focused on Apacheprojects because they are often present in industry-levelprojects at different domains (e.g., cloud managing, databases,web servers, and big data solutions). Our assumption is thatthey might contain good or influential logging practices sincetheir users rely on log data for troubleshooting and monitoringthe execution of complex systems. Table II summarizes thedatasets and provides an overview of the pervasiveness of logstatements. In the following we describe how we analyze thesubjects and the selection criteria to compose our dataset.
Source code filtering: For all projects, including Adyen’scode base, we selected Java files that are related to productioncode. The rationale for excluding non-production sources isthat those files contain methods that may not reflect thedeveloper’s perception of production level logging decisions.We searched for files with the suffix .java using the find
UNIX utility [31] and grouped the entries into the followingcategories: (i) test-related files, (ii) documentation-related files,e.g., “how to” recipes and API examples, and (iii) build-related
TABLE IISUMMARY OF DATA COLLECTION.
Dataset Filesa Logstatements
Methods(M)
Loggedmethods
(LM)
LMM (%)
Adyen 34,526 50,981 309,527 23,723 7.7Apache (N=29) 38,980 55,849 388,086 27,247 –
Apache summary:Min 117 120 1,176 54 4.2Q1 586 727 4,839 417 4.9
Median 821 1,514 6,933 762 7.1Average 1,344 1,926 13,383 940 8.1
Q3 1,577 2,345 14,915 1,154 9.9Max 5,881 12,147 65,184 4,955 15.8
aProduction-related Java code.
files. We classify each Java file by checking whether itscorresponding path contains a keyword related to one of thecategories. For test-related files, the keywords are “fixture”,“memtest”, “/mock/”, and “test/”. For documentation-relatedfiles, the keywords are “docs/”, “/examples/”. For build-relatedfiles, the keyword is “buildSrc/” which corresponds to the pathof custom Gradle tasks. We classify the remaining files asproduction-related file (Table II, column “Files”).
Log statements: In the subset of production-related files,we measure the pervasiveness of log statements with staticanalysis. For each method in the source code, we visit allmethod invocations in the enclosing method body and checkwhether it represents an expression statement. This allows usto identify multi-line log statements and log statements thatuse fluent API patterns (a.k.a., method chaining) which aresupported by popular logging frameworks (e.g., Slf4j [32]and Log4j 2 [33]). We use the lowercase string represen-tation of the expression to check if the expression matchesthe patterns of popular log APIs (i.e., “.*log(ger)?.*”or “.*(error|warn|info|debug).*”). In case it matches,we increment the counter of log statements and mark thecurrent method as a logged method. Columns “Log statements”,“Methods (M)”, “Logged methods (LM)”, and “ LM
M (%)” summarize thecounting of log statements, visited methods, logged methods,and percentage of logged methods, respectively.
Apache selection: We selected Java projects listed in theofficial website from Apache foundation2. We initially down-loaded 64 projects that we were able to clone automaticallybased on the scrapped data from their website. We excludedprojects with less than or equals to 4% of logged methodsand projects with less than or equals to 100 production-relatedfiles. The rationale for the log percentage criterion is to definea lower bound cutoff for projects with less than half of theaverage percentage of logged methods from Adyen dataset(7.7%× 1
2 ≈ 4%); the rationale for the number of production-related files criterion is to exclude small library projects. Afterthe selection criteria, we reduced the original list of 64 to 29projects in the final set3.
The selected Apache projects sum up to 38,980 Java fileswith an average of 8% of logged methods (see “Apachesummary” in Table II for the detailed distribution). The projectwith the highest percentage of logged methods is ApacheSqoop, a system designed for data transmission which hasa percentage of 15.8% of logged methods (488 out of 3,080)and 351 production-related files. The project with the lowestpercentage of logged method is Apache Ignite, an in-memorydatabase and caching platform which has a percentage of 4.2%of logged methods (2,765 out of 65,184) and 5,881 Java files.
B. Label Identification and Feature Extraction
We annotate the labels based on the presence of log state-ments in the methods identified during data collection, andwe use code metrics as features to characterize methods in the
2https://projects.apache.org/projects.html?language3Selected projects available at “./apache-projects-paper.
csv” [22]
1, 3, 4, 11, …, True
@Overridepublic void load(final String domain) { boolean existingData; try { existingData = !confParamOps.list(domain).isEmpty(); } catch (Exception e) { LOG.error("[{}] Could not access Keymaster", domain, e); existingData = true; } if (existingData) LOG.info("[{}] Data found in Keymaster, leaving untouched", domain);}
@Overridepublic void load(final String domain) { boolean existingData; try { existingData = !confParamOps.list(domain).isEmpty(); } catch (Exception e) { existingData = true; }}
Original Modified
CBO, WMC, RFC, SLOC, …, Label
Extracted feature vector
1, 2, 2, 9, …, FalseCBO, WMC, RFC, SLOC, …, Label
1, 2, 2, 9, …, TrueCBO, WMC, RFC, SLOC, …, Label
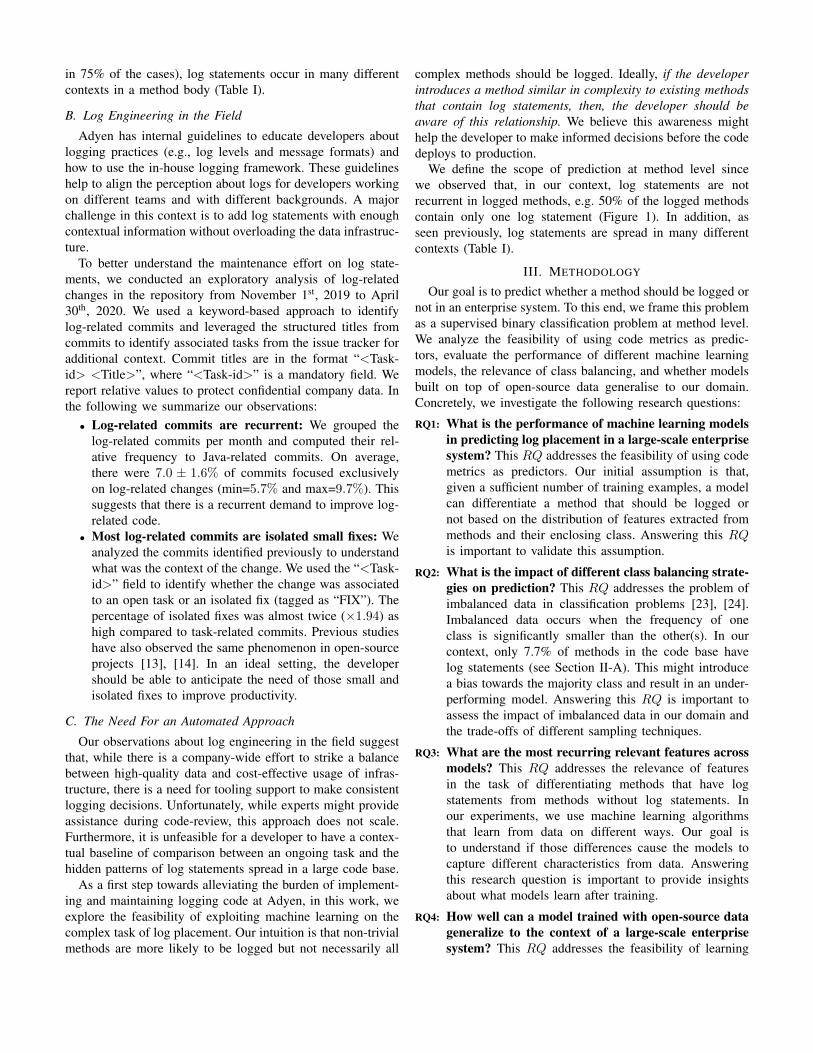
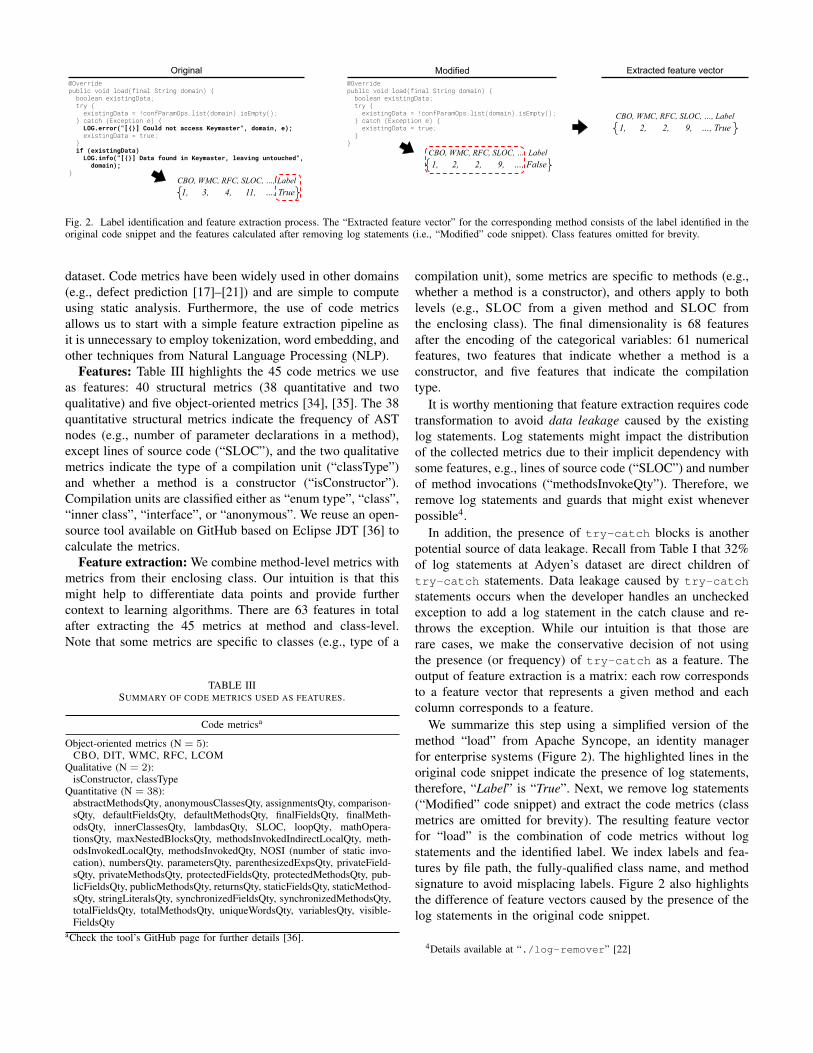
Fig. 2. Label identification and feature extraction process. The “Extracted feature vector” for the corresponding method consists of the label identified in theoriginal code snippet and the features calculated after removing log statements (i.e., “Modified” code snippet). Class features omitted for brevity.
dataset. Code metrics have been widely used in other domains(e.g., defect prediction [17]–[21]) and are simple to computeusing static analysis. Furthermore, the use of code metricsallows us to start with a simple feature extraction pipeline asit is unnecessary to employ tokenization, word embedding, andother techniques from Natural Language Processing (NLP).
Features: Table III highlights the 45 code metrics we useas features: 40 structural metrics (38 quantitative and twoqualitative) and five object-oriented metrics [34], [35]. The 38quantitative structural metrics indicate the frequency of ASTnodes (e.g., number of parameter declarations in a method),except lines of source code (“SLOC”), and the two qualitativemetrics indicate the type of a compilation unit (“classType”)and whether a method is a constructor (“isConstructor”).Compilation units are classified either as “enum type”, “class”,“inner class”, “interface”, or “anonymous”. We reuse an open-source tool available on GitHub based on Eclipse JDT [36] tocalculate the metrics.
Feature extraction: We combine method-level metrics withmetrics from their enclosing class. Our intuition is that thismight help to differentiate data points and provide furthercontext to learning algorithms. There are 63 features in totalafter extracting the 45 metrics at method and class-level.Note that some metrics are specific to classes (e.g., type of a
TABLE IIISUMMARY OF CODE METRICS USED AS FEATURES.
Code metricsa
Object-oriented metrics (N = 5):CBO, DIT, WMC, RFC, LCOM
Qualitative (N = 2):isConstructor, classType
Quantitative (N = 38):abstractMethodsQty, anonymousClassesQty, assignmentsQty, comparison-sQty, defaultFieldsQty, defaultMethodsQty, finalFieldsQty, finalMeth-odsQty, innerClassesQty, lambdasQty, SLOC, loopQty, mathOpera-tionsQty, maxNestedBlocksQty, methodsInvokedIndirectLocalQty, meth-odsInvokedLocalQty, methodsInvokedQty, NOSI (number of static invo-cation), numbersQty, parametersQty, parenthesizedExpsQty, privateField-sQty, privateMethodsQty, protectedFieldsQty, protectedMethodsQty, pub-licFieldsQty, publicMethodsQty, returnsQty, staticFieldsQty, staticMethod-sQty, stringLiteralsQty, synchronizedFieldsQty, synchronizedMethodsQty,totalFieldsQty, totalMethodsQty, uniqueWordsQty, variablesQty, visible-FieldsQty
aCheck the tool’s GitHub page for further details [36].
compilation unit), some metrics are specific to methods (e.g.,whether a method is a constructor), and others apply to bothlevels (e.g., SLOC from a given method and SLOC fromthe enclosing class). The final dimensionality is 68 featuresafter the encoding of the categorical variables: 61 numericalfeatures, two features that indicate whether a method is aconstructor, and five features that indicate the compilationtype.
It is worthy mentioning that feature extraction requires codetransformation to avoid data leakage caused by the existinglog statements. Log statements might impact the distributionof the collected metrics due to their implicit dependency withsome features, e.g., lines of source code (“SLOC”) and numberof method invocations (“methodsInvokeQty”). Therefore, weremove log statements and guards that might exist wheneverpossible4.
In addition, the presence of try-catch blocks is anotherpotential source of data leakage. Recall from Table I that 32%of log statements at Adyen’s dataset are direct children oftry-catch statements. Data leakage caused by try-catch
statements occurs when the developer handles an uncheckedexception to add a log statement in the catch clause and re-throws the exception. While our intuition is that those arerare cases, we make the conservative decision of not usingthe presence (or frequency) of try-catch as a feature. Theoutput of feature extraction is a matrix: each row correspondsto a feature vector that represents a given method and eachcolumn corresponds to a feature.
We summarize this step using a simplified version of themethod “load” from Apache Syncope, an identity managerfor enterprise systems (Figure 2). The highlighted lines in theoriginal code snippet indicate the presence of log statements,therefore, “Label” is “True”. Next, we remove log statements(“Modified” code snippet) and extract the code metrics (classmetrics are omitted for brevity). The resulting feature vectorfor “load” is the combination of code metrics without logstatements and the identified label. We index labels and fea-tures by file path, the fully-qualified class name, and methodsignature to avoid misplacing labels. Figure 2 also highlightsthe difference of feature vectors caused by the presence of thelog statements in the original code snippet.
4Details available at “./log-remover” [22]
Scores
Dataset
Test
Training
Testf ,
Train-test split Model evaluation
5-fold cross-validation
… Logistic
Regression #1
#10ExtraTrees
…
…
ML algorithms Hyper-paramsModel optimization
Logistic Regression
ExtraTrees
…
Optimized models
Logistic Regression
ExtraTrees
…
Optimized models
Logistic Regression
ExtraTrees
…
(training split)
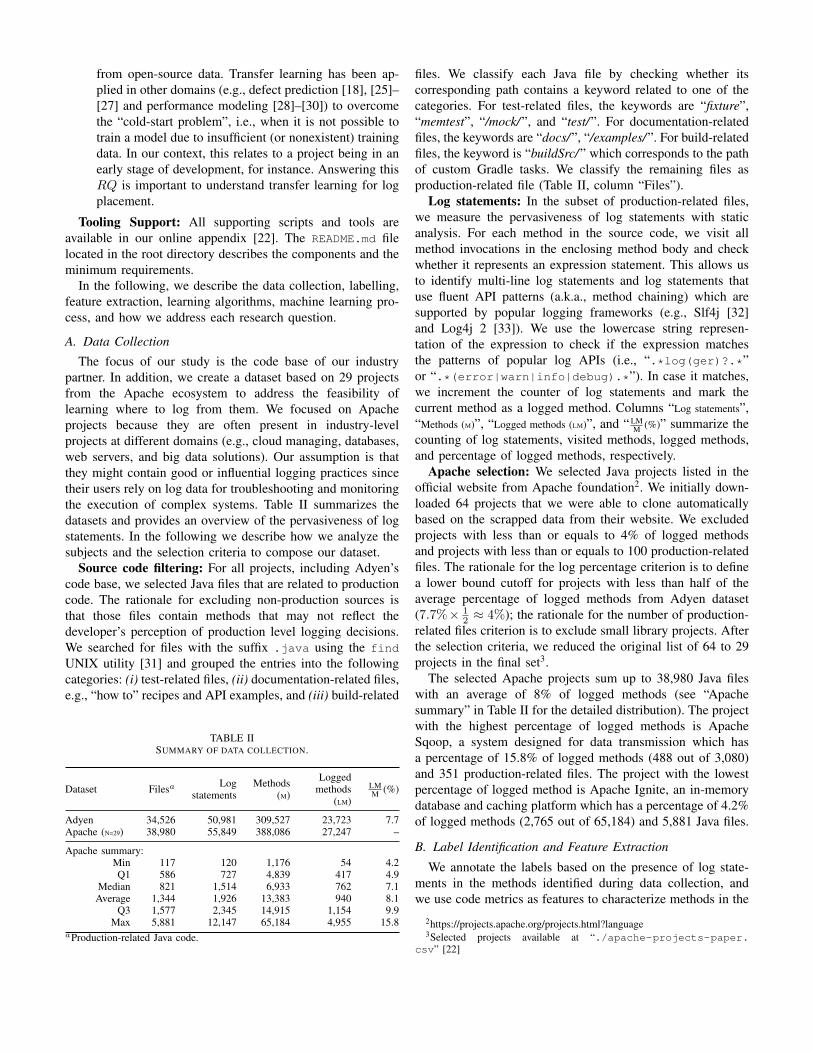
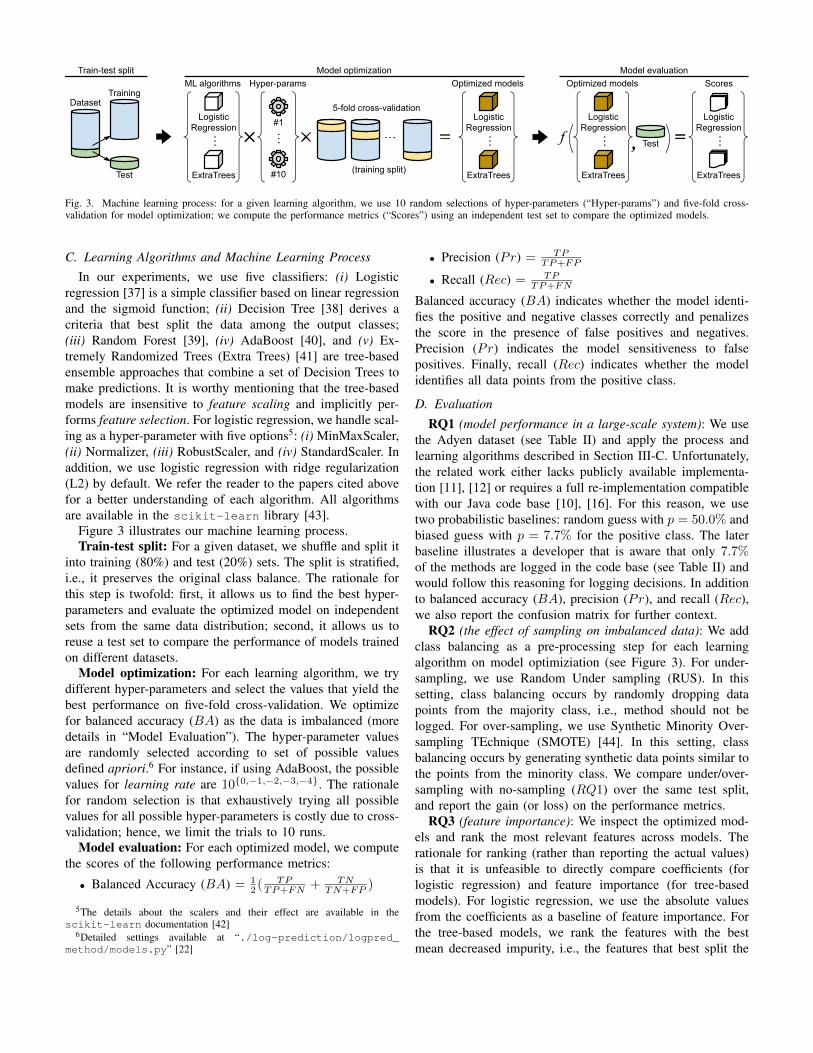
Fig. 3. Machine learning process: for a given learning algorithm, we use 10 random selections of hyper-parameters (“Hyper-params”) and five-fold cross-validation for model optimization; we compute the performance metrics (“Scores”) using an independent test set to compare the optimized models.
C. Learning Algorithms and Machine Learning ProcessIn our experiments, we use five classifiers: (i) Logistic
regression [37] is a simple classifier based on linear regressionand the sigmoid function; (ii) Decision Tree [38] derives acriteria that best split the data among the output classes;(iii) Random Forest [39], (iv) AdaBoost [40], and (v) Ex-tremely Randomized Trees (Extra Trees) [41] are tree-basedensemble approaches that combine a set of Decision Trees tomake predictions. It is worthy mentioning that the tree-basedmodels are insensitive to feature scaling and implicitly per-forms feature selection. For logistic regression, we handle scal-ing as a hyper-parameter with five options5: (i) MinMaxScaler,(ii) Normalizer, (iii) RobustScaler, and (iv) StandardScaler. Inaddition, we use logistic regression with ridge regularization(L2) by default. We refer the reader to the papers cited abovefor a better understanding of each algorithm. All algorithmsare available in the scikit-learn library [43].
Figure 3 illustrates our machine learning process.Train-test split: For a given dataset, we shuffle and split it
into training (80%) and test (20%) sets. The split is stratified,i.e., it preserves the original class balance. The rationale forthis step is twofold: first, it allows us to find the best hyper-parameters and evaluate the optimized model on independentsets from the same data distribution; second, it allows us toreuse a test set to compare the performance of models trainedon different datasets.
Model optimization: For each learning algorithm, we trydifferent hyper-parameters and select the values that yield thebest performance on five-fold cross-validation. We optimizefor balanced accuracy (BA) as the data is imbalanced (moredetails in “Model Evaluation”). The hyper-parameter valuesare randomly selected according to set of possible valuesdefined apriori.6 For instance, if using AdaBoost, the possiblevalues for learning rate are 10{0,−1,−2,−3,−4}. The rationalefor random selection is that exhaustively trying all possiblevalues for all possible hyper-parameters is costly due to cross-validation; hence, we limit the trials to 10 runs.
Model evaluation: For each optimized model, we computethe scores of the following performance metrics:
• Balanced Accuracy (BA) = 12 (
TPTP+FN + TN
TN+FP )
5The details about the scalers and their effect are available in thescikit-learn documentation [42]
6Detailed settings available at “./log-prediction/logpred_method/models.py” [22]
• Precision (Pr) = TPTP+FP
• Recall (Rec) = TPTP+FN
Balanced accuracy (BA) indicates whether the model identi-fies the positive and negative classes correctly and penalizesthe score in the presence of false positives and negatives.Precision (Pr) indicates the model sensitiveness to falsepositives. Finally, recall (Rec) indicates whether the modelidentifies all data points from the positive class.
D. Evaluation
RQ1 (model performance in a large-scale system): We usethe Adyen dataset (see Table II) and apply the process andlearning algorithms described in Section III-C. Unfortunately,the related work either lacks publicly available implementa-tion [11], [12] or requires a full re-implementation compatiblewith our Java code base [10], [16]. For this reason, we usetwo probabilistic baselines: random guess with p = 50.0% andbiased guess with p = 7.7% for the positive class. The laterbaseline illustrates a developer that is aware that only 7.7%of the methods are logged in the code base (see Table II) andwould follow this reasoning for logging decisions. In additionto balanced accuracy (BA), precision (Pr), and recall (Rec),we also report the confusion matrix for further context.
RQ2 (the effect of sampling on imbalanced data): We addclass balancing as a pre-processing step for each learningalgorithm on model optimiziation (see Figure 3). For under-sampling, we use Random Under sampling (RUS). In thissetting, class balancing occurs by randomly dropping datapoints from the majority class, i.e., method should not belogged. For over-sampling, we use Synthetic Minority Over-sampling TEchnique (SMOTE) [44]. In this setting, classbalancing occurs by generating synthetic data points similar tothe points from the minority class. We compare under/over-sampling with no-sampling (RQ1) over the same test split,and report the gain (or loss) on the performance metrics.
RQ3 (feature importance): We inspect the optimized mod-els and rank the most relevant features across models. Therationale for ranking (rather than reporting the actual values)is that it is unfeasible to directly compare coefficients (forlogistic regression) and feature importance (for tree-basedmodels). For logistic regression, we use the absolute valuesfrom the coefficients as a baseline of feature importance. Forthe tree-based models, we rank the features with the bestmean decreased impurity, i.e., the features that best split the
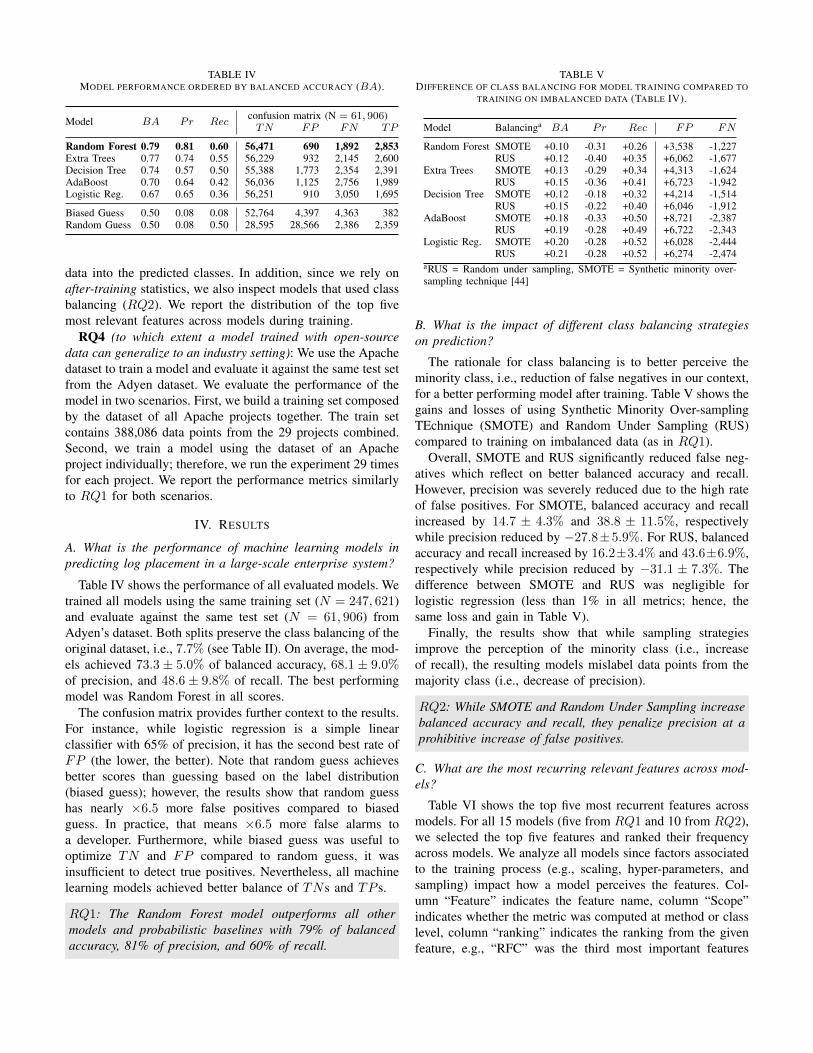
TABLE IVMODEL PERFORMANCE ORDERED BY BALANCED ACCURACY (BA).
Model BA Pr Recconfusion matrix (N = 61, 906)TN FP FN TP
Random Forest 0.79 0.81 0.60 56,471 690 1,892 2,853Extra Trees 0.77 0.74 0.55 56,229 932 2,145 2,600Decision Tree 0.74 0.57 0.50 55,388 1,773 2,354 2,391AdaBoost 0.70 0.64 0.42 56,036 1,125 2,756 1,989Logistic Reg. 0.67 0.65 0.36 56,251 910 3,050 1,695
Biased Guess 0.50 0.08 0.08 52,764 4,397 4,363 382Random Guess 0.50 0.08 0.50 28,595 28,566 2,386 2,359
data into the predicted classes. In addition, since we rely onafter-training statistics, we also inspect models that used classbalancing (RQ2). We report the distribution of the top fivemost relevant features across models during training.
RQ4 (to which extent a model trained with open-sourcedata can generalize to an industry setting): We use the Apachedataset to train a model and evaluate it against the same test setfrom the Adyen dataset. We evaluate the performance of themodel in two scenarios. First, we build a training set composedby the dataset of all Apache projects together. The train setcontains 388,086 data points from the 29 projects combined.Second, we train a model using the dataset of an Apacheproject individually; therefore, we run the experiment 29 timesfor each project. We report the performance metrics similarlyto RQ1 for both scenarios.
IV. RESULTS
A. What is the performance of machine learning models inpredicting log placement in a large-scale enterprise system?
Table IV shows the performance of all evaluated models. Wetrained all models using the same training set (N = 247, 621)and evaluate against the same test set (N = 61, 906) fromAdyen’s dataset. Both splits preserve the class balancing of theoriginal dataset, i.e., 7.7% (see Table II). On average, the mod-els achieved 73.3 ± 5.0% of balanced accuracy, 68.1 ± 9.0%of precision, and 48.6± 9.8% of recall. The best performingmodel was Random Forest in all scores.
The confusion matrix provides further context to the results.For instance, while logistic regression is a simple linearclassifier with 65% of precision, it has the second best rate ofFP (the lower, the better). Note that random guess achievesbetter scores than guessing based on the label distribution(biased guess); however, the results show that random guesshas nearly ×6.5 more false positives compared to biasedguess. In practice, that means ×6.5 more false alarms toa developer. Furthermore, while biased guess was useful tooptimize TN and FP compared to random guess, it wasinsufficient to detect true positives. Nevertheless, all machinelearning models achieved better balance of TNs and TP s.
RQ1: The Random Forest model outperforms all othermodels and probabilistic baselines with 79% of balancedaccuracy, 81% of precision, and 60% of recall.
TABLE VDIFFERENCE OF CLASS BALANCING FOR MODEL TRAINING COMPARED TO
TRAINING ON IMBALANCED DATA (TABLE IV).
Model Balancinga BA Pr Rec FP FN
Random Forest SMOTE +0.10 -0.31 +0.26 +3,538 -1,227RUS +0.12 -0.40 +0.35 +6,062 -1,677
Extra Trees SMOTE +0.13 -0.29 +0.34 +4,313 -1,624RUS +0.15 -0.36 +0.41 +6,723 -1,942
Decision Tree SMOTE +0.12 -0.18 +0.32 +4,214 -1,514RUS +0.15 -0.22 +0.40 +6,046 -1,912
AdaBoost SMOTE +0.18 -0.33 +0.50 +8,721 -2,387RUS +0.19 -0.28 +0.49 +6,722 -2,343
Logistic Reg. SMOTE +0.20 -0.28 +0.52 +6,028 -2,444RUS +0.21 -0.28 +0.52 +6,274 -2,474
aRUS = Random under sampling, SMOTE = Synthetic minority over-sampling technique [44]
B. What is the impact of different class balancing strategieson prediction?
The rationale for class balancing is to better perceive theminority class, i.e., reduction of false negatives in our context,for a better performing model after training. Table V shows thegains and losses of using Synthetic Minority Over-samplingTEchnique (SMOTE) and Random Under Sampling (RUS)compared to training on imbalanced data (as in RQ1).
Overall, SMOTE and RUS significantly reduced false neg-atives which reflect on better balanced accuracy and recall.However, precision was severely reduced due to the high rateof false positives. For SMOTE, balanced accuracy and recallincreased by 14.7 ± 4.3% and 38.8 ± 11.5%, respectivelywhile precision reduced by −27.8±5.9%. For RUS, balancedaccuracy and recall increased by 16.2±3.4% and 43.6±6.9%,respectively while precision reduced by −31.1 ± 7.3%. Thedifference between SMOTE and RUS was negligible forlogistic regression (less than 1% in all metrics; hence, thesame loss and gain in Table V).
Finally, the results show that while sampling strategiesimprove the perception of the minority class (i.e., increaseof recall), the resulting models mislabel data points from themajority class (i.e., decrease of precision).
RQ2: While SMOTE and Random Under Sampling increasebalanced accuracy and recall, they penalize precision at aprohibitive increase of false positives.
C. What are the most recurring relevant features across mod-els?
Table VI shows the top five most recurrent features acrossmodels. For all 15 models (five from RQ1 and 10 from RQ2),we selected the top five features and ranked their frequencyacross models. We analyze all models since factors associatedto the training process (e.g., scaling, hyper-parameters, andsampling) impact how a model perceives the features. Col-umn “Feature” indicates the feature name, column “Scope”indicates whether the metric was computed at method or classlevel, column “ranking” indicates the ranking from the givenfeature, e.g., “RFC” was the third most important features
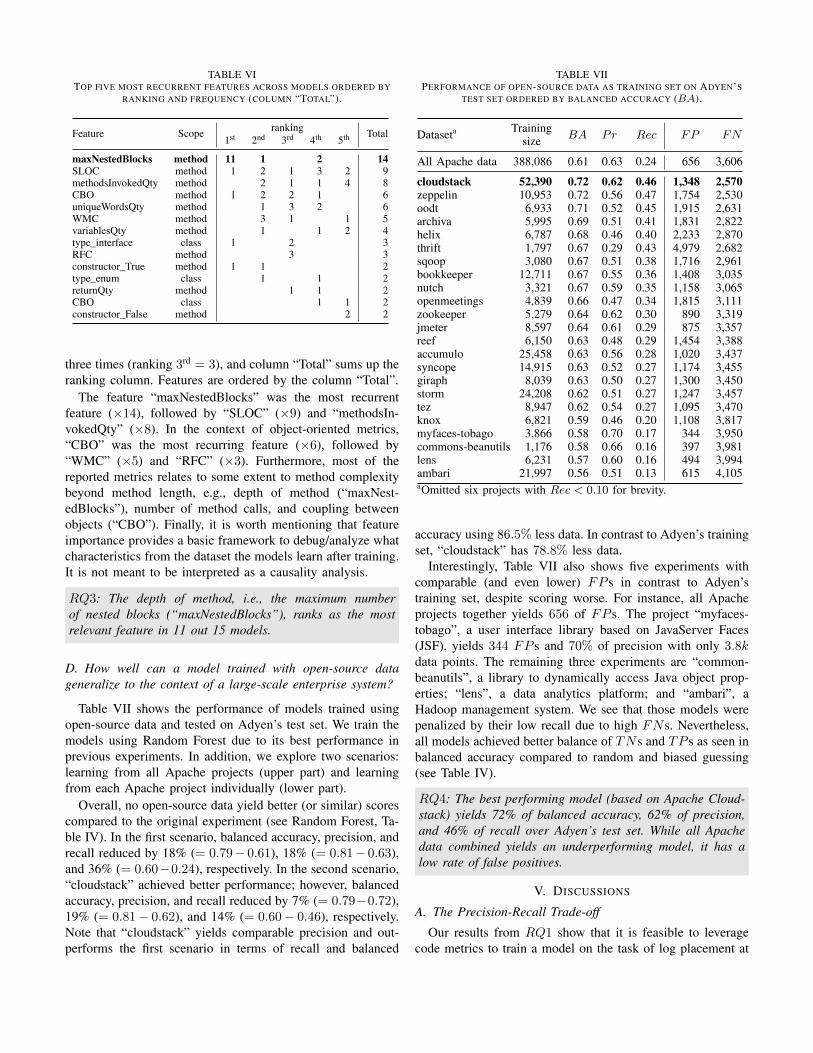
TABLE VITOP FIVE MOST RECURRENT FEATURES ACROSS MODELS ORDERED BY
RANKING AND FREQUENCY (COLUMN “TOTAL”).
Feature Scope ranking Total1st 2nd 3rd 4th 5th
maxNestedBlocks method 11 1 2 14SLOC method 1 2 1 3 2 9methodsInvokedQty method 2 1 1 4 8CBO method 1 2 2 1 6uniqueWordsQty method 1 3 2 6WMC method 3 1 1 5variablesQty method 1 1 2 4type_interface class 1 2 3RFC method 3 3constructor_True method 1 1 2type_enum class 1 1 2returnQty method 1 1 2CBO class 1 1 2constructor_False method 2 2
three times (ranking 3rd = 3), and column “Total” sums up theranking column. Features are ordered by the column “Total”.
The feature “maxNestedBlocks” was the most recurrentfeature (×14), followed by “SLOC” (×9) and “methodsIn-vokedQty” (×8). In the context of object-oriented metrics,“CBO” was the most recurring feature (×6), followed by“WMC” (×5) and “RFC” (×3). Furthermore, most of thereported metrics relates to some extent to method complexitybeyond method length, e.g., depth of method (“maxNest-edBlocks”), number of method calls, and coupling betweenobjects (“CBO”). Finally, it is worth mentioning that featureimportance provides a basic framework to debug/analyze whatcharacteristics from the dataset the models learn after training.It is not meant to be interpreted as a causality analysis.
RQ3: The depth of method, i.e., the maximum numberof nested blocks (“maxNestedBlocks”), ranks as the mostrelevant feature in 11 out 15 models.
D. How well can a model trained with open-source datageneralize to the context of a large-scale enterprise system?
Table VII shows the performance of models trained usingopen-source data and tested on Adyen’s test set. We train themodels using Random Forest due to its best performance inprevious experiments. In addition, we explore two scenarios:learning from all Apache projects (upper part) and learningfrom each Apache project individually (lower part).
Overall, no open-source data yield better (or similar) scorescompared to the original experiment (see Random Forest, Ta-ble IV). In the first scenario, balanced accuracy, precision, andrecall reduced by 18% (= 0.79− 0.61), 18% (= 0.81− 0.63),and 36% (= 0.60−0.24), respectively. In the second scenario,“cloudstack” achieved better performance; however, balancedaccuracy, precision, and recall reduced by 7% (= 0.79−0.72),19% (= 0.81− 0.62), and 14% (= 0.60− 0.46), respectively.Note that “cloudstack” yields comparable precision and out-performs the first scenario in terms of recall and balanced
TABLE VIIPERFORMANCE OF OPEN-SOURCE DATA AS TRAINING SET ON ADYEN’S
TEST SET ORDERED BY BALANCED ACCURACY (BA).
Dataseta TrainingBA Pr Rec FP FNsize
All Apache data 388,086 0.61 0.63 0.24 656 3,606
cloudstack 52,390 0.72 0.62 0.46 1,348 2,570zeppelin 10,953 0.72 0.56 0.47 1,754 2,530oodt 6,933 0.71 0.52 0.45 1,915 2,631archiva 5,995 0.69 0.51 0.41 1,831 2,822helix 6,787 0.68 0.46 0.40 2,233 2,870thrift 1,797 0.67 0.29 0.43 4,979 2,682sqoop 3,080 0.67 0.51 0.38 1,716 2,961bookkeeper 12,711 0.67 0.55 0.36 1,408 3,035nutch 3,321 0.67 0.59 0.35 1,158 3,065openmeetings 4,839 0.66 0.47 0.34 1,815 3,111zookeeper 5,279 0.64 0.62 0.30 890 3,319jmeter 8,597 0.64 0.61 0.29 875 3,357reef 6,150 0.63 0.48 0.29 1,454 3,388accumulo 25,458 0.63 0.56 0.28 1,020 3,437syncope 14,915 0.63 0.52 0.27 1,174 3,455giraph 8,039 0.63 0.50 0.27 1,300 3,450storm 24,208 0.62 0.51 0.27 1,247 3,457tez 8,947 0.62 0.54 0.27 1,095 3,470knox 6,821 0.59 0.46 0.20 1,108 3,817myfaces-tobago 3,866 0.58 0.70 0.17 344 3,950commons-beanutils 1,176 0.58 0.66 0.16 397 3,981lens 6,231 0.57 0.60 0.16 494 3,994ambari 21,997 0.56 0.51 0.13 615 4,105aOmitted six projects with Rec < 0.10 for brevity.
accuracy using 86.5% less data. In contrast to Adyen’s trainingset, “cloudstack” has 78.8% less data.
Interestingly, Table VII also shows five experiments withcomparable (and even lower) FP s in contrast to Adyen’straining set, despite scoring worse. For instance, all Apacheprojects together yields 656 of FP s. The project “myfaces-tobago”, a user interface library based on JavaServer Faces(JSF), yields 344 FP s and 70% of precision with only 3.8kdata points. The remaining three experiments are “common-beanutils”, a library to dynamically access Java object prop-erties; “lens”, a data analytics platform; and “ambari”, aHadoop management system. We see that those models werepenalized by their low recall due to high FNs. Nevertheless,all models achieved better balance of TNs and TP s as seen inbalanced accuracy compared to random and biased guessing(see Table IV).
RQ4: The best performing model (based on Apache Cloud-stack) yields 72% of balanced accuracy, 62% of precision,and 46% of recall over Adyen’s test set. While all Apachedata combined yields an underperforming model, it has alow rate of false positives.
V. DISCUSSIONS
A. The Precision-Recall Trade-off
Our results from RQ1 show that it is feasible to leveragecode metrics to train a model on the task of log placement at
method level. The best performing model (based on RandomForest) achieved 79% of balanced accuracy with only 1.1%of false positives in the test set. Even the worst performingmodel (based on Decision Tree) still achieved 2.8% in falsepositives. We observed empirically that all models mislabeleddata points from the positive class (i.e., it was expected tobe predicted as “should be logged”); therefore, those modelscould improve performance by lowering the false negativesrate. One way to address this issue would be the use of classbalancing. However, as seen in RQ2, our experience on usingsampling techniques was negative in the sense that recall andbalanced accuracy improved at the cost of significant reductionin precision. We argue that sacrificing precision over recall (orbalanced accuracy) is prohibitive in practice: a model with ahigh rate of false positives could compromise the usefulnessof a recommendation tool since it could be a burden fordevelopers to deal with the noisy output.
B. Learning from Code Metrics and Open Source
We achieved promising results in the context of our industrypartner; however, code metrics might not be a good fit forevery context since they are closely related to programmingstyle and design patterns. For instance, in one extreme case, adeveloper could breakdown a method into several single-linemethods. Conversely, several methods could be merged into alarger and complex method. Those variances in programmingstyles might undermine the usefulness of code metrics as pre-dictors. Complementary features might be helpful to capturefurther nuances and characteristics of logged methods, e.g.,the use of a NLP pipeline to learn from the code vocabulary.This could be also useful in the challenge of reducing falsenegatives without undermining precision.
Leveraging open-source data can be useful to overcomethe “cold-start” problem given that the models outperformsrandom guessing and guessing based on label distribution.Furthermore, we observed five scenarios where the resultingmodel achieved a low rate of false positives. For instance,the model trained with all Apache data had 647 of falsepositives (1.2% of the true negative class). However, decidingwhich model to choose or how to combine datasets remainsa problem. More research is necessary to understand whatfactors projects share to help developers to choose an optimalmodel similarly to past work in transfer-learning for defectprediction [18].
VI. THREATS TO VALIDITY
External Validity. The main threat to the generalization ofour results relates to the scope of our study. Our exploratorystudy focused on the code base of our industry partner. Weused open-source data (29 Apache projects) to investigatewhether we could leverage training data from public repos-itories to overcome the “cold-start” problem. It was out ofscope to explore the feasibility of our approach on the eachopen-source project. In addition, we consider that developersuse logging frameworks in the form of method invocations(imperative style). However, another form of instrumenting
source code for logging is through aspect-oriented program-ming (declarative style). While declarative logging is not partof development practices in our industry partner, our approachcould be extended to support Java annotations for the labelingprocess (see Section III-B).
Internal Validity. Our study focuses on logging practices inproduction-related code, and we classify source files accord-ing to their respective paths (see Section III-A). While thisapproach might wrongly classify paths under project-specificsettings, we observed that all Apache projects follow standarddirectory hierarchy of Maven/Gradle projects [45], [46]. Wealso use regular expressions to identify log statements. Weencoded patterns based on the in-house logging frameworkof our industry partner. To generalize to other the open-sourceprojects, we added patterns similarly to other studies [9], [14],[47], [48]. We did not inspect each project individually tofine-tune our identification process. Another threat to internalvalidity is the deletion of log-related code on feature extractionto mitigate data leakage (see Section III-B). We implementeda validation step to compare the presence of log statementsbefore and after the removal of log statements to measure theaccuracy of our implementation. In 23 out of 30 projects, weremoved 100% of the log statements identified. On the otherseven projects, the remaining log ratio was lower than 0.5%.Based on the numbers, we believe that our log removal process(including guards) meets our expectations without compro-mising the results. Finally, our model optimization processconsists of 10 trial runs for each model (see Section III-C).In practice, it would be necessary more trials to cover arepresentative sample of the search space (e.g., Random Foresthas 2,000 possible settings). However, we observed marginalgains on balanced accuracy for 100 runs in comparison to10. For this reason, we keep the number of trials to “10”since it achieves an acceptable trade-off of time-cost andimprovements over the default hyper-parameters.
VII. RELATED WORK
A. The “Log Placement” Problem
Papers addressing the “log placement” problem are closelyrelated in purpose to our goal: providing tooling support tohelp developers to make informed decisions about where toplace log statements. However, they differ in scope, technique,and assumptions.
SMARTLOG [16] provides placement recommendations forerror log statements by mining patterns of “log intention”in source-code using frequent item set mining [49]. Theunderlying assumption is that error log statements are oftenassociated with check conditions involving the return value andarguments of an error-prone function. However, in the scopeof Adyen, the root cause of an invalid state is not limited toan improper parameter or return value of a method. It also in-cludes unexpected interactions between different componentsfrom the application stack that might be nontrivial to capturethrough dependency analysis. Our process relies only on codemetrics extracted from source code. In a different work,LOGADVISOR [10] provides placement recommendations for
two types of code blocks: catch clauses and if statementswith return value. However, our analysis in the code base ofAdyen shows that log statements are placed in many differentplaces rather than only the blocks supported by LOGADVISOR(see Section II-A).
Later work by Li et al. [11] proposes a deep learningarchitecture based on Long Short-Term Memory (LSTM)units to predict log placement at block level. In summary,blocks are represented as feature vectors and, based on thesequence of n blocks, the architecture indicates whether then + 1 block should be logged or not in a sequence-to-vectorfashion. Similarly to our work, they also extract syntacticfeatures based on the occurrence of AST nodes (e.g., num-ber of method calls); however, they also leverage the codevocabulary (referred as semantic features) from variables andmethod invocations. Our work mainly differs on the types ofmodels (deep learning architecture versus traditional machinelearning) and granularity (block-level versus method-level).We choose a simpler approach given the low prevalence of logstatements on logged methods (see Section II-A) and the lackof existing tools (or replication packages) publicly availablefor comparison.
Another study investigates the relationship of the codevocabulary and the presence of log statements [12]. Theunderlying idea is that some system functionalities are morelikely to require log statements (e.g., network communication)than others (e.g., getter and setter methods). The authors use aprobabilistic model (latent Dirichlet allocation [50]) to extracttopics at method level and analyze the correlation betweentopics and the presence of log statements. The similarities incontext compared to our work encourages further investigationon benefits and costs of using topic modeling in our domain.
LOG4PERF [7] provides placement recommendations forlog statements to the specific purpose of improving applicationperformance monitoring in web systems. It relies on loganalysis and source-code instrumentation to build statisticalmodels and to identify code blocks related to “performance-influencing web requests”, i.e., requests with unstable perfor-mance. Our work differs in context since we do not differen-tiate the purpose of log statements.
B. Empirical studies in logging engineering
Several studies leverage repository mining and issue trackerdata to understand how developers conduct logging. Yuanet al. [13] conducted a quantitative study on four C/C++open-source projects (later replicated by Chen and Jiang [14]with 21 java projects) showing that developers struggle onimplementing and maintaining log-related code. Li et al. [8]show qualitatively that logging is challenging and developersrely on their own intuition to balance the trade-offs of logging.Hassani et al. [15] suggest that there is a lack of ownershipwhen dealing with log-related fixes and that maintenancerequires the guidance of experts in the code base. They alsoshow that improper logging has harmful consequences, e.g.,excessive volume of log data, missing log statement, andimproper log messages. Similarly to our analysis of logging
engineering in the field, we also observe that developers in aindustry setting face challenges.
VIII. FUTURE WORK
Our results highlight the feasibility of implementing amachine learning-based tool to support Adyen developersbased on code metrics. However, there are several operationaland usability concerns that must be addressed before makingsuch a tool part of the development workflow. For instance,usability concerns include what is the most effective wayto provide recommendations (e.g., through a plugin in theintegrated development environment or through a bot duringcode review), and how developers react to false positives (e.g.,“What is the acceptable rate of false positives?” and “Woulddevelopers notice the difference between models trained within-house data and models trained with open-source data?”);operational concerns include understanding what is the beststrategy to update models in a fast-paced evolving code base.
All operational and usability concerns are beyond the scopeof this work and require long-term use of a mature tool forvalidation. However, the positive results encouraged us toengage with our industry partner to design an infrastructurefor machine learning-based analysis. As a first step, we arecurrently developing a working prototype at Adyen (using ouruse case of log placement) to collect feedback and conductcontrolled experiments with developers. We want to studydevelopers’ engagement, what are the best operational andmanagement practices for a recommendation tool, and evaluatedifferent machine learning architectures in an industry setting.
IX. CONCLUSION
In this work, we demonstrate that simple metrics extractedfrom source code (e.g., depth of a method, coupling be-tween objects, and SLOC) combined with traditional machinelearning models are useful to address the important problemof placing log statements in source code. We measured theperformance of different classifiers using different training setsand sampling techniques in a large code base from a globalservice provider. In addition, we showed that models based ondata from the Apache ecosystem are relevant in the absenceof training data in an industry setting given the low prevalenceof false positives in different cases. Our promising resultsencourage the next steps on studying how developers deal witha machine learning-based recommendation tool integrated intotheir development workflow on the log placement problem. Allsupporting scripts and tools of our study are publicly availableto the community. We believe that this will foster independentauditing, extension, and future collaborations in the area ofautomated log placement research.
ACKNOWLEDGMENT
We are grateful to everyone at Adyen that contributeddirectly and indirectly to the accomplishment of this work,specially Andreu Mora for the valuable feedback and insights.This research is funded by the NWO MIPL project, grantnumber 628.008.003.
REFERENCES
[1] Elastic, “Elastic Stack: Elasticsearch, Kibana, Beats, and Logstash.”[Online]. Available: https://www.elastic.co/elastic-stack
[2] W. Meng, Y. Liu, Y. Zhu, S. Zhang, D. Pei, Y. Liu, Y. Chen, R. Zhang,S. Tao, P. Sun, and others, “LogAnomaly: Unsupervised Detection ofSequential and Quantitative Anomalies in Unstructured Logs.” in IJCAI,2019, pp. 4739–4745.
[3] X. Zhang, Y. Xu, Q. Lin, B. Qiao, H. Zhang, Y. Dang, C. Xie,X. Yang, Q. Cheng, Z. Li, J. Chen, X. He, R. Yao, J.-G. Lou,M. Chintalapati, F. Shen, and D. Zhang, “Robust log-based anomalydetection on unstable log data,” in Proceedings of the 2019 27thACM Joint Meeting on European Software Engineering Conferenceand Symposium on the Foundations of Software Engineering.Tallinn Estonia: ACM, Aug. 2019, pp. 807–817. [Online]. Available:https://dl.acm.org/doi/10.1145/3338906.3338931
[4] M. Du, F. Li, G. Zheng, and V. Srikumar, “DeepLog: AnomalyDetection and Diagnosis from System Logs through Deep Learning,”in Proceedings of the 2017 ACM SIGSAC Conference on Computerand Communications Security, ser. CCS ’17. New York, NY,USA: Association for Computing Machinery, 2017, pp. 1285–1298, event-place: Dallas, Texas, USA. [Online]. Available: https://doi.org/10.1145/3133956.3134015
[5] S. Lu, B. Rao, X. Wei, B. Tak, L. Wang, and L. Wang, “Log-basedAbnormal Task Detection and Root Cause Analysis for Spark,”in 2017 IEEE International Conference on Web Services (ICWS).Honolulu, HI, USA: IEEE, Jun. 2017, pp. 389–396. [Online]. Available:http://ieeexplore.ieee.org/document/8029786/
[6] N. Gurumdimma, A. Jhumka, M. Liakata, E. Chuah, and J. Browne,“CRUDE: Combining Resource Usage Data and Error Logs forAccurate Error Detection in Large-Scale Distributed Systems,” in2016 IEEE 35th Symposium on Reliable Distributed Systems (SRDS).Budapest, Hungary: IEEE, Sep. 2016, pp. 51–60. [Online]. Available:http://ieeexplore.ieee.org/document/7794329/
[7] K. Yao, G. B. de Pádua, W. Shang, S. Sporea, A. Toma, and S. Sajedi,“Log4Perf: Suggesting Logging Locations for Web-Based Systems’Performance Monitoring,” in Proceedings of the 2018 ACM/SPECInternational Conference on Performance Engineering, ser. ICPE’18. New York, NY, USA: Association for Computing Machinery,2018, pp. 127–138, event-place: Berlin, Germany. [Online]. Available:https://doi.org/10.1145/3184407.3184416
[8] H. Li, W. Shang, B. Adams, M. Sayagh, and A. E. Hassan, “A QualitativeStudy of the Benefits and Costs of Logging from Developers’ Perspec-tives,” IEEE Transactions on Software Engineering, 2020, publisher:IEEE.
[9] Q. Fu, J. Zhu, W. Hu, J.-G. Lou, R. Ding, Q. Lin, D. Zhang,and T. Xie, “Where Do Developers Log? An Empirical Study onLogging Practices in Industry,” in Companion Proceedings of the36th International Conference on Software Engineering, ser. ICSECompanion 2014. New York, NY, USA: ACM, 2014, pp. 24–33.[Online]. Available: http://doi.acm.org/10.1145/2591062.2591175
[10] J. Zhu, P. He, Q. Fu, H. Zhang, M. R. Lyu, and D. Zhang,“Learning to Log: Helping Developers Make Informed LoggingDecisions,” in Proceedings of the 37th International Conferenceon Software Engineering - Volume 1, ser. ICSE ’15. Piscataway,NJ, USA: IEEE Press, 2015, pp. 415–425. [Online]. Available:http://dl.acm.org/citation.cfm?id=2818754.2818807
[11] Z. Li, T.-H. Chen, and W. Shang, “Where Shall We Log? Studying andSuggesting Logging Locations in Code Blocks,” in Proc. of the 35rdIEEE/ACM International Conference on Automated Software Engineer-ing (ASE), 2020.
[12] H. Li, T.-H. P. Chen, W. Shang, and A. E. Hassan, “Studyingsoftware logging using topic models,” Empirical Software Engineering,vol. 23, no. 5, pp. 2655–2694, Oct. 2018. [Online]. Available:https://doi.org/10.1007/s10664-018-9595-8
[13] D. Yuan, S. Park, and Y. Zhou, “Characterizing Logging Practicesin Open-source Software,” in Proceedings of the 34th InternationalConference on Software Engineering, ser. ICSE ’12. Piscataway,NJ, USA: IEEE Press, 2012, pp. 102–112. [Online]. Available:http://dl.acm.org/citation.cfm?id=2337223.2337236
[14] B. Chen and Z. M. J. Jiang, “Characterizing logging practicesin Java-based open source software projects – a replication studyin Apache Software Foundation,” Empirical Software Engineering,
vol. 22, no. 1, pp. 330–374, Feb. 2017. [Online]. Available:https://doi.org/10.1007/s10664-016-9429-5
[15] M. Hassani, W. Shang, E. Shihab, and N. Tsantalis, “Studyingand detecting log-related issues,” Empirical Software Engineering,vol. 23, no. 6, pp. 3248–3280, Dec. 2018. [Online]. Available:https://doi.org/10.1007/s10664-018-9603-z
[16] Z. Jia, S. Li, X. Liu, X. Liao, and Y. Liu, “SMARTLOG: Place errorlog statement by deep understanding of log intention,” in 2018 IEEE25th International Conference on Software Analysis, Evolution andReengineering (SANER). IEEE, 2018, pp. 61–71. [Online]. Available:http://doi.org/10.1109/SANER.2018.8330197
[17] A. Trautsch, S. Herbold, and J. Grabowski, “Static source codemetrics and static analysis warnings for fine-grained just-in-timedefect prediction,” in 2020 IEEE International Conference onSoftware Maintenance and Evolution (ICSME). IEEE, Sep. 2020,pp. 127–138, event-place: Adelaide, Australia. [Online]. Available:https://ieeexplore.ieee.org/document/9240701/
[18] T. Zimmermann, N. Nagappan, H. Gall, E. Giger, and B. Murphy,“Cross-project defect prediction: a large scale experiment on data vs.domain vs. process,” in Proceedings of the 7th joint meeting of theEuropean software engineering conference and the ACM SIGSOFTsymposium on The foundations of software engineering, 2009, pp. 91–100.
[19] B. Turhan, T. Menzies, A. B. Bener, and J. Di Stefano, “On the relativevalue of cross-company and within-company data for defect prediction,”Empirical Software Engineering, vol. 14, no. 5, pp. 540–578, 2009,publisher: Springer.
[20] M. D’Ambros, M. Lanza, and R. Robbes, “An extensive comparison ofbug prediction approaches,” in 2010 7th IEEE Working Conference onMining Software Repositories (MSR 2010). IEEE, 2010, pp. 31–41.
[21] S. E. S. Taba, F. Khomh, Y. Zou, A. E. Hassan, and M. Nagappan, “Pre-dicting bugs using antipatterns,” in 2013 IEEE International Conferenceon Software Maintenance. IEEE, 2013, pp. 270–279.
[22] J. Cândido and M. Aniche, “Electronic Appendix: Paper Toolkit,” 2021.[Online]. Available: https://figshare.com/s/e37588fb2d4f54d5228c
[23] H. He and E. A. Garcia, “Learning from imbalanced data,” IEEETransactions on knowledge and data engineering, vol. 21, no. 9, pp.1263–1284, 2009, publisher: Ieee.
[24] K. E. Bennin, J. Keung, A. Monden, Y. Kamei, and N. Ubayashi,“Investigating the effects of balanced training and testing datasetson effort-aware fault prediction models,” in 2016 IEEE 40th annualComputer software and applications conference (COMPSAC), vol. 1.IEEE, 2016, pp. 154–163.
[25] J. Nam, S. J. Pan, and S. Kim, “Transfer defect learning,” in 2013 35thinternational conference on software engineering (ICSE). IEEE, 2013,pp. 382–391.
[26] Y. Zhang, D. Lo, X. Xia, and J. Sun, “An empirical study of classifiercombination for cross-project defect prediction,” in 2015 IEEE 39thAnnual Computer Software and Applications Conference, vol. 2. IEEE,2015, pp. 264–269.
[27] H. Tong, B. Liu, and S. Wang, “Kernel Spectral Embedding TransferEnsemble for Heterogeneous Defect Prediction,” IEEE Transactions onSoftware Engineering, 2019, publisher: IEEE.
[28] P. Jamshidi, N. Siegmund, M. Velez, C. Kästner, A. Patel, and Y. Agar-wal, “Transfer learning for performance modeling of configurable sys-tems: An exploratory analysis,” in 2017 32nd IEEE/ACM InternationalConference on Automated Software Engineering (ASE). IEEE, 2017,pp. 497–508.
[29] F. Moradi, R. Stadler, and A. Johnsson, “Performance prediction indynamic clouds using transfer learning,” in 2019 IFIP/IEEE Symposiumon Integrated Network and Service Management (IM). IEEE, 2019, pp.242–250.
[30] H. Ha and H. Zhang, “DeepPerf: performance prediction for configurablesoftware with deep sparse neural network,” in 2019 IEEE/ACM 41stInternational Conference on Software Engineering (ICSE). IEEE, 2019,pp. 1095–1106.
[31] FreeBSD, “find(1) freebsd man page.” [Online]. Available: https://www.unix.com/man-page/FreeBSD/1/find/
[32] Slf4j.org, “SLF4J Manual.” [Online]. Available: http://www.slf4j.org/manual.html#fluent
[33] Apache Log4j, “Log4j 2 API Log Builder.” [Online]. Available:https://logging.apache.org/log4j/2.x/manual/logbuilder.html
[34] S. R. Chidamber and C. F. Kemerer, “Towards a metrics suite forobject oriented design,” in Conference proceedings on Object-orientedprogramming systems, languages, and applications, 1991, pp. 197–211.
[35] ——, “A metrics suite for object oriented design,” IEEE Transactionson software engineering, vol. 20, no. 6, pp. 476–493, 1994, publisher:IEEE.
[36] M. Aniche, “Java code metrics calculator (CK),” 2015. [Online].Available: https://github.com/mauricioaniche/ck/
[37] C. M. Bishop, Pattern recognition and machine learning, ser. Informa-tion science and statistics. New York: Springer, 2006.
[38] J. R. Quinlan, C4.5: programs for machine learning, ser. The MorganKaufmann series in machine learning. San Mateo, Calif: MorganKaufmann Publishers, 1993.
[39] L. Breiman, “Random Forests,” Machine Learning, vol. 45, no. 1, pp.5–32, 2001. [Online]. Available: https://rdcu.be/ccoEs
[40] T. Hastie, S. Rosset, J. Zhu, and H. Zou, “Multi-class adaboost,”Statistics and its Interface, vol. 2, no. 3, pp. 349–360, 2009, publisher:International Press of Boston.
[41] P. Geurts, D. Ernst, and L. Wehenkel, “Extremely randomized trees,”Machine learning, vol. 63, no. 1, pp. 3–42, 2006, publisher: Springer.
[42] Scikit-learn, “Compare the effect of different scalerson data with outliers.” [Online]. Available: https : / /scikit-learn.org/stable/auto_examples/preprocessing/plot_all_scaling.html#compare-the-effect-of-different-scalers-on-data-with-outliers
[43] F. Pedregosa, G. Varoquaux, A. Gramfort, V. Michel, B. Thirion,O. Grisel, M. Blondel, P. Prettenhofer, R. Weiss, V. Dubourg, J. Vander-plas, A. Passos, D. Cournapeau, M. Brucher, M. Perrot, and E. Duch-esnay, “Scikit-learn: Machine Learning in Python,” Journal of MachineLearning Research, vol. 12, pp. 2825–2830, 2011.
[44] N. V. Chawla, K. W. Bowyer, L. O. Hall, and W. P. Kegelmeyer,“SMOTE: synthetic minority over-sampling technique,” Journal of arti-ficial intelligence research, vol. 16, pp. 321–357, 2002.
[45] Maven, “Introduction to the Standard Directory Layout.”[Online]. Available: https://maven.apache.org/guides/introduction/introduction-to-the-standard-directory-layout.html
[46] Gradle, “Organizing Gradle Projects,” 2020. [Online]. Available: https://docs.gradle.org/current/userguide/organizing_gradle_projects.html
[47] S. Kabinna, C.-P. Bezemer, W. Shang, M. D. Syer, and A. E. Hassan,“Examining the stability of logging statements,” Empirical SoftwareEngineering, vol. 23, no. 1, pp. 290–333, 2018, publisher: Springer.
[48] H. Li, W. Shang, Y. Zou, and A. E. Hassan, “Towards just-in-timesuggestions for log changes,” Empirical Software Engineering, vol. 22,no. 4, pp. 1831–1865, 2017, publisher: Springer.
[49] R. Agarwal, R. Srikant, and others, “Fast algorithms for mining associ-ation rules,” in Proc. of the 20th VLDB Conference, 1994, pp. 487–499.
[50] D. M. Blei, A. Y. Ng, and M. I. Jordan, “Latent Dirichlet Allocation,”J. Mach. Learn. Res., vol. 3, pp. 993–1022, 2003. [Online]. Available:http://jmlr.org/papers/v3/blei03a.html
![An Exploratory Assessment of Situational Effects in · PDF fileAn Exploratory Assessment of ... been sounded in marketing studies of personality [9], attitudes [18], brand ... AN EXPLORATORY](https://img.pdfslide.us/doc/110x75/5a87d5537f8b9a001c8e19c6/an-exploratory-assessment-of-situational-effects-in-exploratory-assessment-of.jpg)