Embed Size (px)
Citation preview
Flooding in BrisbaneAn explanation of technical f lood terms
We have learnt much about fl ooding over time. The January 2011 fl ood and subsequent Queensland Floods Commission of Inquiry, and Council’s Flood Action Plan acknowledge the importance of providing the best information available to help residents and businesses understand their fl ood risk and be prepared for fl ooding.
Council has developed the Flood Awareness Maps and adopted the terms ‘high’, ‘medium’, ‘low’ and ‘very low’ risk areas to help residents and businesses better understand the likelihood of a fl ood affecting their property.
The Flood Awareness Maps are an awareness tool to provide an indication of the likelihood of a fl ood occurring from one or more sources: creek, river,overland fl ow and storm tide.
The maps do not provide information about the depth or speed of fl ood water. Information on potential depth levels for a property can be found in the FloodWise Property Report visit www.brisbane.qld.gov.au/planning-building.
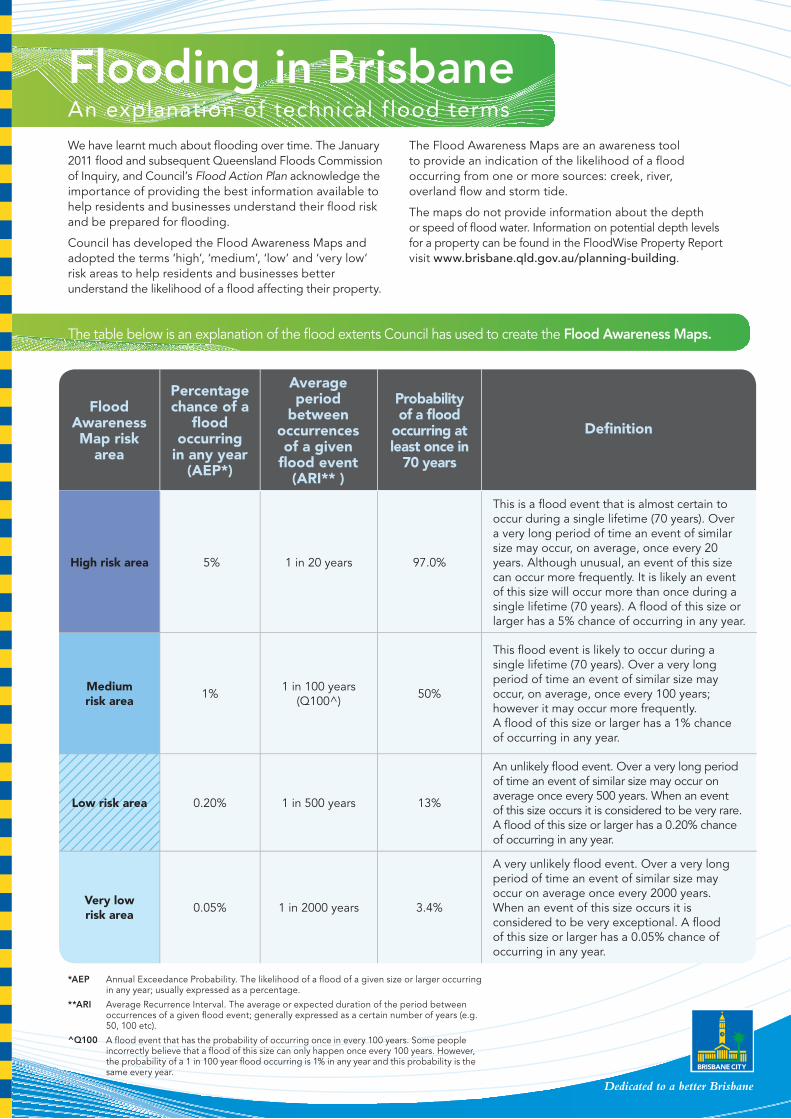
The table below is an explanation of the fl ood extents Council has used to create the Flood Awareness Maps.
Flood Awareness Map risk
area
High risk area
Percentage chance of a
fl ood occurring
in any year (AEP*)
5%
Average period
between occurrences of a given
fl ood event (ARI** )
1 in 20 years
Probability of a fl ood
occurring at least once in
70 years
97.0%
Defi nition
This is a fl ood event that is almost certain to occur during a single lifetime (70 years). Over a very long period of time an event of similar size may occur, on average, once every 20 years. Although unusual, an event of this size can occur more frequently. It is likely an event of this size will occur more than once during a single lifetime (70 years). A fl ood of this size or larger has a 5% chance of occurring in any year.
Medium risk area
1%1 in 100 years
(Q100^)50%
This fl ood event is likely to occur during a single lifetime (70 years). Over a very long period of time an event of similar size may occur, on average, once every 100 years; however it may occur more frequently. A fl ood of this size or larger has a 1% chance of occurring in any year.
Low risk area 0.20% 1 in 500 years 13%
An unlikely fl ood event. Over a very long period of time an event of similar size may occur on average once every 500 years. When an event of this size occurs it is considered to be very rare. A fl ood of this size or larger has a 0.20% chance of occurring in any year.
Very low risk area
0.05% 1 in 2000 years 3.4%
A very unlikely fl ood event. Over a very long period of time an event of similar size may occur on average once every 2000 years. When an event of this size occurs it is considered to be very exceptional. A fl ood of this size or larger has a 0.05% chance of occurring in any year.
*AEP Annual Exceedance Probability. The likelihood of a fl ood of a given size or larger occurring in any year; usually expressed as a percentage.
**ARI Average Recurrence Interval. The average or expected duration of the period between occurrences of a given fl ood event; generally expressed as a certain number of years (e.g. 50, 100 etc).
Q100 A fl ood event that has the probability of occurring once in every 100 years. Some people incorrectly believe that a fl ood of this size can only happen once every 100 years. However, the probability of a 1 in 100 year fl ood occurring is 1% in any year and this probability is the same every year.

©
How do we describe the likelihood of a fl ood occurring?
Understanding the likelihood of different sized fl oods occurring is important for managing fl ood risk. The likelihood of a fl ood event can be described using a variety of terms, but the preferred method,
as recommended by the Queensland Floods Commission of Inquiry, is the Annual Exceedance Probability (AEP). A fl ood with a 1% AEP has a 1% chance of occurring within any year.
How does Council determine the extent of the fl ood risk areas?
The extents are based on modelling and mapping the run-off that would result from a certain amount of rainfall that could fall across a catchment in a given period of time.
For example, the 5% AEP is based on the amount of rainfall that has a 5% chance of occurring in any one year across the catchment.
What factors contribute to fl oods?
The intensity and duration of rainfall are the most important factors in causing a fl ood, but there are many other contributing factors. When rain falls on a catchment, the amount of rainwater that reaches the waterways depends
on the characteristics of the catchment, particularly its size, shape, land use, surrounding structures and saturation levels of soil. Some rainfall is ‘captured’ by soil and vegetation, and the remainder enters waterways as overland fl ow.
What is the difference between the new Flood Awareness Maps and the old Flood Flag Maps?
The purpose of the Flood Flag Maps was to guide building and development in Brisbane. The new Flood Awareness Maps are for residents and businesses to help them understand their fl ood risk and how they can be prepared to help minimise the impact of fl ooding on their homes and businesses.
The Flood Flag Maps modelled a fl ood event required for planning and building purposes. This is typically a 1 in 100 year event. Council is continually improving its fl ood
modelling, based on newly available citywide data and technology, and is now modelling events for 1 in 20, 100, 500 and 2000 year events for the Flood Awareness Maps.
For planning and development purposes, the City Plan 2000 Temporary Local Planning Instrument (TLPI) Brisbane Interim Flood Response and the TPLI Flood Maps should be used. These maps are available from www.brisbane.qld.gov.au/planning-building.
What does the brown hatched area mean on some of the Flood Awareness Maps?
The brown hatching represents specifi c catchment areas. These areas contribute to overland fl ow fl ooding in gullies and fl ow paths. Further investigation is on-going for these areas and when more accurate data is available Council will
update the maps. Until such time the mapping shows the most accurate available overland fl ow data to Council. Please note all other sources of fl ooding are not under review.
FLOOD RISK AREA – TECHNICAL DEFINITIONS
High fl ood risk
High risk is defi ned as fl ooding with a 5% chance of occurring in any year.
Medium fl ood risk
Medium risk is defi ned as fl ooding with a 1% chance of occurring in any year.
Low fl ood risk
Low risk is defi ned as fl ooding with a 0.20% chance of occurring in any year.
Very low fl ood risk
Very low risk is defi ned as fl ooding with a 0.05% chance of occurring in any year.
Brisbane City Council
Information
GPO Box 1434
Brisbane Qld 4001
Printed on recycled paper
N2013-03155 2013 Brisbane City Council
For more information visit www.brisbane.qld.gov.au or call (07) 3403 8888
Facebook.com/BrisbaneCityCouncil
@brisbanecityqld