Embed Size (px)
Citation preview
PSI-Proc.98-01 1st [SUD Sept. 09-11,1996VI
An experimental study on a wake of a torus body using UVP
monitor
Authors: Yoshibiro Inouel , Shintaro Yamashita2, and Masaya Kumada2
Institution: Department of Mechanical Engineering, Suzuka College of Technology
Running head: Y. Inoue et aLI A wake of a torus body
Titles and 1 Department of Mechanical Engineering, Suzuka College of Technology,
Address: Suzuka, Mie 510-02, Japan
2 Department of Mechanical Engineering, Gifu University, Gifu 501-11, Japan
Abstract. A flow around a torus body has a complicated three-dimensional structure, and it
is difficult in this flow to measure a spatiotemporal field of velocity by means of conventional
methods such as hot-wire anemometers. In this study, the wakes of the tori with the diameter
ratio of 3 and 5 are investigated in an axisymmetric and oblique postures mainly for the Reynolds
number of 1500. The vortical structures are observed by the flow visualization techniques,
and instantaneous velocity profiles in the x- and y-directions are measured with an ultrasonic
velocity profile monitor (UVP). The time history of the instantaneous velocity profile is presented,
and the spatial distribution of power-spectrum and two-point correlation coefficient are analyzed.
A system for mUlti-line measurements of the UVP is developed, and a velocity field conditionally
averaged for vortex shedding is shown.
List of symbols
D center-line diameter
d cross-sectional diameter
R 11 correlation coefficient
Re Reynolds number
rx streamwise spacing between two points
St Strouhal number
Uo mainstream velocity
Uc convection velocity
147
U, V mean velocity components in the x- and y-directions
u, v fluctuating velocity components
ii, v instantaneous velocity components
u" v' rms values of fluctuating velocity
x distance in the mainstream direction
y distance parallel to the symmetry plane of the flow and normal to the x-axis
Xlf, Ytr position of the transducer tip
atr angle between the measuring line and x-axis
e oblique angle of the torus against the mainstream
W z vorticity
1 Introduction
Flows around a three-dimensional bluff body and three-dimensional separated flows are of great interest
in the field of fluid mechanics. The vortex formation process even in a wake of a two-dimensional
bluff body like a straight cylinder (Williamson, 1995), however, is not made clear yet, because of its
three-dimensionality and unsteadiness. Many difficult problems related to the flow structure in the
near wake remain to be solved. Axisymmetric bluff bodies have received attention from many
investigators for their simple geometrical shape and wide variety of practical applications: for example,
a disk (Calvert, 1967; Higuchi et aI., 1996), a sphere (Sakamoto and Haniu, 1990) and a ring
(Takamoto, 1987; Miau et aI., 1992). On the other hand, a body of revolution at an angle of attack in
a uniform flow has been also investigated to understand the topology of three-dimensional separated
flow (Tobak and Peake, 1982).
In the present study, the structure of a wake behind a torus body has been investigated; the torus
is a ring with a circular cross-section. This flow is a basic one applicable to many problems, including
biD-fluid mechanics for DNA polymer, properties of flow with micelles, and the drag and heat transfer
performance for helical heating tubes.
The flow around the torus has a three-dimensional complicated structure, and so far few studies
have been made from the engineering and fundamental points of view. Monson (1983), who made
free-fall experiments with different tori in a viscous fluid, found the drag data in the viscous regime
and a variety of flow patterns against a projected area solidity. Also, Amarakoon et aI. (1982) obtained
148
the drag on the torus faIling in a viscous liquid contained by tanks of different cross-sections. In
analytical studies for low Reynolds numbers, Johnson and Wu (1979) employed a singularity method
for Stokes flow and obtained force coefficients for various motions of the torus. Goren and O'Neill
(1980) solved exactly the equations of creeping fluid motion using toroidal coordinates and computed
the resisting forces for toroids with various solidities.
Recently, Leweke and Provansal (1995) investigated the wakes behind four rings with different
aspect ratios in a wind tunnel. They yielded the Strouhal curves in the periodic regime and transition
range, and identified the periodic vortex shedding modes, that is, the parallel mode and helical oblique
modes. Furthermore, they studied the ring wake using a dynamical wake model involving a Ginzburg
Landau amplitude equation and compared its predictions with their experimental data.
Our present experiments were carried out in a water channel using a flow visualization technique
and an ultrasonic Doppler method. The ultrasonic velocity profile (UVP) monitor developed by Takeda
(1995) yields spatiotemporal information on the velocity, so that the wake structure of the torus is
made clear in this study, both in the cases of a zero inclination and oblique postures of the torus.
2 Experimental methods
2.1 Test rig
Experiments were performed in a free-surface water channel. Water preserved in the underground
pit is pumped up and introduced through a control valve into the channel. The flow settled by means
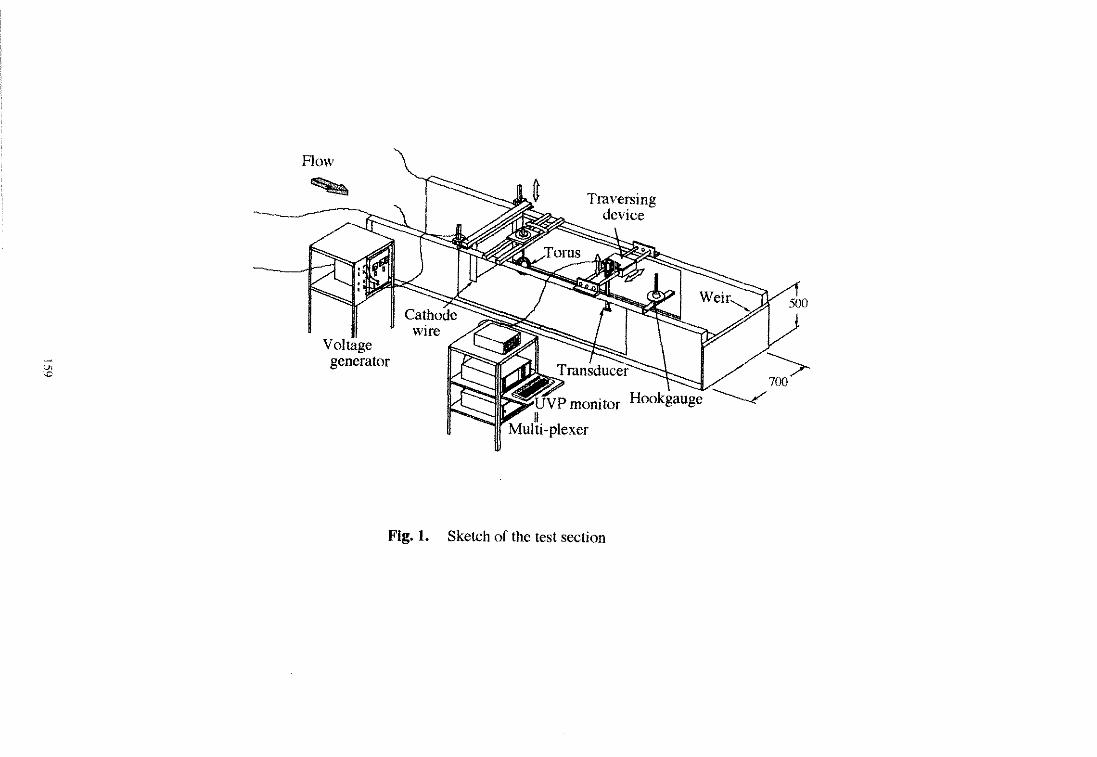
of a straightener and screens is contracted into a test section. The layout around the test channel is
shown in Fig. 1. The channel is 700 mm wide, 3 m long, and 500 mm deep at the top of the weir.
The torus body is suspended on a circular rod, whose other end is fixed at a rotatable table on the
channel, in the middle of a cross section 1 m downstream from the contraction end. An ultrasound
transducer is held in a tip of a streamline-shaped support, which is fastened to a traversing device.
The flow field and coordinate system are shown in Fig. 2. The cross-sectional diameter and center
line diameter of the torus body are defined as d and D, respectively. A ratio Did is a geometrical
parameter of the torus, and in this study the cases of Did =3 and 5 with d =30 mm are investigated.
An inclination of the symmetry axis of torus to the mainstream direction presents an attitude of the
torus. The oblique angle (J was varied in the range of O· to 85·, and the zero inclination, that is (J =0,
is an axisymmetric posture. A dynamical parameter of the flow is the Reynolds number, which is
149

(2)
based on a free stream velocity Uo and the cross-sectional diameter d in the present study. The free
stream velocity remains constant at 50 mm/s, and the Reynolds number Re is nearly equal to 1500.
The origin of co-ordinates is on a plane of symmetry of the torus body and at the center of its rim,
and the x-axis is taken to be coincident with the mainstream direction. The flow visualization by a
hydrogen-bubble technique and measurements with the UVP monitor were made on the symmetry
plane of the flow, i.e., the x-y plane.
2.2 UVP monitor and multiplexer
The UVP monitor used in this study is a model X3-PS (Met-Flow). The hydrogen bubbles, which
were generated and seeded from a cathode wire by the electrolysis of water, were utilized as particles
reflecting the ultrasound. The cathode wire is a platinum wire of 20 !-tm diameter and positioned
upstream of the torus, as shown in Fig. I.
A basic frequency of the ultrasonic transducer is 4 MHz (IMASONIC), and the other measuring
parameters are shown in Table I. The arrangement of the ultrasound transducer is shown in Fig. 2.
A location and orientation of measuring line are presented in terms of the position of the transducer
tip, Xtr and Ytr, and of an angle from the x-axis, atr. Therefore, the velocity q instantaneously detected
by the UVP monitor is a function of atr,
q(x; , yiJ = u(x; , yiJ cos a". + v(x; , yiJ sin a,r' (I)
and the measuring positions are
Xi =x" + ( S" + SCh i) cos a,,,
y; =Ytr + (s" + SCh i) sin a". (i = 0,1, "',127),
where Sst and Sch are the starting depth and channel distance of the UVP monitor, respectively. The
transducer arrangements and spatial measuring parameters adopted in this experiment are also listed
in Table I.
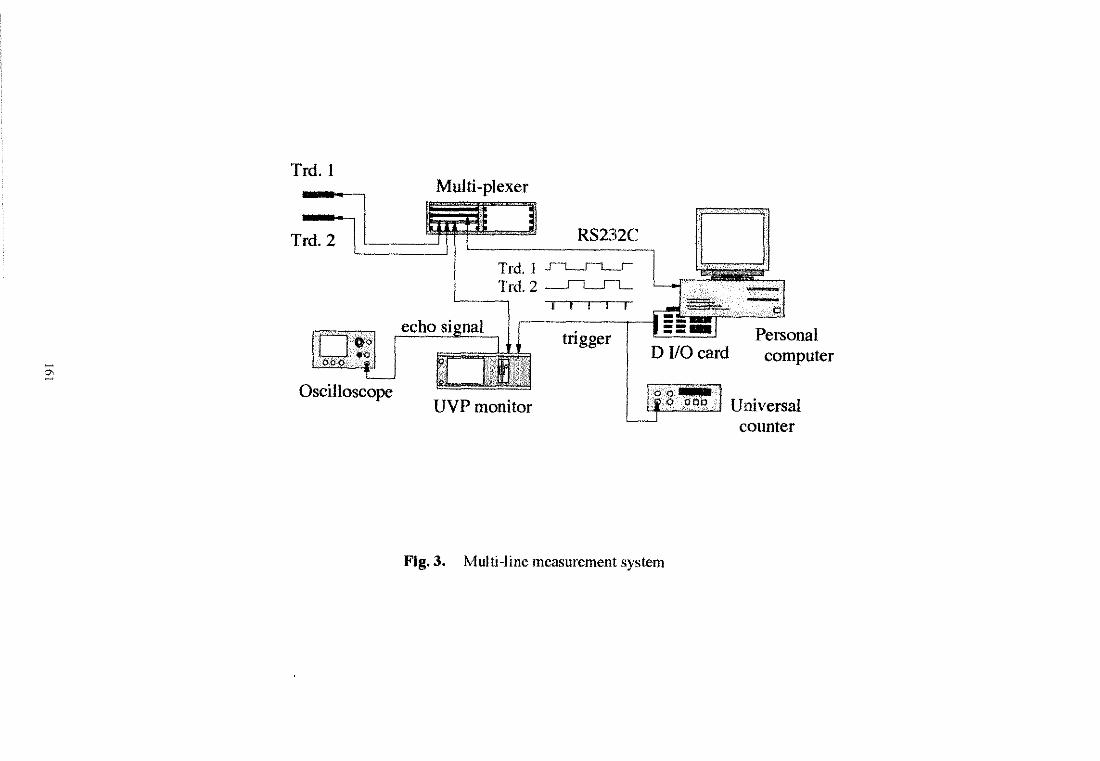
A multi-measurement system applied to conditionally averaging the velocity profiles is shown
schematically in Fig. 3, and a setting of a reference transducer is given in the last column of Table I.
Two transducers are alternately switched by a multiplexer (64-System, JcAIR), which is controlled
together with the UVP monitor by a personal computer (FMV-Series, FUJITSU). The time period of
the transducer switching is 145 ms.
150
3 Results and discussion
3.1 Axisymmetric wake at zero inclination
Flow visualization and vortex shedding frequency
The flows visualized by a hydrogen-bubble method are shown in Fig. 4. Mean flow fields for Did =
3 and 5 are axisymmetric, but the vortical structures for these flows are different from each other. In
the near wake region ofDid = 5, say within about 1 D downstream of the torus, the inside and outside
shear layers roll up alteruately; they are separated from the caliber and circumference of the torus,
respectively, and the vortex rings are shed downstream. In the case of Did =3, however, no vortex
ring is discernible in this visualization picture, and the periodic variation of the velocity is rather
observed near the axis of symmetry of the torus.
There is a dominant frequency of the fluctuating velocity in the wake of the torus at the zero
inclination, probably corresponding to the vortex shedding. In order to estimate the dominant
frequencies, measurements of the fluctuating velocity were made in a range of 600 < Re < 2700 at x
=150 mm, where the inside and outside cylindrical shear layers separated from the torus roll up and
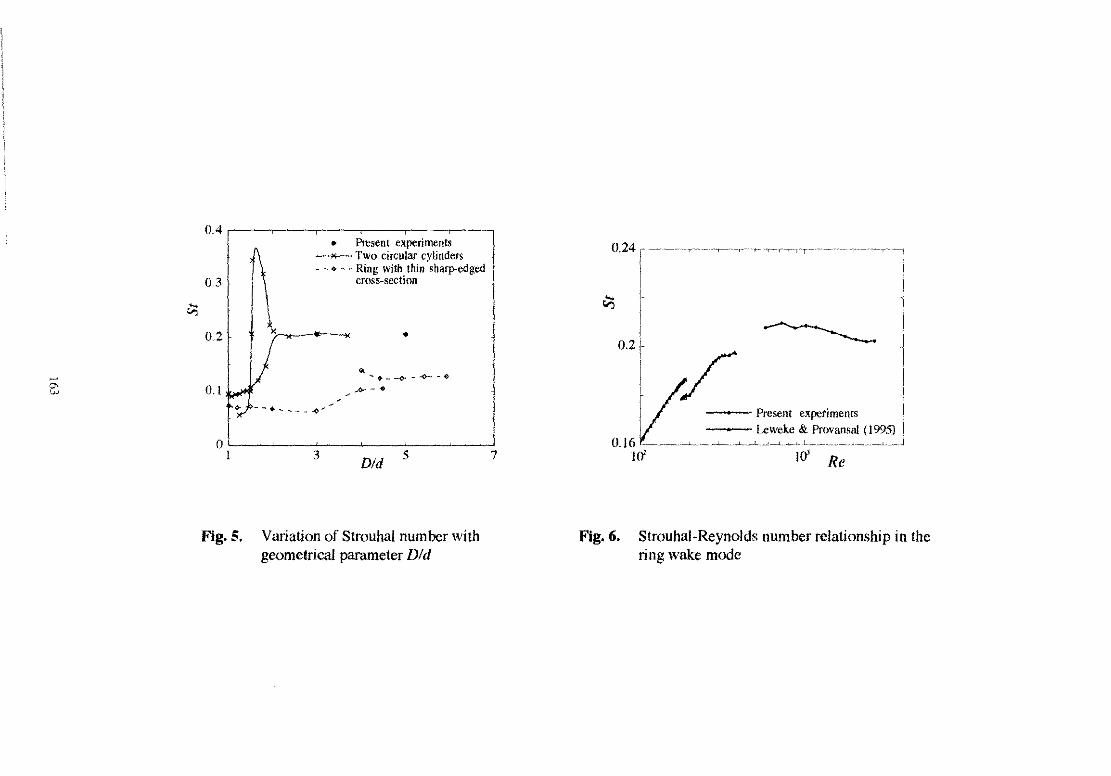
periodic vortex structures are observed, as shown in Fig. 4. The variation in the vortex shedding
frequency, represented in the Strouhal number St =f d I Uo. against the diameter ratio is shown in
Fig. 5; the present data are for Re = 1500, and compared with rings having a sharp-edged cross
section (Takamoto, 1987) and two circular cylinders (Bearman and Wadcock, 1973). Takamoto (1987)
has suggested in his investigations of the rings that there exists a structural change of the wake between
Did =4.5 and 5.0. Monson (1983) also found that the patterns of the torus wake may be classified
into three categories by the projected area solidity, S =4 (DId) I (Did + 1)2, and that there is a sudden
change between two flow patterns at S =0.6 (Did =4.4). In the present experiments the tori with Did
=3 and 5 were used; on referring to the above studies, the former corresponds to a disk mode which
has an oblique loop wake structure typically generated by solid bodies, and the latter to a ring wake
mode which consists of coherent axisymmetric structures. The vortex shedding frequencies for the
torus were almost similar to the wake of two circular cylinders, and they remained almost unchanged
for both regimes of the torus wake. No discrepancy seems to explicitly appear between the two
wake modes in the shedding frequency in contrast to the wake of the ring model. In the wake of the
torus with Did =3, however, the peak of the power spectrum is relatively smaller and much broader
than that with Did =5.
lSI
Figure 6 shows the change in the dominant frequencies with respect to the Reynolds number for
the ring wake mode (Did = 5) together with the results measured by Leweke and Provansal (1995) in
the wake of the torus with Did = 10. Leweke et aJ. have found from their careful experiments that
transition from a stationary to an oscillating wake occurs at Re '" 50, and that there are a periodic
regime nearly in the interval 50 < Re < 190 and a transition regime in 180 < Re < 350. The Reynolds
numbers in the present experiments are slightly above the transition regime, and by reference to the
wake of a circular cylinder (Williamson, 1995), flows in this interval seem to be associated with a
disorganized motion by a fine-scale three-dimensionality. It is observed from our results that the
Strouhal number is nearly constant and slightly decreases as the Reynolds number increases above
1000. This behavior is probably the same for the circular cylinder (Blevins, 1995).
Spatiotemporal velocity field
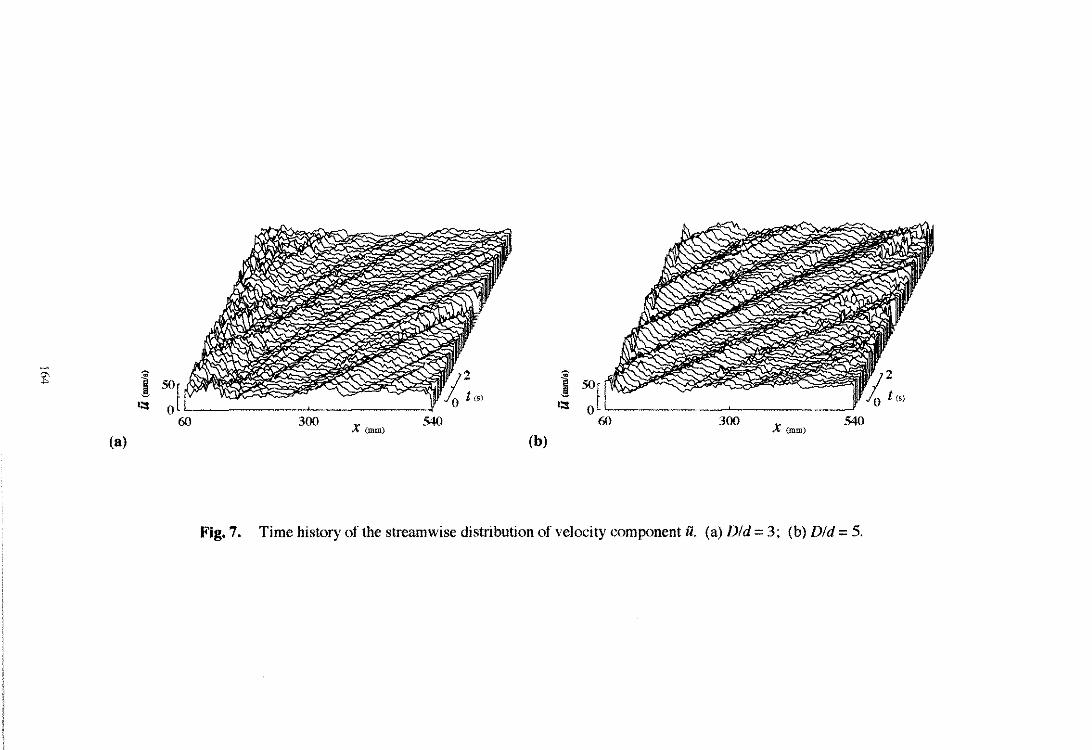
Figures 7(a) and (b) show time histories of the instantaneous profile of the velocity component a in
the x-direction. The radial distances of measuring lines which are parallel to the x-axis are 30 mm
and 50 mrn for the diameter ratio of 3 and 5, respectively, and these positions nearly correspond to
the inside separated shear layers. In the case of Did =5, the regions of higher and lower velocities
appear alternatively and regularly in the time and/or streamwise directions and transfer linearly in
the x-t plane. This slope indicates a convection velocity of flow structure, and the value estimated
here in this case is 0.80 times the free stream velocity Uo. On the other hand, for Did = 3, the regularity
of the flow structure is found downstream of about x =150 mm, and the convection velocity is smaller
than that for Did =5.
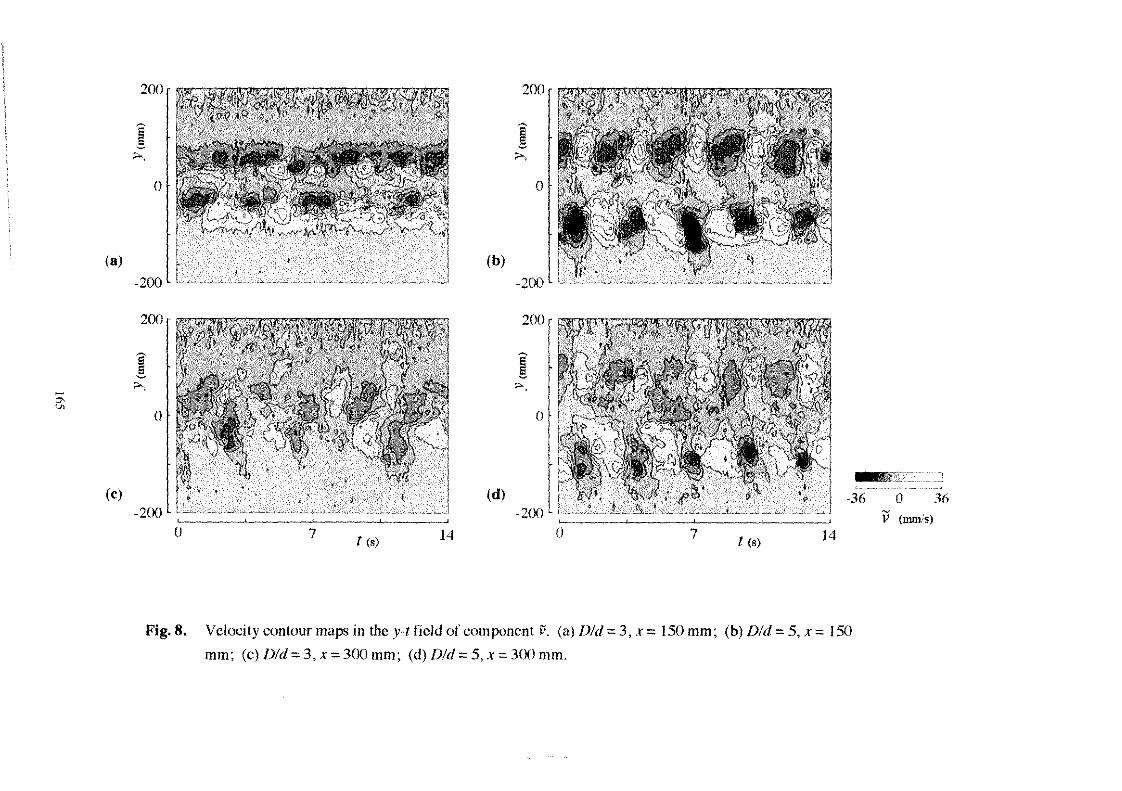
Spatiotemporal contour maps of the instantaneous velocity component in the y-direction are shown
in Figs. 8(a), (b) at x =150 mrn and Figs. 8(c), (d) at x =300 mrn; the abscissae denote the time and
the ordinates are the lateral distance. The figures clearly show the flow patterns in the space-time
field, in which the flow direction is right to left. The map for Did =5 at x =150 mm (Fig. 8(b»
shows clearly the anti-symmetric contour patterns; thus the flow is symmetric with respect to y = 0,
and the regions of the positive and negative velocities are arrayed with a spatiotemporally regular
pattern. In the near field at Did = 3 (Fig. 8(a», there is a flow toward the center axis in the outer
shear layer, and the regions of the positive and negative velocities are scattered about y '" ± 40 mrn
temporally. In the downstream position, x =300 mrn for D/d =5 (Fig. 8(d», it can be seen that the
152
regular patterns are clear and the strnctural arrangement of the flow remains almost unchanged both
in the time and lateral directions. On the other hand, at Did =3 (Fig. 8(c», a flow pattern is
considerably altered compared with the upstream cross section; the regions of the positive and negative
velocities become larger bulks than at the upstream position due to an absorption of the vortices and
have a tendency to be located about y =O. It seems that this modification of the velocity profile is
connected with the transition of the flow structure from the cylindrical vortex to the vortex loop (see
also in Fig. 4(a», which was suggested by Sakamoto and Haniu (1990) for a wake of a sphere.
Flow structure
The space correlation of fluctuating velocities at two points separated in the main flow direction is
useful for a strnctural analysis of flow, while its measurement is difficult by means of the method of
hot-wires, because the upstream probe greatly disturbs the flow. For this reason, the UVP monitor
has an advantage over the other velocity measurement methods and can measure such quantities
without error due to the probe-induced disturbance.
The coefficient of space correlation is defined as,
u(x, y; 0, 0, 0) u(x, y; rx,Ty, 17)
u'(x, y; 0, 0, 0) u'(x, y; rx' ry, 17) , (3)
in the two-dimensional field. Although spatiotemporal parameters are rx, ryand 17, only rx is changed
as a variable and the others remain constant. The correlation coefficients are computed at various y.
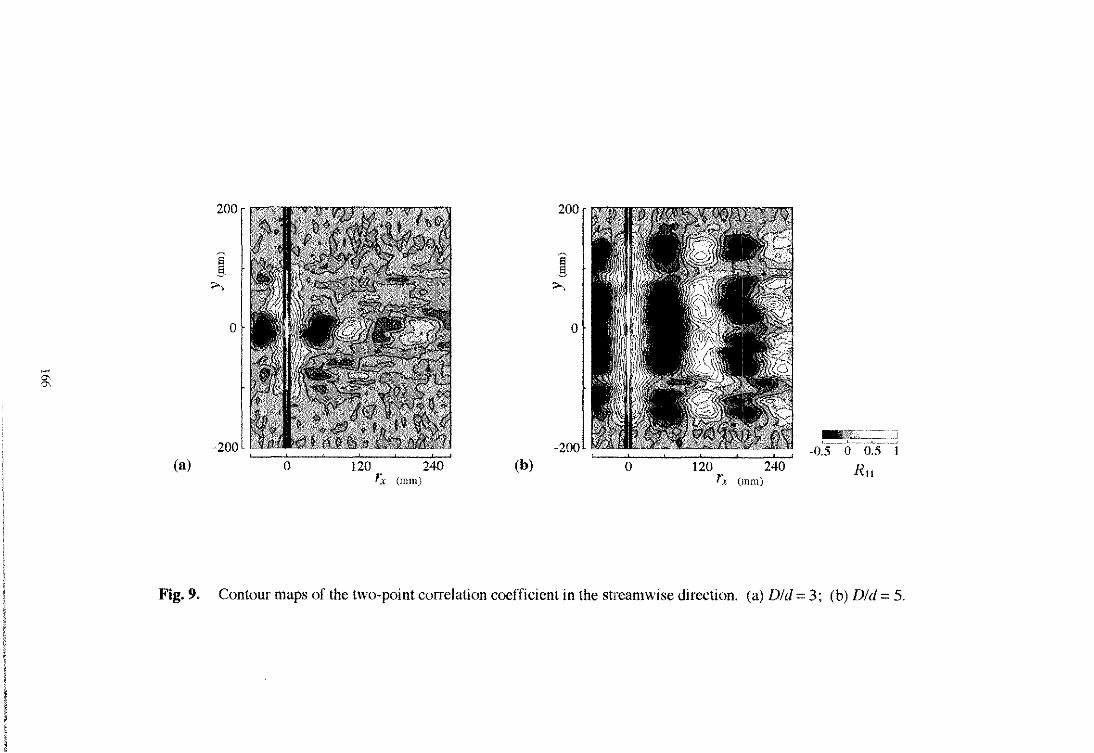
Figures 9(a) and (b) show the contour maps of two-point correlation coefficients at the reference
position of x = 150 mm for the diameter ratio of 3 and 5, respectively. As shown in Fig. 9(a), no
coherent structure of the flow at Did = 3 can he found except in the neighborhood of the axis of
symmetry. In contrast, it can be seen at Did =5 (Fig. 9(b» that the regions of the positive and
negative correlation coefficients appear periodically in the x-direction; the streamwise length scales
of this flow have a same value over the wake, except near y =0 and y =± 90 mm, where mean
velocity gradients in the y-direction dUldy are nearly equal to O.
The wake of the torus of DId =5 exhibits well-organized motion in comparison with Did =3.
This organized strncture consists of the inside and outside vortex rings, shed from the torus body and
counterrotating with each other, which corresponds to the axisymmetric parallel mode. In order to
153
confirm this phenomenon, a conditionally averaging method is utilized in the present study. The
multi-line measurements with two ultrasonic transducers were carried out and instantaneous velocity
profiles at two different locations were sampled almost simultaneously, that is, with a very short
interval of 145 ms; one measuring-line is fixed for a reference velocity fluctuation, and the other is
moved in the wake. The reference signal is that obtained by rectifying the fluctuating velocity by a
band-pass filter, and the time when the reference signal reaches a positive peak is used as a trigger
for each cycle.
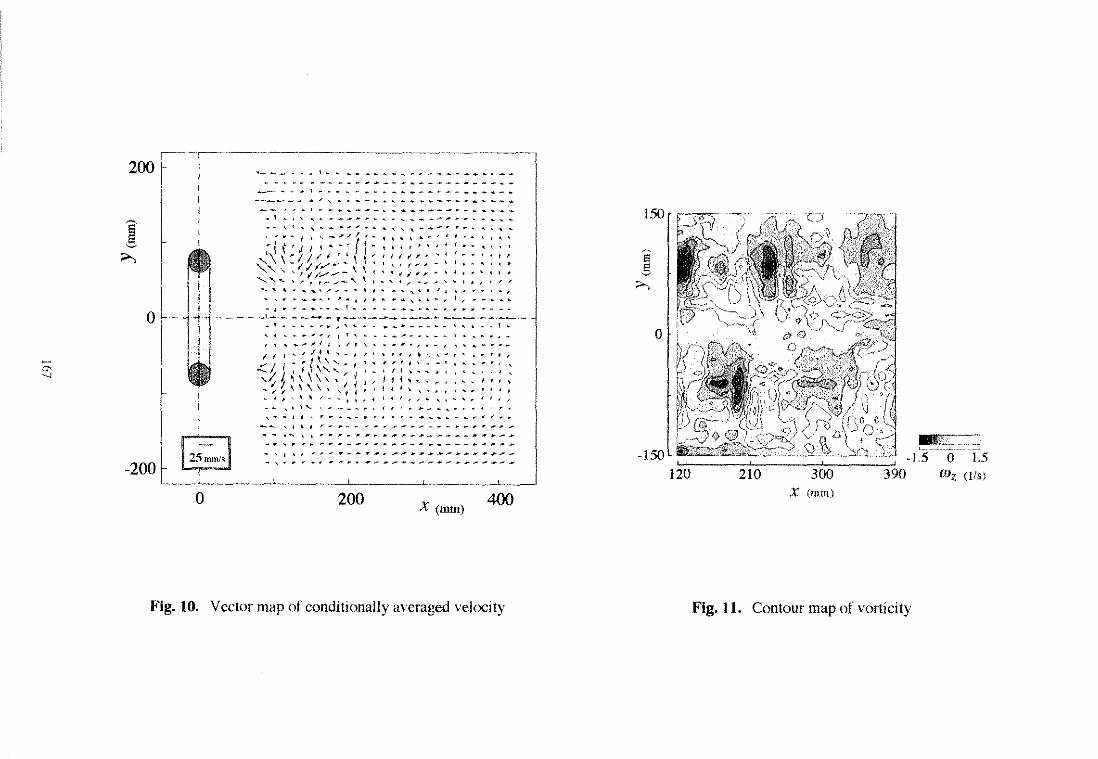
Figure 10 shows the conditionally averaged vector map «u> - Uc,<v», where Ucis the convection
velocity and estimated at 0.80 Uo in the preceding section. Vorticities can be deduced from the
conditionally averaged velocity field. The vorticity in the x-y plane Wz is defined as
ill =iiv _ iiuZ iix iiy, (4)
and velocity gradients are computed by polynomial approximation. Figure 11 shows a contour map
of the vorticity. As shown in Figs. 10 and 11, the vortical structure is symmetric with respect to the
axis of symmetry of the torus, and clockwise and counterclockwise vortex rings alternatively arrange
in the streamwise direction. A center of the inside vortex rings locates at the radial distance of about
50 rum from the symmetry axis of the torus and a center of the outside vortex rings at the radial
distance of about 90 mm. Values of mean velocities in the mainstream direction at the centers of the
inside and outside vortex rings, which were utilized as the convection velocity of the vortex ring by
Takamoto (1987), are 0.81 Uo and 0.77 Uo, respectively.
3.2 Flow fields for oblique posture
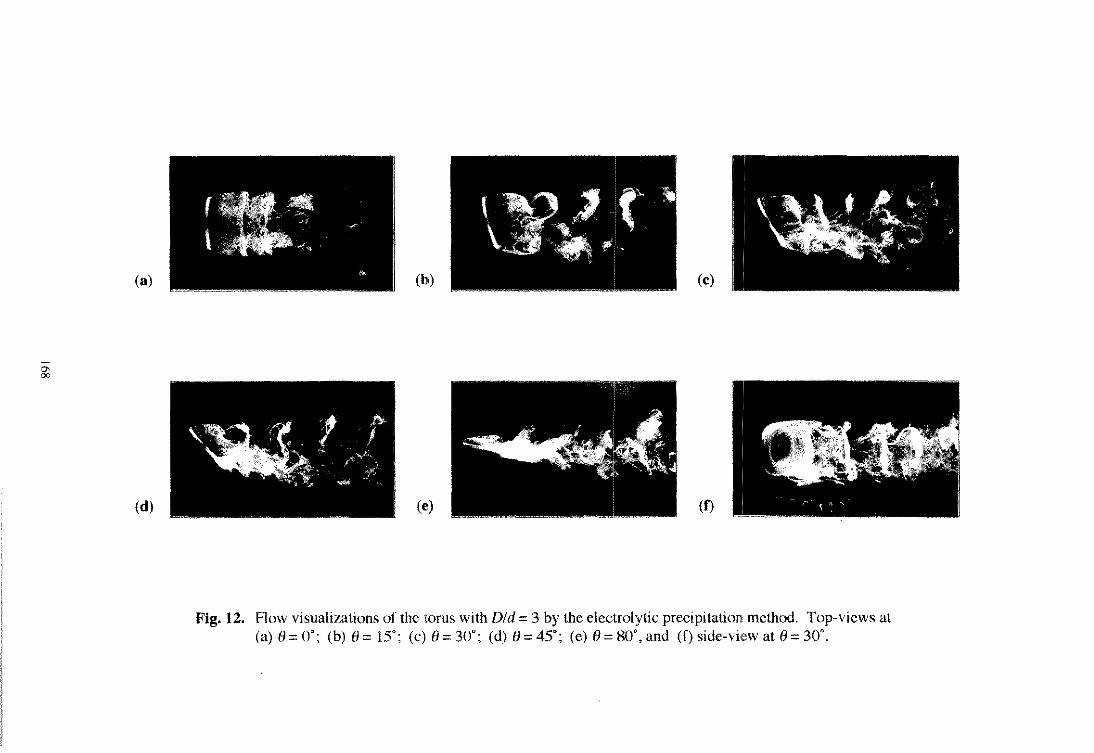
Figures 12(a)-(f) show the flows at Re =600 visualized by the electrolytic precipitation method, in
which the torus with the diameter ratio of 3 was set up in the oblique postures of fJ =0·, 15·, 30.,45°
and 80°, and the behaviors of the shear layer separated from the torus perimeter are visible by white
precipitates. In the axisymmetric case (Fig. 12(a», the separated shear layer is a cylindrical form
rolling up at x., 4d (see also in Fig. 4(a».
For fJ = 15° and 30° (Figs. 12(b) and (c», the separated flow from the torus forms a cylindrical
layer with an axis nearly coincident with the mainstream direction and rolls up at almost the same
downstream distance from the leading edge of the torus body. After that, the vortex ring is broken
154
up into two parts because of an interaction between the outside and inside shear layers. One part
exists in the side where the torus rim is inclined upstream, i.e., y > 0, and vortex filaments are
periodically shed into the wake and have a vortex-loop structure, as shown in a side view for e= 30·
(Fig. 12(t). Another part in the downstream-inclined side (y < 0) is quasi-periodic at different intervals
compared with the upstream-inclined side. For e= 45· (Fig. 12(d» the flow shows almost the same
configuration as the preceding case, but the regularity of flow structure in the downstream-inclined
side vanishes. For e= 80·, shown in Fig. 12(e), the intermittent flow through the inside of the torus
and the separated flow from the trailing edge were synchronized at a nearly constant interval.
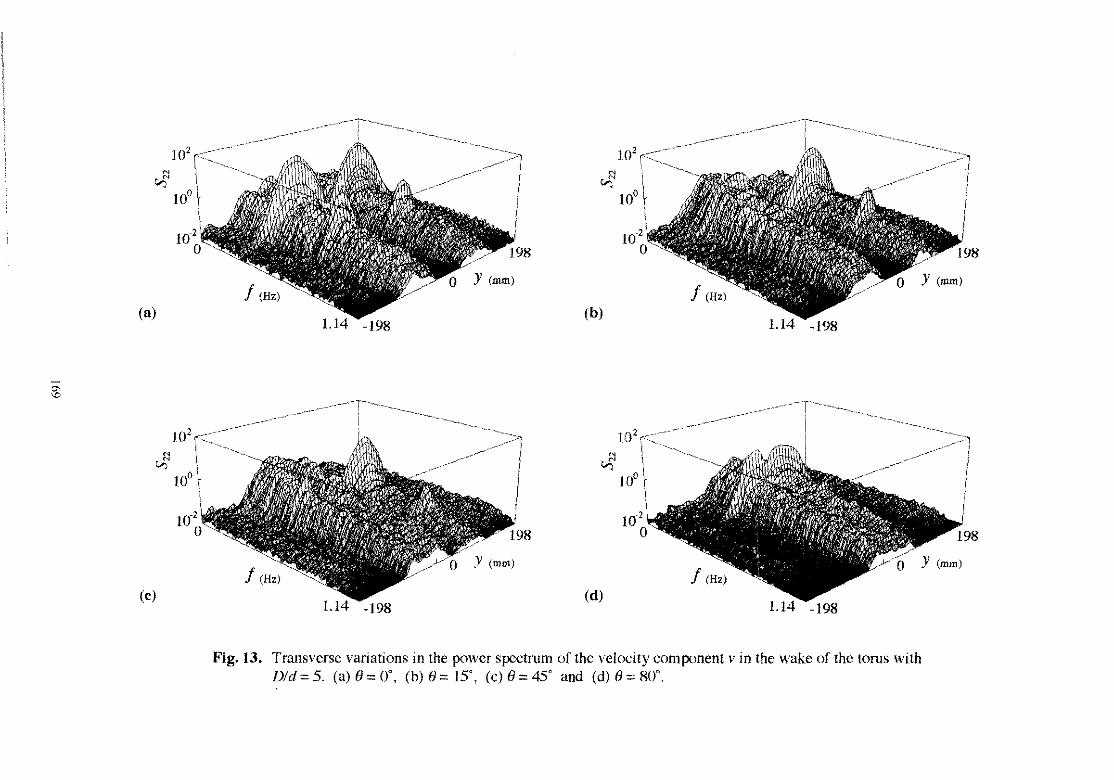
The 3-D maps of power spectra dependent onf and y in the cross section of x = 150 mm are
shown in Figs. 13(a)-(d) for the various oblique postures of the torus with Did = 5; a one-dimensional
power spectrum S22(J) is obtained by Fourier transforming a time-series data set of 512 points measured
by the UVP monitor, where f denotes a frequency. For the axisymmetric flow at e= 0, the spectral
map is symmetric with respect to y = 0 and shows two peaks of single frequency of f'" 0.34 Hz at y '"
± 90 mm. In the case of e= 15·, the peak frequency in the upstream-inclined side (y> 0) increases
compared with e= 0, the one in the downstream-inclined side (y < 0) decreases and its power is
considerably reduced. in the downstream-inclined side at e= 45·, no peak is distinguished in the
frequency domain, and two ridges become evident in the region ofy < O. For e= 80·, there appears
one peak for each spectral ridge with the axis of y = 0 between.
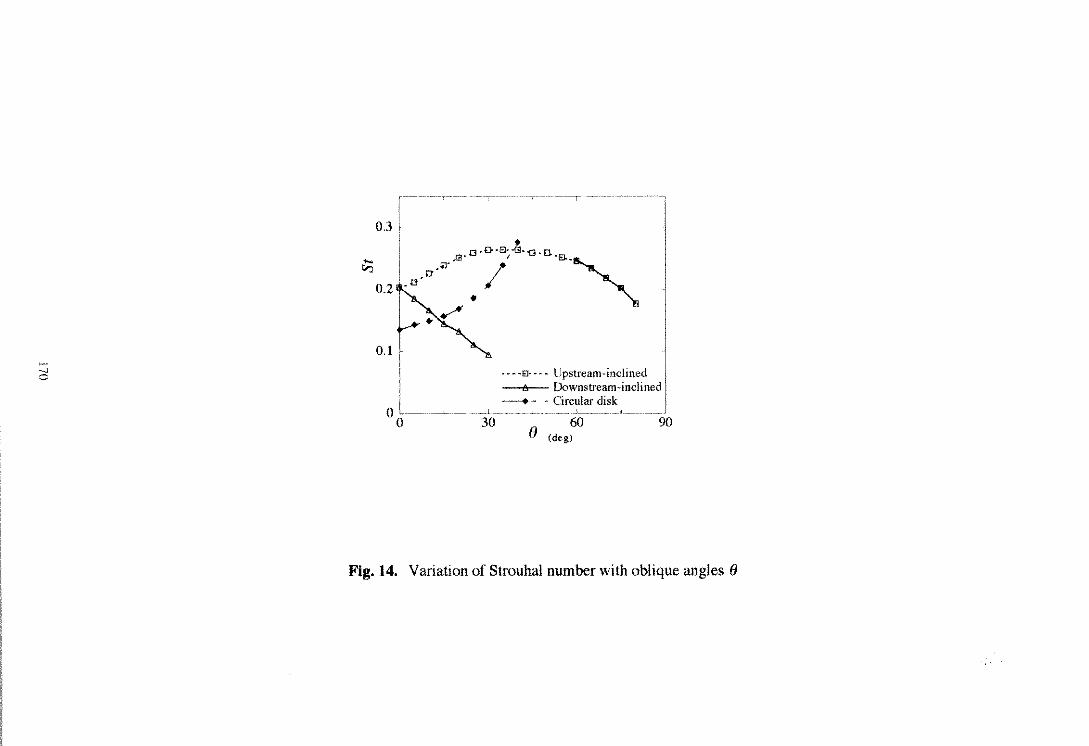
Non-dimensional peak frequencies are plotted against the oblique angle in Fig. 14, together with
the experimental results of a circular disk by Calbert (1967). When the torus is set with axisymmetric
posture (say e= 0), the Strouhal number is about 0.2. If the torus assumes an oblique posture, the
Strouhal numbers in the upstream- and downstream-inclined sides become different from each other;
the former increases and the latter decreases with increasing the oblique angle eup to about e=30·.
By further increasing e, the peak in the power spectrum in the downstream-inclined side disappears
up to about e=60· , and in this range of ethe Strouhal number in the upstream-inclined side is nearly
constant or slightly decreases with e. If egoes over 60·, the peak in the power spectrum in the
downstream-inclined side appears again, and the Strouhal number coincides with the one in the
upstream-inclined side which decreases with increasing 8. This variation of the Strouhal number or
the peak frequency in the spectrum with respect to the oblique angle eindicates that the structure of
the wake of the inclined torus is altered with (); four categories can be identified in the situations of 8
J55
=0·, O· < e< 30·, 30· < e< 60· and e> 60·, respectively.
It is found by our previous work for the inclined torus body (Inoue et al., 1995) that a maximum
value of lift is obtained at e~ 60· , and that the direction of the moment of force acting on the torus is
different from each other for O· < e< 70· and 70· < e< 90·. These phenomena seem to correlate
with the transition of the flow regimes shown in the present experiment.
4 Concluding remarks
The flow structures behind the torus body set with axisymmetric and oblique postures were investigated
by the flow visualization technique and UVP monitor. Qualitative explanations were given for the
vortical structure in terms of flow visualization. Instantaneous flow patteru, various quantities,
including streamwise two-point correlation and power spectral density of fluctuating velocity, and
conditionally averaged velocity profiles were analyzed from the data set measured by the UVP monitor.
These quantities made clear the structural properties of the wake of the torus.
In the axisymmetric wake at zero inclination, it is confirmed that there were two modes of flow
structure. At the lower diameter ratio, the disk mode is observed and consists of the cylindrical shear
layer and oblique vortex loop. The streamwise change of these flow structures is clearly found in the
time history of the instantaneous velocity profile. At the higher diameter ratio corresponding to the
ring wake mode, the counterrotating vortex rings alternately are shed from the torus with regularity.
This phenomenon is reflected in the streamwise two-point correlation and conditionally averaged
vorticity field. In the case of Did =5 at Re ~ 1500, the convection velocity of the vortex ring is
estimated at 0.80 Uo.
The vortex shedding frequencies remain almost unchanged for both regimes within the present
experiments, and no discrepancy explicitly appears between two wake modes in the shedding
frequency. In the ring wake mode, the Strouhal number is nearly constant and slightly decreases as
the Reynolds number increases above 1000.
In the oblique postures of the torus, the change in the flow structure with respect to the oblique
angle can be made clear by the transverse variations in the power spectrum and behavior of the peak
frequencies in the space and frequency domains. The flow patterns can be identified in four categories
of e=0·, O· < e< 30·, 30· < e< 60· and e> 60·, respectively.
156
Acknowledgement
The authors wish to express their appreciation to Dr. Ing. Yasushi Takeda of Paul Scherrer Institut
for his advice on the UVP system.
References
Amarakoon A M D; Hussey R G; Good B J; Grimsal E G (1982) Drag measurements for
axisymmetric motion of a torus at low Reynolds number. Phs. Fluids. 25: 1495-1501
Bearman P W; Wadcock A J (1973) The interaction between a pair of circular cylinders normal to
a stream. J. Fluid Mech. 61: 499-511
Blevins R D (1995) Vortex-structure interaction. In: Fluid Vortices. (ed Green, S I). pp 533-574,
Netherlands: Kluwer Academic Pub.
Calvert J R (1967) Experiments on the flow past an inclined disk. J. Fluid Mech. 29: 691-703
Goren S L; O'Neill M E (1980) Asymmetric creeping motion of an open torus. J. Fluid Mech.
101: 97-110
Higuchi H; Anderson R W; Zhang J (1996) Three-dimensional wake formations behind a family
of regular polygonal plates. AlAA J. 34: 1138-1145
Inoue Y; Okugawa T; Yamashita S (1995) An experimental study on the properties of the 3
dimensional flow around a torus. Proc. 72nd JSME Spring Ann. Meeting. (Tokyo). 3: 63-64
Johnson R E; Wu T Y (1979) Hydromechanics of low-Reynolds-number flow. Part 5. Motion of a
slender torus. J. Fluid Mech. 95: 263-277
Leweke T; Provansal M (1995) The flow behind rings: bluff body wakes without end effects. J.
Fluid Mech. 288: 265-310
Miau J J; Chiu E G; Chou J H (1992) Laser-sheet flow visualization of the confined wake behind a
ring. Fluid Dynamics Research. 9: 255-265
Monson D R (1983) The effect of transverse curvature on the drag and vortex shedding of
elongated bluff bodies at low Reynolds number. Trans. ASME J. Fluids Eng. 105: 308-322
Sakamoto H; Hauiu H (1990) A study on vortex shedding from spheres in a uuiform flow. Trans.
ASME J. Fluids Eng. 112: 386-392
Takamoto M (1987) A study of the wake structure behind bluff rings. Bull. National Research
Laboratory of Metrology. 36: 445-537
157
Takeda Y (1995) Velocity profile measurement by ultrasonic Doppler method. In: Experimental
Thermal and Fluid Science. Vol. 10, pp 444-453, New York: Elsevier Sci. Inc.
Tobak M; Peake D J (1982) Topology of three-dimensional separated flows. Ann. Rev. Fluid
Mech. 14: 61-85
Williamson C H K (1995) Vortex dynamics in the wake of a cylinder. In: Fluid Vortices. (ed
Green, S I). pp 155-234, Netherlands: Kluwer Academic Pub.
]58
Flow
Ch
'"
,
Voltagegenerator
UVPmonitor
"Multi-plexer
Fig. 1. Sketch of the test section
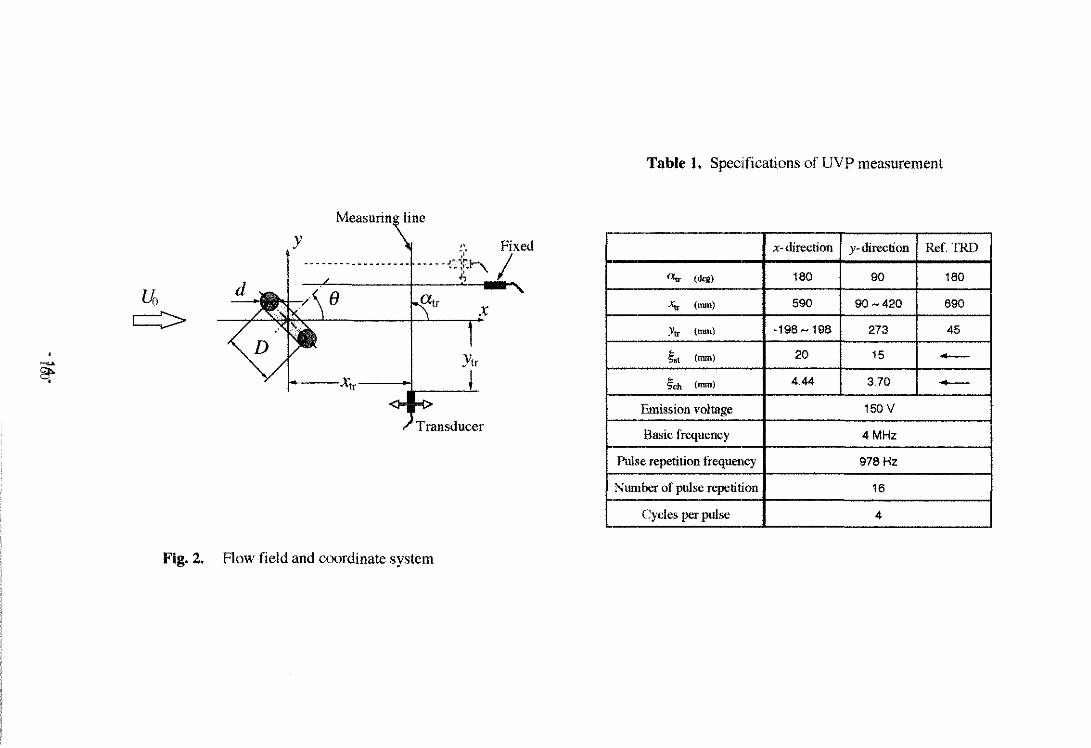
Table 1. Specifications of UVP measurement
Measurinl! line
--0-1 jI- Xtr Ii
Transducer
x-direction y- direction Ref. TRD
a.,. (deg) 180 90 180
-'tr (mm) 590 90 -420 890
y" (mm) -198-198 273 45
S,t (mm) 20 15 -Sch (mm) 444 3.70 -
Emission voltage 150V
Basic frequency 4 MHz
Pulse repetition frequency 978Hz
Number of pulse repetition 16
Cycles per pulse 4
Fixed
Ix
Ytr
a tr
".. .!:..~ - - ~ ~ {;;~iJ-"
~;
e
Y
Vac:::::>
~
Fig. 2. Flow field and coordinate system
'"
Trd.l
Trd.2
Oscilloscope
Multi-plexer
•RS232C
Trd.l -'L...r1.-..J
Trd.2~L
-u I I IT
trigger
UVPmonitor
PersonalD I/O card computer
Universalcounter
Fig. 3. Multi-line measurement system

162
0.4 I I
I
75o I 3 Did1
<> p- -. - - - ~ ~ ....
----"~·_·~-'i
-------0.24 r ~·""--""·--T'~--"'TW"--!--"''j---T-r'T'-''T--_m,- ,
I I
I0,2 r
VI/I) Present experiments
() 16 '_ __ ~ _~. ~,t:~~~'~Pr°va~'~(l_",:~j10' 10' Re
r:;
•
.. .... __(>o_-o__ ~
..... - .
• Present experiments~ Two circular cylinders- - • - - Ring with thin sharp-edged
cross-section~
(U
03
~
'"co
Fig. S. Variation of Strouhal number withgeometrical parameter Did
Fig. 6. Strouhal-Reynolds number relationship in thering wake mode
'" is{)~2 i ~['"':;S ·o[ 0 tM
':::1 060 300 X (mm)
540 60 300X (mm)
(a) (b)
Fig. 7. Time history of the streamwise distribution of velocity component il. (a) Did = 3; (b) Did = 5.
36()
V (rom/g)
~:;it
-36
14t (8)7o
o
-2(XJ
2(XJ
j;..,
(d)
14t (8)7
_, __....L
o
200
o
-2(X)
j;...
(e)
(a)
-200 l (b)
-ZOO
200 r !/'1ii--t"W."iYiJ>k&:5:'· ,·'y,.h.J&iii'if;n;Xi-5hcH:r,[NcilItdi;/:;:}S;;AlJi}M.,.,M(jj ZOO
~r
~
!~
;.., ;;:0."
C"V>
Of 0
Fig. 8. Velocity contour maps in the y-I field of component V. (a) Did =. 3, x=. 150 mm; (b) Did =. 5, x =. ISO
mm; (c)Dld=.3,x=.300mm; (d)Dld=.5,x=.3Wmm.
200 200
S ig
'" '"0 0
a::
(a) o 120 240rx (mOl)
(b) o
L ';_:~:--:;;__ Moj
-0.5 0 0.5 1120 240 R
llrx (mm)
Fig. 9. Contour maps of the two-point correlation coefficient in the streamwise direction. (a) Did = 3; (b) Did = 5.
(1/s)
_2211=1,1:50 (5
390 Wz300X (mm)
210120
-150
o
E§~,-,
, .,,
, ..
, ., ,
, .
400
,, , ,,
-.
-,
X (mm)
w ... '" ... ~ _ ~... ..-
..... _ ~ .. ~ M •
,_ .... -, .. -, '0. _ , ... ,
I ' , ..- I I,," -, "
~ ......._........... -
• ,. .. I"./ ~-
~ .. ,-" ... I l-.,....... " .. ,
200
.. ~ _-_ _ -
... .............
~ I ~ , .. _
- ,
~ , ~~,
... "" I... __ ~_~1_
~ ~ " ' ..~ , , .
. , .
... " ~} f' ,_",,,1,:\,('11""(':
,,\"'1/ 11 " I,,\.~I/,~_ .. \t~........ , ..~,,:I///-\',.""---,\
_._._. l,_ ....... .__ ,.. ._ .....w_,..-. ,, ._
'»~.~"- .. ..-"''' ~_ _~~ ... ,"--, ..,~ ~""''''ll' __ ~_~~
......... '" ( l ... , , ,. r .. ..-
,. I j ..... / flo" _ ..-..- ~ ..
~II- .. !\\ "'I ....... '1'........ j f \ " J f j , ,
,~ f \ \ \\ , , I I ,I' I • , ,"";I\\\\";I,lj*', ,~/~~,__ ... I ."
"..... .... I \ f
o
IIII
12~mm!sIL...........- --L....- _.--L... .L _
o
200
-200
I;>-.,
~-.J
Fig.l0. Vector map of conditionally averaged velocity Fig. 11. Conlour map of vorticily
g;
(a)
(d)
(b)
(e)
(e)
(f)
Fig. 12. Row visualizations of the torus with DId =3 by the electrolytic precipitation method. Top-views at(a) 8 =(r; (b) 8 =]5°; (c) 8 =30°; (d) 8 =45°; (e) 8 =80·, and (f) side-view at 8 =30°.
_.~-
lO2
~10°
(a)-198
y (rom)
102
N
r;;HP
(b)f (Hz)
-198
" ~~~----
_-/.--
---~.<.~
-198
f (Hz)
102r<.~··_---------------------r---·----· -_.
~ I"~ ! ----------
10° r ---
\1021
0"
(d)-198
f (Hz)
Nr;:lOO
102
(c)
~
Fig. 13. Transverse variations in the power spectrum of the velocity component v in the wake of the torus withDid = 5. (a) (i = (r, (b) I) = 15°, (c) I) = 45 0 and (d) I) =- Sir.
0,1 i
I'-'o
0.3
, 0 •_ I: ,.G'o- -a...e·"O_n":l .lil" I "S.
02~o'<> / ~. ~
.. ~ ·8-··· Upstream-inclinedis-- Downstream-inclined
--+ - - Circular disk
00 ~ e W W(deg)
Fig. 14. Variation of Strouhal number with oblique angles (J