Embed Size (px)
Citation preview
IMSC.4.05.71-9 * MAY 1971
AN EXPERIMENTAL STUDY OF THESTRENGTH AND STABILITY OF THIN MONOCOQUE SHELLS
WITH REINFORCED AND UNREINFORCED RECTANGULAR CUTOUTS
ALAN M. C. HOLMESBo O. ALMROTH
N72-13880
Unclas10713
U (NASA
(NASA-CR-115267) AN EXPERIMENTAL STUDYTHE STRENGTH AND STABILITY OF THINMONOCOQUE SHELLS WITH REINFORCED ANDA.M.C. Holmes, et al (Lockheed MissilesSpace Co.) fay 1971 162 p CSCL
CR OR TMX OR AD NUMBER) (CATEGORY) I
Q/fJad/eePA LO ALTO RESEARCH LABORATORY
LOCKHEED MISSILES & SPACE COMPANY * A GROUP DIVISION OF LOCKHEED AIRCRAFT CORPORATION
PALO ALTO, CALIFORNIA
OFFICE OF PRIME RESPONSIBILITY
OPEN"- 2_' ,.~ .;. .
1- I I e - .--
iI.1 J
Ml"k
https://ntrs.nasa.gov/search.jsp?R=19720006231 2018-06-18T02:17:29+00:00Z

AN EXPERIMENTAL STUDY OF THESTRENGTH AND STABILITY OF THIN
MONOCOQUE SHELLS WITH REINFORCEDAND UNREINFORCED RECTANGULAR CUTOUTS
Alan M.C. HolmesBo 0. Almroth
4-05-71-9 May 1971
Structural Mechanics LaboratoryLockheed Palo Alto Research Laboratory
Palo Alto, California

FOREWORD
The research described in this report was performed under Contract
NAS9-10372 with the NASA/Manned Spacecraft Center, Houston, Texas, with
Dr. F. J. Stebbins as Contract Monitor.
i

ABSTRACT
Axial compression tests were run on eleven thin-walled aluminum cylinders
having rectangular cutouts. Varibus types of reinforcement were used around
the cutouts, and some tests were run with no reinforcement. The test results
are compared with the cylinder buckling loads prior to installation of the
cutouts (obtained without damaging the cylinder by using a "buckle-capture"
technique), and correlated with computer-predicted failure loads. The latter
were based on the use of the STAGS computer program.
For thin cylinders such as these, the test and computer-based analysis
shows that for small to moderate size cutouts, reinforcement of the cutout
is of no benefit unless the cylinder is of extremely high (geometrical) quality.
For cylinder quality and cutout size where reinforcei;ient is beneficial, the
relative merits of the various reinforcement configurations are discussed,
and an empirical basis for design is proposed.
ii
/

CONTENTS
Section Page
FOREWORD i
ABSTRACT ii
1 INTRODUCTION AND CONCLUSION 1-1
2 TEST SPECIMENS AND PROCEDURES 2-1
2.1 Specimen Material and Geometry 2-1
2.2 Specimen Manufacture 2-2
2.3 Measurement of the Cylinders 2-2
2.4 The Buckle Capture Technique 2-3
2.5 Installing the Cutouts and Reinforcement 2-6
2.6 Method of Loading 2-7
2.7 Strain Gages and Related Instrumentation 2-8
Tables 2-11
Figures 2-34
3 TEST RESULTS AND EXPLANATORY COMMENTS 3-1
3.1 The Summary Tables 3-1
3.2 The Strain Gage Data Tables 3-2
3.3 Photos of the Tested Cylinders 3-2
Tables 3-3
Figures 3-51
4 THEORETICAL RESULTS 4-1
Figures 4-4
5 CORRELATION 5-1
Tables 5-5
Figures 5-6
6 REFERENCES 6-1
iii

Section 1
INTRODUCTION AND CONCLUSION
One of the critical problems in the structural design of launch vehicles
and spacecraft is the determination of the required reinforcement around cut-
outs in the primary shell structure. Although aircraft have always had rela-
tively large cutouts in the primary structure, the major design consideration
for aircraft is fatigue, and thus operating stress levels are moderate to low.
The simplified design rules for reinforcing a cutout (e.g., the reinforcement
area should equal the area of the material removed by the cutout) have been
adequate to prevent collapse of the fuselage under compressive loading. On
spacecraft and launch vehicles, however, the operating stress is much higher,
and aircraft design rules are not adequate.
To predict collapse loads for shells with cutouts requires a nonlinear
analysis and has until very recently been clearly outside the state of the art
in shell analysis. The large number of parameters makes it impossible to pro-
duce design charts by use of a purely empirical approach, and a theoretical
analysis has been limited by very high computer costs. Consequently design
of cutout reinforcement has been based on rules of thumb which generally are
quite conservative due to the uncertainty involved. However, recent improve-
ments in computer technology as well as in numerical analysis methods have
brought the computer cost down to a level where it now appears feasible to
establish design procedures with a more solid foundation.
The first nonlinear analysis of cylindrical shells with rectangular cut-
outs was presented in Ref. 1. At that time it was not economically feasible
to analyze shells which were thin enough for collapse to occur in the elastic
range. This essentially made meaningful comparisons impossible between test
and theory for metal cylinders. Later improvements (Ref. 2 and 3) have not
only extended the generality of the computer program but also improved its
efficiency so that it now is possible to shed some light on the problem of
the collapse of shells with cutouts through a combination of analytical and
experimental investigations.
1-1

The STAGS (STructural Analysis of General Shells) computer program is an
analytical means for predicting collapse of shells with cutouts. The develop-
ment of this program has been sponsored by the Air Force Flight Dynamics Labo-
ratory (AFFDL), the Air Force Space and Missile Systems Organization (SAMSO),
and Lockheed's Independent Research Program. The experimental work in this
report was designed from its inception to complement that analytical effort.
The primary objective of the present program was to provide high quality ex-
perimental data from relatively simple configurations (circular cylinders
having rectangular cutouts) for comparison with analytical predictions and
for verification of the STAGS computer program. A second objective was to
develop design guidelines for use in preliminary sizing of the reinforcement
around cutouts in cylindrical shells as used in aerospace vehicles. For the
range of parameters considered in this program, the experimental results have
confirmed the theoretical predictions of the STAGS code and it is anticipated
that a more extensive analytical parametric study will develop more detailed
design curves for selecting reinforcement configurations for cutouts in
stiffened cylinders.
As the work progressed it became increasingly apparent that computer
analysis should precede the test work to aid in selecting the most suitable
specimen dimensions. As a result, considerably more computer work was in-
cluded in the preparation of these tests than was originally planned.
Eleven thin-walled aluminum cylinders with cutouts were tested in axial
compression. Each cylinder was tested first without cutouts to establish a
reference level for this cylinder. Due to the sensitivity of axially loaded
cylinders to small initial imperfections, this step was necessary for a pro-
per understanding of the test results. Damage to the specimen during these
preliminary tests was avoided by use of a buckle limiting device, consisting
of an electrically isolated mandrel mounted inside the cylinder. If the gap
between the cylinder and mandrel is small enough, stresses in the buckled
specimen will remain in the elastic range.
In view of the small size of this program and the complexity of the problem,
all conclusions should be considered tentative. However, we can state the
following conclusions with reasonable assurance:
1-2
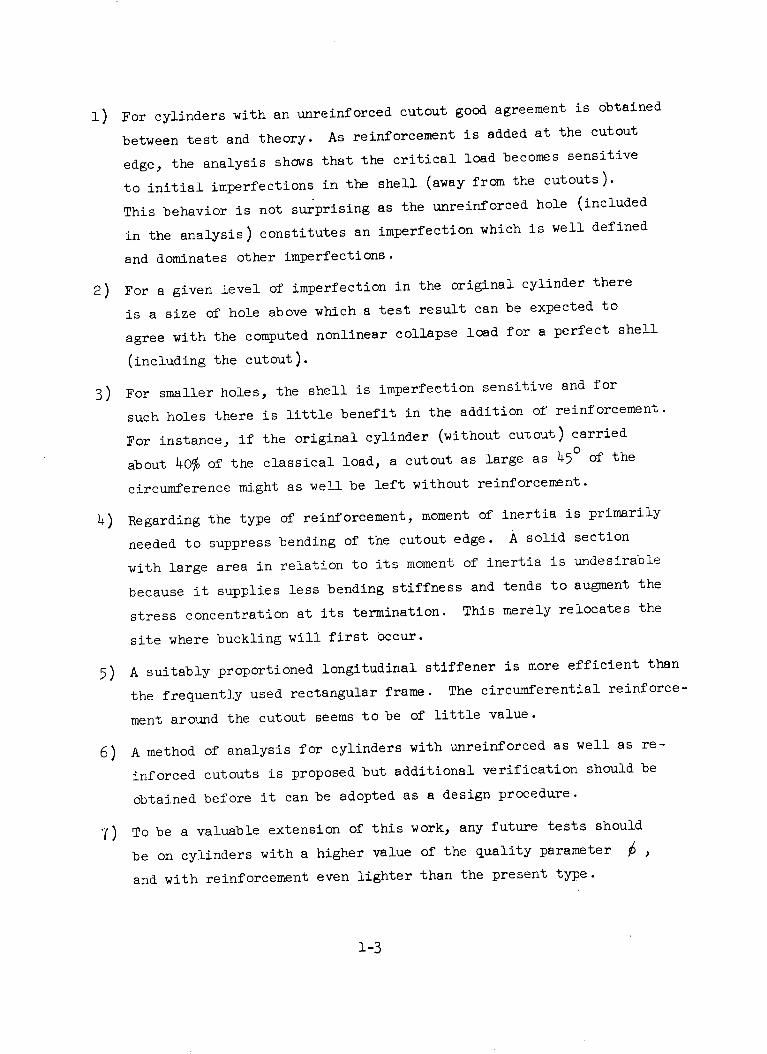
1) For cylinders with an unreinforced cutout good agreement is obtained
between test and theory. As reinforcement is added at the cutout
edge, the analysis shows that the critical load becomes sensitive
to initial imperfections in the shell (away from the cutouts).
This behavior is not surprising as the unreinforced hole (included
in the analysis) constitutes an imperfection which is well defined
and dominates other imperfections.
2) For a given level of imperfection in the original cylinder there
is a size of hole above which a test result can be expected to
agree with the computed nonlinear collapse load for a perfect shell
(including the cutout).
3) For smaller holes, the shell is imperfection sensitive and for
such holes there is little benefit in the addition of reinforcement.
For instance, if the original cylinder (without cutout) carried
about 40% of the classical load, a cutout as large as 45° of the
circumference might as well be left without reinforcement.
4) Regarding the type of reinforcement, moment of inertia is primarily
needed to suppress bending of the cutout edge. A solid section
with large area in relation to its moment of inertia is undesirable
because it supplies less bending stiffness and tends to augment the
stress concentration at its termination. This merely relocates the
site where buckling will first occur.
5) A suitably proportioned longitudinal stiffener is more efficient than
the frequently used rectangular frame. The circumferential reinforce-
ment around the cutout seems to be of little value.
6) A method of analysis for cylinders with unreinforced as well as re-
inforced cutouts is proposed but additional verification should be
obtained before it can be adopted as a design procedure.
7) To be a valuable extension of this work, any future tests should
be on cylinders with a higher value of the quality parameter ,
and with reinforcement even lighter than the present type.
1-3

Section 2
TEST SPECIMENS AND PROCEDURES
2.1 Specimen Material and Geometry
The eleven cylinders tested were machined from 6061-T6 aluminum tube
stock. This extruded tubing raw stock has an outer diameter of 12.75 inches
and an inner diameter of 11.75 inches.
All cylinders were machined to the dimensions shown in Fig. 2.1, the
thickness of the thin-walled portion being the only variable within the set
of eleven specimens.
The thickened end rings are not the same at each end because a close
fitting rigid mandrel had to be inserted from one end. The threaded holes
into the end rings serve to attach the buckle capture device, and thus do
not have to carry heavy loads. Nevertheless, thread inserts were incorporated
into the thinner end ring to supply a more rigid and positive attachment
point. The thread inserts were 'leenserts" (NAS 1394CAL).
The purpose of the end rings is to help distribute the load uniformly
and to serve as an attachment ring for the buckle capture device.
The test cylinders were measured for wall thickness variation at 24
degree stations around the circumference and at 1.75 inch intervals longi-
tudinally, starting one inch from one of the end rings. The results of
these measurements are tabulated in Tables 2.2 through 2.12. A summary of
thickness measurements is given in Table 2.1. This table lists the minimum
and maximum thickness measured, and the average thickness, based on the
seventy-five thickness measurements.
It should be emphasized that considerable care is required to obtain a
plus/minus .001-inch variation in thickness on a diameter of twelve inches
and when the thickness is only ten to fourteen thousandths. Procedures will
be discussed in the next subsection.
2-1

2.2 Specimen Manufacture
The appropriate length of raw stock was first machined internally to a
diameter of 12.115 + .0005 inches. The inner contour of the thicker end ring
was also machined in this step.
The aluminum cylinder and a thick-walled steel mandrel .008 inches larger
in diameter (at room temperature) were then placed in a furnace and slowly
brought to 200 F. At this temperature the aluminum cylinder could be placed
on the steel mandrel. Upon cooling, the cylinder was ready for external
machining, that is to say, shrunk fit onto the mandrel. Fig. 2.2 shows the
steel mandrel and one of the aluminum cylinders after machining.
The machining of the outer surface was done in three successively
"finer" passes leading to the desired thickness (.009 or .014 inches,
nominally). The variations in thickness observed in the cylinders (Tables
2.1 through 2.12) are due to minor eccentricity of the lathe, tool wear,
vibration and temperature effects. Considerable precautions were taken to
minimize these effects.
The finished cylinder is removed from the mandrel by placing the unit
in a furnace and reheating it to 2000 F, at which temperature it slides right
off.
2.3 Measurement of the Cylinders
The cylinder was measured at seventy-five locations equispaced in the
circumferential and axial directions, as explained in Section 2.1. This
was done with a sheet metal micrometer, as shown in Fig. 2.3. The micro-
meter has a six-inch deep throat and a spherical-tipped anvil. Although
the micrometer reads to .0001-inch precision (with a vernier), minor mis-
alignment of the micrometer's measuring axis makes it difficult to get
readings which repeat to better than + .0006. (The micrometer is usually
intended for use on flat sheet for which it is easier to be sure that the
micrometer is correctly aligned.) For this reason, readings were rounded
off to the nearest thousandths of an inch.
2-2

The locations of measurement points were marked on the cylinder with
the help of a template, and the values measured written at the locations.
with a soft wax pencil.
2.4 The Buckle Capture Technique
When a cylinder with a high R/t ratio buckles, a diamond pattern of
buckles is formed with quite high bending stresses in certain regions. The
purpose of the buckle capture technique is to limit the magnitude of the
bending stresses in the buckles. This is achieved by the use of a close
fitting mandrel placed inside the cylinder prior to axial loading,which.
limits the depth of the buckle amplitude. Precautions are taken to be sure
that no axial load is carried by the mandrel. This is done by attaching it
to the cylinder end ring at one end only. At the other end, lateral support
is required, and this is provided by means of linear ball bushings which
permit small cantilevered shafts attached to the cylinder loading plate
to slide axially. The bushings are pressed-fit into an intermediate bracket
which serves to electrically isolate the mandrel segment and makes it pos-
sible to adjust its radial position relative to the cylinder. This assembly
is shown in Fig. 2.3, disassembled, and partially installed in a cylinder in
Fig. 2.4.
Since contact with the mandrel would constitute lateral support for the
cylinder membrane (allowing it to sustain a greater axial stress before
buckling), an electrical sensing system is used to insure that the cylinder
and mandrel are not in contact. Any such contact closes an electrical cir-
cuit which turns on a warning light.
The mandrel is built of three separate segments which can be positioned
radially at both ends of the cylinder so that the gap between the cylinder
and mandrel can be adjusted as required. For the .014-inch wall cylinders
(which present the greatest problem since bending stresses are proportional
to the wall thickness), it was found that a gap of six to ten thousandths is
suitable. The gap is "set" using a seven-mil (.007 inches) shim, which is
removed after the mandrel fasteners are tightened. If a smaller gap is used,
the cylinder can come in contact with the mandrel before it buckles. The
2-3

onset of buckling is unmistakable since the formation of buckles produces
a sharp noise. The contact of the cylinder and mandrel due to too small
a gap is caused by the gradual growth of imperfections under increasing
load. These imperfections, which, as will be seen later, are the true
measure of a cylinder's quality (from a load carrying standpoint), are
minor deviations from the true cylindrical form - a slight "waviness" of
the cylindrical surface, too small to be detected by the naked eye.
The stress-strain curve for 6061-T6 departs from true linearity (i.e.,
elasticity) at a surprisingly low level. Although the yield point is usually
given as 35000 psi, some plastic behavior is apparent even at 20000 psi, which
is, for most structural purposes,regarded as well within the elastic range of
the material. The significance of this is that some small permanent set
occurs on the first buckle, even with the mandrel set at the "optimum" gap.
The first buckle thus introduces a new set of "low-level imperfections",
so that the buckling load achieved after the cylinder is unloaded and re-
loaded is lower than the buckling load achieved on the first loading cycle.
But thereafter, the subsequent buckling load levels remain essentially at
the same level. This is because no new level of imperfections is introduced
on subsequent buckles. Once again, it should be emphasized that the new im-
perfections (introduced by the first buckling) are not visible and must
therefore be a "waviness" of micro-inch amplitude. The very pronounced
pattern visible after buckle (with a mandrel) is only of a few mils in
amplitude (see Fig. 2..9). The eye is extremely sensitive to geometrical
imperfections when they occur on polished surfaces.
The tests with cutouts are therefore not performed on "damaged" cylinders.
The buckle capture technique merely alters the imperfection level slightly.
Since the cylinders already vary considerably in imperfection level as they
arrive" at the first loading test, the purpose of the buckle capture tests
is to establish at what point on this relative scale the cylinder is located.
Some of the cylinders had a first buckling load which was lower than the
second (or "repeatable") buckling load of other cylinders of the same or
smaller thickness. The first buckling load of Cylinder #7 with a minimum
thickness of 13 mils was 3075 lbs, whereas the second or "repeatable" buckling
load of Cylinder #5 with a minimum thickness of 12 mils was 3970 lbs.
Obviously, minimum thickness is not the only criterion of quality. It is
2-4

difficult to explain this phenomenon. We suspect that the specimens may be
susceptible to "damage", i.e., imperfection addition, in general handling.
And yet, considerable care is taken in this respect, notably in avoiding
touching the thin membrane portion after release from the fabrication mandrel
And during measurement. The latter process is the most likely culprit,, and
unfortunately it cannot be deleted.
It has also been observed that the repeatable buckling load can be
altered by repositioning the cylinder relative to the end loading plates.
The reason for this variation in buckling load is obvious: the contacting
faces of the loading plates and the cylinder also have their waviness and
imperfections. If a high spot on the cylinder coincides with a high spot
on the loading plate, the load transmitted in this region (in lbs per lineal
inch) is bound to be higher than in regions where two low spots coincide.
When a pair of high spots match up, and also coincide with a thin region of
the cylinder, the "repeatable" buckling load will drop markedly. Changing
the relative position of the end plates once more returns the buckling load
to the previous higher level, confirming the diagnosis. The variety of ranges
possible from one cylinder to another is, once again, a function of the im-
perfection level, but this time the imperfection level of the cylinder end
planes. Note that for Cylinders #7 and #10 this range was only +15 lbs,
whereas for Cylinder #5 the range was +150 lbs. In both cases the end plane
tolerances on flatness were + .0005 inches, and these were in fact checked
while the cylinder was still on the lathe. But the-smallnes's of these im-
perfections can be appreciated better when it is realized that +150 lbs
represents only +4% of the buckling load in question.
The buckling loads obtained in twenty-five successive tests on each
cylinder are listed in Tables 2.13 through 2.23. Four buckling loads are
registered with the top and bottom plate set in the "zero-degree" position.
The first of these (shown in parentheses), usually much higher than the rest,
is that of the first loading cycle and should be disregarded. Three buckling
loads are then determined with bottom plate in the zero position and the top
plate set in the 90-degree, 180-degree and 270-degree positions. Then the
top plate is held in the zero position and the bottom plate rotated to the
90, 180 and 270 positions. For each combination of positions, the buckling
2-5
process is repeated three times. The repeatable buckling load reported in
Table 3.1 is the mid-range value for these 24 tests (the first buckling load,
or 25t h test value, is disregarded in determining this mid-range).
The wide range of imperfection levels, even when thickness tolerance
is closely held and the manufacturing process carefully controlled, makes
it imperative that each thin-walled cylinder be rated by the buckle capture
technique so that a good reference load exists for the subsequent tests with
cutouts.
2.5 Installing the Cutouts and Reinforcement
Following tests with the buckle capture technique,two rectangular cut-
outs were made on the cylinder. In each case, these were centered at the
cylinder midheight and 180 degrees apart on the circumference.
The cutouts were made by drilling 0.062-inch diameter holes at each
corner of the proposed cutout, and then sawing along prescribed lines with
a high-speed dental wheel. The wheel is driven by a hand-held Dremel motor.
The cylinder is held in a felt-lined wood cradle, and the operator's hand is
braced on a bar fastened to the cradle. Some cleaning up and deburring with
a swiss file is necessary. Because of the high speed of the abrasive wheel,
almost no tool pressure is required. The width of the cut is about 0.025
inches.
The size of the cutouts on all cylinders was 45 degrees of arc by three
inches in the axial direction. One exception to this was Cylinder #1 which
had cutouts with a 30-degree arc. This cylinder constituted an exploratory
test. The arc was increased to 45 degrees on all subsequent cylinders be-
cause this makes the range between buckling with and without cutout wider,
and because for small cutouts the stress concentrations fall in the plastic
range.
Tables 3.1 and 3.2 summarize the cylinder test parameters and buckling
loads. In these tables it is seen that four cylinders were tested without
reinforcement on the cutouts.
All reinforcement of the cutouts consisted of angle sections. Fig. 2.6
2-6

shows the three basic types of reinforcement referenced in Tables 3.1 and 3.2.
These very thin angles were machined from bar stock. A "back-up" bar is
needed when machining the last outstanding leg. Thickness tolerance was + .001
inches. The figure also shows the tapered end details used in all reinforcing
application except the type "P" reinforcement of Cylinder #7, and the location
of holes used to attach the reinforcement to the cylinder (using 2-56 screws).
The purpose of the screws was to provide good clamping during the bonding of
the reinforcement to the cylinder. It is felt that the bonding is the primary
fastener and that the screws could have been removed after they had served
their clamping function during the bonding. The cement used was Hysol 0151
with a 24-hour room temperature cure.
All reinforcement was installed on the outside surface of the cylinder
with the exception that Cylinder #10, which had the same reinforcement as
Cylinder #9, but installed on the inside of the cylinder.
Figures 2.7 and 2.8 show how angle reinforcement (with the same cross
section as type "A") was arranged as the "picture frame" around the cutout
of Cylinder #7. This is called type "P" reinforcement in Table 3.1.
2.6 Method of Loading
In all tests, with or without cutouts, the cylinders were loaded by a
screw-driven "SR-4, FGT" universal testing machine of 50,000 lb capacity.
This machine has several loading ranges. The two ranges used were 2500 or
10,000 lbs full scale. The resolution of this machine is 0.2 percent of the
"full scale" being used, and the accuracy is 0.5 percent of the "full scale"
used, or the resolution figure, whichever is larger.
The load is applied to the cylinder through a two-inch thick aluminum
end plate at each end of the cylinder. These square plates have their con-
tacting surfaces machined to a flatness better than + 0.005 inches.
The more usual arrangement in a cylinder compression test is to have
one of the end plates resting directly on the platen of the machine and to
have a spherical seat bearing between the other plate and the cross head.
This method has been discarded as unsatisfactory because the spherical seat
2-7

bearing is only free to rotate while the cylinder is at very low loads.
At higher loads, the friction in the spherical seat is too great to permit
rotation.
A better solution is to place one of the end loading plates (the lower
one) on top of the cross-head, place the cylinder over this and the other
end loading plate at the top of this stack, then pull down on the upper plate
with a pull rod which passes through both loading plates, the cylinder and
the cross-head, and is connected to the platen of the test machine. The
latter is then driven downwards to load the cylinder. In addition to the
rod's flexibility, a two-axis flexure is added to this tension train, pro-
viding assurance that the upper loading plate is completely free to rotate
about any axis. With close tolerances on the rod and through-holes, con-
centricity of the loading axis with the cylinder axis is also easier to
insure.
The loading rate, which is not critical in tests such as these, was
approximately 400 lbs per minute. The loading was stopped at regular load
intervals to permit scanning of the strain gages. During these stops, no
unloading (or stress relaxation) was observed.
2.7 Strain Gages and Related Instrumentation
A total of 176 strain gages were used on the eleven cylinders tested.
Of these, 30 were part of three-element rosettes. Twelve more were part
of two-element "T-rosettes". The ten three-element rosettes and six two-
element rosettes were all placed on Cylinder #2. The remaining 134 were
1/8-inch gage length W. T. Bean BAE-13-125BB-120 gages. Eastman 910 cement
was used to bond the gages to the cylinder. In all cases (including ro-
settes), gages were arranged in back-to-back pairs so that bending stress
(or strain) could be separated from membrane stress (or strain). The data
tabulated are given in the form of membrane and bending stress (or strain)
at a "station", which means "at a back-to-back pair of gages or rosettes".
Strain gage signals were recorded by means of a digital Data Acquisition
System (DAS). The measuring element of the DAS is an integrating digital
voltmeter which reads to microvolts. The DAS also includes a channel scanner,
2-8

a printer (for test monitoring),and a tape punch. The punch tape i; "r',rl"
and processed by a Tymshare computer which substracts the zero datum,
applies the required scale factor and tabulates the data in any specified
form. In the case of rosettes, the Mohr circle of stress equations are
solved. The resolution of the system is + 5 microstrain, and the accuracy
is + 1.25 percent (or better) of the value being read (or five microstrain,
whichever is greater). Most of the inaccuracy stems from uncertainty in the
gage factor (which is quoted to + 1.0 percent accuracy), so that on a relative
basis, the accuracy is probably even better than the 0.5 percent.
A shunt calibration is performed with a high precision resistor on a
leg of the bridge whose resistance has been measured to 0.1 ohm accuracy.
Line resistance errors are corrected and the bridge power supply voltage is
held to within + 0.1 percent.
In the case of rosette data where strain rather than stress is reported,
the + 1.25 percent accuracy (of the reading) still holds except that an
additional absolute error may exist in that the elastic modulus is assumed
to be 10.3 x 10 psi and Poisson's ratio to be 0.30. On a relative basis
(i.e., comparing stresses at different load levels or at different stations
on the same cylinder) the modulus and Poisson errors can be disregarded.
Since all cylinders were cut from the same piece of tube, the variation of
properties from cylinder to cylinder is very small and comparisons of stress
from one cylinder to another therefore presents only a small error possibility.
For most cylinders, only strain measurements were reported. This is
because with single element gages only the strain is known unless the stress
at the point is uniaxial. For Cylinder #2, rosettes were used and the full
stress condition is. measured, so stresses can be given in the tables.
Stresses were reported for the single element stations on this cylinder be-
cause they were used at points for which it was known (from the geometry and
loading condition) that the stress was practically uniaxial. This last re-
mark also applies for the ten single-element stations of Cylinder #8. In
this last case it was known (from data on Cylinder #2) that although the
stress was not uniaxial, the stress transverse to the gage element was so
small that errors less than five percent would result if the stress was
assumed to be uniaxial.
2-9

Cylinders #2 and #8 were heavily strain gaged because these had unrein-
forced cutouts, and the strain gages made it possible to study the growth of
bending stresses preceding buckling.
Most of the reinforced cylinders were strain gaged at seven stations.
The general goal here was to determine how much of a strain concentration
the reinforcing was causing. Bending stresses (as roughly inferred from
the bending strain tabulations) were not very large compared to those seen
in cylinders having unreinforced cutouts. From the standpoint of comparisons
with computer analyses, strain gages and the deformations they measured were
more interesting and valuable in the unreinforced cylinders than in the re-
inforced cylinders.
Strain gage data are tabulated in Tables 3.3 through 3.13 and curves
are plotted for Cylinder #2 in Figs. 3.1 through 3.3.
The location of strain gage stations on each test cylinder is given
in Figs. 3.4 through 3.10.
2-10

TABLE 2.1
SUMMARY OF CYLINDER THICKNESS (MILS)
MinimumThickness
14
14
12
12
12
12
13
9
8
9
9
MaximumThickness
16
15
14
16
14
15
15
11
11
11
11
2-11
AverageThickness
CylinderNumber
1
2
3
4
5
6
7
8
9
O10
11
14.76
14.68
12.81
14.64
13.27
13.67
13.73
9.72
9.50
9.53
9.53
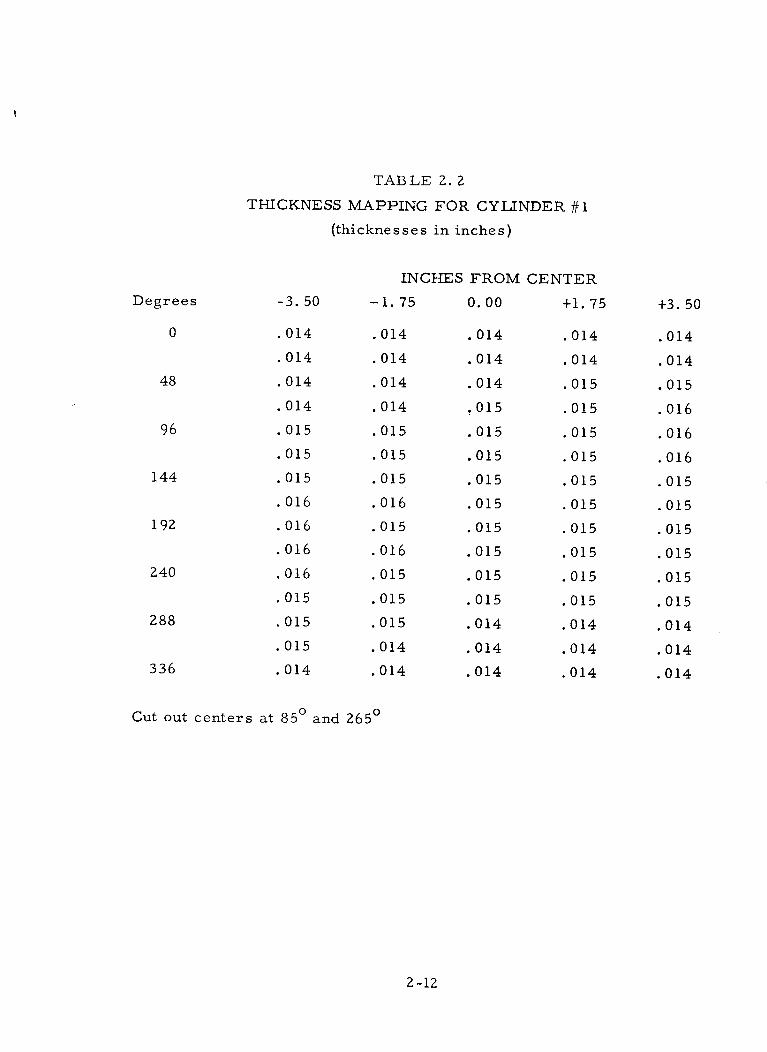
TABLE 2. 2
THICKNESS MAPPING FOR CYLINDER #1
(thicknesses in inches)
Degrees -3. 50
0
48
96
144
.014
.014
.014
.014
.015
.015
.015
.016
.016
.016
.016
.015
.015
.015
.014
192
240
288
336
INCHES FROM
-1.75 0.00
.014
.014
.014
.014
.015
.015
.015
.016
.015
.016
.015
.015
.015
.014
.014
.014
.014
.014
.015
.015
.015
.015
.015
.015
.015
.015
.015
.014
.014
.014
CENTER
+1.75
.014
.014
.015
.015
.015
.015
.015
.015
.015
.015
.015
.015
.014
.014
.014
Cut out centers at 85 ° and 2650
2 -12
+3. 50
.014
.014
.015
.016
.016
.016
.015
.015
.015
.015
.015
.015
.014
.014
.014
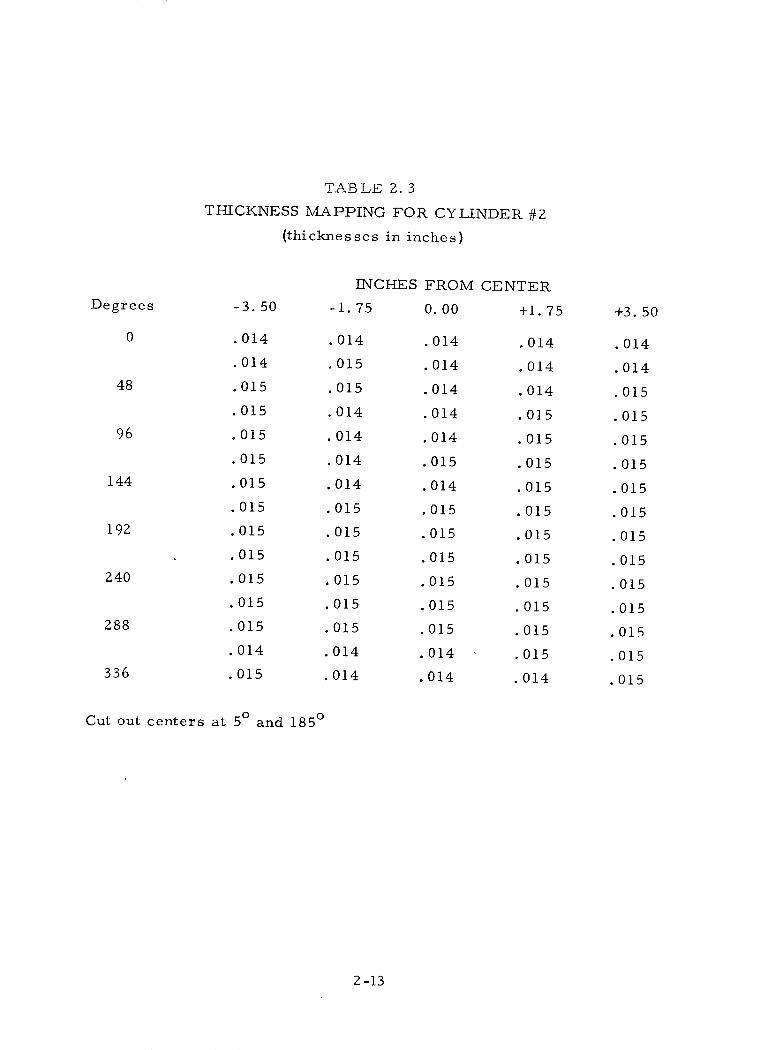
TABLE 2. 3
THICKNESS MAPPING FOR CYLINDER #2
(thicknesses in inches)
INCHES FROM CENTER
Degrees
0
48
96
144
-3. 50
.014
.014
.015
.015
.015
.015
.015
.015
.015
.015
.015
.015
.015
.014
.015
192
240
288
336
-1.75
.014
.015
.015
.014
.014
.014
.014
.015
.015
.015
.015
.015
.015
.014
.014
0. 00
.014
.014
.014
.014
.014
.015
.014
.015
.015
.015
.015
.015
.015
.014
.014
Cut out centers at 50 and 1850
2-13
+1.75
.014
.014
.014
.015
.015
.015
.015
.015
.015
.015
.015
.015
.015
.015
.014
+3. 50
.014
.014
.015
.015
.015
.015
.015
.015
.015
.015
.015
.015
.015
.015
.015

TABLE 2.4
THICKNESS MAPPING FOR CYLINDER #3
(thicknesses in inches)
-3. 50
.013
.013
.013
.013
.013
.013
.013
.013
.013
.013
.013
.013
.013
.013
.012
INCHES
-1.75
.012
.012
.012
.013
.013
.013
.013
.014
.013
.013
.013
.013
.013
.013
.012
FROM
0.00
.012
.012
.012
.012
.013
.013
.014
.014
.013
.013
.013
.013
.013
.012
.012
CENTER
+1.75
.012
.012
.012
.013
.014
.013
.013
.013
.013
.013
.013
.013
.013
.013
.013
Cut out centers at 0° and 1800
2-14
Degrees
0
48
96
144
192
240
+3. 50
.012
.012
.013
.013
.014
.014
.014
.014
.014
.013
.013
.013
.013
.013
.013
288
336

TABLE 2. 5
THICKNESS MAPPING FOR CYLINDER #4
(thicknesses in inches)
Degrees -3. 50
0
48
96
144
.015
.015
.015
.015
.016
.016
.016
.016
.016
.016
.016
.016
.016
.016
.015
192
240
288
336
INCHES FROM
-1.75 0.00
.014
.015
.015
.015
.016
.016
.015
.015
.015
.016
.015
.016
.016
.015
.015
.014
.014
.014
.014
.015
.015
.015
.015
.015
.014
.014
.014
.015
.014
.014
CENTER
+1.75
.014
.014
.014
.014
.015
.015
.015
.015
.014
.014
.014
.014
.014
.014
.014
Cut out centers at 580 and 2380
2-15
+3. 50
.012
.012
.013
.014
.014
.015
.015
.014
.014
.013
.013
.014
.014
.014
.013

TABLE 2.6
THICKNESS MAPPING FOR CYLINDER #5
(thicknesses in inches)
INCHES FROM CENTER
Degrees
0
48
96
144
-3. 50
.013
.013
.014
.013
.014
.014
.014
.014
.014
.014
.014
.014
.014
.014
.013
192
240
288
336
-1.75 0.00
.013
.012
.013
.013
.013
.013
.013
.013
.013
.014
.013
.014
.013
.013
.013
.012
.012
.012
.013
.013
.013
.013
.013
.013
.013
.013
.013
.013
.013
.013
Cut out centers at 240 and 2040
2-16
+1. 75
.012
.012
.012
.013
.014
.014
.014
.014
.014
.013
.013
.014
.013
.013
.013
+3. 50
.013
.013
.013
.013
.013
.014
.014
.014
.014
.014
.014
.014
.014
.014
.013
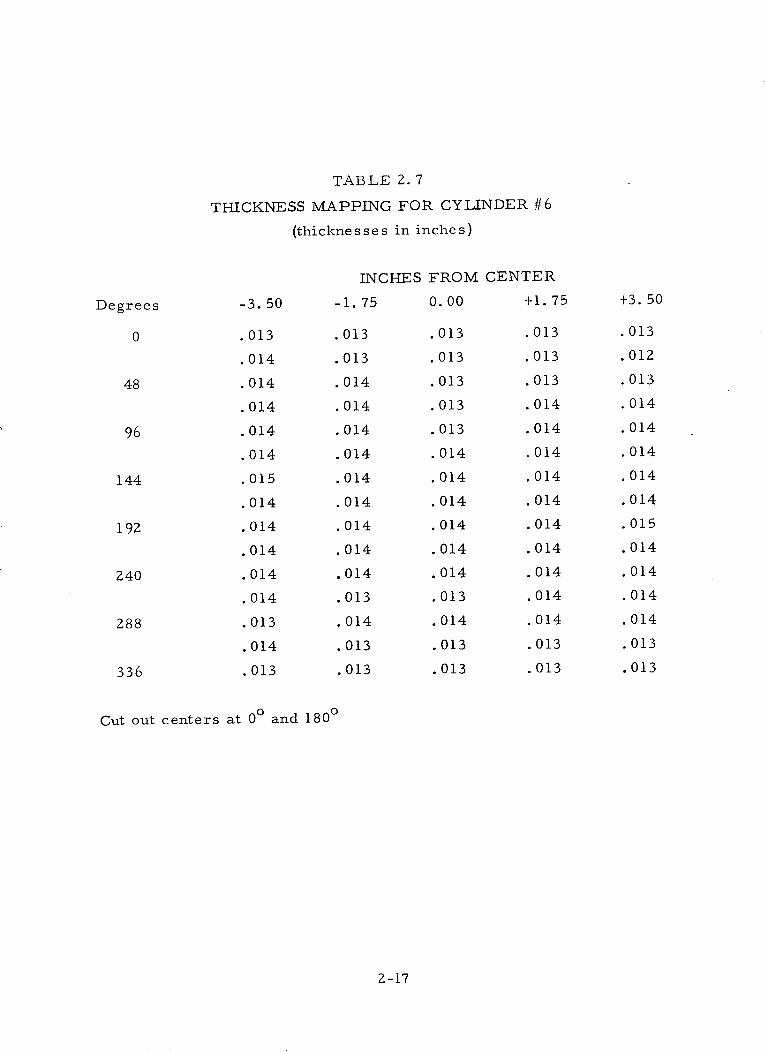
TABLE 2. 7
THICKNESS MAPPING FOR CYLINDER #6
(thicknesses in inches)
Degrees -3. 50
0
48
96
144
.013
.014
.014
.014
.014
.014
.015
.014
.014
.014
.014
.014
.013
.014
.013
192
240
288
336
INCHES FROM
-1.75 0.00
.013
.013
.014
.014
.014
.014
.014
.014
.014
.014
.014
.013
.014
.013
.013
.013
.013
.013
.013
.013
.014
.014
.014
.014
.014
.014
.013
.014
.013
.013
CENTER
+1.75
.013
.013
.013
.014
.014
.014
.014
.014
.014
.014
.014
.014
.014
.013
.013
Cut out centers at 00 and 1800
2-17
+3. 50
.013
.012
.013
.014
.014
.014
.014
.014
.015
.014
.014
.014
.014
.013
.013

TABLE 2.8
THICKNESS MAPPING FOR CYLINDER #7
(thicknesses in inches)
Degrees -3. 50 -1.
.014
.014
.014
.014
.015
.015
.015
.015
.015
.015
.014
.013
.013
.014
.014
INCHES FROM CENTER
.75 0.00 +1.
.013
.013
.013
.014
.014
.014
.015
.015
.014
.014
.014
.013
.013
.014
.013
.013
.013
.013
.014
.014
.014
.014
.015
.014
.014
.014
.013
.013
.013
.013
Cut out centers at 00 and 1800
2-18
0
48
96
144
75
192
240
.013
.013
.013
.014
.014
.014
.014
.014
.014
.014
.014
.013
.013
.013
.013
+3. 50
.013
.013
.013
.014
.014
.014
.014
.014
.014
.014
.014
.013
.013
.013
.013
288
336

TABLE 2.9
THICKNESS MAPPING FOR CYLINDER #8
(thicknesses in inches)
Degrees
0
48
96
144
-1.-3. 50
.010
.010
.010
.010
.010
.010
.010
.01 1
.011
.011
.011
.011
.01 1
.010
.010
INCHES FROM CENTER
75 0. 00 +1.
.009
. 009
.010
.010
.009
.009
.010
.010
.010
.011
.011
.010
.010
.010
.009
.009
.009
.009
.009
.009
.009
.009
.010
.010
.010
.010
.010
.010
.009
.009
Cut out centers at 360 and 2160
2-19
75
192
240
.009
.009
.009
.009
.009
.009
.009
.009
.010
.010
.011
.010
.009
.009
.009
+3. 50
. 009
. 009
. 009
. 009
.009
. 009
. 009
.009
.010
.010
.010
.010
.009
.009
.009
288
336

TABLE Z. 10
THICKNESS MAPPING FOR CYLINDER #9
(thicknesses in inches)
INCHES FROM CENTER
Degrees
0
48
96
144
-3. 50
.009
.009
.009
.009
.010
.010
.010
.010
. 010
.010
.010
.010
.010
.009
.009
192
240
288
336
-1.75
.009
.009
.009
.009
.009
.010
.010
.010
.010
.010
.010
.010
.010
.009
. 009
0. 00
.009
. 009
.009
.009
. 009
.009
.010
.010
.010
.010
.010
.010
.010
.009
. 009
Cut out centers at 360 and 2160
2-20
+1.75
.009
.009
.009
.008
.009
.009
.010
.011
.010
.010
.010
.009
.009
.009
.009
+3. 50
.009
.009
.009
.008
.009
.009
.011
.011
.011
.010
.010
.010
.009
.009
.009
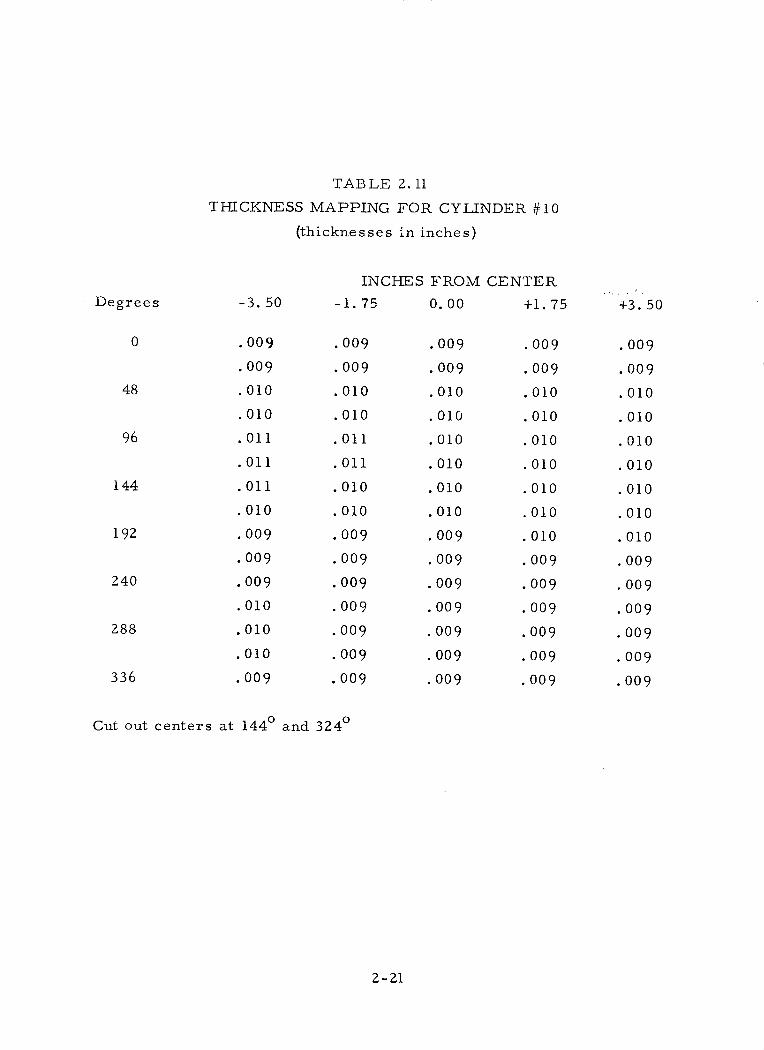
TABLE 2. 11
THICKNESS MAPPING FOR CYLINDER #10
(thicknesses in inches)
Degrees -3. 50
0
48
96
144
.009
. 009
.010
.010
. 011
. 011
.011
.010
. 009
. 009
. 009
. 010
.010
.010
. 009
192
240
288
336
INCHES FROM
-1.75 0. 00
.009
. 009
.010
.010
.011
.011
.010
.010
. 009
.009
.009
. 009
.009
. 009
.009
.009
. 009
.010
.010
.010
.010
. 010
.010
. 00 9
. 009
. 009
. 00 9
. 009
. 009
. 009
CENTER
+1. 75
. 009
. 009
.010
.010
.010
.010
.010
.010
.010
. 009
. 009
.009
.009
.009
. 009
Cut out centers at 1440 and 324 °
2-21
+3. 50
. 009
. 009
.010
.010
.010
.010
.010
.010
.010
. 009
. 009
.009
. 009
. 009
. 009

TABLE 2. 12
THICKNESS MAPPING FOR CYLINDER #11
(thicknesses in inches)
Degrees
0
48
96
144
-3. 50
.009
.009
.009
.010
.01 1
.01 1
.011
.010
.010
.010
.010
.010
.010
.010
.009
192
240
288
336
INCHES FROM
-1.75 0.00
009
.009
.009
.010
.010
.010
.010
.010
.010
.010
.009
.009
.010
.009
. 009
.009
.009
.009
. 009
.010
.010
.010
.010
.010
.010
. 009
. 009
.009
.009
.009
CENTER
+1. 75
.009
.009
.009
.009
.010
.010
.010
.010
.010
.010
. 009
.009
.009
.009
. 009
Cut out centers at 490 and 2290
2-22
+3. 50
.009
.009
.009
.009
.010
.010
.010
.010
.010
.010
.009
.009
.009
.009
.009
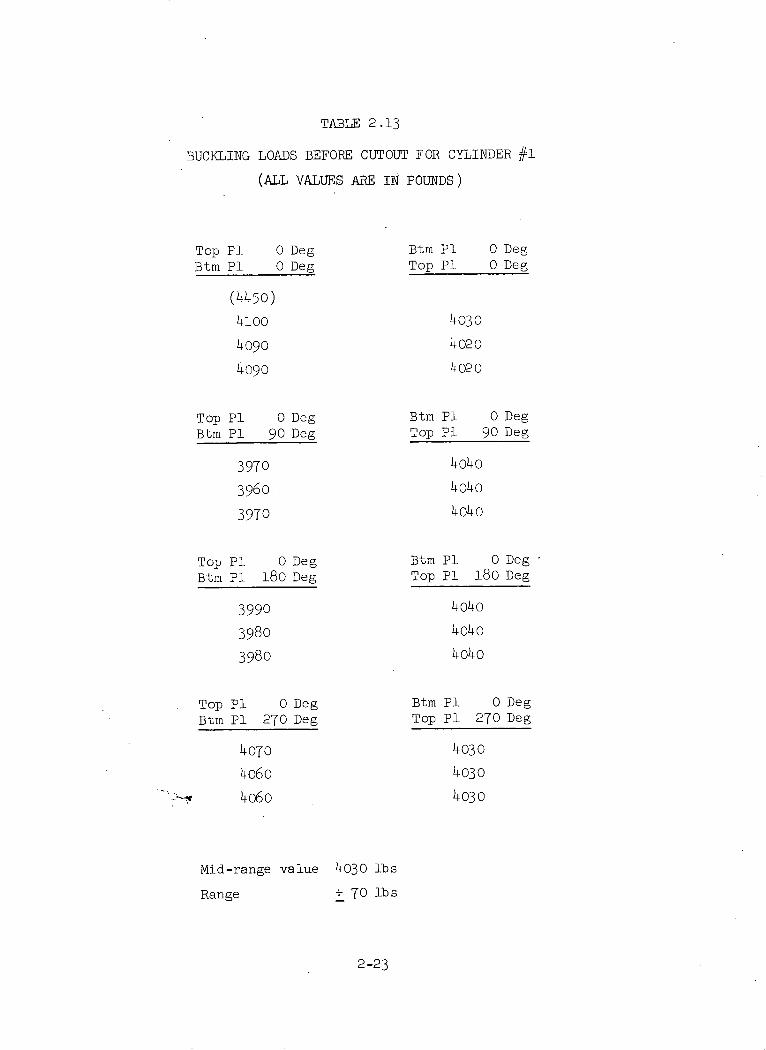
TABLE 2.13
BUCKLING LOADS BEFORE CUTOUT FOR CYLINDER #1
(ALL VALUES ARE IN POUNDS)
Top P1 0 DegBtm P1 0 Deg
(4450)
4100
4090
4090
Top P1 0 DegBtm P1 90 Deg
3970
3960
3970
Top P1 O DegBtm P1 180 Deg
3990
3980
3980
Top P1 0 DegBtm P1 270 Deg
4070
4060
4060
Mid-range value
Range
Btm P1 0 DegTop P1 0 Deg
4030
4020
4020
Btm P1 0 DegTop P1 90 Deg
4040
4040
4040
Btm P1 O Deg ·Top P1 180 Deg
4040
4040
4040
Btm P1 0 DegTop P1 270 Deg
4030
4030
4030
4030 lbs
+ 70 lbs
2-23
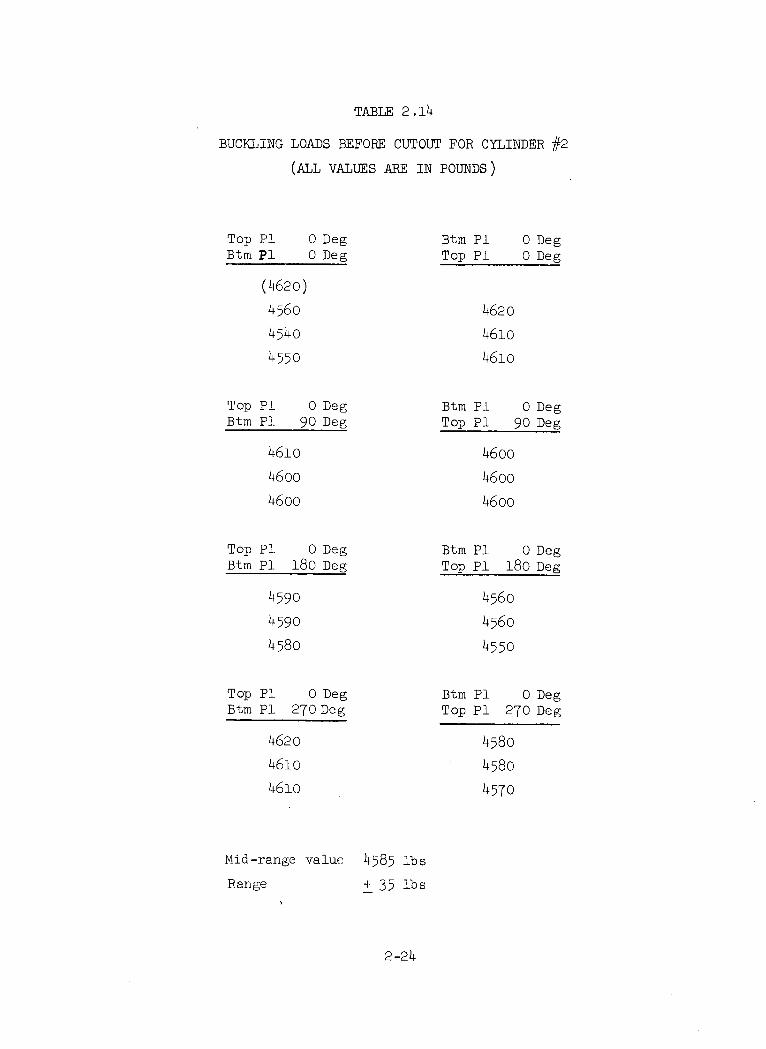
TABLE 2.14
BUCKLING LOADS BEFORE CUTOUT FOR CYLINDER #2
(ALL VALUES ARE IN POUNDS)
Top P1 0 DegBtm P1 0 Deg
(4620)
4560
4540
4550
Top P1 0 DegBtm P1 90 Deg
4610
4600
4600
Top P1 0 DegBtm P1 180 Deg
4590
4590
4580
Top P1 0 DegBtm P1 270 Deg
4620
4610
Mid-range value
Range
Btm P1 0 DegTop P1 0 Deg
4620
4610
4610
Btm P1 0 DegTop P1 90 Deg
4600
4600
4600
Btm P1 0 DegTop P1 180 Deg
4560
4560
4550
Btm P1 0 DegTop P1 270 Deg
458o
4580
4570
4585 lbs
+ 35 lbs
2-24
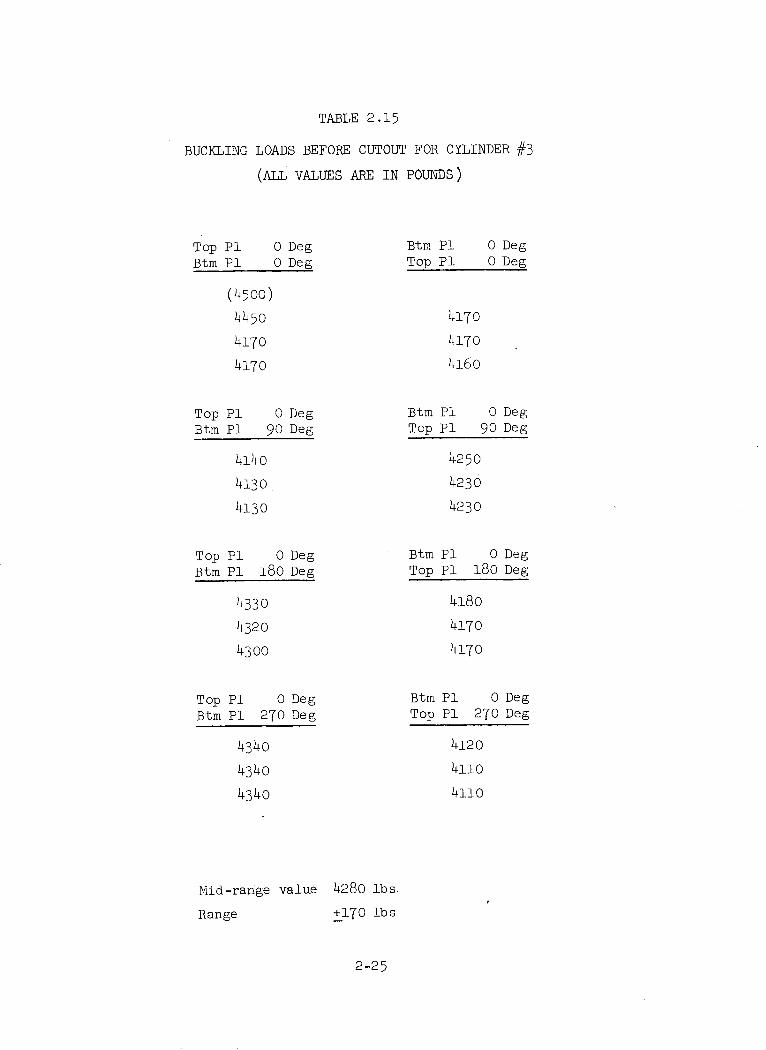
TABLE 2.15
BUCKLING LOADS BEFORE CUTOUT FOR CYLINDER #3
(ALL VALUES ARE IN POUNDS)
Top P1 0 DegBtm P1 0 Deg
(4500)
4450
4170
4170
Top P1 0 DegBtm P1 90 Deg
4140
4130
4130
Top P1 0 DegBtm Pi 180 Deg
4330
4320
4300
Top P1 0 DegBtm P1 270 Deg
4340
4340
4340
Mid-range value
Range
Btm P1 0 DegTop P1 0 Deg
4170
4170
4160
Btm P1 0 DegTop P1 90 Deg
4250
4230
4230
Btm P1 0 DegTop P1 180 Deg
4180
4170
4170
Btm P1 0 DegTop P1 270 Deg
4120
4110
4110
4280 lbs.
+170 lbs
2-25
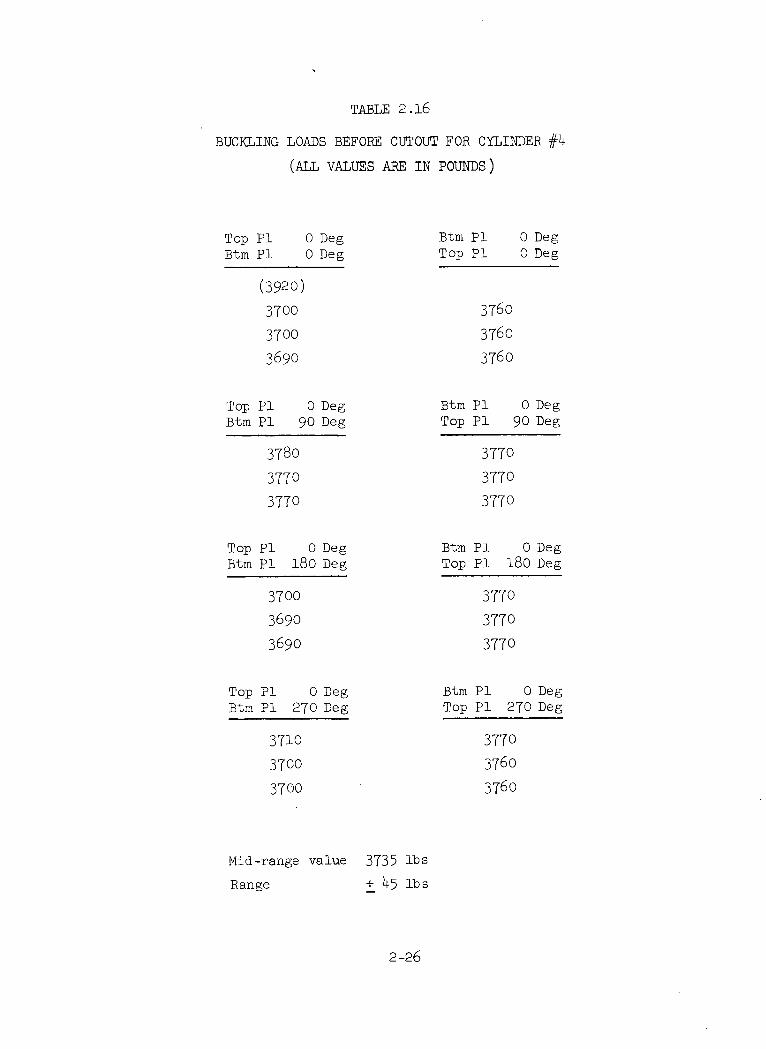
TABLE 2.16
BUCKLING LOADS BEFORE CUTOUT FOR CYLINDER #4
(ALL VALUES ARE IN POUNDS)
Top P1 0 DegBtm P1 0 Deg
(3920)
3700
3700
3690
Top P1 0 DegBtm P1 90 Deg
3780
3770
3770
Top P1 0 DegBtm P1 180 Deg
3700
3690
3690
Top P1 0 DegBtm P1 270 Deg
3710
3700
3700
Btm P1 0 DegTop P1 0 Deg
3760
3760
3760
Btm P1 0 DegTop P1 90 Deg
3770
3770
3770
Btm P1 0 DegTop P1 180 Deg
3770
3770
3770
Btm P1 0 DegTop P1 270 Deg
3770
3760
3760
Mid-range value
Range
3735 lbs
+ 45 lbs
2-26

TABLE 2.17
BUCKLING LOADS BEFORE CUTOUT FOR CYLINDER #5
(ALL VALUES ARE IN POUNDS)
Top P1Btm P1
0 Deg0 Deg
(4180)
4120
4120
4120
Top P1 0 DegBtm P1 90 Deg
3840
3840
3840
Top P1 0 DegBtm P1 180 Deg
3830
3830
3820
Top P1 0 DegBtm P1 270 Deg
Btm P1 0 DegTop P1 0 Deg
4080
4070
4060
Btm P1 0 DegTop P1 90 Deg
4080
4080
4080
Btm P1 0 DegTop P1 180 Deg
4080
4060
4060
Btm P1 0 DegTop P1 270 Deg
3900
3910
3900
Mid-range value
Range
3870
3860
3860
3970 lbs
+150 lbs
2-27

TABLE 2.18
BUCKLING LOADS BEFORE CUTOUT FOR CYLINDER #6
(ALL VALUES ARE IN POUNDS)
Top P1 0 DegBtm P1 0 Deg
(4110)
3520
3520
3530
Top P1 0 DegBtm P1 90 Deg
3460
3460
3460
Top P1 0 DegBtm P1 180 Deg
3330
3320
3310
Top Pl 0 DegBtm P1 270 Deg
3500
3500
3500
Mid-range value
Range
Btm Pl 0 DegTop P1 0 Deg
3500
3500
3500
Btm Pl 0 DegTop P1l 90 Deg
3400
3400
3400
Btm P1 0 DegTop P1 180 Deg
3350
3340
3340
Btm Pl 0 DegTop P1 270 Deg
3300
3290
3290
3360 lbs
+ 70 lbs
2-28

TABLE 2.19
BUCKLING LOADS BEFORE CUTOUT FOR CYLINDER #7
(ALL VALUES ARE IN POUNDS)
Top P1 0 DegBtm P1 0 Deg
(3075)
3056
3056
3056
Top P1 0 Deg3tm P1 90 Deg
.3070
3070
3070
Top P1 0 DegBtm P1 180 Deg
3048
3048
3048
Top P1 0 DegBtm P1 270 Deg
Btm P1 0 DegTop P1 0 Deg
3052
3050
3050
Btm P1 0 DegTop P1 90 Deg
3050
3050
3048
Btm P1 0 DegTop Pi 180 Deg
3072
3070
3070
Btm P1 0 DegTop P1 270 Deg
3040
3040
3040
Mid-range value
Range
3052
3050
3050
3360 lbs
+ 70 lbs
2-29

TABLE 2.20
BUCKLING LOADS BEFORE CUTOUT FOR CYLINDER #8
(ALL VALUES ARE IN POUNDS)
Top P1 0 DegBtm P1 0 Deg
(1340)
1300
1295
1300
Top P1 0 DegBtm P1 90 Deg
1305
1305
1310
Top P1 0 DegBtm P1 180 Deg
1285
1290
1280
Top P1 0 DegBtm P1 270 Deg
1285
1285
1280
Mid-range value
Range
Btm P1 0 DegTop P1 0 Deg
1240
1255
1250
Btm P1 0 DegTop P1 90 Deg
1255
1255
1250
Btm P1 0 DegTop P1 180 Deg
1255
1255
1255
Btm P1 0 DegTop P1 270 Deg
1240
1235
1235
1265 lbs
+ 35 lbs
2-30
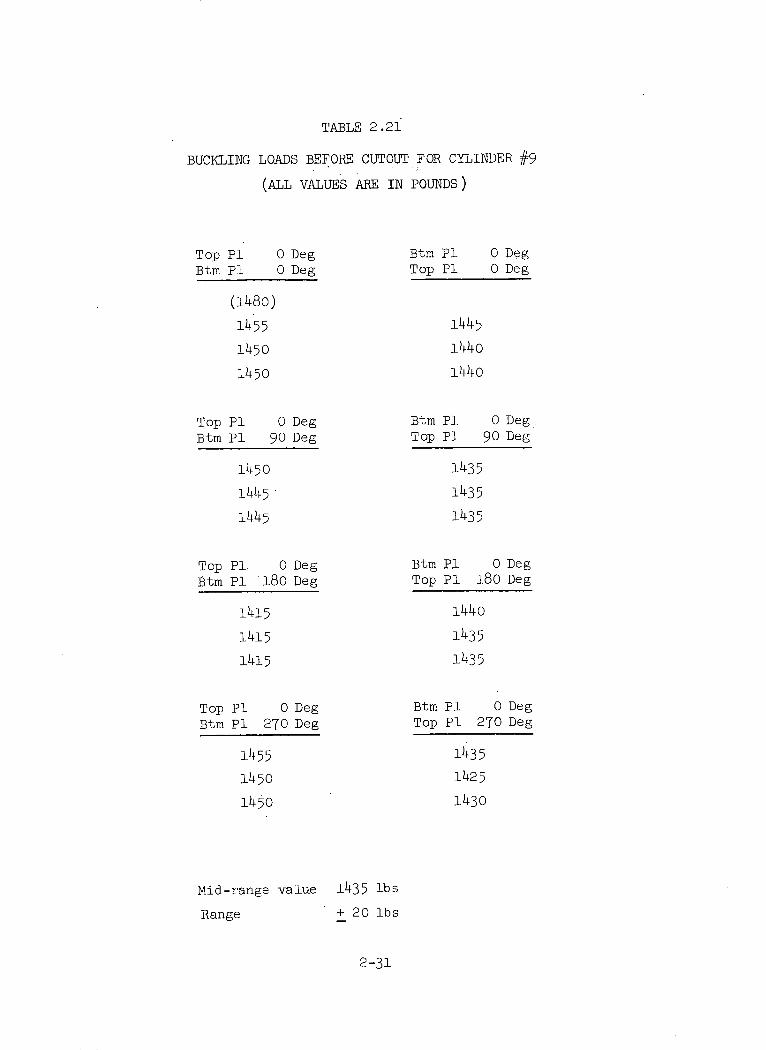
TABLE 2.21
BUCKLING LOADS BEFORE CUTOUT FOR CYLINDER #9
(ALL VALUES ARE IN POUNDS)
Top P1 0 DegBtm P1 0 Deg
(1480)
1455
1450
1450
Top P1 0 DegBtm P1 90 Deg
1450
1445
1445
Top P1 0 DegBtm P1 180 Deg
1415
1415
1415
Top P1 0 DegBtm P1 270 Deg
1455
1450
1450
Mid-range value
Range
Btm P1 0 DegTop P1 0 Deg
1445
1440
1440
Btm P1 0 DegTop P1 90 Deg
1435
1435
1435
Btm PI 0 DegTop P1 180 Deg
1440
1435
1435
Btm P1 0 DegTop P1 270 Deg
1435
1425
1430
1435 lbs
+ 20 lbs
2-31

TABLE 2.22
BUCKLING LOADS BEFORE CUTOUT FOR CYLINDER #10
(ALL VALUES ARE IN POUNDS)
Top P1 0 DegBtm P1 0 Deg
(1390)
1385
1390
1390
Top P1 0 DegBtm P1 90 Deg
1360
1360
1360
Top P1 0 DegBtm P1 180 Deg
1370
1370
1370
Top P1 0 DegBtm P1 270 Deg
1365
1360
1360
Mid-range value
Range
Btm P1 0 DegTop P1 0 Deg
1380
1380
1385
Btm P1 0 DegTop P1 90 Deg
1375
1375
1375
Btm P1 0 DegTop P1 180 Deg
1385
1385
1390
Btm P1 0 DegTop P1 270 Deg
1390
1380
1380
1375 lbs
+ 15 lbs
2-32
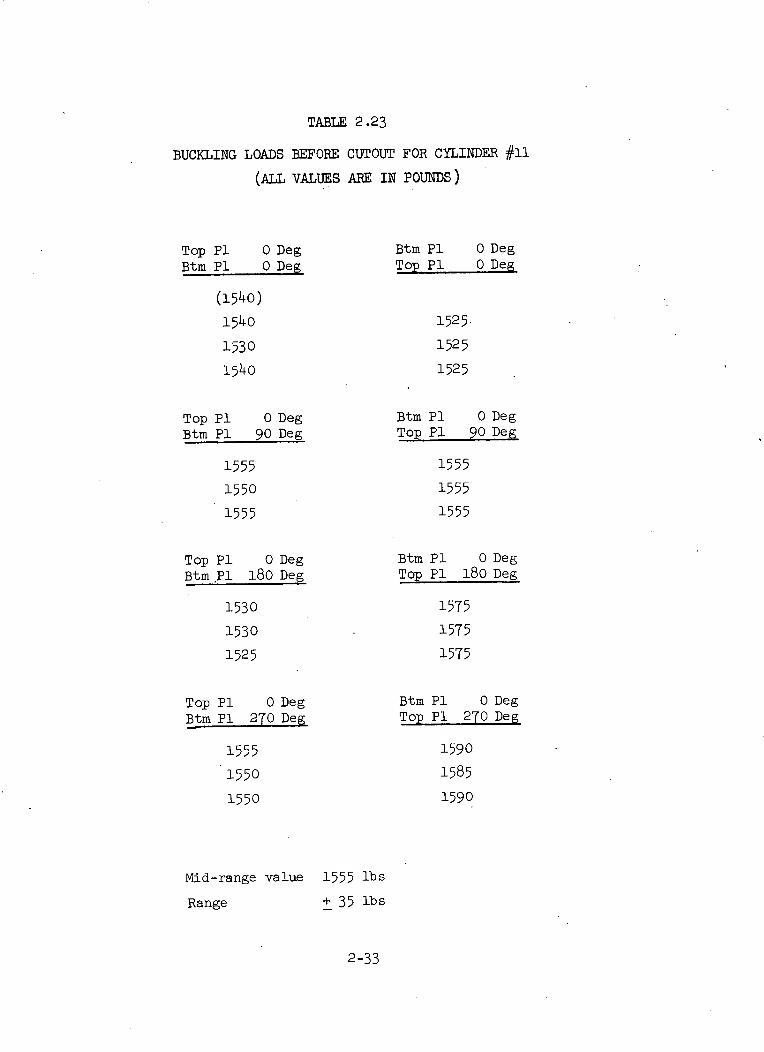
TABLE 2.23
BUCKLING LOADS BEFORE
(ALL VALUES
CUTOUT FOR CYLINDER #11
ARE IN POUNDS)
Top P1 0 DegBtm P1 0 Deg
(1540)
1540
1530
1540
Top P1 0 DegBtm P1 90 Deg
1555
1550
1555
Top P1 0 DegBtm P1 180 Deg
1530
1530
1525
Top P1 0 DegBtm P1 270 Deg
1555
1550
Btm P1 0 DegTop Pi 0 Deg
1525
1525
1525
Btm P1 0 DegTop P1 90 Deg
1555
1555
1555
Btm P1 0 DegTop P1 180 Deg
1575
1575
1575
Btm P1 0 DegTop P1 270 Deg
1590
1585
15901550
Mid-range value
Range
1555 lbs
+ 35 lbs
2-33

P3
KEENSERTNAS 1394C AL6 Places
12.115=0.001Internal Diameter 1/4 NC20
6 Places
t0.0215+ 1/2
DETAIL
t ±0.I0 +0.030
D 60.020Rr
0.030 R)0.020
DETAIL .
Fig. 2.1 Basic Dimensions of Test Cylinders

Fig. 2.2 Steel Fabrication Mandrel and Finished Cylinder
2-35
ro i
ON
Fig. 2.3 Sheet Metal Micrometer Used in Thickness Mapping

ro i
CO
- 5
Fig. 2.k "Buckle-Capture" Mandrel Segments Before Installation in Test
ro i
CO
Fig . 2.5 "Buckle-Capture" Mandrel Segments P a r t i a l l y Ins ta l l ed in Test

1 1.50
g95oLO.501O.5O
0- pD 0 0 - 0 0
0.110 0.130 150 A 0.250
- Symmetry Q089Line Drill Thru
r0.160
0.125- 0.250
t -h Q 0020
1- 0.250 t t
SECTION AA
Fig. 2.6 Geometry of Different Reinforcement Types
I
0.080
TYPE t hA . 0.020 0.150B 0.010 0.150C 0.010 0.080P 0.020 0. 150
,l 1.50 =3.00
LO',.0
.I~
A

0C C) O) O O ( ) o( c
4.66
Fig. 2.7 Geometry of Type "P" Reinforcement
2-40
C I
3.25
0.50.050 --p Typ.0
C C
0
c mob
I
3
JlJ u u u u U U U U k

cyz..-11
ro i -p-H
Fig. 2.8 Picture Frame Reinforcement on Cylinder #7
t
+IA4!
+
CY H6 e -
, _40 _A_
I Reproduced fromI best available copy.
Fig. 2.9 I Buckle With Buckle With Buckle-Capture Mandrel In Place (Cylinder #1)
2-42
Z~~

Section 3
TEST RESULTS AND EXPLANATORY COMMENTS
3.1 The Summary Tables
Tables 3.1 and 3.2 summarize all important test parameters and results
for .014 and .009-inch thick cylinders, respectively (where these thicknesses
are nominal rather than actual values).
Each summary table gives the following items:
The range of thicknesses measured on the cylinder, in mils. The first
number is the minimum thickness, followed by a slash and the maximum thickness.
The average thickness in mils, based on the seventy-five measurements.
The classical buckling load (in lbs) based on the minimum thickness and
equal to 0.6 E.t/R.
The first buckling load in lbs.
The first buckling load expressed as a percentage of the classical
buckling load.
The "repeatable" buckling load (median value)
The range of the "repeatable" buckling load.
The "repeatable" buckling load expressed as a percentage of the classical
buckling load.
The arc of the cutout, in degrees. (In every case, the height of the
cutout was 3.00 inches.)
The type of reinforcement, if any. The various types are illustrated in
Figs. 2.5 and 2.6.
The buckling load with the cutout, in lbs.
The number of strain gages used on that cylinder.
The "repeatable" buckling load expressed as a percent of classical, where
the classical is based on the nominal thickness of 0.009 or 0.014 inches.
3-1

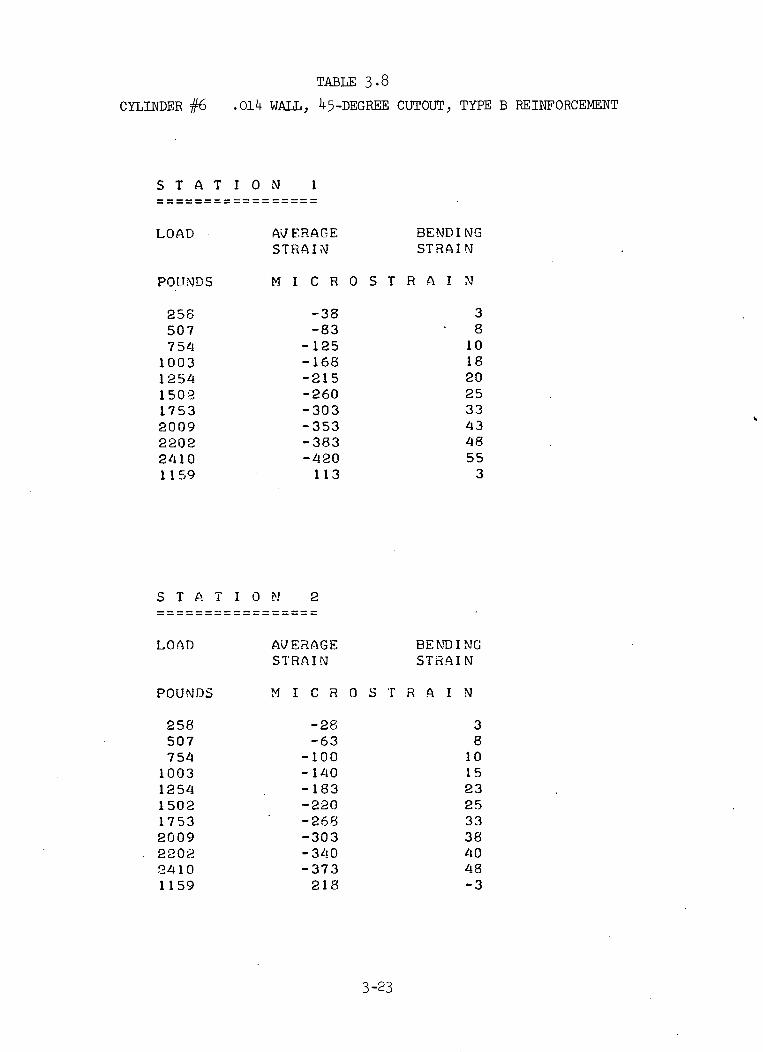
3.2 The Strain Gage Data Tables
Tables 3.3 through 3.13 are the strain gage data tabulations for the
eleven cylinders. The reader is referred to subsection 2.7 for an extensive
discussion of how this data was obtained and why some of the tables give the
strains, and others the stress. Note also that a strain gage "station" means
a set of back-to-back gages. The locations of the strain gage stations varies
on each cylinder, and these locations are shown in Figs. 3.4 through 3.10.
Compressive strains (or stresses) are negative. A positive bending
strain (or stress) means that the tension due to bending was on the outer
face of the cylinder.
The solid lines in Figs. 3.1 through 3.3 represent the stress distribu-
tion in Cylinder #2, based on a computer run using the STAGS program. The
points plotted are the actual stress measured on the cylinder by strain gages.
3.3 Photos of the Tested Cylinders
Fig. 3.11 and higher are photographs of the tested cylinders. The speci-
men numbers appearing on labels in the photographs should be disregarded,
as they refer to a temporary numbering system used during the test program.
The number appearing in the caption of the photograph is the pertinent
number and agrees with the numbering in Tables 3.1 and 3.2.
3-2

TABLE 3.1
.014-INCH THICK CYLINDERS
Cylinder Number
Thickness range (mils)
Average thickness (mils)
Classical buckling load (lbs)
First buckling load (lbs)
FBL as percent of classical
"Repeatable" buckling load(lbs)
Range of "repeatable" load(lbs)
RBL as percent of classical
Arc of cutout (degrees)
Reinforcement type
Buckling load with cutout(lbs)
Number of strain gages used
RBL as percent of nominal "t"classical buckling**
1
14/16
14.76
7389
4450
60%
4030
+70
55%
30
None
2740
6
2
14/15
14.68
7389
4620
63%
3
12/14
12.81
5430
4500
83%
4
12/16
14.64
5430
3920
72%
5
12/14
13.27
5430
4180
77%
6
12/15
13.67
5430
4110
75%
4585 4280 3735 3970 3360 3055
+35
62%
45
None
254o
48
55% 62%
+170
79%
45
None
2050
16
58%
+45
69%
45
A
3190
6
50%
+150
73%
45
A
2850
14
+70
62%
45
B
2560
14
For cylinders in this table with a nominalclassical load is 7389 lbs.
thickness of .014 inches, the
3-3
7
13/15
13.73
6370
3075
48%
+15
41%
45
P
2600
16
41%54% 46%

TABLE 3.2
.009-INCH THICK CYLINDERS
Cylinder Number 8 9 10 11
Thickness range (mils) 9/11 8/11 9/11 9/11
Average thickness (mils 9-72 9.50 9.53 9.53
Classical buckling load (lbs) 3054 2413 3054 3054
First buckling load (lbs) 1340 1480 1390 1590
FBL as percent of classical 44% 61% 46% 52%
"Repeatable" buckling load (lbs) 1265 1435 1375 1555
Range of "repeatable" load (lbs) +35 +20 +15 +35
RBL as percent of classical 41% 47% 45% 51%
Arc of cutout (degrees) 45 45 45 45
Reinforcement type None B B C
Buckling load with cutout (lbs) 807 1275 1030 1055
Number of strain gages used 20 14 14 14
RBL as percent of nominal "t"classical buckling** 45%
Reinforcement on inside of cylinder
See Table 3.1
3-4
TABIX 3.3
CYLINDER #1 .014 WALL, 30-DEGREE CUTOUT, NO REINFORCEMENT
s r AT I ON 1
LOAD
POUNDS
200394595796
119013851590179719972187239726271217
S T A T I 0
LOAD
POUNDS
200394595796
119013851590179719972187239726271217
AVERAGESTRAIN
BENDINGSTRAIN
M I C R 0 S T R A I N
-29-65-93-96-69-50-27
23263
102146
-752
M 2
AAVERAGESTRAIN
- 41-30-60
-107-212-266-318-367-415-459-505-549
63
BE ND I NGSTRAI N
M I C R 0 S T R A I N
-58 16-118 48-181 139-219 318-235 819-234 11I11-227 1402-216 1687-206 1970-195 2247-183 2538- 170 2844
49 -3043
3-5

CYLINDER #1
STAT I ON
LOAD
POUMDS
200394595796
1190138515901797199721872397
e26271217
TABLE 3.3 - Concluded
.014 WALL, 30-DEGREE CUTOUT, NO REINFORCEMENT
3
AVERAGESTRAIN
BENDINGSTRA I N
! I C R 0 S T R A I N
-42 -2-84 -4
-130 -8-183 -15-295 -32-352 -37.-409 -38-462-513-561-609-65g
39
-37-32-23
-918
-3032
3-6
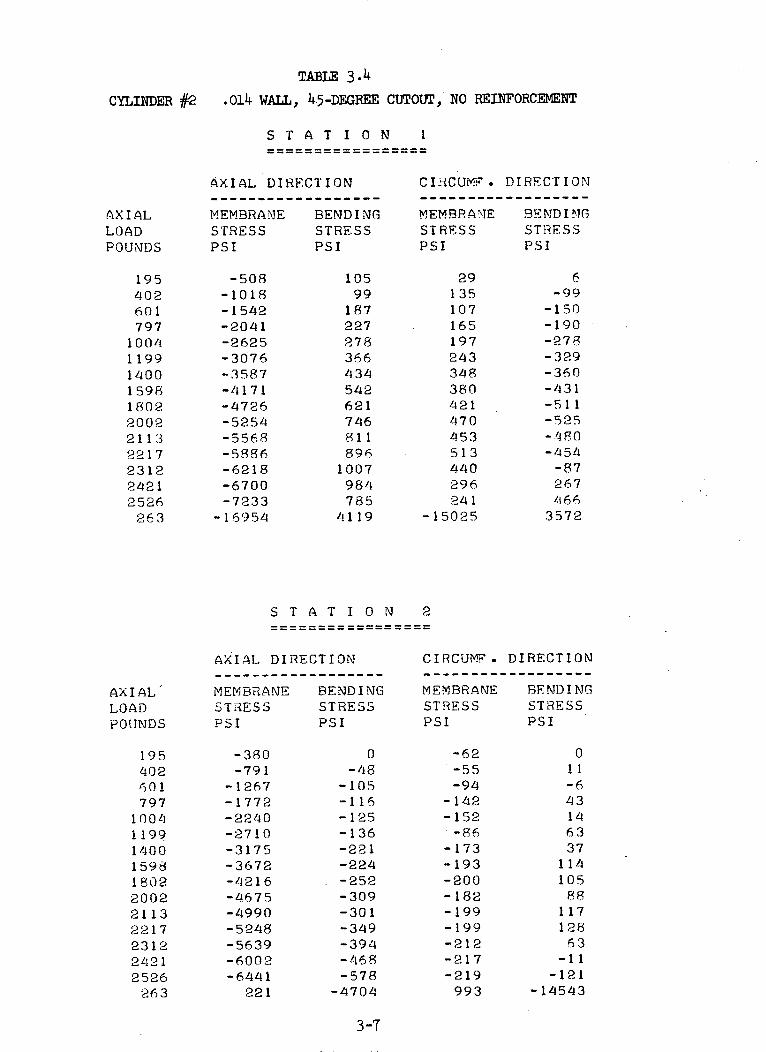
CYLINDER #2
TABLE 3.4
.014 WALL, 45-DEGREE CUTOUT, NO REINFORCEMENT
STATION 1
AXIAL DIRECTION
MEMBRANESTRESSPSI
-508-1018-1542-2041-2625-3076-3587-4171-4726-5254-5568-5886-6218-6700-7233
-16954
BENDINGSTRESSPSI
10599
1872272783664345426217468118961007984785
4119
CIRCUMTF. DIRECTION
MEMBRANESTRESSPSI
29135107165197243348380421470453513440296241
-15025
ST AT ION
AXIAL DIRECTION
MEMBRANESTRESSPSI
-380-791
-1267-1772-2240-2710-3175-3672-4216-4675-4990-5248-5639-6002-6441
221
BENDINGSTRESSPSI
0-48
-105-116-125-136-221-224
. -252-309-301-349-394- 168-578
-4704
CIRCUMF. DIRECTION
MEMBRANESTRESSPSI
-62-55-94
-142-152-86
-173-193-200-182-199-199-212-217-219
993
3-7
AXIALLOADPOUNDS
195402601797
10041199140015981802200221132217231224212526
263
BENDINGSTRESSPSI
6-99
-150-190-278-329-360-431-511-525-480-4524
-872674L66
3572
2
AXIAL'LOADPOUNDS
195402601797
10041199140015981802200221132'217231224212526
263
BENDINGSTRESSPSI
011-643146337
114105
88117128
63-11
-152143-14543

CYLINDER #2
TABLE 3.4 - Continued
.014 WALL, 45-DEGREE CUTOUT, NO REINFORCEMENT
STATION 3
AXIAL DIRECTION
MEMBIRANE BENDINGSTRESS STRESSPSI PSI
-306-499-6 80-8/15
-1004-1120-1 56-1386- 1i54-1551-1551-1627-1 -i 54- 130 '-11111
1885
74153198210295315371411439513496533496476476
-337
CIRCUMF. DIRECTION
MEMBRANE BENDINGSTRESS STRESSPSI PSI
125755
1091053
1152556797982
1'2781
175
74-65911361733-6
761956193939
-17
STATION 4
AXIAL DIRECTION
MEMBRANE BENDINGSTRESS STRESS?SI PSI
- 1/z12-919
-1398-1877-2401-2929-3a33-3981-4565-5129-5438-5761-61099-6396-6694-7122
193323473703865
106312621 49717351953208722172379248426282353
CIRCULJ4 . DIRiEC.CTION
MEMBR aE BENDINGSTiFSS STRESSPSI PSI
74357311183
13 -85
15318519i3828624132136 1401-351
-4645
1151071291 ,. ,U147
3 A 3343363
al 16506529534500'4144
3-8
AXIALLOATD
195403601797
100411991 oi r01598
1On2.1132217231224212.526
AXI AL
195402' 0 1
797100 l11991 ?- 001 59;1 202, 0 1) 2,
2.1723122421
263Dh;3

CYLINDER #2
TABLE 3.4 - Continued
.014 WALL, 45-DEGREE CUTOUT, NO REINFORCEMENT
STATION 5
AXIAL, DIRECTION
MENB1iANE BENDINGSTRESS STRESSPSI PSI
-315-734-1194-1667-2152-25741-3042-3499-3986-4443-4664-4922-5151-5390!-56593847
179349485675819
1009118813611559173218171962205521802296
77
CIRCUFr . DIRECT'IOi;
MEMBRANE BENDINGSTRESS STRESSPSI PSI
-17-39-21
- 136-203- 149-160-218-209-268-231-230-221- 2/ 1-192
90
7913067986495174148207181207173226212169
-261
STATION 6
AXIAL DIRECTION
MEMBRANE BENDINGSTRESSPSI
-1100-1991-2830-3z432-3904-/4244-4480-4664-4821
-48147-41768-3773-2908-21484140
STRESSPSI
CIRCUiTi . DIRECTION
MEMBRANF BENDINGSTRESSPSI
996242104 40268389563
12209148031 744920069224532360624418207501779015772
-19021
STRESSPSI
0000000000000000
000000O000O00000
3-9
AXIALLOADPOUNDS
195/102601797
10!0 119914001598180220022113221723122421
263
AXIAL.LOADPOUNJPDS
195402601797
1004119.9140015981802200221132217231224212526
263

CYLINDER #2
TABLE 3.4 - Continued
.014 WALL, 45-DEGREE CUTOUT, NO REIFORCEMENT
S r A T I 0 N 7
AXIAL DIRECTION CIRCTJMU.z. DI RECTION
BEMDINGSTRESSPSI
65515982908450662888070979911633134L93152221613916847150911370312864
-15537
MEMBRANESTRESSPSI
BENDINGST'RESSPSI
000000000000000n
00000I000o0o0o000
S T A T I 0 M
AXIAl. DIRECTION CIRCTJiS . TDIRECTION
v!EMBRRANESTRESSPSI
-550-917
-1205-1 493-1729-2017-2279-2568-2777-2987-3039-3065-2489-2P79-2306-2044
BENDINGSTRESSPSI
MEMBRANESTR F S SPSI
393917
162425413563/-!6375738691781749484
1016610821103491013910323
-12943
000
000000000
00
n
3-10
.Oa')DPiO.U!DS
195:;02601797
11991 4001598],8022002
'2 172312
25262,63
S T iF.E SSPSI
-707-1179- 1 546-1782-1939-2096-2306-2;163-259/2-2699-2725-2699-2358-2227-2279- 1965
RE ND I 9rSTRESSPSI
AXIAL
Orj OUDS
195
701797
100411991400159818022 O) 02211322172312
2526263
00
000000000
00
001
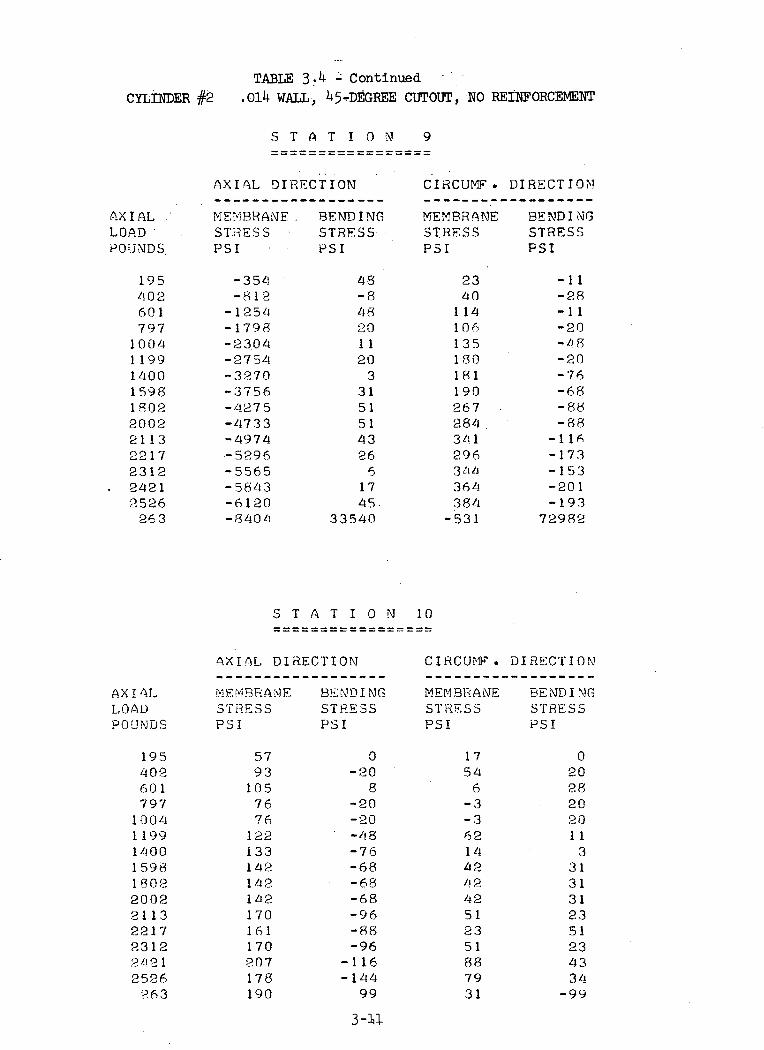
CYLINDER #
TABLE 3.4 - Continued
.014 WALL, 45-DEGREE CUTOUT, NO REINFORCEMENT
S T A T I0N 9
AXIAL DIRECTION
MEMBRANE. BENDINGST.RESS STRESSPSI PSI
-354-812-1254-1798-2304-27542-3270-3756-/-1275-4733-4974.- 5296-5565-5843-6120-840 Z
48-841 820112033151514326
61745
33540
CIRCUMF. DIRECTIOM____________--____
MEMBRANE BENDINGSTRESS STRESSPSI PSI
23401141 0613518018119026728/34129634/436438/
-531
-11-28-11-20-48-20-76-68-88-88
-116-173-153-201-19372982
S T A T I 0 N 10
AXIAL DIRECTION
MEMBRANE BENDI NGSTRESS STRESSPSI PSI
5793
1057676
122,133142142la2170161170207178190
0-20
8-20-20-/48-76-68-68-68-96-88-96
-116-144
99
3 --
CIRCUM1F. DIRECTION
MEMBRANE BENDI NGSTRESS STRESSPSI PSI
1754
6-3-36214424242512351887931
020282020113
3131312351234334
-99
AXI.4ALLOADPOUNDS
195402601797
100/411991400159818022002211 32217231224212526
26 3
AXIALLOADPOUNDS
195402601797
1 00411991400159818022002211322172.31224212526
263

CYLINDER #2
TABLE 3.4 - Concluded
014 WALL;. 45-DEGREE CUTOUT, NO REINFORCEMENT
S T A T I 0 N 11
AXIAL DIRECTION
MEMBRANE BENDINGSTRESS STRESSPSI PSI
-314-829
-1353-1 48I/-2335-2805-3272-3787-4246-4733-5030-5279-5593- 5'879-6205-9152
65178340416597739900
107012231421152616391743182019532618
CIRCUMF. DIRECTION
MEMBRANESTRESSPSI
-17-16-44-64-55
11
172666957870
10169
3-12
AXIALLOADPOUNDS
1954026 01797
10041199140015981802200221132217231224212526
263
BENDINGSTRESSPSI
4579
10299
1011441662172p11271276310316313327655

CYLINDER #3
TABLE 3 .5
.o014 WALL, 45-DEGREE CUTOUT, NO REINFORCEMENT
. S T A 'r I 0 \ 1
POt..nDS
19839:i601791
119213921590
1787
19 590
20932072
970
4AJER4GEST RAI I
M I C R 0 S T R A I N
-78-178-333-430-480-508-525-535-533-533- 530-518-90
-1054 0
s r I r-T I i M 2==== === === ===
LO)AD 4VERR4GESTr-AIN
M I C R 0 S r R 4 I N
-50-9aR
-158-203- 53-30;-363- LI 1 3-435
-513-670-645-108
0338
131818a3p25
33t13
-60-40
-4 1 A3
3-13
BENDI .ISTR/I N
1005
I '?S 1374
209322! 323.5:2533
990-2 '/10
_R bi9 I N',, h,;'ra I :T
PO L UNI)DS
193396601791995
119213921 90
1 787
1 9R/20932072970

CYLINDER #3
TABLE 3.5 - Continued
.014 WALL, 45-DEGREE CUTOUT, NO REINFORCEMENT
S T A T I ON 3============
AV ERAGESTRAI N
8E NDINGS' rRAI N
M I-C R 0 S T R A I
-48-100-153-200-255-308-360-413-440-470-498-528-623-608- 145 -3
N
-30
-3-5-5-3-5-8-5-5-8-8
-23-23035
S T A T .I 0 N 4…== = = = = =
AVERAGESTRAIN
BENDINGSTRAIN
M I C R 0 S T R A I N
-40 0-85 0
-135 0-180 0-230 0-280 -5-330 -5 --383 -8-408 -8-438 -8-463 -8-490 -10-535 -10-525 -10
-1365 550
3-14
LOAD
POUNDS
198396601791995
119213921 590168617871886198420932072
970
LOAD
POUNDS
198396601791995
119213921 59016861787.88619R420932072
970
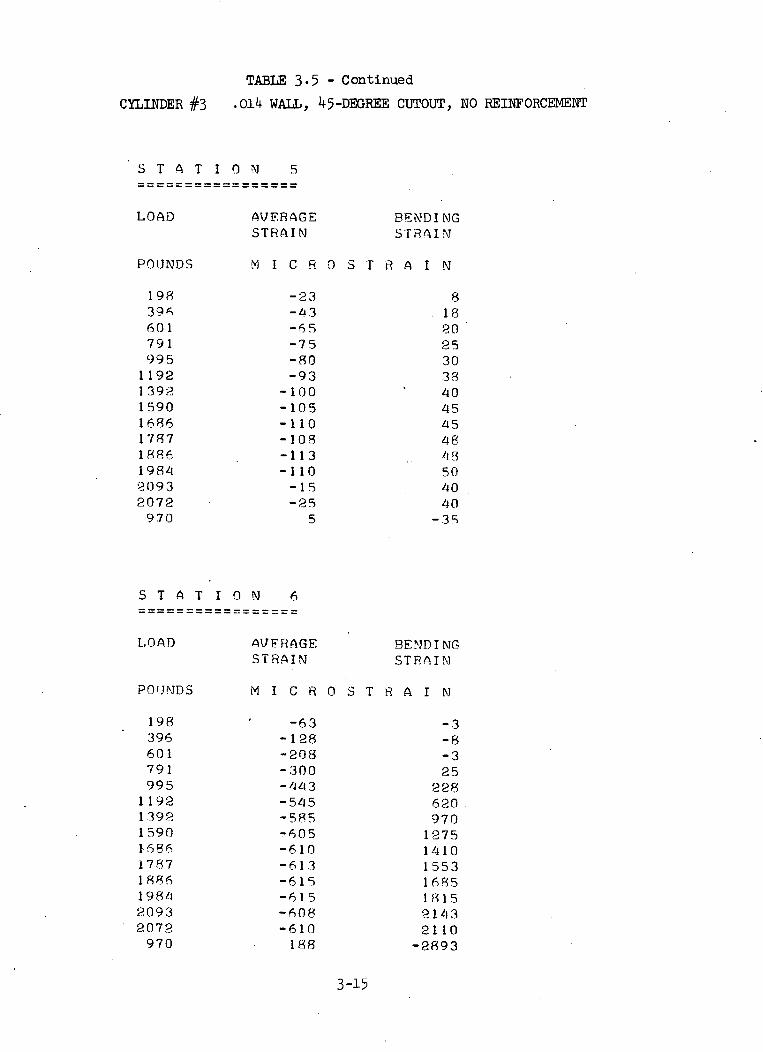
TABLE 3.5 - Continued
CYLINDER #3 .014 WALL, 45-DEGREE CUTOUT, NO REINFORCEMENT
S T A T ION 5
LOAD
POUNDS
19839,601791995
119213921590168617871886198420932072
970
AVERAGESTRAIN
BEND INGSTRAI N
M I C R 0 S T R A I N
-23-43-65-75-80-93
-100-105-110-108-113-110
-15-25
5
8182025303840454548
504040
-35
STAT ION
L.OAD
POUNDS
198396601791995
11921 3921 5901 58617871886198420932072
970
6
AVFRAGESTRAIN
BEND I NGSTRAI N
M I C R O S T R A I N
-63- 128-208-300-443-545-585-605-610-613-615-615-608-610
188
-3-8-325
228520970
1275141015531 6R5181521i432110
-2893
3-15
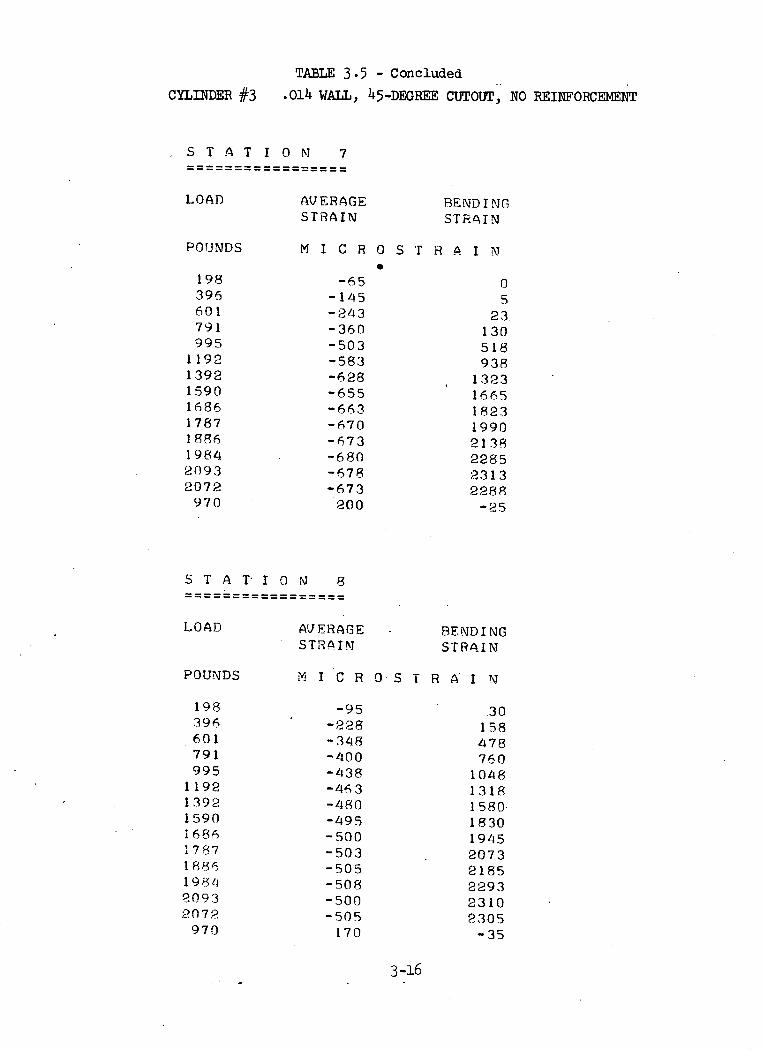
TABLE 3.5 - Concluded
CYLINDER #3 .014 WALL, 45-DEGREE CUTOUT, NO REINFORCEMENT
. STATION 7
LOAD
POUNDS
198395601791995
119213921590168617871886198420932072
970
S T A T- I 0
LOAD
POUNDS
198396601791995
119213921590168617871886198420932072
970
AVERAGESTRAIN
M I C R
BEND I NGSTRAIN
0S
-65-145-243-360-503-583-628-655-663-670-673-680-678-673
200
N 8
AVERAGESTRAIN
S r R .9 I N
05
23.130518938
13231665182319902138228523132288-25
BENDINGSTRAIN
M I C R 0 S T R A' I N
-95-228-348-400-4L38-463-480-495-500-503-505-508-500-505
170
30158478760
104813181580-1830194520732185229323102305-35
3-16

TABLE 3.6
CYLINDER #4 .014 WALL, 45-DEGREE CUTOUT, TYPE A REINFORCEMENT
STATION 1.= …===
AVERAGESTRAIN
MI CR
-28-68
-113-158-200-240-288-328-365-405-445-488-525-568-600-640
STATION 2
LOAD AVERAGESTRAIN
POUNDS M I C R
200 -28400 -75580 -113800 -1601000 -2051180 -2451410 -2901610 -3351800 -3682000 -4102180 -4482390 -4802590 -5202790 -5553000 -5853190 -613
BENDINGSTRAIN
OS TRAIN
-3-3-3-300+3+3
+10+10
+15+18+25+33+45+55
BENDINGSTRAIN
OS TRAIN
-80
+3+5+10
+15+20
+30+33+40+48+55+65+75+85
+103
3-17
LOAD
POUNDS
200400580800
100011801410161o18002000218023902590279030003190

CYLINDER #4
TABLE 3.6 - Concluded
.014 WALL, 45-DEGREE CUTOUT, TYPE A RMEINFORCEMENT
STATION= = = = = =
AVERAGE BENDINGSTRAIN STRAIN
MICROS TRAIN
-40 +5-78 +13
-128 +3
-173 +3-220 0-263 -3-310 -10-358 -13-395 -10-440 -15-485 -15-530 -20-578 -23-633 -33-670 -30-710 -40o
3-18
LOAD
POUNDS
200400580800
1000118014101610180020002180
23902590279030003190

CYLINDER #5
TABLE 3.7
.014 WALL, 45-DEGREE CUTOUT, TYPE A REINFORCEMENT
S T A T I O
LOAD
POUNDS
212415602822
10101189141316111807201921102205230324 1625222607269828081039
1
AVERAGESTRAIN
BENDINGSTRAIN
M I C R 0 S T R A I N
8132333435880
110143198233273323383470583743928
-118
-48-103-163-218-278-328-385-440-488-538-5653-588-603-618-625-623-578-483
-18
STATION 2
AJ ERAGESTRAIN
BEND I NGSTRAIN
N I C R 0 S T R A I N
-33 -8-73 -3
-118 -13-165 -15-210 -20-255 -25-303 -33-353 -38-403 -48-450 -55-475 -55-498 -58-523 -63-5418 -63-570 -65-595 -65-615 -60-645 -60-668 -48
3-19
LOAD
POUNDS
212415602822
101011891413161118072019211022052303241625222607269828081039

CYLINDER #5
TABLE 3.7 - Continued
.014 WALL, 45-DEGREE CUTOUT, TYPE A REINFORCEMENT
STAT I ON
LOAD
POUNDS
212415602822
101011891413161118072019211022052303241625222607269828081039
3
AJ ERAGESTRA I N
BENDINGSTRAI N
M I C R 0 S T R A I N
-53 -3-95 5
-153 8-203 13-255 15-305 20-358 28-403 33-453 43-493 58-523 63-543 68-568 78-588 88-605 100-623 108-633 113-608 93-203 473
STATION 4......... =====...
LOAD
POUNDS
212/415602822
101011891413161118072019211022052303241625222607269828081039
AVERAGESTRAIN
BE ND I NGSTRAIN
M I C R 0 S T R A I N
-58-108- 158-213-263-313-363-410-460-503-528-550-575-595-620- 6 13-663-695-48
-3-8-8-8
-13-13-13-10
-538
152530/456388
1601138
3-20

CYLINDER #5
TABLE 3.7 - Continued
.014 WALL, 45-DEGREE CUTOUT, TYPE A REINFORCEMENT
STAT I ON
LOAD
POUNDS
212415602822
101011891413161118072019211022052303241625222607269828081039
5
AVERAGESTRA I N
BENDINGSTRAIN
M I C R 0 S T R A I
-50-93
-148-195-243-288-330-373-413-453-475-493-510-525-540-550-545-488
-1023
N
58
132023283543536875788595
100110120138
1658
S r AT I O N 6
AVERAGESTRAIN
BENDINGSTRAIN
M I C R 0 S T R A I N
-45 0-85 0
-133 3-180 5-225 5-270 5-315 10-355 15-398 13-435 20-458 23-478 28-498 28-513 33-533 33-550 40-565 45-585 55620 615
3-21
LOAD
POUNDS
212415602822
101011891413161118072019211022052303 '241625222607269828081039

CYLINDER #5
TABLE 3.7 - Concluded
.014 WALL, 45-DEGREE CUTOUT, TYPE A REINFORCEMENT
ST AT ION
LOAD
POUNDS
212415602822
101011891413161118072019211022052303241625222607269828081039
7
AVERAGESTRAIN
BENDINGSTRAIN
M I C R O S T R A I N
-55 0-100 0-150 0-198 3-253 3-298 3-348 3-390 0-435 0-483 3-508 3-533 3-560 0-580 0-605 0-630 0-655 -5-690 -5293 723
3-22
CYLINDER #6
TABLE 3.8
.014 WALL, 45-DEGREE CUTOUT, TYPE B REINFORCEMENT
S T A T I O N
LOAD
POUNDS
256507754
10031254150217532009220224101159
S T A T I 0 N
1
AV ERAGESTRAIN
BENDINGSTRAI N
M I C R O S T R A I
-38-83
-125-168-215-260-303-353-383-420
113
2
AVERAGESTRAIN
BENDINGSTRAIN
M I C R 0 S T R . I N
-28 3-63 8
-100 10-140 15-183 23-220 25-268 33-303 38-340 40-373 48
218 -3
3-23
38
1018202533434855
3
LOAD
POUNDS
258507754
10031254150217532009220224101159
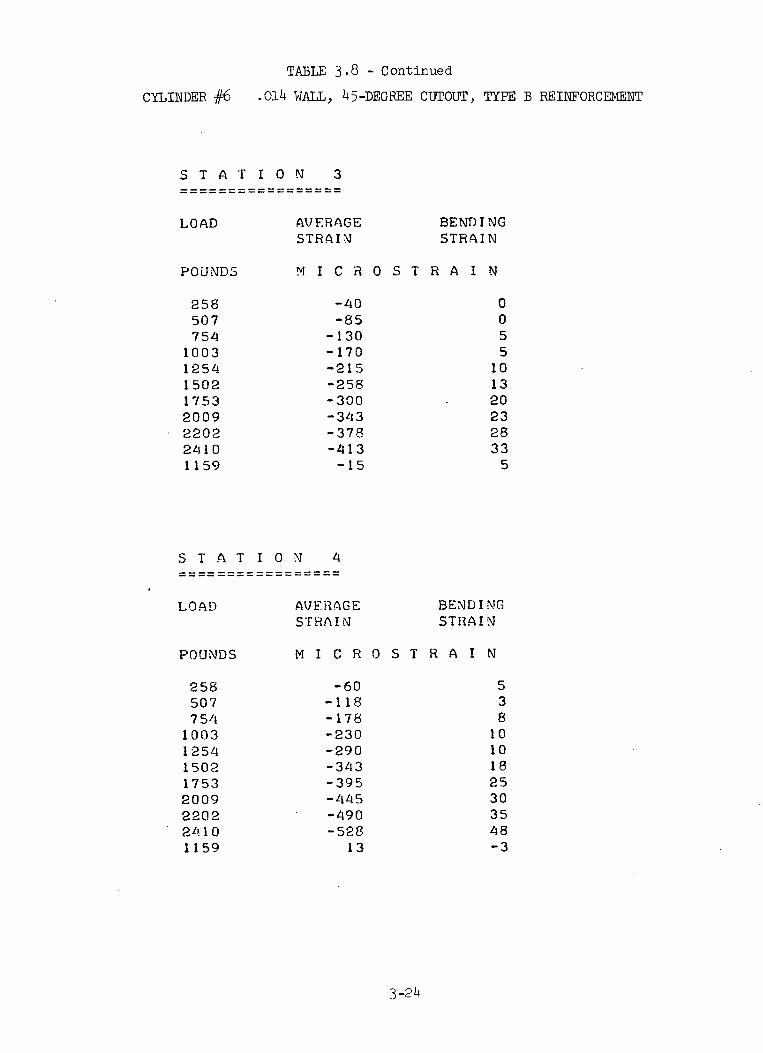
CYLINDER #6
TABLE 3.8 - Continued
.014 WALL, 45-DEGREE CUTOUT, TYPE B REINFORCEMENT
S T A T I ON
LOAD AsS'
POUNDS M
2585077541003125415021753200922022L1101159
STAT IO N
LOAD
POUNDS
258507754
100312541502175320092202241101159
VERAGETRAIN
BENDINGSTRAIN
I C R O S T R A I N
-40-85-130-170-215-258-300-343-378-413-15
4
AVERAGESTRAIN
BENDINGSTRAIN
M I C R O S T R A I
-60-118-178-230-290-343-395-445-490-528
13
3-24
3
0055
101320232833
5
N
538
10101825303548-3
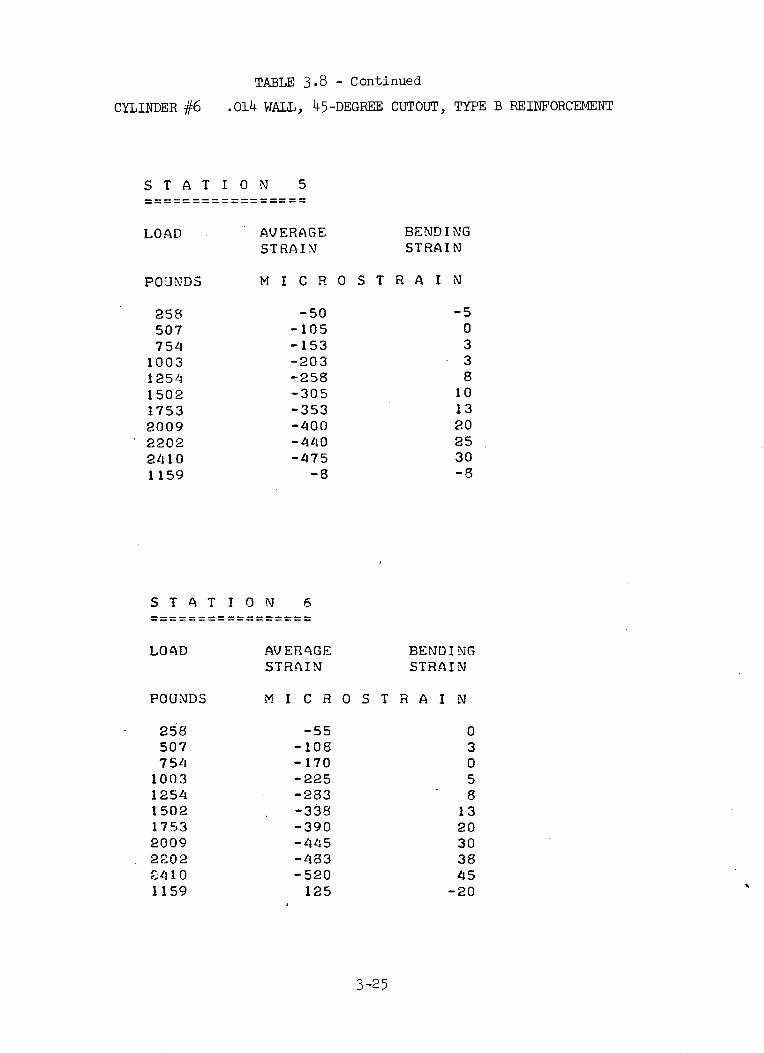
CYLINDER #6
STATION
LOAD
POUJNDS
258507754
100312541502175320092202241101159
TABLE 3.8 - Continued
.014 WALL, 45-DEGREE CUTOUT, TYPE B REINFORCEMENT
5
AVERAGESTRAIN
BENDINGSTRAIN
M I C R O S T R A I
-50-105-153-203-258-305-353-400-440-475
-8
N
-50338
1013202530-8
STATION 6
AVERAGESTRAIN
BENDINGSTRAIN
M I C R O S T R A I N
-55 0-108 3-170 0-225 5-283 8-338 13-390 20-445 30-483 38-520 45
125 -20
3-25
LOAD
POUNDS
258507754
100312541502175320092 0224101159
CYLINDER #6
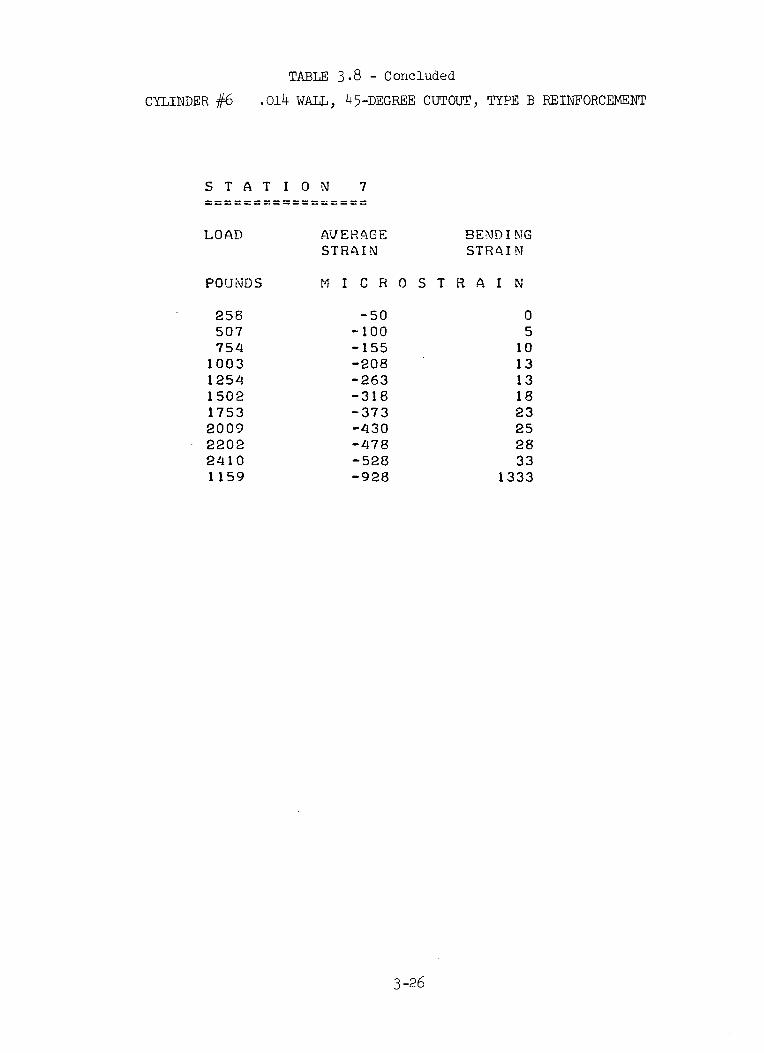
TABLE 3.8 - Concluded
.014 WALL, 45-DEGREE CUTOUT, TYPE B REINFORCEMENT
STAT I 0 N
LOAD
POUNDS
25850775410031254150217532009220224101159
7
AVERAGESTRAIN
BENDINGSTRAIN
M I C R 0 S T R A I N
-50-100-155-208-263-318-373-430-478-528-928
05
1013131823252833
1333
3-26

CYLINDER #7
STAT I ON
LOAD
POUNDS
203407617808918
100511081209131014115151316111716181119122025211922122325242426161225
TABLE 3.9
.014 WALL, 45-DEGREE CUTOUT, TYPE P REINFORCEMENT
1
AVERAGESTRAIN
M I C R 0 S T R A
-15-28-4zO-58-60-68-78-83-88-93
-103-108-113-118-120-128-130-138-145-1/48-155-260
BENDINGSTRAIN
I N
-10-23-35-48-55-63-68-78-83-88-98
-103-113-123-135-143-155-163-175-183-205
695
3-27

CYLINDER #7
TABLE 3.9 - Continued
.014 WALL, 45-DEGREE CUTOUT, TYPE P REINFORCEMENT
S T A T I O N
LOAD
POUNDS
203407617808918
10051108120913101415151316111716181119122025211922122325242426161225
2
AVERAGESTRAIN
BENDINGSTRAIN
M I C R 0 S T R A I N
-65-135-205-270-300-328-360-393-423-455-480-510-53 K-565-593-623-6 48-670-700-723-770-555
-15-30-50-65-75-83-95
-108-118-130- 145-155-173-190-208-223-248!-265-290-313-3701545
3-28
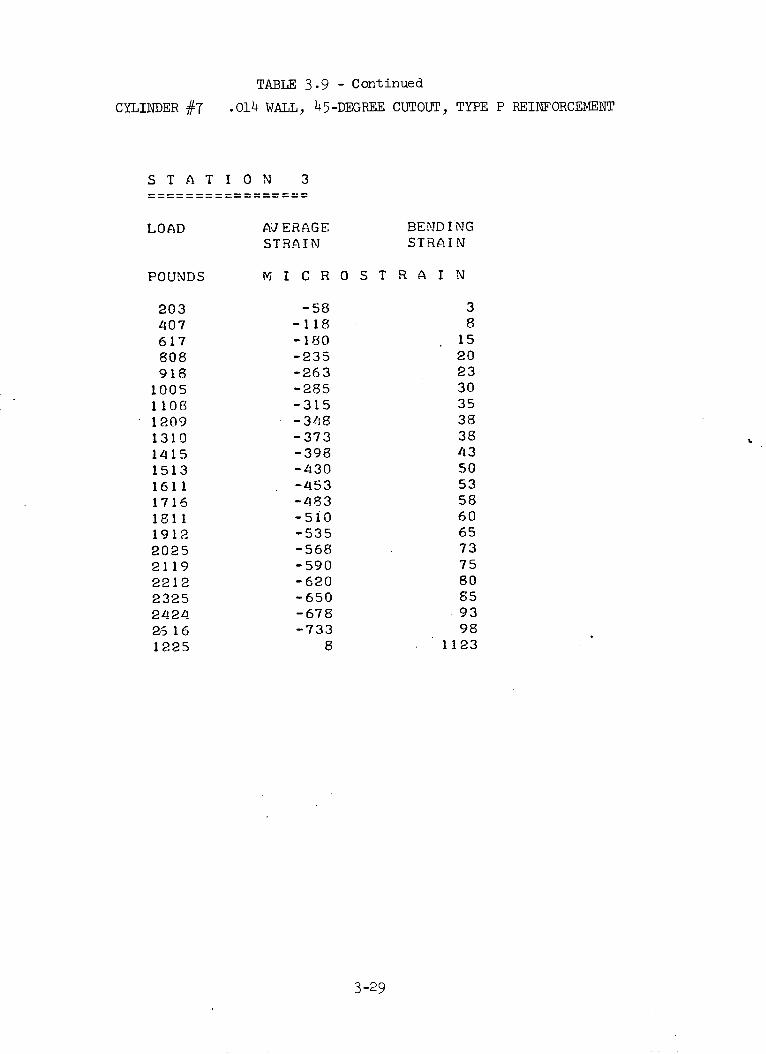
CYLINDER #7
TABLE 3.9 - Continued
.014 WALL, 45-DEGREE CUTOUT, TYPE P REINFORCEMENT
STATION 3
AU ERAGE BENDINGSTRAIN STRAIN
M I C R O S T R A I N
-58 3-118 - 8-180 15-235 20-263 23-285 30-315 35-3, I8 38-373 38-398 43-430 50-453 53-483 58-510 60-535 65-568 73-590 75-620 80-650 85-678 93-733 98
8 1123
3-29
LOAD
POUNDS
2034076178089181005110812091310141515131611171618111912202521192212232524242,5 161225
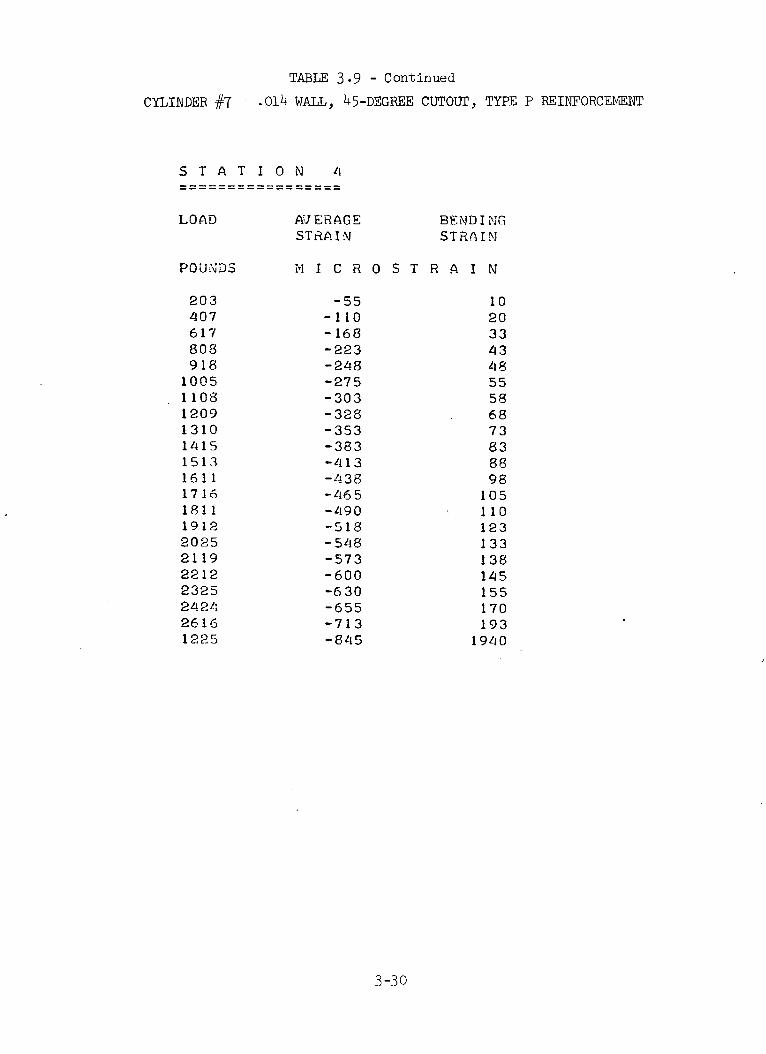
TABLE 3.9 - Continued
CYLINDER #7 .014 WALL, 45-DEGREE CUTOUT, TYPE P REINFORCEMENT
STATION 4
AJ ERAGEST IAIN
BENDINGSTRAIN
i I C R 0 S T R A I N
-55 10-110 20-168 33-223 43-248 48-275 55-303 58-328 68-353 73-383 83-413 88-438 98-465 105-490 110-518 123-548 133-573 138-600 145-630 155-655 170-713 193-845 1940
3-30
LOAD
POUNDS
203407617808918
10051108120913101415151316111716181119122025211922122325242426161225

CYLINDER #7
TABLE 3.9 - Continued
.014 WALL, 45-DEGREE CUTOUT, TYPE P REINFORCEMENT
S T A T I O N
LOAD
POUNDS
20340761780891810051108120913101415151316111716181119122025211922122325242426161225
5
AVERAGESTRAIN
BE ND I NGSTRAIN
M I C R O S T RA I N
-60-118-178-235-265-290-323-350-378-405-435-463-490-515-545-570-598-623-655-680-730-285
-5-8-13-15-15-15-18-15-18-20-20-23-20-25-20-20-18-18-15-15-10
-855
3-31
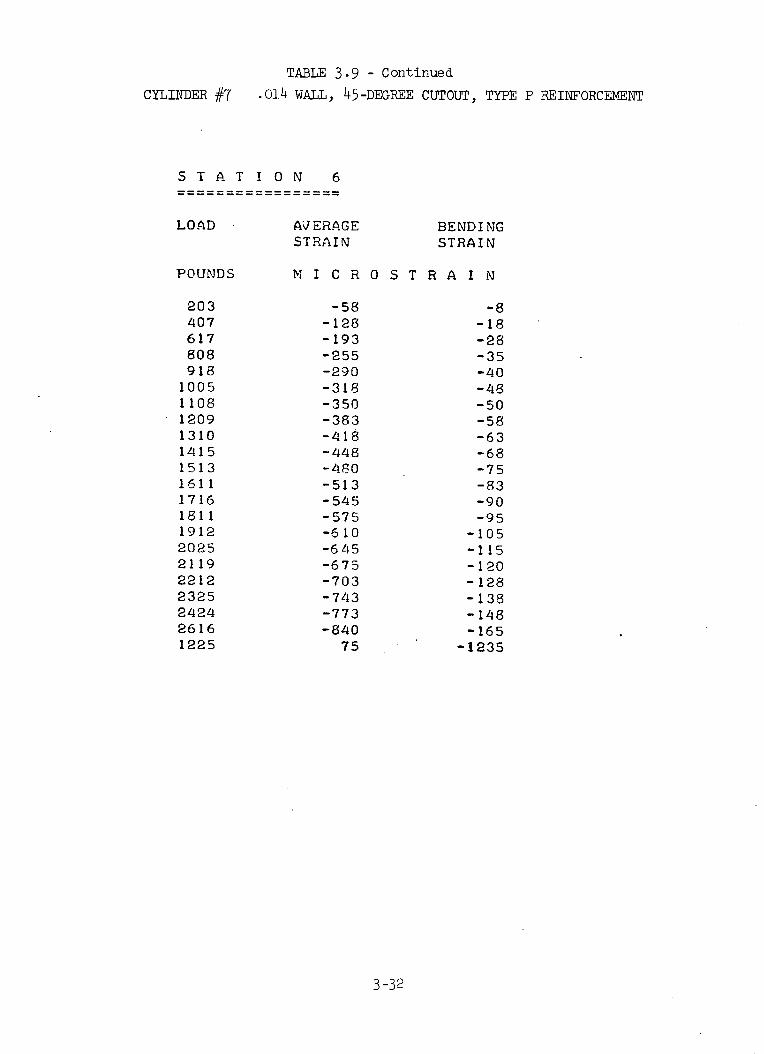
CYLINDER #7
TABLE 3.9 - Continued
.014 WALL, 45-DEGREE CUTOUT, TYPE P REINFORCEMENT
STATION
LOAD
POUNDS
20340761780891810051108120913101415151316111716181119122025211922122325242426161225
6
AVERAGESTRAIN
BENDINGSTRAIN
M I C R 0 S T R A I N
-58-128-193-255-290-318-350-383-418-448-z180-513-545-575-610-645-675-703-743-773-840
75
-8-18-28-35-40-48-50-58-63-68-75-83-90-95
-105-115-120-128-138-148-165
-1235
3-32

CYLINDER #7
TABLE 3.9 - Continued
.014 WALL, 45-DEGREE CUTOUT, TYPE P REINFORCEMENT
STATION 7
AVERAGESTRAI N
BENDINGSTRAIN
M I C R O S T R A I
-70-133-193-248-280-308-340-368-395-420-455-480-505-535-55 0-588-615-645-675-700-753-360
3-33
LOAD
POUNDS
20310761780891810051108120913101415151316111716181119122025211922122325242426161225
N
088131518202325303035404550535560657088
395

CYLINDER #7
TABLE 3.9 - Concluded
.014 WALL, 45-DEGREE CUTOUT, TYPE P REINFORCEMENT
STATION
LOAD
POUNDS
203407617808918100511081209131014151513161117161811191220252119221223252412426161225
8
AVERAGESTRAI N
BENDINGSTRAIN
M I C R 0 S T R A I N
-43 3-93 8-140 15-188 18-213 23-233 28-258 28-285 30-305 35-330 40-358 43-383 48-408 53-433 58-458 63-485 70-510 75-535 80-568 88-593 98-645 115-265 1215
3-34

TABLE 3.10
CYLINDER #8 .009 WALL, 45-DEGREE CUTOUT, NO REINFORCEMENT
STATION 1
LOAD AVERAGE BENDINGSTRESS STRESS
POUNDS PSI PSI
58 -472 367102 -734 681157 -1022 1127203 -1336 1703258 -1598 2489308 -1834 3354356 -1965 4218405 -2096 5135455 -2201 6131507 -2279 7205553 -2332 8096603 -2332 9144652 -2358 10218
709 -2332 12759755 -2227 14489
STATION 2
LOAD AVERAGE BENDINGSTRESS STRESS
POUNDS PSI PSI
58 -210 262102 -393 498157 -550 812203 -655 1231258 -760 1755308 -812 2332256 -812 2961405 -838 3563455 -838 4244507 -865 4952553 -891 5554603 -838 6288652 -865 6995709 -838 8856755 -707 10192
3-35

CYLINDER #8
S TAT ION
LOAD
POUNDS
58102
157203258308356405455507553603652709755
STATION
LOAD
POUNDS
58102
157203258308356405455507553603652709755
TABLE 3.10 - Continued
.009 WALL, 45-DEGREE CUTOUT, NO REINFORCEMENT
3
AVERAGESTRESSPSI
-183-288-419-524-629
-707-786-838-943
-1048-1127-1179-1231-1362-1310
BENDINGSTRESSPSI
183288472681943
1231157219392306272530653485395651886131
4
AVERAGESTRESSPSI
-183-341-524-681-838
-1022
-1153-1310-1493-1651-1808-1965-2096-2384-2410
BENDINGSTRESSPSI
79131210262419
550681786969
117913361546178224373039
3-36

CYLINDER #8
S TAT ION
LOAD
POUNDS
58102
157203258308356405455507553603652709755
STATION
LOAD
POUNDS
58102157203258308356405455507553603652709755
TABLE 3.10 - Continued
.009 WALL, 45-DEGREE CUTOUT, NO REINFORCEMENT
5
AVERAGESTRESSPSI
-576-917
-1284-1546-1886-2122-2306-2489-2672-2856-2987-3118-3196-2803-2856
BENDINGSTRESSPSI
7341389222731184140516161317100817493531032311554133101721317161
6
AVERAGESTRESSPSI
-210-288-419-472-524-576-629
-707-760-838-865-838-786-891
-1022
BENDINGSTRESSPSI
524969
157221482882356342444952568564987205812293801357213650
3-37
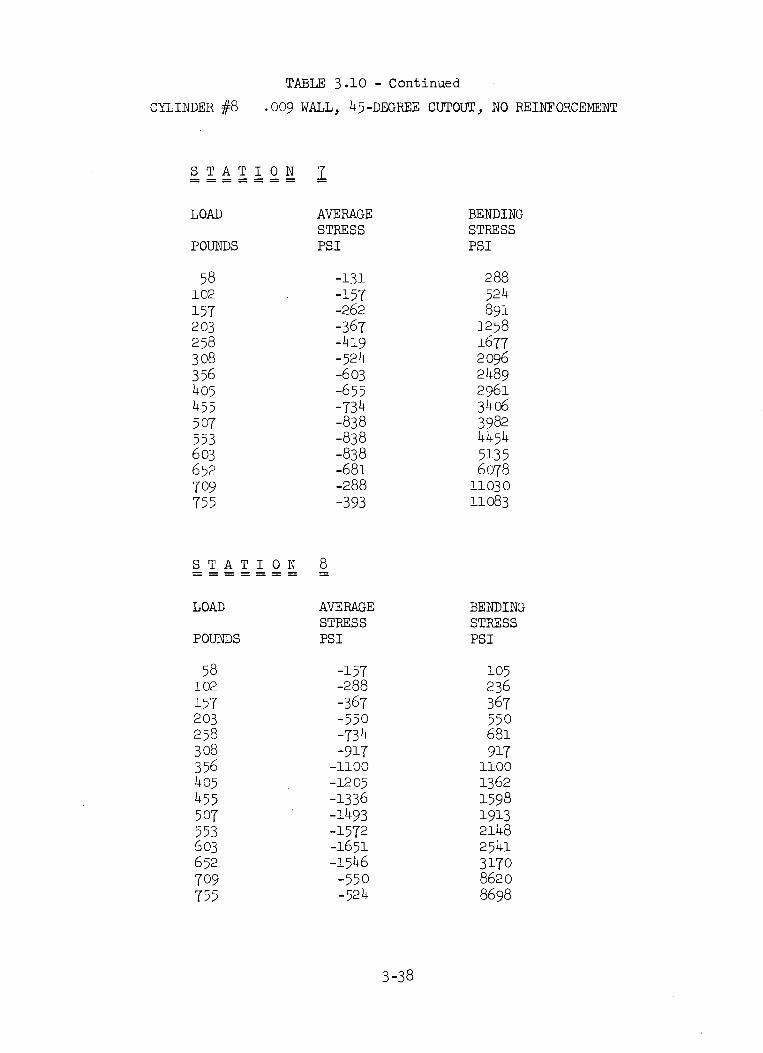
TABLE 3.10 - Continued
CYLINDER #8 .009 WALL, 45-DEGREE CUTOUT, NO REINFORCEMENT
S T A T I ON 7
LOAD AVERAGE BENDINGSTRESS STRESS
POUNDS PSI PSI
58 -131 288102 -157 524157 -262 891203 -367 1258258 -419 1677308 -524 2096356 -603 2489405 -655 2961455 -734 3406507 -838 3982553 -838 4454603 -838 5135652 -681 6078709 -288 11030755 -393 11083
STATION 8
LOAD AVERAGE BENDINGSTRESS STRESS
POUNDS PSI PSI
58 -157 105102 -288 236157 -367 367203 -550 550258 -734 681308 -917 917356 -1100 1100405 -1205 1362455 -1336 1598507 -1493 1913553 -1572 2148603 -1651 2541652 -1546 3170709 -550 8620755 -524 8698
3-38
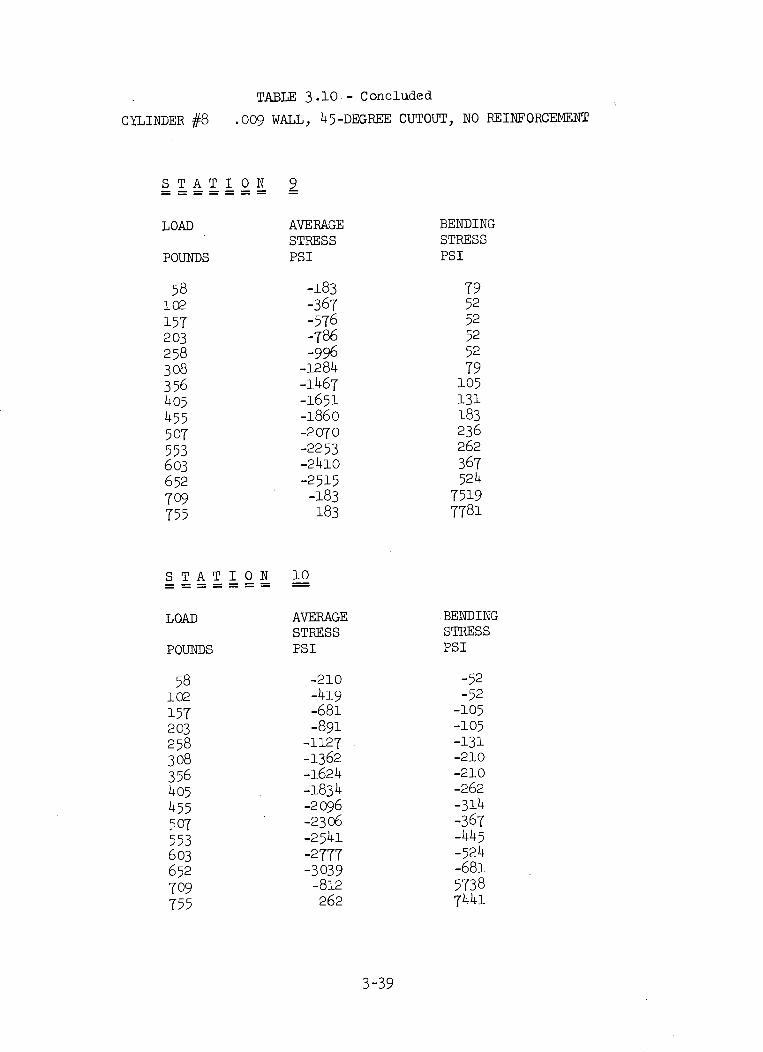
CYLINDER #8
TABLE 3.10-- Concluded
.009 WALL, 45-DEGREE CUTOUT, NO REINFORCEMENT
STATION
LOAD
POUNDS
58102
157203258308356405455507553603652
709755
STATION
LOAD
POUNDS
58102
157203258308356405455
07553603652
709755
9
AVERAGESTRESSPSI
-183-367-576-786-996
-1284-1467-1651-1860-2070-2253-2410-2515-183183
BENDINGSTRESSPSI
795252525279105131183236262
367524
75197781
10
AVERAGESTRESSPSI
-210-419-681-891
-1127-1362-1624-1834-2096-2306-2541-2777-3039
-812262
BENDINGSTRESSPSI
-52
-52-105-105-131-210-210-262-314-367-445-524-681
57387441
3-39
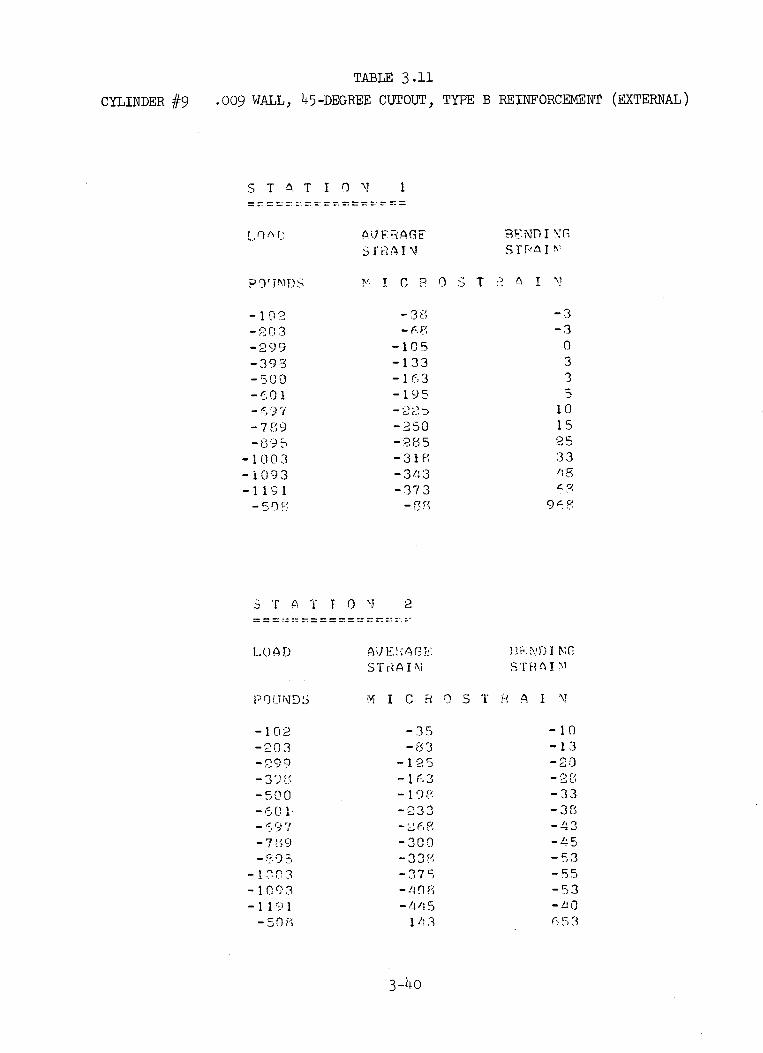
CYLINDER #9
TABLE 3.11
.009 WALL, 45-DEGREE CUTOUT, TYPE B REINFORCEMENT (EXTERNAL)
S T A T I 0 N 1
L' I Ai,S]
-203
-299
-500
- 3 9a
-789
-100 3-1C)93- 1 1 I
S` T A T I 0 'J
LO)AD
p ry3 ID S
-102-203-299-39 "-500
- 1 9 "I-7 9J-1 3
-1 093-1 1 9 1
-50 g
) RA GF-r-a&I
-F ND I 'GSTFrnI 'V
J C? OST -A I
-l0-105
-133
-2 50-31 3
- 3 1: 3-34 3-373
- 8, ,
2
A I E. .,; A ._ST r' A I \i
-Tr.. H) I,sTrAT ,
M I C R 0 S T H A I :N
-35-83
-125-1 - 1 (,3
-_33
-300-33F,
- /4 5143
3-40
-3-3
0335
101525.33/I .
5g.8
-10-1 3-20
-33
- , 3
- , 3-53-55-53
CrF, 53
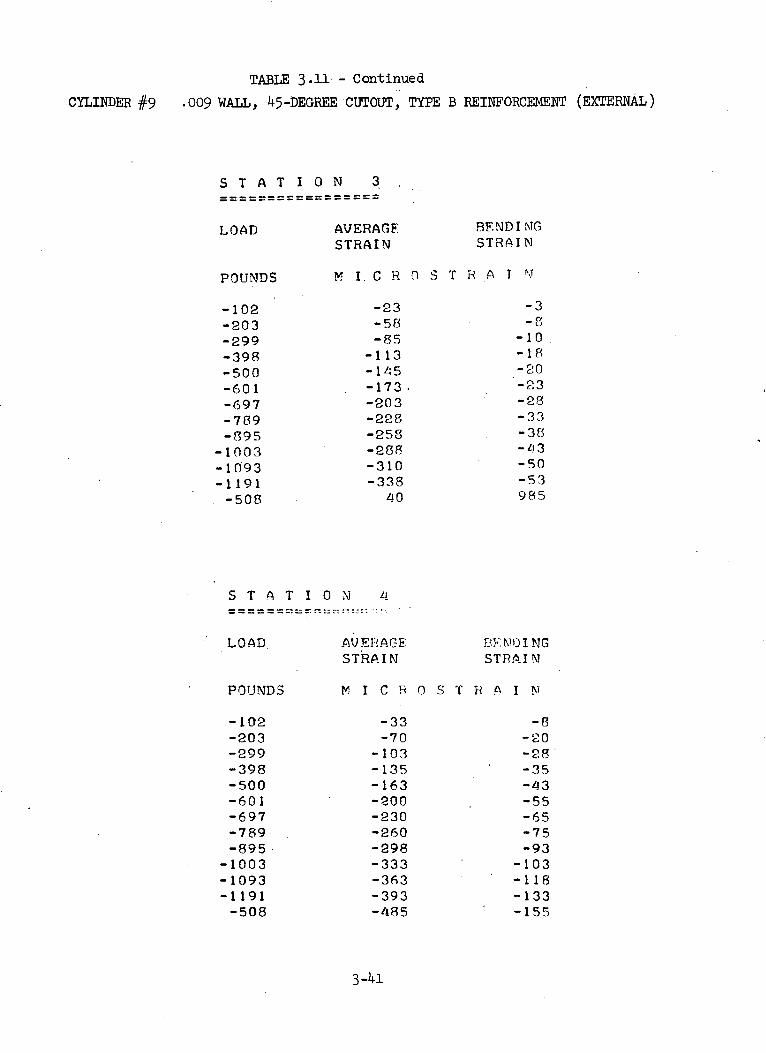
CYLINDER #g9TABLE 3.11 - Continued
.009 WALL, 45-DEGREE CUTOUT, TYPE B REINFORCEMENT (EXTERNAL)
STATION 3= = = = = == = = = = = =
LOAD
POUNDS
-102-203-299-398-500-601-697-789-895
-1003-1093-1191-508
AVERAGESTRAIN
BENDI MGSTRAIN
M I. C R O S T R A I N
-23-58-85
-113-145-173.-203-228-258-288-310-338
40
-3-
-10
-20-23-28-33-38-43- 50-53985
STATIO N 4= = = = = _ =- -
LOAD AV7EI:AGE:STRAIN
B: NDO INGSTRAI N
M I C R 0 S T R A I N
-33 -8-70 -20
-103 -28-135 -35-163 -43-200 -55-230 -65-260 -75-298 -93-333 -103-363 -118-393 -133-485 -155
3-41
POUNDS
-102-203-299-398-500-601-697-789-895
-1003-1093-1191-508

CYLINDER #9
TABLE 3.11 - Continued
.oo9 WALL, 45-DEGREE CUTOUT, TYPE B REINFORCEMENT (EXTERNAL)
STAT I ON
LOAD
POUNDS
-102-203-299-398-500-601-697-789-895
-1003-1093-1191-508
5
AVERAGESTRAIN
BEkNDI NGSTRAIN
M I C R 0 S T R A I N
-33-65
-100-135-165-195-228-250-280-310-335-360-35
-3000003555
1015
780
STATION 6=============t==
LOAD AVERAGESTRAIN
BENDINGSTRAIN
M I C R O S T RA I N
-35-70
-108-138-170-198-230-253-285-315-343-368
-1003
003-358
108
10151818
-373
3-42
POUNDS
-102-203-299-398-500-601-697-789-895
-1003-1093-1191-508
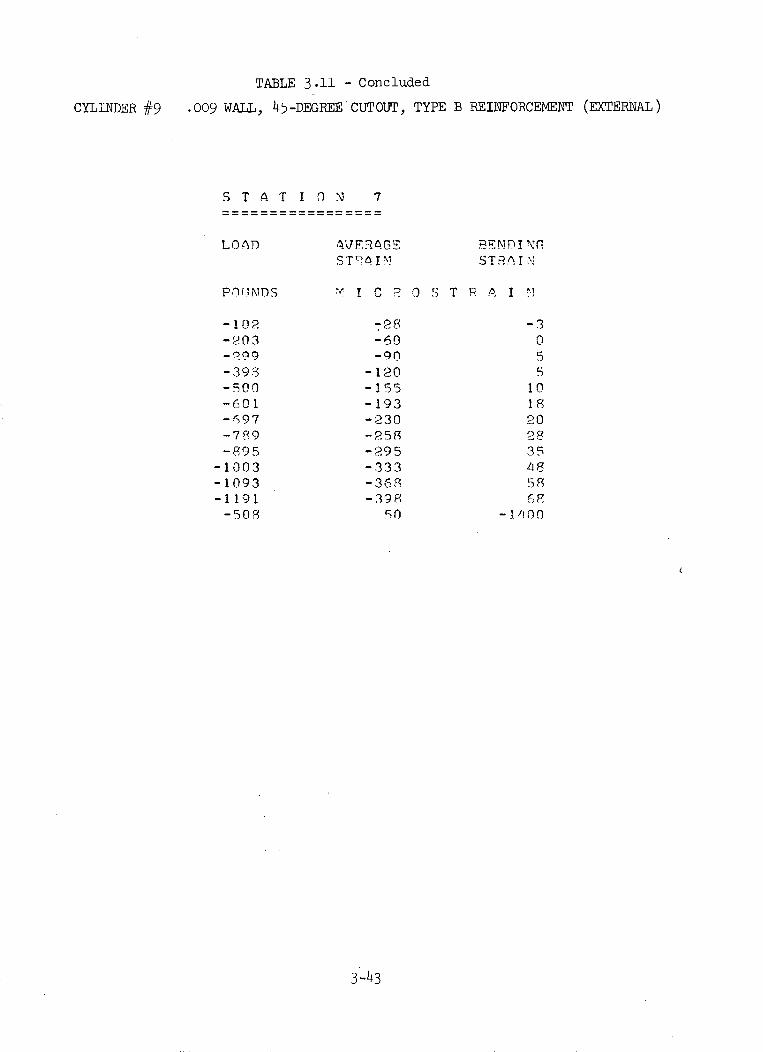
CYLINDER #9
TABLE 3.11 - Concluded
.009 WALL, 45-DEGREE CUTOUT, TYPE B REINFORCEMENT (EXTERNAL)
STATIO N 7
LOAn
P ni ,;ns
-102.
-'c?03-293-39.-500-601-6;97-789-895-1003-1093-1191-508
AV? ER'GES T'?. I N
BF.N nI N.PSTRA I.,
m' I C P 0 S T R A I
-28-60-90
-120-155-193-230
-33395-333
-39850 -1
N1
-3055
10182028354858F68
3-43

CYLINDER #10
TABLE 3.12
.009 WALL, 45-DEGREE CUTOUT, TYPE B REINFORCEMENT (INTERNAL)
S T A T ION
LOAD
1
AJERAGESTRAIN
BENDINGSTRAIN
POUNDS M
-1 00-208-305-/403-508-600-700-808-905
-1005
S r A T I O N
LOAD
POUNDS
-100-208-305-403-508-600-700-808-905
-1005
I C R 0 S T R A I
-38-73
-110-1/45-175-208-248-280-310-3 Li 3
2
AVERAGESTRAIN
BENDINGSTRAIN
M I C R 0 S T R A I
-33-80
-118-158-193-228-258-298-330-365
3-44
N
3300033558
N
35
1318232833384555
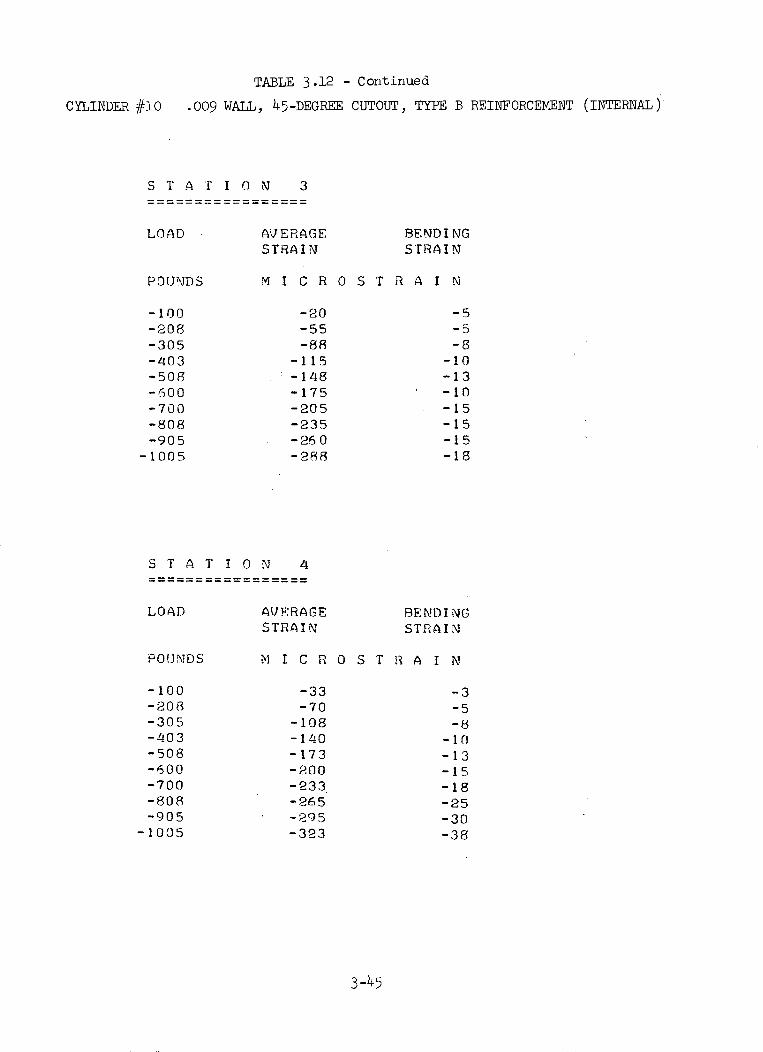
CYLINDER #lo
TABLE 3.12 - Continued
.009 WALL, 45-DEGREE CUTOUT, TYPE B REINFORCEMENT (INTERNAL)
S T .4 r I o N 3
LOAD A%S'
POUNDS M
-100-208-305-403-508-600-700-808-905-1005
S T A T I ON
LOAD
POUNDS
-100-208-305-403-508-600-700-808-905
-1005
VERAGETRAIN
BENDINGSTRAIN
I C R O S T R A I N
-20 -
-55 -
-88 -E
-115 -1I-148 -1:-175 -11-205 - 1-235 -1-260 -1-2889 -1I
55803055
3
583
/4
AVERAGESTRAIN
BENDINGSTRAIN
M1 I C R 0 S T 1 A I N
-33 -3-70 -5
-108 -8-140 -10-173 -13-200 -15-233 -18-265 -25-295 -30-323 -38
3-45

CYLINDER #10
TABLE 3.12 - Continued
.009 WALL, 45-DEGREE CUTOUT, TYPE B REINFORCEMENT (INTERNAL)
STAT I ON
LOAD
POUNDS
-100-208-305-403-508-600-700-808-905
-1005
5
AVE RAGESTRAIN
BENDINGSTRAIN
M I C R 0 S T R A I N
-40-80
-123-163-205-245-290-333-378-418
05813152025283338
STATION 6…== = = = = = =
LOAD A.J ERAGESTRAIN
BENDINGSTRAIN
M I C R 0 S T R A I
-43-90
- 130-175-213-250-293-335-370-413
3-46
POUNDS
-100-208-305-/403-508-600-700-808-905-1005
35
1015182023253033

CYLINDER #10
TABLE 3.12 - Concluded
.009 WALL, 45-DEGREE CUTOUT, TYPE B REINFORCEMENT (INTERNAL)
STATION 7
LOAD
POUNDS
-100-208-305-403-508-600-700-808-905
-1005
APJ ERAGESTRAIN
BENDINGSTRAI IN
M I C R O S T R A I N
-40 15-78 23
-113 33-143 J13-178 58-208 68-240 80-273 98-303 113-335 135
3-47

CYLINDER #11
TABLE 3.13
.009 WALL, 45-DEGREE CUTOUT, TYPE C REINFORCEMENT
S T A T I O N
LOAD
PO)UJNDS
103203304401500549
651
75280/85690O959401a22187
1
A.t 7 F REFSTRA I N
BENDI NGST RA I
M I C R 0 S T R A I V
-5-10-15-20-25-33-33-35-35-35-a0-38-35-35-30-20
1013
-30-70
-110- 115-185-203-218F-2 0-260-275-295-313-328-345-360- 360
163
STATION 2
LOAD RENDIN GSTR41 N
A'JER GE FSTRAIN
M I C R 0 S T . A I ,U
-23 -3-55 0-90 0
-120 0-153 3-170 0-180 0-198 3-210 5-228 8-245 5-258 8-268 8-283 13-295 15-30() 15-210 665
3-48
POU [NDS
103203304401500549
65170275280/4
90f.95940 1422187
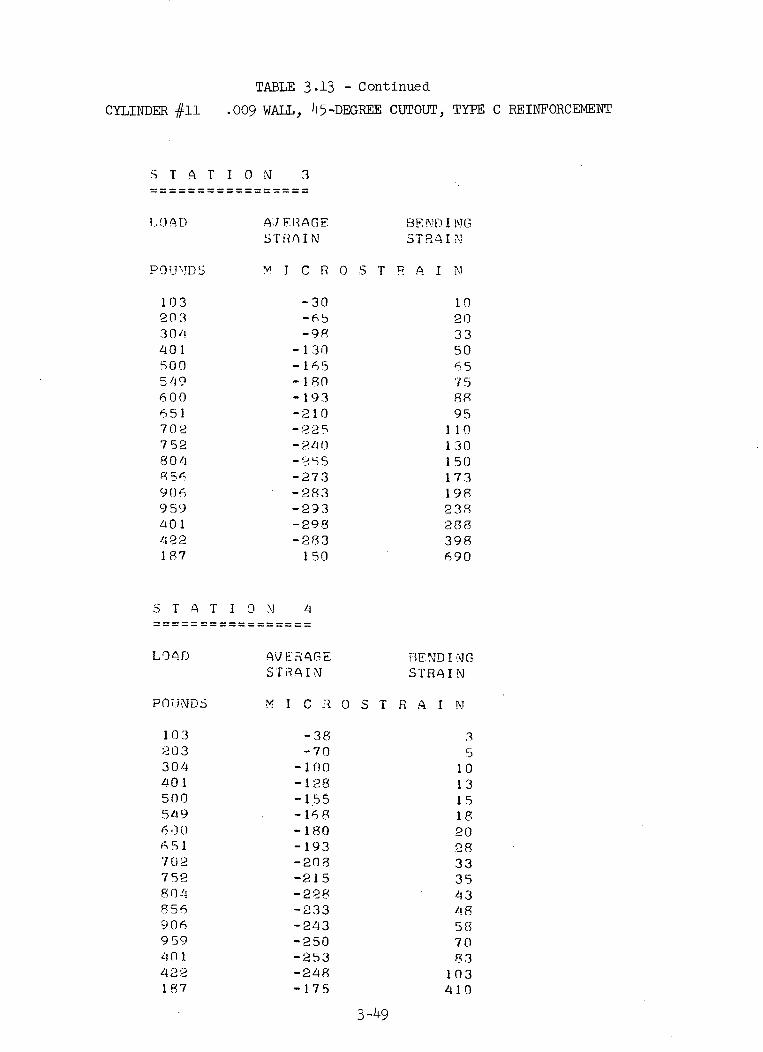
CYLINDER #11
TABLE 3.13 - Continued
.009 WALL, 45-DEGREE CUTOUT, TYPE C REINFORCEMENT
STATI O N 3
.4A; FRAGEST R I N
BE ND I !!NGSTR, AI N'
M I C R 0 S T R A I Nl
-30 1l-65 20-98 33
-130 so50-165 65- 180 75-193 88-210 95-2 25 110
P-2h0 1 30-255 150-273 173-283 198-293 238-298 288-213 398
150 690
S T A T I 0
Aq E . 4GES' R t I N
BEND I NJGSTRAIN
M I C R 0 S T R A I N
-38 3-70 5
-100 10-128 13-155 15-168 18-180 20-193 28-208 33-215 35-228 43-233 /18-243 58-250 70-253 83-248 103-175 410
3-49
P9 0 U TD S
10320330/!4015005/19600651702752iF, 0 /I804
9(06959401!i122187
LOAD
POUi.NDS
10320330440 1500
6 -)O6 51
752804856906959zi 14221 87

CYLINDER #11
TABLE 3.13 - Continued
.009 WALL, 45-DEGREE CUTOUT, TYPE C REINFORCEMENT
5 ' A 1 I 0 N
LO4D
103203304
S 00
6006517O07528()4
856906959q4 014221R7
5
9VER4GESTRAI NJ
9ENDINGS rRA I M
M I C R 0 S T R A I N
-33-68
-100-1.33-1 58-173-1 8S-200-210-220-228-9235-238-2z13-240-233
-1 148
-8-8
-10-8-8-8-5-5
-S0
1518283543
1318
S 1 4 I 0 .N
LOAD AJ ERA.GEs 'r RA I N SRNDA rI GSTRA I NJ1
M I C R O S T R A I N
-33-65-95
-123-153-163-175-185-19 5
-1520-213
-225-225
513
82030435363657080
140593
100105115123128253
3-50
POU JNDS
10.320330440150054960065170'Ž758
04 1
187zt 2 I1R)7
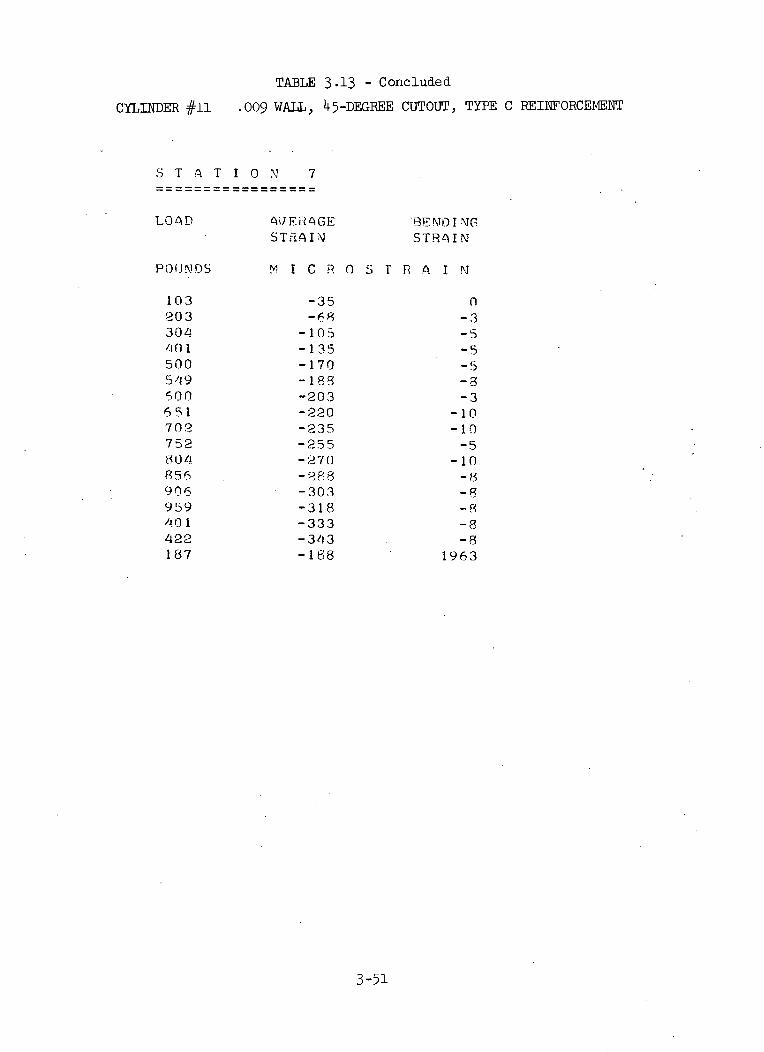
TABLE 3.13 - Concluded
CYLINDER #11 .009 WALL, 45-DEGREE CUTOUT, TYPE C REINFORCEMENT
STATI ON 7
LOAD 9 Eit AGE 'BEN1D I TST RIJ STRAIN
PO)JNDo M I C R 0 s r A9 I N
103 -35 0203 -68 -3304 -105 -51i01 -135 -5500 -170 -5549 -18S -8-600 -203 -3651 -220 -10702 -235 -10752 -255 -5804 -270 -10a56 -'88 -89016 -303 -8959 -318 -8
.401 -333 -8422 -343 . -8187 -188 1963
3-51

LOAD(Ibs)
20000o
A i
1200:
800(
7 1400
90
Fig. 3.1 Axial Stress
0 - Degrees0.30 Inches From End Ring (Cylinder #2)
3-52
6000
5000
4000
3000
2000
1000
O
-10000
1600
._
Q.
I.
x
0
0
0::
n
1-
V
30
0
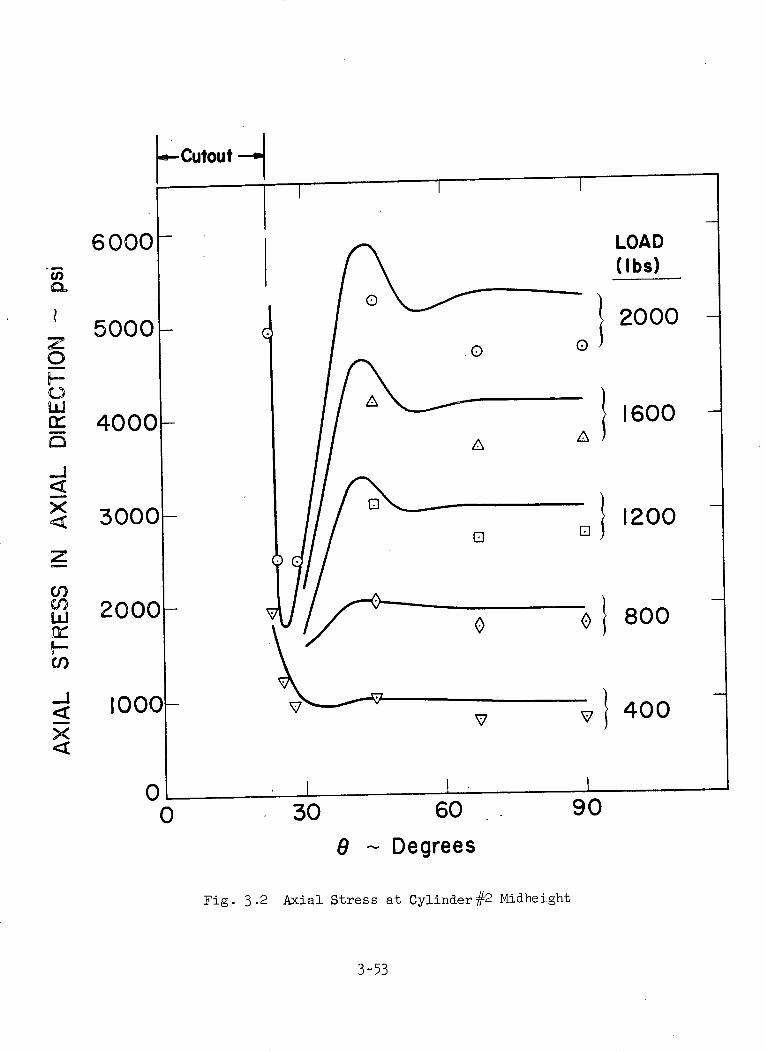
6000
5000
4000
3000
2000
1000
0C
I- Cutout -
)
8 - Degrees
Fig. 3.2 Axial Stress at Cylinder#2 Midheight
3-53
Iz0
0
-j
x
z
w
CI
}
1:2J
O J
I
LOAD(Ibs)
2000
1600
1200
800
400
30 60 90I I,
I

Theory
LOAD
- 2000
I 00
5
28OL-22
30
Fig. 3.3 Bending
8 (degrees)
Stress Near Edge of Cutout (Cylinder
#2 Midheight)
3-54
32
.--- Experimental
2000!

12.25 Dia.
3.00
l
Fig. 3.4 Location of Strain Gage Stations for Cylinder #1
I\J1
9.0
1
I L
4)+ I_1.00
II-
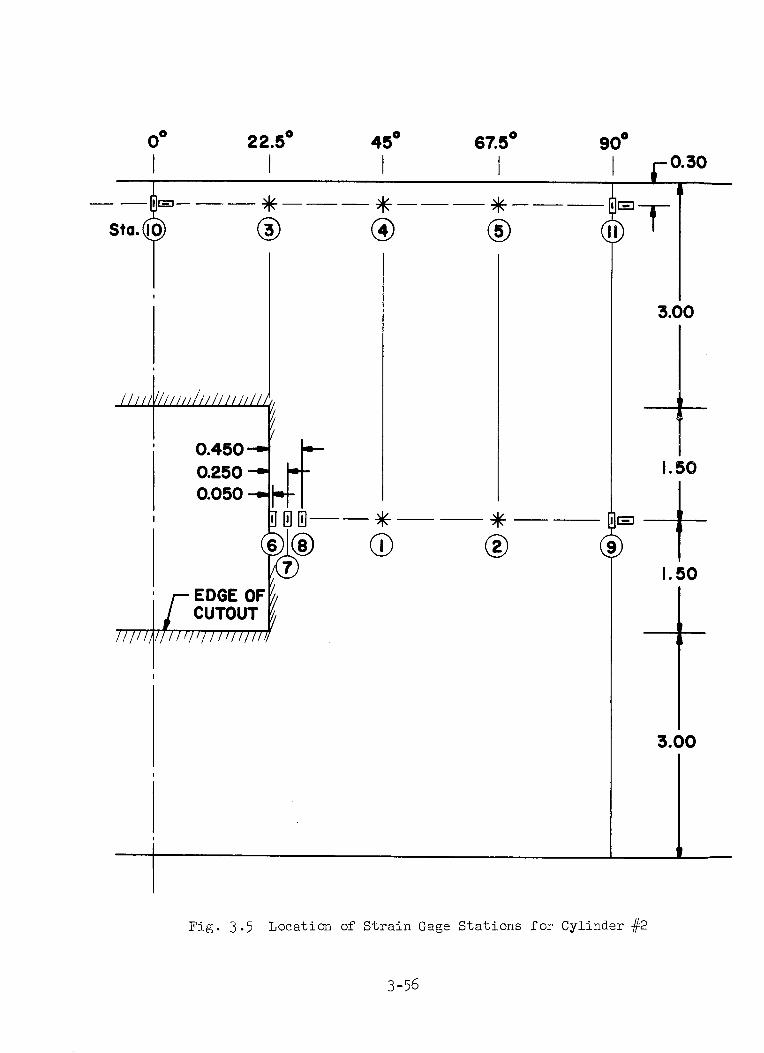
22.5 ° 450 67.50 90o
I I I I
0.4500.2500.050
EDGE OFCUTOUT
Fig. 3.5 Location of Strain Gage Stations for Cylinder #2
3-56
00
Sta.
0.30
1.50
1.50
H
3.00

900 I57.5
3.00
1.50
1.50 0.10
180°
CUTOUT
a- ~ ~ -
I _
Fig. 3.6 Location of Strain Gage Stations for Cylinder #3
22.501
00 22.50 450 67.5° 202.5°
I--
0.10-
JT
0.10
CUTOI
a-
II)10.10Fo.o

22.5 °
i 0.50
1.50
I!
K05 1.5
® .--0.50 1.5
3.0
Fig. 3.7 Location of Strain Gage Stations for Cylinder f#4
3-58
3.0
CUTOUT
oO 90oo
I

22.5 ° 22.5 °
11.00
0.50
0.50
O- -Y-- - --
uJ w 0.50
N - - - II 1.00t
1.00
Fig. 3.8 Location of Strain Gage Stations for Cylinders #5, 6, 9, 10 and 11
.3-59
900 00

22.50
Om
T i'
1.50
Fig. 3.9 Location of Strain Gage Stations for Cylinder #7
3-60
0.125 -
CUTOUT
®--
- - - -~~I
.O 90°
0.40--

22.5 °
0.050-0.250
J ' -0.450- -,- 0.650
0.950 6501.250
22.5°
1 ICUTOUT
0.050 .--0.250 ---0.450 -- 0.650 -_
Fig. 3.10 Location of Strain Gage Stations for Cylinder #8
3 -61
1-
1.50
I1.50
_L
00
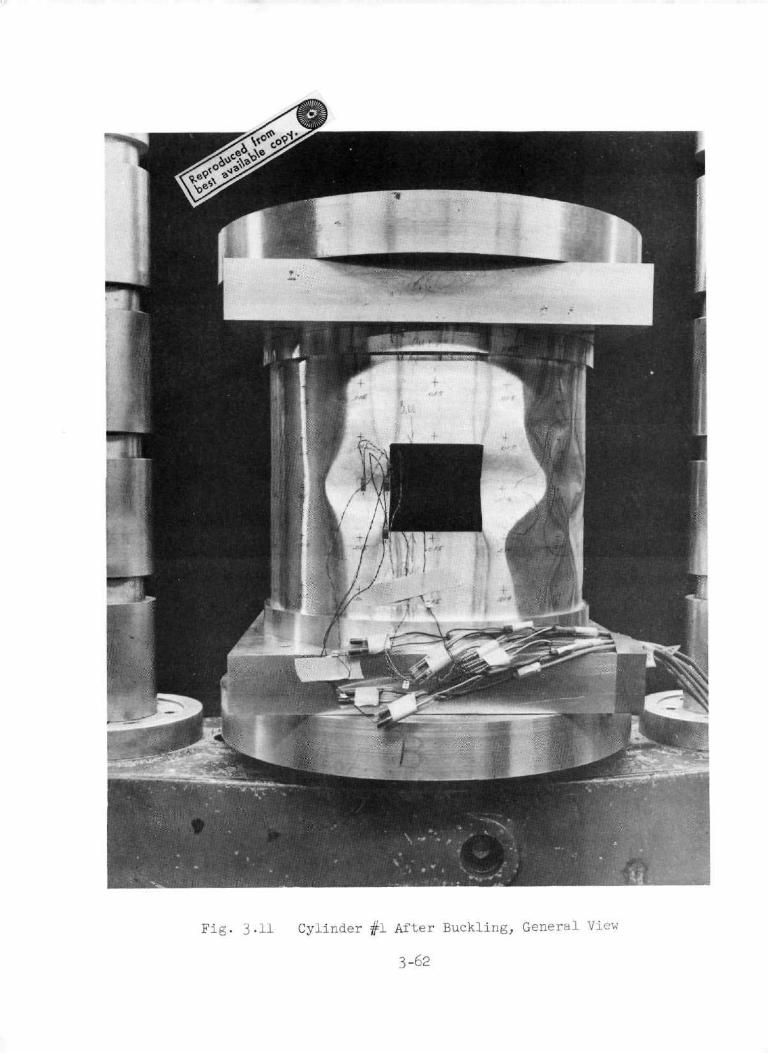
Fig. 3.11 Cylinder #1 After Buckling, General Viev
3-62

CD •H > H CD
(1) C
CD
O
HO
fl •H
H
u
m
CD -P
H JH
CD
a •H
H
>> O
H W)
•H
3-63
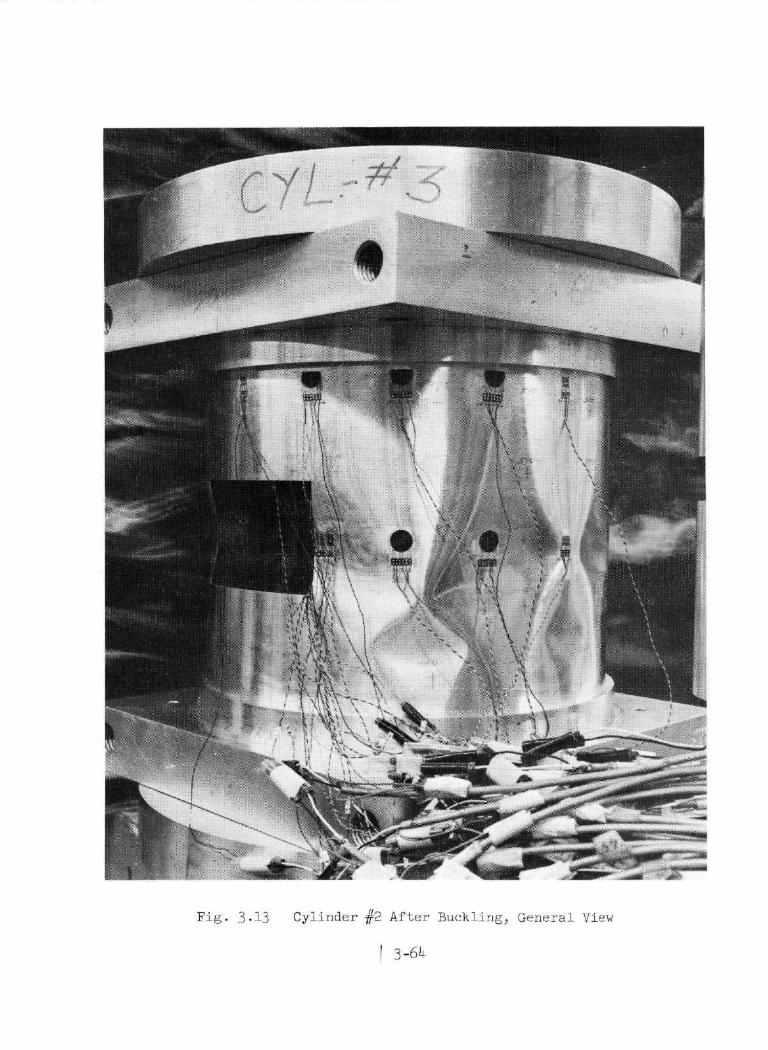
Fig. 3.13 Cylinder #2 After Buckling, General View
I 3-64

Fig. 3-1^ Cylinder #3 After Buckling, General View, West Side
3-65

Fig. 3.15 Cylinder #3 After Buckling, General View, East Side
3-66

Fig. 3.16 Cylinder #4 After Buckling, Detail View From North Side
3-67

m »v
M
ft/
\
A /
H jsr/o- fr/i
4- _T/
3-68

Cylinder #4 After Buckling, Detail View From South Side
3-69
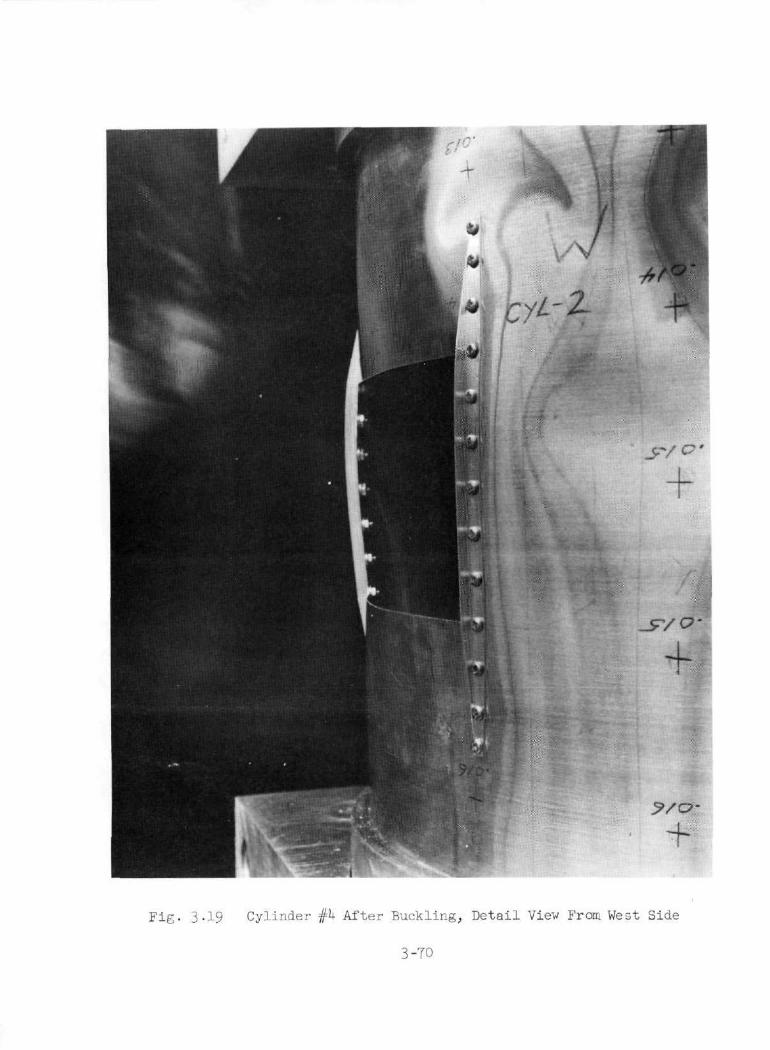
Fig. 3.19 Cylinder #h After Buckling, Detail Viev From West Side
3-70
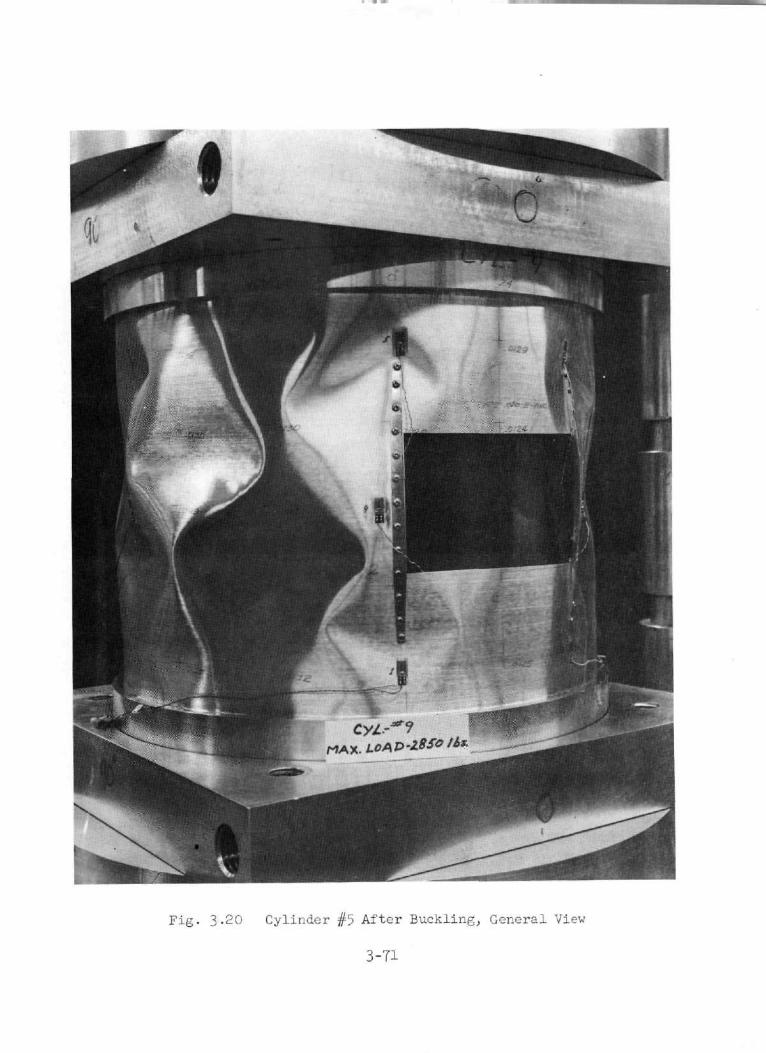
Fig. 3-20 Cylinder #5 After Buckling,, General View
3-71

Fig. 3-21 Cylinder #6 After Buckling, General View
3-72

i
cyi.- *+/o [MAX. LOA0-2S-6O a,t
Fig. 3-22 Cylinder #6 After Buckling, Detail Viev From East Side
3-73

MAX, LOPst>'2.S"6o
Fig. 3.23 Cylinder #6 After Buckling, Detail View From West Side
3-7^
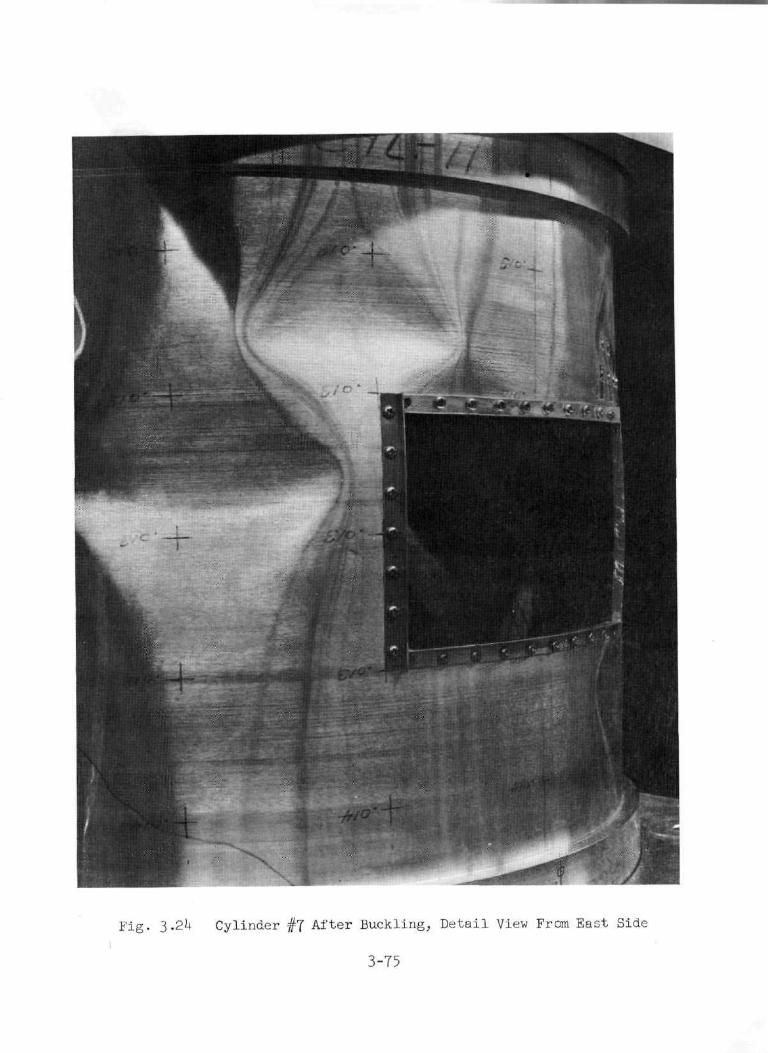
Fig. 3.2h Cylinder #7 After Buckling, Detail Viev From East Side
3-75

Fig. 3.25 Cylinder #7 After Buckling, Detail View From West Side
3-76

r. 'n
- -'
Cy/ . . **& \ ^,'1 LOA&-QQ7 /A-s^
+ CO
Fig. 3.26 Cylinder #8 After Buckling, Detail View, Cutout With Gages
3 -77

F i g . 3-27 Cyl inder #8 Af ter Buckl ing, D e t a i l View, Cutout Without Gages
3-78

/
I
MAX.LOAP 12 7S/AS.
Fig. 3-28 Cylinder #9 After Buckling, Detail View
3-79

Fig. 3'29 Cylinder #10 After Buckling, General View
3-80

Fig. 3*30 Cylinder #11 After Buckling, General View
3-81

cysfc ;MA*. LOAV-ZOSS /U
Fig. 3.31 Cylinder #11 After Buckling, Detail View
3-82
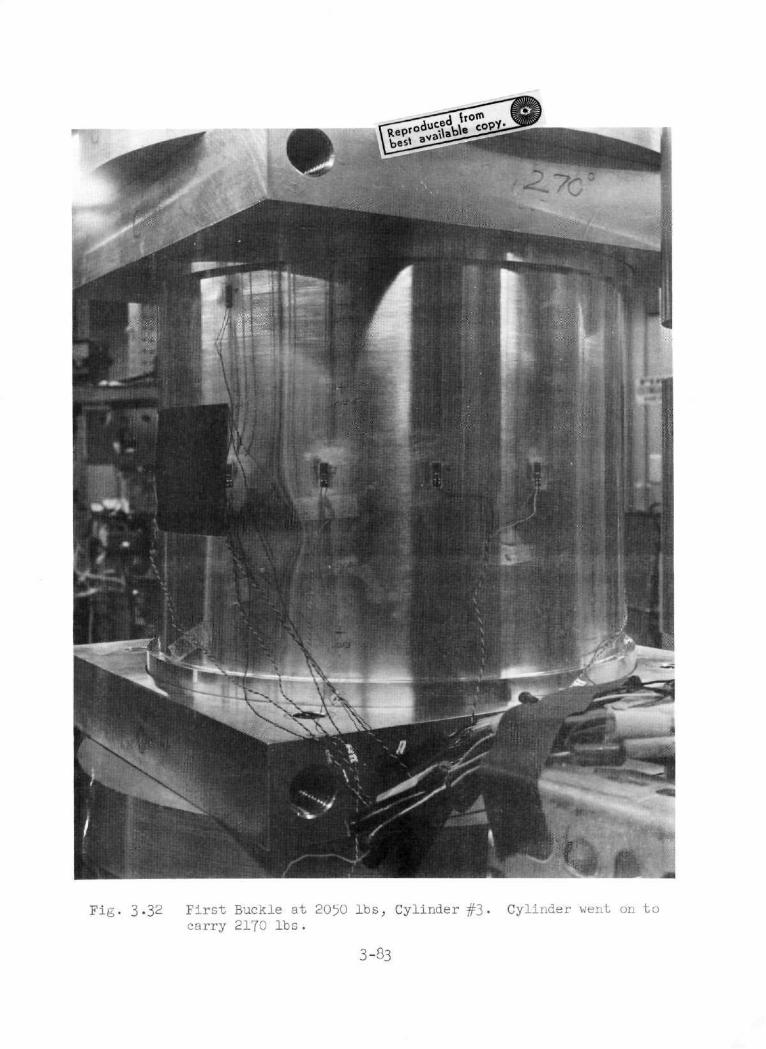
Fig. 3.32 First Buckle at 2050 lbs, Cylinder #3. carry 2170 lbs.
Cylinder went on to
3-83
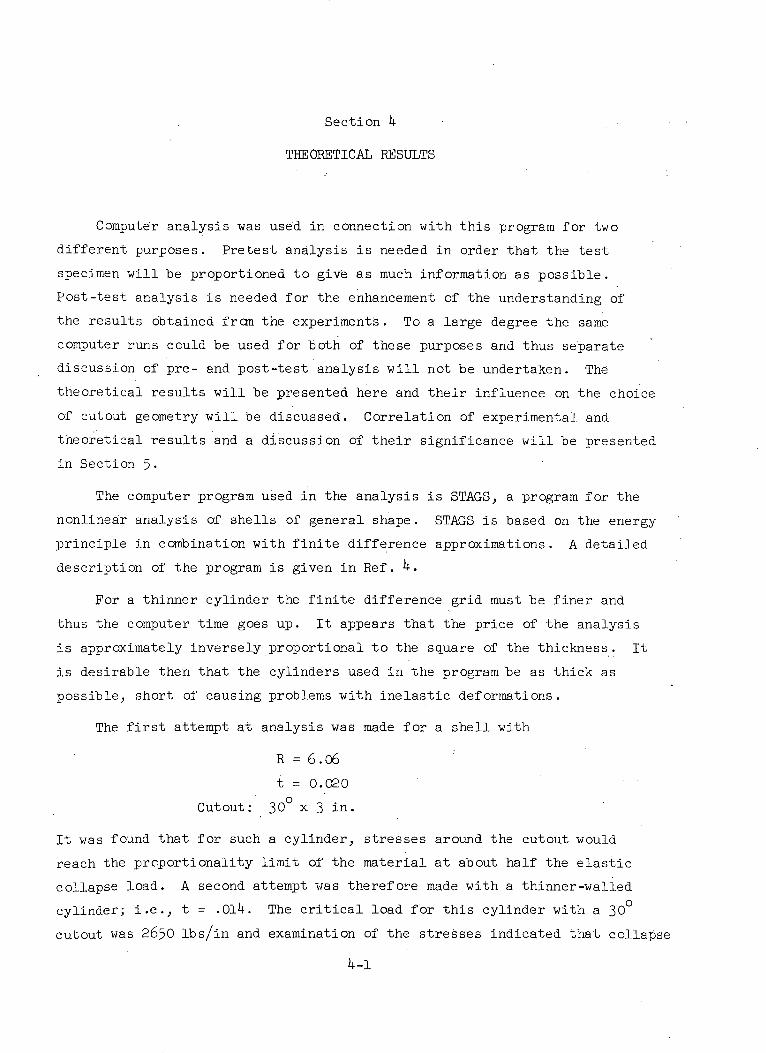
Section 4
THEORETICAL RESULTS
Computer analysis was used in connection with this program for two
different purposes. Pretest analysis is needed in order that the test
specimen will be proportioned to give as much information as possible.
Post-test analysis is needed for the enhancement of the understanding of
the results obtained from the experiments. To a large degree the same
computer runs could be used for both of these purposes and thus separate
discussion of pre- and post-test analysis will not be undertaken. The
theoretical results will be presented here and their influence on the choice
of cutout geometry will be discussed. Correlation of experimental and
theoretical results and a discussion of their significance will be presented
in Section 5.
The computer program used in the analysis is STAGS, a program for the
nonlinear analysis of shells of general shape. STAGS is based on the energy
principle in combination with finite difference approximations. A detailed
description of the program is given in Ref. 4.
For a thinner cylinder the finite difference grid must be finer and
thus the computer time goes up. It appears that the price of the analysis
is approximately inversely proportional to the square of the thickness. It
is desirable then that the cylinders used in the program be as thick as
possible, short of causing problems with inelastic deformations.
The first attempt at analysis was made for a shell with
R = 6.o6
t = 0.020
Cutout: 30° x 3 in.
It was found that for such a cylinder, stresses around the cutout would
reach the proportionality limit of the material at about half the elastic
collapse load. A second attempt was therefore made with a thinner-walled
cylinder; i.e., t = .014. The critical load for this cylinder with a 30°
cutout was 2650 lbs/in and examination of the stresses indicated that collapse
4-1

would occur in the elastic range. However, the difference between the buckling
load for a cylinder without cutout and one with unreinforced cutout was too
narrow to permit a successful study of the efficiency of cutout reinforcement
Therefore, cylinders with 0.014 -inch thickness and wider cutouts were also
analyzed. The critical load for a 45-degree cutout was found to be 2250 lbs
and with a 6 0-degree cutout it was 1900 lbs. The lateral displacements at the
edge of the cutout for these three shells are shown as a function of applied
load in Fig. 4.1. The displacement pattern for the cylinder with a 4 5-degree
cutout is shown here in Fig. 4.2 and the distribution of stresses in the same
cylinder is discussed in Section 5. Although the results of Ref. 1 provided
some guidance, two attempts had to be made before a suitable finite difference
grid was established. The grid which finally was chosen is shown in Fig. 4.3.
The original plan called for test of two series of shells differing from one
another only in shell thickness. As no shells can be thicker than .014-inch,
the two nominal thicknesses chosen were t=.014 (R/t=430) and t=.009 (R/t=675).
The first attempt at analysis of shells with reinforced cutouts was made
with a shell thickness of .014 -inch and a 6 0-degree by 3-inch cutout. The
type of reinforcement chosen was used in the analysis of Ref. 1. A solid
rectangular stiffener was attached like a picture frame around the cutout.
The computed critical load as a function of the thickness of the reinforcing
frame is shown in Fig. 4.4. It is clear that this type of reinforcement is
very inefficient for this shell. If the reinforcement is light, the cylinder
buckles at the midlength of the cutout edge, and at a load only slightly above
the load carried by a cylinder with unreinforced cutout. As the thickness of
the reinforcing frame is increased the buckle shifts its location to a region
above the corner of the cutout and, still, the increase in buckling strength
remains slight. This is because the added area causes a stress concentration
at the place where the reinforcement ends. The reason that the solid frame
could be used to advantage for the cylinder in Ref. 1 is that that cylinder
is so much thicker.
Clearly the reinforcing stiffener at the cutout edge should have bending
stiffness bulc its area should be as small as possible. A thin angle section
stiffener therefore appeared superior to one with the solid rectangular section.
Also one might conjecture that for the case of axial compression the stiffening
along the curved edges of the cutout may be of little value and that it may
4-2
be better to sacrifice this part of the frame and instead extend the stiffen-
ers in the axial direction. Linear analysis was used in a preliminary study
which established the stiffeners selected as suitable (Figs. 2.5 and 2.6).
It was also concluded that little would be gained by using a 6 0-degree cutout
rather than one with a 45-degree arc and that the latter would be more repre-
sentative of practical design. The 45-degree cutout was therefore adopted as
the standard for all tests.
Computer results for the collapse load were obtained for three cylinders
with 4 5-degree cutouts and.0.014-inch thickness. Two were of. the type with
axial s.tiffeners only; one with a stiffener thickness of 0.010-inches and
one with a thickness of 0.020-inches. The third reinforcing configuration
had. a picture frame reinforcement (Fig. 2.7) with an angle of 0.020-inch
thickness. These reinforcement configurations were then used in the test
program. The higher stresses which can be reached in the shell with rein-
forced cutout makes it necessary to use a finer finite difference grid. The
grid selected for analysis of these cylinders has 22 axial and 25 circum-
ferential coordinate lines as shown in Fig. 4.5. For the cylinders with
stringer reinforced cutouts, the maximum displacement shifts away from the
cutout edge to a point about 4 degrees of arc from the edge as the load
increases. For the two cylinders with axial reinforcement only, the displace-
ments at this point are shown as a function of the axial load in Fig. 4.6.
In Fig. 4.7 an attempt has been made to show how the critical load varies
with the thickness of the reinforcement. The data points available are too
few to indicate more than the trend. It seems clear, however, that the
arrangement with only axial stiffeners is definitely superior.
Additional theoretical results were obtained for somewhat thicker cylin-
ders, R/t = 200, with the same cutout. The effect of the size of a stringer
reinforcement (Type A) was studied and the results are shown in Fig. 4.9.
The grid used in this analysis contained 15 axial and 21 circumferential
stations. From these results it can be concluded that the effect of an un-
reinforced cutout is somewhat more severe for thinner cylinders. With
R/t = 200 the cutout reduces the critical load to 41.8% while for a shell
with R/t = 430 the corresponding value is 30.5%.
4-3
Figure 4.10 shows a comparison of reinforcement efficiency for the two
cylinders. The thinner cylinder responds quicker to small reinforcements
than the thicker cylinder, but the thicker cylinder is somewhat more efficient.
However, in both cases we can obtain little more than half the buckling load
of the complete cylinder.
Of the thinner cylinders (R/t = 675) only one was analyzed as the com-
puter time is very high for such shells. The reinforcement chosen for the
analysis was type "C" (see Fig. 2.6) with an angle stiffener which has an
outstanding leg with a reduced height of 0.080 inches. For reasonable
accuracy in the results, it is necessary to use a very fine grid but the
chosen grid with 28 axial and 33 circumferential stations appears to be
satisfactory. This stiffener is so weak that the maximum displacement still
occurs at the cutout edge. This displacement as a function of load is shown
in Fig. 4.8.
4-4

3000 l I , CUTOUT ANGLE 300
2500
45,2000
60o
C
a-1500
0_j
I 1000x4
500
0 i I I i I0 0.02 0.04 0.06 0.08 0.10
w AT CUTOUT EDGE AT MIDLENGTH (inches)
Fig. 4.1 Load-Displacement Curves for Cylinders with Unreinforced Cutouts(t = 0.014)
4-5

U
c-
C
8 (degrees)
0.10
0.05
0
3t O
-0.05 L0 1 2 3 4
x (inches)
Fig. 4.2 Displacement Patterns with 4 5-Degree Unreinforced Cutout (t = 0.014)
4-6
-I
Along Generator CoincidingWith Edge of Cutout
-Cutout -
P

22
fI
1 I T IIT I I I I I I 1
|~ ~ at 4 l I I I. 1 114t7
Fig. 4.3 Finite Difference Grid for Cylinder with 45-Degree Cutout
4-7
I I I 1 1 1 l l l l
0
0
0-J
-J
0_J
U
CUTOUT REINFORCEMENT(inches)
Fig. 4.4 Effect of Solid Reinforcement for 60-Degree Cutout (t = 0.014)
DEPTH, d
22
24
Fig. 4.5 Finite Difference Grid for CyJli der wi'tr 45-Degree ReinforcedCutout

0
C
0 3000
° 2000
xI 000
00 0.01w AT CUTOUT
Fig. 4.6 Load-Displacement (Reinforced Cutouts
0.02 0.03 0.04EDGE AT MIDLENGTH (in.)
Curves for Cylinders with Stringer
4-10

Pcr
Po
0 0.005 ° 0.010 0.015 0.020REINFORCEMENT THICKNESS,
Fig. 4.7 Effect of Reinforcements Around 4 5-Degree Cutout (t = 0.014)
tr
0.025

2000 l l
X 1000
1500
00 /
O 0.01 0.02 0.03 0.04
w AT CUTOUT EDGE AT MIDLENGTH (in.)
Fig. 4.8 Load-Displacement Curve for Cylinder #10 (R/t = 675)
4-12
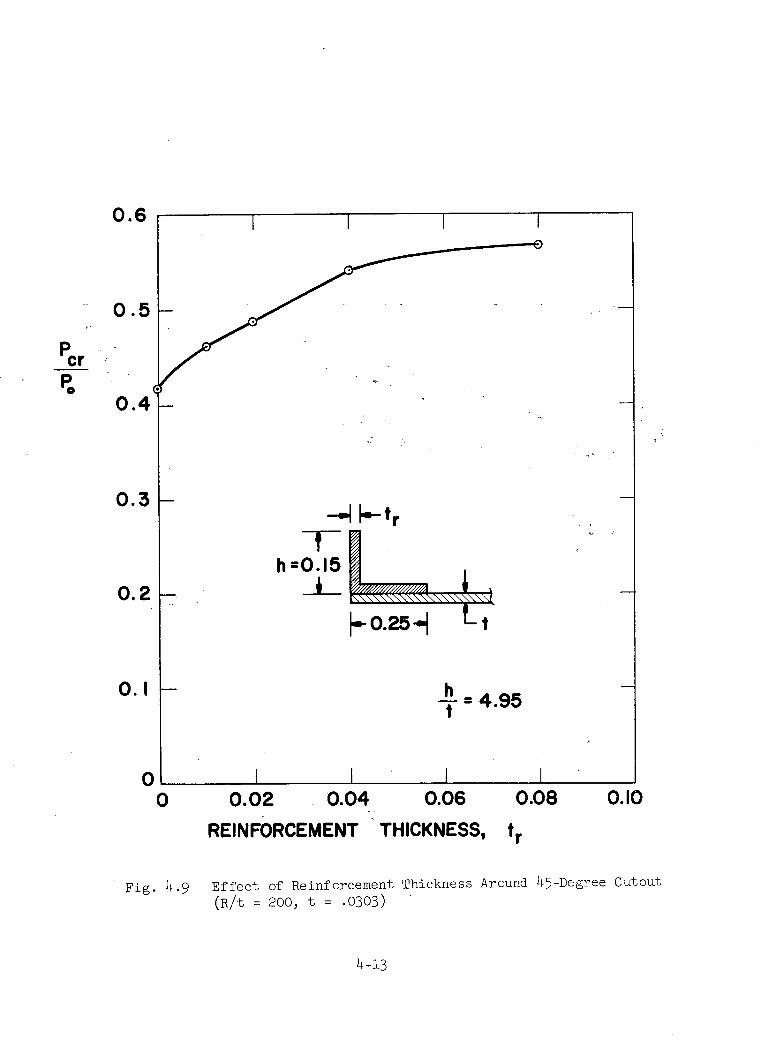
0 0.02 0.04 0.06 0.08REINFORCEMENT THICKNESS, tr
0.10
Fig. 4.9 Effect of Reinforcement Thickness Around 45-Degree Cutout(R/t = 200, t = .0303)
4-13
0.6
0.5
Po0.4
0.3
0.2
0.1
0

cr
0 0.5 1.0 1.5 2.0 2.5
trt
Comparison of Reinforcement Efficiency for Cylinders withR/t = 200 and R/t = 430
4-14
Fig. 4.10
3.0
Section 5
CORRELATION
The extensive strain measurements for Cylinder #2 (with thickness 0.014
inche's and unreinforced cutouts) offers a good opportunity to compare the-
oretical and experimental results'and thus verify the validity of the com-
puter program. The solid lines in Figs.'3.1, 3.2 and 3.3 represent computed
stresses. The points are the stress values determined by use of the strain
gages.
Figure 3.1, which shows axial membrane stress 0.30 inches from the end
ring, indicates very good agreement between test and theory at all load
levels. The agreement deteriorates somewhat as we move away from the cutout.
The reason for this appears to be that the theoretical results are for a
cylinder with a constant 0.014-inch thickness'while the thickness of the
actual test cylinder tended to increase to 0.015 or 0.016 inches. In Fig.
3.2, which shows the axial membrane stress at the cylinder midlength, the
trend is about the same. 'At the edge of'the cutout the agreement between
experimental and theoretical stresses is exceptionally good. Away from the
cutout the measured stresses tend to be somewhat lower than computed stresses
because the thickness in this area is above nominal.
Bending stresses are generally so small that the dominating influence on
these are the small imperfections in the shape of the test cylinder. Only
at the edge of the cutout are these stresses big enough to make a comparison
between test and theory meaningful. The axial direction bending stresses at
the cylinder midlength and close to the cutout edge are shown in Fig. 3.3.
Here the agreement is seen to be relatively poor for small load levels; where
the influence of imperfections is dominant, but improves with increasing load.
Figs. 5.1 through 5.4 show a comparison between theory and measured mem-
brane strains for Cylinders #4, 6, #7 and #11, respectively. On several of
these cylinders some of the -gage stations were placed symmetrically around
the cutout, so that as many as four experimental records are available for
one given location. The term "Location A" is thus used to indicate position
5-1
relative to the symmetrical axes of the cutout or cylinder. For Locations "A"
and "C", the data from the various stations on all the cylinders scatter about
evenly above and below the theoretical curve, and agreement is thus generally
good. At Location "B", the agreement is not as good, but it should be pointed
out that there is a very steep stress gradient in this region (see Fig. 3.2),
so that the placement of the gage is very critical, or conversely, measure-
ments have a high probability of being "off" because of minor gage misplacement.
Taking this into consideration, it is felt that agreement between test and
theoretically predicted membrane strains is very good for the four reinforced
cylinders covered.
For Cylinders #2 and #3, a reversal occurred in the trend of the bending
moment at the cutout edge before the ultimate load was reached. For Cylinder
#3, a small buckle which formed at the lower corner of one of the cutouts,
was observed just above the load at which the bending moment reversal occurred.
A photo of this buckle is shown in Fig. 3.32. The experimental value of the
bending strain at one of the cutout edges on Cylinder #2 is shown as a function
of the applied load in Fig. 5.5. Fig. 5.6 shows the same graph for Cylinder #3
at all four meridional cutout edges. We feel that the point of the bending
stress reversal is the proper load level to compare with the theoretical col-
lapse loads. For Cylinder #2 the theoretical load is then 2250 lbs. and the
experimental load is 2200 lbs. Cylinder #3 is somewhat thinner; in the neigh-
borhood of the cutout the thickness was 0.13 inches. If the collapse load is
assumed to be proportional to the square of the thickness, the thickness corres-
ponding to the test failure load of 2000 lbs., is 0.0132 inches, which agrees
well with the measured thickness. For Cylinder #1 with a 30-degree cutout no
stress reversal was observed before collapse. The critical load of 2740 lbs.
compares well with the computed load of 2900 lbs. (The thickness varies in
the neighborhood of a cutout between 0.014 and 0.015 inches.) In Fig. 5.7
the critical load is plotted as a function of the width of the cutout. In
addition to the analytical results for 30, 45 and 60-degree cutouts, we know
of course the critical loads for 0-degree and 180-degree cutouts. Due to the
limited number of points the curve is rather uncertain, particularly for cut-
outs between 0 degrees and 30 degrees.
5-2
It is seen that in cylinders with reinforced as well as unreinforced
cutouts theory and experiment agree very well on the stress distribution.
In addition, for cylinders with unreinforced cutouts the theory predicts
quite accurately the collapse load. In the case of cylinders with reinforced
cutouts, it is evident that a reinforced cutout constitutes less of an im-
perfection than was generally found in these cylinders, so that a knock-down
factor based on the imperfection level has to be applied to the computer based
nonlinear analysis. This agreement between test and theory is encouraging
and is one of the most important conclusions of the program. It indicates
that it would be possible to make extensive studies of the efficiency of cut-
out reinforcement designs primarily on an analytical basis.
It is useful to note that we obtain a reasonably good approximation to
the effective axial stress level by dividing the total load by the cross-
sectional area of the cylinder which remains after the cutout is introduced.
One should be cautioned that this remark, as well as the following observations,
apply only to the situation in which the load is applied by constant end short-
ening. This accurately represents the test conditions, and is applicable to
many practical problems as well (e.g., collapse of a section of a launch vehicle
contained between two large bulkheads). However, cylinders to which a uniform
axial edge load is applied will behave quite differently (the interior stress
distribution is highly nonuniform and the collapse load will be lower than for
the same shell with constant end shortening); such cases have not been studied
extensively and are beyond the scope of the present effort.
The maximum stress acr which the cylinder can sustain (under constant
end shortening), even if the cutout is adequately reinforced, is the critical
stress for a complete cylinder. In view of the sensitivity of axially loaded
cylinders to geometrical imperfections, a cylinder without a cutout has a
critical axial stress of
Ucr 9K a 0 (5.1)cr o
where ~ is a knock-down factor tied to a probability level depending on
the quality of the dylinder, and aO is the classical buckling stress for
a perfect cylinder without a cutout, i.e.
5-3

CO = 0.6E t/R
Thus the maximum load the cylinder can sustain is the critical stress times
the net area (assuming two equal unreinforced cutouts 180 degrees apart)
1- 80- Pu = 180 a Po=P (5 3)
where
a = angular arc of cutout
Po = 2nRt
The validity of this approximation was established by both the theo-
retical and experimental work of this program. This method appears to be valid
for the case of cylinders with reinforced cutouts if the area of the re-
inforcement is added to that of the remaining cylinder. If there is only
one cutout the average stress may be somewhat lower, but tentatively it is
recommended here that the same equation be applied to cylinders with one
cutout.
If the reinforcement around the cutout is inadequate or nonexistent, the
shell may collapse at a load significantly less than the upper bound Pu
given by Eq. (5.3). This collapse load PNL must be determined by a non-
linear analysis. The critical load PCR for the shell is then the smaller
of the two loads PNL and Pu'
For a given value of the quality parameter ~ there is a maximum size
of a cutout that can be left unreinforced without reduction of the critical
load. This relationship is shown in Fig. 5.8, and is based on computer runs
for 30, 45 and 60-degree cutouts. It is also based on the fact, already
stated, that some imperfections in the complete cylinder lower the buckling
load more than do some cutouts. It is stressed here that because the investi-
gation was not extensive enough, these are only tentative suggestions, and
that there is a lot of scatter in the test data for cylinders with low values
of the quality parameter i . For instance, if ~ = 0.41, it means that only
one percent of the cylinders tested will have a critical load less than 0.41 Po'
5-4
(5.2)
If a 30-degree unreinforced cutout is made in such a cylinder, the test results
150 = .34 P Introduction ofwill be concentrated around tPo = 10 x 0.41 P .34 P .Introduction of
reinforcement will not change this lower bound, or the 99% probability limit,
but the average of several such tests may be considerably above 0.34 P
As the value of $ was determined for all test specimens before any
cutouts were introduced, it is possible to obtain a preliminary evaluation
of this method by application to all cases for which theoretical as well as
experimental results are available. Such an evaluation is made in Table 5.1.
Since it is difficult to take the variable thickness into account and since
many of the cnomputer runs were made before the cylinders were manufactured,
all calculations here are based on nominal values of the thickness. In view
of the thickness variation in any given shell, this approximation is not in-
appropriate. However, more analysis and additional experiments are needed
before this method could be considered an established design procedure. As
might be expected, the nonlinear analysis value provides the critical load
for all shells with unstiffened cutouts (#1, #2, and #3). However, in spite
of the very light stiffening used in some case, P is critical in alluspecimens with reinforced cutouts. Any future work should therefore be on
cylinders that have even lighter cutout reinforcement and a higher value of
the quality parameter i.
5-5

TABLE 5.1
CORRELATION BETWEEN TEST AND THEORY
Pu u ND
·545
.620
* 578
·.503
.538
.455
.413
.45
.455
.465
.435
.375
.403
.34
.31
.338
3360
3440
3210
2780
2980
2500
2290
1030
2900
2250
2250
3700
3700
3500
3100
1400
Key - 6, + and P
PNL
PCR
PEXP
see Eqs. 5.1 and 5.3
theoretical buckling load from nonlinear analysis ofperfect shell with cutout
predicted buckling load (minimum of Pu and PTH)
experimental buckling load
*Load at which bending strain reversed; this is somewhat lower than totalcollapse load shown in Table 3.1.
5-6
SpecimenNumnbe r
1
2
3
4
5
6
7
lm
PCR
2900
2250
2250
2780
2980
2500
2290
1030
PEXP
2740
2250
2000
3190
2850
2560
2600
1030

Position C
' · ,- o-- --- Computer-- ~ ,~~ Experimental
/~~~3000 - -;I
I
2000- , a I /
Or~~~~~~~~~~~~~~r~~~~1000
~~0~~~~~~~ I 0 500 1000 0 500 I000 0 500 1000
MICROSTRAIN
Fig. 5.1 Measured and Computed Membrane Strains in Cylinder #4

Position B Position C
500 1000 0 500MICROSTRAIN
1000 0 500
--o-- Computer- Experimental
B
1000
Fig. 5.2 Measured and Computed Membrane Strains in Cylinder #6
4000
ac
o
I aCL q
9
3000
2000
1000
00
Position A

Position B Position C
500 1000 0 500 1000 0MICROSTRAIN
500
- --o-- ComputerExperimental
B
1000
Fig. 5.3 Measured and Computed Membrane Strains in Cylinder #7
4000
gc006
a4Q
3000
2000
1000 _
00
Position A
lD\-D

---o--- Computer--- ExpFrimental
Position A Position BB
0 200 400MICROSTRAIN
600
Position C
Fig. 5.4 Measured and Computed Membrane Strains in Cylinder #11
2000
1500
o C
- 1000
a
0-J
500
0
IIIII
/
I I

1500
I000
500
00 0.001 0.002
BENDING STRAIN
Fig. 5.3 Bending Strain Reversal at Edge of Cutout and Cylinder Midheight(Test Data for Cylinder #2)
5-11
2000
1500
1000
500
06
2000
1000
500
0 I I0 0.001 0.002 0.003 0 0.001 0.002 0.00'
BENDING STRAINFig. 5.6 Bending Strain Reversal at Cutout Midheight (Two Location at Each of Two
Cutouts, Cylinder #3) r I5-12
X 4000-I0
3000 -a
402000 -
< c tf0.0134
1000
0 ___0 30 60
SIZE, OF CUTOUT ( Degrees)
Fig. 5.7 Cr-itical Load vs. Cutout Angle

0.8 l l l
0.6 - ReinforcementBenefit
w
0.4
No Reinforcement>.. Benefi t1-0.2
a
0 20 40 60 80ANGLE (degrees)
Fig. 5.8 Reinforcement Benefit as a Function of Cutout Arc andCylinder Quality Parameter
%-14

Section 6
REFERENCES
1. F. A. Brogan and B. O. Almroth, "Buckling of Cylinders with Cutouts",
AIAA J., Vol. 8, No. 2, Feb. 1970, pp. 236-241.
2. B. 0. Almroth, F. A. Brogan, and M. B. Marlowe, "Collapse Analysis for
Elliptic Cones", AIAA J., Vol. 9, No. 1, Jan. 1971, pp. 32-36.
3. B. 0. Almroth and F. A. Brogan, "Collapse Analysis for Shells of General
Shape - Vol. I - Analysis", AFFDL-TR-71-8, Wright-Patterson Air Farce
Base, Ohio, 1971.
4. B. 0. Almroth, F. A. Brogan, and F. Zele, "Collapse Analysis for Shells
of General Shape - Vol. II - User's Manual for STAGS", AFFDL-TR-71-8,
Wright-Patterson Air Force Base, Ohio, 1971.
6-1