Embed Size (px)
Citation preview

An Experimental Investigation on the Effect of Nitrogen
Enriched Air and Heat Transfer on the Maximum
Experimental Safe Gap for Propane Gas Explosions
Eivin Bergstad Larsen
Dissertation for the degree of Master of Science
in the subject of Process Safety Technology
Department of Physics and Technology
University of Bergen
2012


i
Acknowledgments
Writing this thesis has been interesting and educational, as well as challenging. Many people
have contributed to this thesis in different and most appreciated ways. First of all, I would like
to thank my two supervisors, associate Professor Bjørn J. Arntzen and Professor Rolf K.
Eckhoff for valuable guidance and discussions throughout this project. Especially thanks to
the two former master students Fredrik Solheim and Marte Henden for help during the start-
up period of the experimental work. To Linn Ringdal and Marianne Winnes Steiner; thanks
for the good companionship and cooperation we have had during the year at the lab.
Thanks to Rachid Maad and Werner Olsen for help setting up temperature measurements,
your help has been invaluable. Rune Haugland, thank you for helping with the repairs and
service of the gas analyser. Thanks to Leif Egil Sandnes and the rest of the staff at the IFT
mechanical workshop who have been most helpful with supplying gas and mechanical parts
used in the experimental work. To Irene Heggstad at the Laboratory for Electron Microscopy
for help using their equipment; thank you.
I am really grateful to Trine Solberg Mykkeltvedt, Siril Bergstad Larsen, Vilde Bergstad
Larsen and Kjetil Lien Olsen for taking their time proofreading this thesis.
I would also like to thank my great study comrades through six years in Bergen. Thank you
for making even the most stressful times, good times. To all who live in Villaveien, thank you
for encouraging me and for all the fun we have together.
Thanks to my three great sisters Vilde, Siril and Kine, who has given me three fantastic
niblings, and always are supportive and helpful. Last but not least, I want to express my
grateful thanks to my mom and dad, Else Bergstad and Thor Erling Larsen who has motivated
me to take higher education and supported me whenever I needed.
Bergen, June 15th
2012,
Eivin Bergstad Larsen.
Department of Physics and Technology
University of Bergen
Norway

ii

iii
Abstract
Electrical apparatuses for use in potentially explosive gas atmospheres are required to be
enclosed. There are two main requirements in the design of such enclosures. Firstly, they are
required to withstand the pressure generated in an internal explosion. Secondly, any gap
openings must be small enough to quench flames and to cool combustion products to prevent
re-ignition of a surrounding explosive gas atmosphere. The largest gap opening that just
prevents transmission of an internal explosion to a surrounding explosive gas atmosphere is
called the maximum experimental safe gap (MESG). The MESG values is determined from
standardised experiments.
The purpose of the conducted experimental work was to investigate the influence of the gap
material on the MESG value. Another aim was to find out if partial inertisation of the
explosive gas influences the maximum experimental safe gap.
The combustible gas used in the experiments was propane. The experiments were conducted
in an apparatus with an interchangeable and adjustable gap opening. The gap materials tested
was carbon steel, brass, aluminium and polyoxymethylene.
The experiments with metal gaps show that the properties of the metals do not have a
significant influence on the MESG value. However, a decrease of 0.01 mm was achieved
when a flame gap of brass was used, compared to the value obtained using a steel gap.
Temperature measured above the orifice of the gap opening supports the finding. At equal gap
opening, a higher temperature was measures above brass gaps than above steel gaps. An
increase of the MESG was achieved by partial inertisation of the explosive gas atmosphere.
The MESG value of propane was doubled when the oxygen content of air was lowered to
15.04 volume percent.

iv

v
Table of Contents Acknowledgments ....................................................................................................................... i
Abstract ..................................................................................................................................... iii
1 Introduction ......................................................................................................................... 1
2 Relevant literature ............................................................................................................... 3
2.1 Explosion theory .......................................................................................................... 3
2.2 Classification of explosion proof equipment ............................................................... 4
2.2.1 Zone classification ................................................................................................ 4
2.2.2 Explosion groups .................................................................................................. 5
2.2.3 Temperature classes ............................................................................................. 6
2.2.4 Type of protection ................................................................................................ 6
2.3 Propane as fuel in an explosion ................................................................................... 7
2.4 Ignition source ............................................................................................................. 8
2.4.1 Ignition of explosive atmosphere ......................................................................... 8
2.5 Flameproof enclosures ............................................................................................... 10
2.5.1 History ................................................................................................................ 10
2.5.2 Working principle .............................................................................................. 10
2.5.3 Quenching distance ............................................................................................ 10
2.5.4 Maximum experimental safe gap ....................................................................... 11
2.5.5 Test method for maximum experimental safe gap ............................................. 12
2.6 Explosion transmission through narrow gaps ............................................................ 13
2.6.1 Flame quenching by a cold wall ......................................................................... 13
2.6.2 Heat transfer to gap wall .................................................................................... 14
2.6.3 Effect of wall roughness on fluid flow and heat transfer ................................... 15
2.6.4 Cooling of a jet by mixing with unburned gas ................................................... 17
2.7 Adding inert gas to an explosive atmosphere ............................................................ 19
2.7.1 Flammability limits ............................................................................................ 19
2.7.2 Partial inertisation .............................................................................................. 20
2.7.3 Hypoxic environment ......................................................................................... 21
2.7.4 Effect of oxygen concentration on the MESG ................................................... 21
2.8 Relevant experimental background ........................................................................... 23
2.8.1 Previous experiments performed with the PRSA ............................................... 24
vi
3 Experimental apparatuses .................................................................................................. 27
3.1 The Plane Rectangular Slit Apparatus ....................................................................... 27
3.1.1 Ignition source .................................................................................................... 29
3.1.2 Thermocouples ................................................................................................... 29
3.1.3 Flame gap ........................................................................................................... 30
3.1.4 Flow in the PRSA ............................................................................................... 31
3.1.5 Gas composition ................................................................................................. 32
3.2 Measurement and control system .............................................................................. 33
3.3 Sources of error ......................................................................................................... 34
3.3.1 Data Acquisition system ..................................................................................... 34
3.3.2 Gas concentration measurements ....................................................................... 34
3.3.3 Air humidity ....................................................................................................... 34
3.3.4 Pressure .............................................................................................................. 34
3.3.5 Temperature ....................................................................................................... 35
3.3.6 Condensed water ................................................................................................ 35
3.3.7 Experiments ........................................................................................................ 35
4 Experimental results and discussion ................................................................................. 37
4.1 Temperature measurement above flame gaps ........................................................... 39
4.1.1 Results ................................................................................................................ 39
4.1.2 Discussion .......................................................................................................... 41
4.2 Experiments with slits in mixture of propane and air ................................................ 42
4.2.1 Discussion .......................................................................................................... 43
4.3 Experiments with steel slits in mixture of propane and nitrogen enriched air .......... 44
4.3.1 Measurements of oxygen content in test gas ...................................................... 45
4.3.2 Oxygen content of 19.00 volume percentage ..................................................... 46
4.3.3 Oxygen content of 16.77 volume percentage ..................................................... 47
4.3.4 Oxygen content of 15.04 volume percentage ..................................................... 49
4.3.5 Discussion .......................................................................................................... 50
4.4 Adhesive tape with polyethylene coating situated in the primary chamber .............. 53
5 Conclusion ......................................................................................................................... 55
6 Recommendations for further work .................................................................................. 57
7 References ......................................................................................................................... 59

vii
Experimental apparatus and procedures ............................................................ i Appendix A
Adjustment of gap opening in the PRSA. ......................................................... ii Appendix B
Calibration of gas analyser, Servomex 4200. .................................................. iv Appendix C
Experimental procedure .................................................................................... v Appendix D
Data acquisition system .................................................................................. vii Appendix E
Thermocouples ................................................................................................ ix Appendix F
Calculation of stoichiometric concentrations ................................................... x Appendix G
Photography of gas analyser with valve numbers .......................................... xii Appendix H
Gas analyser specifications ............................................................................... xiii Appendix I
Magnified photos of slits ................................................................................ xv Appendix J
Experimental data ........................................................................................ xviii Appendix K

viii

1
1 Introduction
Over 90 % of the energy used by humans is developed through combustion processes [1].
Knowledge of how to deal with the hazards of combustion processes, and how to achieve high
operational safety is of great importance. Efforts to develop technology and to gain
knowledge of how to prevent explosions have taken place over time. In the coal mining
industry, firedamp could be ignited when miners used lamps with open flames. Sir Humphry
Davy developed a safety lamp in 1815 which was able to provide light without causing risk of
an explosion [1]. Following the development of the Davy lamp, several technical solutions
have been made to prevent accidental ignition of explosive atmospheres. However, fires,
explosions and processes running out of control still occur occasionally. Recent major
incidents in the petroleum industry include Piper Alpha (1988), BP Texas City (2005),
Buncefield fire, UK (2005), Puerto Rico gas plant explosion (2009) and Deepwater Horizon
(2010) [2]. All accidents resulted in damaged property, financial loss, loss of company
reputation and large environmental damage. Some even resulted in fatalities. In March 2012 a
gas leakage at Elgin WHP, in the British sector of the North Sea, led to a great risk of a major
explosion. Evacuating the workers and shutting down the platform avoided this.
Explosive atmospheres may occur where flammable gas, dust, mist or spray mix with air. To
reduce the risk of an explosion, protective measures must be taken. Actions with objective of
avoiding explosions can be divided into primary, secondary and tertiary explosion protection
measures [3].
The primary explosion protection consists of actions performed to prevent the formation of a
potentially explosive atmosphere. Numerous methods can be effective:
Avoidance of flammable substances.
Limitation of concentration in range below or above explosive limits.
Inertisation; lowering the proportion of oxygen by adding an inert gas in the mixture.
Ventilation.
Secondary explosion protection is actions performed where primary measures have been
exhausted, and hazardous areas with explosive atmospheres still occur. Protective measures
which render ignition sources ineffective are applied. These measures include all explosion
protection measures for electrical apparatuses used in hazardous areas.
Tertiary explosion protection is constructional explosion protection limiting the extent of an
accidental explosion. An example of this is equipment designed to withstand the maximum
explosion pressure. If equipment is not able to withstand the pressure, pressure relieves can be
used.

2
In many cases electrical equipment must be used and operated in areas where an explosive
atmosphere might occur. Thus representing a hazard, because of electric sparks and parts with
high temperatures, which can serve as an ignition source. A secondary explosion protection
measure is to place electrical equipment inside flameproof enclosures to exclude them from
being sources of ignition. The flameproof enclosure serves as a safety barrier between the
surrounding atmosphere and the electrical equipment. Gaps in the enclosure, even though
small, are necessary. They are needed to permit assembly, installation and maintenance of the
equipment. These gaps may cause explosive gas to penetrate into the enclosure; hence a
requirement is that pressure developed during an internal explosion must be withstood. It is of
importance to identify the critical dimensions of gaps and joints through which an internal
explosion can be transmitted to a surrounding explosive atmosphere. The maximum gap
between two close-fitting, flat surfaces, which prevents transmission of an internal explosion
to a surrounding explosive gas atmosphere, is called the maximum experimental safe gap,
MESG. The value of MESG is determined experimentally and is dependent on the
composition and properties of the exploding atmosphere, as well as the specification of the
gap.
Partial inertisation is a term referring to lowering the oxygen content in air. This is a
protective measure for fire and a mitigating measure for explosions occurring. The present
work aims to investigate two factors of the maximum experimental safe gap. One objective is
to study how nitrogen enrichment of air, in an explosive mixture with propane, influences the
safe gap, using an experimental approach. This is done to investigate if standards applying for
flameproof enclosures which are intended for use in fuel in air, can be used in atmospheres
with fuel in nitrogen enriched air. As well as to investigate the impact on the MESG.
A parameter for the determination of MESG values is the heat transfer occurring inside the
safe gap. The heat transfer cools the combustion products from an explosion. The present
work aims to investigate if varying the gap material, in terms of its thermal conductivity,
influence the MESG value. Temperature measurements of the combustion gas exiting the
orifice of the safe gap can indicate if gap material is of importance.
The rest of the thesis is organised as follows: Chapter 2 outlines the relevant literature. A
review of explosion theory and classification of explosion proof equipment is presented,
followed by an explanation of the operating principles of flameproof enclosures. Next, in
Chapter 3, the experimental equipment used throughout the present work is presented, and
then Chapter 4 consists of the experimental results and discussions of these. Finally, in the
Appendix, details of the experimental procedures are given, along with specifications of the
equipment used.

3
2 Relevant literature
This section is a review of the relevant literature for this thesis. An outline of explosion theory
and classification of explosion proof equipment is presented, followed by an explanation of
the operating principles of flameproof equipment.
2.1 Explosion theory
There are several definitions of the term explosion. Some focus on the noise due to the sudden
release of a pressure wave, while some focus on the sudden release of chemical energy. In
Eckhoff [4], a definition of the term is given:
“An explosion is an exothermal chemical process that, when occurring at constant volume,
gives rise to a sudden and significant pressure rise”.
The explosion pentagon in Figure 2-1 illustrates the five components required for a gas, liquid
or dust explosion to occur. Removal of any element prevents an explosion, but a fire might
still take place.
Fuel – a combustible gas, liquid or dust; will function as the reducing agent.
Oxidant – air/oxygen; will function as the oxidizing agent.
Mixing – concentration of fuel within explosion limits.
Confinement – some degree of confinement to ensure pressure rise.
Ignition source – source providing sufficient ignition energy to initiate explosion.
The combustible material can be flammable gas, dust, mist or spray. The ability the material
has to form an explosive atmosphere depends on its flammability and concentration.
Oxidant Fuel
Ignition source
Mixing Confinement
Figure 2-1: Explosion pentagon showing the requirements for a gas, liquid or dust explosion
to occur.

4
Figure 2-2 demonstrates the explosion limits for a combustible material. The concentration of
the combustible material must lie between the lower explosion limit (LEL) and the upper
explosion limit (UEL). In order to be ignited, the mixture must contain a concentration of fuel
within this range. These limiting values are commonly expressed in volume percent (vol. %)
of the total mixture, and depends on the initial pressure and temperature. A concentration of
the most incentive mixture of fuel and air is bounded by LEL and UEL. This concentration is
experimentally determined, and lies near the stoichiometric fuel-air concentration for gas
mixtures [5].
2.2 Classification of explosion proof equipment
Explosion proof equipment is classified according to its intended use. Three factors which are
important for this classification can be summarized as follows:
The probability of a potential flammable atmosphere occurring.
The flammable substance which the equipment potentially will be exposed to.
o Gases, vapors and mists or dust.
The properties of the flammable atmosphere.
2.2.1 Zone classification
A hazardous area can be defined as “an area in which an explosive atmosphere is present, or
may be expected to be present, in quantities such as to require special precautions for the
construction, installation and use of electrical apparatus” [6].
Areas are classified according to the probability of the presence of flammable atmosphere.
The classification is done to establish adequate means of explosion protection. Furthermore,
the areas are subdivided into zones based on the likelihood of occurrence and duration of a
flammable atmosphere [4]:
0 vol. % 100 vol. %
Explosive
atmosphere
L
E
L
U
E
L
Too lean
mixture
Too rich mixture
Upper
explosion
limit
Lower
explosion
limit
Most
incentive
mixture
Figure 2-2: Explosion limits for combustible material in volume percentage.

5
Zone 0: Area where a flammable atmosphere is present continuously or for long
periods
Zone 1: Area where a flammable atmosphere is likely to occur in normal operation.
Zone 2: Area where a flammable atmosphere is not likely to occur in normal
operation. If occurring, it will only exist for short periods.
Figure 2-3: Example of the zone classification of explosive atmospheres.
Figure 2-3 exemplifies a zone classification of a tank containing a flammable liquid. Inside
the tank, above the liquid, is an area classified as Zone 0, where a flammable vapour is
expected to be present. Outside the tank, an area classified as Zone 1 is situated where
ventilation from the tank creates a hazardous area in normal operation. Safety walls contain
the flammable vapour, assuming it is heavier than air. If leakage or spills occur, the safety
walls may not be able to contain the vapour, leading to an area classified as Zone 2.
Flammable atmosphere in this area is likely to be a rare occurrence.
2.2.2 Explosion groups Electrical equipment used in an explosive atmosphere is classified in the following groups [7]:
Group I: Equipment intended for use in mines, susceptible for firedamp.
Group II: Equipment intended for use in places with an explosive gas atmosphere
other than firedamp.
Group III: Equipment intended for use in places with an explosive dust atmosphere.
Group II is subdivided, based on the nature of the explosive gas atmosphere in which they are
intended to be used.
IIA – a typical gas is propane.
IIB – a typical gas is ethylene.
IIC – a typical gas is hydrogen.

6
2.2.3 Temperature classes The auto ignition temperature of an explosive gas atmosphere is the lowest temperature of a
heated surface which, under specified conditions, will ignite a flammable substance in the
form of a gas or vapour mixture with air [6]. The auto ignition temperature of some gases is
presented in Table 2-1.
Table 2-1: Auto ignition temperature for some hydrocarbons and hydrogen in air [5].
Gas Auto ignition temperature (°C)
Methane (firedamp) 595
Propane 450
Ethylene 440
Hydrogen 560
The highest surface temperature of equipment used in hazardous areas, must be lower than the
ignition temperature of the surrounding flammable gas. Electrical equipment used in
explosion group II has been classified according to its maximum permissible surface
temperature, shown in Table 2-2.
Table 2-2: Temperature classes for electrical equipment of explosion group II [4] .
Temperature
class
Maximum permissible surface
temperature of electrical equipment
(°C)
Auto ignition temperature of
surrounding flammable gas
(°C)
T1 450 T > 450
T2 300 300 < T < 450
T3 200 200 < T < 300
T4 135 135 < T < 200
T5 100 100 < T < 135
T6 85 85 < T < 100
2.2.4 Type of protection Different protection measures are carried out on electrical equipment subjected to an
explosive gas atmosphere. Several types of protections are used; all based on different
protection concepts. The most common types of protections are shown in Table 2-3.
Table 2-3: The most common secondary explosion protection measures for electrical
equipment used in an explosive gas atmosphere [7].
Type of protection Marking Used in Zone
0 1 2
Increased safety Ex ‘e’ ● ●
Flameproof enclosure Ex ‘d’ ● ●
Pressurized enclosure Ex ‘p’ ● ●
Intrinsic safety Ex ‘i’ ● ● ●
Oil filled enclosure Ex ‘o’ ● ●
Sand filled enclosure Ex ‘q’ ● ●
Encapsulation Ex ‘m’ ● ● ●

7
Only two types of protection concepts are allowed used in a Zone 0 environment, as Table 2-3
highlights. The two types are intrinsic safety and encapsulation. Any sparks in equipment with
intrinsic safety has insufficient energy to be an ignition source. When encapsulation is used as
a protection concept, equipment is molded inside a material to prevent any contact with the
surrounding atmosphere.
2.3 Propane as fuel in an explosion
Combustion is a self-sustainable chemical reaction which requires no additional energy when
initiated. Combustion with hydrocarbon gas as fuel can be described by reaction (2-1).
(2-1)
Stoichiometric mixtures are mixtures of fuel and oxidant which support complete combustion
of the fuel. A combustible mixture is lean or rich in reference to its stoichiometric mixture.
Rich mixtures have an excess of fuel and combustion will result in incomplete combustion
because of lack of oxidant. Mixtures are lean if there are excess of oxidant.
A reaction where all the fuel is consumed is a stoichiometric reaction. Propane, the gaseous
fuel used in this thesis, gives the stoichiometric reaction (2-2).
(2-2)
Reaction (2-2) is a simplification of the chemical reactions taking place in a combustion
reaction.
The stoichiometric mixture consists of 4.02 vol. % propane in air, when air is the oxidiser.
See Appendix G for calculations. Table 2-4 summarizes values for propane as fuel in an
explosion.
Table 2-4: Tabulated values for propane [5].
Attribute Value
Equipment group IIA
Temperature class T2
MIC ratio 0.82
MESG (mm) 0.92 mm
Most incentive mixture (vol. % in air) 4.2
Auto ignition temperature (°C) 450
Relative density to air (air = 1) 1.56
Adiabatic flame temperature in air (°C) 1977
8
2.4 Ignition source
In order to prevent ignition of explosive atmospheres, it is important to identify possible
ignition sources. Some of the ignition sources which can set off an explosion are [3]:
Hot surfaces.
Flames and hot gases.
Mechanically generated sparks.
Electrical equipment.
Stray electric current.
Static electricity.
Adiabatic compression.
2.4.1 Ignition of explosive atmosphere Ignition can be defined as the initiation of a self-sustained combustion [8]. Ignition occurs
when the rate of heat generation exceeds the rate of heat loss in a fixed volume.
Figure 2-4: Heat generation and heat loss as a function of temperature. [9]
Figure 2-4 illustrates three possible scenarios of heat generation in opposition to heat loss:

9
Case 1 – Line 1 represents the heat loss line and curve 2 the heat generation curve.
The heat generation curve intersects the heat loss line in three points, two of them
shown in the figure. These represent points of stationary states. Increase in
temperature over 1 will be counteracted by an increase in rate of heat loss greater
than rate of heat generation. This leads to cooling of the system if heating is
stopped; the temperature will decrease to 1. The other intersection point, 2,
represents an unstable stationary state. If the temperature is raised at this point, the
rate of heat generation will exceed the rate of heat loss and explosion ensues. If the
temperature is lowered the opposite occurs. Heat loss rate exceeds heat generation
rate and temperature reverts to 1, the stable stationary point.
Case 2 – Line 1 represents heat loss line and curve 3 the heat generation curve
There are no intersection points. The heat generation curve lies above the heat loss
line and only explosive states can exist. The same applies to the case where line 5
is the heat loss line and curve 2, 3 or 4 is the heat generation curve. The relation
between line 1 and 5 can in this case represent reactants with different
concentrations.
Case 3 – crit is the intersection point between line 1 and curve 4.
This point is the last possible stationary state before explosion occurs. This is
called the critical state.
As long as the rate of heat generation exceeds rate of heat loss, the reactant will self-heat.

10
2.5 Flameproof enclosures
This section will give an outline of the principles behind and the function of flameproof
enclosures.
2.5.1 History In 1815 Sir Humphry Davy discovered that iron wire gauze prevents ignition of firedamp by
the flame of an oil lamp. The thermal conductivity of the gauze was sufficient to cool the
combustion residuals [10]. The close meshed screen prevented the flame to propagate to the
surroundings and ignite any firedamp present.
Ninety years later Carl Beyling, a mining engineer, conducted fundamental experiments
leading to development of flameproof enclosures. He discovered that ignited firedamp caused
an overpressure in a closed enclosure, and that joints of suitable dimensions prevented flame
transmission to the surrounding firedamp.
2.5.2 Working principle
A flameproof enclosure, Ex “d”, is an enclosure containing electric parts which can ignite an
explosive atmosphere. It is a requirement that the enclosure is able to withstand the pressure
developed during an internal explosion. It must also prevent explosion transmission to an
explosive gas atmosphere surrounding the enclosure.
To decrease the maximum explosion pressure of an internal explosion, the enclosure can have
gaps or joints with narrow openings. These joints must be narrow enough to prevent
penetrating combustion products igniting a surrounding explosive atmosphere. Joints have
two purposes; to relieve the pressure and to cool down hot combustion products. The shortest
path through the joint, from the inside to the outside of the enclosure, is defined as the width
of the flameproof joint.
Flameproof enclosure “d” is defined by The International Electrotechnical Commission as an
“enclosure in which parts which can ignite an explosive atmosphere are placed and which can
withstand the pressure developed during an internal explosion of an explosive mixture and
which prevents the transmission of the explosion to the explosive atmosphere surrounding the
enclosure” [11].
2.5.3 Quenching distance For a flame to be able to propagate trough a narrow gap, the heat generated by the combustion
reaction must be greater than the heat loss to the wall. The quenching distance (QD) is the
smallest gap width a flame can propagate through, without extinguishing [12].

11
2.5.4 Maximum experimental safe gap Hot combustion products are able to cause re-ignition if they are not cooled down sufficiently
when passing through a gap opening. This can cause re-ignition at smaller gap openings than
the quenching distance, if an explosive gas atmosphere is present.
The maximum experimental safe gap (MESG) is defined as the maximum gap, of a joint of 25
mm in width, which prevents any transmission of an explosion [6]. Gap openings in
flameproof enclosures must therefore be narrower than the MESG, as illustrated in Figure 2-5.
This will ensure that hot combustion products are sufficiently cooled down and re-ignition not
possible.
MESG values are determined experimentally. The values are dependent on the fuel-air ratio;
therefore the most incentive mixture is tested. That is the fuel-air ratio providing the smallest
MESG value. The initial pressure and temperature are also of relevance. Table 2-5
summarizes values for some combustible gases in air at atmospheric pressure and normal
temperature.
Table 2-5: The MESG values of some combustible gases in air at atmospheric pressure and
normal temperature [5].
Gas MESG value
(mm)
Explosion group Most incentive mixture
(vol. % in air)
Methane (firedamp) 1.14 I 8.2
Propane 0.92 IIA 4.2
Ethylene 0.65 IIB 6.5
Hydrogen 0.29 IIC 27
Figure 2-5: Illustration of a flameproof enclosure (Ex ‘d’) from [4].

12
2.5.5 Test method for maximum experimental safe gap The International Electrotechnical Commission (IEC) is the leading international standards
organization. They prepare and publish international standards for all electrical, electronic and
related technology. IEC provide an international standardized test method, used to determine
maximum experimental safe gap for different gases [5]. The apparatus used consist of an
internal and an external chamber, shown in Figure 2-6. The chambers are connected through a
circumferential gap with adjustable gap opening and a gap length of 25 mm. Average
roughness of the gap surface is required to be < 6.3 µm. The apparatus is filled with a known
mixture of gas and air, under normal temperature and pressure. The mixture is ignited and the
flame propagation is observed. By adjusting the gap in small steps, he MESG value for the
gas is determined.
10 explosion tests at each gap opening, at a number of concentrations around the most
incentive mixture, are performed to confirm MESG values.
Probability of ignition is used as an indication of the accuracy of values found. Experimental
results give values for the highest gap, g0, at which there is 0 % probability of ignition, and
the lowest gap, g100, giving 100 % probability of ignition. The gap opening of 0 % probability
of ignition, g0, is defined as the MESG value of the gas.
Figure 2-6: Illustration of the test apparatus used by IEC for determination of the maximum
experimental safe gap [13].
13
2.6 Explosion transmission through narrow gaps
Gaps or joints in a flameproof enclosure have two purposes, as emphasised in section 2.5.2:
The flame resulting from an internal explosion has to be quenched.
The hot products of combustion have to be cooled down sufficiently to not cause
ignition of an explosive atmosphere surrounding the enclosure.
2.6.1 Flame quenching by a cold wall The quenching distance, as discussed in section 2.5.3, is the smallest width of a gap that a
flame can propagate through. Williams introduced two ignition criteria [12]:
Ignition will occur only if enough energy is added to the gas to heat a slab about as
thick as a steady propagating laminar flame to the adiabatic flame temperature.
The rate of liberation of heat by chemical reactions inside the slab must
approximately balance the rate of heat loss from the slab by thermal conduction.
By using these two criteria for ignition and quenching, an energy balance for quenching can
be made. In this simplified energy balance heat loss due to convection is neglected.
(2-3)
- Volumetric heat release rate from the flame
- Heat loss by conduction to walls
The flame quenching is illustrated in Figure 2-7.
Figure 2-7: Flame quenching in a gap opening between two parallel walls.
14
A flame arrestor is a device which prevents breakthrough of an explosion flame by
extinguishing the flame. The quenching effect is based on the amount of heat transferred
from the combustion zone to the gap walls. Experiments with flame arresting devices have not
shown significant influence of the wall material or the thermal conductivity on their flame
arresting capabilities [1].
2.6.2 Heat transfer to gap wall When a fluid is flowing through a gap, heat can be transferred by convection and conduction.
Convection is heat transfer due to movement of fluid. A high temperature combustion gas
flowing through a gap with lower temperature will result in heat transfer from the gas to the
surface of the gap.
Newton’s Law of cooling given in equation (2-4) states that the difference between the
surface temperature and the temperature of the fluid is proportional to the heat loss [14].
( )
(2-4)
- Rate of heat flow (W).
- Surface area of the heat being transferred (m2).
- Surface temperature (K).
- Fluid temperature (K).
- Heat-transfer coefficient (W·m-2
·K-1
).
The fluids heat-transfer coefficient depends on both the flow patterns determined by fluid
mechanics and the thermal properties it has.
Convection can further be subdivided into free convection and forced convection. Free
convection is when a fluid is put in motion because of density gradients in the fluid. Forced
convection can be described as fluid flow caused by an external source. The explosion
experiments performed in this study leads to temperature and density variations within the
fluid flow. Hence, both types of convection occur within the flame gap.
Conduction is heat transfer in a continuous substance due to a temperature gradient. Fourier’s
Law states that the heat flux is proportional to the temperature gradient but with opposite sign.
For one dimensional heat flow, Fourier’s Law is given by equation (2-5) [14]:
(
)
(2-5)
- Rate of heat flow in direction normal to the surface (W).
- Surface area (m2).
- Thermal conductivity (W·m-1
·K-1
).
- Temperature (K).
- Distance normal to surface (m).
In metals, thermal conduction results from motion of free electrons. Because of this there is
close correspondence between thermal conductivity and electrical conductivity.

15
2.6.3 Effect of wall roughness on fluid flow and heat transfer The velocity of a fluid flow is zero at the interface between the fluid and the wall surface.
This is caused by friction. A rough surface leads to higher friction, which is quantified using a
dimensionless number called the friction factor f. If a rough surface is smoothed, the friction
factor is reduced.
The relative roughness of a wall is a measure of how smooth the wall is. Relative roughness
of a pipe wall is the ratio between k and D, where k is a measure of the height of a groove, and
D is a measure of the diameter of the pipe extending from the bottom of the grooves.
Turbulence in a flow can be described using the dimensionless Reynolds number (Re) which
is a measure of the ratio between the viscous forces and the inertial forces. The Reynolds
number is defined as [14]:
(2-6)
- Density of the fluid (kg·m-³).
- Average velocity of the fluid (m·s-1
)
- Diameter of the pipe (m).
- Dynamic viscosity of the fluid (N·s·m-2
).
Re>4000 indicates a turbulent flow, while Re<2100 indicates laminar flow.
A moody diagram shows the relation between friction factor, relative roughness and Reynolds
number for flow in circular pipes, shown in Figure 2-8.
Figure 2-8: Friction factor plot for circular pipes [14].

16
The equivalent diameter for a non-circular pipe is defined as [14]:
(2-7)
- Cross sectional gap area (m2).
- Perimeter of gap (m).
The flow through a safe gap with temperature difference between the walls of the gap and the
combustion gas leads to heat transfer. This can be described as a fluid stream in flow parallel
to a plate. The flow will develop boundary layers close to the interface of the plate. The
velocity at the plate surface is zero and increase to the outer boundary of the layer. This
difference in velocity within the fluid is called the hydrodynamic boundary layer. The fluid
temperature is higher than the plate temperature. Heat will be transferred from the fluid to the
plate and create a temperature gradient in the fluid. This difference in temperature within the
fluid is called the thermal boundary layer.
The Nusselt number is ratio of convective and conductive heat transfer across the boundary
layer [14]:
(2-8)
- Convective heat transfer coefficient (W·m-2
·K-1
).
- Diameter of the pipe (m).
- Thermal conductivity of the fluid (W·m-1
·K-1
).
If the Nusselt number is close to 1, the convection and conduction terms have relatively
similar order of magnitude and thus laminar flow. A large Nusselt number means that the
convective heat transfer dominates, hence the flow is turbulent.
The relationship between the thicknesses of the thermal boundary layer and the hydrodynamic
boundary layer at a given point along the plate is the dimensionless Prandtl number (Pr). It is
the ratio of the viscous diffusion rate and the thermal diffusion rate [14]:
(2-9)
- Specific heat (J·kg-1
·K-1
).
- Dynamic viscosity (N·s·m-2
).
- Thermal conductivity (W·m-1
·K-1
).
When Pr <<1, conductive transfer is dominant, the thermal diffusion rate is much larger than
the viscous diffusion rate. Convective transfer is dominant when Pr >>1. Temperature has
little influence on the Prandtl number of gases, since viscosity and thermal conductivity
increase with temperature approximately with the same rate.

17
Roughness leads to change in conditions of heat transfer. The Gnielinski correlation states
that the Nusselt number for forced convection in turbulent pipe flow is [15]:
(
)( )
(
)
(
)
2-10
Where f is the friction factor and 3000 ≤ Re ≤ 5·106. A larger friction factor, hence rougher
surface, will increase the heat transfer coefficient and lead to increased heat loss.
2.6.4 Cooling of a jet by mixing with unburned gas Hot gas flowing through a gap, from a primary explosion chamber to an external chamber,
creates a jet. Due to the high pressure in the primary chamber, the jet becomes turbulent with
velocity fluctuations. The velocity fluctuations cause the jet to mix with the unburned
explosive gas in the external chamber.
The flow field of a turbulent jet can be divided into three different regions as illustrated in
Figure 2-9; the core region, the transient region and the fully developed turbulent jet region
[16]. If the jet of hot gas achieves favourable conditions and enough energy in any of the
regions, it will cause re-ignition in the external chamber.
Figure 2-9: Illustration of the flow field of a turbulent jet [16].
The core region is characterized by constant temperature, velocity and concentration, and
consists of burned gas. The high velocity of the region provides little contact with the
surrounding unburned gas and contact time is often too short to ignite the unburned gas.
In the transition region, the core region develops into a fully developed turbulent jet. The
interface between the burnt and unburned gas will increase and the jet will lose velocity. The
ratio between the heat generation and the heat loss determines whether ignition occurs.
mixing layer
mixing layer
core region transition region fully developed
turbulent jet

18
In the fully developed turbulent jet region, the interaction between the hot and cold gas is at
its maximum, hence the cooling of the hot gas is at its maximum. If the heat generation
exceeds the heat loss, ignition will occur in this region. The other outcome is that mixing
causes the energy of the jet to dissipate to the extent that heat generation does not exceed the
heat loss, in which case the explosive unburned gas will not ignite.

19
2.7 Adding inert gas to an explosive atmosphere
Inert gases, such as nitrogen, argon and helium, are gases that do not readily react with other
elements. When added to an explosive atmosphere, it displaces oxygen and thus decreases the
danger of oxygen dependant explosions.
2.7.1 Flammability limits A fuel-air mixture may be described as flammable if it is possible to initiate combustion with
an ignition source. Critical flammability concentrations of fuel in air decide the limits of
where combustion is possible as pointed out in 2.1.
Figure 2-10: Flammability diagram for propane (in vol. %) [17].
Each point in the flammability diagram in Figure 2-10, describes different concentrations of
oxygen, nitrogen and propane. The diagram area of which the mixture is flammable is limited
by the lines between point G-A-C-B-F. Air – fuel combinations are found along the air/fuel
line from point D (100 % propane) to point E (air – 79 % nitrogen, 21 % oxygen, 0 %
propane.) The lower flammability limit (LFL) and the upper flammability limit (UFL) for
propane in air are plotted at points B and A respectively. The line from point D, tangential to
point C is the limit line. Along this line the ratio between nitrogen to oxygen is fixed. Below
this, flame propagation is not possible for any amount of propane. This line meets the nitrogen
axis at the limiting oxygen concentration (LOC).
In this thesis, the flammable area between A-C-D is evaluated. The area consists of an
explosive mixture of propane and air with reduced oxygen content.

20
Table 2-6: Flammability limits of propane in air at atmospheric pressure and normal
temperature. Based on [18].
Flammable substance Vessel LFL
(vol. % in air)
UFL
(vol. % in air)
LOC (N2)
(vol. %)
Propane
Flam. tube a 2.1 9.5 11.5
12-L b
2.0 10.0 10.5 a Flammability tube data by [19].
b Data from 12-L spherical flask by [20].
Table 2-6 show the lower and upper flammability limits in terms of vol. % propane in air.
Limiting oxygen concentration (LOC) is defined as the minimum oxygen concentration in a
mixture of fuel, air and an inert gas which will propagate flame [18]. The LOC is dependent
on pressure, temperature and type of inert gas. The tabulated values are found at atmospheric
pressure and normal temperature, using nitrogen as the inert gas.
2.7.2 Partial inertisation It is not always cost-effective to add the amount of inert gas necessary to reach the LOC value
for air-fuel mixtures. One of the focus areas of this thesis is to study how atmospheres with
permanently low oxygen concentration (LO), or hypoxic air, affects the MESG value of
flameproof enclosures. Reduction of oxygen in air by replacement of nitrogen is an effective
measure to prevent fire. Oxygen concentration at 13-15 vol. % prevents many materials being
ignited and functions as a mitigating measure for explosions occurring. [18]
Figure 2-11: Effect of nitrogen on the burning velocity of a propane-air mixture. [21]

21
LO atmospheres influence the flammability of explosive mixtures. The LFL value increase
and the UFL value decrease, creating a smaller interval of ignitable gas mixture with respect
to the concentration of the combustible gas. In [21] Yumlu performed experiments in a
conical flame burner, adding nitrogen to a 4.2 vol. % propane in air mixture, causing
decreased burning velocity as shown in Figure 2-11.
In [22] Movileandu et al. did a study concerning effects of various additives (Ar, N2, and
CO2) on the burning velocity of ethylene-air mixtures. It was concluded that both burning
velocity and maximum flame temperature decreased with increased amount of additive,
making the explosion less fierce.
2.7.3 Hypoxic environment Environment containing hypoxic air where humans can operate at a normal level of activity,
for short or extended durations, is called a hypoxic environment. Angerer and Nowak [23]
performed a study of the physiological effects on healthy persons working in a room with an
oxygen concentration of 13–15 vol. %. It was concluded that the atmosphere did not impose a
health hazard. However, their conclusion emphasized that mood, cognitive and psychomotor
functions might be mildly impaired in those conditions. They recommended close monitoring
of the health problems of people working in low oxygen atmospheres.
A British standard for hypoxic air fire prevention systems defines hypoxic risk categories
[24]. In the standard, no risk is associated with respiration of air containing minimum 14.8 %
oxygen for healthy persons. With a limitation of 4 hour exposure, healthy persons can work in
areas containing 13.0–14.7 % oxygen. Oxygen concentration below 13 % leads to risk of
acute mountain sickness and special precautions are necessary.
2.7.4 Effect of oxygen concentration on the MESG This thesis investigates the influence of nitrogen enrichment of air on the MESG for propane
gas. In [25] Lunn studied the effect of oxygen enrichment of air on the MESG values for
several flammable gases. It was found that oxygen enrichment had a notable effect on the
MESG, which decreased as the oxygen enrichment increased, as seen in Figure 2-12.
The study pointed out that the MESG value depends on three factors:
The temperature of the jet of hot combustion gas.
The rate of combustion, hence the composition of the flammable mixture.
The relative rate of entrainment of ambient mixture into the jet, relative to the mass of
the jet.
The relative rate of entrainment depended on three factors: The jet velocity, the density of the
hot jet and the size of the jet orifice (dependent on the MESG). High jet velocity and small jet
orifice increased the rate of entrainment, reducing chance of re-ignition.

22
Figure 2-12: MESG measurements for fuel-oxygen in stoichiometric proportions with added
oxygen [25].
Increasing oxygen concentration in the mixture led to higher rate of combustion and an
increase of the internal explosion pressure. The higher explosion pressure increases jet
velocity through the safe gap. As pointed out, this reduced the chance of re-ignition.
However, both the rate of combustion and the temperature are higher, increasing the
probability of re-ignition. To counteract this, a smaller jet orifice is necessary to increase the
rate of entrainment to prevent re-ignition. Lowering the safe gap opening does this.
When the oxygen concentration is increased to a relative high level, the flow through the safe
gap is choked. As the nitrogen content of the gas mixture decreases, the reactivity of the gas
mixture increases and the internal explosion pressure at which the hot jet ejects through the
safe gap increases.
23
2.8 Relevant experimental background
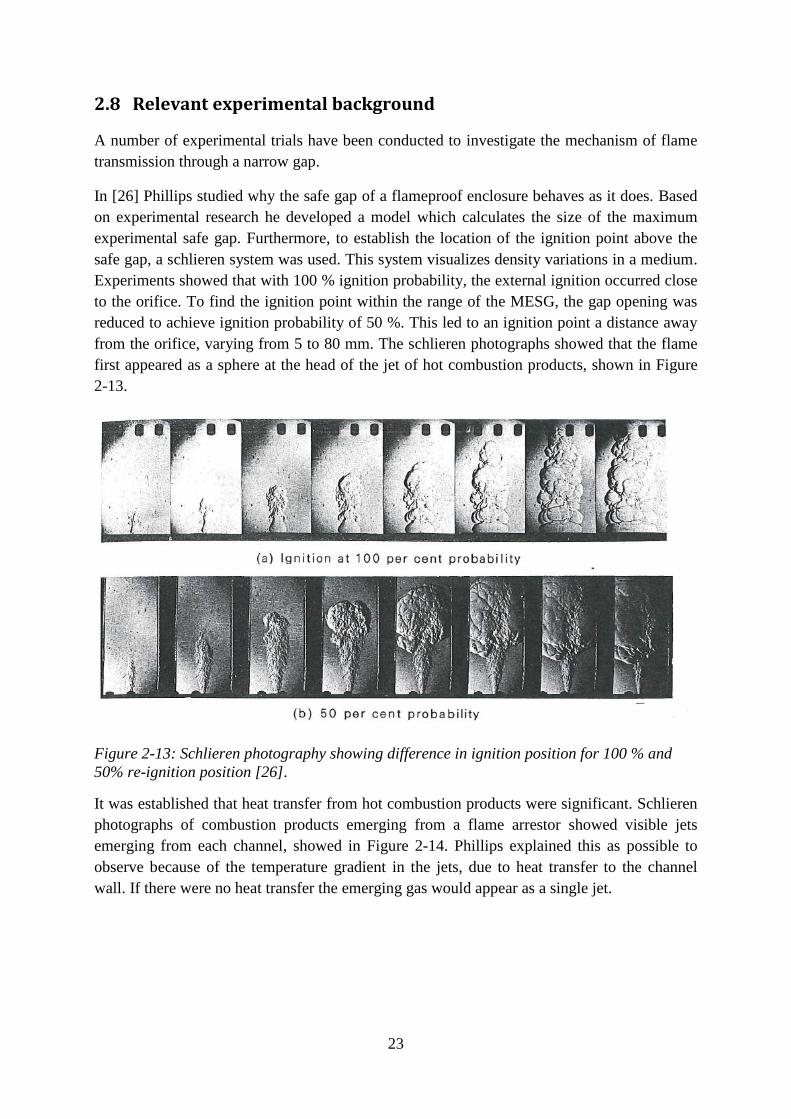
A number of experimental trials have been conducted to investigate the mechanism of flame
transmission through a narrow gap.
In [26] Phillips studied why the safe gap of a flameproof enclosure behaves as it does. Based
on experimental research he developed a model which calculates the size of the maximum
experimental safe gap. Furthermore, to establish the location of the ignition point above the
safe gap, a schlieren system was used. This system visualizes density variations in a medium.
Experiments showed that with 100 % ignition probability, the external ignition occurred close
to the orifice. To find the ignition point within the range of the MESG, the gap opening was
reduced to achieve ignition probability of 50 %. This led to an ignition point a distance away
from the orifice, varying from 5 to 80 mm. The schlieren photographs showed that the flame
first appeared as a sphere at the head of the jet of hot combustion products, shown in Figure
2-13.
Figure 2-13: Schlieren photography showing difference in ignition position for 100 % and
50% re-ignition position [26].
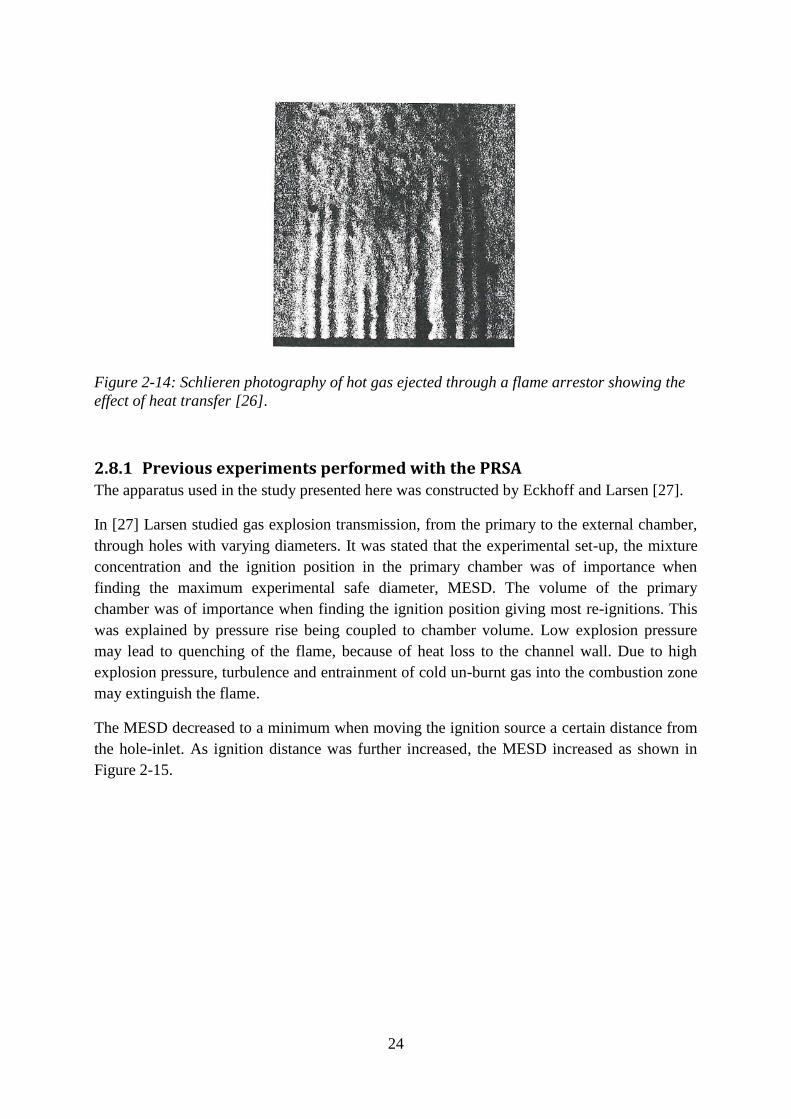
It was established that heat transfer from hot combustion products were significant. Schlieren
photographs of combustion products emerging from a flame arrestor showed visible jets
emerging from each channel, showed in Figure 2-14. Phillips explained this as possible to
observe because of the temperature gradient in the jets, due to heat transfer to the channel
wall. If there were no heat transfer the emerging gas would appear as a single jet.
24
Figure 2-14: Schlieren photography of hot gas ejected through a flame arrestor showing the
effect of heat transfer [26].
2.8.1 Previous experiments performed with the PRSA The apparatus used in the study presented here was constructed by Eckhoff and Larsen [27].
In [27] Larsen studied gas explosion transmission, from the primary to the external chamber,
through holes with varying diameters. It was stated that the experimental set-up, the mixture
concentration and the ignition position in the primary chamber was of importance when
finding the maximum experimental safe diameter, MESD. The volume of the primary
chamber was of importance when finding the ignition position giving most re-ignitions. This
was explained by pressure rise being coupled to chamber volume. Low explosion pressure
may lead to quenching of the flame, because of heat loss to the channel wall. Due to high
explosion pressure, turbulence and entrainment of cold un-burnt gas into the combustion zone
may extinguish the flame.
The MESD decreased to a minimum when moving the ignition source a certain distance from
the hole-inlet. As ignition distance was further increased, the MESD increased as shown in
Figure 2-15.

25
Figure 2-15: Safe diameter Ds and D10 for various ignition-distances Xi. Primary volume
V=1-l and 4.2 vol. % propane-air.[27]
The concentration that gave the smallest safe diameter, called the optimal concentration, was
found to be dependent on the experimental set-up. Larsen used 4.2 vol. % propane in air
when conducting his experiments. This was found to be the most incentive mixture in the
PRSA.
In [28] Einarsen modified the PRSA to be able to perform experiments with both parallel slits
and cylindrical holes. He investigated the relation between gap length and MESG, as well as
hole length and MESD. It was found that an increase in gap length led to a systematic
increase of the MESG. The same result was found for the experiments with cylindrical holes.
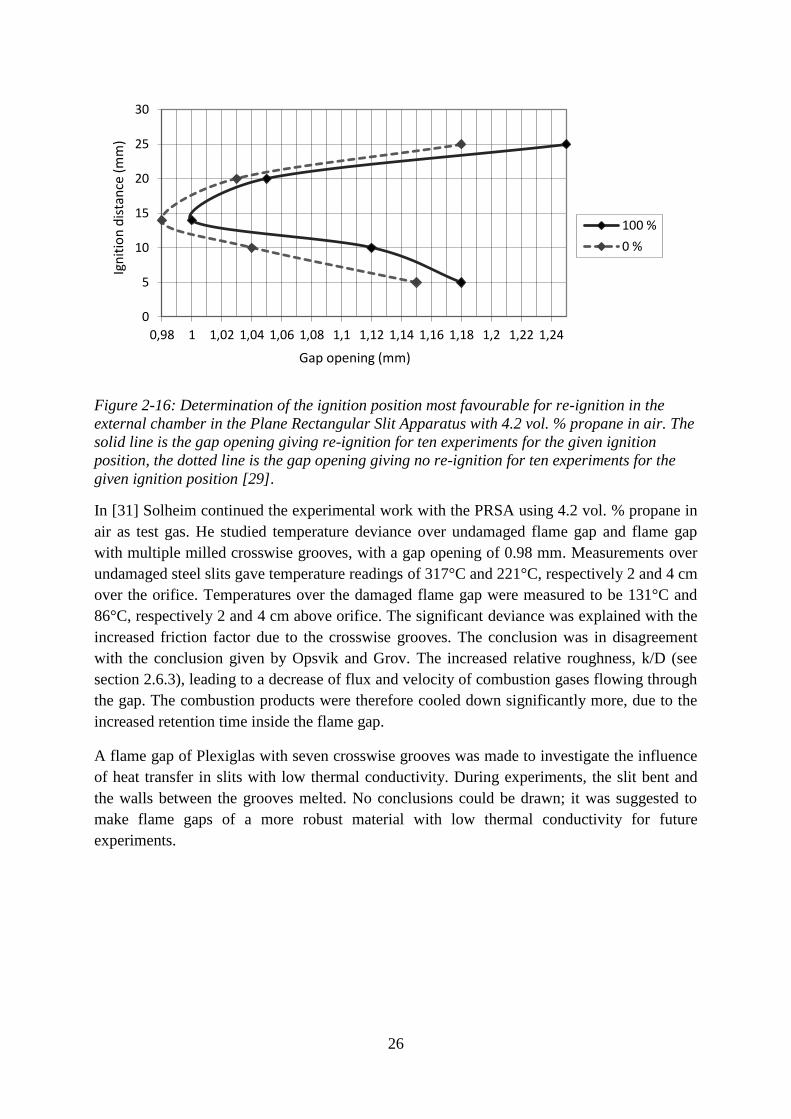
In [29] and [30] Opsvik and Grov conducted experiments with the PRSA and an apparatus
with a circular flame gap, the plane circular flange apparatus (PCFA). Experiments were
carried out with 4.2 vol. % propane in air. The ignition distance most favourable for re-
ignition, in the external chamber in the PRSA, was found to be 14 mm, shown in Figure 2-16.
It was also investigated how surface damages on the flame gap influence the MESG value.
Flame gap surfaces were damaged using several methods. Milled grooves, both lengthwise
and crosswise the flow direction, were examined. Sets of flame gaps were also exposed to sea
water to investigate the influence of rust. Flame gaps with crosswise grooves led to an
increase of the MESG value, from 0.98 mm to 1.10 mm in the PRSA. Compared to
experiments with undamaged flame gap surfaces, the damaged flame gaps gave higher
pressure measurements in the primary chamber. It was suggested that the grooves led to
increased turbulence and velocity in the flame gap, giving rise to a more efficient cooling of
the combustion jet.
0
4
8
12
16
20
24
28
32
36
40
44
48
0 1 2 3 4 5 6 7 8 9 10 11 12
D [mm]
X i
[mm]
0% re-ignition, Ds
100% re-ignition, D10
26
Figure 2-16: Determination of the ignition position most favourable for re-ignition in the
external chamber in the Plane Rectangular Slit Apparatus with 4.2 vol. % propane in air. The
solid line is the gap opening giving re-ignition for ten experiments for the given ignition
position, the dotted line is the gap opening giving no re-ignition for ten experiments for the
given ignition position [29].
In [31] Solheim continued the experimental work with the PRSA using 4.2 vol. % propane in
air as test gas. He studied temperature deviance over undamaged flame gap and flame gap
with multiple milled crosswise grooves, with a gap opening of 0.98 mm. Measurements over
undamaged steel slits gave temperature readings of 317°C and 221°C, respectively 2 and 4 cm
over the orifice. Temperatures over the damaged flame gap were measured to be 131°C and
86°C, respectively 2 and 4 cm above orifice. The significant deviance was explained with the
increased friction factor due to the crosswise grooves. The conclusion was in disagreement
with the conclusion given by Opsvik and Grov. The increased relative roughness, k/D (see
section 2.6.3), leading to a decrease of flux and velocity of combustion gases flowing through
the gap. The combustion products were therefore cooled down significantly more, due to the
increased retention time inside the flame gap.
A flame gap of Plexiglas with seven crosswise grooves was made to investigate the influence
of heat transfer in slits with low thermal conductivity. During experiments, the slit bent and
the walls between the grooves melted. No conclusions could be drawn; it was suggested to
make flame gaps of a more robust material with low thermal conductivity for future
experiments.
0
5
10
15
20
25
30
0,98 1 1,02 1,04 1,06 1,08 1,1 1,12 1,14 1,16 1,18 1,2 1,22 1,24
Ign
itio
n d
ista
nce
(m
m)
Gap opening (mm)
100 %
0 %

27
3 Experimental apparatuses
The experimental part of the present work has been done in The Plane Rectangular Slit
Apparatus (PRSA). The apparatus was originally designed by Larsen [27] and Eckhoff and
has previously been used in experimental work by Larsen [27], Einarsen [28], Grov [29] and
Solheim [31].
A list of the experimental apparatuses used in the present work is given in Appendix A.
3.1 The Plane Rectangular Slit Apparatus
The Plane Rectangular Slit Apparatus, denoted PRSA, consists of a cylindrical primary and
external chamber as shown in Figure 3-1.
The primary chamber has a volume of 1 litre and is made out of steel. It contains an ignition
source with variable ignition position and a piezoelectric pressure transducer. The external
chamber is 3 litres and made out of Perplex. This makes is possible to visually confirm re-
ignition in the chamber. It contains two thermocouples mounted directly above the flame gap
orifice. Explosion ventilation is at the top of the external chamber.
The interchangeable flame gap is mounted on a removable plate between the primary and the
external chamber. The external chamber can easily be removed by unscrewing it from the
primary chamber, releasing the flame gap plate, making inspection and adjustments easy.
Experimental procedure for the PRSA is described in Appendix D.

28
Figure 3-1: The Plane Rectangular Slit Apparatus, shown with tubing. Compressed air inlet is connected
to the compressed air system of UoB. The gas inlet and outlet is connected to the gas analyser.

29
3.1.1 Ignition source Spark electrodes in the primary chamber function as the ignition source in the PRSA. The
spark electrodes are connected to a spark generator with an external trigger device. An electric
spark in the primary chamber is provided when the spark generator is triggered.
The position of the ignition source in the primary chamber is vertically adjustable. The
ignition position is referred to as the distance from the top of the spark electrodes to the flame
gap entrance. Experiments Grov [29] and Solheim [31] conducted showed that an ignition
position of 14 mm gave most re-ignitions in the external chamber. This distance is used in the
experimental work in this thesis, as the most incentive ignition position.
Figure 3-2: Spark electrodes shown in the centre of the primary chamber.
3.1.2 Thermocouples Thermocouples are used to measure the temperature of combustion products leaving the flame
gap. Two thermocouples were mounted on steel rods inside the external chamber, vertical
above the gap opening, as shown in Figure 3-3. The heights of the steel rods are adjustable
and secured that the thermocouples were at the same height and position throughout the
execution of the experiments. The height was controlled to not have been altered after each
set of explosions.
Thermocouple specifications and welding procedure are given in Appendix F.

30
Figure 3-3: Thermocouples fastened at two distances directly over the flame gap opening in
the external chamber. At each side of the gap orifice, distance shims are viewed.
3.1.3 Flame gap The flame gap consists of a pair of plane slits with equal material characteristics. The slits are
mounted between the primary chamber and the external chamber on the flame gap plate,
creating a passage between the chambers. This distance is referred to as the flame gap
opening.
Distance shims with variable thicknesses, from 0.03 mm to 1.00 mm, are used to adjust the
distance between the slit pairs. Shims are placed at each side and throughout the gap to ensure
uniform and controlled gap opening. Low torque is used when fastening the flame gap on the
flame gap plate to not squeeze the flame gap together, making the gap opening smaller than
intended or not uniform.
The procedure for adjustment of flame gap opening is given in Appendix B.
All slits used in the experimental work has equal dimensions. Slits shown in Figure 3-4 have
the dimensions tabulated in Table 3-1.
Table 3-1: Dimensions of slits used to create the flame gap in this thesis.
Specification Measure
Length of slit (mm) 25.0
Width of slit (mm) 56.3
Thickness of slit (mm) 5.0
Thermocouple
positioned 2 cm
over gap orifice
Thermocouple
positioned 4 cm over
gap orifice

31
Figure 3-4: A pair of slits with dimensions tabulated in Table 3-1.
Different materials have been used to fabricate slits used in this thesis. Some material and slit
specifications are presented in Table 3-2.
Table 3-2: Properties of the different slits materials used. Values from [14] and [32].
Material property
(25°C)
Slit material
Carbon
steel Brass
1 Aluminium
Polyoxy-
methylene
(POM)
Weight of slit pair
(g) 159.0 169.4 53.2 28.0
Thermal conductivity
(W/m°C) 45 96 202 0.36
Specific Heat
(J/g°C) 0.49 0.38 0.90 1.46
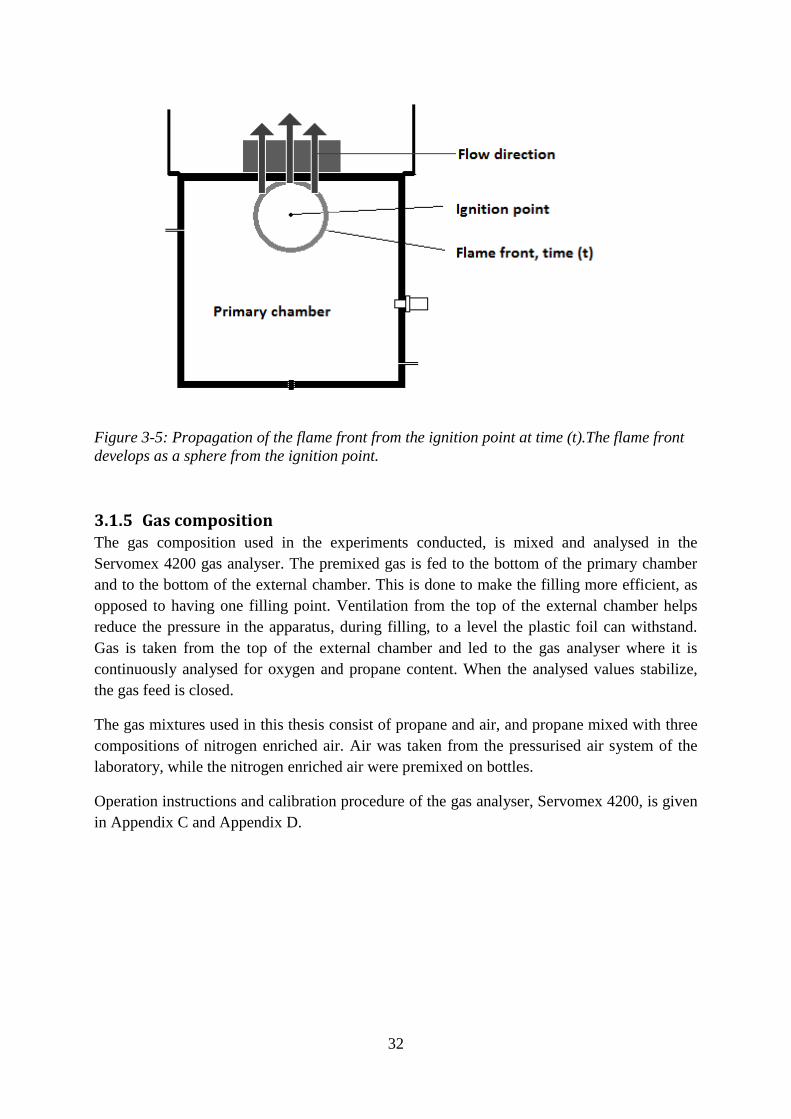
3.1.4 Flow in the PRSA Ignition in the primary chamber leads to spherical flame propagation. The flame front drives
unburned reactants through the flam gap due to expansion of the hot combustion products.
Pressure increases as the flame front approach the flame gap entrance. The flame is quenched
if the flame gap opening is less than the quenching distance. Hot combustion products
penetrates the gap and into the secondary chamber. An illustration of the flame front
propagation, at time t, is given in Figure 3-5.
1 The brass consists of an alloy of 58 % copper, 39 % zinc and 3 % lead.
Width Length
Thickness
32
Figure 3-5: Propagation of the flame front from the ignition point at time (t).The flame front
develops as a sphere from the ignition point.
3.1.5 Gas composition The gas composition used in the experiments conducted, is mixed and analysed in the
Servomex 4200 gas analyser. The premixed gas is fed to the bottom of the primary chamber
and to the bottom of the external chamber. This is done to make the filling more efficient, as
opposed to having one filling point. Ventilation from the top of the external chamber helps
reduce the pressure in the apparatus, during filling, to a level the plastic foil can withstand.
Gas is taken from the top of the external chamber and led to the gas analyser where it is
continuously analysed for oxygen and propane content. When the analysed values stabilize,
the gas feed is closed.
The gas mixtures used in this thesis consist of propane and air, and propane mixed with three
compositions of nitrogen enriched air. Air was taken from the pressurised air system of the
laboratory, while the nitrogen enriched air were premixed on bottles.
Operation instructions and calibration procedure of the gas analyser, Servomex 4200, is given
in Appendix C and Appendix D.

33
3.2 Measurement and control system
A tailor made data acquisition and control system for the PRSA is illustrated in Figure 3-6.
This was used in the experiments to measure temperature and pressure, and to control the
ignition source.
Operational procedures for the data acquisition system are given in Appendix E.
Computer
The PRSA
Primary chamber External chamber
Charge Meter
Kistler Type 5015
Pressure
transducer
Data Acquisition
Device
NI USB 6008
Spark generator
(UoB)
External spark
trigger
Thermocouples Spark
electrodes
Figure 3-6: The measurement and control system of the PRSA.

34
3.3 Sources of error
This chapter is based on chapter 3.9 in [31].
3.3.1 Data Acquisition system The experience from the work performed in this thesis shows that the amplification of the
measured signal is of importance. The analogue/digital converter reads all the channels and
have switches inside which chooses which channel to read. If one channel is not satisfactorily
amplified, the signal from this channel influences the signal from the next reading.
3.3.2 Gas concentration measurements Calibration of the propane analyser was done with a certified gas containing 5.00 vol. %
propane in nitrogen. Calibration of the oxygen analyser was done with regular air, according
to the manufacturer, with a calibration value of 20.95 vol. % oxygen. Zero calibration of the
analyser was done with gas containing 99.999 vol. % nitrogen. The measurements close to
these values would have the highest accuracy and as the gas mixture departs from these values
the accuracy would be somewhat lower. For mixtures far from the reference point, the
accuracy depends on the linearity between the two points or the extrapolation towards a richer
mixture. The alternative is how well the analyser calibrates for nonlinearity.
Insufficient calibration could result in uncertainties with respect to concentration
measurements. All calibration of the gas analyser has been executed in accordance with the
calibration procedure enclosed in Appendix C.
Another parameter which can have an influence on the actual gas concentration both in the
primary and external chamber is that the mixture in the chambers may not always be
homogenous.
3.3.3 Air humidity The propane used in the experiments is mixed with air from the local pressurised air system.
No measurements of humidity are done, but the air is filtrated and dried in a unit downstream
the air compressor. In any case the quality of the air is not documented and pollution in form
of oil, dust particles or water may exist in the supplied air. This may have effects on the
results.
3.3.4 Pressure There is uncertainty in the pressure readings due to the resolution of the pressure transducer.
Kistler, the manufacturer of the piezoelectric transducer and amplifier, states that the accuracy
of the measurement is ≤ ± 0.08 % of Full Scale Output when the calibration range is in the
area of 0 to 25 bar. This gives an accuracy of ± 0.02 bar at the used measuring range, which is
well within acceptable limits.
The pressure transducer is mounted a fixed distance at the vertical chamber wall of the
primary chamber. The transducer does not detect local pressure gradients in the chamber.

35
3.3.5 Temperature The thermocouples used in this work are not constructed to measure temperatures in
explosions (or jets). The extremely rapid increase in temperature, due to the explosion, causes
some uncertainty to the measured temperature. It is assumed that the temperature difference
measured between different experiments is valid.
3.3.6 Condensed water After a few explosions water will typically condense on the inside of the walls of the primary
chamber and may represent a significant source of error. Water may evaporate from the warm
vessel walls during gas filling and the subsequent period of turbulence settling, altering the
gas composition. Water in the gas mixture may affect reaction mechanisms and heat capacity,
whereas a small portion of the water at the vessel walls may evaporate during the explosion. It
is assumed that the explosions will be too rapid for significant amounts of water to evaporate.
3.3.7 Experiments There are uncertainties due to construction tolerances in size of volumes, ignition positions
and flange diameters and distances. In addition, there is accuracy related to the experimental
work, although good experimental procedures would counteract this.
The dimension of the distance shims is observed to have a variation of approximately +/- 1
hundredth of a millimetre.

36

37
4 Experimental results and discussion
In this chapter the results and discussions from the experimental work are presented. The
experiments have been carried out in the Plain Rectangular Slit Apparatus with propane as the
fuel gas. Figure 4-1 shows an example of an explosion propagated from the primary chamber
to the external chamber. Combustion gas from the explosion in the primary chamber ignites
the explosive atmosphere in the external chamber.
Figure 4-1: Explosion propagation in the PRSA. Experiment performed using steel-slits with
1.01 mm gap opening, in air with 4.20 vol. % propane. The black spot on the external
chamber is due to fastening of thermocouples during assembling.
38
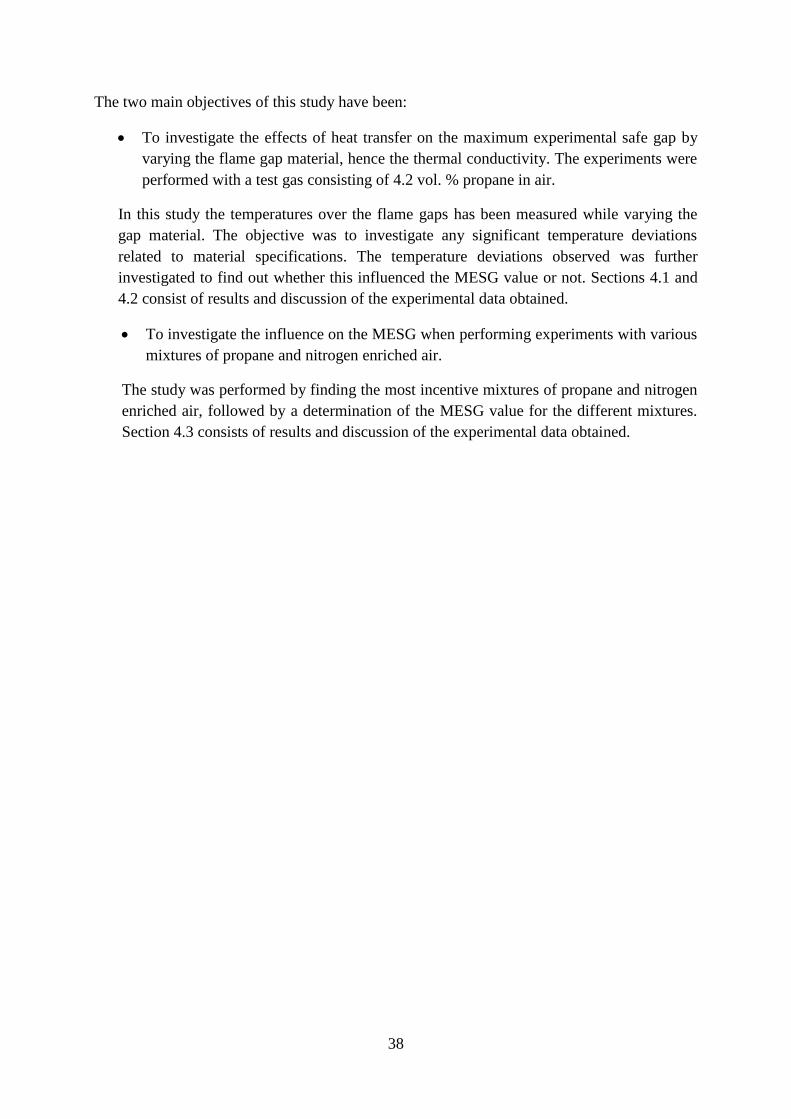
The two main objectives of this study have been:
To investigate the effects of heat transfer on the maximum experimental safe gap by
varying the flame gap material, hence the thermal conductivity. The experiments were
performed with a test gas consisting of 4.2 vol. % propane in air.
In this study the temperatures over the flame gaps has been measured while varying the
gap material. The objective was to investigate any significant temperature deviations
related to material specifications. The temperature deviations observed was further
investigated to find out whether this influenced the MESG value or not. Sections 4.1 and
4.2 consist of results and discussion of the experimental data obtained.
To investigate the influence on the MESG when performing experiments with various
mixtures of propane and nitrogen enriched air.
The study was performed by finding the most incentive mixtures of propane and nitrogen
enriched air, followed by a determination of the MESG value for the different mixtures.
Section 4.3 consists of results and discussion of the experimental data obtained.

39
4.1 Temperature measurement above flame gaps
Slits with different thermal properties were fabricated and tested in the PRSA. Some of the
material properties are listed in Table 3-2. A combustible gas consisting of 4.2 vol. % propane
in air was used for the tests.
Temperature measurements in the external chamber were performed at two altitudes, 2 cm
and 4 cm, directly over the flame gap opening. A minimum of 5 consecutive experiments was
conducted to ensure the temperature measured was repetitive. The temperatures presented are
mean values from experiments not causing re-ignition in the external chamber.
4.1.1 Results Slits made out of brass, aluminium and carbon steel were examined at two gap openings.
Brass slits with gap opening of 0.98 mm caused re-ignition in the external chamber and is not
included in Table 4-1.
Table 4-1: Mean temperature measured over the flame gap in the external chamber of the
PRSA. Test gas of 4.2 vol. % propane in air.
Gap opening (mm) Slit material
Temperature (°C)
at measuring distance
2 cm 4 cm
0.95 Brass 316.3 246.0
0.95 Aluminium 298.7 225.9
0.95 Steel 285.1 209.6
0.98 Aluminium 325.2 241.8
0.98 Steel 316.3 228.1
Slits made out of brass gave the highest temperature readings and steel slits gave the lowest
readings, as seen in Table 4-1. With a gap opening of 0.95 mm, the temperature 2 cm over the
flame gap was 316.3°C for brass slits, while for steel slits a temperature of 285.1°C was
obtained. When increasing the gap opening to 0.98 mm, use of brass slits caused re-ignition in
the secondary chamber, and the results could not be used. Aluminium slits gave temperature
readings between values for steel slits and brass slits, when the gap opening was 0.95 mm.
Slits of polyoxymethylene (POM) were temperature measured using two gap openings, 0.98
mm and 1.01 mm. Experiments were conducted 3 times at each gap opening. The reason for
this was that when examining the POM slits after 3 consecutive trials, melting had started to
occur at the gap entrance. The surface of the gap was smoothed by the heat of the combustion
products, compared to new slits. No re-ignitions in the external chamber were observed while
testing POM slits at these gap openings.

40
Table 4-2: Temperature measurements over flame gap of POM.
Gap opening (mm)
Test
number Slit material
Temperature (°C)
at measuring distance
2 cm 4 cm
0.98 1 POM 365.6 298.8
0.98 2 POM 370.0 295.1
0.98 3 POM 382.2 309.0
1.01 1 POM 407.3 N/A
1.01 2 POM 412.5 N/A
1.01 3 POM 438.7 N/A
Table 4-2 shows temperature measured over the POM flame gap, using two measuring
distances and conducting three tests for each gap opening. The experiments show an increase
of temperature during the test series.
Figure 4-2: Temperature measurements over flame gaps made of different materials, using
two measuring distances and two gap openings. The figure shows the mean temperature and
standard deviation.
Figure 4-2 show mean temperatures measured at the two heights above the gap orifice.
Temperature values for steel, brass and aluminium are included, while temperature values for
POM is not included in Figure 4-2 because of the varying measurements tabulated in Table
4-2.
205,0
210,0
215,0
220,0
225,0
230,0
235,0
240,0
245,0
250,0
280,0 290,0 300,0 310,0 320,0 330,0 340,0
Tem
pe
ratu
re 4
cm
ab
ove
fla
me
gap
(°C
)
Temperature 2 cm above flame gap (°C)
Brass 0.95
Alu 0.95
Steel 0.95
Alu 0.98
Steel 0.98

41
4.1.2 Discussion Temperature measurements of the hot combustion gas in the external chamber gave dissimilar
temperature measurements, with different flame gap materials. Measurements over brass slits,
with a gap opening of 0.95 mm showed higher readings of temperature than over aluminium
and brass. Heat transfer across materials of high thermal conductivity occurs at a higher rate
than across materials of low thermal conductivity, see section 2.6.2.
The thermal conductivities of the flame gap materials are tabulated in Table 3-2. With carbon
steel having 45 W/m°C, brass 96 W/m°C and aluminium 202 W/m°C. It could be expected
that flame gaps made of metals with high thermal conductivity has higher conductive heat
transfer, compared to materials with low thermal conductivity. The high thermal conductivity
should then cause the jet to lose some of its energy, and emerge with a lower temperature. It is
clear that other factors influence the heat transfer to the gap and that conductivity is of minor
importance. A possible explanation for the findings of higher temperatures over brass slits is
oxidation of the gap surface of the brass. Oxidation of brass occurs when the copper molecule
comes in contact with oxygen. This process may affect the heat transfer ability of the brass
surface in such way that the heat loss of the jet decrease.
The temperature of a jet emerging from a gap is of importance of the MESG value of the gas.
The re-ignition occurring at 0.98 mm, when brass slits were used, supports the findings of
higher temperatures over brass slits, compared to slits of steel and aluminium, at gap opening
of 0.95 mm.
Temperature values measured, using the same gap opening, can be compared. When
comparing the data in Table 4-1 and Table 4-2, it can be seen that temperatures measured
above POM slits, with gap opening of 0.98 mm, are larger than comparable temperatures over
the metal gaps. Thermal conductivity of POM is 0.36 W/m°C, 1/125 of the value of steel.
This may cause the jet to emerge at a higher temperature, thus having insulating properties.
Table 4-2 show a systematic increase of measured temperature over POM slits, from test
number 1 to test number 3. Electro microscopic photos show a smoothing of the gap surface
occurring during tests. See Appendix J for comparable photos of new and tested POM slits.
From 2.6.3, a smoother surface, will decrease the heat transfer coefficient and lead to
decreased heat loss. The increase of temperature may be the result of reduced friction inside
the gap, due to the smoothing.
When increasing the gap opening, a temperature increase for both the steel slits and the
aluminium slits are observed. The temperature of the jet is a result heat loss to the walls and
heat generated in the combustion. When the gap opening is increased, the wall area in contact
with the jet, relative to the mass of the jet is decreased. Hence the temperature of the jet is
increased.

42
4.2 Experiments with slits in mixture of propane and air
Of the metal gaps examined, steel and brass flame gaps gave temperature readings with the
largest spread. The slits were examined further to find out what influence they had on the
MESG value. The value was found according to the IEC test method for maximum
experimental safe gap, described in section 2.5.5. Ten explosion experiments were performed
at each gap opening. The highest value of gap, g0, at which there is 0 % probability of ignition
in the external chamber, is defined as the MESG value of the gas.
Obtained MESG value using steel-slits in regular air was 0.98 mm as shown in Table 4-3. The
value coincide with the MESG previously reported by Solheim [31]. A gap opening of 0.97
mm gave two re-ignitions, while a gap opening of 0.98 mm gave zero re-ignitions. The lowest
gap, g100, giving 100 % probability of ignition was 1.01 mm.
Table 4-3: Experiments with steel-slits.
Gap opening
(mm)
Ignition
distance (mm)
Number of
experiments
Number of re-
ignitions
Mean pressure
(barg)
0.97 14 10 0 2.32
0.98 14 10 0 2.29
0.99 14 10 2 2.22
1.00 14 10 8 2.23
1.01 14 10 10 2.33
The MESG value found using brass-slits in regular air was found to be 0.97 mm as shown in
Table 4-4. The gap opening of 0.98 mm gave three re-ignitions while gap opening of 0.97 mm
gave zero re-ignitions. The lowest gap, g100, giving 100 % probability of ignition was 1.00
mm.
Table 4-4: Experiments with brass-slits.
Gap opening
(mm)
Ignition
distance (mm)
Number of
experiments
Number of re-
ignitions
Mean pressure
(barg)
0.97 14 10 0 2.34
0.98 14 10 4 2.31
0.99 14 10 9 2.18
1.00 14 10 10 2.23
1.01 14 10 10 2.34
From Table 4-3 and Table 4-4, it can be seen that values for g100 and g0 are 0.01 mm less for
brass compared to the experimental data of steel. This indicates equally reliable values,
according to IEC [5].

43
4.2.1 Discussion The MESG value obtained, for the most incentive mixture of propane in air, when using brass
slits compared to value obtained when using steel slits are not equal. MESG value using steel
slits were observed to be 0.98 mm, while using brass slits 0.97 mm, a deviation of 0.01 mm.
Brass gives a lower value, as expected from experiments discussed in 4.1.2.
When examining the slit surface of the two flame gaps, there are no readily apparent
deviations between the two surfaces. The slits are milled using the same equipment; the
surface roughness is of equal dimension, 2.0 µm [29]. This value is well within the IEC
requirement of < 6.3 µm. Electro microscopic photography of the two slit surfaces show no
significant deviance between the surfaces. See Appendix J for comparable photo. There may
be some small surface damages on the steel slit surface which can be related to increased
turbulence in the flame gap. This can lead to increased heat loss to the gap walls and explain
the higher MESG value.
According to the IEC standard, the maximum gap opening for flameproof enclosures, with the
dimensions of the test apparatus used in this thesis, is 0.40 mm [5]. The material properties of
the flameproof gaps of metal, tested in this thesis, are of minor importance to the MESG value
of propane.
The pressure measurements show that the mean minimum pressure is obtained when
probability of re-ignition is between 20 % and 9 0%. For steel slits the value is obtained at
0.99 mm and 20 % re-ignition probability while for brass slits it is obtained at 0.99 mm and
90 % re-ignition probability. When re-ignition probability is 100 %, measurements show that
the maximum pressure in the primary chamber increases, despite a larger gap opening. Re-
ignition in the external chamber increases the pressure above the gap orifice resulting in a
decreased pressure difference between the primary chamber and the external chamber. Fluids
moves from high pressure toward low pressure areas. The pressure difference leads to a
higher maximum pressure in the primary chamber, which may be caused by the increased
pressure in the external chamber. The same phenomenon can be seen in pressure
measurements in the following section, 4.3.

44
4.3 Experiments with steel slits in mixture of propane and nitrogen
enriched air
The experiments were done with three nitrogen-oxygen mixtures with unlike mixture rates.
These mixtures contained less oxygen than air. Propane was used as fuel gas, in all trials, and
mixed with nitrogen-oxygen according to the experimental procedure in Appendix D.
Due to limited amount of the nitrogen enriched air, trials performed has not been done with 10
consecutive trials for each tested gap opening. However, the MESG value found is verified
with 10 consecutive tests.
The procedure done to find the MESG value is in accordance with the IEC Standard [5] for
gas and vapour classification, regarding test methods and data. Pressure measurements were
conducted using a fixed gap opening and varying the concentration of propane starting at a
concentration around stoichiometric value. See Appendix G for calculation of the
stoichiometric values of propane in the three nitrogen-oxygen mixtures. The pressure
measurements were done to find the concentration value of propane providing the maximum
pressure, indicating the most incentive mixture [27].
Preliminary tests were made by adjusting the gap opening several times and varying the
concentration of propane. The tests were done to establish the highest gap with 0 %
probability of ignition and the lowest gap with 100 % probability of ignition. The indicated
most incentive mixture, found using pressure measurements, was used as a basis for propane
concentration in the mixture.
The highest gap, g0, found during preliminary tests was examined with 10 consecutive trials,
using concentrations close to the most incentive mixture found in the preliminary test, as
specified in the IEC Standard. If no re-ignition occurred during these test series, g0 was
established as the gas MESG value.

45
4.3.1 Measurements of oxygen content in test gas Three test gases, containing different ratios of N2 and O2 were used in the following
experiments. The oxygen content was measured using the gas analyser, succeeding two
complete calibration procedures. The two measurements were done one week apart and found
to be equal. Values are tabulated in Table 4-5.
Table 4-5: Measured oxygen content and calculated nitrogen content in the three test gases.
Mixture Vol. % O2 Vol. % N2
ii. 19.00 81.00
iii. 16.77 83.23
iv. 15.04 84.96
The stoichiometric values of propane in the three mixtures are presented in Table 4-6.
Calculations are described in Appendix G. As shown in section 2.5.4, the stoichiometric
mixture may differ from the most incentive mixture.
Table 4-6: Stoichiometric mixtures of fuel and nitrogen enriched air.
Mixture Vol. % C3H8 Vol. % O2 Vol. % N2
ii. 3.66 18.30 78.03
iii. 3.25 16.23 80.53
iv. 2.92 14.60 82.48

46
4.3.2 Oxygen content of 19.00 volume percentage Figure 4-3 shows pressure measurement in experiments with mixture ii from Table 4-5, and
variable propane concentration. The most incentive mixture, basis for propane concentration
is found to be 3.85 vol. % propane.
Figure 4-3: Pressure measurements in explosion experiments with mixture containing
propane and air with 19.00 vol. % oxygen. A gap opening of 1.00 mm and ignition distance of
14 mm were used.
Experiments were conducted as described in section 4.3, varying the gap opening to find
value for g0. Ten consecutive experiments with concentrations neighbouring the most
incentive mixture with gap opening of 1.21 mm gave no re-ignitions, shown in Table 4-7. The
MESG value found is therefore 1.21 mm.
Table 4-7: Experiments with steel-slits in mixture of propane and air with 19.00 vol. %
oxygen.
Gap opening
(mm)
Ignition
distance (mm)
Number of
experiments
Number of re-
ignitions
Mean pressure
(barg)
1.20 14 3 0 1.23
1.21 14 10 0 1.21
1.22 14 13 4 1.22
1.23 14 7 3 1.24
1.25 14 3 3 1.19
0,00
0,20
0,40
0,60
0,80
1,00
1,20
1,40
1,60
3,20 3,40 3,60 3,80 4,00 4,20 4,40 4,60 4,80 5,00
p (
bar
g)
Vol. % propane

47
Figure 4-4 show pressure measurements during preliminary tests. Pressure increase is
observed when increasing the gap opening from g0 to g100, then decrease from g100.
Figure 4-4: Pressure measurements with 3.85 vol. % propane in mixture.
4.3.3 Oxygen content of 16.77 volume percentage Figure 4-5 shows pressure measurements in experiments with mixture iii from Table 4-5, and
variable propane concentration. The most incentive mixture, basis for propane concentration
is found to be 3.45 vol. % propane.
Figure 4-5: Pressure measurements in explosion experiments with mixture containing
propane and air with 16.77 vol. % oxygen, using a gap opening of 1.20 mm and ignition
distance of 14 mm.
0,90
0,95
1,00
1,05
1,10
1,15
1,20
1,25
1,10 1,15 1,20 1,25 1,30 1,35
p (
bar
g)
Gap opening (mm)
0,00
0,05
0,10
0,15
0,20
0,25
0,30
0,35
0,40
0,45
0,50
3,00 3,10 3,20 3,30 3,40 3,50 3,60 3,70
p (
bar
g)
Vol. % propane
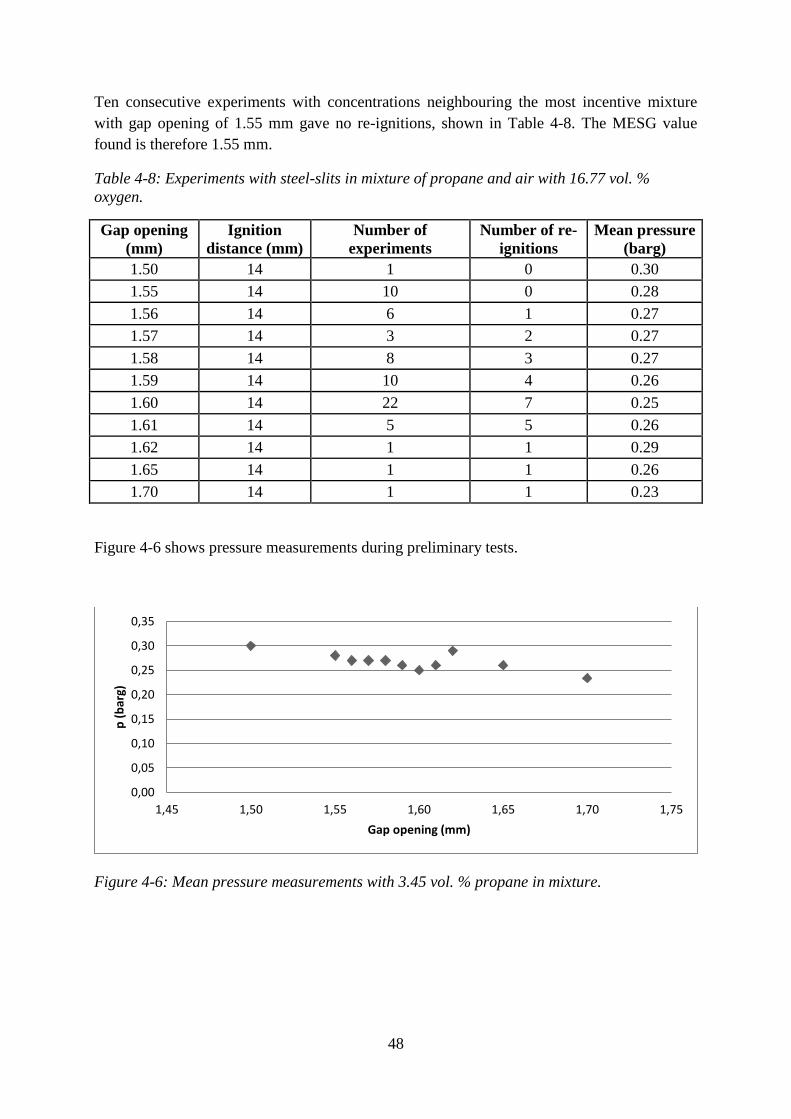
48
Ten consecutive experiments with concentrations neighbouring the most incentive mixture
with gap opening of 1.55 mm gave no re-ignitions, shown in Table 4-8. The MESG value
found is therefore 1.55 mm.
Table 4-8: Experiments with steel-slits in mixture of propane and air with 16.77 vol. %
oxygen.
Gap opening
(mm)
Ignition
distance (mm)
Number of
experiments
Number of re-
ignitions
Mean pressure
(barg)
1.50 14 1 0 0.30
1.55 14 10 0 0.28
1.56 14 6 1 0.27
1.57 14 3 2 0.27
1.58 14 8 3 0.27
1.59 14 10 4 0.26
1.60 14 22 7 0.25
1.61 14 5 5 0.26
1.62 14 1 1 0.29
1.65 14 1 1 0.26
1.70 14 1 1 0.23
Figure 4-6 shows pressure measurements during preliminary tests.
Figure 4-6: Mean pressure measurements with 3.45 vol. % propane in mixture.
0,00
0,05
0,10
0,15
0,20
0,25
0,30
0,35
1,45 1,50 1,55 1,60 1,65 1,70 1,75
p (
bar
g)
Gap opening (mm)
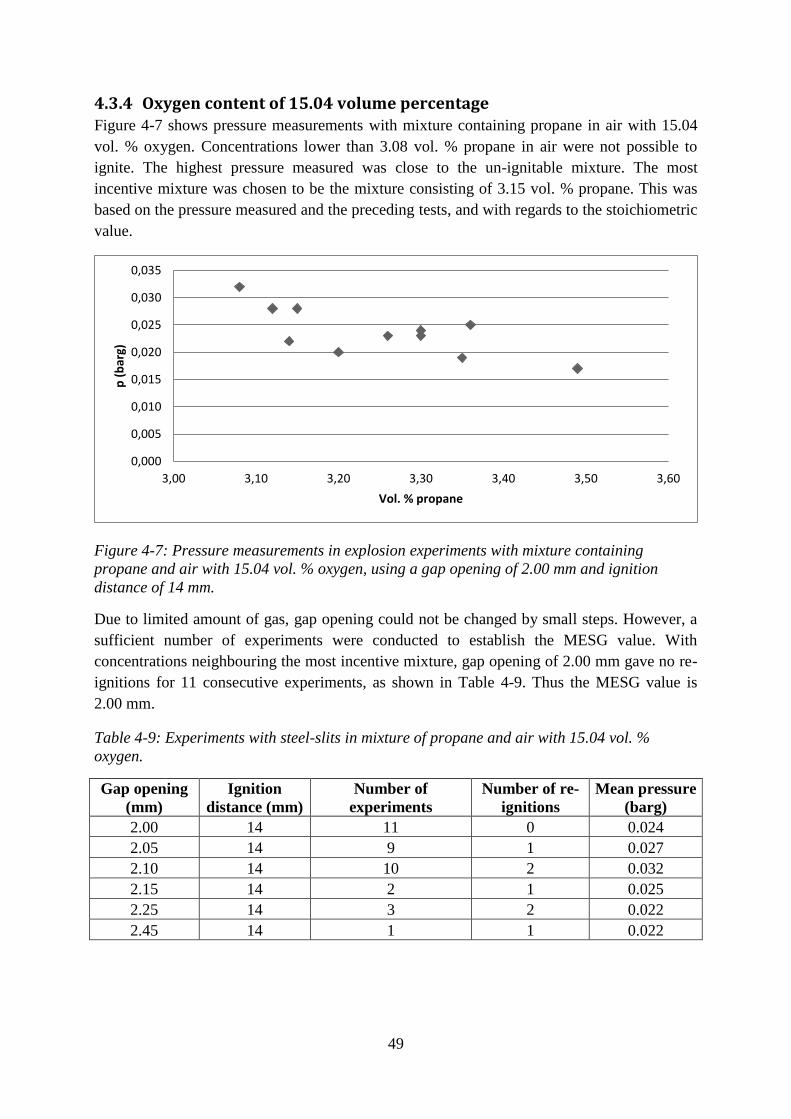
49
4.3.4 Oxygen content of 15.04 volume percentage Figure 4-7 shows pressure measurements with mixture containing propane in air with 15.04
vol. % oxygen. Concentrations lower than 3.08 vol. % propane in air were not possible to
ignite. The highest pressure measured was close to the un-ignitable mixture. The most
incentive mixture was chosen to be the mixture consisting of 3.15 vol. % propane. This was
based on the pressure measured and the preceding tests, and with regards to the stoichiometric
value.
Figure 4-7: Pressure measurements in explosion experiments with mixture containing
propane and air with 15.04 vol. % oxygen, using a gap opening of 2.00 mm and ignition
distance of 14 mm.
Due to limited amount of gas, gap opening could not be changed by small steps. However, a
sufficient number of experiments were conducted to establish the MESG value. With
concentrations neighbouring the most incentive mixture, gap opening of 2.00 mm gave no re-
ignitions for 11 consecutive experiments, as shown in Table 4-9. Thus the MESG value is
2.00 mm.
Table 4-9: Experiments with steel-slits in mixture of propane and air with 15.04 vol. %
oxygen.
Gap opening
(mm)
Ignition
distance (mm)
Number of
experiments
Number of re-
ignitions
Mean pressure
(barg)
2.00 14 11 0 0.024
2.05 14 9 1 0.027
2.10 14 10 2 0.032
2.15 14 2 1 0.025
2.25 14 3 2 0.022
2.45 14 1 1 0.022
0,000
0,005
0,010
0,015
0,020
0,025
0,030
0,035
3,00 3,10 3,20 3,30 3,40 3,50 3,60
p (
bar
g)
Vol. % propane

50
Figure 4-8: Pressure measurements with 3.15 vol. % propane in mixture.
In Figure 4-9 a typical pressure development in the primary chamber during experiments with
3.15 vol. % propane in mixture is shown. The occurrence of two pressure tops followed by a
pressure reduction can be seen.
Figure 4-9: Typical pressure measurement in the primary chamber during experiments with
3.15 vol. % propane in mixture.
4.3.5 Discussion As pointed out in section 2.7.4 the MESG is dependent on three factors;
The temperature of the jet of hot combustion gas.
The rate of combustion.
The relative rate of entrainment of ambient mixture into the jet, relative to the mass of
the jet.
The main observation from the experiments is that when decreasing the oxygen concentration
and increasing the nitrogen concentration in the mixtures, the MESG value increase, as shown
in Figure 4-10.
0,000
0,005
0,010
0,015
0,020
0,025
0,030
0,035
1,80 1,90 2,00 2,10 2,20 2,30 2,40 2,50
p (
bar
g)
Gap opening (mm)
-0,1
-0,08
-0,06
-0,04
-0,02
0
0,02
0,04
1
12
23
34
45
56
67
78
89
10
0
11
1
12
2
13
3
14
4
15
5
16
6
17
7
18
8
19
9
21
0
22
1
23
2
24
3
25
4
26
5
27
6
28
7
29
8
30
9
Pre
ssu
re (
bar
g)
Sampling, 250 Hz
1 2

51
Figure 4-10: MESG values for propane in nitrogen enriched air, in terms of oxygen
concentration in the air.
Table 4-10 shows a summary of the results obtained in present section. The most incentive
mixtures are tabulated with their respectable MESG values, determined experimentally. It can
be mentioned that the most incentive mixture value of propane is found to be above the
stoichiometric value for all mixtures.
According to the IEC standard, the maximum gap opening for flameproof enclosures, with the
dimensions of the test apparatus used in this thesis, is 0.40 mm [13]. For equipment intended
to be used in a hypoxic environment, the requirement of maximum gap opening can be said to
be strict. This requirement comes with a large margin of safety, if implemented in a future
standard for hypoxic environments.
Table 4-10: MESG values and most incentive mixtures of propane and different nitrogen-
oxygen mixtures.
Mixture Vol. % C3H8 Vol. % O2 Vol. % N2 MESG (mm)
i. 4.20 20.07 75.73 0.98
ii. 3.85 18.27 77.88 1.22
iii. 3.45 16.19 80.36 1.55
iv. 3.15 14.57 82.28 2.00
Increasing nitrogen content in the mixture decreases the reactivity, hence lowers the explosion
pressure in the primary chamber. A pressure difference of approximately 2.25 barg is
measured at MESG values of mixture i and mixture iv. As indicated in section 2.7.4, when
nitrogen content is at the levels examined, the flow through the flame gap is subsonic. A
decrease in explosion pressure causes lower jet velocity and a decreased relative rate of
entrainment. This contributes to increased probability of ignition. The jet temperature and the
reactivity of the mixture are reduced when increasing the nitrogen content because of the
effect on the combustion rate. This contributes to decreased probability of ignition. When
increasing the gap opening, this results in a bigger jet orifice. The relative rate of entrainment
is then increased so that ignition occurs at a bigger gap opening.
0,80
1,00
1,20
1,40
1,60
1,80
2,00
14,0 15,0 16,0 17,0 18,0 19,0 20,0 21,0
MES
G v
alu
e (
mm
)
Oxygen content in air (vol. %)

52
Pressure measurements in experiments with propane in mixture with an oxygen content of
15.04 vol. % resulted in two pressure tops in the primary chamber. An ignition of an
explosive mixture in the primary chamber will lead to a spherical flame front propagating
toward the flame gap, shown in section 3.1.4. The explosion products cause pressure to
increase in the primary chamber. When the flame front reaches the flame gap, a pressure top
can be seen in Figure 4-9, labelled 1. The flame front propagates through the flame gap and is
quenched, followed by explosion products flowing through the gap. Escaping explosion
products causes lowering of pressure in the primary chamber. A sudden pressure drop might
induce turbulence causing the burning rate to increase, causing another pressure top, labelled
2. This result might indicate that the ignition position is not optimal. If the ignition source
were positioned further from the gap entrance, the maximum pressure could be higher. This as
a result of a larger spherical flame front developing prior the flame front reaching flame gap
entrance, hence more combustion products.
Comparing experimental MESG values from this thesis and values by Lunn [25], a good
correlation is found. From Table 2-6 the limiting oxygen concentration for propane is found to
be 10.5-11.5 vol. % oxygen, depending on the test method. At this value, the MESG will have
a value of infinite. Lunn used stoichiometric values for his experimental work. This may lead
to higher MESG values compared to values found using the most incentive mixtures. The
reason for this is that the most incentive mixture is the mixture providing the smallest MESG
value as emphasised in section 2.5.4.
Figure 4-11: MESG values for propane in nitrogen enriched air and oxygen enriched air, in
terms of nitrogen concentration in the air. Experimental values from present work seen in
context with experimental values from Lunn. Lunn using stohiciometric values of propane in
oxygen enriched air [25].
0,00
0,20
0,40
0,60
0,80
1,00
1,20
1,40
1,60
1,80
2,00
40,0 50,0 60,0 70,0 80,0 90,0
MES
G v
alu
e (
mm
)
Nitrogen content in air (vol. %)
This study Lunn values

53
4.4 Adhesive tape with polyethylene coating situated in the primary
chamber
Some test experiments with hydrogen as fuel was done in the PRSA. Hydrogen is a more
reactive gas with MESG value of 0.29 mm. To make sure tests were not influenced by leaks at
the side of the flame gap, adhesive tape was attached to the flame gap plate inside the primary
chamber. Experiments resulted in variable and unreliable MESG values obtained. This
indicated that the adhesive tape influenced the combustion process.
Experiments with adhesive tape inside the primary chamber were also conducted with steel
slits in 4.20 vol. % propane in air. This was done to see how melting of plastic influence the
re-ignition in the external chamber. The experiments with adhesive tape inside the primary
chamber led to decreased MESG value for all slits tested. The gap opening providing ignitions
were inconsistent. The value of (g100 – g0) were in some cases as high as 7. According to IEC,
a value of 4, when conducting experiments with fuel in air, is to be considered an acceptable
limit for results to be reliable [5].
Table 4-11: Possible MESG values obtained for experiments with adhesive tape with
polyethylene coating situated in the primary chamber
Gap material Lowes gap with probability of
ignition > 0 % (mm)
Possible MESG value (mm)
Steel 0.98 0.97
Brass 0.95 0.94
Aluminium 0.97 0.96
POM 1.20 1.19
Table 4-11 gives an indication of the minimum gap opening obtained in the PRSA, with
variable slit material, providing explosion in the external chamber. Possible MESG values are
tabulated.
A readily available explanation for the results is hard to find. Melting of the polyethylene
coating was observed; hence gases may interfere with the combustion process, increasing the
reactivity of the reaction.

54
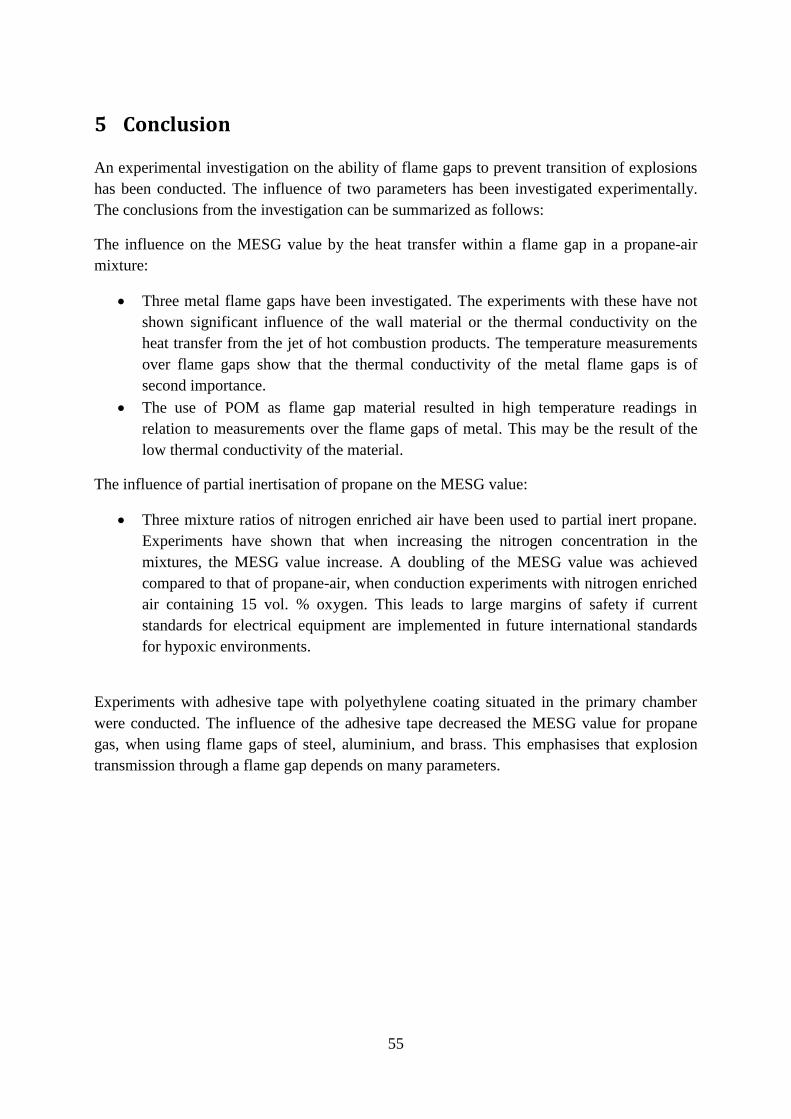
55
5 Conclusion
An experimental investigation on the ability of flame gaps to prevent transition of explosions
has been conducted. The influence of two parameters has been investigated experimentally.
The conclusions from the investigation can be summarized as follows:
The influence on the MESG value by the heat transfer within a flame gap in a propane-air
mixture:
Three metal flame gaps have been investigated. The experiments with these have not
shown significant influence of the wall material or the thermal conductivity on the
heat transfer from the jet of hot combustion products. The temperature measurements
over flame gaps show that the thermal conductivity of the metal flame gaps is of
second importance.
The use of POM as flame gap material resulted in high temperature readings in
relation to measurements over the flame gaps of metal. This may be the result of the
low thermal conductivity of the material.
The influence of partial inertisation of propane on the MESG value:
Three mixture ratios of nitrogen enriched air have been used to partial inert propane.
Experiments have shown that when increasing the nitrogen concentration in the
mixtures, the MESG value increase. A doubling of the MESG value was achieved
compared to that of propane-air, when conduction experiments with nitrogen enriched
air containing 15 vol. % oxygen. This leads to large margins of safety if current
standards for electrical equipment are implemented in future international standards
for hypoxic environments.
Experiments with adhesive tape with polyethylene coating situated in the primary chamber
were conducted. The influence of the adhesive tape decreased the MESG value for propane
gas, when using flame gaps of steel, aluminium, and brass. This emphasises that explosion
transmission through a flame gap depends on many parameters.

56

57
6 Recommendations for further work
The experimental work in this thesis has showed some of the effects material properties have
on the efficiency of flame gaps. It has also shown the effects of lowering oxygen
concentration, in an explosive gas mixture, on the MESG value. Verification experiments and
experiments with other flame gap materials and gas properties are needed to provide final
conclusions. Suggestions for further work in conjunction with experimental work done in this
thesis:
Experiments with other flame gap material. Usage of flame gaps made of more heat
resistant material with low conductivity, to further investigate the relation between
heat transfer within the flame gap and the MESG value.
Investigate the effect of groves milled in materials of low thermal conductivity.
Grooves leads to increased turbulence in the flame gap which may contribute to larger
heat loss.
Simulate experiments using computational fluid dynamics.
Redesign the apparatus in such way that temperature measurements inside the flame
gap are possible. This can help to better understand where the heat transfer occurs, and
if the main cooling of the jet is situated in the external chamber.
Investigate the effect of obstructions or plastics inside the primary chamber.
Preliminary experiments showed that the MESG were affected by adhesive tape inside
the primary chamber of the PRSA.
Conduct experiments with nitrogen enriched air, to further investigate the effect of
increased reactivity on the MESG value.
Examine the influence of the ignition position in the primary chamber. To investigate
the effect of increased and reduced distance between the ignition source and the flame
gap entrance, on the MESG values obtained for nitrogen enriched air.
Suggestions for further work using experimental apparatus and procedures in this study:
Investigate the effect of metal dust inside the flame gap, and the influence it may have
on re-ignition in the external chamber.
Perform experiments with obstructions just outside the flame gap orifice, to see if it
affects the MESG value and the re-ignition in the external chamber.

58

59
7 References
1. Hattwig, M.S., H, Handbook of Explosion Prevention and Protection 2004.
2. Nolan, D.P., Handbook of fire and explosion protection engineering principles: for
oil, gas, chemical and related facilities2011, London: Elsevier. XVI, 324 s.
3. CEAG, Principles of Explosion-Protection, 2012.
4. Eckhoff, R.K., Explosion hazards in the process industries2005, Houston, Tex.: Gulf
Publishing. XI, 439 s.
5. International Electrotechnical Commission., IEC 60079-20-1, in Explosive
atmospheres - Part 20-1: Material characteristics for gas and vapour
classification2010.
6. International Electrotechnical Commission. Electropedia. 2012; Available from:
http://www.electropedia.org.
7. International Electrotechnical Commission., IEC 60079-0, in Explosive atmospheres -
Part 0: Equipment - General requirements2010.
8. Eckhoff, R.K., Dust explosions in the process industries2003, Amsterdam: Gulf
Professional Pub. xxi, 719 s.
9. Zukas, J.A. and W.P. Walters, Explosive effects and applications1998, New York:
Springer. XV, 431 s.
10. Groh, H., Explosion protection: electrical apparatus and systems for chemical plants,
oiland gas industry, coal mining2004, Amsterdam: Elsevier Butterworth-Heinemann.
XV, 524 s.
11. International Electrotechnical Commission., IEC 60079-19, in Explosive atmospheres
- Part 19: Equipment repair, overhaul and reclamation.2010.
12. Williams, F.A., Combustion theory : the fundamental theory of chemically reacting
flow systems1985, Menlo Park, Calif.: Benjamin/Cummings. xxiii, 680 s., ill.
13. International Electrotechnical Commission., IEC 60079-1 in Explosive atmospheres -
Part 1: Equipment protection by flameproof enclosures "d"2011.
14. McCabe, W.L., P. Harriott, and J.C. Smith, Unit operations of chemical
engineering2005, Boston: McGraw-Hill. XXV, 1140 s.
15. Incropera, F.P. and D.P. DeWitt, Fundamentals of heat and mass transfer2002, New
York: Wiley. XIX, 981 s.
16. Tennekes, H. and J.L. Lumley, A first course in turbulence1972, Cambridge, Mass.:
MIT Press. XII, 300 s.
17. Butler, K.M., A Computational Model of Dissipation of Oxygen from an Outward
Leak of a Closed-Circuit Breathing Device. National Institute of Standards and
Technology Technical Note 1484, 2007(June 2007): p. 41.
18. Zlochower, I.A.I., The limiting oxygen concentration and flammability limits of gases
and gas mixtures. Journal of loss prevention in the process industries, 2009. 22(4): p.
499-505.
19. Kuchta, J.M., Investigation of fire and explosion accidents in the chemical,mining, and
fuel-related industries – a manual. U.S. Bureau of Mines Bulletin, 1985. 680: p. 84.
20. Kondo, S., Takizawa, K., Takahashi, A., Tokuhashi, K., & Sekiya, A., A study on
flammability limits of fuel mixtures. Journal of Hazardous Materials, 2008. 155.
21. Yumlu, V.S., The effects of additives on the burning velocities of flames and their
possible prediction by a mixing rule. Combustion and Flame, 1968. 12(1): p. 14-18.
22. Movileanu, R.J.R., Additive Effects on the Burning Velocity of Ethylene-Air Mixtures.
Energy & fuels, 2011. 25(6): p. 2444-2451.

60
23. Angerer, P. and D. Nowak, Working in permanent hypoxia for fire protection--impact
on health. International Archives of Occupational and Environmental Health, 2003.
76(2): p. 87-102.
24. Standards, B.B., PAS 95:2011 - Hypoxic air fire prevention systems. Specification.,
2011. p. 36.
25. Lunn, G.A., The maximum experimental safe gap: The effects of oxygen enrichment
and the influence of reaction kinetics. Journal of Hazardous Materials, 1984. 8(3): p.
261-270.
26. Phillips, H., The mechanism of flameproof protection, in Research Report No. 275
Safety in Mines Research Establishment (SMRE), UK (1971)1971.
27. Larsen, Ø., A study of critical dimensions of holes for transmission of gas explosions
and development & testing of a Schlieren system for studyng jets of hot combustion
products, 1998, [Ø.Larsen]: Bergen. p. XII, 115 bl.
28. Einarsen, R.I., Experimental determination of critical dimensions of holes and slits in
flameproof enclosures, for prevention of explosion transmission to external explosive
gas clouds, 2001, [R.I. Einarsen]: Bergen. p. VII, 127 b.
29. Grov, A., An experimental study of the influence of major damage offlame gap
surfaces in flameproof apparatus on the ability ofthe gaps to prevent gas explosion
transmission, 2010, A. Grov: Bergen. p. VIII, 110 s.
30. Z., O.H.E., Experimental investigation of the influence of mechanical and corrosion
damage of gap surfaces on the efficiency of flame gaps in flameproof apparatus., in
University of Bergen2010.
31. Solheim, F., An experimental investigation of the influence of mechanical damage,
rust and dust on the ability of flame gaps to prevent gas explosion transmission, 2010,
F. Solheim: Bergen. p. 101 s.
32. Zhao, X. and L. Ye, Study on the thermal conductive polyoxymethylene/graphite
composites. Journal of Applied Polymer Science, 2009. 111(2): p. 759-767.
33. Kalvatn, I.B., Experimental investigation of the optical measurement method for
detecting dust and gas flames in a flame accelerationtube: development of
experimental apparatus, 2009, I.B. Kalvatn: Bergen. p. VI, 53 s.

i
Experimental apparatus and procedures Appendix A
Experimental apparatus Type
Explosion apparatus The Plane Rectangular Slit Apparatus
Gas analyser Servomex 4200, industrial gas analyser
Computer Dell Latitude D630
DAQ NI USB 6008
Pressure transducer Kistler 701A
Charge amplifier 5015A000
Spark generator Tailor made, estimated energy 50mJ
Thermocouples Tailor made
Welding apparatus for thermocouples Tailor made
Camera Casio Exilim Ex-F1
Test gas 1 Propane (99.95 %)
Test gas 2 19 vol. % O2/ rest N2
Test gas 3 17 vol. % O2/ rest N2
Test gas 4 15 vol. % O2/ rest N2
Calibration gas Nitrogen, quality 5.0 (99.999 %)

ii
Adjustment of gap opening in the PRSA. Appendix B
The adjustment of flame gap opening must be done before any experimental procedure.
1. Disconnect all tubing from the external chamber and unscrew from primary chamber.
2. Remove the flame gap plate from the top of the external chamber.
3. Place distance shims on both sides of the gap. The shims must be placed on the sides
and to the bottom of the gap. This will ensure uniform gap opening.
4. Fasten screw 1 and 2 at the upper part of the gap. Use a torque of 20 cNm. Shown in
Figure 7-1.
5. Fasten screw 3 – 6 at the lower part of the gap. Use a torque of 20 cNm. Shown in
Figure 7-1 and Figure 7-2.
6. Fasten screw 7 – 12 at the underside of the gap. Use a torque of 1 Nm.
The reasons for using low torque on screws are to not damage the screw threads and to not
squeeze the flame gap together, making the gap opening smaller than intended or not uniform.
Figure 7-1: Screws on the fastening clamp at the upper part of the flame gap plate.
2 1
4 3

iii
Figure 7-2: Screws on the lower part of the flame gap plate.
5
6
3
4

iv
Calibration of gas analyser, Servomex 4200. Appendix C
The gas analyser is able analyse two components in the gas composition. It can measure
oxygen concentration and propane concentration. To obtain correct volume percent values,
the gas analyser must be calibrated. Two calibrations for each component are necessary.
Low level calibration:
Nitrogen gas with quality of 5.0 must be used to calibrate for a zero-level
concentration. This consists of 99.999 vol. % nitrogen.
High level calibration:
To calibrate for high level, gas with known level of oxygen/propane is used. To
calibrate for high level of oxygen, regular air can be used.
The flow to analyse must never exceed 100 ml/minute. This may ruin the paramagnetic
oxygen sensor or give false measurements.
The calibration procedure follows, see Appendix H for numbered figure of gas analyser:
1. Connect calibration gas to calibration gas inlet and turn valve (4) to “calibration gas”.
2. The first arrow (1) must be turned “to exhaust fan”, the second (2) to “calibration test
gas” and the third (3) “to HC analysis”.
3. Make sure the calibration gas inlet is chosen, and then turn on the “flow HC gas”.
4. Turn on the analysis pump.
5. The display shows the measured volume percentage of oxygen and propane in the
calibration gas. Wait for values to stabilize.
6. To correct the values press the following button combination quickly: “enter”, “quit”,
“right arrow”, “measure”, arrow up”, “menu”.
7. Choose “calibrate” by pressing “enter”. Enter the password: 1812 using the arrows,
then press “enter”.
8. Choose manual calibration, and then either oxygen or propane.
9. Choose low calibration to calibrate for 0.0000 vol. % oxygen/propane. Choose high
calibration using gas with known volume percentage of oxygen/propane.
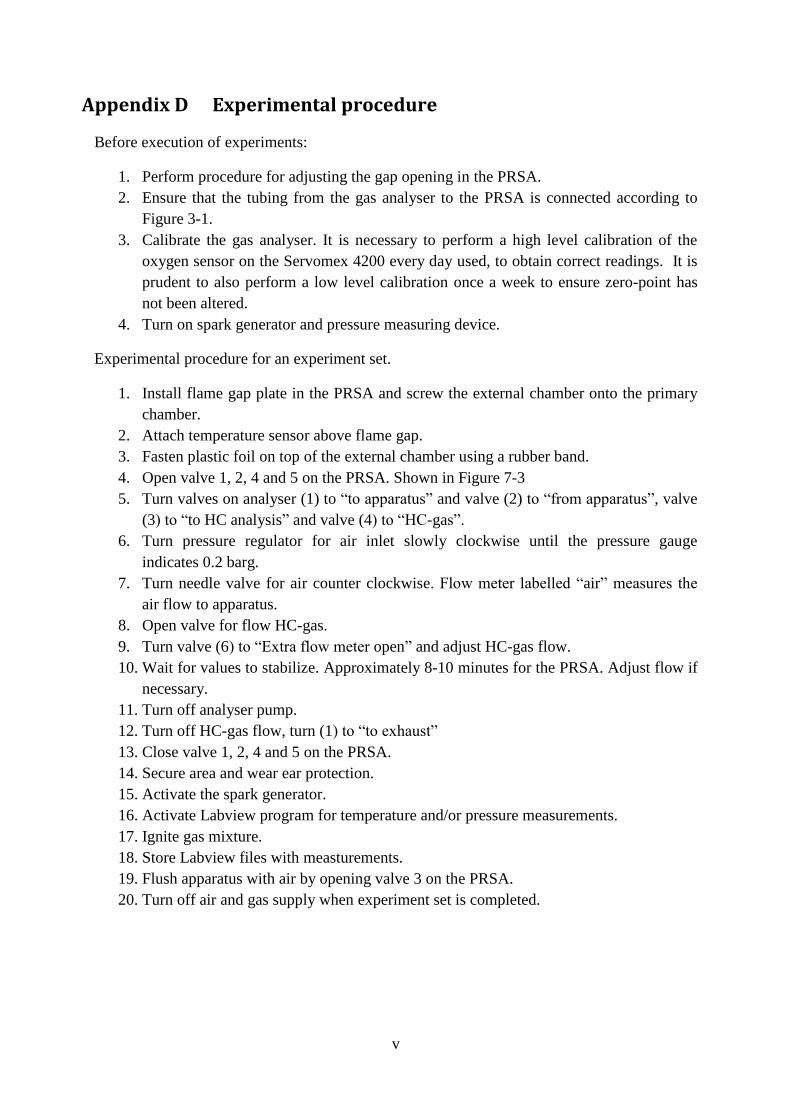
v
Experimental procedure Appendix D
Before execution of experiments:
1. Perform procedure for adjusting the gap opening in the PRSA.
2. Ensure that the tubing from the gas analyser to the PRSA is connected according to
Figure 3-1.
3. Calibrate the gas analyser. It is necessary to perform a high level calibration of the
oxygen sensor on the Servomex 4200 every day used, to obtain correct readings. It is
prudent to also perform a low level calibration once a week to ensure zero-point has
not been altered.
4. Turn on spark generator and pressure measuring device.
Experimental procedure for an experiment set.
1. Install flame gap plate in the PRSA and screw the external chamber onto the primary
chamber.
2. Attach temperature sensor above flame gap.
3. Fasten plastic foil on top of the external chamber using a rubber band.
4. Open valve 1, 2, 4 and 5 on the PRSA. Shown in Figure 7-3
5. Turn valves on analyser (1) to “to apparatus” and valve (2) to “from apparatus”, valve
(3) to “to HC analysis” and valve (4) to “HC-gas”.
6. Turn pressure regulator for air inlet slowly clockwise until the pressure gauge
indicates 0.2 barg.
7. Turn needle valve for air counter clockwise. Flow meter labelled “air” measures the
air flow to apparatus.
8. Open valve for flow HC-gas.
9. Turn valve (6) to “Extra flow meter open” and adjust HC-gas flow.
10. Wait for values to stabilize. Approximately 8-10 minutes for the PRSA. Adjust flow if
necessary.
11. Turn off analyser pump.
12. Turn off HC-gas flow, turn (1) to “to exhaust”
13. Close valve 1, 2, 4 and 5 on the PRSA.
14. Secure area and wear ear protection.
15. Activate the spark generator.
16. Activate Labview program for temperature and/or pressure measurements.
17. Ignite gas mixture.
18. Store Labview files with measturements.
19. Flush apparatus with air by opening valve 3 on the PRSA.
20. Turn off air and gas supply when experiment set is completed.

vi
Figure 7-3: The PRSA. Showing apparatus completely assembled with plastic foil on top of
the external chamber. Temperature sensor mounted and valve 1, 2, 4 and 5 in the open
position. Valve numbers indicated.
5
2 4
3 1
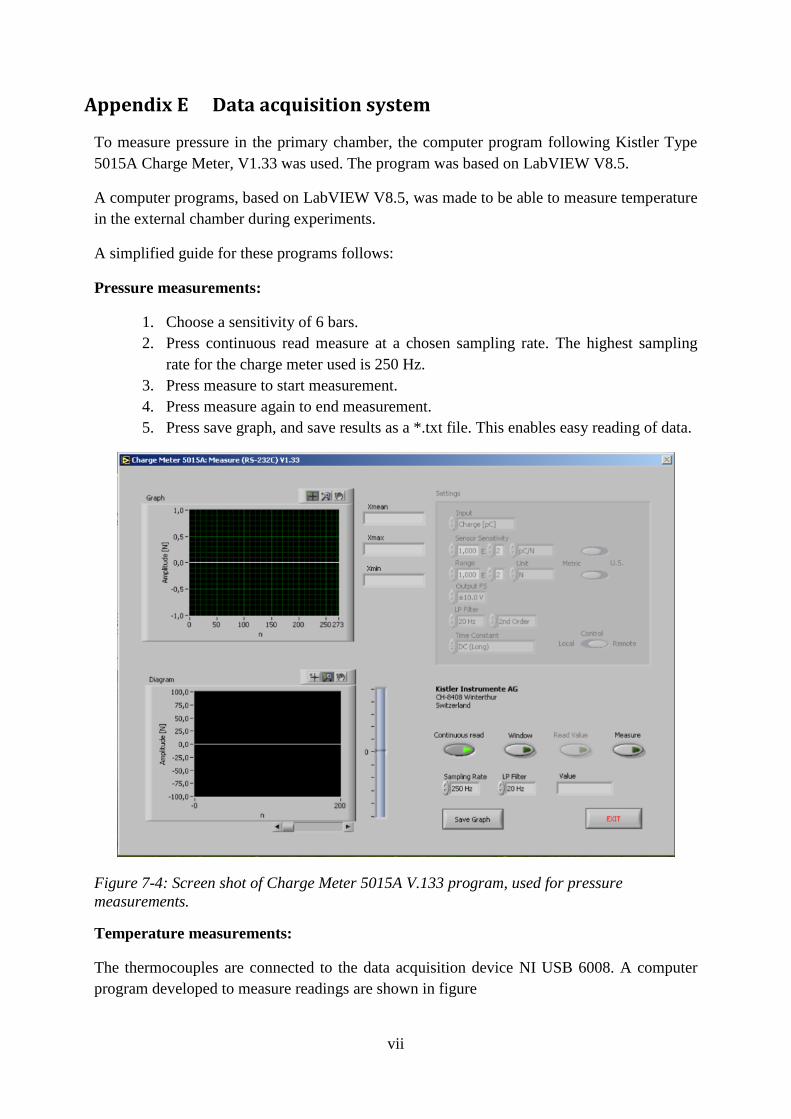
vii
Data acquisition system Appendix E
To measure pressure in the primary chamber, the computer program following Kistler Type
5015A Charge Meter, V1.33 was used. The program was based on LabVIEW V8.5.
A computer programs, based on LabVIEW V8.5, was made to be able to measure temperature
in the external chamber during experiments.
A simplified guide for these programs follows:
Pressure measurements:
1. Choose a sensitivity of 6 bars.
2. Press continuous read measure at a chosen sampling rate. The highest sampling
rate for the charge meter used is 250 Hz.
3. Press measure to start measurement.
4. Press measure again to end measurement.
5. Press save graph, and save results as a *.txt file. This enables easy reading of data.
Figure 7-4: Screen shot of Charge Meter 5015A V.133 program, used for pressure
measurements.
Temperature measurements:
The thermocouples are connected to the data acquisition device NI USB 6008. A computer
program developed to measure readings are shown in figure

viii
1. Press run, shown in Figure 7-6.
2. After 5 seconds a dialogue box appears which enables saving of measurements as a
*.txt file.
3. Readings is displayed as a waveform graph in the program.
Figure 7-5: Block diagram LabVIEW program used for temperature measurements.
Figure 7-6: Screen shot of LabVIEW program used for temperature measurements.
Run

ix
Thermocouples Appendix F
Thermocouples are a device consisting of a wire with two different metals and a conjunction
point between them. When the junction point is heated or cooled, a voltage is produced that
can be correlated to the temperature. The thermocouples used in the present work are of type
k and consist of nickel-chromium (+) and nickel-aluminium (-). Their temperature range is -
200°C to 1100°C. The thickness of the metal wires is 0.3 mm. Sensitivity is approximately 41
µV/°C and accuracy of ±2.5°C. The voltage produced from the thermocouples was amplified
through a tailor made amplifier (AD597), connected to a data acquisition device (NI USB
6008) and logged using a computer program (see Appendix E).
The welding apparatus for the thermocouples are tailor made [33]. The principle of the
apparatus is to charge a condensator via a rectifier, and to discharge across the two metal
wires. The wires are connected to the condensator, one at the positive side and one to the
negative side. The opposite ends of the wires are gently pushed together until contact is made
and the condensator discharge through the wires creating a welding point. Argon is added to
the welding point during the procedure to prevent combustion and make the welding the more
dominant process.

x
Calculation of stoichiometric concentrations Appendix G
Calculation of stoichiometric concentrations of propane in mixtures with various ratios of
nitrogen/oxygen:
Table 7-1: Gas mixtures with different oxygen/nitrogen concentrations.
Mixture Vol. % O2 Vol. % N2
i. 20.95 79.05
ii. 19.00 81.00
iii. 16.77 83.23
iv. 15.04 84.96
Stoichiometric
(7-1)
Stoichiometric calculation for mixture i:
(
) (
)
(7-2)
Molar ratio of propane and oxygen reactant is:
(7-3)
(7-4)
Molar ratio of nitrogen and oxygen reactants is:
(7-5)
(7-6)
Using that:
∑ (7-7)

xi
(7-8)
Substituting molar ratios of propane and nitrogen:
(7-9)
(
)
(7-10)
(7-11)
Knowing the stoichiometric oxygen concentration, nitrogen and propane concentrations can
be found using:
(7-12)
(7-13)
Calculation of stoichiometric mixtures of propane and the other three oxygen/nitrogen
mixtures made using same method.
Table 7-2: Stoichiometric values for fuel/air and fuel/nitrogen enriched air.
Mixture Vol. % C3H8 Vol. % O2 Vol. % N2
i. 4.02 20.11 75.87
ii. 3.66 18.30 78.03
iii. 3.25 16.23 80.53
iv. 2.92 14.60 82.48
Table 7-3: Values for concentration with regards to most incentive mixture.
Mixture Vol. % C3H8 Vol. % O2 Vol. % N2
i. 4.20 20.07 75.73
ii. 3.85 18.27 77.88
iii. 3.45 16.19 80.36
iv. 3.15 14.57 82.28
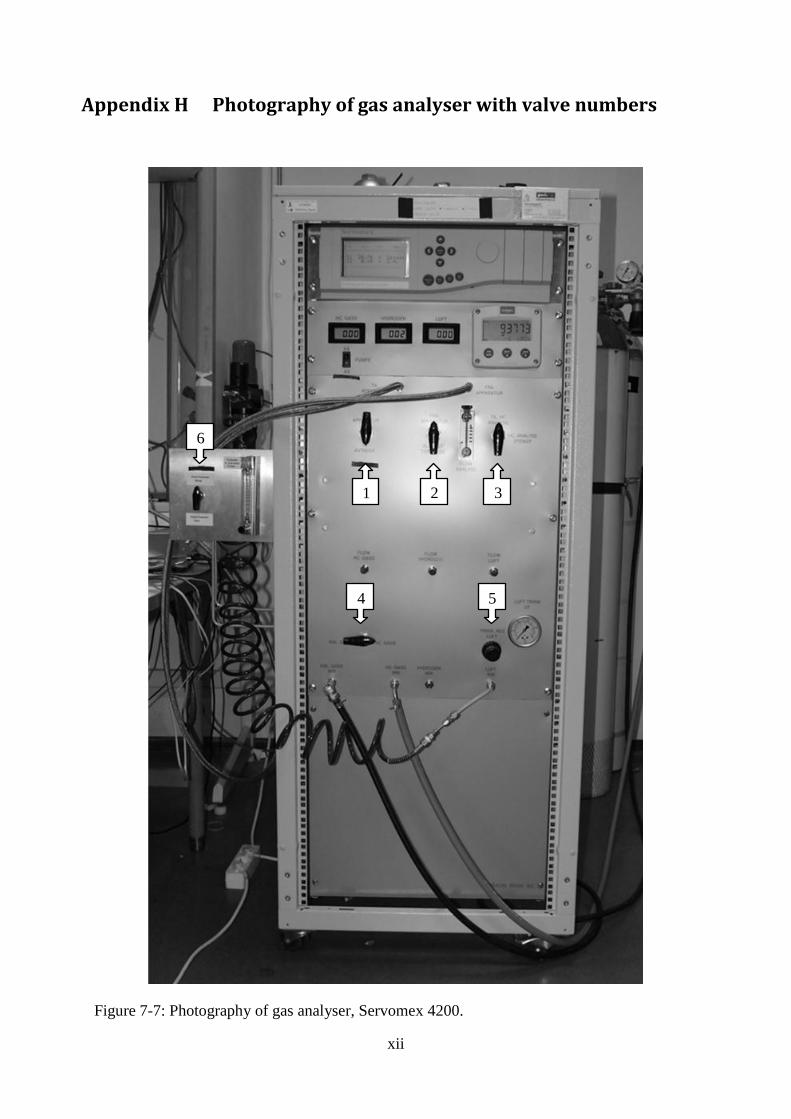
xii
Photography of gas analyser with valve numbers Appendix H
Figure 7-7: Photography of gas analyser, Servomex 4200.
1 2 3
4 5
6

xiii
Gas analyser specifications Appendix I
Figure 7-8: Specifications of gas analyser.

xiv
Figure 7-9: The mechanical couplings of the gas analyser.

xv
Magnified photos of slits Appendix J
The photos were taken at the Laboratory for Electron Microscopy at UoB, using a Zeiss Supra
55VP electron microscope.
Figure 7-10: POM slit surface, new and unexposed of heat.
Figure 7-11: POM slit surface, after 3 consecutive explosion experiments, lower part of gap
surface.

xvi
Figure 7-12: Surface of carbon steel slit.
Figure 7-13: Surface of brass slit.

xvii
Figure 7-14: Surface of aluminium slit.

xviii
Experimental data Appendix K
An excerpt from the measurement data, not presented in the results section, obtained through
the experimental work is presented in this section.
Gap opening Trials Re-ignition Pressure Mean pressure
0,97 Steel 0 2,33
0,97 Steel 0 2,31
0,97 Steel 0 2,30
0,97 Steel 0 2,30
0,97 Steel 0 2,32
0,97 Steel 0 2,31
0,97 Steel 0 2,31
0,97 Steel 0 2,32
0,97 Steel 0 2,34
0,97 Steel 0 2,32
Mean
0 2,32 2,32
0,98 Steel 0 2,29
0,98 Steel 0 2,29
0,98 Steel 0 2,29
0,98 Steel 0 2,30
0,98 Steel 0 2,31
0,98 Steel 0 2,31
0,98 Steel 0 2,28
0,98 Steel 0 2,27
0,98 Steel 0 2,29
0,98 Steel 0 2,28
Mean
0 2,29 2,29
0,99 Steel 1 2,22
0,99 Steel 0 2,22
0,99 Steel 0 2,20
0,99 Steel 0 2,22
0,99 Steel 0 2,21
0,99 Steel 1 2,19
0,99 Steel 0 2,23
0,99 Steel 0 2,22
0,99 Steel 0 2,21
0,99 Steel 0 2,23
Mean
2 2,22 2,22
1,00 Steel 0 2,19
1,00 Steel 1 2,24
1,00 Steel 1 2,20
1,00 Steel 1 2,22
1,00 Steel 1 2,25
1,00 Steel 1 2,26
1,00 Steel 0 2,23
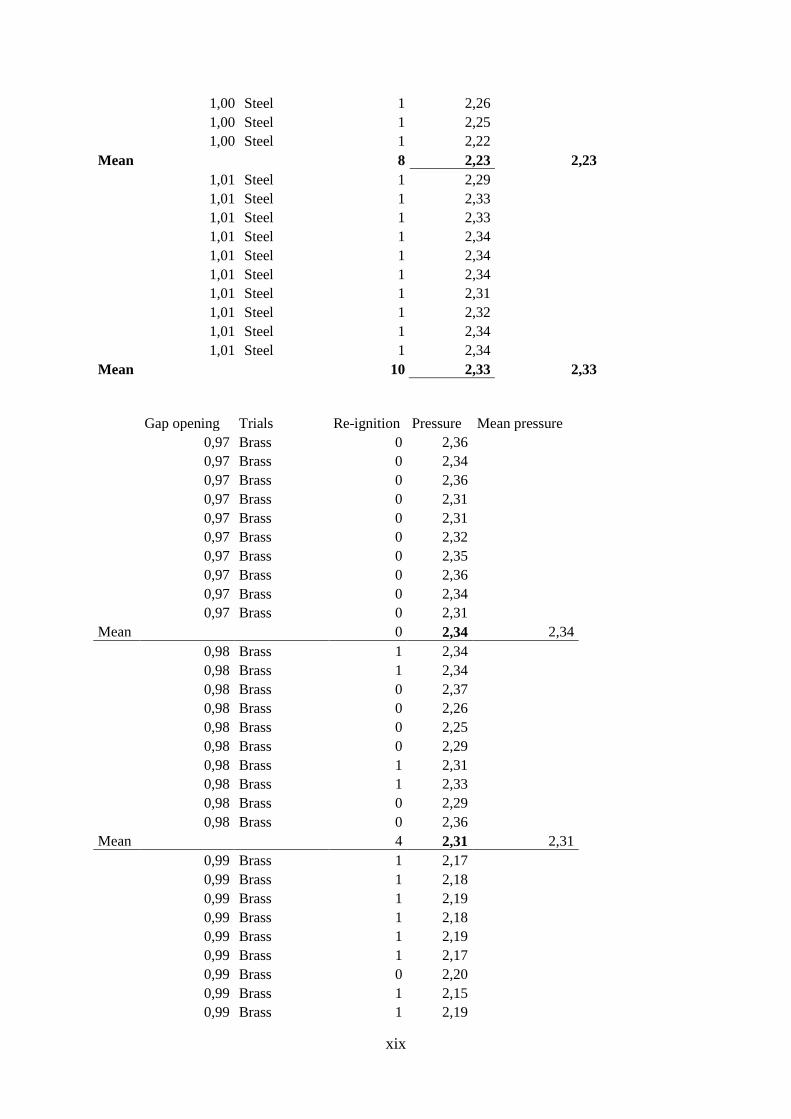
xix
1,00 Steel 1 2,26
1,00 Steel 1 2,25
1,00 Steel 1 2,22
Mean
8 2,23 2,23
1,01 Steel 1 2,29
1,01 Steel 1 2,33
1,01 Steel 1 2,33
1,01 Steel 1 2,34
1,01 Steel 1 2,34
1,01 Steel 1 2,34
1,01 Steel 1 2,31
1,01 Steel 1 2,32
1,01 Steel 1 2,34
1,01 Steel 1 2,34
Mean
10 2,33 2,33
Gap opening Trials Re-ignition Pressure Mean pressure
0,97 Brass 0 2,36
0,97 Brass 0 2,34
0,97 Brass 0 2,36
0,97 Brass 0 2,31
0,97 Brass 0 2,31
0,97 Brass 0 2,32
0,97 Brass 0 2,35
0,97 Brass 0 2,36
0,97 Brass 0 2,34
0,97 Brass 0 2,31
Mean 0 2,34 2,34
0,98 Brass 1 2,34
0,98 Brass 1 2,34
0,98 Brass 0 2,37
0,98 Brass 0 2,26
0,98 Brass 0 2,25
0,98 Brass 0 2,29
0,98 Brass 1 2,31
0,98 Brass 1 2,33
0,98 Brass 0 2,29
0,98 Brass 0 2,36
Mean 4 2,31 2,31
0,99 Brass 1 2,17
0,99 Brass 1 2,18
0,99 Brass 1 2,19
0,99 Brass 1 2,18
0,99 Brass 1 2,19
0,99 Brass 1 2,17
0,99 Brass 0 2,20
0,99 Brass 1 2,15
0,99 Brass 1 2,19

xx
0,99 Brass 1 2,15
Mean 9 2,18 2,18
1,00 Brass 1 2,22
1,00 Brass 1 2,23
1,00 Brass 1 2,25
1,00 Brass 1 2,23
1,00 Brass 1 2,20
1,00 Brass 1 2,26
1,00 Brass 1 2,21
1,00 Brass 1 2,22
1,00 Brass 1 2,22
1,00 Brass 1 2,23
Mean 10 2,23 2,23
1,01 Brass 1 2,36
1,01 Brass 1 2,31
1,01 Brass 1 2,31
1,01 Brass 1 2,35
1,01 Brass 1 2,30
1,01 Brass 1 2,36
1,01 Brass 1 2,37
1,01 Brass 1 2,37
1,01 Brass 1 2,35
1,01 Brass 1 2,31
Mean 10 2,34 2,34
Temperature measurements over flame gaps (°C):
0.95 Brass 2 cm above gap 4 cm above gap
314,5 242,4
311,5 246,5
319,6 251,0
317,6 245,9
318,1 244,4
316,3 246,0
Std dev 3,243917385 3,192647804
0.95 Aluminium 2 cm above gap 4 cm above gap
301,1 228,1
294,1 218,4
296,7 225,0
300,8 230,6
301,0 227,3
298,7 225,9
Std dev 3,186377253 4,63540721
xxi
0.95 Steel 2 cm above gap 4 cm above gap
284,5 213,8
280,4 206,2
289,1 212,3
287,5 209,3
284 206,4
285,1 209,6
Std dev 3,369718089 3,421257079
0.98 Aluminium 2 cm above gap 4 cm above gap
322,2 242,9
326,8 243,1
330,4 248,1
322,6 234,7
324,2 240,1
325,2 241,8
Std dev 3,404115157 4,896120914
0.98 Steel 2 cm above gap 4 cm above gap
315,0 225,3
314,0 228,1
316,6 232,5
315,1 229,5
320,7 225,0
316,3 228,1
Std dev 2,63950753 3,113197713
Mixture with 19.00 vol. % oxygen in nitrogen/oxygen:
Trial C3H8 p (barg) Opning
1 4,56 1,045 1,00
2 4,83 0,567 1,00
3 4,30 1,298 1,00
4 3,90 1,408 1,00
5 3,85 1,405 1,00
6 3,63 1,363 1,00
7 3,59 1,322 1,00
8 3,44 1,158 1,00
9 3,73 1,390 1,00
10 4,11 1,367 1,00

xxii
Gap opening Trials Re-ignitions Re-ignitions Pressure Mean pressure
1,20 3 0 0 1,26 1,23
1,20
0 1,22
1,20
0 1,21
1,21 10 0 0 1,21 1,21
1,21
0 1,22
1,21
0 1,21
1,21
0 1,22
1,21
0 1,19
1,21
0 1,19
1,21
0 1,20
1,21
0 1,22
1,21
0 1,20
1,21
0 1,20
1,22 13 4 0 1,24 1,22
1,22
0 1,20
1,22
0 1,19
1,22
1 1,21
1,22
1 1,20
1,22
1 1,22
1,22
0 1,21
1,22
0 1,20
1,22
1 1,24
1,22
0 1,23
1,22
0 1,22
1,22
0 1,23
1,22
0 1,21
1,23 7 3 0 1,26 1,24
1,23
1 1,26
1,23
0 1,23
1,23
0 1,24
1,23
1 1,24
1,23
1 1,24
1,23
0 1,23
1,25 3 1 1 1,19 1,19
1,30 1 1 1 1,18 1,18
1,33 1 1 1 1,17 1,17
1,40 1 1 1 1,12 1,12
1,50 1 1 1 0,98 0,98
xxiii
Mixture with 16.77 vol. % oxygen in nitrogen/oxygen:
Forsøk C3H8 p (barg) Opning
1 3,00 0,201 1,2
2 3,21 0,386 1,2
3 3,32 0,425 1,2
4 3,38 0,434 1,2
5 3,44 0,440 1,2
6 3,51 0,442 1,2
7 3,58 0,430 1,2
8 3,67 0,409 1,2
9 3,59 0,421 1,2
10 3,44 0,454 1,2
Gap opening Trials Re-ignitions Re-ignitions Pressure Mean pressure
1,50 1 0
0,30 0,30
1,55 10 0 0 0,27 0,28
1,55
0
0,29
1,55
0
0,28
1,55
0
0,27
1,55
0
0,29
1,55
0
0,28
1,55
0
0,29
1,55
0
0,27
1,55
0
0,29
1,55
0
0,31
1,56 6 0 1 0,26 0,27
1,56
0
0,25
1,56
0
0,27
1,56
1
0,29
1,56
0
0,28
1,56
0
0,28
1,57 3 1 2 0,27 0,27
1,57
1
0,27
1,57
0
0,28
1,58 8 0 3 0,24 0,27
1,58
1
0,25
1,58
1
0,28
1,58
0
0,28
1,58
0
0,28
1,58
0
0,25
1,58
1
0,29
1,58
0
0,26
1,59 10 0 4 0,27 0,26

xxiv
1,59
0
0,25
1,59
0
0,22
1,59
1
0,26
1,59
1
0,24
1,59
1
0,27
1,59
0
0,23
1,59
1
0,46
1,59
0
0,22
1,59
0
0,22
1,60 22 0 7 0,19 0,25
1,60
1
0,22
1,60
1
0,22
1,60
0
0,26
1,60
1
0,25
1,60
0
0,26
1,60
0
0,25
1,60
0
0,26
1,60
1
0,24
1,60
0
0,25
1,60
0
0,27
1,60
0
0,26
1,60
0
0,27
1,60
1
0,26
1,60
0
0,26
1,60
0
0,27
1,60
0
0,27
1,60
1
0,25
1,60
0
0,26
1,60
0
0,25
1,60
1
0,25
1,60
0
0,26
1,61 5 1 5 0,25 0,26
1,61
1
0,29
1,61
1
0,27
1,61
1
0,28
1,61
1
0,24
1,62 1 1 1 0,29 0,29
1,65 1 1 1 0,26 0,26
1,70 1 1 1 0,23 0,23
xxv
Mixture with 15.04 vol. % oxygen in nitrogen/oxygen:
Forsøk C3H8 p (barg) Opning
1 3,30 0,024 2,00
2 3,20 0,020 2,00
3 3,26 0,023 2,00
4 3,49 0,017 2,00
5 3,30 0,023 2,00
6 3,35 0,019 2,00
7 3,14 0,022 2,00
8 3,12 0,028 2,00
9 3,08 0,032 2,00
10 3,15 0,028 2,00
11 3,36 0,025 2,00
Gap opening Trials Re-ignitions Re-ignitions Pressure Mean pressure
2,00 11 0 0
0,024
2,05 9 0 1 0,028 0,027
2,05
0
0,030
2,05
0
0,029
2,05
0
0,025
2,05
0
0,023
2,05
1
0,025
2,05
0
0,026
2,05
0
0,025
2,05
0
0,027
2,10 10 0 2 0,027 0,032
2,10
1
0,038
2,10
1
0,029
2,10
0
0,040
2,10
0
0,038
2,10
0
0,022
2,10
0
0,035
2,10
0
0,031
2,10
0
0,026
2,10
0
0,029
2,15 2 1 1 0,028 0,025
2,15
0
0,022
2,25 3 0 2 0,023 0,022
2,25
1
0,023
2,25
1
0,021
2,45 1 1 1 0,022 0,022