Embed Size (px)
Citation preview
MINISTRY OF AVIATION
R. & M. No. 3446
AERONAUTICAL RESEARCH COUNCIL
REPORTS AND MEMORANDA
An Experimental Investigation of the Reflected-Shock Pressure-Time Profiles for Air, Oxygen, Nitrogen, Argon, Carbon Dioxide and
Acetylene By L. Davies, Ph .D. and D. H. Edwards , Ph.D.
~r^u i~DfORD.
LONDON: HER MAJESTY'S STATIONERY OFFICE
1967
PRICE Ils. Od. NET.
An Experimental Investigation of the Reflected-Shock Pressure-Time Profiles for Air, Oxygen, Nitrogen, Argon, Carbon Dioxide and
Acetylene By L. Davies , P h . D . and D. H. E d w a r d s , P h . D .
Reports and Memoranda No. 3446*
November, 1964
Summary. A review of the literature on the subject of normal reflection of shock waves at the end of a shock
tube is given and indicates that, although many of the phenomena which influence the motion of the reflected shock wave have been identified, the analysis is by no means complete. Woods has given a theoretical description of the motion of the reflected shock for times not too far removed from the instant of reflection which includes most of the relevant influences, e.g., boundary-layer growth behind the primary shock wave and reflected shock-boundary-layer interaction.
Experimental reflected-shock pressure-time profiles are described for air, oxygen, argon, nitrogen, carbon dioxide and acetylene for both short duration (~ 200 microseconds) and long duration (~4-10 milliseconds) recording times and the results compared with existing theories. Woods' theory is found to predict correctly the form of the pressure-time profile for the first few hundred microseconds after shock reflection, but for longer times the influence of shock interaction with a turbulent boundary layer in a shock tube and with a contact region rather than a contact surface require clarification. The pressure levels immediately after shock reflection are shown to agree closely with real-gas theory, but measurements of the pressure rise across the shock transmitted through the contact surface show a similar scatter and poor agreement with theory as was described by Holder and Schultz for reflected- shock studies in air. It is shown that reflected-shock waves in acetylene must be considered a separate study owing to the added complication of pyrolysis which occurs for incident shock Mach numbers greater than 4. Some streak schlieren photographs for acetylene showing the occurrence of carbon formation are shown.
For all the gases except nitrogen the initial pressure range was 10-300 mm Hg, the driver gas was room temperature hydrogen and the experiments were carried out in a 2 in. internal diameter shock tube. The reflected-shock pressures were measured using a bar gauge, and a description of a modified bar gauge developed~especially for studying the long duration recordings shown in this report is given. The reflected- shock pressure-time profiles for nitrogen were obtained in the N.P.L. 2 in., 3 in. and 6 in. internal diameter shocktubes using hydrogen and helium gases at pressure up to 1800 lb/in? abs. In this latter case the shock pressures were measured using S.L.M. PZ.14 transducers.
1. Introduction.
When a plane shock wave is normally reflected from the rigid plate forming the closed end of a shock tube, the gas behind the incident wave is, ideally, just brought to rest by the reflected shock wave receding from the wall. This interaction is of considerable interest to both the aerodynamicist and kineticist alike. To the former, the stationary column of high enthalpy gas offers a convenient means of driving a reflected- shock hypersonic tunnel. For the kineticist, the attraction of the process, over incident shock methods
*Replaces N.P.L. Aero Report 1124-A.R.C.26 040. Published with the permission of the Director, N.P.L.
of measurement, is twofold. First, higher temperatures are more easily obtained than those existing behind the incident wave and second, the quiescent state of the gas makes higher time resolution possible as measured reaction rates correspond to the true gas values. The research output on reflected-shock problems over the last decade has been considerable and much careful work has been carried out on the application and limitations of the technique. Notable examples of contributions from the Chemical Kinetic aspect are those of Toennies and Greene (1957) 1, Strehlow and Cohen (1958, 2 19593), Gardiner and Kistiakowsky (1961). 4 Elucidation of the important problem of the interaction of the reflected-shock wave with the boundary layer behin d the incident wave was first provided by the theory of Mark (1958). s This has subsequently been developed by other investigators, for example, Rudinger (1961) 6 and Woods (1962). 7
Measurements of temperature (e.g. Lapworth, 1963s), pressure (e.g. Skinner, 19599 ; Brabbs et al, 1960 l°) and density combine with the theoretical investigations to give a picture of the motion of the reflected shock as it retreats from the end plate, and the conditions prevailing in the hot gas in the region between the end plate and the reflected shock. Henceforth, this region will be referred to as the 'reflected-shock region'.
Previous experimental and theoretical work is discussed and details of pressure measurements in the reflected shock region for air, oxygen, nitrogen, argon, carbon dioxide and acetylene are given below in Sections 4 and 5 and the results compared with existing theories.
2. Some Previous Theoretical and Experimental Work.
(a) Ideal reflected-shock behaviour. Here the term °ideal reflected-shock' refers to the reflected-shock which is predicted by simple shock-
tube theory and which is not influenced by relaxation effects in the test gas or by flow phenomena such as boundary-layer growth.
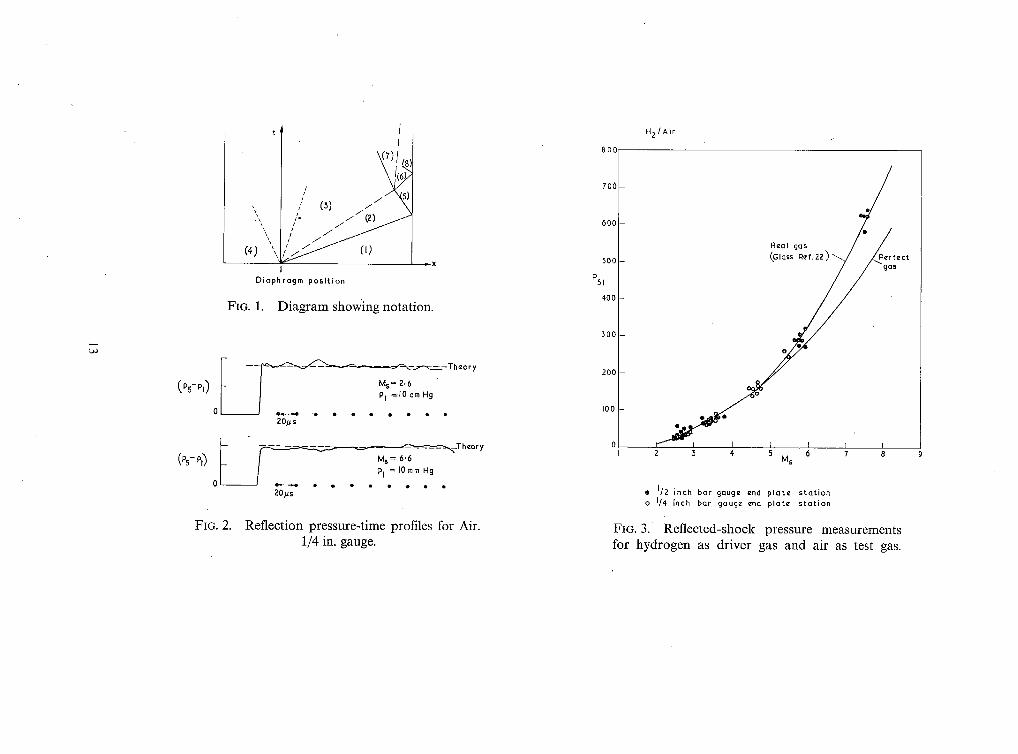
On an (x, t) diagram (see Fig. 1) the primary shock wave and contact surface are assumed to reach their theoretical velocity instantaneously and to maintain this velocity until interaction with the end plate or some wave system causes a deviation. The reflected-shock wave is also shown as a straight line which meets and is refracted on passing through (except under special conditions) the contact surface. At diaphragm rupture the rarefaction wave is assumed to be centred at the origin. This is a simple picture which has proved to be very useful as a guide to shock-tube operation. Real-gas effects, however, cause the pressures behind the shock waves to be higher than the simple theory predicts at high Mach numbers, and when correction factors are included in the calculations to allow for chemical reactions and high- temperature effects- behind the reflected shock in particular- the theoretical pressures over the first 100-200 microseconds after shock reflection agree closely with experiment (see Section 4). When time intervals of the order of milliseconds after shock reflection are considered, a host of phenomena occur giving a distance-time history of the reflected shock considerably different from the ideal picture. The ideal shock-tube flow equations are well known (see Glass (1958) 11) and will not therefore be reproduced here.
When discussing the reflected shock mention must be made of the "tailored-interface technique". This refers to the conditions under which the reflected primary shock wave passes through the contact surface without giving rise to additional disturbances. As a result the pressure remains (theoretically) constant at the end plate until the arrival of the expansion wave from the high-pressure driver section of the tube. This extends the time available for using the reflected-shock region for chemical kinetics
, studies, and for the aerodynamicist it increases the useful running time of the shock tunnel. The effects of non-ideal driving conditions (here again "ideal' refers to perfect-gas, simple shock-tube theory) on tailoring and of the bulk compressibility of the driver gas at high pressures on the running times in shock tunnels are discussed in detail by Davies et al (1963) 12 and Davies (1963) la. It will be noted, however, that when considering the interaction of the reflected-shock wave with the contact surface, and the disturbances arising from this interaction, the effects of non-ideal P41 i.e. initial pressure ratio across the dialShragm (see Fig. 1) must be taken into account. When the overall pressure levels are raised, e.g. when
driver pressures of up to 10 000 lb/in, z abs. are used, the increase in sound speed in the driver section due to bulk compressibility almost halves the runningtime at the highest driver pressure. This is due to the increase in velocity of the head of the rarefaction wave as it passes through the driver gas.
Owing to deviations from simple shock-tube theory, measured values of the flow parameters in a shock tube can be very different from the simple theoretical values.
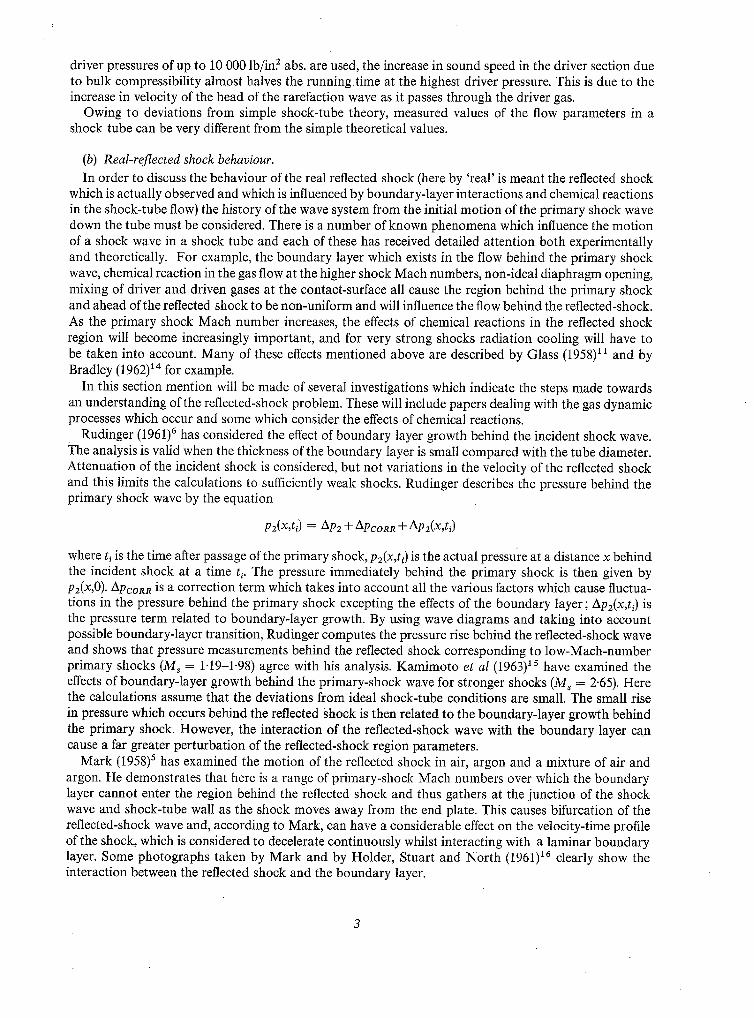
(b) Real-reflected shock behaviour. In order to discuss the behaviour of the real reflected shock (here by 'real' is meant the reflected shock
which is actually observed and which is influenced by boundary-layer interactions and chemical reactions in the shock-tube flow) the history of the wave system from the initial motion of the primary shock wave down the tube must be considered. There is a number of known phenomena which influence the motion of a shock wave in a shock tube and each of these has received detailed attention both experimentally and theoretically. For example, the boundary layer which exists in the flow behind the primary shock wave, chemical reaction in the gas flow at the higher shock Mach numbers, non-ideal diaphragm opening, mixing of driver and driven gases at the contact-surface all cause the region behind the primary shock and ahead of the reflected shock to be non-uniform and will influence the flow behind the reflected-shock. As the primary shock Mach number increases, the effects of chemical reactions in the reflected shock region will become increasingly important, and for very strong shocks radiation cooling will have to be taken into account. Many of these effects mentioned above are described by Glass (1958) 11 and by Bradley (1962) 14 for example.
In this section mention will be made of several investigations which indicate the steps made towards an understanding of the reflected-shock problem. These will include papers dealing with the gas dynamic processes which occur and some which consider the effects of chemical reactions.
Rudinger (1961) 6 has considered the effect of boundary layer growth behind the incident shock wave. The analysis is valid when the thickness of the boundary layer is small compared with the tube diameter. Attenuation of the incident shock is considered, but not variations in the velocity of the reflected shock and this limits the calculations to sufficiently weak shocks. Rudinger describes the pressure behind the primary shock wave by the equation
p~(x,t3 = ap~ + Ap~o~. + ap~(x,t~)
where t i is the time after passage of the primary shock, p2(x&) is the actual pressure at a distance x behind the incident shock at a time t~. The pressure immediately behind the primary shock is then given by p2(x,O). ApcoRR is a correction term which takes into account all the various factors which cause fluctua- tions in the pressure behind the primary shock excepting the effects of the boundary layer; Ap2(x,t~) is the pressure term related to boundary-layer growth. By using wave diagrams and taking into account possible boundary-layer transition, Rudinger computes the pressure rise behind the reflected-shock wave and shows that pressure measurements behind the reflected shock corresponding to low-Mach-number primary shocks (iV/s = 1.19-1-98) agree with his analysis. Kamimoto et al (1963) 15 have examined the effects of boundary-layer growth behind the primary-shock wave for stronger shocks (M s = 2.65). Here the calculations assume that the deviations from ideal shock-tube conditions are small. The small rise in pressure which occurs behind the reflected Shock is then related to the boundary-layer growth behind the primary shock. However, the interaction of the reflected-shock wave with the boundary layer can cause a far greater perturbation of the reflected-shock region parameters.
Mark (1958) 5 has examined the motion of the reflected shock in air, argon and a mixture of air and argon. He demonstrates that here is a range of primary-shock Mach numbers over which the boundary layer cannot enter the region behind the reflected shock and thus gathers at the junction of the shock wave and shock-tube wall as the shock moves away from the end plate. This causes bifurcation of the reflected-shock wave and, according to Mark, can have a considerable effect on the velocity-time profile of the shock, which is considered to decelerate continuously whilst interacting with a laminar boundary layer. Some photographs taken by Mark and by Holder, Stuart and North (1961) 16 clearly show the interaction between the reflected shock and the boundary layer.
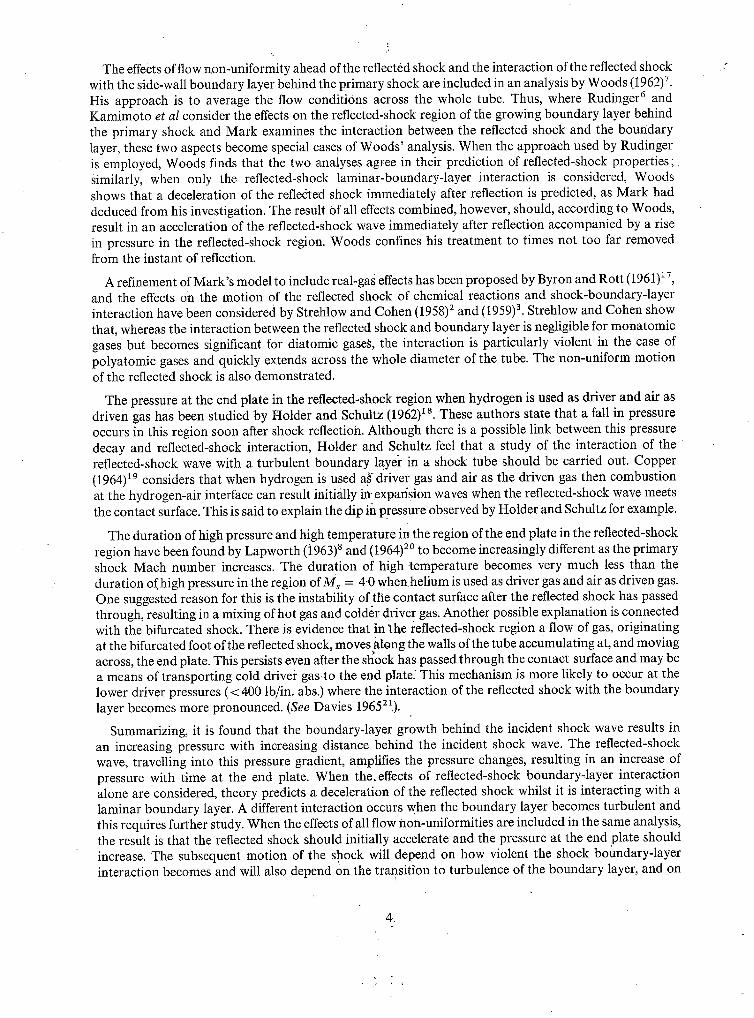
The effects of flow rton-uniformity ahead of the reflected shock and the interaction of the reflected shock with the side-wall boundary layer behind the primary shock are included in an analysis by Woods (1962) 7 . His approach is to average the flow conditions across the whole tube. Thus, where Rudinger 6 and Kamimoto et al consider the effects on the reflected-shock region of the growing boundary layer behind the primary shock and Mark examines the interaction between the reflected shock and the boundary layer, these two aspects become special cases of Woods' analysis. When the approach used by Rudinger is employed, Woods finds that the two analyses agree in their prediction of reflected-shock properties; Similarly, when only the reflected-shock laminar-boundary-layer interaction is considered, Woods shows that a deceleration of the refledted shock immediately after reflection is predicted, as Mark had deduced from his investigation. The result Of all effects combined, however, should, according to Woods, result in an acceleration of the reflected-shock wave immediately after reflection accompanied by a rise in pressure in the reflected-shock region. Woods confines his treatment to times not too far removed from the instant of reflection.
A refinement of Mark's model to include real-gas effects has been proposed by Byron and Rott (1961) 17, and the effects on the motion of the reflected shock of chemical reactions and shock-boundary-layer interaction have been considered by Strehlow and Cohen (1958) 2 and (1959) 3. Strehlow and Cohen show that, whereas the interaction between the reflected shock and boundary layer is negligible for monatomic gases but becomes significant for diatomic gases, the interaction is particularly violent in the case of polyatomic gases and quickly extends across the whole diameter of the tube. The non-uniform motion of the reflected shock is also demonstrated.
The pressure at the end plate in the reflected-shock region when hydrogen is used as driver and air as driven gas has been studied by tfolder and Schultz (1962) is. These authors state that a fall in pressure occurs in this region soon after shock reflection. Although there is a possible link between this pressure decay and reflected-shock interaction, Holder and Schultz feel that a study of the interaction of the reflected-shock wave with a turbulent boundary la.yer in a shock tube should be carried out. Copper (1964) 19 considers that when hydrogen is used a~ driver gas and air as the driven gas then combustion at the hydrogen-air interface can result initially in-expar~sion waves when the reflected-shock wave meets the contact surface. This is said to explain the dip in pressure observed by Holder and Schultz for example.
The duration of high pressure and high temperature in the region of the end plate in the reflected-shock region have been found by Lapworth (i963) s and (1964) 1° to become increasingly different as the primary shock Mach number increases. The duration of high .temperature becomes very much less than the duration of high pressure in the region of M~ -- 4'0 when helium is used as driver gas and air as driven gas. One suggested reason for this is the instability of the contact surface after the reflected shock has passed through, resulting in a mixing of hot gas and colder driver gas. Another possible explanation is connected with the bifurcated shock. There is evidence that in 'the reflected-shock region a flow of gas, originating at the bifurcated foot of the reflected shock, moves along the walls of the tube accumulating at, and moving across, the end plate. This persists even after the sh~ock has passed through the contact surface and may be a means of transporting cold driver gas.to the end pIate: This mechanism is more likely to occur at the lower driver pressures (< 400 lb/in, abs.) where the interaction of the reflected shock with the boundary layer becomes more pronounced. (See Davies 196521~).
Summarizing, it is found that the boundary-layer growth behind the incident shock wave results in an increasing pressure with increasing distance behind the incident shock wave. The reflected-shock wave, travelling into this pressure gradient, amplifies the pressure changes, resulting in an increase of pressure with time at the end plate. When the.effects of reflected-shock boundary~layer interaction alone are considered, theory predicts a deceleration of the reflected shock whilst it is interacting with a laminar boundary layer. A different interaction occurs when the boundary layer becomes turbulent and this requires further study. When the effects of all flow non-uniformities are included in the same analysis, the result is that the reflected shock should initially accelerate and the pressure at the end plate should increase. The subsequent motion of the shock will depend on how violent the shock boundary-layer interaction becomes and will also depend on the transition to turbulence of the boundary layer, and on
4
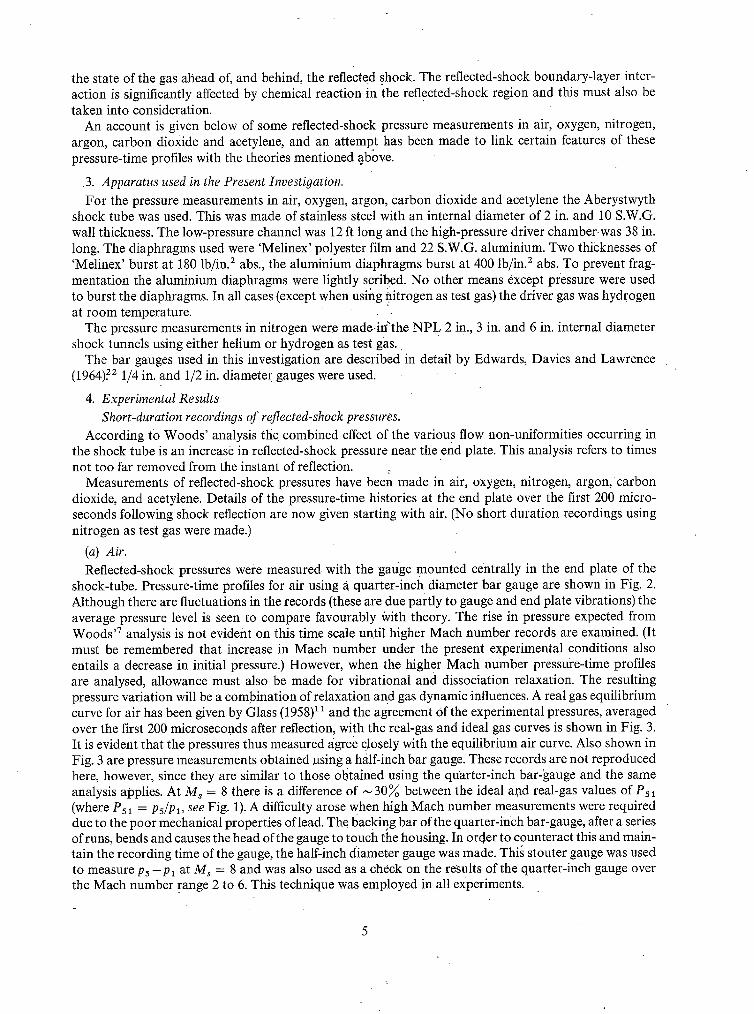
the state of the gas ahead of, and behind, the reflected shock. The reflected-shock boundary-layer inter- action is significantly affected by chemical reaction in the reflected-shock region and this must also be taken into consideration.
An account is given below of some reflected-shock pressure measurements in air, oxygen, nitrogen, argon, carbon dioxide and acetylene, and an attempt kas been made to link certain features of these pressure-time profiles with the theories mentioned above.
.3. Apparatus used in the Present Investigation. For the pressure measurements in air, oxygen, argon, carbon dioxide and acetylene the Aberystwyth
shock tube was used. This was made of stainless steel with an internal diameter of 2 in. and 10 S.W.G. wall thickness. The low-pressure channel was 12 ft long and the high-pressure driver chamber was 38 in. long. The diaphragms used were 'Melinex' polyester film and 22 S.W.G. aluminium. Two thicknesses of 'Melinex' burst at 180 lb/in. 2 abs., the aluminium diaphragms burst at 400 lb/in. 2 abs. To prevent frag- mentation the aluminium diaphragms were lightly scribed. No other means except p~:essure were used to burst the diaphragms. In all cases (except when usihg nitrogen as test gas) the driver gas was hydrogen at room temperature.
The pressure measurements in nitrogen were made-iffthe N P L 2 in., 3 in. and 6 in. internal diameter shock tunnels using either helium or hydrogen as test gas .
The bar gauges used in this investigation are described in detail by Edwards, Davies and Lawrence (1964). 22 1/4 in. and 1/2 in. diameter gauges were used.
4. Experimental Results Short-duration recordings of reflected-shock pressures.
According to Woods' analysis the combined effect of the various flow non-uniformities occurring in the shock tube is an increase in reflected-shock pressure near the end plate. This analysis refers to times not too far removed from the instant of reflection.
Measurements of reflected-shock pressures have been made in air, oxygen, nitrogen, argon, ca rbon dioxide, and acetylene. Details of the pressure-time histories at the end plate over the first 200 micro- seconds following shock reflection are now given starting with air. (No short duration recordings using nitrogen as test gas were made.
(a) Air. Reflected-shock pressures were measured with the gauge mounted centrally in the end plate of the
shock-tube. Pressure-time profiles for air using a quarter-inch diameter bar gauge are shown in Fig. 2. Although there are fluctuations in the records (these are due partly to gauge and end plate vibrations) the average pressure level is seen to compare favourably ~vith theory. The rise in pressure expected from Woods 'v analysis is not evident on this time scale until higher Mach number records are examined. (It must be remembered that increase in Mach number under the present experimental conditions also entails a decrease in initial pressure.) However, when the higher Mach number pressure-time profiles are analysed, allowance must also be made for vibrational and dissociation relaxation. The resulting pressure variation will be a combination of relaxation and gas dynamic.influences. A real gas equilibrium curve for air has been given by Glass (1958) i l and the agreement Of the experimental pressures, averaged over the first 200 microseconds after reflection, with the real-gas and ideal gas curves is shown in Fig. 3. It is evident that the pressures thus measured agree closely with the equilibrium air curve. Also shown in Fig. 3 are pressure measurements obtained using a half-inch bar gauge. These records are not reproduced here, however, since they are similar to those ol~tained using the quarter-inch bar-gauge and the same analysis applies. At M s = 8 there is a difference of ~ 30~ between the ideal a.nd real-gas values of Ps 1 (where Psi = Ps/Pi, see Fig. 1). A difficulty arose when high Mach number measurements were required due to the poor mechanical properties of lead. The backing bar of the quarter-inch bar-gauge, after a series of runs, bends and causes the head of the gauge to touch the housing. In order to counteract this and main- tain the recording time of the gauge, the half-inch diameter gauge was made. This stouter gauge was used to measure Ps - P l at M s = 8 and was also used as a check on the results of the quarter-inch gauge over the Mach number [ange 2 to 6. This technique was employed in all experiments.
Since the gauge heads lie flush with the end plate and since the primary shock wave is incident normally on this face, there will be no loss in spatial resolution as would occur if the gauges had been incorporated in the side of the tube. There. will, however, be a difference in rise time. The rise time of the quarter-inch diameter bar-gauge is 3 microseconds as compared to 7 microseconds for the half-inch bar-gauge.
Woods ' prediction of a pressure rise immediately after shock reflection is not detectable at the lower Mach numbers over the time scale discussed above but is more evident at the higher Mach numbers or when longer time scales are involved. Certainly there is no immediate fall away in pressure as is predicted by Mark ' s s analysis (and discussed by Woods). The pressure remains steady and close to the theoretical real-gas Values for the first 200 microseconds after reflection.
Holder and Schultz ~ s have measured the value of the initial rise in pressure immediately following reflection of the primary shock wave in air in 3 in. and 2 in. diameter shock tubes using a PZ.6 gauge and have shown reasonable agreement with the theoretical air curve. Their results in the region Ms = 4 to 5 tend to lie about 15~ below the curve but for M~ -- 6 to 7 better agreement is obtained. Measurements of reflected-shock pressures in air have also been made by Nagamatsu 23 but the agreement of his results with his theoretical curves is not good.
(b) Oxygen. Pressure records for reflected-shock waves in oxygen obtained using a ¼ in. bar-gauge are shown in
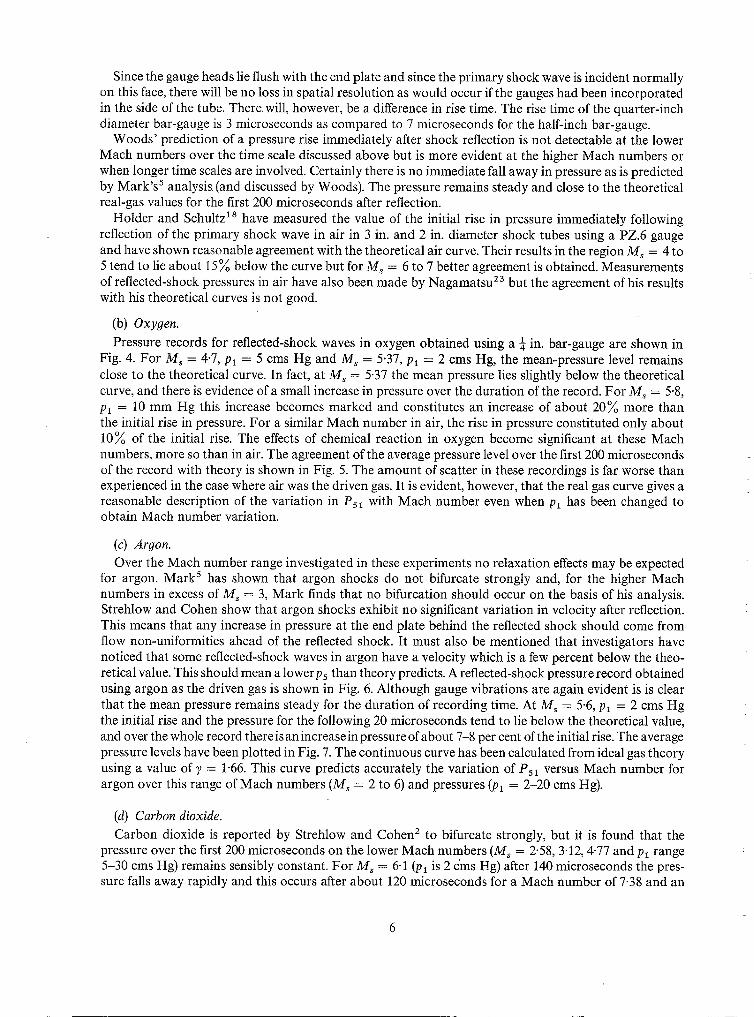
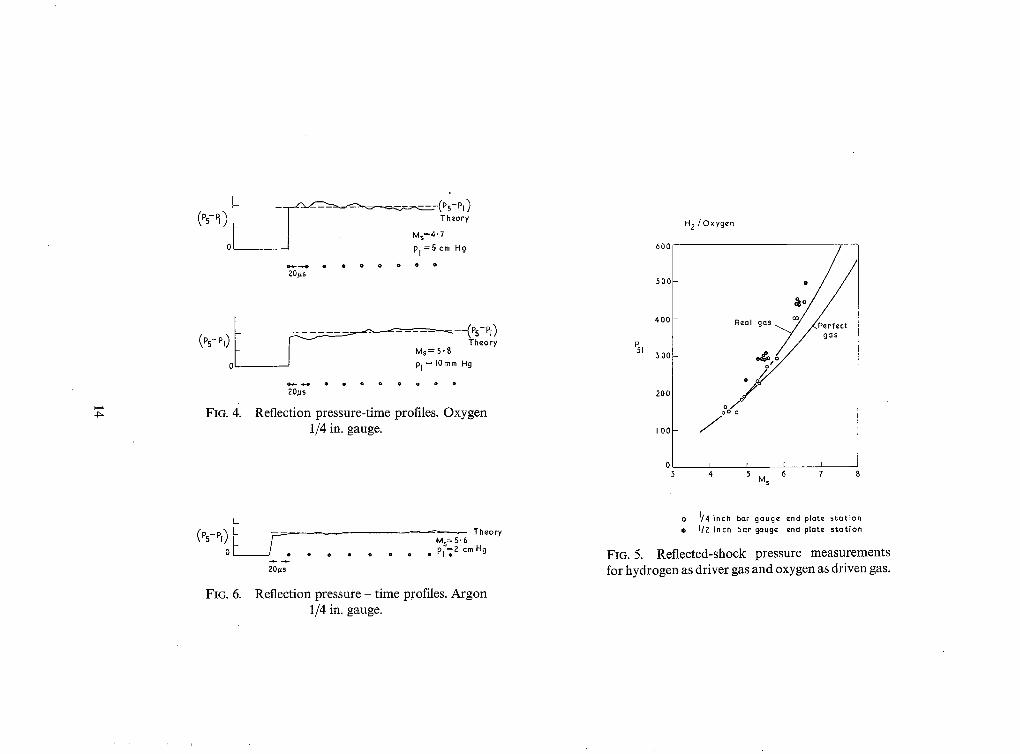
Fig. 4. For M~ = 4.7, Pl = 5 cms Hg and M s = 5.37, p~ = 2 cms Hg, the mean-pressure level remains close to the theoretical curve. In fact, at M, -- 5.37 the mean pressure lies slightly below the theoretical curve, and there is evidence of a small increase in pressure over the duration of the record. For M~ = 5"8, Pl = 10 m m Hg this increase becomes marked and constitutes an increase of about 2 0 ~ more than the initial rise in pressure. For a similar Mach number in air, the rise in pressure constituted only about 10~ of the initial rise. The effects of chemical reaction in oxygen become significant at these Mach numbers, more so than in air. The agreement of the average pressure level over the first 200 microseconds of the record with theory is shown in Fig. 5. The amount of scatter in these recordings is far worse than experienced in the case where air was the driven gas. It is evident, however, that the real gas curve gives a reasonable description of the variation in Ps~ with Mach number even when p~ has been changed to obtain Mach number variation.
(c) Argon. Over the Mach number range investigated in these experiments no relaxation effects may be expected
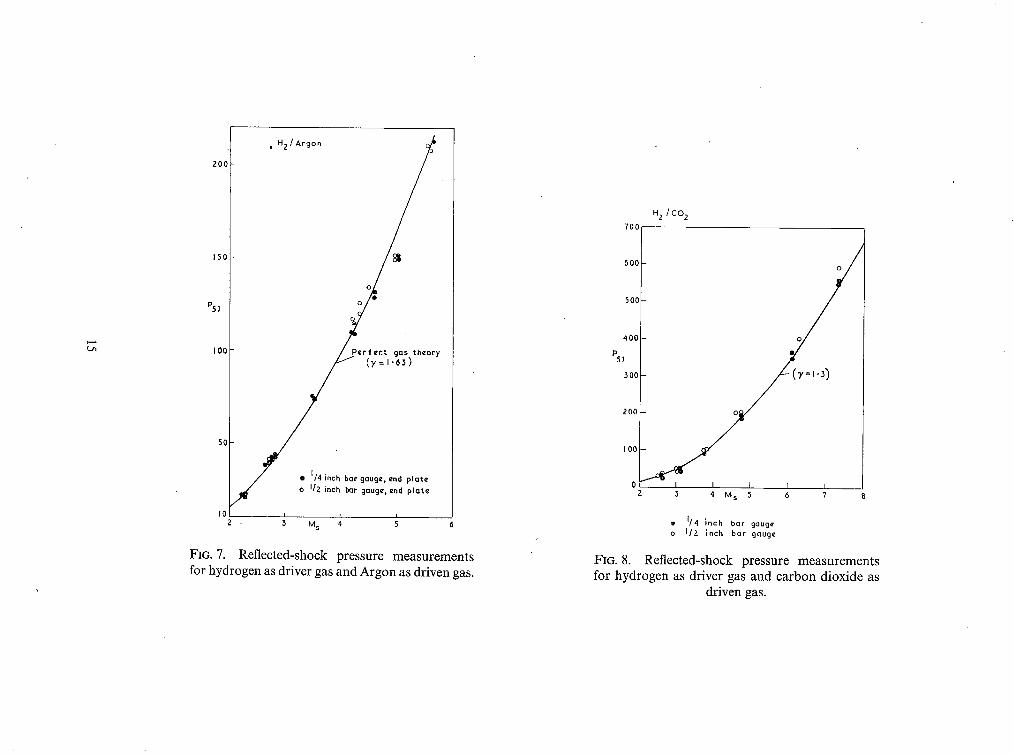
for argon. Mark s has shown that argon shocks do not bifurcate strongly and, for the higher Mach numbers in excess of Ms = 3, Mark finds that no bifurcation should occur on the basis of his analysis. Strehlow and Cohen show that argon shocks exhibit no significant variation in velocity after reflection. This means that any increase in pressure at the end plate behind the reflected shock should come from flow non-uniformities ahead of the reflected shock. It must also be mentioned that investigators have noticed that some reflected-shock waves in argon have a velocity which is a few percent below the theo- retical value. This should mean a lowerp5 than theory predicts. A reflected-shock pressure record obtained using argon as the driven gas is shown in Fig. 6. Although gauge vibrations are again evident is is clear that the mean pressure remains steady for the duration of recording time. At M s = 5.6, pl = 2 cms Hg the initial rise and the pressure for the following 20 microseconds tend to lie below the theoretical value, and over the whole record there is an increase in pressure of about 7-8 per cent of the initial rise. The average pressure levels have been plotted in Fig. 7. The continuous curve has been calculated from ideal gas theory using a value of 7 = 1-66. This curve predicts accurately the variation of P51 versus Mach number for argon over this range of Mach numbers (Ms = 2 to 6) and pressures (Pl = 2-20 cms Hg).
(d) Carbon dioxide. Carbon dioxide is reported by Strehlow and Cohen 2 to bifurcate strongly, but it is found that the
pressure over the first 200 microseconds on the lower Mach numbers (M~ = 2.58, 3.12, 4.77 and Pl range 5-30 cms Hg) remains sensibly constant. For Ms = 6-1 (Pl is 2 cms Hg) after 140 microseconds the pres- sure falls away rapidly and this occurs after about 120 microseconds for a Mach number of 7.38 and an
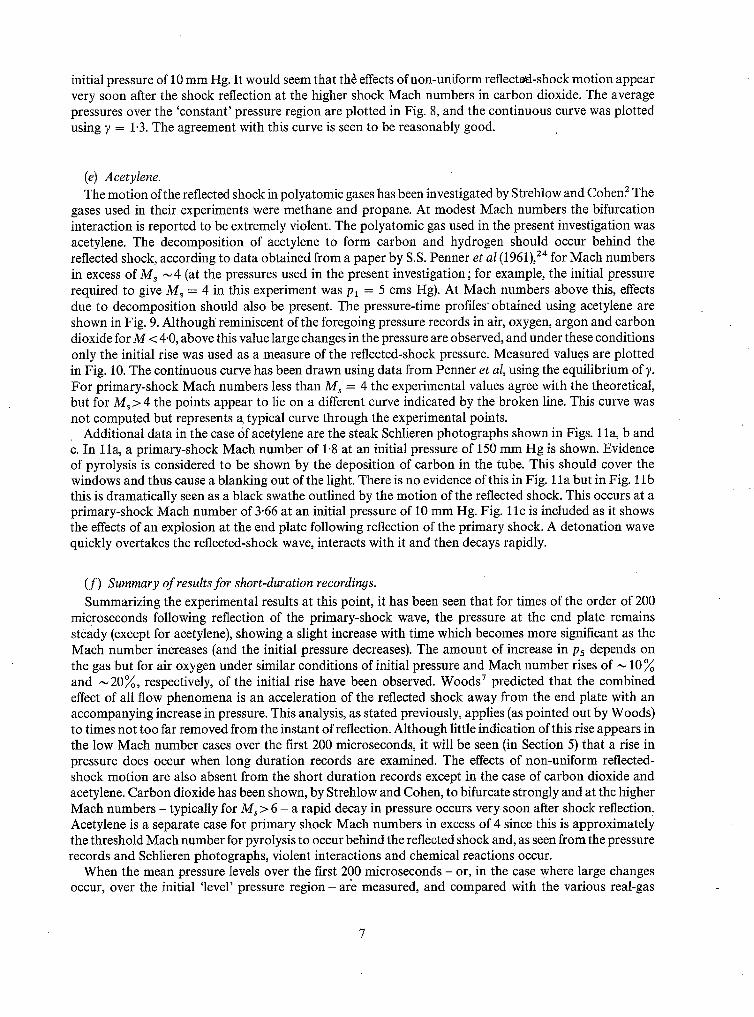
initial pressure of 10 mm Hg. It would seem that th~ effects of non-uniform reflecto~t-shock motion appear very soon after the shock reflection at the higher shock Mach numbers in carbon dioxide. The average pressures over the 'constant' pressure region are plotted in Fig. 8, and the continuous curve was plotted using V -- 1.3. The agreement with this curve is seen to be reasonably good.
(e) Acetylene. The motion of the reflected shock in polyatomic gases has been investigated by Strehlow and Cohen? The
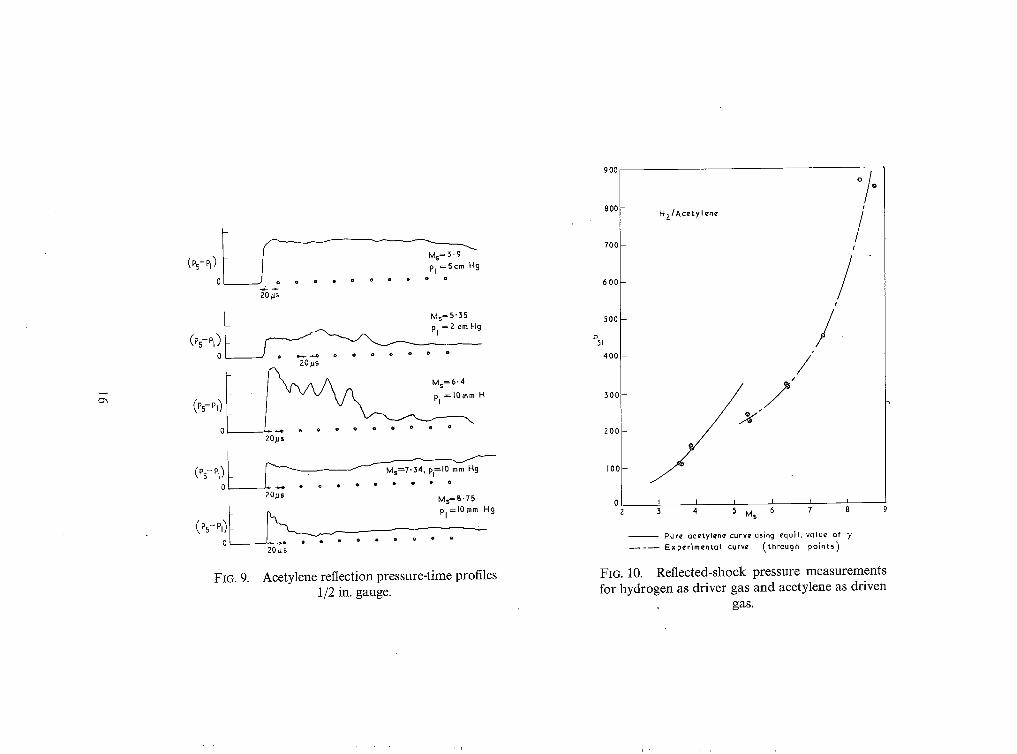
gases used in their experiments were methane and propane. At modest Mach numbers the bifurcation interaction is reported to be extremely violent. The polyatomic gas used in the present investigation was acetylene. The decomposition of acetylene to form carbon and hydrogen should occur behind the reflected shock, according to data obtained from a paper by S.S. Penner et al (1961), 24 for Mach numbers in excess of Ms ~ 4 (at the pressures used in the present investigation ; for example, the initial pressure required to give M s = 4 in this experiment was Pl = 5 cms Hg). At Mach numbers above this, effects due to decomposition should also be present. The pressure-time profiles obtained using acetylene are shown in Fig. 9. Although reminiscent of the foregoing pressure records in air, oxygen, argon and carbon dioxide for M < 4"0, above this value large changes in the pressure are observed, and under these conditions only the initial rise was used as a measure of the reflected-shock pressure. Measured values are plotted in Fig. 10. The continuous curve has been drawn using data from Penner et al, using the equilibrium ofv. For primary-shock Mach numbers less than M s -- 4 the experimental values agree with the theoretical, but for M s > 4 the points appear to lie on a different curve indicated by the broken line. This curve was not computed but represents a~ typical curve through the experimental points.
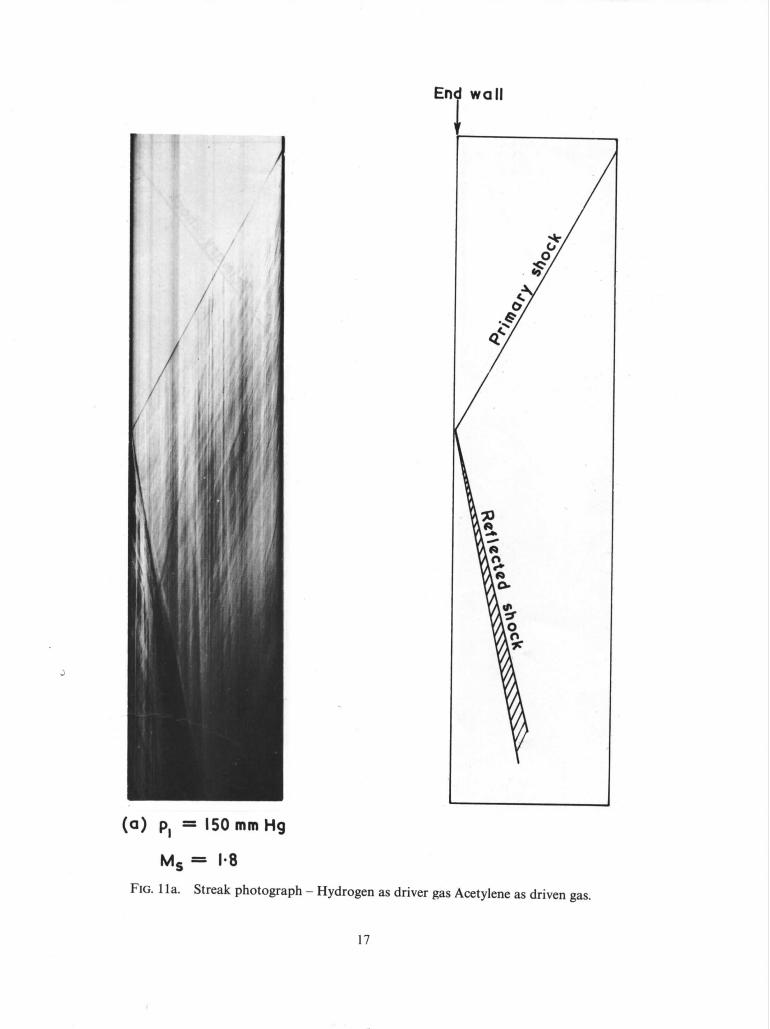
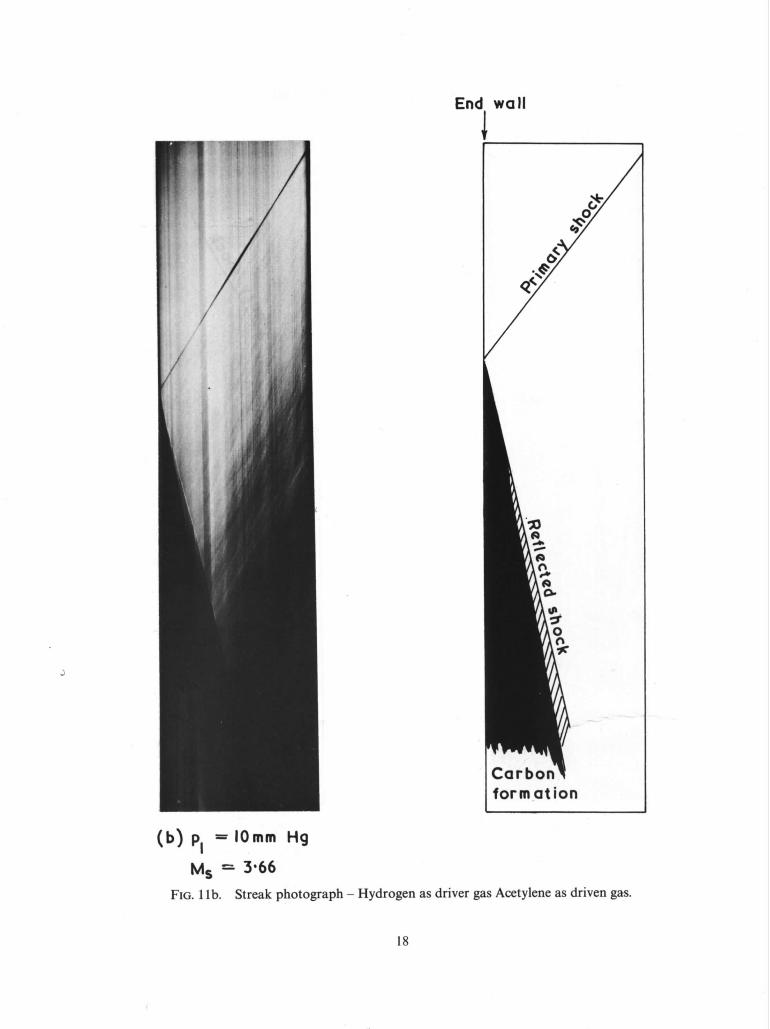
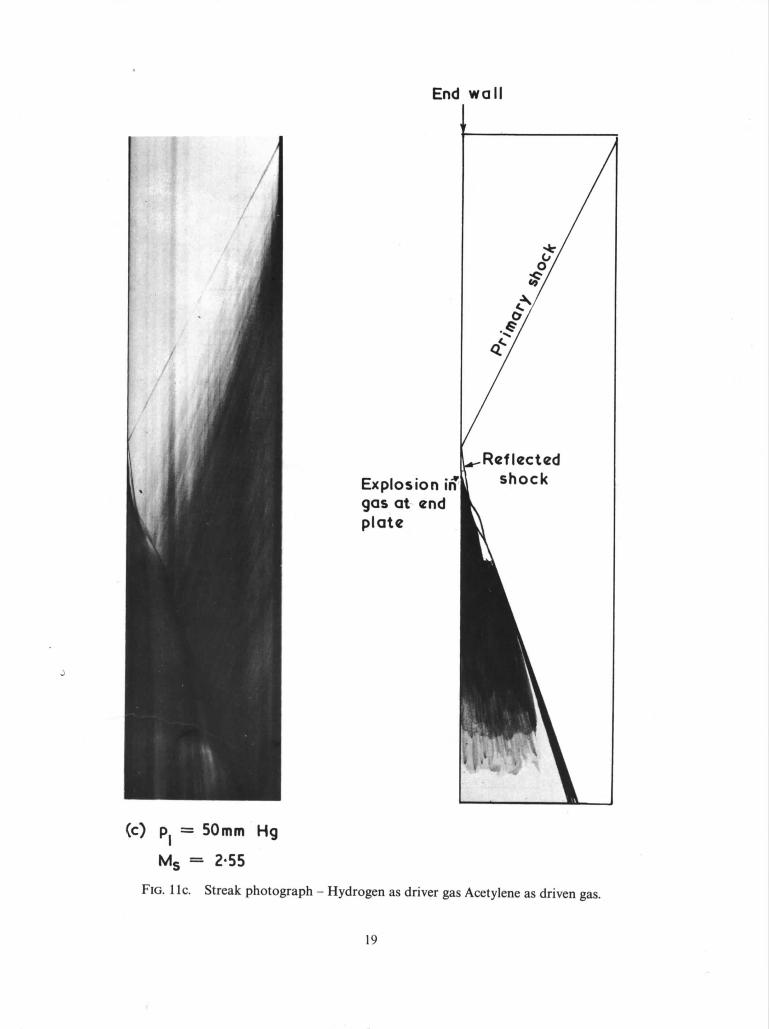
Additional data in the case of acetylene are the steak Schlieren photographs shown in Figs. 1 la, b and c. In l la , a primary-shock Mach number of 1.8 at an initial pressure of 150 mm Hg is shown. Evidence of pyrolysis is considered to be shown by the deposition of carbon in the tube. This should cover the windows and thus cause a blanking out of the light. There is no evidence of this in Fig. l l a but in Fig. l l b this is dramatically seen as a black swathe outlined by the motion of the reflected shock. This occurs at a primary-shock Mach number of 3-66 at an initial pressure of 10 mm Hg. Fig. 11c is included as it shows the effects of an explosion at the end plate following reflection of the primary shock. A detonation wave quickly overtakes the reflected-shock wave, interacts with it and then decays rapidly.
(f) Summary of results for short-duration recordings. Summarizing the experimental results at this point, it has been seen that for times of the order of 200
microseconds following reflection of the primary-shock wave, the pressure at the end plate remains steady (except for acetylene), showing a slight increase with time which becomes more significant as the Mach number increases (and the initial pressure decreases). The amount of increase in P5 depends on the gas but for air oxygen under similar conditions of initial pressure and Mach number rises of ,-~ 10 and ~20~o, respectively, of the initial rise have been observed. Woods 7 predicted that the combined effect of all flow phenomena is an acceleration of the reflected shock away from the end plate with an accompanying increase in pressure. This analysis, as stated previously, applies (as pointed out by Woods) to times not too far removed from the instant of reflection. Although little indication of this rise appears in the low Mach number cases over the first 200 microseconds, it will be seen (in Section 5) that a rise in pressure does occur when long duration records are examined. The effects of non-uniform reflected- shock motion are also absent from the short duration records except in the case of carbon dioxide and acetylene. Carbon dioxide has been shown, by Strehlow and Cohen, to bifurcate strongly and at the higher Mach numbers - typically for M s > 6 - a rapid decay in pressure occurs very soon after shock reflection. Acetylene is a separate case for primary shock Mach numbers in excess of 4 since this is approximately the threshold Mach number for pyrolysis to occur behind the reflected shock and, as seen from the pressure records and Schlieren photographs, violent interactions and chemical reactions occur.
When the mean pressure levels over the first 200 microseconds - or, in the case where large changes occur, over the initial 'level' pressure r eg ion - are measured, and compared with the various real-gas
and perfect-gas curves applicable to the gas under test, the agreement with the real gas curves for air and oxygen is reasonably good, and with the ideal-gas curves for argon and carbon dioxide. Again acetylene behaves in a different manner and an empirical curve has to be drawn through the experimental points for Ms > 4.
If long duration pressure-time profiles for these gases are now examined additional complexities concerning the interaction of the reflected shock with the contact surface, for example, will occur and have to be accounted for.
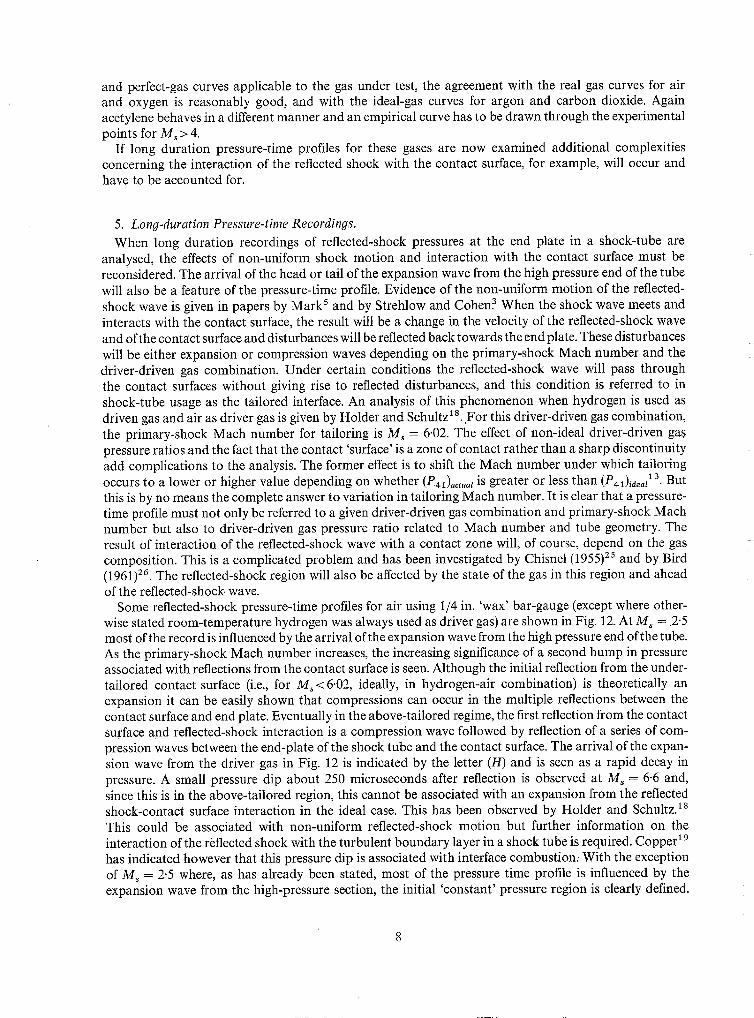
5. Long-duration Pressure-time Recordings. When long duration recordings of reflected-shock pressures at the end plate in a shock-tube are
analysed, the effects of non-uniform shock motion and interaction with the contact surface must be reconsidered. The arrival of the head or tail of the expansion wave from the high pressure end of the tube will also be a feature of the pressure-time profile. Evidence of the non-uniform motion of the reflected- shock wave is given in papers by Mark 5 and by Strehlow and Cohen? When the shock wave meets and interacts with the contact surface, the result will be a change in the velocity of the reflected-shock wave and of the contact surface and disturbances will be reflected back towards the end plate. These disturbances will be either expansion or compression waves depending on the primary-shock Mach number and the driver-driven gas combination. Under certain conditions the reflected-shock wave will pass through the contact surfaces without giving rise to reflected disturbances, and this condition is referred to in shock-tube usage as the tailored interface. An analysis of this phenomenon when hydrogen is used as driven gas and air as driver gas is given by Holder and Schultz 18. F o r this driver-driven gas combination, the primary-shock Mach number for tailoring is Ms = 6.02. The effect of non-ideal driver-driven gas pressure ratios and the fact that the contact 'surface' is a zone of contact rather than a sharp discontinuity add complications to the analysis. The former effect is to shift the Mach number under which tailoring occurs to a lower or higher value depending on whether (Pgl)aetuat is greater or less than (P~)ieea~ ~ 3. But this is by no means the complete answer to variation in tailoring Mach number. It is clear that a pressure- time profile must not only be referred to a given driver-driven gas combination and primary-shock Mach number but also to driver-driven gas pressure ratio related to Mach number and tube geometry. The result of interaction of the reflected-shock wave with a contact zone will, of course, depend on the gas composition. This is a complicated problem and has been investigated by Chisnel (1955) z5 and by Bird (1961) 26 . The reflected-shock region will also be affected by the state of the gas in this region and ahead of the reflected-shock wave.
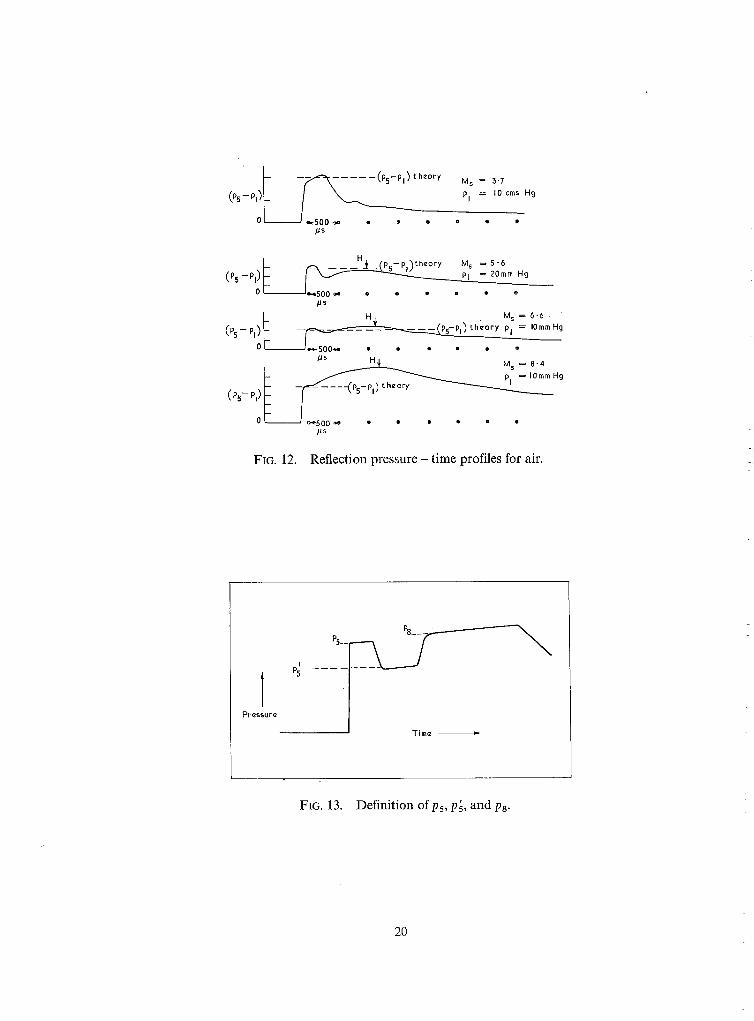
Some reflected-shock pressure-time profiles for air using 1/4 in. 'wax' bar-gauge (except where other- wise stated room-temperature hydrogen was always used as driver gas) are shown in Fig. 12. At M s = 2-5 most of the record is influenced by the arrival of the expansion wave from the high pressure end of the tube. As the primary-shock Mach number increases, the increasing significance of a second hump in pressure associated with reflections from the contact surface is seen. Although the initial reflection from the under- tailored contact surface (i.e., for Ms<6"02, ideally, in hydrogen-air combination) is theoretically an expansion it can be easily shown that compressions can occur in the multiple reflections between the contact surface and end plate. Eventually in the above-tailored regime, the first reflection from the contact surface and reflected-shock interaction is a compression wave followed by reflection of a series of com- pression waves between the end-plate of the shock tube and the contact surface. The arrival of the expan- sion wave from the driver gas in Fig. 12 is indicated by the letter (H) and is seen as a rapid decay in pressure. A small pressure dip about 250 microseconds after reflection is observed at Ms = 6-6 and, since this is in the above-tailored region, this cannot be associated with an expansion from the reflected shock-contact surface interaction in the ideal case. This has been observed by Holder and Schultz. 18 This could be associated with non-uniform reflected-shock motion but further information on the interaction of the reflected shock with the turbulent boundary layer in a shock tube is required. Copper t9 has indicated however that this pressure dip is associated with interface combustion.. With the exception of M s = 2.5 where, as has already been stated, most of the pressure time profile is influenced by the expansion wave from the high-pressure section, the initial 'constant' pressure region is clearly defined.
It is now possible to observe the increase in pressure immediately after reflection described by Woods. This pressure region is terminated by the arrival of the expansion wave from the reflected-shock interaction with the contact-surface region in the under-tailored cases and by a pressure fall, which is possibly associated with non-uniform shock motion, in the higher-Mach-number cases. Though at the lower Mach numbers a combination of both effects might occur.
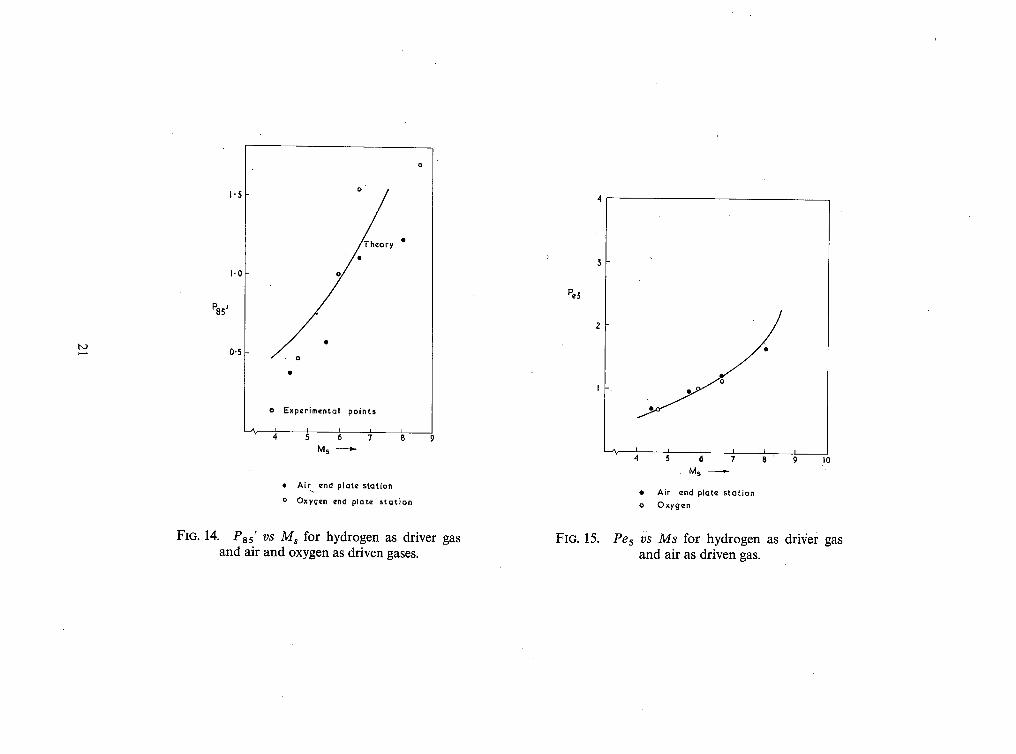
Holder and Schult~dentify various parts of the pressure profiles as is shown in Fig. 13. p; is the pressure at the end plate immediately before the arrival of the initial disturbance reflected from the interaction between the reflected-shock wave and the contact surface. This pressure is used to estimate the pressure ratio across the first disturbance from the reflected-shock and contact-surface interaction (P~5). As is seen from Fig. 14, the agreement with the theoretical curve is not very good. This is not surprising owing to the non-uniform motion of the reflected shock and non-ideal-contact surface. The measured values lie below the theoretical values which is consistent with the measurements in a 2 in. internal diameter shock tube, under similar conditions, made by the last-mentioned authors. These authors also define an equilibrium pressure (Pe) which is defined as the pressure that would be reached if the flow behind the contact surface was brought to rest by the first transmitted shock. It can be shown that Pe is very close to the pressure eventually obtained by the multiple reflections between the contact surface and the end plate (see Holder and Schultz). A plot of Pe5 versus Mach number including some measurements in air is shown in Fig. 15. The continuous curve has been calculated as by Holder and Schultz. The agreement here is seen to be reasonably good.
2"
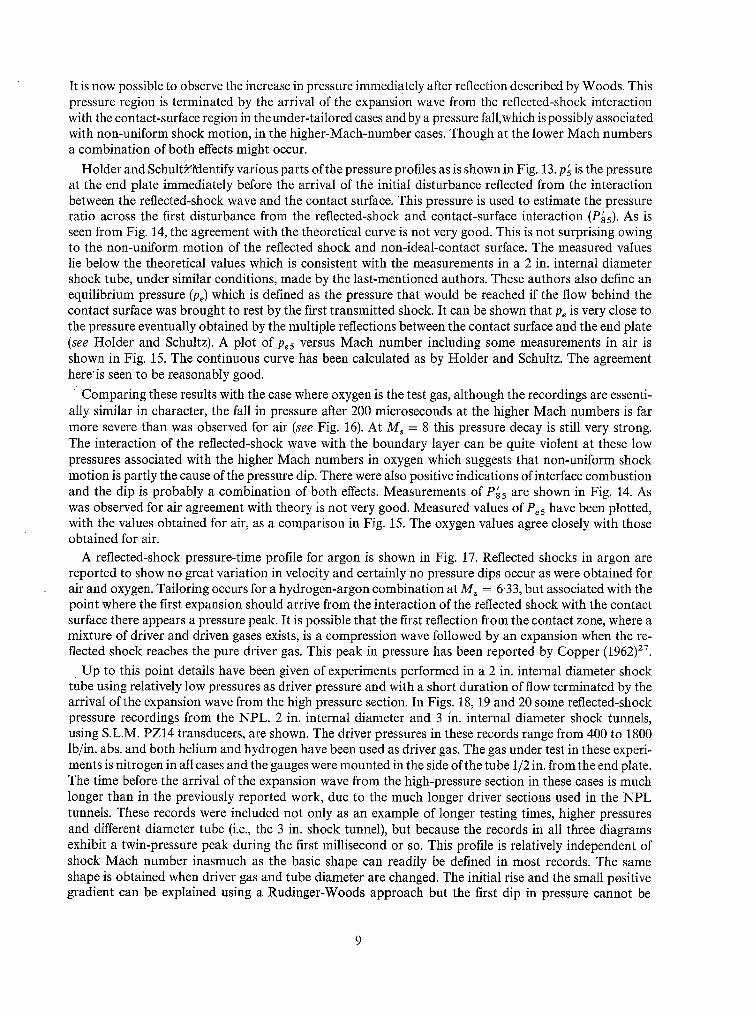
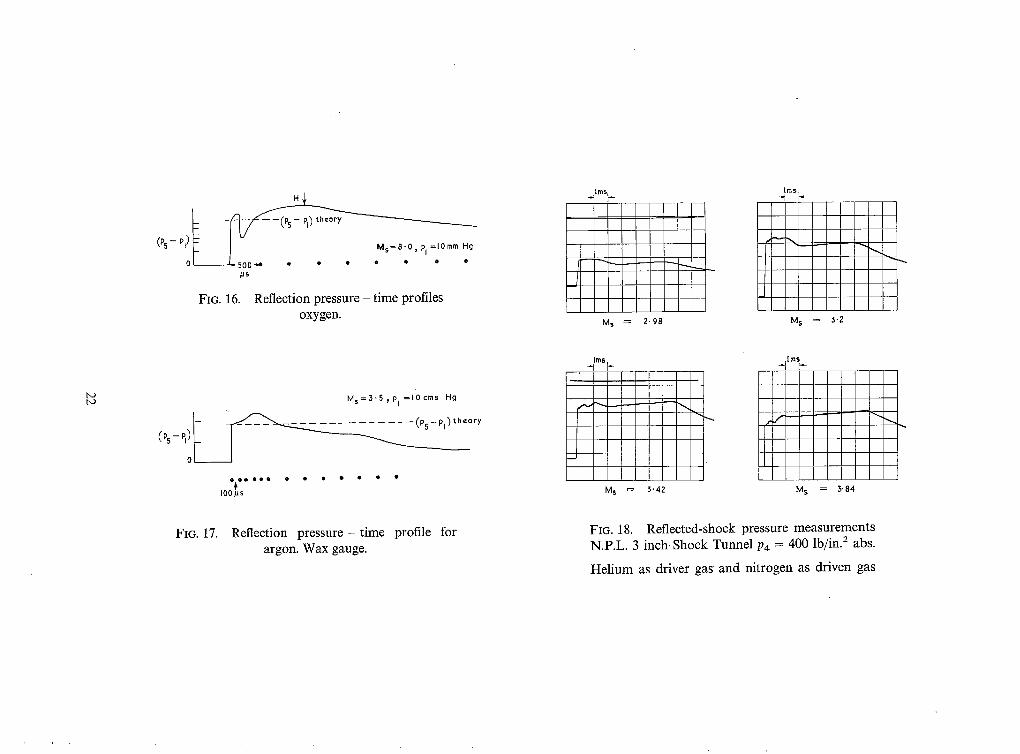
Comparing these results with the case where oxygen is the test gas, although the recordings are essenti- ally similar in character, the fall in pressure after 200 microseconds at the higher Mach numbers is far more severe than was observed for air (see Fig. 16). At Ms -- 8 this pressure decay is still very strong. The interaction of the reflected-shock wave with the boundary layer can be quite violent at these low pressures associated with the higher Mach numbers in oxygen which suggests that non-uniform shock motion is partly the cause of the pressure dip. There were also positive indications of interface combust ion and the dip is probably a combination of both effects. Measurements of P~s are shown in Fig. 14. As was observed for air agreement with theory is not very good. Measured values of Pe5 have been plotted, with the values obtained for air, as a comparison in Fig. 15. The oxygen values agree closely with those obtained for air.
A reflected-shock pressure-time profile for argon is shown in Fig. 17. Reflected shocks in argon are reported to show no great variation in velocity and certainly no pressure dips occur as were obtained for air and oxygen. Tailoring occurs for a hydrogen-argon combination at M~ = 6"33, but associated with the point where the first expansion should arrive from the interaction of the reflected shock with the contact surface there appears a pressure peak. It is possible that the first reflection from the contact zone, where a mixture of driver and driven gases exists, is a compression wave followed by an expansion when the re- flected shock reaches the pure driver gas. This peak in pressure has been reported by Copper (1962) 27 .
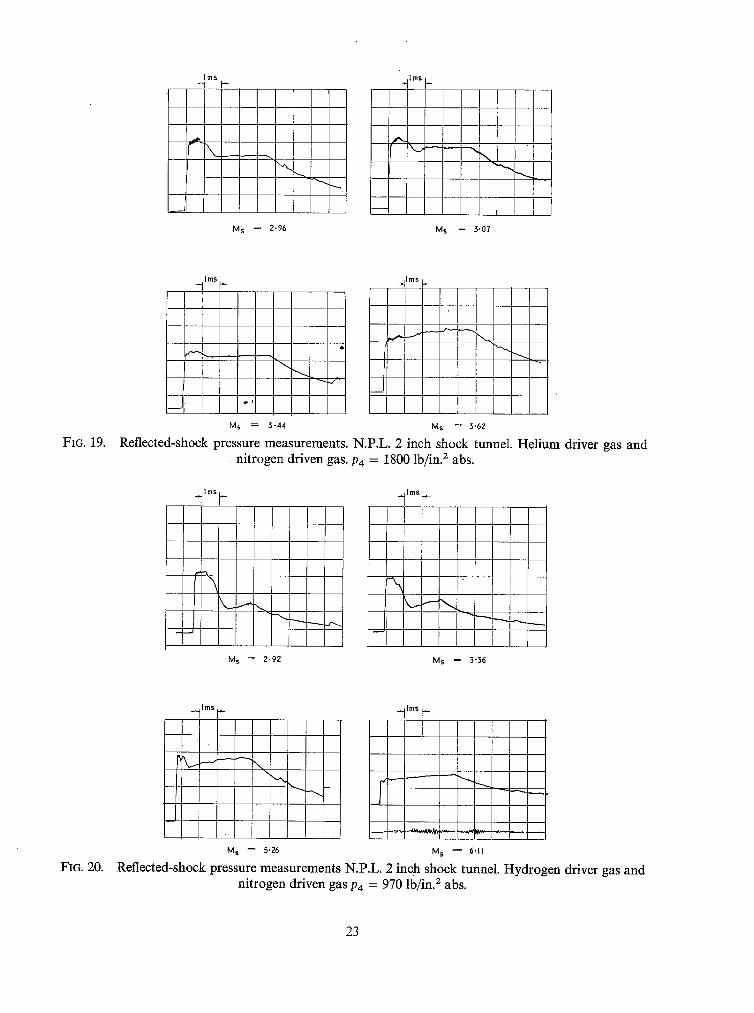
Up to this point details have been given of experiments performed in a 2 in. internal diameter shock tube using relatively low pressures as driver pressure and with a short duration of flow terminated by the arrival of the expansion wave from the high pressure section. In Figs. 18, 19 and 20 some reflected-shock pressure recordings from the NPL. 2 in. internal diameter and 3 in. internal diameter shock tunnels, using S.L.M. PZ14 transducers, are shown. The driver pressures in these records range from 400 to 1800 Ib/in. abs. and both helium and hydrogen have been used as driver gas. The gas under test in these experi- ments is nitrogen in all cases and the gauges were mounted in the side of the tube 1/2 in. from the end plate. The time before the arrival of the expansion wave from the high-pressure section in these cases is much longer than in the previously reported work, due to the much longer driver sections used in the N P L tunnels. These records were included not only as an example of longer testing times, higher pressures and different diameter tube (i.e., the 3 in. shock tunnel), but because the records in all three diagrams exhibit a twin-pressure peak during the first millisecond or so. This profile is relatively independent of shock Mach number inasmuch as the basic shape can readily be defined in most records. The same shape is obtained when driver gas and tube diameter are changed. The initial rise and the small positive gradient can be explained using a Rudinger-Woods approach but the first dip in pressure cannot be
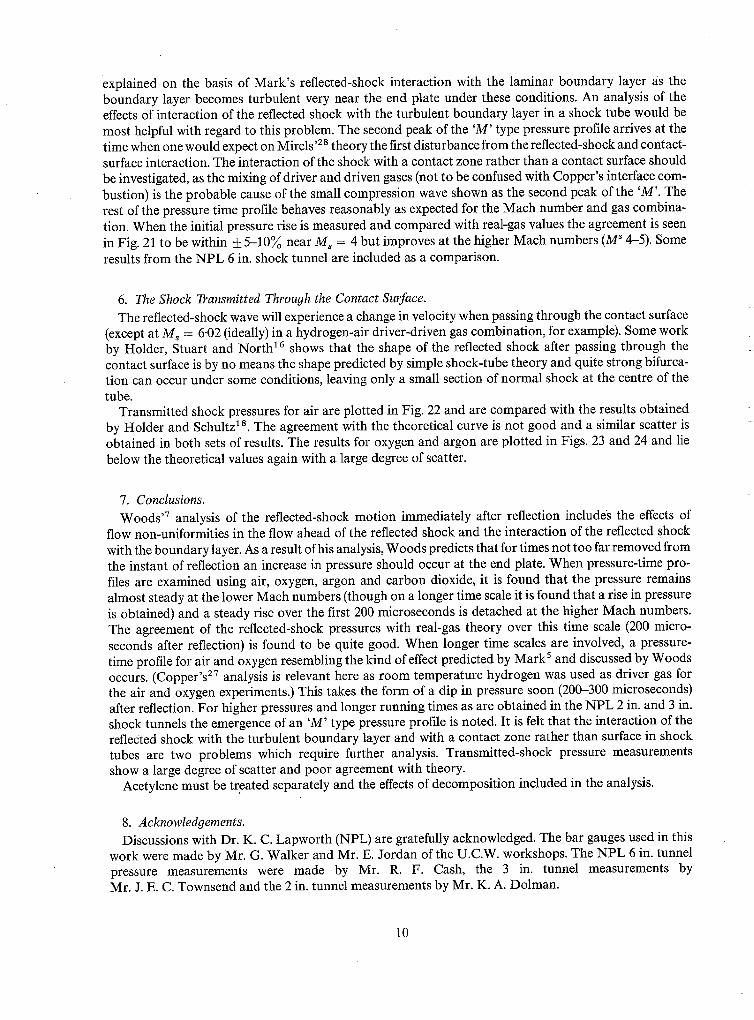
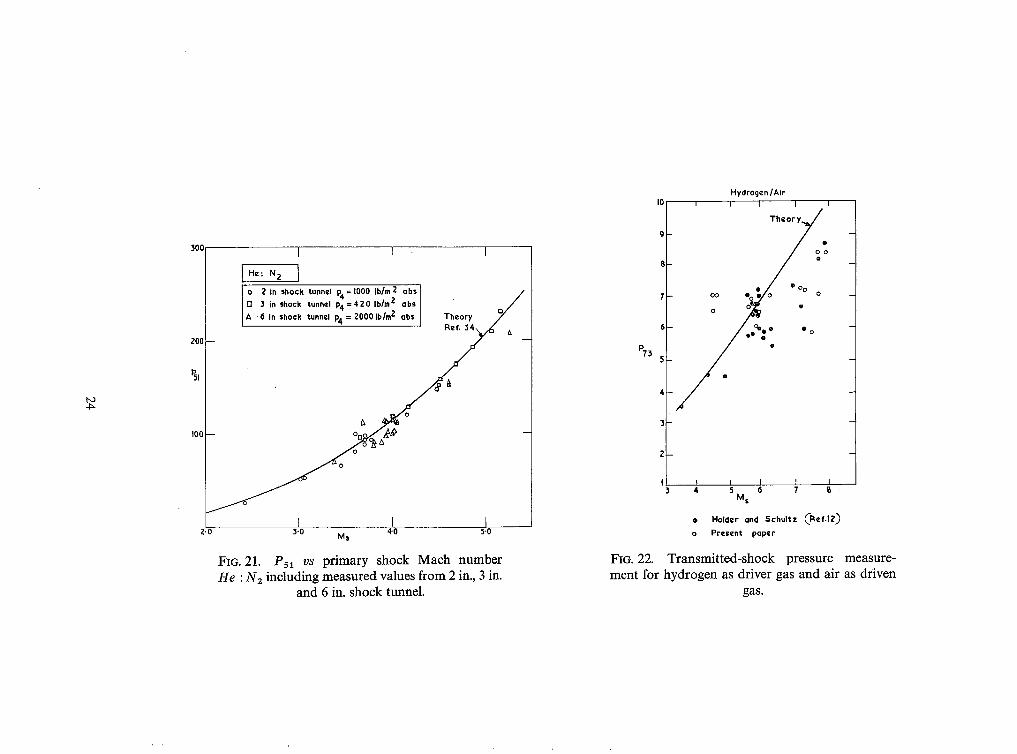
explained on the basis of Mark's reflected-shock interaction with the laminar boundary layer as the boundary layer becomes turbulent very near the end plate under these conditions. An analysis of the effects of interaction of the reflected shock with the turbulent boundary layer in a shock tube would be most helpful with regard to this problem. The second peak of the 'M' type pressure profile arrives at the time when one would expect on Mirels '28 theory the first disturbance from the reflected-shock and contact- surface interaction. The interaction of the shock with a contact zone rather than a contact surface should be investigated, as the mixing of driver and driven gases (not to be confused with Copper's interface com- bustion) is the probable cause of the small compression wave shown as the second peak of the 'M'. The rest of the pressure time profile behaves reasonably as expected for the Mach number and gas combina- tion. When the initial pressure rise is measured and compared with real-gas values the agreement is seen in Fig. 21 to be within +_ 5-10~ near Ms = 4 but improves at the higher Mach numbers (M s 4-5). Some results from the NPL 6 in. shock tunnel are included as a comparison.
6. The Shock Transmitted Through the Contact Surface. The reflected-shock wave will experience a change in velocity when passing through the contact surface
(except at M, = 6.02 (ideally) in a hydrogen-air driver-driven gas combination, for example). Some work by Holder, Stuart and North 16 shows that the shape of the reflected shock after passing through the contact surface is by no means the shape predicted by simple shock-tube theory and quite strong bifurca- tion can occur under some conditions, leaving only a small section of normal shock at the centre of the tube.
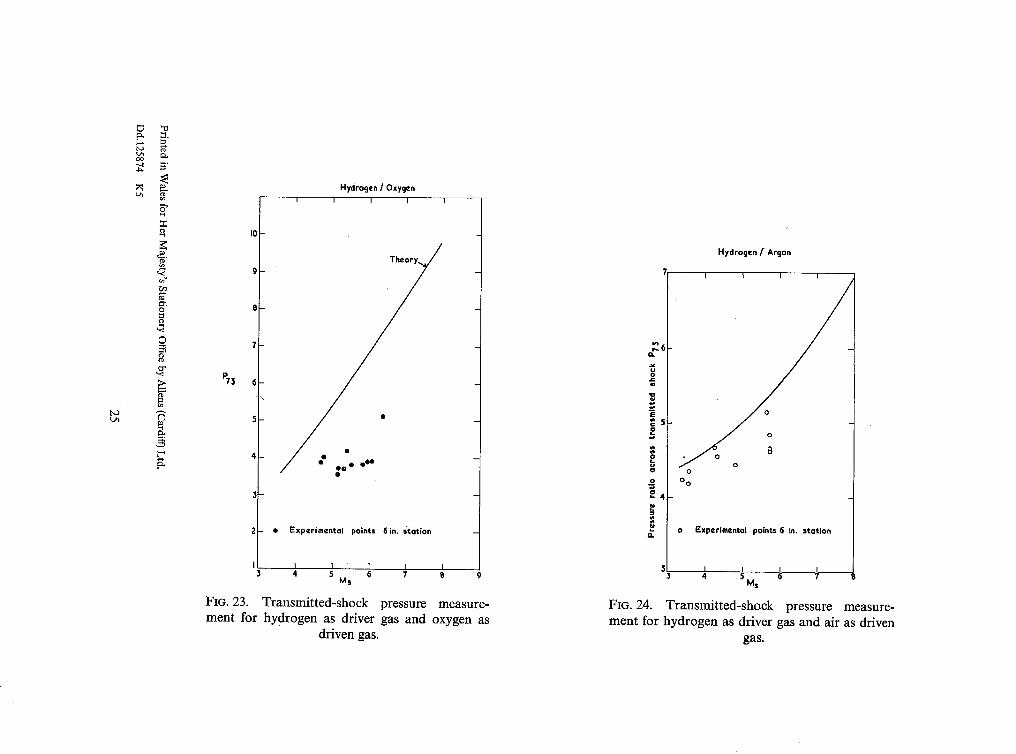
Transmitted shock pressures for air are plotted in Fig. 22 and are compared with the results obtained by Holder and Schultz 18. The agreement with the theoretical curve is not good and a similar scatter is obtained in both sets of results. The results for oxygen and argon are plotted in Figs. 23 and 24 and lie below the theoretical values again with a large degree of scatter.
7. Conclusions. Woods '7 analysis of the reflected-shock motion immediately after reflection includes the effects of
flow non-uniformities in the flow ahead of the reflected shock and the interaction of the reflected shock with the boundary layer. As a result of his analysis, Woods predicts that for times not too far removed from the instant of reflection an increase in pressure should occur at the end plate. When pressure-time pro- files are examined using air, oxygen, argon and carbon dioxide, it is found that the pressure remains almost steady at the lower Mach numbers (though on a longer time scale it is found that a rise in pressure is obtained) and a steady rise over the first 200 microseconds is detached at the higher Mach numbers. The agreement of the reflected-shock pressures with real-gas theory over this time scale (200 micro- seconds after reflection) is found to be quite good. When longer time scales are involved, a pressure- time profile for air and oxygen resembling the kind of effect predicted by Mark s and discussed by Woods occurs. (Copper's 27 analysis is relevant here as room temperature hydrogen was used as driver gas for the air and oxygen experiments.) This takes the form of a dip in pressure soon (200-300 microseconds) after reflection. For higher pressures and longer running times as are obtained in the NPL 2 in. and 3 in. shock tunnels the emergence of an 'M' type pressure profile is noted. It is felt that the interaction of the reflected shock with the turbulent boundary layer and with a contact zone rather than surface in shock tubes are two problems which require further analysis. Transmitted-shock pressure measurements show a large degree of scatter and poor agreement with theory.
Acetylene must be treated separately and the effects of decomposition included in the analysis.
8. Acknowledgements. Discussions with Dr. K. C. Lapworth (NPL) are gratefully acknowledged. The bar gauges used in this
work were made by Mr. G. Walker and Mr. E. Jordan of the U.C.W. workshops. The NPL 6 in. tunnel pressure measurements were made by Mr. R. F. Cash, the 3 in. tunnel measurements by Mr. J. E. C. Townsend and the 2 in. tunnel measurements by Mr. K. A. Dolman.
10
No. Author(s)
1 J .P. Toennies and E. F. Greene
2 R. A. Strehlow and A. Cohen
3 R .A. Strehlow and A. Cohen
4 W.C. Gardiner and . . . . G. B. Kistiakowsky
5 H. Mark . . . . . .
6 G. Rudinger . . . . . .
7 B.A. Woods . . . . . .
8 K.C. Lapworth . . . .
9 G.A. Skinner . . . . . .
10 T.A. Brabbs, Z. A. Zlatarich and F. E. Bells
11 I .I . Glass . . . . . .
12 L. Davies, L. Pennelegion, . . P. Gough and K. Dolman
13 L. Davies . . . . . .
14 J .N. Bradley . . . . . .
15 G. Kamimoto, T. Akamatsu and T. Hasegawa
16 D. W. Holder, C. M. Stuart and R. J. North
17 S. Byron and N. Rott . . . .
18 D.W. Holder and D. L. Schultz
REFERENCES
~tIe, etc.
J. Chem. PHys. 26, 655 (1957).
J. Chem. Phys. 28, (1958).
Limitations of the reflected-shock technique for studying fast chemical reactions and its application to the observation of relaxation in nitrogen and oxygen.
J. Chem. Phys. 30, 257 (1959).
J. Chem. Phys. 34, 1080 (1961).
The interaction of a reflected shock wave with the boundary layer in a shock tube.
NACA TM.1418 (March, 1958).
J. Phys. Fluids, 4, 12 (1961).
A linearized investigation of the effect of a wall boundary layer on the motion of a reflected shock.
A.R.C.24 571. October, 1962.
Agardograph 68, Pergamon Press (1963).
J. Chem. Phys. 31, 268 (1959).
J. Chem. Phys. 33, 307 (1960).
U.T.I.A. Review 12, Part 1 (1958).
The effects of high pressure on the flow in the reflected shock tunnel.
A.R.C.C.P. No. 730 (1963). "
High pressure real gas drivers and tailoring in shock tunnels. A.R.C.C.P. No. 770. December, 1963.
Shock waves in chemistry and physics. Methuen & Co. Ltd. (1962).
Effect of shock attenuation on reflected-shock waves. Dept. of Aeronautical Engineering, Kyoto University, CP.2, October, 1962.
" 7
A.R.C.24 608.14th March, 1963.
The interaction of a reflected shock with the contact surface and boundary layer in a shock tube.
A.R.C.22 891.19th September, 1961.
Proc. 1961, Heat Transfer and Fluid Mechanics Institute (Ed. Binder et al).
Stanford University Press (1961).
On the flow in a reflected-shock tunnel. A.R.C.R. & M. No. 3265 (1962).
11
No. Author(s)
19 J.A. Copper . .
20 K .C . Lapworth and J. E. G. Townsend
° .
21 L. Davies . . . . . .
22 D . H . Edwards, L. Davies and T. R. Lawrence
23 H .T . Nagamatsu . . . .
24 S. S. Penner, E. N. Bennett, F. Harshbarger and W. J. Hooker
25 R.F . Chisnel
26 G.A. Bird
27 J.A. Copper
28 H. Mirels
REFERENCES--cont inued
Title, etc.
A.I.A.A. Journ:, Vol. 2, No. 9, September, 1964.
Temperature and pressure studies in the reservoir of a reflected- shock hypersonic tunnel•
• A.R.C.26 110. December, 1964.
The interaction of the reflected shock with the boundary layer in a shock tube and its influence on the duration of hot flow in a refracted-shock tunnel.
Part I - A.R.C.C.P. No. 880. July, 1965. Part II - A.R.C.C.P. No. 881. September, 1965.
The application of a piezo-electric bar gauge to shock tube studies• J. Sci. Instr. 41 (1964).
Fundamental data obtained from shock tube experiments• Pergamon Press (1961).
Fundamental data obtained from shock tube experiments• Pergamon Press (1961)•
•. The normal motion of a shock wave through a non-uniform one- dimensional medium.
Proc. Roy. Soc.(A), November, 1955, Vol. 232.
•. d. Fluid Mech., Vol. 11, Part 2 (1961).
. . d. Phys. Fluids 5, 844 (1962)•
.. Attenuation in a shock tube due to unsteady-boundary-layer action•
NACA Report 1333 (1957). (Supersedes NACA T N 3278).
12
t H2/Air
(%-Pl)
(4) ",
/ /
," (3) .,-/" "~ /. //(2) /
/' / " / ~
~X
Dioph ragm position
FIG. l. Diagram showing notation.
f - - - - ~ - T h e o r y I Ms= 2.6 "
o I . . _ . . . . . T ' ° : ? . 20#s
(Ps- Pl) f 0
FIG. 2.
~--Th¢ory Ms= 6'6
Pl = I0 m m Hg • e o • •
20us
Reflection pressure-time profiles for Air. 1/4 in. gauge.
800
7O0
600
500
P51
400
300
200
I00
o Real gas (.Gloss Rcf. 22) " ~ /Z.P,r fs¢ ct
• o ~ ° o e
e
I I " 1 2 3 4 5 6 7 8
M s
• I/2 inch bar gouge end plate station o I/4 inch bar gauge end plate station
FIG. 3. Reflected-shock pressure measurements for hydrogen as driver gas and air as test gas.
(~-~')o ~-
(,Ps- h) I 0 l
FI~. 4.
FIG. 6.
. . . . . . . . . . ( . ~ - . , ) Theory
20#s
. . . . . . . (Ps-P,) ~ Theory
M s = 5 . 8
P l=10rnm Hg
e~- -t-o • • • o • e • • 20.us
Reflection pressure-time profiles. Oxygen 1/4 in. gauge.
- - - - Theory MS~ 5,6
_e * , . . . . . Pl ~ 2 cm H 9
20#s
Reflection pressure - time profiles. Argon 1/4 in. gauge.
600
500
400
500
200
I 0 0
H 2 / O x y g e n
o)/ o o o
/
I I I I 5 4 5 6 7
Ms
o [/4 inch bar gauge end plate s t a t i o n @ I /2 inch bar g a u g e e n d plate s t a t i o n
FIG. 5. Reflected-shock pressure measurements for hydrogen as driver gas and oxygen as driven gas.
200
150
P51
100
50
10
• H z / A r g o n
Perfect gas theory
• I/4 inch bar gauge, end p la te
o I/z inch bar gauge, end p l a t e
i I i
3 M s 4 5
FIG. 7. Reflected-shock pressure measurements for hydrogen as driver gas and Argon as driven gas.
H 2 /CO 2 700
600
500
400
P 51
500
200
I00
0 2
o
" oO
I I I I i 3 4 M s 5 6 7
• I/4 "Inch bar gauge o I /z inch bar gauge
FIG. 8. Reflected-shock pressure measurements for hydrogen as driver gas and carbon dioxide as
driven gas.
(P5- PI)ot
(Ps-P~) I 0
(P~- P') f 0
(%- Pl) f 0k
0~
FIG. 9.
~ o
20#s
Ms=3-9 PI =Scm It 9
e o e e e
Ms=5"35 PI = 2 cm Hg
e e
20/~s
~ - ~.~ e o e o • o o • • 20#s
~ =7.34, pi=10 mm H9 m • e
20#s Ms=B,? 5 pi =10mm Hg
~ ~ - - - - ~ e • e • e • e e o 20#s
Acetylene reflection pressure-time profiles 1/2 in. gauge.
900
800
700
600
500
% 400
30C
200
lO0
0
Hz/Acety lene
/
/ f
I I I I f P 3 4 5 Ms 6 7 8
- - Pure acetylene curv~' using equil, value of ~' - - - - - ExperimentaJ curve (through po in ts)
O/o
/ I
FIG. 10. Reflected-shock pressure measurements for hydrogen as driver gas and acetylene as driven
gas.
End wo II
/
S, /
! / t
( a ) Pl = 150 mm H9
M s = 1.8
FIG. l la. Streak photograph - Hydrogen as driver gas Acetylene as driven gas.
17
End wall
(b) Pl '~ 10ram Hg
M s f f i 3.66 FIG. I lb. Streak photograph - Hydrogen as driver gas Acetylene as driven gas.
18
End wa II
Explosion i~ gas at end p la te
. -Re f lec ted ~hnrk
(c) Pl --- S0mm Hg
M s = 2,55
FIt3. 1 lc. Streak photograph - Hydrogen as driver gas Acetylene as driven gas.
]9
(Ps-P,) I O /
- - t T , , ~ - - - - - - - - - - ( p s - p l ) t heory M s = 3"7
PI = 10 cms Hg
t ~-SOO -~ • ~ • o • •
(PS --Pl~I
I
(Ps- P,) I 0 /
H _ ~ i_(ps-h)th,o~y Ms =s-6 p[ ~ 20ram Hg
e o • • • o
#s H . M s =6"6 •
__ 500~__ _~__ __~pS-Pl). • • • theory. PI e= 10ram Hg
# ~ M s = 8-4 Pl ~ I 0 mm Hg
- - ; - - ---(PS- h) t "~°rY
f c,.~500 ~ o • • • • •
#s
FIG. 12. Reflection pressure - t ime profiles for air.
T ~r~ssur~
I P5
P8_-- "
P S - i ~ w,
FIG. 13. Definition ofps, p~, and P8-
20
i .0
Pss'
0.5
a"
y
o Experimental points
M s J=
• A i r end plate stat ion
o Oxygen end plate s ta t i on
FIG. 14. Pss' vs Ms for hydrogen as driver gas and air and oxygen as driven gases.
~5
FIG, 15.
- - % i i I I
M S
• A i r end plate s ta t ion
o Oxygen
Pes vS Ms for hydrogen as drNer gas and air as driven gas.
(P5- PL)0f
FIG. 16.
M s = 8 " 0 ' P l=10mm Hg
• • o
,us
Reflection pressure - t i m e profiles oxygen.
_slmsp_
Ms = 2.98 M s = 5.2
I
- -q . .
to to
(Ps-P~) l 0 /
Ms=3-S~p I = l O c m s H~
(p5-- pl ) t h e o r y
o o e o o o • • o •
I O 0 # s
~m,l._
M s
I ~qt~L
3.42 M s = 3.84
FIG. 17. Reflection pres sure - time profile for argon. Wax gauge.
FIG. 18. Reflected-shock pressure measurements N.P.L. 3 inch Shock Tunnel P4 = 400 lb/in. 2 abs.
Hel ium as driver gas and nitrogen as driven gas
ImS ~I rns ~_
\ _
m m
Ms = 2 -96 Ms = 3 - 0 7
FIG. 19.
~lrns I-'-
Ms = 3 - 4 4 Ms = 3 ' 6 2
Reflected-shock pressure measurements. N.P.L. 2 inch shock tunnel. Hel ium driver gas and nitrogen driven gas. P4 = 1800 lb/in? abs.
M s ~ 2 , 9 2 M s = 3'36
FIG. 20.
I
L._ 4 \
M s ~ 5"26 M s ~ 6'11
Reflected-shock pressure measurements N.P.L. 2 inch shock tunnel. Hydrogen driver gas and nitrogen driven gas P4 = 970 lb/in. 2 abs.
23
t.d,
300
Z00
~J
tO0
I I I
IHe:N2 I o Z in shock tunnel P4 = 1000 Ib/m 2 abs j ~]6 :: ::°:kk :;:r~: P4 ~. ;~000',bb//~Z2 ~;; TS,ory y
_ ,
I L I 2 .0 3 .0 4,0 5 .0
M s
FIG. 21. P51 vs primary shock Mach number He : N2 including measured values from 2 in., 3 in.
and 6 in. shock tunnel.
%
Hydrogen/Air i I I I I
T h e ° r / o
• • O0 CO O O e 0 0
0 0 u
00 o
t I I I I 4 5 G 7 ~ "
M s
• Holder and Schultz CI~¢f.lZ) o Present paper
FIG. 22. Transmitted-shock pressure measure- ment for hydrogen as driver gas and air as driven
gas.
b~
.~..
r~
© 7
~3 6
Hydrogen / Oxygen I k I I I
9 The° ry~ / / / /
8
4 * •
• Experimental points 6in. "~t.ation
I I l I I 4 5 6 7 g 9
MS
FIG. 23. Transmi t t ed - shock pressure measure- men t for hydrogen as driver gas and oxygen as
driven gas.
~ 6
E ~ 5 .o
o o
.o 4
Hydrogen f Argon
I I I I
i o
o o
o Experimental points 6 in. station
I I I I 4 $ 6 7
Ms
FIG. 24. T r a n s m i t t e d - s h o c k pressure measure- m e n t for h y d r o g e n as dr iver gas and ai r as dr iven
gas.
~ . & M. Ne. 3446
© Crown copyright 1967
Published by HER MAJESTY'S STATIONERY OFFICE
To be purchased from 49 High Holborn, London w.c.1 423 Oxford Street, London w.1 13A Castle Street, Edinburgh 2
109 St. Mary Street, Cardiff Brazennose Street, Manchester 2
50 Fairfax Street, Bristol 1 35 Smallbrook, Ringway, Birmingham 5
80 Chichester Street, Belfast 1 or through any bookseller
~. & I~VL No, 3446
S.O. Code No. 23-3446