Embed Size (px)
Citation preview
386
1 INTRODUCTION Groins are structures that protrude into rivers from the bank and a suitable measure for bank protection and flood control. Recently groins have been received more attention from the standpoint of ecosystem. The de-sign, location, orientation and length of groins are very important subjects for the hydraulic engineers in the field. Basically, it is important to have a clear picture of flow phenomenon around these structures in order to be able to make a safe and economic design. Also, hydraulic conditions such as velocity, water depth, bed shape, and bed material around groins are so diverse to provide the ecosystem with suitable habitat. The de-velopment and magnitude of flow behavior for different angle of attacks are still undefined, though flow be-havior is of utmost importance to the design of any type of groin. Groins are structures that are normally con-structed either as a single groin or in series along the channel bank change river conditions, thereby creating a flow condition that promotes navigability and diverts the flow away from the bank. As one of the most popu-lar techniques for riverbank stabilization, groins have already been enjoyed a wide use in a number of river-bank stabilization projects and with a strong tendency to increase its applicability (Shields et al., 1995).
IABSE-JSCE Joint Conference on Advances in Bridge Engineering-II, August 8-10, 2010, Dhaka, Bangladesh. ISBN: 978-984-33-1893-0 Amin, Okui, Bhuiyan (eds.) www.iabse-bd.org
An experimental investigation of flow field around bell mouth groin
Md. Jahir Uddin Khulna University of Engineering and Technology, Khulna, Bangladesh
M.M.Hossain Bangladesh University of Engineering and Technology, Dhaka, Bangladesh
ABSTRACT: Groins are popular river training structures widely used all over the world including Bangla-desh. Groins have been used to create a flow condition that reduces the vulnerability of river bank erosion by diverting the flow away from the bank. Also groins have been used to increase the navigability of waterways. The flow structures around groin head play a very important role for their successful performance. Literature search reveals that bell mouth groins are relatively more popular in Bangladesh than other types of groins. But no systematic experiments have been conducted to study the flow pattern and flow behavior around bell mouth groins. Keeping this in view, a study was undertaken to investigate the flow field around bell mouth groin in a large mobile bed physical model facility (46m x 11 m) of BUET. A total number of 24 test runs were conducted. Three different discharges and four different angles and two groin conditions (submerged and non-submerged) was considered. Twelve tests were conducted for non-submerged conditions of which 6 (six) tests were with 14 cm depth and 6 (six) tests were with 18 cm depth. Similarly, another twelve tests were conducted with submerged condition of which 6 (six) had a water depth of 22 cm and the rest six with 26 cm depth. The top width of the shank of bell mouth groin was 12.5 cm and the bottom width was 32.5 cm. The height of groin above the bed surface was 20 cm and below the bed level was 40 cm. The top diameter at head of the groin was 15 cm and at base on the bed level was 35 cm. All tests were conducted for 8 hours duration in clear water condition. In order to avoid the ripple formation, the coarse sand with d50 = 0.75 mm was se-lected as bed material. Velocity data have been collected forming grids in both vertical and horizontal direc-tion around the vicinity of the bell mouth groin. Velocity was measured at 0.2, 0.4, 0.6 and 0.8 depths from the water surface by forming grids. For each grid 120 velocity measurements were taken, hence for 4-layers in one test run, 480 data on velocity have been collected with the help of a programmable electromagnetic ve-locity meter (P-EMS). Change in flow conditions around bell mouth groin for various test run have been ana-lyzed non-dimensionally in longitudinal, lateral and vertical direction. The study showed that for different groin arrangements the near bed velocity around the vicinity of bell mouth was reduced. In most of the cases, shifting away of maximum velocity was observed. Analysis of velocity contour also revealed this trend of shifting maximum velocity away from the bell mouth groin. In this paper the results of test runs conducted under submerged conditions for 1500 and 900 angles are reported.
387
Over the past several years, there has been a rapid expansion of literatures concerning groins under clear water scour condition in both laboratory experiment and numerical simulation (Rahman and Muramoto 1999, Ishigaki and Baba 2004); River course stabilization by groin like structures (Khaleduzzaman 2004); River bank stabilization in a bend by groin (Hossain 1981); velocity distribution in groin fields (Muto et al. 2005); Exchange process between river & its groin fields (Uijttewaal et al. 2001) etc. Kabir (2007) investigated the scour reduction technique and flow pattern around abutment using bottom vanes. Rahman et al. (2001, 2002) investigated flow field and scouring around piers and abutments.
From the foregoing discussion it is apparent that most of the above studies were concerned with pier, em-bankment, abutment, groin and spur-dikes mainly for assessment of local scour which is very frequently used in Bangladesh. But the development of scientific guiding principles for the bell mouth groin design is yet not fully explained. The reason is that bell mouth groin is typical in the Indian subcontinent including Bangla-desh. The flow structure and scour development around bell mouth groin is of great interest for the design of riverbank stabilization projects in Bangladesh. In the present study, which is exploratory and experimental in nature, flow structure around the single groin is investigated for submerged groin.
Groins vary depending on their action on the stream flow. They may be classified as attracting, deflecting or repelling groins. Groins may be further classified according to their appearance of plan. Straight groin is set at some angle from the bank and has a head to provide extra volume and area for scour protection at the outer end. T-head groin has a straight shank with a rectangular guide vane at the outer end. L-head groin or wing or trail groins have larger sediment deposits between groins, less scour at their head, provide greater protection to the banks and are more effective in channelization for navigation when the length closes 45 to 65 percent of the gap between the groins. Hockey shape groins have scour holes that are more extensive in area than the T-shape groins and do not appear to have any advantages over the other shapes (Richardson et al., 1975). Straight groin with mole head may be employed which provides extra volume of scour protection material and a gentler transition between groin head and river bed.
In some locations groins are constructed higher than the high water level, which are called non-submerged groin. In other locations groins are submerged under the water surface. In rivers with unsteady flow condi-tions, groins can serve as non-submerged in ordinary state or submerged during flood. The area behind the groin is either a dead zone during non-submerged conditions or a slow flow zone during submerged flow con-ditions. Most of previous investigators published experimental data on the various aspects of the local scour around emerged spur dikes. In their experiments, they have used flow depths that were less than the height of the spur-dike model, (Ahmed 1953; Liu et al. 1961). Many prototype spur dikes, however, were designed to regularly consider overtopping flow, submerged condition.
2 EXPERIMENTAL PROCEDURES The experiments have been carried out in a wide straight flume which is 45.60 m long, 2.45m wide and hav-ing a depth of 1m. The flume has a re-circulating water supply system with pre-pump storage pool, post pump upstream, measuring devices, measuring bridge, point gauges, tail gates, sediment trap and stilling basin etc. The water passed through an approach upstream reservoir provided with a series of baffles. These baffles dis-tributed the flow uniformly over the entire width of the flume and also helped in dissipating the excess energy of flow. The sand bed had a thickness of 30 cm. The sand used in the experiments reported herein has mean size of d50= 0.75 mm and standard deviation of σg= 1.94. The groin models used in the study were fabricated by wooden. The groin model was bell mouth type. The groin was positioned with different angle of inclina-tion of 60o, 90o, 135o and 150o with the downstream. A total number of 24 test runs were conducted. Three different discharge and two groin condition (submerged and non-submerged) was considered. Twelve tests were conducted for non-submerged conditions of which 6 (six) tests were with 14 cm depth and 6 (six) tests were with 18 cm depth. Similarly, another 12 (twelve) tests were conducted with submerged condition of which 6 (six) had a water depth of 22 cm and the rest six had a flow depth of 26 cm. To obtain a specific dis-charge, water level was maintained by adjusting the tailgate on downstream. The water discharge has been measured at two sharp-crested Rehbock weirs, one between the upstream reservoir and the flume and one in the recirculation channel. Only the Rehbock weir located at the re-circlulating canal has been used to measure the discharge on a routine basis at half hour intervals. The discharge has been calculated from reading of point gauge in the adjacent stilling basin using the following equation.
23
)(*2***32 HgLCQ weird ∆=
(1)
The free flow has been ensured only at the downstream weir and coefficient of discharge (Cd) has been calcu-lated to be 0.6.

388
Right flume wall
+X +Z
+Y
Fixed bed
Measuring tape
Flow
End fixed bed
Initial level of sand bed, Z=0
Origin of the system which is the lengthwise mid point of right wall at the initial bed level
Water depths were measured at one-hour intervals by the help of a point-gauge mounted on a wooden frame. Flow velocity measurements were obtained by using programmable electromagnetic velocity meter (P-EMS) consisting of a 50 mm-diameter probe and a control unit, mounted on a movable measuring carriage. The sensor of this instrument determines flow velocity components in two dimensions. P-EMS positions and readings were calibrated daily, as the instrument was removed every evening and re-installed every morning to prevent theft. Details of selected experimental runs are given in Table 1. Each test was designated by cer-tain notations. For example Test no.1 is designated by 170-S-150, it mean that the test was conducted at a dis-charge of 170 l/s, submerged condition with the groin placed at 150ο angle in direction towards downstream. All others tests have been similarly designated.
Each velocity reading has been taken as the average velocity of 30 seconds duration. Two velocity compo-nents, i.e. streamwise velocity (Vx) and transverse velocity (Vy), with standard deviations are read from the display screen of the control unit at a time. Grid point layout in XY plane at 0.2, 0.4, 0.6 and 0.8 depths from the water surface is formed and velocity has been measured on the selected grid. In each layer-grid, 120 ve-locity measurements have been collected, hence for 4-layers in one test run, 480 data on velocity have been collected. In this paper the results of test runs conducted under submerged conditions for 150o and 90o angles are reported. The grid point layout for velocity measurement in XY plane for two bell mouth groin arrange-ments are shown in Figure 1 & 2 respectively.
Figure 1.Grids for velocity measurement for 150ο angle Figure 2.Grids for velocity measurement for 90ο ang
2.1 Co-ordinate system A Cartesian co-ordinate system has been chosen and used during the experimentation in the flume as shown in Figure 3.
Figure 3. Coordinate system used in the experiment
-30
-20
-15 -5-10 403020151050
120
110
100
908580
70
60
50
20
30
Longitudinal distance, X cm
Late
ral d
ista
nce,
Y c
m
-130-120-110-100-90 -80 -70 -60
100
90
807570
60
-40 -20
50
40
30
20
10
0 Longitudinal distance, X cm
Late
ral d
ista
nce,
Y c
m

389
Table 1. Summary of the test program
Test No.
Test Designation
Discharge
(lit/sec) Angle of attack (degree) Water depth (cm)
1 170-NS-150 170 2 150-NS-150 150 3 130-NS-150 130
14
4 170-S-150 170 5 150-S-150 150 6 130-S-150 130
150
22
7 170-NS-135 170 8 150-NS-135 150 9 130-NS-135 130
18
10 170-S-135 170 11 150-S-135 150 12 130-S-135 130
135
26
13 170-NS-90 170 14 150-NS-90 150 15 130-NS-90 130
14
16 170-S-90 170 17 150-S-90 150 18 130-S-90 130
90
22
19 170-NS-60 170 20 150-NS-60 150 21 130-NS-60 130
18
22 170-S-60 170 23 150-S-60 150 24 130-S-60 130
60
26
2.2 Bell mouth groin dimensions Groin was installed on the bed surface. The top width was 12.5 cm and bottom width was 32.5 cm on the bed level. The height of groin above the bed surface is 20 cm and below the bed level was 40 cm. The top diame-ter at head of the groin is 15 cm and at base on the bed level is 35 cm. Shank and head slope is 2V:1H. All the dimension of the bell mouth groin above the bed surface was shown in the Figure 4.
Figure 4. Bell mouth groin dimension above the bed level (All dimensions are in cm)
3 RESULT AND DISCUSSION
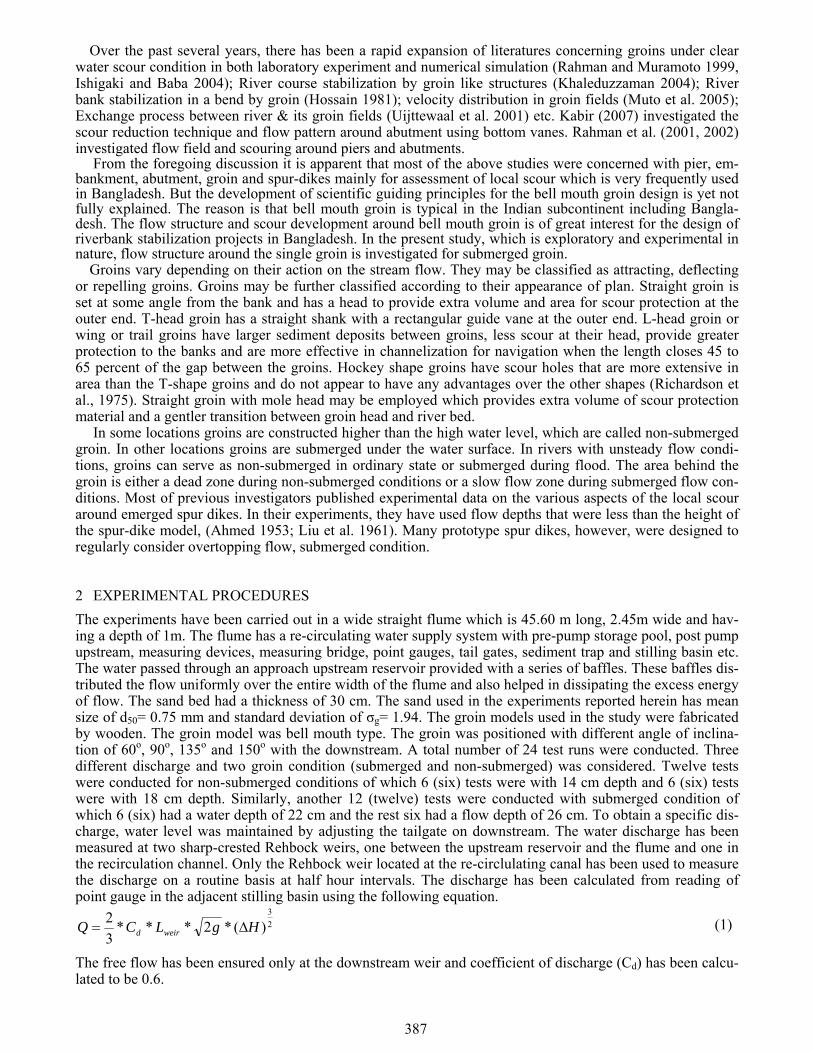
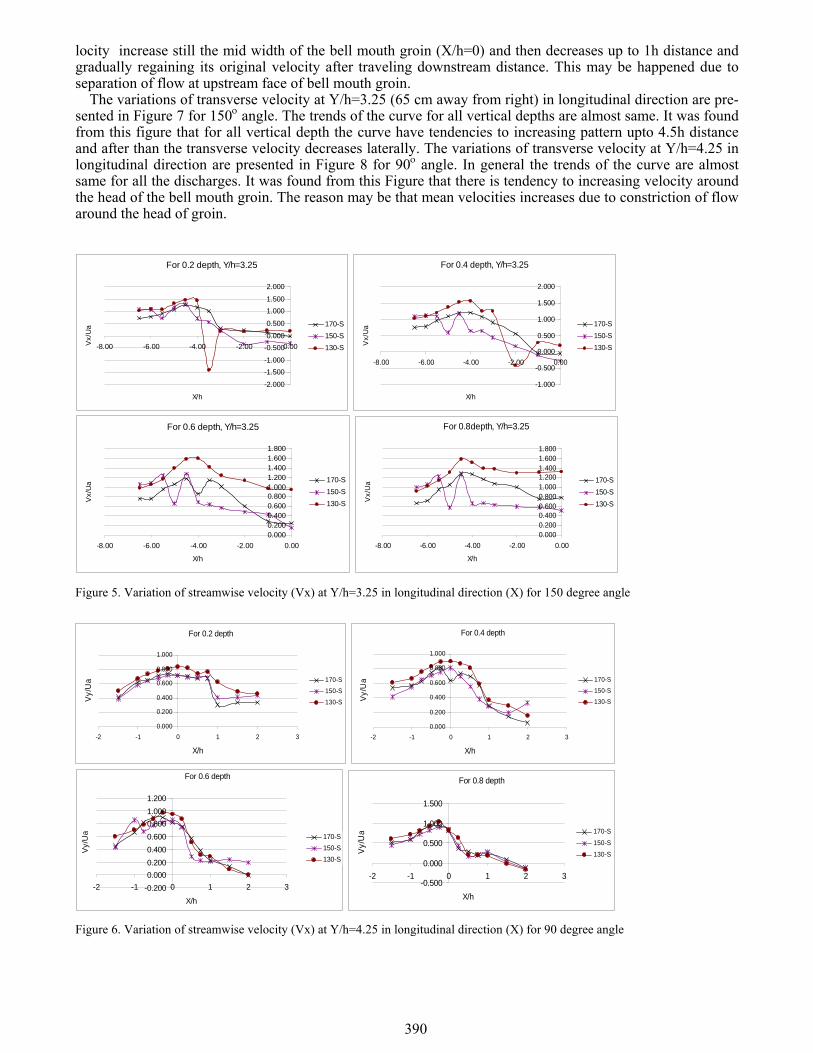
3.1 Velocity variation along longitudinal direction Figure 5 shows the variation of streamwise velocity at Y/h=3.25 (65cm away from right) in longitudinal di-rection for 150o angle. From this Figure it was found that the maximum velocity gains at the -4.0h distance i.e. around head of the bell mouth groin. Figure 6 shows the variation of streamwise velocity at Y/h=4.25 (85 cm away from right) in longitudinal direction for 900 angle. From this Figure it was found that streamwise ve-
Cross section 2-2
35
20
15
Cross section 1-1
12.5
20
32.5
1 1
2 2
390
locity increase still the mid width of the bell mouth groin (X/h=0) and then decreases up to 1h distance and gradually regaining its original velocity after traveling downstream distance. This may be happened due to separation of flow at upstream face of bell mouth groin.
The variations of transverse velocity at Y/h=3.25 (65 cm away from right) in longitudinal direction are pre-sented in Figure 7 for 150ο angle. The trends of the curve for all vertical depths are almost same. It was found from this figure that for all vertical depth the curve have tendencies to increasing pattern upto 4.5h distance and after than the transverse velocity decreases laterally. The variations of transverse velocity at Y/h=4.25 in longitudinal direction are presented in Figure 8 for 90ο angle. In general the trends of the curve are almost same for all the discharges. It was found from this Figure that there is tendency to increasing velocity around the head of the bell mouth groin. The reason may be that mean velocities increases due to constriction of flow around the head of groin.
Figure 5. Variation of streamwise velocity (Vx) at Y/h=3.25 in longitudinal direction (X) for 150 degree angle
Figure 6. Variation of streamwise velocity (Vx) at Y/h=4.25 in longitudinal direction (X) for 90 degree angle
For 0.2 depth, Y/h=3.25
-2.000
-1.500-1.000
-0.5000.000
0.500
1.0001.500
2.000
-8.00 -6.00 -4.00 -2.00 0.00
X/h
Vx/
Ua 170-S
150-S130-S
For 0.4 depth, Y/h=3.25
-1.000
-0.500
0.000
0.500
1.000
1.500
2.000
-8.00 -6.00 -4.00 -2.00 0.00
X/h
Vx/
Ua 170-S
150-S130-S
For 0.6 depth, Y/h=3.25
0.0000.2000.4000.6000.8001.0001.2001.4001.6001.800
-8.00 -6.00 -4.00 -2.00 0.00
X/h
Vx/
Ua 170-S
150-S130-S
For 0.8depth, Y/h=3.25
0.0000.2000.4000.6000.8001.0001.2001.4001.6001.800
-8.00 -6.00 -4.00 -2.00 0.00
X/h
Vx/
Ua 170-S
150-S130-S
For 0.2 depth
0.000
0.200
0.400
0.600
0.800
1.000
-2 -1 0 1 2 3
X/h
Vy/U
a 170-S150-S
130-S
For 0.4 depth
0.000
0.200
0.400
0.600
0.800
1.000
-2 -1 0 1 2 3
X/h
Vy/U
a 170-S
150-S
130-S
For 0.6 depth
-0.2000.0000.2000.4000.6000.8001.0001.200
-2 -1 0 1 2 3
X/h
Vy/
Ua 170-S
150-S130-S
For 0.8 depth
-0.500
0.000
0.500
1.000
1.500
-2 -1 0 1 2 3
X/h
Vy/
Ua 170-S
150-S
130-S

391
Figure 7. Variation of transverse velocity (Vy) at Y/h=3.25 in longitudinal direction (X) for 150 degree angle Figure 8. Variation of transverse velocity (Vy) at Y/h=4.25 in longitudinal direction (X) for 90 degree angle
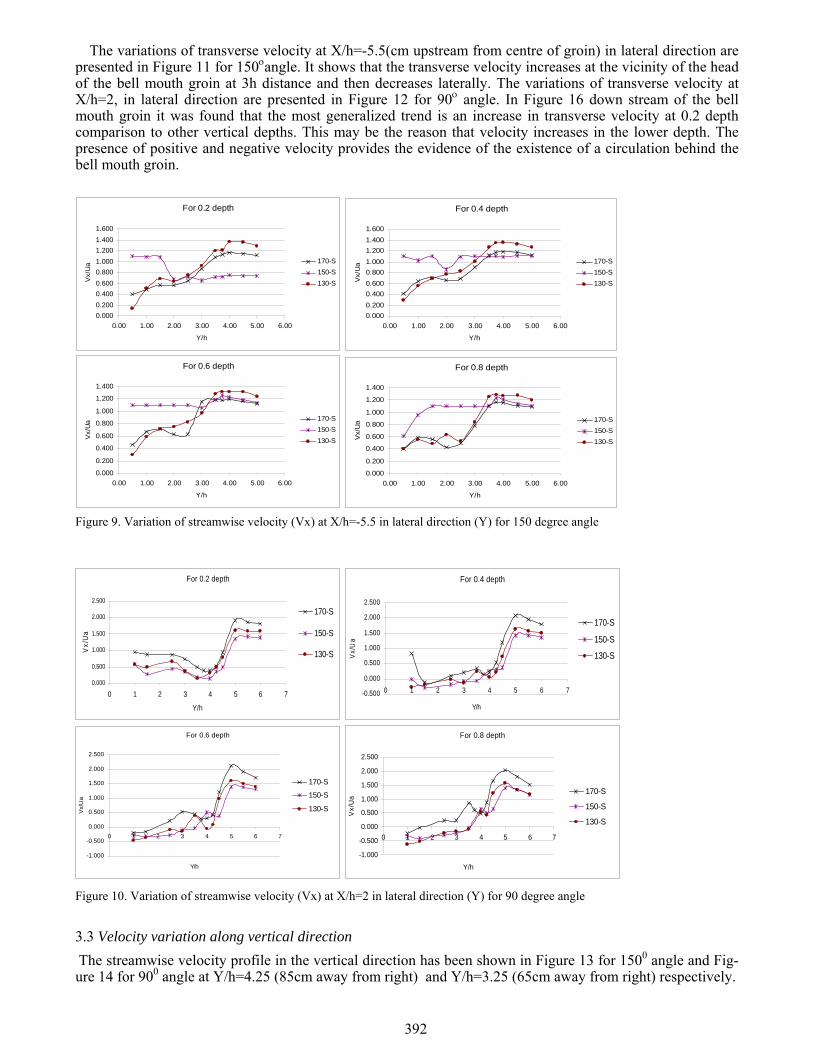
3.2 Velocity variation along lateral direction The variations of streamwise velocity at X/h=-5.5 (105cm upstream from centre of groin) in lateral direction are presented in Figure 9 for 1500 angle. It was found that the variation of streamwise velocity for four verti-cal depth from the water surface, the tendency of the curve al-most increasing to the lateral direction. It may be caused due to shifting of velocity from right to left touching the head of structure. The variations of streamwise velocity at X/h=2, in lateral direction are presented in Figure 10 for angle 900 angle. From this Figure it was observed that from 1h to 4h distance velocity variation almost uniform. From 4h to 5h distance (around head of the groin) velocity variation is increasing pattern to the lateral direction. This may be occurs due to passing the flow adjacent to the head of the groin. The most significant observation that can be made from all this Figures is the lateral shifting of maximum velocity away from the head of the bell mouth groin. This lateral shifting of velocity is evidently related with the shifting of discharge away from the bell mouth groin.
For 0.4 depth
-0.300-0.200-0.1000.0000.1000.2000.3000.4000.5000.600
-8.00 -6.00 -4.00 -2.00 0.00
X/h
Vy/
Ua 170-S
150-S130-S
For 0.2 depth
-0.200-0.1000.0000.1000.2000.3000.4000.5000.6000.700
-8.00 -6.00 -4.00 -2.00 0.00
X/h
Vy/
Ua 170-NS
150-NS130-NS
For 0.6depth
-0.600
-0.400
-0.200
0.000
0.200
0.400
0.600
-8.00 -6.00 -4.00 -2.00 0.00
X/h
Vy/
Ua 170-S
150-S130-S
For 0.8 depth
-0.600
-0.400
-0.200
0.000
0.200
0.400
0.600
-8.00 -6.00 -4.00 -2.00 0.00
X/h
Vy/
Ua 170-S
150-S130-S
For 0.2 depth
0.000
0.200
0.400
0.600
0.800
1.000
-2 -1 0 1 2 3
X/h
Vy/
Ua 170-S
150-S
130-S
For 0.4 depth
0.000
0.200
0.400
0.600
0.800
1.000
-2 -1 0 1 2 3
X/h
Vy/
Ua 170-S
150-S
130-S
For 0.8 depth
-0.500
0.000
0.500
1.000
1.500
-2 -1 0 1 2 3
X/h
Vy/
Ua 170-S
150-S
130-S
For 0.6 depth
-0.2000.0000.2000.4000.6000.8001.0001.200
-2 -1 0 1 2 3
X/h
Vy/
Ua 170-S
150-S130-S
392
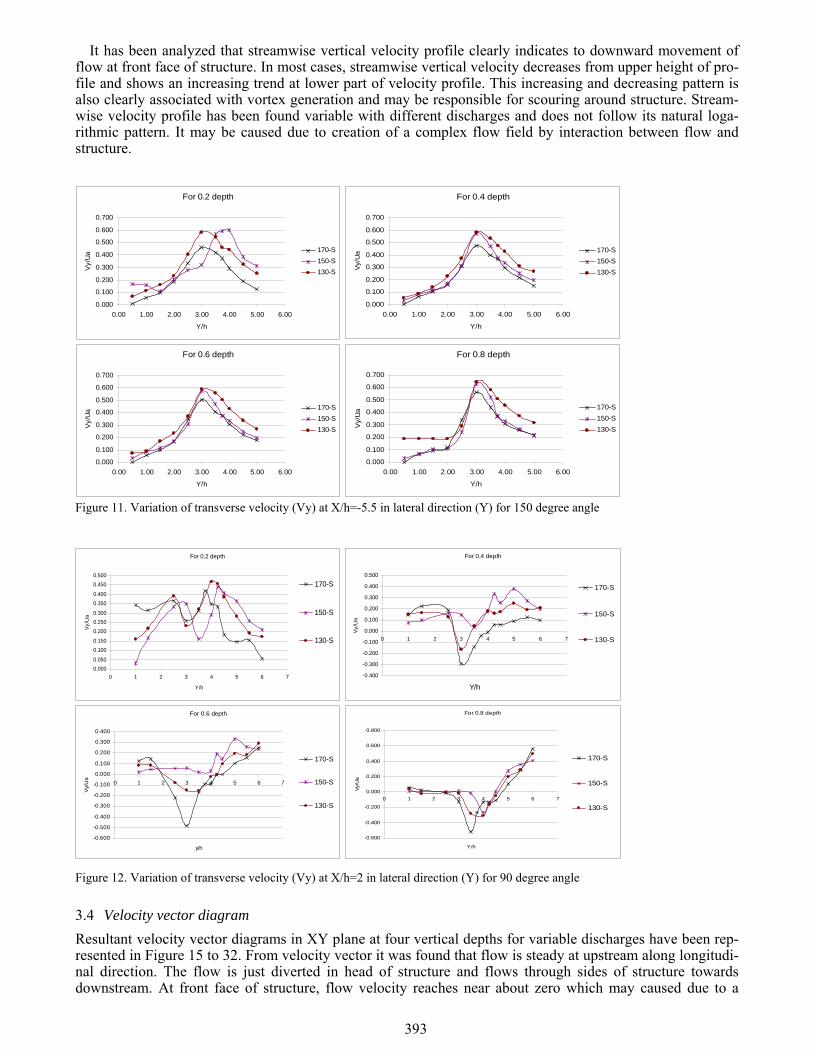
The variations of transverse velocity at X/h=-5.5(cm upstream from centre of groin) in lateral direction are presented in Figure 11 for 150οangle. It shows that the transverse velocity increases at the vicinity of the head of the bell mouth groin at 3h distance and then decreases laterally. The variations of transverse velocity at X/h=2, in lateral direction are presented in Figure 12 for 90ο angle. In Figure 16 down stream of the bell mouth groin it was found that the most generalized trend is an increase in transverse velocity at 0.2 depth comparison to other vertical depths. This may be the reason that velocity increases in the lower depth. The presence of positive and negative velocity provides the evidence of the existence of a circulation behind the bell mouth groin.
Figure 9. Variation of streamwise velocity (Vx) at X/h=-5.5 in lateral direction (Y) for 150 degree angle
Figure 10. Variation of streamwise velocity (Vx) at X/h=2 in lateral direction (Y) for 90 degree angle
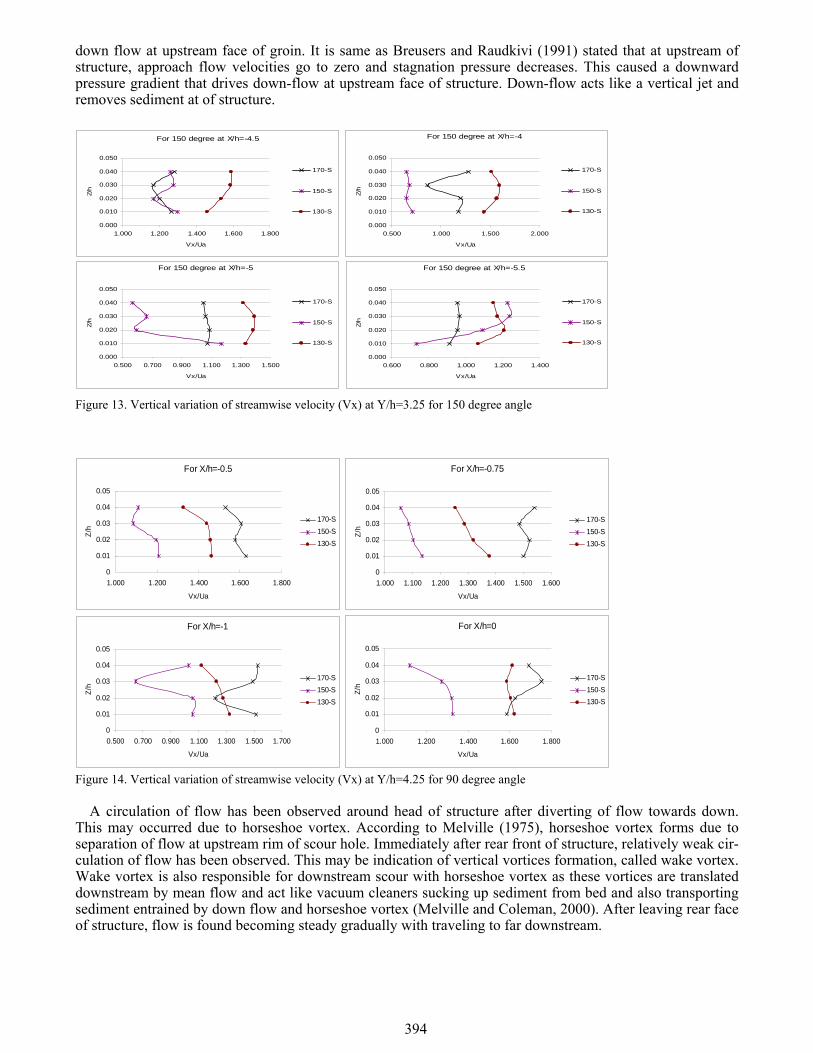
3.3 Velocity variation along vertical direction The streamwise velocity profile in the vertical direction has been shown in Figure 13 for 1500 angle and Fig-ure 14 for 900 angle at Y/h=4.25 (85cm away from right) and Y/h=3.25 (65cm away from right) respectively.
For 0.2 depth
0.0000.2000.4000.6000.8001.0001.2001.4001.600
0.00 1.00 2.00 3.00 4.00 5.00 6.00
Y/h
Vx/
Ua 170-S
150-S130-S
For 0.4 depth
0.0000.2000.4000.6000.8001.0001.2001.4001.600
0.00 1.00 2.00 3.00 4.00 5.00 6.00
Y/h
Vx/
Ua 170-S
150-S130-S
For 0.6 depth
0.000
0.200
0.400
0.600
0.800
1.000
1.200
1.400
0.00 1.00 2.00 3.00 4.00 5.00 6.00
Y/h
Vx/
Ua 170-S
150-S130-S
For 0.8 depth
0.000
0.200
0.400
0.600
0.800
1.000
1.200
1.400
0.00 1.00 2.00 3.00 4.00 5.00 6.00
Y/h
Vx/
Ua 170-S
150-S130-S
For 0.2 depth
0.000
0.500
1.000
1.500
2.000
2.500
0 1 2 3 4 5 6 7
Y/h
Vx/
Ua
170-S
150-S
130-S
For 0.4 depth
-0.500
0.000
0.500
1.000
1.500
2.000
2.500
0 1 2 3 4 5 6 7
Y/h
Vx/U
a
170-S
150-S
130-S
For 0.6 depth
-1.000
-0.500
0.000
0.500
1.000
1.500
2.000
2.500
0 1 2 3 4 5 6 7
Y/h
Vx/
Ua
170-S
150-S
130-S
For 0.8 depth
-1.000
-0.500
0.000
0.500
1.000
1.500
2.000
2.500
0 1 2 3 4 5 6 7
Y/h
Vx/
Ua
170-S
150-S
130-S
393
It has been analyzed that streamwise vertical velocity profile clearly indicates to downward movement of flow at front face of structure. In most cases, streamwise vertical velocity decreases from upper height of pro-file and shows an increasing trend at lower part of velocity profile. This increasing and decreasing pattern is also clearly associated with vortex generation and may be responsible for scouring around structure. Stream-wise velocity profile has been found variable with different discharges and does not follow its natural loga-rithmic pattern. It may be caused due to creation of a complex flow field by interaction between flow and structure.
Figure 11. Variation of transverse velocity (Vy) at X/h=-5.5 in lateral direction (Y) for 150 degree angle
Figure 12. Variation of transverse velocity (Vy) at X/h=2 in lateral direction (Y) for 90 degree angle
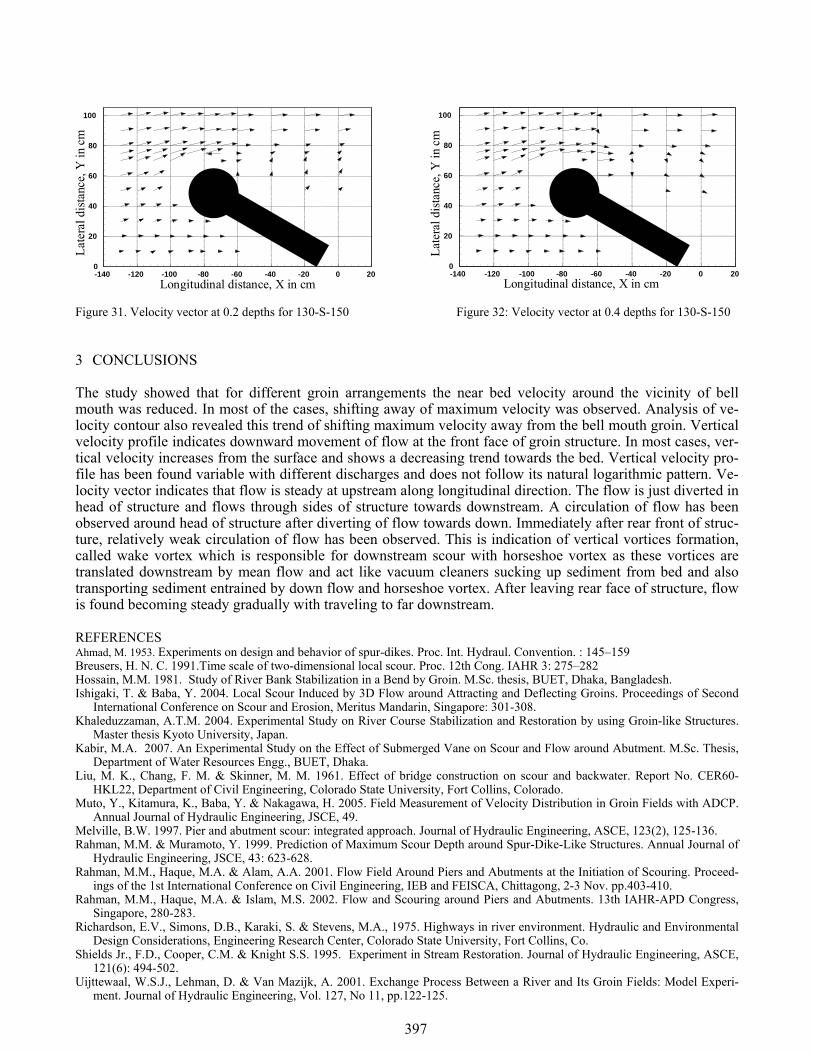
3.4 Velocity vector diagram Resultant velocity vector diagrams in XY plane at four vertical depths for variable discharges have been rep-resented in Figure 15 to 32. From velocity vector it was found that flow is steady at upstream along longitudi-nal direction. The flow is just diverted in head of structure and flows through sides of structure towards downstream. At front face of structure, flow velocity reaches near about zero which may caused due to a
For 0.2 depth
0.000
0.100
0.200
0.300
0.400
0.500
0.600
0.700
0.00 1.00 2.00 3.00 4.00 5.00 6.00
Y/h
Vy/
Ua 170-S
150-S130-S
For 0.4 depth
0.000
0.100
0.200
0.300
0.400
0.500
0.600
0.700
0.00 1.00 2.00 3.00 4.00 5.00 6.00
Y/h
Vy/
Ua 170-S
150-S130-S
For 0.6 depth
0.000
0.100
0.200
0.300
0.400
0.500
0.600
0.700
0.00 1.00 2.00 3.00 4.00 5.00 6.00
Y/h
Vy/
Ua 170-S
150-S130-S
For 0.8 depth
0.000
0.100
0.200
0.300
0.400
0.500
0.600
0.700
0.00 1.00 2.00 3.00 4.00 5.00 6.00
Y/h
Vy/
Ua 170-S
150-S130-S
For 0.2 depth
0.0000.050
0.1000.150
0.2000.2500.300
0.3500.400
0.4500.500
0 1 2 3 4 5 6 7
Y/h
Vy/U
a
170-S
150-S
130-S
For 0.4 depth
-0.400
-0.300
-0.200
-0.100
0.000
0.100
0.200
0.300
0.400
0.500
0 1 2 3 4 5 6 7
Y/h
Vy/U
a
170-S
150-S
130-S
For 0.6 depth
-0.600
-0.500
-0.400
-0.300
-0.200
-0.100
0.000
0.100
0.200
0.300
0.400
0 1 2 3 4 5 6 7
y/h
Vy/
Ua
170-S
150-S
130-S
For 0.8 depth
-0.600
-0.400
-0.200
0.000
0.200
0.400
0.600
0.800
0 1 2 3 4 5 6 7
Y/h
Vy/U
a
170-S
150-S
130-S
394
down flow at upstream face of groin. It is same as Breusers and Raudkivi (1991) stated that at upstream of structure, approach flow velocities go to zero and stagnation pressure decreases. This caused a downward pressure gradient that drives down-flow at upstream face of structure. Down-flow acts like a vertical jet and removes sediment at of structure.
Figure 13. Vertical variation of streamwise velocity (Vx) at Y/h=3.25 for 150 degree angle
Figure 14. Vertical variation of streamwise velocity (Vx) at Y/h=4.25 for 90 degree angle
A circulation of flow has been observed around head of structure after diverting of flow towards down. This may occurred due to horseshoe vortex. According to Melville (1975), horseshoe vortex forms due to separation of flow at upstream rim of scour hole. Immediately after rear front of structure, relatively weak cir-culation of flow has been observed. This may be indication of vertical vortices formation, called wake vortex. Wake vortex is also responsible for downstream scour with horseshoe vortex as these vortices are translated downstream by mean flow and act like vacuum cleaners sucking up sediment from bed and also transporting sediment entrained by down flow and horseshoe vortex (Melville and Coleman, 2000). After leaving rear face of structure, flow is found becoming steady gradually with traveling to far downstream.
For 150 degree at X/h=-4.5
0.000
0.010
0.020
0.030
0.040
0.050
1.000 1.200 1.400 1.600 1.800
Vx/Ua
Z/h
170-S
150-S
130-S
For 150 degree at X/h=-4
0.000
0.010
0.020
0.030
0.040
0.050
0.500 1.000 1.500 2.000
Vx/Ua
Z/h
170-S
150-S
130-S
For 150 degree at X/h=-5
0.000
0.010
0.020
0.030
0.040
0.050
0.500 0.700 0.900 1.100 1.300 1.500
Vx/Ua
Z/h
170-S
150-S
130-S
For 150 degree at X/h=-5.5
0.000
0.010
0.020
0.030
0.040
0.050
0.600 0.800 1.000 1.200 1.400
Vx/Ua
Z/h
170-S
150-S
130-S
For X/h=-0.5
0
0.01
0.02
0.03
0.04
0.05
1.000 1.200 1.400 1.600 1.800
Vx/Ua
Z/h
170-S150-S130-S
For X/h=-0.75
0
0.01
0.02
0.03
0.04
0.05
1.000 1.100 1.200 1.300 1.400 1.500 1.600
Vx/Ua
Z/h
170-S150-S130-S
For X/h=-1
0
0.01
0.02
0.03
0.04
0.05
0.500 0.700 0.900 1.100 1.300 1.500 1.700
Vx/Ua
Z/h
170-S150-S130-S
For X/h=0
0
0.01
0.02
0.03
0.04
0.05
1.000 1.200 1.400 1.600 1.800
Vx/Ua
Z/h
170-S150-S130-S

395
Figure 15. Velocity vector at 0.2 depths for 170-S-150 Figure 16. Velocity vector at 0.4 depths for 170-S-150
Figure 17. Velocity vector at 0.6 depths for 170-S-150 Figure 18. Velocity vector at 0.8 depths for 170-S-150
Figure 19. Velocity vector at 0.2 depths for 150-S-150 Figure 20. Velocity vector at 0.4 depths for 150-S-150
Figure 21. Velocity vector at 0.6 depths for 150-S-150 Figure 22. Velocity vector at 0.8 depths for 150-S-150
-140 -120 -100 -80 -60 -40 -20 0 200
20
40
60
80
100La
tera
l dis
tanc
e, Y
in c
m
Longitudinal distance, X in cm -140 -120 -100 -80 -60 -40 -20 0 200
20
40
60
80
100
Late
ral d
ista
nce,
Y in
cm
Longitudinal distance, X in cm
-140 -120 -100 -80 -60 -40 -20 0 200
20
40
60
80
100
Late
ral d
ista
nce,
Y in
cm
Longitudinal distance, X in cm
-140 -120 -100 -80 -60 -40 -20 0 200
20
40
60
80
100
Late
ral d
ista
nce,
Y in
cm
Longitudinal distance, X in cm
-140 -120 -100 -80 -60 -40 -20 0 200
20
40
60
80
100
Late
ral d
ista
nce,
Y in
cm
Longitudinal distance, X in cm
-140 -120 -100 -80 -60 -40 -20 0 200
20
40
60
80
100
Late
ral d
ista
nce,
Y in
cm
Longitudinal distance, X in cm
-140 -120 -100 -80 -60 -40 -20 0 200
20
40
60
80
100
Late
ral d
ista
nce,
Y in
cm
Longitudinal distance, X in cm
-140 -120 -100 -80 -60 -40 -20 0 200
20
40
60
80
100
Late
ral d
ista
nce,
Y in
cm
Longitudinal distance, X in cm

396
Figure 23. Velocity vector at 0.2 depths for 170-S-90 Figure 24. Velocity vector at 0.4 depths for 170-S-90
Figure 25. Velocity vector at 0.6 depths for 170-S-90 Figure 26. Velocity vector at 0.8 depths for 170-S-90
Figure 27. Velocity vector at 0.2 depths for 150-S-90 Figure 28. Velocity vector at 0.4 depths for 150-S-90
Figure 29. Velocity vector at 0.6 depths for 150-S-90 Figure 30. Velocity vector at 0.8 depths for 150-S-90
-30 -20 -10 0 10 20 30 40 500
20
40
60
80
100
120
Late
ral d
ista
nce,
Y in
cm
Longitudinal distance, X in cm
-40 -30 -20 -10 0 10 20 30 40 500
20
40
60
80
100
120
Late
ral d
ista
nce,
Y in
cm
Longitudinal distance, X in cm
-40 -30 -20 -10 0 10 20 30 40 500
20
40
60
80
100
120
Late
ral d
ista
nce,
Y in
cm
Longitudinal distance, X in cm
-40 -30 -20 -10 0 10 20 30 40 500
20
40
60
80
100
120
Late
ral d
ista
nce,
Y in
cm
Longitudinal distance, X in cm
-40 -30 -20 -10 0 10 20 30 40 500
20
40
60
80
100
120
Late
ral d
ista
nce,
Y in
cm
Longitudinal distance, X in cm
-40 -30 -20 -10 0 10 20 30 40 500
20
40
60
80
100
120
Late
ral d
ista
nce,
Y in
cm
Longitudinal distance, X in cm
-40 -30 -20 -10 0 10 20 30 40 500
20
40
60
80
100
120
Late
ral d
ista
nce,
Y in
cm
Longitudinal distance, X in cm
-40 -30 -20 -10 0 10 20 30 40 500
20
40
60
80
100
120
Late
ral d
ista
nce,
Y in
cm
Longitudinal distance, X in cm
397
Figure 31. Velocity vector at 0.2 depths for 130-S-150 Figure 32: Velocity vector at 0.4 depths for 130-S-150
3 CONCLUSIONS
The study showed that for different groin arrangements the near bed velocity around the vicinity of bell mouth was reduced. In most of the cases, shifting away of maximum velocity was observed. Analysis of ve-locity contour also revealed this trend of shifting maximum velocity away from the bell mouth groin. Vertical velocity profile indicates downward movement of flow at the front face of groin structure. In most cases, ver-tical velocity increases from the surface and shows a decreasing trend towards the bed. Vertical velocity pro-file has been found variable with different discharges and does not follow its natural logarithmic pattern. Ve-locity vector indicates that flow is steady at upstream along longitudinal direction. The flow is just diverted in head of structure and flows through sides of structure towards downstream. A circulation of flow has been observed around head of structure after diverting of flow towards down. Immediately after rear front of struc-ture, relatively weak circulation of flow has been observed. This is indication of vertical vortices formation, called wake vortex which is responsible for downstream scour with horseshoe vortex as these vortices are translated downstream by mean flow and act like vacuum cleaners sucking up sediment from bed and also transporting sediment entrained by down flow and horseshoe vortex. After leaving rear face of structure, flow is found becoming steady gradually with traveling to far downstream. REFERENCES Ahmad, M. 1953. Experiments on design and behavior of spur-dikes. Proc. Int. Hydraul. Convention. : 145–159 Breusers, H. N. C. 1991.Time scale of two-dimensional local scour. Proc. 12th Cong. IAHR 3: 275–282 Hossain, M.M. 1981. Study of River Bank Stabilization in a Bend by Groin. M.Sc. thesis, BUET, Dhaka, Bangladesh. Ishigaki, T. & Baba, Y. 2004. Local Scour Induced by 3D Flow around Attracting and Deflecting Groins. Proceedings of Second
International Conference on Scour and Erosion, Meritus Mandarin, Singapore: 301-308. Khaleduzzaman, A.T.M. 2004. Experimental Study on River Course Stabilization and Restoration by using Groin-like Structures.
Master thesis Kyoto University, Japan. Kabir, M.A. 2007. An Experimental Study on the Effect of Submerged Vane on Scour and Flow around Abutment. M.Sc. Thesis,
Department of Water Resources Engg., BUET, Dhaka. Liu, M. K., Chang, F. M. & Skinner, M. M. 1961. Effect of bridge construction on scour and backwater. Report No. CER60-
HKL22, Department of Civil Engineering, Colorado State University, Fort Collins, Colorado. Muto, Y., Kitamura, K., Baba, Y. & Nakagawa, H. 2005. Field Measurement of Velocity Distribution in Groin Fields with ADCP.
Annual Journal of Hydraulic Engineering, JSCE, 49. Melville, B.W. 1997. Pier and abutment scour: integrated approach. Journal of Hydraulic Engineering, ASCE, 123(2), 125-136. Rahman, M.M. & Muramoto, Y. 1999. Prediction of Maximum Scour Depth around Spur-Dike-Like Structures. Annual Journal of
Hydraulic Engineering, JSCE, 43: 623-628. Rahman, M.M., Haque, M.A. & Alam, A.A. 2001. Flow Field Around Piers and Abutments at the Initiation of Scouring. Proceed-
ings of the 1st International Conference on Civil Engineering, IEB and FEISCA, Chittagong, 2-3 Nov. pp.403-410. Rahman, M.M., Haque, M.A. & Islam, M.S. 2002. Flow and Scouring around Piers and Abutments. 13th IAHR-APD Congress,
Singapore, 280-283. Richardson, E.V., Simons, D.B., Karaki, S. & Stevens, M.A., 1975. Highways in river environment. Hydraulic and Environmental
Design Considerations, Engineering Research Center, Colorado State University, Fort Collins, Co. Shields Jr., F.D., Cooper, C.M. & Knight S.S. 1995. Experiment in Stream Restoration. Journal of Hydraulic Engineering, ASCE,
121(6): 494-502. Uijttewaal, W.S.J., Lehman, D. & Van Mazijk, A. 2001. Exchange Process Between a River and Its Groin Fields: Model Experi-
ment. Journal of Hydraulic Engineering, Vol. 127, No 11, pp.122-125.
-140 -120 -100 -80 -60 -40 -20 0 200
20
40
60
80
100
Late
ral d
ista
nce,
Y in
cm
Longitudinal distance, X in cm
-140 -120 -100 -80 -60 -40 -20 0 200
20
40
60
80
100
Late
ral d
ista
nce,
Y in
cm
Longitudinal distance, X in cm