Embed Size (px)
Citation preview
Center for Turbulence ResearchAnnual Research Briefs 2001
51
An experimental and computational investigationof flow past cacti
By Sharon Talley, Gianluca Iaccarino, Godfrey Mungal AND Nagi N. Mansour
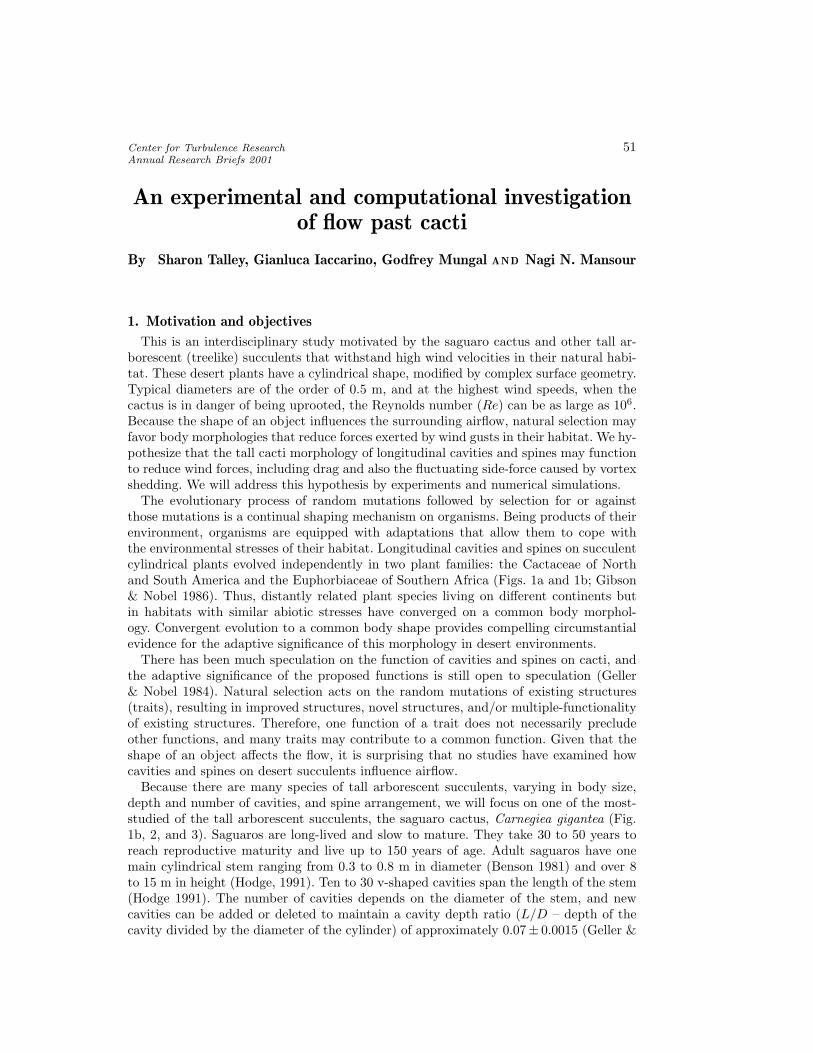
1. Motivation and objectives
This is an interdisciplinary study motivated by the saguaro cactus and other tall ar-borescent (treelike) succulents that withstand high wind velocities in their natural habi-tat. These desert plants have a cylindrical shape, modified by complex surface geometry.Typical diameters are of the order of 0.5 m, and at the highest wind speeds, when thecactus is in danger of being uprooted, the Reynolds number (Re) can be as large as 106.Because the shape of an object influences the surrounding airflow, natural selection mayfavor body morphologies that reduce forces exerted by wind gusts in their habitat. We hy-pothesize that the tall cacti morphology of longitudinal cavities and spines may functionto reduce wind forces, including drag and also the fluctuating side-force caused by vortexshedding. We will address this hypothesis by experiments and numerical simulations.
The evolutionary process of random mutations followed by selection for or againstthose mutations is a continual shaping mechanism on organisms. Being products of theirenvironment, organisms are equipped with adaptations that allow them to cope withthe environmental stresses of their habitat. Longitudinal cavities and spines on succulentcylindrical plants evolved independently in two plant families: the Cactaceae of Northand South America and the Euphorbiaceae of Southern Africa (Figs. 1a and 1b; Gibson& Nobel 1986). Thus, distantly related plant species living on different continents butin habitats with similar abiotic stresses have converged on a common body morphol-ogy. Convergent evolution to a common body shape provides compelling circumstantialevidence for the adaptive significance of this morphology in desert environments.
There has been much speculation on the function of cavities and spines on cacti, andthe adaptive significance of the proposed functions is still open to speculation (Geller& Nobel 1984). Natural selection acts on the random mutations of existing structures(traits), resulting in improved structures, novel structures, and/or multiple-functionalityof existing structures. Therefore, one function of a trait does not necessarily precludeother functions, and many traits may contribute to a common function. Given that theshape of an object affects the flow, it is surprising that no studies have examined howcavities and spines on desert succulents influence airflow.
Because there are many species of tall arborescent succulents, varying in body size,depth and number of cavities, and spine arrangement, we will focus on one of the most-studied of the tall arborescent succulents, the saguaro cactus, Carnegiea gigantea (Fig.1b, 2, and 3). Saguaros are long-lived and slow to mature. They take 30 to 50 years toreach reproductive maturity and live up to 150 years of age. Adult saguaros have onemain cylindrical stem ranging from 0.3 to 0.8 m in diameter (Benson 1981) and over 8to 15 m in height (Hodge, 1991). Ten to 30 v-shaped cavities span the length of the stem(Hodge 1991). The number of cavities depends on the diameter of the stem, and newcavities can be added or deleted to maintain a cavity depth ratio (L/D – depth of thecavity divided by the diameter of the cylinder) of approximately 0.07± 0.0015 (Geller &

52 Talley, Iaccarino, Mungal, Mansour
Figure 1. Convergence of the external morphology of desert succulents: (a) Euphorbia sp.(Euphorbiaceae) from Southern Africa and (b) young saguaro, Carnegiea gigantea (Cactaceae)from North America.
(a) (c)
(b)
Figure 2. (a) Addition of cavities (ribs) on an adult saguaro trunk (b) Saguaro forest, and (c)Root system of a saguaro toppled by the wind.
Nobel 1984; Fig. 2a). Apices of the cavity junctures are adorned with whorls of 15 to 30spines 2.5 to 7.6 cm long (Benson 1981).
In order for wind to be a selective agent on saguaros, high wind velocities must occur insaguaro habitats and they must affect their reproductive success. Within the distributionof saguaros, high wind velocities were recorded 15 m above the ground for a nine-yearperiod (Bulk 1984). The maximum wind velocity recorded was 38 m/s, (Re = 106), andvelocities exceeding 22 m/s (Re = 7 × 10⁵) occurred almost every month. Saguaro habi-tats contain less vegetation cover than other ecosystems and, consequently, have few ifany other tall plants to shelter them from the wind (Fig. 2b). There is substantial circum-stantial evidence that wind gusts exert enough force to topple saguaros, and thus, cause

The flow past cacti 53
θD
L
(a) (b)
Figure 3. (a) Saguaro stem anatomy (Niklas & Buchman 1994). (b) Sketch of the cross-section
their premature mortality (Fig. 2c; Benson 1981; Alcock 1985; Pierson and Turner 1998),although information on the wind velocities required to topple large desert succulents islacking. The natural-selection scenario would suggest that some saguaros are toppled bygusts (Fig. 2b), while many others remain standing. Considering that most tall cacti livefor 150 years and take 30 to 50 years or more to reach reproduce maturity, strong gustsneed only occur only every 30 to 50 years to be important in the natural selection of tallsucculent morphology.
Another way stationary organisms can cope with high wind velocities is to increasetheir structural strength; however, investment in structural tissues has opportunity costs(Denny 1994). Saguaros have low investment in the structural tissues of the stem andeven less in the roots. Succulent stems are 90 to 94% water (Gibson and Nobel 1986),and, therefore, use little structural tissue ”wood” to support their massive structures.Saguaro wood is confined to the center of the stem (xylem fibers; Fig. 3a). The compositestem tissue has a density specific stiffness (ε/ρ) less than half of that for a solid woodstem (Niklas and Buchman 1994). The ratio of dry-weight investment in root mass tostem mass in cacti (0.08 to 0.14) is considerably less than most other plants forms (0.3 to7.3), suggesting that saguaros invest comparatively little in root structural tissue (Nobel1994). The saguaro root system is shallow, having a mean root depth of 25 cm andconsisting of thin roots up to 2.5 cm in diameter (Fig. 2c). Their shallow root system,which provides poor root anchorage, has been noted to result in saguaro toppling whenexposed to high wind velocities (Hodge 1991). The ability to dampen fluctuating side-force may also be particularly important in keeping these structures upright because largefluctuations in forces may break or dislodge roots. Because there are probably constraintson tissue strength, and evolution occurs by the natural selection of random mutations, itis conceivable that stationary organisms may evolve shapes that reduce drag and diminishfluctuating side-force.
At high Reynolds numbers (Re > 104) the drag coefficient (Cd) curves for spheresand cylinders have four distinct flow ranges, characterized by changes in drag causedby boundary-layer separation and by transition from laminar to turbulent flow (Fig.4a; Roshko 1961; Achenbach 1977; Farell 1981). In the subcritical range, Cd is almostindependent of Re (separation is laminar). Then, at the beginning of the critical range,Cd drops rapidly (boundary layer undergoes transition to turbulence). The lowest Cd onthe curve is within the critical range, at what is referred to as the critical Re. The nextrange is the supercritical range, where Cd increases with increasing Re and continues toincrease to the fully turbulent transcritical range.

54 Talley, Iaccarino, Mungal, Mansour
When comparing Cd curves of uniformly rough and smooth cylinders, rough cylindershave Cd curves to the left of their smooth analogs and, therefore, experience the criticalrange at lower Re (Achenbach 1971). Roughness promotes transition, and, generally, thegreater the roughness the greater the shift of the Cd curve to the left (the degree of surfaceroughness is quantified by the parameter k/D, the height of the roughness divided by thediameter of the cylinder). Although a greater degree of uniform surface roughness resultsin a lower critical Re, it is accompanied by a smaller drop in Cd and a smaller criticalRe range. In addition, rough cylinders often have higher Cd in the postcritcal regime.
Experimental evidence shows that the shape of the Cd curve depends not only on thesize but also on the shape and distribution of surface roughness. Cylinders with dis-tributed strips of roughness have been shown to experience early transition without arapid rise in Cd in the supercritical range (Fig. 4b; Nakamura and Tomonari 1982). Com-plex surface roughness, such as dimples on a golf ball (Bearman and Harvey 1976) andon a cylinder (Bearman and Harvey, 1993), also have a larger Re range of Cd reductionthan cylinders with uniform roughness. Other surface modifications have been studiedto passively reduce drag and fluctuating lift forces on circular cylinders; however, nonehave studied spanwise v-shaped cavities with 0.07L/D.
This project addresses fundamental concepts in evolution by examining whether organ-isms are optimally shaped through natural selection to reduce drag and fluctuating lift.The fluid mechanics of cacti has not been examined experimentally or numerically. Suchinvestigation would provide information on how longitudinal cavity depth and complexsurface roughness can affect flow. There are surprisingly few studies on the fluid mechan-ics of biological organisms, especially terrestrial organisms with bluff bodies. There areno known bluff organisms that use surface roughness to reduce drag (Vogel 1981). Sur-face roughness has been argued to be an unlikely adaptation to control drag, because thereduction in Cd afforded by the surface roughness is accompanied by a dramatic increasein Cd at higher Re (Denny 1988 and Vogel 1981). However, if the increase in Cd occursat Reynolds numbers that are rarely if ever experienced by the organism in question, itshould have no effect on the organism’s evolution.
2. Experimental study
2.1. Wind tunnelCircular cylinders with diameter D of 9.98 cm were manufactured from Ren Shape 460Modeling board. Five test cylinders are considered: a smooth cylinder, a uniformly roughcylinder (k/D = 2.5 × 10⁻³), and three cylinders differing in the depth of the verticalv-shaped cavities (L/D = 0.035, 0.07, and 0.105, see Fig. 3b). Each L/D cylinder had 24cavities spanning 15o; bits were used to cut angles of 124o, 82.5o and 60o for the 0.035,0.07, and 0.105 respectively. Roughness on the uniformly rough cylinder was providedby commercial 36 grit sandpaper (hydrodynamic roughness height, k/D = 2.5 × 10⁻³;Guven, Farell and Patel 1980). Sheets of sandpaper were cut and attached to the smoothcylinder with double-sided adhesive tape, and the thickness added to the cylinder wasless than 2 mm.
Experimental measurements were performed at flow velocities from 13 to 29.5 m/s ina low-speed blower wind tunnel with a test section 1.18 m × 1.18 m in cross section.Cylinders were mounted vertically between two endplates attached to the roof and floor,giving an aspect ratio of 7.06 (h/D) and a geometric blockage (cylinder diameter dividedby the width of the test section) of 13%. The endplates were 8D long by 7D wide, and

The flow past cacti 55
Re
Cd
Sub
criti
cal
Cri
tical
Sup
ercr
itica
l
Tra
nscr
itica
l
CriticalReynoldsNumber
Re
Cd
104 105 1060
0.5
1
1.5
Smooth CylinderRough CylinderCylinder with Roughness Strips
(a) (b)
Figure 4. (a) Cd curve defining the regimes of flow around a smooth cylinder (Re > 104) and(b) Experimental Cd curves of smooth and rough cylinders cylinders. : smooth surface(Achenbach 1971) ); : k/D = 5.16 × 10⁻³ (Nakamura & Tomonari 1982); : smoothcylinder with strips of k/D = 5.16× 10⁻³ at θ = 50 degrees.
Figure 5. Smoke flow visualizations at Re =13,000. Flow is right to left (black line behind thecylinders is a fracture in the glass).
the distance between the cylinder axis and the leading edge was 3.5D (Szepessy 1994).The cylinder was rotated about its axis to place the cavities at different orientations tothe flow, and then secured with supports.
Simple visualizations were performed using tufts of yarn attached to the cylinders,to a wand, and at the wire intersections of a fine framed grid. Flow was documented

56 Talley, Iaccarino, Mungal, Mansour
(a) (b)
y/D
u/V
inl
-2 -1 0 1 2
0.75
1
y/D
u/V
inl
-2 -1 0 1 2
0.75
1
Figure 6. Velocity profiles at Re = 125,000 behind cylinders at different spanwise locations.Location of pitot-static probe from top endplate; L/D = 0.5, 2.3, 3.5, and
4.7. (a) Velocity profiles behind a smooth cylinder (b) Velocity profiles behind a cylinderwith L/D 0.07.
using a Camcorder (Panasonic PV-L857). Visualization experiments were also carriedout in a low-speed smoke tunnel (Collins model # 300; Collins Radio Co., Cedar Rapids,Iowa) with a test section 64.3 cm deep, 61 cm high, and 107 cm wide. Vortex streets atRe of approximately 13,000 were observed in all cases but the cylinder with a L/D of0.07 (Fig. 5). The symmetric vortex shedding of the 0.07 L/D may be an artifact of thetest cylinders not spanning the entire width of the test section. All test cylinders wereexamined in the same way.
Wake velocity profiles were measured with a Pitot-static tube supported by a motorizedtraversing mechanism. Profiles were measured at 3.2D behind the cylinder. The Pitot-static probe was traversed across the test section to a distance of about D from eachwall. A total of 63 points were measured in the wake at a sampling rate 100 Hz for oneminute (6000 samples/point).
2.2. Data analysis
In the Re range from 90,000 to 200,000, the cylinders with cavities and the one withuniform roughness had narrower wakes, with smaller velocity defect, than the smoothcylinder. On both counts, this suggests that the cylinders with cavities have a lower Cd
than the smooth cylinder.Velocity profiles were measured at different locations behind the cylinders to determine
whether the flow was two-dimensional. Behind the smooth cylinder (Fig. 6a) the profilesare in very good agreement whereas larger discrepancies can be observed behind thecylinder with cavities (Fig. 6b), suggesting that longitudinal cavities may induce strongthree-dimensional effects. Additional measurements and flow visulaization are requiredto clarify this issue.
The flow past cacti 57
(a) (d)(c)(b)
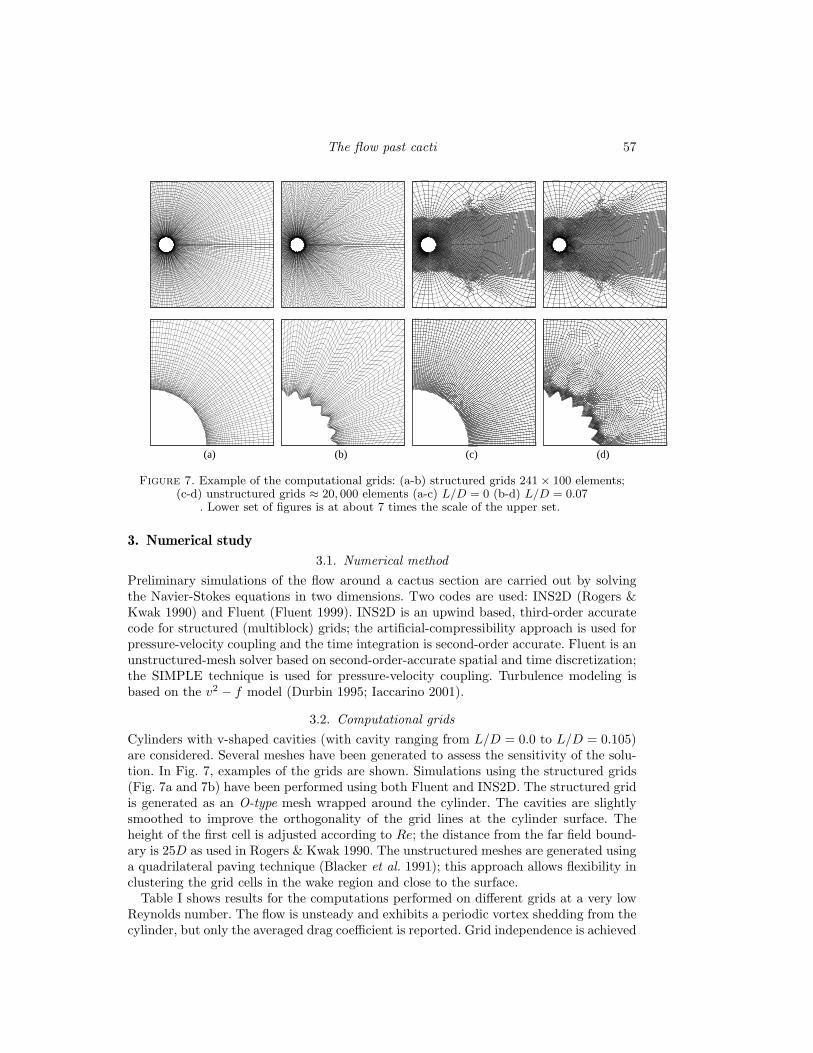
Figure 7. Example of the computational grids: (a-b) structured grids 241× 100 elements;(c-d) unstructured grids ≈ 20, 000 elements (a-c) L/D = 0 (b-d) L/D = 0.07
. Lower set of figures is at about 7 times the scale of the upper set.
3. Numerical study
3.1. Numerical methodPreliminary simulations of the flow around a cactus section are carried out by solvingthe Navier-Stokes equations in two dimensions. Two codes are used: INS2D (Rogers &Kwak 1990) and Fluent (Fluent 1999). INS2D is an upwind based, third-order accuratecode for structured (multiblock) grids; the artificial-compressibility approach is used forpressure-velocity coupling and the time integration is second-order accurate. Fluent is anunstructured-mesh solver based on second-order-accurate spatial and time discretization;the SIMPLE technique is used for pressure-velocity coupling. Turbulence modeling isbased on the v2 − f model (Durbin 1995; Iaccarino 2001).
3.2. Computational gridsCylinders with v-shaped cavities (with cavity ranging from L/D = 0.0 to L/D = 0.105)are considered. Several meshes have been generated to assess the sensitivity of the solu-tion. In Fig. 7, examples of the grids are shown. Simulations using the structured grids(Fig. 7a and 7b) have been performed using both Fluent and INS2D. The structured gridis generated as an O-type mesh wrapped around the cylinder. The cavities are slightlysmoothed to improve the orthogonality of the grid lines at the cylinder surface. Theheight of the first cell is adjusted according to Re; the distance from the far field bound-ary is 25D as used in Rogers & Kwak 1990. The unstructured meshes are generated usinga quadrilateral paving technique (Blacker et al. 1991); this approach allows flexibility inclustering the grid cells in the wake region and close to the surface.
Table I shows results for the computations performed on different grids at a very lowReynolds number. The flow is unsteady and exhibits a periodic vortex shedding from thecylinder, but only the averaged drag coefficient is reported. Grid independence is achieved

58 Talley, Iaccarino, Mungal, Mansour
for the smooth cylinder L/D = 0 using both the structured and the unstructured grids,and the corresponding values are extremely close.
The results for the flow around the cylinders with cavities show that grid independenceis achieved only using the unstructured grids. An increase in cavity depth requires afiner resolution to capture accurately the in-cavity flow; in addition, the quality of thestructured grid degrades as the cavity depth increases. It is worth noting that the resultsobtained using the finest structured grid (761 × 201) are in good agreement with thegrid-independent results for the unstructured mesh.
In the following Sections only results computed using the unstructured grids are re-ported.
Grid Elements L/D L/D L/D L/D0 0.035 0.070 0.105
161 × 61 9,600 1.312 1.131 1.172 1.257241 × 101 24,000 1.329 1.269 1.294 1.341481 × 101 40,000 1.339 1.301 1.304 1.326761 × 201 152,000 1.339 1.311 1.313 1.318
Structured grids
Elements L/D L/D L/D L/D0 0.035 0.070 0.105
6,300 1.267 1.171 1.212 1.25520,000 1.331 1.300 1.301 1.33042,000 1.337 1.307 1.310 1.31976,000 1.338 1.309 1.310 1.317
Unstructured grids
Table I. Computed time-averaged Cd for different computational grids – Re = 100
3.3. Laminar simulationsFlow simulations at low Reynolds number (Re = 100 and Re = 200) are carried outto evaluate the effect of cavity depth (and the accuracy of the predictions) withoutuncertainties related to the turbulence modeling. Two-dimensional simulations have beenperformed with unstructured grids using 6,000 to 42,000 elements (only the fine meshresults are presented). The calculations are carried out using a timestep ∆tU/D = 0.01(corresponding to approximately 35 time steps per vortex shedding period) and for atotal time of TU/D = 150. The time history of drag and lift coefficients at Re = 100 arereported in Fig. 8a and 8b respectively. The statistics (time-averaged values, Strouhalnumber St etc.) are computed over a period Tav = 50D/U and are reported in Table II:here Cl is the coefficient of fluctuating side force (peak values shown).
L/D Cd Cl St
0 1.339 ± 0.010 ± 0.330 0.1600.035 1.304 ± 0.011 ± 0.325 0.1610.070 1.309 ± 0.010 ± 0.334 0.1620.105 1.318 ± 0.012 ± 0.336 0.161
Re = 100
L/D Cd Cl St
0 1.365 ± 0.037 ± 0.664 0.1750.035 1.361 ± 0.045 ± 0.713 0.1720.070 1.364 ± 0.057 ± 0.742 0.1720.105 1.381 ± 0.049 ± 0.740 0.170
Re = 200
Table II. Statistics for low Reynolds number flow around cacti
The results indicate a small drag reduction (≤ 10%) associated with the presence ofthe cavities. The cavity depth L/D = 0.05 is nearly optimal. The change in the unsteadyside-force is also small, showing that the effect of the cavity is limited.

The flow past cacti 59
t U / D
Cd
0 50 100 150
1.1
1.2
1.3
1.4
t U / D
Cl
0 50 100 150
-0.3
0
0.3
(a) (b)
Figure 8. Time history of drag (a) and lift (b) coefficients. Re = 100. : L/D = 0;: L/D = 0.07
.
The results presented for the smooth cylinder at Re = 200 are in good agreement withthe numerical simulations and the experimental data reported in Rogers & Kwak (1990).It is worth noting that Re = 190 represent the onset of three-dimensional flow in thewake of the cylinder.
3.4. Turbulent simulations
Calculations at Re = 20, 000 and Re = 100, 000 (subcritical regime, Fig. 4a) are per-formed using the v2 − f turbulence model. The time step, the simulated time and theaveraging time are the same as before; the time history of lift and drag is shown in Fig.9.
Compared to the results presented at low Re, the drag reduction is now larger (≈ 25%).The strength of the unsteady motion is also greatly reduced, as seen in Table III.
L/D Cd Cl St
0 1.683 ± 0.164 ± 1.923 0.2170.035 1.452 ± 0.076 ± 1.562 0.2210.070 1.419 ± 0.083 ± 1.245 0.2240.105 1.359 ± 0.052 ± 0.987 0.223
Re = 20, 000
L/D Cd Cl St
0 1.644 ± 0.113 ± 1.791 0.2280.035 1.464 ± 0.120 ± 1.462 0.2240.070 1.401 ± 0.131 ± 1.128 0.2210.105 1.325 ± 0.079 ± 0.864 0.221
Re = 100, 000
Table III. Statistics for high Reynolds number flow around cacti

60 Talley, Iaccarino, Mungal, Mansour
(a) (b)
t U / D
Cd
0 25 50 75
1
1.5
2
t U / D
Cl
0 25 50 75
-2
-1
0
1
2
Figure 9. Time history of drag (a) and lift (b) coefficients. Re = 20, 000. : L/D = 0;: L/D = 0.07
.
From the results presented in Table III, it appears that the cavity depth has a relativelystrong effect on the drag and a substantial dampening effect on the unsteady motion.
The time averaged turbulent kinetic energy for the four geometries considered is re-ported in Fig. 10; the intensity very close to the cylinder decreases with the cavity depth,but higher values are observed in the near wake.
The comparison of the computed Cd with the experimental values for the smoothcylinder (Achenbach 1971) shows an overprediction of about 20%. The flow over thesmooth cylinder in the subcritical regime is characterized by a laminar boundary layerseparation; turbulence is generated in the separated shear layer and is sustained in thenear wake. The smooth cylinder calculations (L/D = 0) are carried out with the v2 − fturbulence model switched off for θ ≤ 90o. This is necessary, especially at the higherReynolds numbers, because turbulence models typically anticipate transition. The sim-ulations with cavities are carried out with the model switched on from the stagnationpoint (θ = 0o) because it is expected that transition occurs immediately after the firstcavity. The exact location of transition has an impact on the accuracy of the drag calcu-lation. In addition, in the subcritical range three-dimensional effects in the real-life wakeare substantial.
Experimental and computed velocity profiles in the wake are compared in Fig. 11.The results for the smooth cylinder confirm that the calculation overestimate the drag(corresponding to the larger velocity defect in the wake); on the other hand, the data forthe cylinder with cavities show remarkable agreement. It must be pointed out that themeasurements exhibit three-dimensional effects that are not accounted for in the presenttwo-dimensional simulations.

The flow past cacti 61
(a) (b)
(c) (d)
Figure 10. Time averaged turbulent kinetic energy: (a) L/D = 0; (b) L/D = 0.035; (c)L/D = 0.070; (d) L/D = 0.105
.
4. Conclusions and future plans
The preliminary numerical results presented suggest that the v-shaped cavities providea damping effect of the fluctuating forces and a drag reduction. Further work is requiredto assess the effect of the cavities in the range of Re relevant for the cacti.
4.1. Experimental work
Future experiments should focus on obtaining Cd curves over a range of Re from 2× 10⁴
(for computational comparisons) to 106 (limit of wind velocities in the saguaro habi-tat). We will measure drag directly (using a multi-component force transducer - MC3A-X1000, Advanced Mechanical Technology, Inc, Watertown, MA), the pressure distribu-tion around the test cylinders (using 16 static ports attached to a scanivalve), and vortexshedding frequency (using hot-wire anemometry). If there are interesting flow phenom-ena, the effect of spines on flow around the test cylinders will be evaluated (using 3-DPIV). Finally, experimental measurements will be performed on live cactus specimens.
4.2. Numerical ccalculations
Two-dimensional RANS calculations will be carried out up to Re = 106. The pressureand skin friction distributions on the surface will be examined for various cavity depthto evaluate the effect on the local flow characteristics.
The effect of the location of the laminar/turbulent transition must be investigated,together with the impact of the turbulence modeling.

62 Talley, Iaccarino, Mungal, Mansour
(a) (b)
y/D
u/V
inl
-2 -1 0 1 20.5
0.75
1
y/D
u/V
inl
-2 -1 0 1 2
0.75
1
Figure 11. Velocity profiles in the wake of cylinders. simulations (Re = 100,000);◦ experiments (Re = 125,000). (a) smooth cylinder (b) cylinder with L/D 0.07.
In addition, three-dimensional direct simulations will be required to perform a fair com-parison with the experimental measurements in the subcritical and transcritical range.
Aknowledgements
We thank Profs. Peter Bradshaw, Rabindra Mehta, and John Eaton for advice and useof experimental equipment. We are grateful to Alex Hsu for help with laboratory work,Evangelos Kotsalis for help with numerical simulations, and Dr. Georgi Kalitzin for helpwith data analysis. We are especially thankful for technical support from graduate stu-dents Vijay Somandepalli, Simon Song, Paul Kodzwa, and Steve Solovitz. Additionalthanks to Profs. Petros Koumoutsakos, Javier Jimenez and Haecheon Choi for sugges-tions.
REFERENCES
Achenbach, E. 1971 Influence of surface roughness on the cross-flow around a circularcylinder. J. Fluid Mech. 46, 321-335.
Achenbach, E. 1977 The effects of surface roughness on the heat transfer from a circularcylinder to the cross flow of air. International Journal of Heat and Mass Transfer20, 359-362.
Alcock, J. 1985 Sonaran Desert Spring, The University of Chicago, Chicago.Bearman, P. W., and Harvey, J. K. 1976 Golf ball aerodynamics. Aeronautical
Quarterly, 112-122.Bearman, P. W., and Harvey, J. K. 1993 Control of circular cylinder flow by the
use of dimples. AIAA J. 31, 1753-1756.Benson, L. 1981 The Cacti of Arizona, The University of Arizona Press, Tucson.Blacker T.D., M.B. Stephenson & S. Canann 1991 Analysis automation with
paving: A new quadrilateral meshing technique Advances in Engineering Software,56, pp.332-337.
The flow past cacti 63
Denny, M. W. 1988 Biology and the Mechanics of the Wave-Swept Environment, Prince-ton University Press, New Jersey.
Denny, M. W. 1994. Extreme drag forces and the survival of wind and water-sweptorganisms. J. Exp. Biol. 194, 97-115.
Durbin, P.A. 1995 Separated flow computations with the k-ε-v2 model, AIAA J., 33pp.659-664.
Farell, C. 1981 Flow around fixed circular cylinders: Fluctuating loads. Proc. ASCE:J. Engg. Mech. Divn. 107, 565-573.
Geller, G. N., & Nobel, P. S. 1984. Cactus ribs: influence on PAR interception andCO2 uptake. Photosynthetica 18, 482-494.
Gibson, A. C., & Nobel, P. S. 1986 The Cactus Primer, Harvard University Press,Cambridge.
Guven, O., Farell, C. & Patel, V. C. 1978 Surface-roughness effects on mean flow.J. Fluid Mech. 98, 673-701.
Hodge, C. 1991. All About Saguaros, Hugh Harelson-Publisheer, Phoenix.Iaccarino, G. 2001 Predictions of a turbulent separated flow using commercial CFD
codes, J. Fluids Engg, 123, 1-10.Fluent Inc. 1999 Fluent V5.3 User Manual.Nakamura, Y., & Tomonari, Y. 1982. Effects of surface roughness on the flow past
circular cylinders at high Reynolds numbers. J. Fluid Mech. 123, 363-378.Niklas, K. J., & Buchman, S. L. 1994. The allometry of saguaro height. Amer. J.
Botany 81 1161-1168.Nobel, P. S. 1994 Remarkable Agaves and Cacti, Oxford University Press, New York.Pierson, E. A., & Turner, R. M. 1998 An 85-year study of saguaro (Carnegiea
gigantea) demography. Ecology 79, 2676-2693.Rogers, S. E. & Kwak, D. 1990 An upwind differencing scheme for the time accurate
incompressible Navier-Stokes equations. AIAA J., 28, 253–262.Roshko, A. 1961 Experiments on the flow past a circular cylinder at very high Reynolds
number. J. Fluid Mech. 10, 345-356.Szepessy, S. 1994 On the spanwise correlation of vortex shedding from a circular cylinder
at high Reynolds number. Phys. Fluids 6, 2406-2416.Vogel, S. 1981 Life in Moving Fluids, Princeton University Press, Princeton.