Embed Size (px)
Citation preview

An Experimental Analysis Of The Effect Of Quantitative Easing
Adrian Penalver1, Nobuyuki Hanaki2, Eizo Akiyama3, Yukihiko Funaki4, Ryuichiro Ishikawa5 6
June 2018, WP #684
ABSTRACT
In this paper we report the results of a repeated experiment in which a central bank buys bonds for cash in a quantitative easing (QE) operation in an otherwise standard asset market setting. The experiment is designed so that bonds have a constant fundamental value which is not affected by QE under rational expectations. By repeating the same experience three times, we investigate whether participants learn that prices should not rise above the fundamental price in the presence of QE (as found in (Penalver et al., 2017)). We find that some groups do learn this but most do not, instead becoming more convinced that QE boosts bond prices. These claims are based on significantly different behaviour of two treatment groups relative to a control group that doesn't have QE.
Keywords: Quantitative Easing, Experimental Asset Markets
JEL classification: C90, D84, G21
1 Banque de France, [email protected] 2 Université Nice Sophia Antipolis , [email protected] 3 University of Tsukuba, [email protected] 4 University of Waseda, [email protected] 5 University of Waseda, [email protected] 6 The views expressed herein are those of the authors and should under no circumstances be interpreted as reflecting those of the Banque de France. This research was funded by Project BEAM (Behavioral and Experimental Analyses in Macro-Finance). This paper has benefited from comments received at the SEF conference in Nice, the CEF conference in New York, the Stony Brook Experimental Macroeconomics workshop and a seminar at the Banque de France. We are particularly grateful for the discussion comments of Cars Hommes.
Working Papers reflect the opinions of the authors and do not necessarily express the views of the Banque de France. This document is available on publications.banque-france.fr/en

Banque de France WP #684 ii
NON-TECHNICAL SUMMARY
Quantitative easing (QE) is an unconventional monetary policy instrument available to central banks when their policy interest rates hit the effective lower bound. QE in its most basic form involves the purchase of government bonds in exchange for central bank reserves with the intention to retain them for a significant length of time. In an era in which central banks pay interest on reserves, QE is an exchange of one interest-bearing liability of the state for another. Under the textbook expectations hypothesis of the yield curve, QE can have no effect on bond yields if there is no change in the expected path of the policy interest rate and therefore no effect on output, employment or wages. In these circumstances, QE would just be an irrelevant shortening of the average maturity of net public debt.
In an earlier Working Paper (no. 651) we presented laboratory evidence that central bank purchases could raise bond prices even if government bonds and cash were perfect substitutes and the interest rate on cash was constant. The experiment was designed in such a way that QE would be ineffective under rational expectations. There was no uncertainty in the returns on bonds or cash and the principal repaid at the end of the experiment was equal to its fundamental value according to rational expectations. The presence of strongly statistically significant changes in prices in this original experiment suggests that a behavioural channel could also play a role in explaining the effectiveness of QE. QE could affect bond prices simply because traders believed it would.
A natural follow-up question to ask, which we address in this paper, is whether this is just a one-off effect? Won't traders realise after repeated experience that prices shouldn't move? This is not just an interesting academic exercise or robustness check but has important policy implications. If participants do learn, then the behavioural channel would weaken with repeated use. This would weaken the reliability of QE as an instrument for monetary policy stimulus if nominal interest rates hit the effective lower bound again in the future. (Nothing in the current paper says anything about the effectiveness of other channels through which QE affects bond prices.)
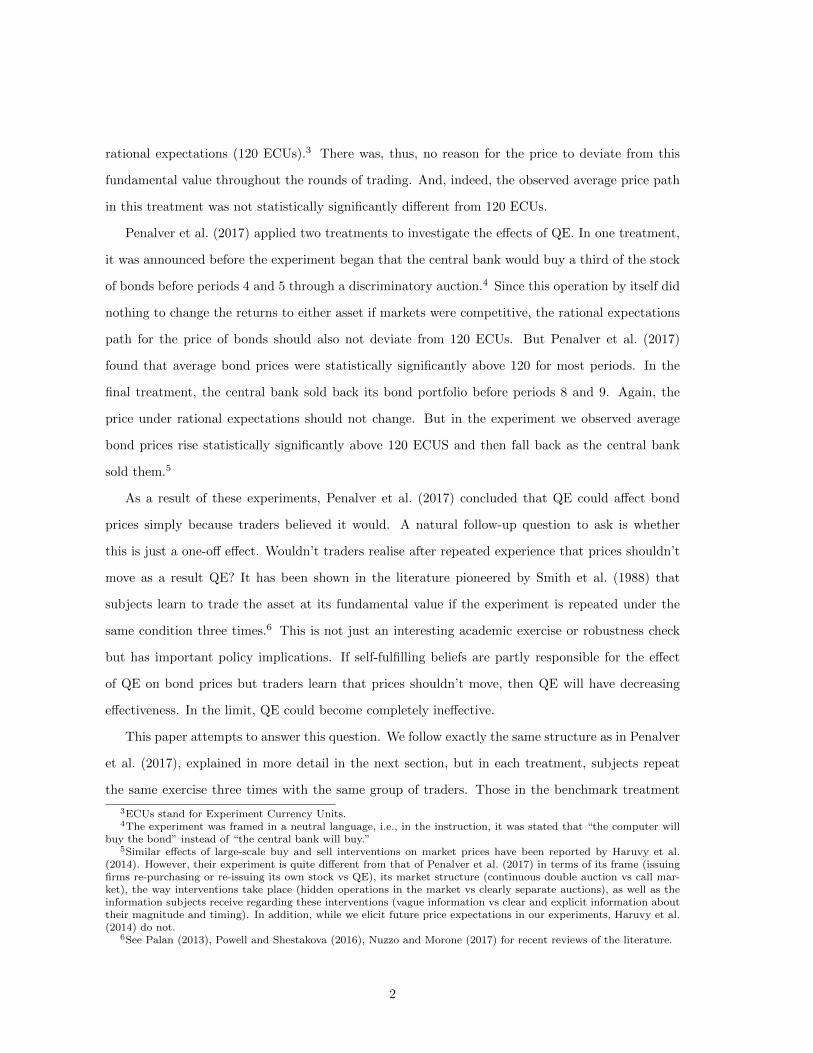
Our repeated experiments, illustrated in the Figure above, generally confirm the main results of the previous paper. Those in the benchmark treatment clearly learn that prices should not deviate from the fundamental price. In the QE treatments, some groups learn that the actions of the central bank (in this setting) should not affect the price but most come to "learn" that prices will rise and then fall back to fundamentals. These groups come to believe there is a pattern in the data.

Banque de France WP #684 iii
Another interesting feature of the repeated QE treatments is that participants start to anticipate price increases, with the peak in prices occurring earlier and earlier and by the third round they rise from the start.
Overall, the results in this paper suggest that QE can be repeatedly effective even if a behavioural component helps explain some of the effect of central bank asset purchases on bond prices.
Effets de l’assouplissement quantitatif des banques centrales: apports d’une étude
expérimentale RÉSUMÉ
Dans cet article, nous présentons les résultats d'une expérience répétée au cours de laquelle une banque centrale achète des obligations au comptant dans le cadre d'une opération d'assouplissement quantitatif (AQ). La structure du marché des actifs est par ailleurs standard. L'expérience est conçue de manière à ce que les obligations aient une valeur fondamentale constante. Quand les anticipations sont rationnelles, cette valeur n’est pas affectée par l'assouplissement quantitatif. En répétant la même expérience trois fois, nous cherchons à savoir si les participants comprennent que les prix ne devraient pas dépasser le prix fondamental en présence de l'assouplissement quantitatif (comme dans Penalver et al., 2017). Nous constatons que certains groupes le comprennent. Mais la plupart n’en déduisent pas cette conclusion et deviennent plutôt plus convaincus que l'assouplissement quantitatif accroit les prix des obligations. Ces résultats sont fondés sur le comportement significativement différent de deux groupes de traitement par rapport à un groupe témoin qui n'a pas d'AQ. Mots-clés : assouplissement quantitatif, marchés financiers expérimentaux. Les Documents de travail reflètent les idées personnelles de leurs auteurs et n'expriment pas nécessairement
la position de la Banque de France. Ils sont disponibles sur publications.banque-france.fr

1 Introduction
Quantitative easing (QE) in its most basic form is the purchase of government bonds in exchange for
central bank reserves with the intention to retain them for a significant length of time.1 In an era in
which interest is paid on reserves, this amounts to the exchange of one interest-bearing liability of
the state for another. In textbook models with frictionless and complete markets and fully rational
and infinitely living agents and no arbitrage, such a transaction can have no temporary or permanent
effects on any macroeconomic variables (Eggertsson and Woodford, 2003). In particular, short-term
and long-term interest rates will be unchanged and there will be no effect on output and inflation.2
There is, however, strong evidence that QE programmes have moved bond prices and yields, al-
though the scale and duration of such effects is still debated (Krishnamurthy and Vissing-Jorgensen,
2011; Joyce et al., 2011). The literature has focused on two departures from the textbook model to
explain these effects. One theory is that central bank money and government bonds are not perfect
substitutes (Tobin, 1958) perhaps because markets are segmented due to investors’ ‘preferred habi-
tat’ (Vayanos and Vila, 2009) or investors do not like holding the interest rate risk associated with
long-term bonds. If long-term government bonds and central bank reserves are not perfect substi-
tutes, a fall in the volume of long-term bonds in private hands can raise the price and drop the yield
relative to short-term rates. The alternative explanation is that QE is a means by which central
banks can give credibility to forward guidance commitments to deviate from established monetary
policy behaviour, such as a Taylor rule (Eggertsson and Woodford, 2003). QE reinforces the signal
that the short-term rate will remain low for longer than a time-consistent policy rule would suggest.
Lowering the expected path of short-term rates drags down long-term rates through the expectations
hypothesis of the term structure.
Penalver et al. (2017) showed, through a set of controlled laboratory experiments, that QE could
increase bond prices even in the absence of either of these channels. In the benchmark treatment
of the experiment by Penalver et al. (2017), a group of student subjects traded bonds for central
bank cash among themselves. There was no uncertainty in the returns on bonds or cash and the
principal repaid at the end of the experiment was equal to its fundamental value according to
1The scale of the purchases and the holding period distinguish quantitative easing from standard open marketoperations. QE programmes have also bought non-government bonds but this is outside the scope of this paper.
2Older irrelevance propositions for open market operations were described in Wallace (1981) and Sargent andSmith (1987).
1
rational expectations (120 ECUs).3 There was, thus, no reason for the price to deviate from this
fundamental value throughout the rounds of trading. And, indeed, the observed average price path
in this treatment was not statistically significantly different from 120 ECUs.
Penalver et al. (2017) applied two treatments to investigate the effects of QE. In one treatment,
it was announced before the experiment began that the central bank would buy a third of the stock
of bonds before periods 4 and 5 through a discriminatory auction.4 Since this operation by itself did
nothing to change the returns to either asset if markets were competitive, the rational expectations
path for the price of bonds should also not deviate from 120 ECUs. But Penalver et al. (2017)
found that average bond prices were statistically significantly above 120 for most periods. In the
final treatment, the central bank sold back its bond portfolio before periods 8 and 9. Again, the
price under rational expectations should not change. But in the experiment we observed average
bond prices rise statistically significantly above 120 ECUS and then fall back as the central bank
sold them.5
As a result of these experiments, Penalver et al. (2017) concluded that QE could affect bond
prices simply because traders believed it would. A natural follow-up question to ask is whether
this is just a one-off effect. Wouldn’t traders realise after repeated experience that prices shouldn’t
move as a result QE? It has been shown in the literature pioneered by Smith et al. (1988) that
subjects learn to trade the asset at its fundamental value if the experiment is repeated under the
same condition three times.6 This is not just an interesting academic exercise or robustness check
but has important policy implications. If self-fulfilling beliefs are partly responsible for the effect
of QE on bond prices but traders learn that prices shouldn’t move, then QE will have decreasing
effectiveness. In the limit, QE could become completely ineffective.
This paper attempts to answer this question. We follow exactly the same structure as in Penalver
et al. (2017), explained in more detail in the next section, but in each treatment, subjects repeat
the same exercise three times with the same group of traders. Those in the benchmark treatment
3ECUs stand for Experiment Currency Units.4The experiment was framed in a neutral language, i.e., in the instruction, it was stated that “the computer will
buy the bond” instead of “the central bank will buy.”5Similar effects of large-scale buy and sell interventions on market prices have been reported by Haruvy et al.
(2014). However, their experiment is quite different from that of Penalver et al. (2017) in terms of its frame (issuingfirms re-purchasing or re-issuing its own stock vs QE), its market structure (continuous double auction vs call mar-ket), the way interventions take place (hidden operations in the market vs clearly separate auctions), as well as theinformation subjects receive regarding these interventions (vague information vs clear and explicit information abouttheir magnitude and timing). In addition, while we elicit future price expectations in our experiments, Haruvy et al.(2014) do not.
6See Palan (2013), Powell and Shestakova (2016), Nuzzo and Morone (2017) for recent reviews of the literature.
2

clearly learn that prices should not deviate from its fundamental value. In the two QE treatments,
some groups learn that the actions of the central bank (in this setting) should not affect the price
but most come to “learn” that prices should rise and then fall back to fundamentals. These groups
come to believe that there is a pattern in the data. We observe clearly that subjects’ expectations
are anchored by the price paths they have observed. Another interesting feature of the QE results is
that traders start to anticipate price increases. In the first round (in both QE treatments) average
prices peak in period 7 - well after the central bank has stopped buying. In the second round, prices
peak in periods 4 to 6, and in the third round they peak in periods 1 to 3.
The paper is organised as follows. Section 2 describes the experiment in more detail, section 3
presents the main results and section 4 concludes.
2 Experiment
We first describe the aspects of the experiment that are common to all the treatments. We then
describes each of our three treatments. See Appendix B for an English translation of the instruction.
2.1 Basic experimental set-up: Market structure
We set up an experimental bond market very similar to Bostian and Holt (2009). A market consists
of N traders who are put into the situation of large commercial banks which hold a portfolio of
riskless bonds and central bank reserves (“cash” from here on).7 At the start of the experiment,
each trader is endowed with 8 bonds and 800 ECU of cash. Each round of the experiment lasts for
T = 11 periods. Each bond pays a dividend of 6 ECU per period and matures at the end of period
11 for 120 ECUs. Cash receives a 5% interest rate per period. In this setting, the fundamental value
(FVt) of a unit of bond at the beginning of period t is 120 ECU for all t = 1, ..., T .8
At the end of each period the participants have the opportunity (but not the obligation) to trade
bonds and cash with each other in a call market as in van Boening et al. (1993), Haruvy et al.
7Note, however, that we did not frame experiment in such a way. In particular, we did not tell subjects that theyare acting as large commercial banks. Instead, we simply told our subjects that they are going to trade hypotheticalgovernment bonds using the hypothetical experimental currency.
8Consider at the beginning of period T . If a trader buys a unit of bond at price FVT , then it will be 6+120 ECUat the end. If the trader kept the same amount cash until the end, then, it will become 1.05FVT after the interestpayment. Since these two have to be the same in the equilibrium, we have 1.05FVT = 126, i.e., FVT = 120. Now,consider the beginning of period T − 1. If a trader buys a unit of bond at FVT−1, its value at the end of the period is6 +FVT = 126. If the same amount of cash is held until the the end of period, it will become 1.05FVT−1. Since thesetwo have to be equivalent, 1.05FVT−1 = 126, i.e., FVT−1 = 120. One can do the same thing for all the remainingperiods to obtain FVt = 120 for all t = 1, .., T .
3

(2007), and Akiyama et al. (2014, 2017). In a call market, traders submit order by specifying a
price-quantity pair. In period t, for example, if trader i wishes to submit a buy order, he must
specify the maximum price at which he is willing to pay for a unit of bond (bid, bit) and how many
units of bond he wishes to purchase (dit). If i wishes to submit a sell order in period t, he must
specify the minimum price at which he is willing to sell a unit of bond (ask, ait) and how many units
of bond he wishes to sell (sit). In each period, each trader can submit both a buy order and a sell
order, just one of them, or none. Neither short-selling or borrowing of cash is allowed. Thus, in case
i submits a sell order in period t, he must have sit units of bond in his portfolio. Similarly, if i submits
a buy order in period t, his cash holding has to be no less than bitdit. Finally, in case i submits both
buy and sell orders, we require bit ≤ ait.9 Once all the traders in the market submit their orders,
the orders are aggregated and a market clearing price is computed. Following the existing studies
(Haruvy et al., 2007; Akiyama et al., 2014, 2017), when there are multiple market clearing prices,
we choose the minimum among them.
We have employed the call market structure, instead of a continuous double auction, to facilitate
the forecasting task performed by participants (to be described in the next subsection). In the call
market, because there is only one market clearing price per period, the prices participants need
to forecast are defined clearly. Note that the existing experimental results show that call markets
and continuous double auctions generate similar price dynamics (Palan, 2013, Obs. 27), although
trading volumes can be different.
2.2 Basic experimental set-up: Forecasting
We elicit traders’ expectation regarding future prices to better understand how QE, in the form
considered in our experiment, influences the expectations and behavior of market participants. While
expectations play a central role in modern macro and financial economics, and various policies,
both monetary and fiscal, have increasingly come to be viewed as influencing the expectations of
market participants (Honkapohja, 2015; Mertens and Ravn, 2014), there still is a considerable room
for research into the dynamics of expectation formations as Palan (2013) points out. By eliciting
traders’ expectations regarding the current and future periods prices at the beginning of each period,
we aim to better understand the link between price expectations and market prices and how and
9There was an additional technical constraint. We only allowed both ait and bit to be an integer value between 1and 2000. This was purely due to the way experimental software were programmed.
4

why price expectations evolve over time.
At the beginning of each period, before traders submit their orders, we ask subjects to submit
their forecasts of the bond price in the current as well as in all the remaining periods. That is, at
the beginning of period t, subject i is submitting his forecasts for bond prices in periods t, t + 1,
..., T . This elicitation methods allow us to observe dynamics of subjects’ short-run and long-run
forecasts, and have been employed, for example, by Haruvy et al. (2007) and Akiyama et al. (2014,
2017).
Subjects receive a bonus of 0.5% of their final cash holding (after their bonds have matured) for
each forecast that contained the realized price plus or minus 10%. Thus, if all the 66 forecasts i
submitted during 11 periods satisfy this condition, they receive a bonus payment of 33% of their
final cash holding.10
2.3 Three treatments
We consider three treatments: (T1) Benchmark, (T2) Buy&Hold, and (T3) Buy&Sell. Benchmark
treatment is without any policy intervention and conducted under our basic setting described above.
In both Buy&Hold and Buy&Sell treatments, there is a pre-announced policy intervention that the
central bank will try to buy a total of 1/3 of outstanding bonds from market participants through
a discriminatory auction before the beginning of period 4 and 5 (we call this buy-operation). In
Buy&Sell treatment, there is additional pre-announced policy intervention that the central bank
will try to sell back the bonds it bought during its buy-operation to market participants through a
discriminatory auction before the beginning of period 8 and 9 (we call this sell-operation).
During the buy-operations in T2 and T3, the central bank aims to buy 1/3 of the stock of
outstanding bonds. The central bank tries to buy equal amounts in periods 4 and 5. If it fails to
buy the bonds planned in period 4, the residual amount was added to its operation in period 5. If
it fails to buy its revised target in period 5, the shortfall is ignored.11
During these two buy-operations, each trader can submit a sell order that specifies (price, quan-
10Akiyama et al. (2014, 2017) introduced this incentive scheme for the forecasting performance to minimize thepossibility of subjects trying to improve their forecasting performances by engaging in unprofitable trading strategiesjust to make the market prices closer to their forecasts. Recently, however, Hanaki et al. (2018b) found that rewardingsubjects for their forecasting performance this way can enlarge mis-pricing compared to the experiments where subjectsonly trade and no forecast is elicited. Although the set-up considered by Hanaki et al. (2018b) is slightly different fromours, it is possible that the similar effects operate in the current experiment. It should be noted, however, becausethe way subjects are rewarded for their forecasting performances is identical across all the treatments we consider inthis paper, it will not influence our analyses based on treatment comparisons.
11In practice the central bank always bought or sold its planned amount in each period.
5

tity) pair. Once all the orders are submitted, the central bank sorts them based on the specified
prices in the ascending order, and buys up to the targeted amount, from the lowest price, each at
its specified price.
In the Buy&Hold treatment, once the central bank complete its buy-operation, it will hold the
bonds its bought until the end of period T. In other words, the central bank permanently removes
those bonds from the market. In the Buy&Sell treatment, the central bank will sell back the bonds
it bought back to the market participant during its sell-operation before the period 8 and 9.
The sell-operation in Buy&Sell treatment is conducted in a similar manner as in the buy-
operation. It tries to sell back half its portfolio of bonds in period 8, and whatever amount remains
in period 9. If it fails to sell back all the units of bond during these two sell-operation, it will simply
keep them until the end of period T. During these sell-operations, each trader can submit a buy
order that specifies (price, quantity) pair. Once all the orders are submitted, the central bank sorts
them based on the specified prices in the descending order, and sells up to the targeted amount,
from the highest price, each at its specified price.
In both treatments, these policy interventions are announced before the beginning of the game.
Thus, subjects in Buy&Hold treatment are informed that there will be the central bank intervening
to buy a large fraction of bond out of the market after period 3, and those in the Buy&Sell treatment
are informed that there will be the central bank intervention after period 3 as well as the reverse
intervention after period 7. We are primarily interested in how these pre-announced interventions
influence the price forecasts of our subjects.
2.4 Other aspects of the experiments
In all the three treatments, the same group of subjects repeat the same 11 periods bond market
game three times. We call one play of the 11 periods market game a round. We are interested
in how subjects learn and adjust their forecasts and trading behavior based on their experience in
playing the same game. At the end of the final round of the game, one of the three round is chosen
randomly for payment. Subjects are paid based on their final cash holding and the bonus for their
forecast performance of this chosen round, in addition to their participation fee of 500 JPY. The
exchange rate between ECU and JPY was 1 ECU = 1 JPY.
We conducted the whole exercise with two market sizes: N = 6 and N = 12. This was intended to
test whether the result of Penalver et al. (2017) which was based on N = 6 were robust to the degree
6

Mean forecast deviations Median forecast deviations
1 2 3 4 5 6 7 8 9 10 11p
-40
-20
20
40f1,p - FV
1 2 3 4 5 6 7 8 9 10 11p
-40
-20
20
40f1,p - FV
p-valuest=1 t=2 t=3 t=4 t=5 t=6 t=7 t=8 t=9 t=10 t=11
T1: H0 : f1,t = 120 0.0002 0.538 0.058 0.425 0.441 0.592 0.097 0.005 0.002 0.008 0.001T2: H0 : f1,t = 120 0.996 0.723 0.376 0.122 0.019 0.120 0.022 0.030 0.06 0.087 0.115T3: H0 : f1,t = 120 0.647 0.381 0.418 0.196 0.078 0.142 0.060 0.090 0.091 0.096 0.981H0 : T1 = T2 = T3 0.084 0.567 0.125 0.103 0.333 0.277 0.446 0.525 0.828 0.938 0.814
Figure 1: The average (left) and the median (right) initial forecasts deviations from FV for 11 periodsin three treatments. T1: Benchmark (thin blue), T2: Buy&Hold (thick red), and T3: Buy&Sell(black dashed)
of competition in each market. Since the results were not statistically significantly different, however,
we combined the two datasets and report pooled results. See Appendix A for the comparisons.
Computerized experiments12 were conducted at Waseda University and University of Tsukuba
between January and July 2017. 438 students from a variety of disciplines who had never participated
in similar experiments were recruited.13
3 Results
3.1 Initial forecasts
We start by presenting the first thing that all the participants in each treatment do - provide an
initial forecast for the market price across the 11 periods of the first round. The deviations of
the mean and median paths from FV are presented in Figure 1 (T1: Benchmark (thin blue), T2:
Buy&Hold (thick red), and T3: Buy&Sell (black dashed)). Both paths show a tendency to increase,
although this is much more evident for the mean than the median. The median paths are very
similar across the three treatments and quite close to the FV. Indeed it is interesting to note that
12The experiment was computerized using z-Tree (Fischbacher, 2007)13We had 8 markets for each of the two market sizes for each of the three treatments (except for the benchmark
treatment with N = 6, where we have 9 markets). Thus, we have 150 subjects (9 markets with 6 subjects each and8 markets with 12 subjects each) for the benchmark treatment, and 144 subjects each for the Buy&Hold and theBuy&Sell treatments.
7

the median forecast for the final period (when bonds mature at FV) is exactly FV for the three
treatments. The means are all above the median suggesting that there is an upward skew in the
initial distribution across the participants. This is particularly the case for the two QE treatments.
The benchmark forecast is mostly below the two QE forecasts, although this difference is generally
not statistically significant. Figure 1 shows the p-values for testing whether, for each treatment, the
forecast for period p price is different from FV, as well as the forecasts for period p price are different
across three treatments. Those periods in which the test reject the null hypothesis at 5% significance
level is shown in bold. These tests are conducted based on running the following OLS regression
(for each period) and testing the equality of the estimated coefficients.
f i1,p = α1DiT1 + α2DT2 + α3DT3 + εip (1)
where f i1,p is subject i’s forecast for period p price elicited at the beginning of period 1, Dixs are
dummy variables that takes value 1 if i has participated in treatment x ∈ {T1, T2, T3}. The standard
errors are corrected for potential within group clustering effect. We have chosen this test in order
to control for possible correlation among subjects within a group.14
There is not much discernible difference between the initial price forecast paths between T2 and
T3. The average expected prices around periods 8 and 9 when the central bank sells in treatment
T3 are below T2 but this difference is not statistically significant. Moreover, if anything the median
price path for T3 is above those in T2.
Overall, we do not observe a significant effect of the announced differences in treatment on initial
forecasts. This is in contrast to what was found in Penalver et al. (2017).
To further check if the policy announcement did not influence subjects’ initial forecasts, we
measured the deviation of price forecasts from FV by the two measures proposed by Akiyama et al.
(2014, 2017), the relative absolute forecast deviations (RAFD) and the relative forecast deviation
(RFD). For the set of forecasts submitted by subject i in the beginning of period t, RAFDit and
14Note however that given that this is the first set of forecasts submitted by the subjects without observing thepast realized prices, the effect of such correlation should be very limited. Not correcting for clustering effect, however,does not change the result qualitatively.
8

RAFD RFD
0.0 0.5 1.0 1.5 2.0RAFD
0.2
0.4
0.6
0.8
1.0CDF
-2 -1 0 1 2RFD
0.2
0.4
0.6
0.8
1.0CDF
Mean (Std. Dev.) Mean (Std. Dev).T1 T2 T3
0.503 0.546 0.543(0.676) (0.908) (0.838)
T1 T2 T30.062 0.155 0.127
(0.821) (1.03) (0.983)p=0.807 p=0.538
Figure 2: Empirical CDF of RAFD1 and RFD1. T1: Benchmark (thin blue), T2: Buy&Hold (thickred), and T3: Buy&Sell (black dashed)
RFDit are defined as:
RAFDit =
1
11− t+ 1
T∑p=t
|f it,p − 120|120
(2)
RFDit =
1
11− t+ 1
T∑p=t
f it,p − 120
120(3)
where f it,p is the forecast of asset price in period p submitted by subject i in the beginning of period t.
Figure 2 shows the empirical cumulative distribution (empirical CDF) of RAFDi1 (left) and
RFDi1 (right) for three treatments: T1: Benchmark (thin blue), T2: Buy&Hold (thick red), and T3:
Buy&Sell (black dashed). It also reports the mean, standard error, and the p-values for treatment
comparison.15
The absence of treatment effects in RAFD1 and RFD1 confirms the earlier finding. The an-
nouncement of large intervention does not influence the subjects’ initial expectations.16
Observation 1 The announcement of large intervention does not influence initial expectations of
15Just as we have done for the forecasts for period p price, the test of equally among three treatments are done byrunning OLS regression (with correcting the clustering effect) of the form Y i = a + b1DT1 + b2DT2 + b3DT3 + µi
(where Y i is either RAFDi1 or RFDi
1. Dx a dummy variable that takes value 1 if treatment is x.) and testing whetherestimated coefficients of treatment dummies are equal that is H0 : b1 = b2 = b3 to control for the possible correlationamong subjects within a group.
16Furthermore, non-parametric Kruskal-Wallis test give the same conclusion: p=0.867 for RADF and p=0.836 forRDF.
9

T1: Benchmark T2: Buy&Hold T3: Buy&SellRound 1
1 2 3 4 5 6 7 8 9 10 11t
-50
50
pt - FV
1 2 3 4 5 6 7 8 9 10 11t
-50
50
pt - FV
1 2 3 4 5 6 7 8 9 10 11t
-50
50
pt - FV
Round 2
1 2 3 4 5 6 7 8 9 10 11t
-50
50
pt - FV
1 2 3 4 5 6 7 8 9 10 11t
-50
50
pt - FV
1 2 3 4 5 6 7 8 9 10 11t
-50
50
pt - FV
Round 3
1 2 3 4 5 6 7 8 9 10 11t
-50
50
pt - FV
1 2 3 4 5 6 7 8 9 10 11t
-50
50
pt - FV
1 2 3 4 5 6 7 8 9 10 11t
-50
50
pt - FV
Figure 3: Dynamics of price deviations in T1: Benchmark (left), T2: Buy&Hold (center), and T3:Buy&Sell (right) over three rounds. The median across markets are shown in think lines.
inexperienced subjects.
3.2 Price dynamics
We now turn to the core results of the experiment illustrated in Figure 3. The columns are respec-
tively the benchmark treatment, the Buy&Hold treatment and the Buy&Sell treatment. The rows
are the first, second and third rounds for each treatment. In each panel, a thin line represents the
observations from one market, while the thick line represents their median. 17 We observe substan-
tial variations across markets within each treatment.18 There are a number of interesting results
17We have eliminated several instances in which the market clearing algorithm delivers a price of 1. No trading evertakes place at these prices.
18It is not the case that trades occurs among only a few specific traders in the market, nor the prices are determinedby some specific minority of traders in each market. See Subsections A.1.2 and A.1.3 of Appendix for the analysesdone separately for two market sizes.
10

here. The median price path for the Benchmark treatment in the first round is slightly above 120
but many are clustered around the fundamental value. A few markets have wildly high prices at
the beginning and a few others rise and then fall. By the second and particularly the third round,
the median price is scarcely different from the fundamental price. Fewer and fewer markets show
any deviation. In the Buy&Hold treatment, period 1 prices in round 1 are highly dispersed. But
prices generally drift up and between periods 6 and 8 (after the central bank has stopped buying)
and prices in every single one of the 16 markets is above the fundamental price. Prices converge
back to 120 by period 11. In round 2 of the Buy&Hold treatment, the action moves earlier. Almost
all markets start with prices well above 120. And with the notable exception of one market in which
they have collectively realised the rational expectations solution, all markets have prices above the
fundamental price from periods 2 to 7. Prices begin to gradually converge towards the fundamental
price from period 6. By round 3, markets in the Buy&Hold treatment again almost all start above
the fundamental price but the median price peaks in period 3. Median prices have converged to
fundamentals by period 9. The Buy&Sell treatment shows quite a similar pattern to the Buy&Hold
treatment. Prices in period 1 of round 1 are highly dispersed but again rise so that almost all prices
are above the fundamental price in periods 4 to 7. There is, however, a noticeable drop in prices as
the central bank starts to sell in periods 8 and 9. The action again moves earlier in round 2 and
the median peaks in period 4. By round 3, prices in all markets jump initially and then generally
monotonically decrease after period 3.
Figure 4 presents the same price paths using averages and reports a number of simple statistical
tests of hypotheses of differences in behaviour. Our three treatments are shown in each panel, T1:
Benchmark (thin blue), T2: Buy&Hold (thick red), and T3: Buy&Sell (black dashed). The table
below the three panels reports p-values from various tests. Those p-values less than 0.05 are shown
in bold. Several observations can be made. In round 1, prices are overvalued in all treatments,
including the benchmark. There is little difference between the three treatments before period 6.
In period 7, however, the average prices in two treatments with QE is statistically significantly
higher than that in the benchmark. The two QE treatments become noticeably and statistically
significantly different from the benchmark treatment - evidence of a non-fundamental channel for
QE - in rounds 2 and 3. Treatments Buy&Hold and Buy&Sell are statistically indistinguishable until
periods 9 and 10. In period 9, prices in the QE Buy&Sell treatment are statistically significantly
lower than the QE Buy&Hold treatment, strong evidence that the sell-operation had a systematic
11

Average price deviationRound 1 Round 2 Round 3
1 2 3 4 5 6 7 8 9 10 11t
-40
-20
20
40pt - FV
1 2 3 4 5 6 7 8 9 10 11t
-40
-20
20
40pt - FV
1 2 3 4 5 6 7 8 9 10 11t
-40
-20
20
40pt - FV
Round 1. P-valuest=1 t=2 t=3 t=4 t=5 t=6 t=7 t=8 t=9 t=10 t=11
T1: H0 : pt = 120∗ 0.864 0.087 0.014 0.006 0.002 0.001 0.004 0.002 0.004 0.004 0.012T2: H0 : pt = 120∗ 0.726 0.315 0.104 <0.001 <0.001 <0.001 <0.001 <0.001 <0.001 <0.001 0.044T3: H0 : pt = 120∗ 0.223 0.483 0.022 <0.001 <0.001 <0.001 <0.001 0.006 0.654 0.642 0.451H0 : T1 = T2 = T3 ∗∗ 0.877 0.934 0.751 0.518 0.259 0.040 0.002 0.011 0.001 0.006 0.036H0 : T1 = T2 ∗∗∗ 0.706 0.456 0.269 0.853 0.897 0.161 0.002 0.004 0.021 0.106 0.917H0 : T1 = T3 ∗∗∗ 0.282 0.353 0.498 0.852 0.297 0.044 0.001 0.174 0.368 0.066 0.013H0 : T2 = T3 ∗∗∗ 0.522 0.834 0.602 0.599 0.266 0.394 0.594 0.439 0.013 0.001 0.033
Round 2. P-valuest=1 t=2 t=3 t=4 t=5 t=6 t=7 t=8 t=9 t=10 t=11
T1: H0 : pt = 120∗ 0.022 0.004 0.002 0.002 0.003 0.005 0.013 0.036 0.110 0.029 0.954T2: H0 : pt = 120∗ <0.001 <0.001 <0.001 <0.001 <0.001 <0.001 <0.001 0.307 0.001 0.016 0.180T3: H0 : pt = 120∗ 0.002 <0.001 <0.001 <0.001 <0.001 <0.001 <0.001 <0.001 0.139 0.499 0.521H0 : T1 = T2 = T3∗∗ 0.362 0.077 0.064 0.010 0.002 0.001 0.001 0.002 0.002 0.128 0.224H0 : T1 = T2 ∗∗∗ 0.380 0.055 0.021 0.005 0.001 <0.001 0.001 0.750 0.003 0.167 0.333H0 : T1 = T3 ∗∗∗ 0.594 0.112 0.053 0.012 0.004 0.006 0.009 0.089 0.940 0.369 0.678H0 : T2 = T3 ∗∗∗ 0.702 0.679 0.653 0.549 0.228 0.091 0.107 0.988 0.002 0.058 0.151
Round 3. P-valuest=1 t=2 t=3 t=4 t=5 t=6 t=7 t=8 t=9 t=10 t=11
T1: H0 : pt = 120∗ 0.028 0.022 0.037 0.084 0.115 0.078 0.227 0.308 0.615 0.321 1.000T2: H0 : pt = 120∗ <0.001 <0.001 0.041 <0.001 <0.001 0.001 0.003 0.170 0.044 0.128 0.965T3: H0 : pt = 120∗ <0.001 <0.001 <0.001 <0.001 <0.001 <0.001 0.008 0.678 0.430 0.370 0.263H0 : T1 = T2 = T3∗∗ 0.004 0.007 0.001 <0.001 0.259 <0.001 0.003 0.010 0.064 0.083 0.102H0 : T1 = T2∗∗∗ 0.023 0.014 0.188 0.001 0.001 0.005 0.007 0.021 0.030 0.059 1.000H0 : T1 = T3∗∗∗ 0.006 0.017 0.004 0.004 0.001 0.001 0.039 0.955 0.617 0.787 0.325H0 : T2 = T3∗∗∗ 0.761 0.758 0.811 0.329 0.381 0.654 0.374 0.147 0.046 0.077 0.461
∗ P-values based on t-test (two-tailed).∗∗ P-values based on Kruskal-Wallis test.∗∗∗ P-values based on Fisher-Pitman permutation test (two-tailed).∗∗∗ Those p-values < 0.05 are shown in bold.
Figure 4: Dynamics of the average price deviations from the FV over three rounds in T1: Benchmark(thin blue), T2: Buy&Hold (thick red), and T3: Buy&Sell (black dashed). P-values for varioushypothesis tests are also reported.
12

effect on prices.
Observation 2 The large scale buy-operation (quantitative easing) raises the bond price signifi-
cantly. Furthermore, for market with experienced subjects (Round 2 and 3), such an operation raises
the bond price even before it takes place.
Observation 3 The sell-operation that follows the buy-operation significantly lowers the bond price
only immediately after its completion. It does not lower the prices before the operation takes place.
3.2.1 Central bank operations
Table 1 report the average prices per unit of bond with which the central bank bought (top panel)
and sold (middle panel) during its operation. It also reports the difference between the average
transaction prices between two operations (bottom panel). We observe that, on average, the central
bank paid a price substantially higher than the FV during its buy operations. In Buy&Sell treatment,
although the central bank also sold at prices significantly higher than FV during its sell operation
(except in Round 3), on average, it was not as high as the prices it paid for a unit of bond during
the buy operation (except in Round 1). As a result, substantial amount of cash (on average, 20% of
FV per unit of bond) has been transferred from the central bank to the market participants through
these two operations.
Existing studies (see, e.g., Kirchler et al., 2012; Haruvy et al., 2014; Deck et al., 2014) of
similar types of experimental asset markets find that prices can rise when the ratio of cash to assets
increases. It is possible that participants in those experiments thought they needed to put ”idle cash
to work”. The two QE buy operations in our experiments are an exchange of bonds for cash and
thus substantially increase this ratio. Some readers might wonder whether the subsequent strength
of prices is simply a result of this effect. We conduct the follwoing regression to test this:
pbom = a1 + a2p1−3
m + εm (4)
∆pm = b1 + b2pbom + µm (5)
where pbom is the average transaction price per unit of bond during the buy operation for market m,
and ∆pm ≡ p5−7m − p1−3m is the difference in the average prices for the three periods immediately
before and after the buy-operation for market m.
13

Table 1: Summary of Central Bank Operation
Average transaction price in buy operation : pboMean SD Min Max
T2. Round 1 149.61a 18.93 122.06 191.75T2. Round 2 162.80a 34.01 125.00 263.13T2. Round 3 151.53a 21.24 119.94 186.41T3. Round 1 148.62a 20.37 121.09 180.50T3. Round 2 154.91a 17.19 124.69 179.75T3. Round 3 145.66a 16.83 122.19 174.00
Average transaction price in sell operation : psoMean SD Min Max
T3. Round 1 140.19a 24.58 116.81 212.81T3. Round 2 126.96a 5.53 115.75 137.38T3. Round 3 119.73 11.02 82.69 130.78
Difference between sell and buy operation: pbo − psoMean SD Min Max
T3. Round 1 8.43 31.67 −78.94 59.69T3. Round 2 27.94b 14.06 0.00 48.38T3. Round 3 25.94b 20.38 3.72 77.25
a statistically significantly different from 120 at 1% level.(t-test, 2 tailed)b statistically significantly different from 0 at 1% level.(t-test, 2 tailed)
Regression 4 tests whether the prices paid by the central bank can be explained by the prices
in the market for the three previous periods. The left panel of Table 2 reports the results of
this regression for the three rounds pooling across treatments T2 and T3. There is an increasingly
stronger and statistically significantly positive relationship between prices in the market before the
buy operations and the average price paid by the central bank.
Regression (5) tests whether the difference in prices in the market before and after the central
bank buy operation are related to the average price paid by the central bank.19 If the cash/asset ratio
was an important driver for the price increase after the buy-operation, these should be a statistically
significant positive relationship. The right panel of Table 2 shows that this is clearly not the case.
19There were two cases in Round 1 (for the market with 6 traders) where the central bank failed to buy the targetedamount of bond (instead of 16, it bought 14 or 15) for these two instances, the pbo is not a precise measure of thechange in the cash/asset ratio caused by the buy operation. We have run the regression (shown in eq. (5)) droppingthese two instances, but the result is qualitatively the same. We have also run the regressions separately for Buy&Holdand Buy&Sell treatments. The results are qualitatively the same as the one presented in the right panel of Table 2 forboth treatments, except that the estimated coefficients of the average prices during the first period in the specificationshown in eq. (4) become not statistically significantly from zero for Round 1 and Round 2 in Buy&Hold treatment.
14

Table 2: Relationships between the average market prices and the buy operation
Dependent Var: pbo Dependent Var: ∆pRound 1 Round 2 Round 3
Const 105.03∗∗∗ 56.40 36.33∗∗
(15.26) (37.25) (14.22)p1−3 0.36∗∗∗ 0.70∗∗∗ 0.77∗∗∗
(0.12) (0.25) (0.10)R2 0.225 0.204 0.679
N of Obs. 32 32 32
Round 1 Round 2 Round 3Const 50.50 -0.234 49.39∗∗
(43.88) (16.27) (21.14)pbo -0.153 -0.003 -0.404∗∗∗
(0.292) (0.101) (0.141)R2 0.009 0.000 0.214
N of Obs. 32 32 32
∗∗ statistically significant at 5% level∗∗∗ statistically significant at 1% level
In rounds 1 and 2, the effect is negligible and in round 3 it is negative rather than positive.
The top panel of Table 3 compares the average prices paid by the central to the average prices
in the three periods beforehand. In round 1, the central bank pays around 25 ECUs more than the
previous average market price in both treatments. This gap narrows until it is negligible in round
3. By contrast, the bottom panel shows that the central bank on average sells at below the price
prevailing in the periods beforehand.
Observation 4 The central bank pays significantly more than the fundamental price for the bonds
it buys. The higher are prior market prices, the more the central bank pays. When the central bank
subsequently sells bonds it makes a substantial loss relative to what it paid.
3.3 Forecast dynamics
To set the scene,for our discussion of the joint evolution of prices and forecasts, we provide a
comprehensive description of the paths of forecasts and prices across the three rounds for one group.
Figure 5 shows, for each period of Round 1 (Top panel) and 2 (Middle panel) as well as the first
4 periods of Round 3 (bottom panel), the complete path of individual forecasts (thin lines), their
medians (thick lines), and realized prices (dots) for one group of six subjects in the Buy&Hold
treatment.20 There are many interesting features that we observe in this figure that illustrate
results that we demonstrate more formally later in the paper. First of all, the very first forecasts
elicited in period 1 of round 1 before the participants have any experience of trading vary widely.
20This group was not chosen at random. It is the one that most neatly illustrates behaviour observed in generalacross the experiment.
15

T2, N=6, Group 5, Round 1Period 1 Period 2 Period 3 Period 4
1 2 3 4 5 6 7 8 9 10 11t0
50
100
150
200
250P
1 2 3 4 5 6 7 8 9 10 11t0
50
100
150
200
250P
1 2 3 4 5 6 7 8 9 10 11t0
50
100
150
200
250P
ìì
1 2 3 4 5 6 7 8 9 10 11t0
50
100
150
200
250P
Period 5 Period 6 Period 7 Period 8
ìììì
1 2 3 4 5 6 7 8 9 10 11t0
50
100
150
200
250P
ìììì
1 2 3 4 5 6 7 8 9 10 11t0
50
100
150
200
250P
ìììì
1 2 3 4 5 6 7 8 9 10 11t0
50
100
150
200
250P
ìììì
1 2 3 4 5 6 7 8 9 10 11t0
50
100
150
200
250P
Period 9 Period 10 Period 11
ìììì
1 2 3 4 5 6 7 8 9 10 11t0
50
100
150
200
250P
ìììì
1 2 3 4 5 6 7 8 9 10 11t0
50
100
150
200
250P
ìììì
1 2 3 4 5 6 7 8 9 10 11t0
50
100
150
200
250P
T2, N=6, Group 5, Round 2Period 1 Period 2 Period 3 Period 4
1 2 3 4 5 6 7 8 9 10 11t0
50
100
150
200
250P
1 2 3 4 5 6 7 8 9 10 11t0
50
100
150
200
250P
1 2 3 4 5 6 7 8 9 10 11t0
50
100
150
200
250P
ìì
1 2 3 4 5 6 7 8 9 10 11t0
50
100
150
200
250P
Period 5 Period 6 Period 7 Period 8
ìììì
1 2 3 4 5 6 7 8 9 10 11t0
50
100
150
200
250P
ìììì
1 2 3 4 5 6 7 8 9 10 11t0
50
100
150
200
250P
ìììì
1 2 3 4 5 6 7 8 9 10 11t0
50
100
150
200
250P
ìììì
1 2 3 4 5 6 7 8 9 10 11t0
50
100
150
200
250P
Period 9 Period 10 Period 11
ìììì
1 2 3 4 5 6 7 8 9 10 11t0
50
100
150
200
250P
ìììì
1 2 3 4 5 6 7 8 9 10 11t0
50
100
150
200
250P
ìììì
1 2 3 4 5 6 7 8 9 10 11t0
50
100
150
200
250P
T2, N=6, Group 5, Round 3Period 1 Period 2 Period 3 Period 4
1 2 3 4 5 6 7 8 9 10 11t0
50
100
150
200
250P
1 2 3 4 5 6 7 8 9 10 11t0
50
100
150
200
250P
1 2 3 4 5 6 7 8 9 10 11t0
50
100
150
200
250P
ìì
1 2 3 4 5 6 7 8 9 10 11t0
50
100
150
200
250P
Figure 5: Dynamics of forecasts and price observed in Benchmark treatment with 6 traders/market,Group 1. Top: Round 1. Middle: Round 2. Bottom: the first four periods of Round 3. Thin lines:individual traders. Thick line: Median. Dots realized prices
16

Table 3: Central bank operation and the market prices
pbo − p1−3Mean SD Min Max
T2. Round 1 25.13∗∗∗ 25.94 −21.27 77.10T2. Round 2 15.93 32.86 −21.67 130.79T2. Round 3 5.84 12.82 −6.76 37.04T3. Round 1 26.16∗∗∗ 22.14 −5.57 69.88T3. Round 2 10.89∗∗∗ 11.98 −5.5 32.08T3. Round 3 −1.13 9.90 −20.35 25.23
pso − p5−7Mean SD Min Max
T3. Round 1 −13.96∗∗ 19.00 −55.85 21.36T3. Round 2 −13.87∗∗ 8.10 −23.83 −0.98T3. Round 3 −14.13∗∗∗ 14.84 −64.98 −1.90∗∗∗ statistically significantly different from 0 at 1% level.(t-test, two-tailed)∗∗ statistically significantly different from 0 at 5% level.(t-test, two-tailed)
But they vary less at the end than they do at the beginning, suggesting that most participants realise
that prices should converge towards the maturity value by period 11. 21 The first realised price,
represented by the dot in the first period, is close to the median first period forecast and very close
to FV. Forecast paths narrow dramatically in period 2 of round 1 as participants update their beliefs
in light of the first period’s realised price. The distribution of price forecasts across horizons is now
much flatter. What the central bank pays in periods 4 and 5 (illustrated by the red diamond) is well
above the previous market prices and above the subsequent market prices in those periods. There
is no obvious immediate impact on price forecasts, although the median is gradually rising in line
with realised prices. For this group, prices continue to rise until period 8 and then decline. When
the participants start again in period 1 of round 2, initial forecasts are again relatively dispersed
particularly for early periods but converge towards (slightly above) the maturity price in period 11.
Notably, the distribution of forecasts has shifted up. Short-term forecasts again narrow dramatically
in period 2, centered on the realised price of period 1 which is well above the fundamental value.
What the central bank pays in round 2 is now squarely in line with previous and future prices.
Realised market prices in round 2 fall fairly monotonically thereafter but are still slightly above the
maturity value in period 11. By the time the participants start again in period 1 of round 3, initial
21One participant has extremely high forecasts initially and is excluded to keep a common scale throughout.
17

forecasts are virtually indistinguishable. There is a near universal belief that prices will initially
jump to the price expected to prevail in periods 4 and 5 (for which there is complete consensus that
prices will be equal to what the central bank paid in round 2). Prices then track almost exactly the
initial median path which is scarcely updated over the first four rounds. (The remaining periods of
round 3 are uninteresting.)
For the further analyses, it is convenient to distinguish short-term and long-term forecasts as
have been done by recent studies (Carle et al., 2017; Hanaki et al., 2018a). Short-term forecast is
the forecast for the current period price, while long-term forecasts are forecasts for all the future
periods not including the current period. In this paper, we focus on the relationship between the
short-term forecasts and realized prices, as well as their dynamics, because as found in Carle et al.
(2017) and Hanaki et al. (2018a) the relationships between the dynamics of long-term forecasts and
realized prices are not very clear.
We have conducted regression analyses in order to investigate more systematically the relation-
ships between the median short-run forecasts among market participants and the realized current
period prices, as well as the individual short-run forecasts and the past-realized prices.
Table 4: Current period prices and median short-term forecasts. Dependent variable Pt.
Round 1 Round 2 Round 3T1 T2 T3 T1 T2 T3 T1 T2 T3
Median ft,t 0.687∗∗∗ 0.737∗∗∗ 0.787∗∗∗ 0.705∗∗∗ 0.705∗∗∗ 0.715∗∗∗ 0.866∗∗∗ 0.902∗∗∗ 0.687∗∗∗
(0.0357) (0.0397) (0.0372) (0.0419) (0.0486) (0.0305) (0.0660) (0.0527) (0.0733)
Period -1.613∗∗∗ -1.277∗∗∗ -1.255∗∗∗ -0.660∗∗∗ -1.474∗∗∗ -1.231∗∗∗ -0.202 -0.274 -1.478∗∗∗
(0.307) (0.330) (0.350) (0.182) (0.330) (0.174) (0.245) (0.310) (0.391)
Constant 52.53∗∗∗ 44.75∗∗∗ 35.84∗∗∗ 41.12∗∗∗ 50.45∗∗∗ 45.83∗∗∗ 15.71 13.42 49.27∗∗∗
(4.906) (5.083) (5.194) (5.914) (7.668) (4.711) (9.019) (8.410) (11.41)N 187 176 176 187 176 176 187 176 176
Standard errors in parentheses∗∗ p < 0.05, ∗∗∗ p < 0.01
Table 4 reports the results of group random effect regressions for the three treatments and three
rounds. The dependent variable is the current period price Pt. In Table 4, we show that the median
short-term forecasts, Median ft,t, is always highly significant and generally increases in importance
in later rounds.
The results of these two regressions indicate a relationship between individual short-run forecasts
and the observed prices in the previous period as noted in our discussion of Figure 5.
Table 5 describes in statistical terms how the participants made their short-term price forecasts
18

Table 5: Short-term forecasts and previous periods prices. Dependent variable: ft,tRound 1 Round 2 Round 3
T1 T2 T3 T1 T2 T3 T1 T2 T3Pt−1 0.950∗∗∗ 0.826∗∗∗ 0.793∗∗∗ 0.716∗∗∗ 0.825∗∗∗ 0.754∗∗∗ 0.898∗∗∗ 0.339∗∗∗ 0.453∗∗∗
(0.0338) (0.103) (0.0419) (0.0776) (0.0774) (0.0539) (0.0392) (0.130) (0.0461)
ft−1,t 0.0301 0.175 0.187∗∗∗ 0.170∗∗∗ 0.0533 0.194∗∗∗ 0.0124 0.494∗∗∗ 0.415∗∗∗
(0.0323) (0.110) (0.0400) (0.0613) (0.0421) (0.0308) (0.0111) (0.0674) (0.0600)
Period −0.611∗∗ −0.923∗∗ −1.309∗∗∗ −0.832∗ −1.042∗∗∗ −1.018∗∗∗ −0.330∗ −0.954∗∗ −0.674∗∗(0.299) (0.462) (0.356) (0.486) (0.277) (0.260) (0.190) (0.400) (0.304)
Constant 9.112∗∗ 6.270 12.40∗∗∗ 21.13 23.21∗∗∗ 12.95∗∗∗ 14.34∗∗∗ 29.03∗∗ 21.74∗∗∗
(3.744) (4.520) (3.852) (13.00) (8.838) (4.249) (5.128) (13.49) (7.342)N 1350 1296 1296 1350 1296 1296 1350 1296 1296adj. R2
Standard errors corrected for within group correlations in parentheses∗ p < 0.10, ∗∗ p < 0.05, ∗∗∗ p < 0.01
Round 1 Round 2 Round 3T1 T2 T3 T1 T2 T3 T1 T2 T3
Pt−1 0.967∗∗∗ 0.978∗∗∗ 0.933∗∗∗ 0.871∗∗∗ 0.877∗∗∗ 1.037∗∗∗ 0.494∗∗∗ 0.619∗∗∗ 0.526∗∗∗
(0.0337) (0.0418) (0.0352) (0.0627) (0.115) (0.0809) (0.117) (0.127) (0.0698)
Period −0.339 −0.880∗∗∗ −1.286∗∗∗ −0.829∗ −1.148∗∗∗ −0.715∗∗∗ −0.0918 −1.192∗ −0.536∗∗(0.243) (0.333) (0.449) (0.442) (0.264) (0.156) (0.150) (0.613) (0.217)
PR−1t −0.0126 −0.00752 −0.0885∗∗∗ 0.355∗∗∗ 0.152∗∗∗ 0.336∗∗∗
(0.0266) (0.0684) (0.0343) (0.0869) (0.0284) (0.0729)
Constant 9.699∗∗ 9.367∗ 19.55∗∗∗ 25.21∗ 24.91∗∗∗ 11.36 19.20∗∗∗ 39.10∗ 21.60∗∗∗
(3.996) (5.168) (4.584) (13.25) (8.625) (6.953) (6.910) (20.37) (5.761)N 1500 1440 1440 1500 1440 1440 1500 1440 1440adj. R2
Standard errors corrected for within group correlations in parentheses∗ p < 0.10, ∗∗ p < 0.05, ∗∗∗ p < 0.01
19

ft,t across the three treatment groups. It does so in two steps. In the top panel, the explanatory
variables for the price forecasts are a constant, the previous forecast (ft−1,t), the lagged price (Pt−1),
and a time trend. The first three explanatory variables can be thought of as the fundamental, the
prior, and the news, respectively. This panel clearly shows that participants almost entirely relied
on the lagged price to guide their forecasts during the first round. This is most marked in the case
of the benchmark treatment but is also present in the other two cases. The prior (ft−1,t) is only
statistically signficant for the Buy&Sell treatment. By round 3, lagged prices are less important in
terms of magnitude and has about the same weight as the prior for the two QE treatments. The
value of the fundamental has also increased in importance and significance. (Round 2 is roughly in
between.)
The bottom panel repeats the same regressions but replaces the prior (ft−1,t) with the market
price observed in the same period the round before.22 By Round 3, the previous round’s price is
highly statistically significant. The participants are starting to think that prices should follow a
pattern - recall the round 3 initial forecasts in 5.
4 Summary and conclusion
In this paper we have revisited previous QE experiment (Penalver et al., 2017) to ascertain whether
the key result - QE raises bond prices when in the rational expectations equilibrium it shouldn’t -
holds when participants are exposed to the same treatment three times. Will they or won’t they
learn that QE should be irrelevant?
It is clear from the repeated benchmark treatment (without QE) that participants can learn that
prices should not deviate from the fundamental price in this setting. It does take several rounds for
this to occur whereas Penalver et al. (2017) observed it immediately.
In the Buy&Hold treatment in which the central bank permanently removes some bonds from the
market, prices rise statistically significantly well above the fundamental price and stay there, even
after the central bank has stopped buying. In most markets, repeated exposure only strengthens the
belief that prices should rise. In a minority of cases, though, QE has limited effect. We find that the
central bank considerably overpays relative to the fundamental price and the most recent market
price in round 1. Rather than compete this effect away (as rational expectations would imply),
22As might be expected from the results, the previous round’s price is highly significant in explaining the prior (notseparately reported).
20

participants come to expect it. Indeed, by round 3 the price path in the earlier rounds significantly
conditioned their price expectations. It was noticeable also that the peak price effect occurs earlier
in the later rounds as participants start to anticipate higher prices from the beginning.
Price dynamics in the Buy&Sell treatment is remarkably similar to that in the Buy&Hold treat-
ment, particularly over the periods 1 to 7. The main difference occurs thereafter, as prices tend to
drop to the fundamental price as the central bank sells. Overall, the central bank makes considerable
losses.
References
Akiyama, E., N. Hanaki, and R. Ishikawa (2014): “How do experienced traders respond to
inflows of inexperienced traders? An experimental analysis,” Journal of Economic Dynamics and
Control, 45, 1–18.
——— (2017): “It is not just confusion! Strategic uncertainty in an experimental asset market,”
Economic Journal, 127, F563–F580.
Bostian, A. A. and C. A. Holt (2009): “Price bubbles with discounting: A web-based classroom
experiment,” Journal of Economic Education, 40, 27–37.
Carle, T. A., Y. Lahav, T. Neugebauer, and C. N. Noussair (2017): “Heterogeneity of
beliefs and trade in experimental asset markets,” Journal of Financial and Quantitative Analysis,
forthcoming.
Deck, C., D. Porter, and V. Smith (2014): “Double Bubbles in Assets Markets with Multiple
Generations,” Journal of Behavioral Finance, 15, 79–88.
Eggertsson, G. B. and M. Woodford (2003): “The Zero Bound on Interest Rates and Optimal
Monetary Policy,” Brookings Papers on Economic Activity, 34, 139–235.
Fischbacher, U. (2007): “z-Tree: Zurich toolbox for ready-made economic experiments,” Experi-
mental Economics, 10, 171–178.
Hanaki, N., E. Akiyama, and R. Ishikawa (2018a): “Behavioral uncertainty and the dynam-
ics of traders’ confidence in their price forecasts,” Journal of Economic Dynamics and Control,
forthcoming.
21

——— (2018b): “Effects of different ways of incentivizing price forecasts on market dynamics and
individual decisions in asset market experiments,” Journal of Economic Dynamics and Control,
forthcoming.
Haruvy, E., Y. Lahav, and C. N. Noussair (2007): “Traders’ Expectations in Asset Markets:
Experimental Evidence,” American Economics Review, 97, 1901–1920.
Haruvy, E., C. N. Noussair, and O. Powell (2014): “The impact of asset repurchases and
issues in an experimental market,” Review of Finance, 18, 681–713.
Honkapohja, S. (2015): “Monetary policies to counter the zero interest rate: An overview of
research,” Research Discussion Paper 18/2015, Bank of Finland.
Joyce, M., M. Tong, and R. Woods (2011): “The United Kingdom’s quantitative easing policy:
design, operation and impact,” Bank of England Quarterly Bulletin, 51, 200–212.
Kirchler, M., J. Huber, and T. Stockl (2012): “Thar She Bursts: Reducing Confusion Re-
duces Bubbles,” American Economic Review, 102, 865–883.
Krishnamurthy, A. and A. Vissing-Jorgensen (2011): “The Effects of Quantitative Easing on
Interest Rates: Channels and Implications for Policy,” Brookings Papers on Economic Activity,
43, 215–287.
Mertens, K. R. S. M. and M. O. Ravn (2014): “Fiscal policy in an expectations-driven liquidity
trap,” Review of Economic Studies, 81, 1637–1667.
Nuzzo, S. and A. Morone (2017): “Asset markets in the lab: A literature review,” Journal of
Behavioral and Experimental Finance, 13, 42–50.
Palan, S. (2013): “A Review of bubbles and crashes in experimental asset markets,” Journal of
Economic Surveys, 27, 570–588.
Penalver, A., N. Hanaki, E. Akiyama, Y. Funaki, and R. Ishikawa (2017): “A quantitative
easing experiment,” Working paper WP 651, Banque de France.
Powell, O. and N. Shestakova (2016): “Experimental asset markets: A survey of recent devel-
opments,” Journal of Behavioral and Experimental Finance, 12, 14–22.
22

Sargent, T. J. and B. D. Smith (1987): “Irrelevance of Open Market Operations in Some
Economies with Government Currency Being Dominated in Rate of Return,” American Economic
Review, 77, 78–92.
Smith, V. L., G. L. Suchanek, and A. W. Williams (1988): “Bubbles, Crashes, and Endoge-
nous Expectations in Experimental Spot Asset Markets,” Econometrica, 56, 1119–1151.
Tobin, J. (1958): “Liquidity Preference as Behavior Towards Risk,” Review of Economic Studies,
25, 65–86.
van Boening, M. V., A. W. Williams, and S. LaMaster (1993): “Price bubbles and crashes
in experimental call markets,” Economics Letters, 41, 179–185.
Vayanos, D. and J.-L. Vila (2009): “A Preferred-Habitat Model of the Term Structure of Interest
Rates,” NBER Working Papers 15487, National Bureau of Economic Research, Inc.
Wallace, N. (1981): “A Modigliani-Miller Theorem for Open-Market Operations,” American Eco-
nomic Review, 71, 267–74.
23

A Comparisons between two market sizes
In this appendix, we provide the result of comparing outcomes between sessions with 6 traders /
market and those with 12 traders / market.
A.1 Market level outcomes
A.1.1 Magnitude of mis-pricing and trading volume
We measure degree of mis-pricing, RAD and RD, volume of trade, TO, and volume weighted RAD
and RD, vRAD and vRD.
RADm =1
T
T∑p=1
|Pmp − FVp||FV |
(6)
RDm =1
T
T∑p=1
Pmp − FVp|FV |
, (7)
TOm =
T∑p=1
Qmp
Smp
, (8)
where Smp is the number of outstanding bond in market m in period p. Note that this is initially
8N (where N is the number of traders in the market), but change during 11 periods as a result of
central bank operations.
We consider vRAD and vRD here as well because in a few cases with 6 traders/market, there
are large price deviations from FV (price equal to 1) without any transactions. In market with 12
traders, such outcomes are not observed. vRAD and vRD are defined as
vRADm =1
T
T∑p=1
Qmp |Pm
p − FVp|Smp |FV |
(9)
vRDm =1
T
T∑p=1
Qmp (Pm
p − FVp)
Smp |FV |
(10)
A.1.2 Degree of concentration of transactions
We compute the share of the number of market transactions over 11 periods for each trader in each
market. Because we are interested in whether transactions are concentrated among a few traders in
24

the market, we compute, for each market, normalized Herfindahl index. We use normalized index
to be able to compare between markets with two different sizes.
Namely, we compute for each subject i in market m, his share of transactions sim as
sim =
∑11t=1 |qit|∑
j∈m∑11
t=1 |qjt |
(11)
where |qit| is the quantity subject i has transacted in period t and j ∈ m represents subject j in
market m. Then, the normalized Hefindahl index for the share of transaction in market m is
HISTm =
∑i∈m sim
1− 1/N(12)
where N is number of traders in m.
A.1.3 Degree of concentration of being a price setter
We also compute the relative frequencies with which a trader has been the marginal price setter over
11 periods. Because we are interested in whether market prices are determined by a few traders
in the market or not, we computer, for each market, normalized Herfindal index, just as we do for
concentration of the share of market transactions, for the share of frequencies of being the marginal
price setter. We call it HIFPSm for market m.
We identify the marginal price setter to be the buyer who has submitted the buy or sell order
with a bid or an ask equal to the market clearing price. In case there is no transaction, given the
way our price determination algorithm, it is the buyer who has submitted the buy order with a bid
just below the market price.
Table 6 reports, for each round and each treatment, means and the standard deviations of
RAD, RD, TO, vRAD, vRD, HIST, and HIFPS, separately for 6 traders/market experiment and 12
traders/market experiment. The p-values from two-sample permutation test (two-tailed) are also
reported.
For the benchmark treatment, we do not observe any statistically significant difference for the
five measures we consider between 6 traders and 12 traders sessions in any of the three rounds. For
the Buy and Hold treatment, only vRAD in Round 1 is significantly different (at 10% level). Finally,
in Buy and Sell treatment, we observe RAD in Round 1 and 2 (at 10% level), and RD in Round 2 (at
25

5% level) are significantly different, but once we take volume of transactions into account (vRAD)
they are no longer statistically significantly different.
The normalized Herfindal indices for share of trades as well as frequencies of being a price setter
are both low suggesting that trades are not concentrated among a few traders, nor it is the case that
prices are driven by a few specific traders. Between two market sizes, the degree of concentration is
higher, in some cases statistically significantly so, for the smaller market which is not too surprising.
A.2 Forecasts deviations
We compare the average RAFDt and RFDt between 6 traders and 12 traders sessions for each
round in each treatment.
Figure 6, 7, and 8 show the dynamics of average RAFDt and RFDt for 6 traders session (solid)
and 12 traders session (dashed) in Benchmark, Buy and Hold, and Buy and Sell treatment, respec-
tively. It also shows the p-values of the market size effect. Note that we are simply taking average
across subjects for the plot, but for the statistical test, we correct for within group correlation.
Namely, these p-values are obtained by running linear regressions that correct for clustering effect
(at group level) of the form Y = α+βD12 where Y is either RAFD or RFD and D12 takes value of
1 for 12 traders session and zero for 6 traders session, and testing whether β is significantly different
from zero.
RAFDt and RFDt are not statistically significantly different (at 10% level) between two market
sizes in none of the periods in the Benchmark treatment. Similarly, for the Buy and Hold treatment,
except for the RAFDt of Period 10 of Round 1, they are not statistically significantly different at
10% level between two market sizes. For Buy and Sell treatments, there are more periods where
RAFDt and RFDt are statistically significantly different at 10% level between the two market sizes,
but for most of the periods, they are not.
A.3 Outcomes of buy and sell operations
We compare the average price paid for a unit of bond by the CB in their buy operations, and average
price received by the CB for a unit of bond in their sell operation between two market sizes.
Table 7 shows the result. The average prices for a unit of bond paid by CB in her buy operation
tend to be higher in smaller markets although they are not statistically significantly different between
26

Tab
le6:
Com
par
ison
bet
wee
n6
trad
ers/
mark
etse
ssio
ns
an
d12
trad
ers/
mark
etse
ssio
ns
Ben
chm
ark
Rou
nd
1B
ench
mark
Rou
nd
2B
ench
mark
Rou
nd
36
trad
ers
12tr
ader
sp
-val
ue
6tr
ad
ers
12
trad
ers
p-v
alu
e6
trad
ers
12
trad
ers
p-v
alu
eR
AD
0.16
1(0
.148
)0.
110
(0.0
62)
0.38
40.0
74
(0.0
84)
0.0
87
(0.0
78)
0.7
53
0.0
61
(0.0
69)
0.0
40
(0.0
48)
0.4
83
RD
0.11
7(0
.160
)0.
098
(0.0
60)
0.76
40.0
60
(0.0
92)
0.0
85
(0.0
78)
0.5
41
0.0
24
(0.0
89)
0.0
36
(0.0
51)
0.7
37
TO
0.56
9(0
.188
)0.
770
(0.3
24)
0.15
00.6
88
(0.3
69)
0.7
66
(0.3
71)
0.6
60
0.6
13
(0.2
65)
0.6
61
(0.1
82)
0.6
65
vR
AD
0.00
9(0
.009
)0.
008
(0.0
05)
0.74
00.0
05
(0.0
06)
0.0
07
(0.0
07)
0.5
14
0.0
03
(0.0
06)
0.0
04
(0.0
06)
0.9
26
vR
D0.
006
(0.0
09)
0.00
6(0
.004
)0.
887
0.0
04
(0.0
07)
0.0
07
(0.0
07)
0.4
02
0.0
03
(0.0
06)
0.0
03
(0.0
06)
0.8
77
HIS
T0.
049
(0.0
26)
0.03
2(0
.022
)0.
175
0.0
83
(0.0
71)
0.0
43
(0.0
32)
0.1
95
0.0
89
(0.0
67)
0.0
49
(0.0
32)
0.1
45
HIF
PS
0.09
1(0
.061
)0.
042
(0.0
17)
0.038
0.0
73
(0.0
44)
0.0
70
(0.0
28)
0.8
71
0.0
82
(0.0
32)
0.0
57
(0.0
16)
0.058
Bu
yan
dH
old
Rou
nd
1B
uy
an
dH
old
Rou
nd
2B
uy
an
dH
old
Rou
nd
36
trad
ers
12tr
ader
sp
-val
ue
6tr
ad
ers
12
trad
ers
p-v
alu
e6
trad
ers
12
trad
ers
p-v
alu
eR
AD
0.15
4(0
.077
)0.
203
(0.0
65)
0.18
60.1
85
(0.1
00)
0.1
88
(0.0
88)
0.9
44
0.1
69
(0.0
76)
0.1
36
(0.0
95)
0.4
38
RD
0.12
6(0
.094
)0.
152
(0.0
81)
0.55
00.1
55
(0.1
00)
0.1
88
(0.0
88)
0.4
94
0.1
34
(0.1
23)
0.1
31
(0.0
96)
0.9
60
TO
0.73
7(0
.276
)0.
763
(0.1
83)
0.83
10.7
26
(0.2
30)
0.7
21
(0.1
89)
0.9
69
0.7
07
(0.4
02)
0.7
01
(0.2
17)
0.9
77
vR
AD
0.00
9(0
.004
)0.
014
(0.0
06)
0.092
0.0
11
(0.0
06)
0.0
12
(0.0
07)
0.6
41
0.0
11
(0.0
06)
0.0
09
(0.0
07)
0.5
48
vR
D0.
007
(0.0
05)
0.00
9(0
.008
)0.
398
0.0
11
(0.0
06)
0.0
12
(0.0
07)
0.6
10
0.0
08
(0.0
10)
0.0
08
(0.0
07)
0.9
27
HIS
T0.
092
(0.0
45)
0.03
4(0
.018
)0.003
0.0
68
(0.0
49)
0.0
45
(0.0
26)
0.2
61
0.0
55
(0.0
47)
0.0
40
(0.0
30)
0.5
16
HIF
PS
0.14
1(0
.104
)0.
063
(0.0
35)
0.062
0.1
10
(0.0
49)
0.0
54
(0.0
14)
0.001
0.0
66
(0.0
32)
0.0
59
(0.0
28)
0.6
40
Bu
yan
dS
ell
Rou
nd
1B
uy
an
dSel
lR
ou
nd
2B
uy
an
dS
ell
Rou
nd
36
trad
ers
12tr
ader
sp
-val
ue
6tr
ad
ers
12
trad
ers
p-v
alu
e6
trad
ers
12
trad
ers
p-v
alu
eR
AD
0.23
2(0
.105
)0.
132
(0.0
97)
0.063
0.1
72
(0.0
57)
0.1
04
(0.0
74)
0.061
0.1
59
(0.1
03)
0.1
03
(0.0
73)
0.2
37
RD
0.14
9(0
.106
)0.
093
(0.0
81)
0.24
40.1
68
(0.0
60)
0.0
97
(0.0
69)
0.048
0.1
06
(0.0
63)
0.0
96
(0.0
73)
0.7
82
TO
0.69
4(0
.445
)0.
590
(0.0
73)
0.50
80.6
05
(0.3
67)
0.6
65
(0.1
35)
0.7
09
0.5
86
(0.2
80)
0.6
08
(0.1
62)
0.8
49
vR
AD
0.01
8(0
.019
)0.
007
(0.0
05)
0.10
80.0
10
(0.0
07)
0.0
07
(0.0
06)
0.3
75
0.0
07
(0.0
03)
0.0
07
(0.0
06)
0.8
47
vR
D0.
014
(0.0
17)
0.00
5(0
.004
)0.
185
0.0
10
(0.0
07)
0.0
07
(0.0
06)
0.3
78
0.0
07
(0.0
03)
0.0
07
(0.0
06)
0.8
55
HIS
T0.
050
(0.0
18)
0.03
4(0
.007
)0.035
0.0
69
(0.0
22)
0.0
43
(0.0
16)
0.0
14
0.0
75
(0.0
40)
0.0
43
(0.0
20)
0.061
HIF
PS
0.10
7(0
.039
)0.
079
(0.0
50)
0.22
80.0
97
(0.0
82)
0.0
57
(0.0
18)
0.1
75
0.0
94
(0.0
67)
0.0
52
(0.0
20)
0.1
08
Mea
ns
(sta
nd
ard
dev
iati
ons)
asw
ell
asp
-val
ues
from
two-s
am
ple
per
mu
tati
on
test
sare
rep
ort
ed.
27

Dynamics of the average RAFDt in BenchmarkRound 1 Round 2 Round 3
1 2 3 4 5 6 7 8 9 10 11t
0.2
0.4
0.6
0.8
1.0RAFD
1 2 3 4 5 6 7 8 9 10 11t
0.2
0.4
0.6
0.8
1.0RAFD
1 2 3 4 5 6 7 8 9 10 11t
0.2
0.4
0.6
0.8
1.0RAFD
P-values for the treatment differencet=1 t=2 t=3 t=4 t=5 t=6 t=7 t=8 t=9 t=10 t=11
Round 1 0.974 0.186 0.152 0.146 0.174 0.396 0.796 0.153 0.577 0.450 0.293Round 2 0.546 0.440 0.172 0.193 0.306 0.539 0.458 0.536 0.831 0.860 0.697Round 3 0.966 0.764 0.725 0.985 0.823 0.569 0.942 0.998 0.929 0.570 0.293
Dynamics of the average RFDt in BenchmarkRound 1 Round 2 Round 3
1 2 3 4 5 6 7 8 9 10 11t
-0.4
-0.2
0.2
0.4
0.6
0.8
1.0RFD
1 2 3 4 5 6 7 8 9 10 11t
-0.4
-0.2
0.2
0.4
0.6
0.8
1.0RFD
1 2 3 4 5 6 7 8 9 10 11t
-0.4
-0.2
0.2
0.4
0.6
0.8
1.0RFD
P-values for the treatment differencet=1 t=2 t=3 t=4 t=5 t=6 t=7 t=8 t=9 t=10 t=11
Round 1 0.621 0.401 0.242 0.256 0.264 0.444 0.862 0.087 0.355 0.267 0.276Round 2 0.772 0.312 0.135 0.185 0.302 0.507 0.481 0.357 0.863 0.927 0.371Round 3 0.743 0.671 0.721 0.936 0.823 0.545 0.731 0.534 0.641 0.067 0.146
Figure 6: Dynamics of the average RAFDt (top) and the average RFDt (bottom) over 10 periods in3 rounds of Benchmark treatment for 6 traders sessions (solid) and 12 traders sessions (dashed).
28

Dynamics of the average RAFDt in Buy and HoldRound 1 Round 2 Round 3
1 2 3 4 5 6 7 8 9 10 11t
0.2
0.4
0.6
0.8
1.0RAFD
1 2 3 4 5 6 7 8 9 10 11t
0.2
0.4
0.6
0.8
1.0RAFD
1 2 3 4 5 6 7 8 9 10 11t
0.2
0.4
0.6
0.8
1.0RAFD
P-values for the treatment differencet=1 t=2 t=3 t=4 t=5 t=6 t=7 t=8 t=9 t=10 t=11
Round 1 0.580 0.625 0.629 0.886 0.447 0.529 0.358 0.452 0.161 0.275 0.057Round 2 0.224 0.840 0.610 0.671 0.586 0.362 0.406 0.433 0.439 0.573 0.912Round 3 0.716 0.975 0.631 0.922 0.756 0.770 0.232 0.892 0.485 0.667 0.599
Dynamics of the average RFDt in Buy and HoldRound 1 Round 2 Round 3
1 2 3 4 5 6 7 8 9 10 11t
-0.4
-0.2
0.2
0.4
0.6
0.8
1.0RFD
1 2 3 4 5 6 7 8 9 10 11t
-0.4
-0.2
0.2
0.4
0.6
0.8
1.0RFD
1 2 3 4 5 6 7 8 9 10 11t
-0.4
-0.2
0.2
0.4
0.6
0.8
1.0RFD
P-values for the treatment differencet=1 t=2 t=3 t=4 t=5 t=6 t=7 t=8 t=9 t=10 t=11
Round 1 0.220 0.798 0.307 0.516 0.566 0.399 0.343 0.445 0.145 0.143 0.335Round 2 0.490 0.840 0.628 0.688 0.625 0.410 0.417 0.519 0.394 0.997 0.950Round 3 0.801 0.938 0.685 0.981 0.835 0.785 0.190 0.625 0.955 0.780 0.748
Figure 7: Dynamics of the average RAFDt (top) and the average RFDt (bottom) over 10 periods in3 rounds of Buy and Hold treatment for 6 traders sessions (solid) and 12 traders sessions (dashed).
29

Dynamics of the average RAFDt in Buy and SellRound 1 Round 2 Round 3
1 2 3 4 5 6 7 8 9 10 11t
0.2
0.4
0.6
0.8
1.0RAFD
1 2 3 4 5 6 7 8 9 10 11t
0.2
0.4
0.6
0.8
1.0RAFD
1 2 3 4 5 6 7 8 9 10 11t
0.2
0.4
0.6
0.8
1.0RAFD
P-values for the treatment differencet=1 t=2 t=3 t=4 t=5 t=6 t=7 t=8 t=9 t=10 t=11
Round 1 0.624 0.534 0.406 0.070 0.556 0.545 0.416 0.455 0.438 0.111 0.037Round 2 0.052 0.174 0.392 0.252 0.040 0.019 0.099 0.283 0.199 0.486 0.723Round 3 0.062 0.063 0.271 0.265 0.243 0.496 0.059 0.306 0.282 0.308 0.275
Dynamics of the average RFDt in Buy and SellRound 1 Round 2 Round 3
1 2 3 4 5 6 7 8 9 10 11t
-0.4
-0.2
0.2
0.4
0.6
0.8
1.0RFD
1 2 3 4 5 6 7 8 9 10 11t
-0.4
-0.2
0.2
0.4
0.6
0.8
1.0RFD
1 2 3 4 5 6 7 8 9 10 11t
-0.4
-0.2
0.2
0.4
0.6
0.8
1.0RFD
P-values for the treatment differencet=1 t=2 t=3 t=4 t=5 t=6 t=7 t=8 t=9 t=10 t=11
Round 1 0.595 0.999 0.379 0.057 0.409 0.540 0.344 0.410 0.449 0.690 0.572Round 2 0.092 0.197 0.390 0.219 0.039 0.016 0.144 0.736 0.396 0.461 0.716Round 3 0.056 0.063 0.270 0.245 0.239 0.501 0.121 0.997 0.343 0.299 0.313
Figure 8: Dynamics of the average RAFDt (top) and the average RFDt (bottom) over 10 periods in3 rounds of Buy and Sell treatment for 6 traders sessions (solid) and 12 traders sessions (dashed).
30

Table 7: Average price per unit of bond paid by CB and received by CBBuy and Hold Buy and Sell
Average price paid for a unit of bond Average price paid for a unit of bond6 traders 12 traders p-values 6 traders 12 traders p-values
Round 1 151.3 (24.70) 147.9 (12.29) 0.731 155.7 (20.95) 141.5 (18.32) 0.165Round 2 170.0 (45.79) 155.4 (16.28) 0.464 164.3 (12.00) 145.6 (17.02) 0.026Round 3 153.3 (24.20) 149.8 (19.34) 0.748 150.8 (14.07) 140.5 (18.67) 0.232
Average price received for a unit of bond6 traders 12 traders p-values
Round 1 142.2 (31.48) 138.1 (17.15) 0.796Round 2 129.4 ( 6.72) 124.6 ( 2.70) 0.084Round 3 116.3 (14.66) 123.2 ( 4.24) 0.215
the two market size except for Round 2 in Buy and Sell treatment, according to the two-sample
permutation test (two-tailed). The same is true for the average prices for a unit of bond received by
CB in her sell operation. They are not statistically significantly different between the two market
sizes except in Round 2.
31