Embed Size (px)
Citation preview
AN EXECUTION CONTEXT OPTIMIZATION
FRAMEWORK FOR DISK ENERGY
by
JERRY YIN HOM
A dissertation submitted to the
Graduate School-New Brunswick
Rutgers, The State University of New Jersey
in partial fulfillment of the requirements
for the degree of
Doctor of Philosophy
Graduate Program in Computer Science
written under the direction of
Associate Professor Ulrich Kremer
and approved by
New Brunswick, New Jersey
May, 2008
ABSTRACT OF THE DISSERTATION
An Execution Context Optimization Framework for Disk Energy
by JERRY YIN HOM
Dissertation Director:Ulrich Kremer
Power, energy, and thermal concerns have had explosive growth in research over
the past two decades. In servers, desktops, and mobile systems, the hard disk is
among the top resources in power and energy consumption. Common techniques for
reducing disk energy consumption have included caching, adaptive low power modes,
batch scheduling, and data migration. Many previous software optimizations for sin-
gle disk systems have assumed and experimented in uniprogramming environments.
However, modern systems are typically multiprogramming, and the optimizations do
not extend well from the uniprogramming model. Programs should be aware of con-
currently running programs to enable cooperation and coordinate disk accesses from
multiple programs. The set of concurrently running programs is referred to as an
execution context. Execution context optimizations were introduced to target mul-
tiprogramming environments. My research introduces an optimization framework
to provide execution context information and reduce disk energy consumption by
effectively managing disk accesses.
Optimizing over all possible execution contexts is counter-productive because
many contexts do not occur in practice. For an extreme example, users rarely, if
at all, run more than twenty programs concurrently. Optimizations may be prof-
itably targeted at the most common execution contexts for a given workload. A
study was conducted of real workloads by collecting user activity traces and char-
acterizing the execution contexts. Out of hundreds of contexts and over 50 unique
ii
programs, the study confirmed the intuition that users generally run only a small set
of programs at a time.
Execution context optimizations were implemented on eight streaming and inter-
active applications. The optimizations were compared to previous best optimizations
and evaluated on a laptop disk which is already designed for energy efficiency. The
disk energy was measured while running synthetic traces of ten execution contexts.
The results show up to 63% energy savings while incurring less than 1% performance
delay. When compared to unoptimized versions, energy savings was up to 77%. If
the optimizations were applied to comparable applications in the user study, an esti-
mated 9% disk energy could have been saved. Execution context optimizations show
significant promise for saving disk energy.
iii

iv
Acknowledgments
I am deeply indebted to my advisor, Ulrich Kremer, for guiding me along to manage
and complete this many-headed beast, accepted as a Ph.D. dissertation after years
of struggle, toil, and self-torment. I am thankful for the countless, and probably
many unknown, ways in which he has supported me. When I wanted to quit, he
persuaded me I could continue on; and when I was stubborn, he showed me new
things to consider. And of course, hanging out in Germany was pretty awesome!
I am fortunate for my dissertation committee who have influenced and shaped my
research direction. Thanks to Ricardo Bianchini for the many insightful ideas and
lending me the Fujitsu disk. Thanks to Rich Martin for keeping me on my toes to
get it right. Thanks to Frank Bellosa for inspring my work and being so congenial in
giving helpful advice.
The systems administrators of the Laboratory for Computer Science Research
(LCSR) deserve a heartfelt thanks for their deep technical knowledge and making
part of my research work possible. Doug Motto helped tremendously in debugging
the tracing software. Hanz Makmur, Charles McGrew, Rick Crispin, Rob Toth, Don
Smith, (Big) Lars Sorensen, and Rob Tuck have directly provided valuable assistance
above and beyond the call of duty.
Thanks to Barbara Ryder for letting me experience the comforts of the Program-
ming Languages Research Group (ProLangs) Lab and also providing several pieces
of invaluable advice. At times I wish I had acted upon more of her advice instead of
v

learning their validity the hard way. Her generosity is also much appreciated.
I am grateful to the members, present and past, of the Energy Efficiency and
Low-Power (EEL) Lab. John McCabe, Chris Woithe, Denitsa Tilkidjieva, and De-
siree Ottoni have provided encouragement and support at various times to keep me
laughing while I lived in the lab. No siesta for me, but I will remember the Fiesta
times. Thanks also for helping me revise, edit, improve, revise, edit, improve, revise,
edit, and improve my defense presentation. Thanks to Chunling Hu, Yang Ni, and
Chung-Hsing Hsu for stimulating discussions and showing examples of life after grad-
uate school. Thanks to Luiz Ramos, of the DARK Lab, for enduring torture just to
help improve my presentation.
In the grand scheme of things, my graduate life was relatively easy through the
support and care of my parents. Any success I have is a result of your nurturing,
upbringing, and trust to form me as the person I am. Thanks Mom and Dad! Andrew
and Leah have periodically refreshed my sense of joie de vivre from their childhood
innocence.
Most importantly, to the Creator and Savior, I have yet to know how I have made
it thus far except to acknowledge Your grace poured out over me. I am profoundly
indebted and hope that my profession of research demonstrates grace in the career
of life.
vi
Contents
Abstract ii
Acknowledgments v
List of Tables xi
List of Figures xiii
1 Introduction 1
1.1 Disk Energy . . . . . . . . . . . . . . . . . . . . . . . . . . . . . . . . 1
1.2 Background . . . . . . . . . . . . . . . . . . . . . . . . . . . . . . . . 2
1.3 Thesis . . . . . . . . . . . . . . . . . . . . . . . . . . . . . . . . . . . 3
1.4 Contribution . . . . . . . . . . . . . . . . . . . . . . . . . . . . . . . . 4
2 Literature Review 7
2.1 Disk Energy Management . . . . . . . . . . . . . . . . . . . . . . . . 7
2.1.1 Modeling . . . . . . . . . . . . . . . . . . . . . . . . . . . . . 8
2.1.2 Policies . . . . . . . . . . . . . . . . . . . . . . . . . . . . . . 9
2.1.3 Management Techniques for Various Disks . . . . . . . . . . . 10
2.1.4 Alternative Storage . . . . . . . . . . . . . . . . . . . . . . . . 11
2.2 Adaptive Applications . . . . . . . . . . . . . . . . . . . . . . . . . . 12
2.3 Surveying User Activity . . . . . . . . . . . . . . . . . . . . . . . . . 13
vii
3 Optimization Framework 15
3.1 Disk Energy Accounting . . . . . . . . . . . . . . . . . . . . . . . . . 16
3.2 Uniprogramming . . . . . . . . . . . . . . . . . . . . . . . . . . . . . 17
3.3 Multiprogramming . . . . . . . . . . . . . . . . . . . . . . . . . . . . 22
3.3.1 Inverse Barrier . . . . . . . . . . . . . . . . . . . . . . . . . . 24
3.3.2 File Descriptor Attributes . . . . . . . . . . . . . . . . . . . . 25
3.3.3 Execution Context . . . . . . . . . . . . . . . . . . . . . . . . 29
3.4 Implementation . . . . . . . . . . . . . . . . . . . . . . . . . . . . . . 32
3.4.1 Limitations . . . . . . . . . . . . . . . . . . . . . . . . . . . . 33
3.4.2 Synchronization . . . . . . . . . . . . . . . . . . . . . . . . . . 33
3.4.3 Greedy Hibernation . . . . . . . . . . . . . . . . . . . . . . . . 34
3.4.4 Optimization Passes . . . . . . . . . . . . . . . . . . . . . . . 34
4 Opportunity 39
4.1 Tracing Infrastructure . . . . . . . . . . . . . . . . . . . . . . . . . . 40
4.1.1 LTTng . . . . . . . . . . . . . . . . . . . . . . . . . . . . . . . 41
4.1.2 Trace Time Setup . . . . . . . . . . . . . . . . . . . . . . . . . 43
4.1.3 Trace Analysis . . . . . . . . . . . . . . . . . . . . . . . . . . 45
5 Evaluation Infrastructure 53
5.1 Hardware . . . . . . . . . . . . . . . . . . . . . . . . . . . . . . . . . 53
5.2 Software . . . . . . . . . . . . . . . . . . . . . . . . . . . . . . . . . . 56
6 Experiments 59
6.1 Write Caching . . . . . . . . . . . . . . . . . . . . . . . . . . . . . . . 61
6.2 Program Events . . . . . . . . . . . . . . . . . . . . . . . . . . . . . . 62
6.3 Results . . . . . . . . . . . . . . . . . . . . . . . . . . . . . . . . . . . 63
6.4 Energy Model . . . . . . . . . . . . . . . . . . . . . . . . . . . . . . . 67
viii
7 Summary and Future Work 71
A Xnee Session Script Sample 75
Bibliography 89
Curriculum Vita 97
ix

x
List of Tables
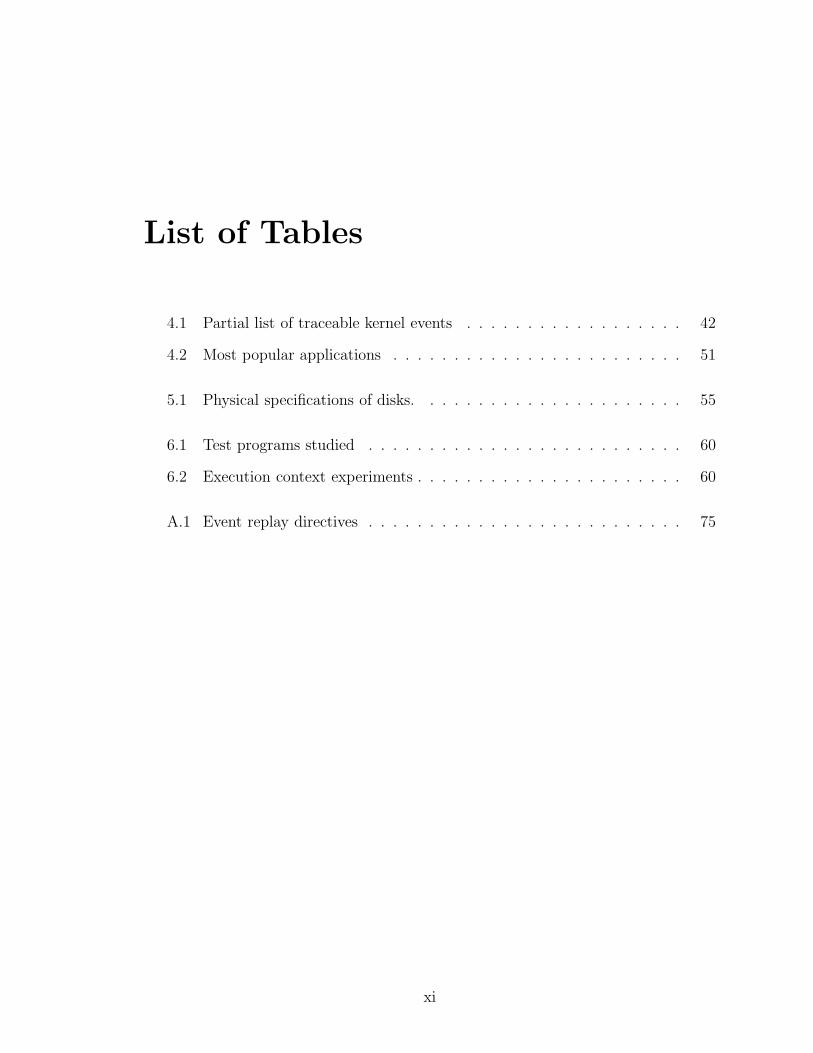
4.1 Partial list of traceable kernel events . . . . . . . . . . . . . . . . . . 42
4.2 Most popular applications . . . . . . . . . . . . . . . . . . . . . . . . 51
5.1 Physical specifications of disks. . . . . . . . . . . . . . . . . . . . . . 55
6.1 Test programs studied . . . . . . . . . . . . . . . . . . . . . . . . . . 60
6.2 Execution context experiments . . . . . . . . . . . . . . . . . . . . . . 60
A.1 Event replay directives . . . . . . . . . . . . . . . . . . . . . . . . . . 75
xi

xii
List of Figures
3.1 File access of streaming applications . . . . . . . . . . . . . . . . . . 17
3.2 Disk activity of audio player . . . . . . . . . . . . . . . . . . . . . . . 18
3.3 File access behavior of buffered streaming applications . . . . . . . . 20
3.4 Disk activity of buffered audio player . . . . . . . . . . . . . . . . . . 20
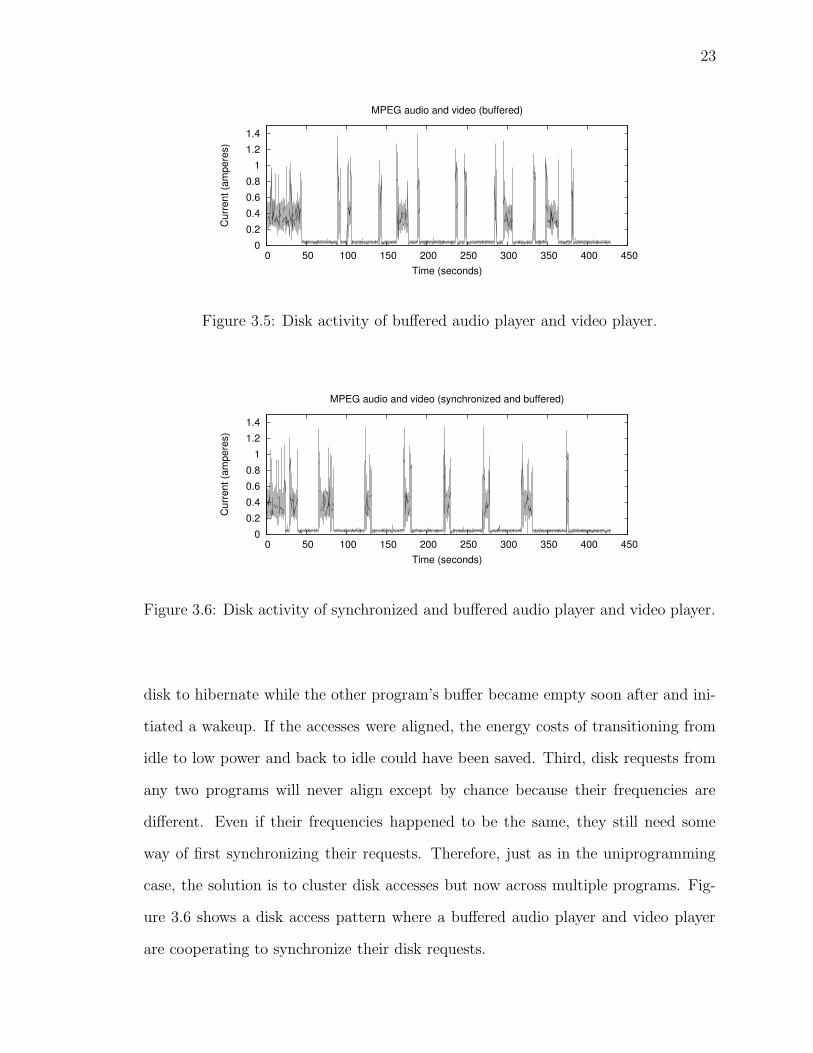
3.5 Disk activity of buffered audio player and video player . . . . . . . . 23
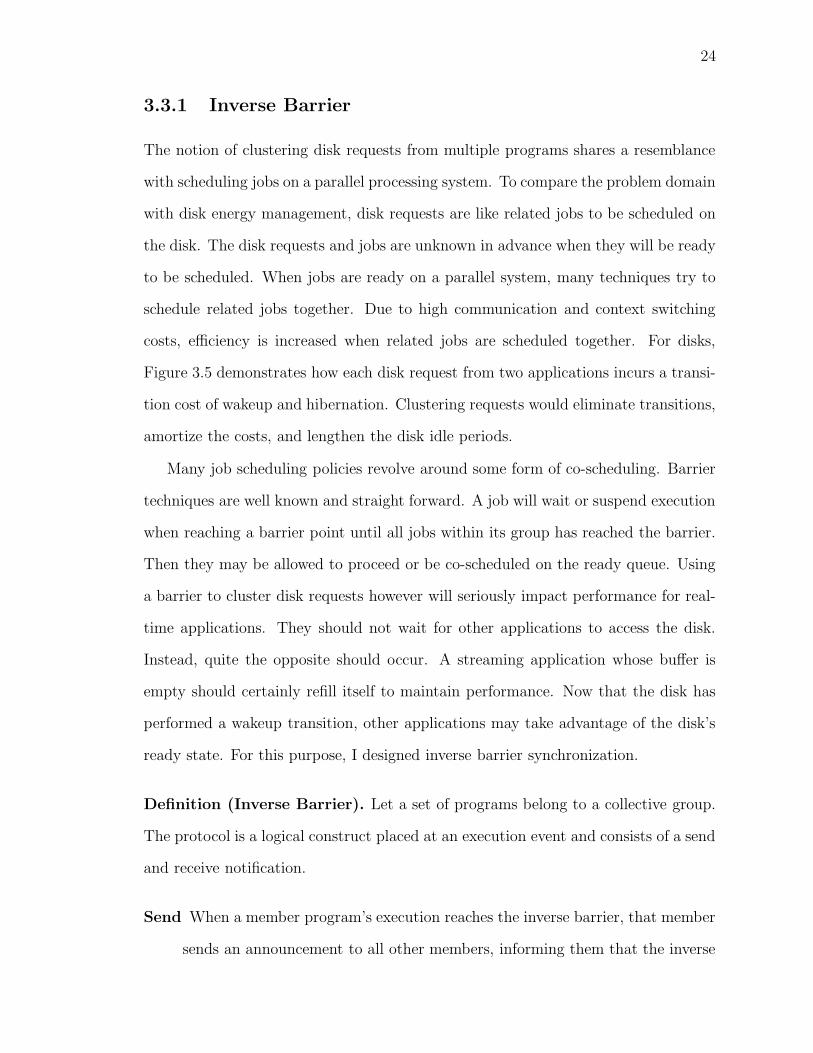
3.6 Disk activity of synchronized and buffered audio player and video player 23
3.7 The effect of scheduling policies on disk accesses . . . . . . . . . . . . 26
3.8 Disk activity of synchronized and proportionally buffered audio player
and video player . . . . . . . . . . . . . . . . . . . . . . . . . . . . . . 32
3.9 Two stage optimization framework . . . . . . . . . . . . . . . . . . . 35
3.10 Finding the end of logical I/O operations . . . . . . . . . . . . . . . . 36
4.1 Histogram of user login sessions . . . . . . . . . . . . . . . . . . . . . 44
4.2 Parent and child process lifetimes . . . . . . . . . . . . . . . . . . . . 46
4.3 Execution contexts grouped by number of programs . . . . . . . . . . 47
4.4 Histogram of transition times between execution contexts . . . . . . . 48
4.5 Most popular execution contexts . . . . . . . . . . . . . . . . . . . . . 52
5.1 Power measurement infrastructure . . . . . . . . . . . . . . . . . . . . 54
6.1 Disk activity trace (full) for program events . . . . . . . . . . . . . . 63
6.2 Disk activity trace (steady state) for program events . . . . . . . . . 64
xiii

6.3 Results comparing write-through and write-back cache policies . . . . 65
6.4 Disk activity during transitions . . . . . . . . . . . . . . . . . . . . . 68
xiv

1
Chapter 1
Introduction
Energy, power, and thermal issues are important computing system design consider-
ations for a variety of reasons. Energy efficiency and conservation is a popular trend
as global energy demands outpace the growth in supply. Power and heat correspond
to cooling issues which may require additional energy for external cooling systems. In
battery-powered systems, the battery’s energy supply gives a finite, useful comput-
ing time before recharging or replacement. Increasing energy efficiency means longer
operational times, greater flexibility, lower cost, or smaller form factors, is desirable
for computing systems in general, and can be addressed at various hardware and
software levels. This research is a language level approach at reducing disk energy
consumption in multiprogramming environments.
1.1 Disk Energy
For many computing systems, the display, processor, and disk are generally regarded
as the largest power consumers on average. Different configurations will change the
relative percentages of power consumption. For example, servers may not have dedi-
cated displays yet include multiple processors with multiple disks attached. Smaller
scale battery-powered systems have taken advantage of more power efficient devices,
2
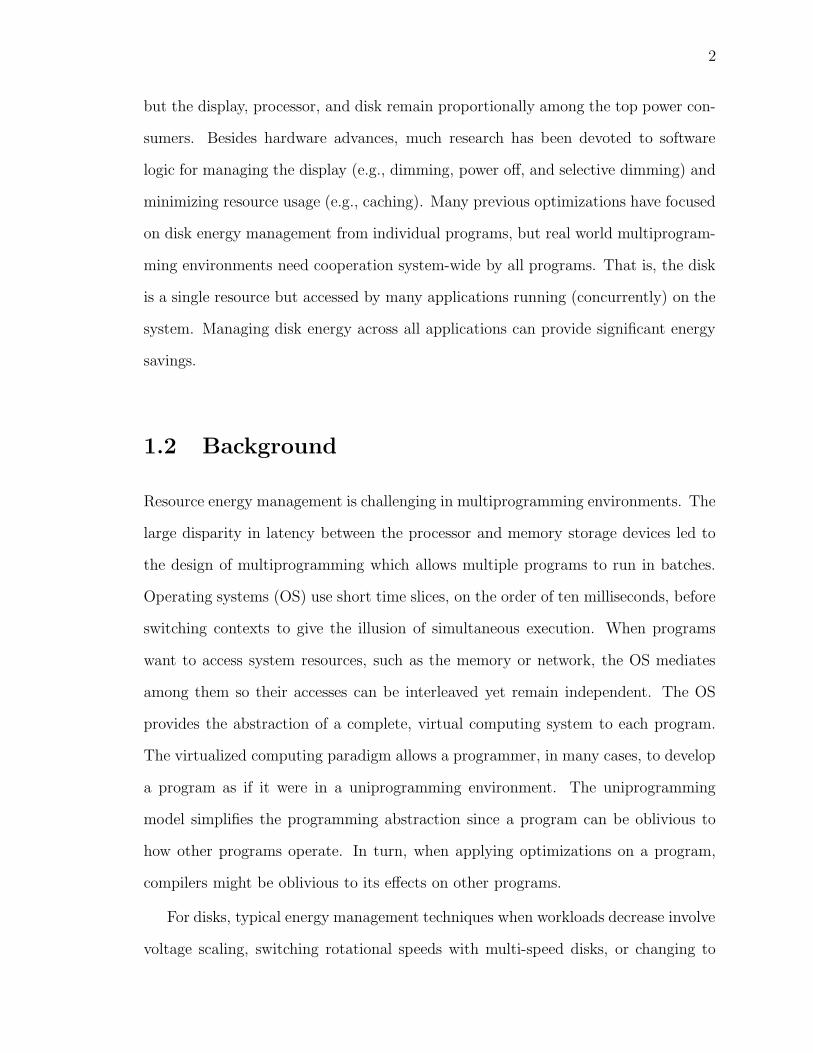
but the display, processor, and disk remain proportionally among the top power con-
sumers. Besides hardware advances, much research has been devoted to software
logic for managing the display (e.g., dimming, power off, and selective dimming) and
minimizing resource usage (e.g., caching). Many previous optimizations have focused
on disk energy management from individual programs, but real world multiprogram-
ming environments need cooperation system-wide by all programs. That is, the disk
is a single resource but accessed by many applications running (concurrently) on the
system. Managing disk energy across all applications can provide significant energy
savings.
1.2 Background
Resource energy management is challenging in multiprogramming environments. The
large disparity in latency between the processor and memory storage devices led to
the design of multiprogramming which allows multiple programs to run in batches.
Operating systems (OS) use short time slices, on the order of ten milliseconds, before
switching contexts to give the illusion of simultaneous execution. When programs
want to access system resources, such as the memory or network, the OS mediates
among them so their accesses can be interleaved yet remain independent. The OS
provides the abstraction of a complete, virtual computing system to each program.
The virtualized computing paradigm allows a programmer, in many cases, to develop
a program as if it were in a uniprogramming environment. The uniprogramming
model simplifies the programming abstraction since a program can be oblivious to
how other programs operate. In turn, when applying optimizations on a program,
compilers might be oblivious to its effects on other programs.
For disks, typical energy management techniques when workloads decrease involve
voltage scaling, switching rotational speeds with multi-speed disks, or changing to
3
lower power operational modes. The basic hibernation strategies rely upon the OS
to monitor the disk’s workload. When the workload has decreased for some period
of time, then the OS may decide to reduce the power draw. However, if the time
threshold is too long, many opportunities to save energy are missed. If the time
threshold is too short, both performance and energy can suffer from too aggressive
hibernation. Compiler optimizations have been developed to more precisely identify
when the disk can profitably hibernate between a program’s disk accesses, enable
hibernation opportunities by clustering a program’s disk accesses, and even increase
the opportunities such as with prefetching.
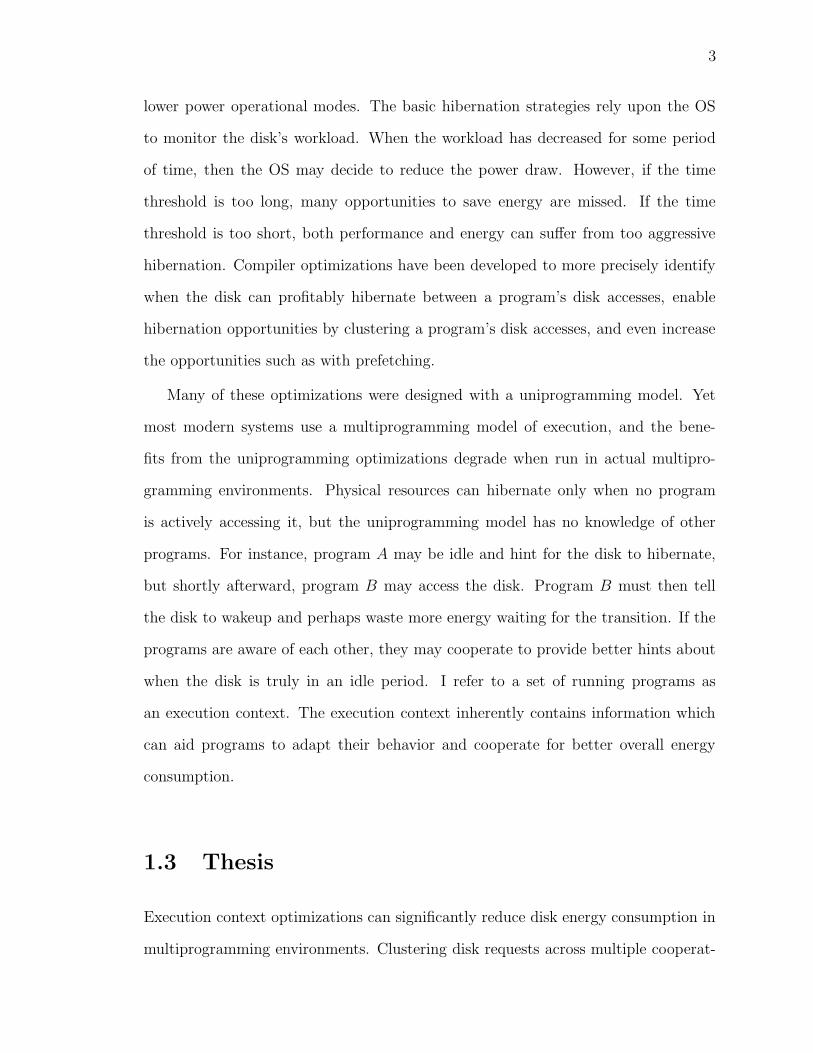
Many of these optimizations were designed with a uniprogramming model. Yet
most modern systems use a multiprogramming model of execution, and the bene-
fits from the uniprogramming optimizations degrade when run in actual multipro-
gramming environments. Physical resources can hibernate only when no program
is actively accessing it, but the uniprogramming model has no knowledge of other
programs. For instance, program A may be idle and hint for the disk to hibernate,
but shortly afterward, program B may access the disk. Program B must then tell
the disk to wakeup and perhaps waste more energy waiting for the transition. If the
programs are aware of each other, they may cooperate to provide better hints about
when the disk is truly in an idle period. I refer to a set of running programs as
an execution context. The execution context inherently contains information which
can aid programs to adapt their behavior and cooperate for better overall energy
consumption.
1.3 Thesis
Execution context optimizations can significantly reduce disk energy consumption in
multiprogramming environments. Clustering disk requests across multiple cooperat-
4
ing programs increases hibernation opportunities for saving energy. If programs cat-
egorize their types of disk request behaviors, a compilation and runtime framework
can facilitate cooperation and adapt program behavior according to the execution
context. Identifying the most common execution contexts will reveal the greatest
opportunities for saving energy. The significant benefits of execution context opti-
mizations can be verified through physical measurements of representative or actual
workloads.
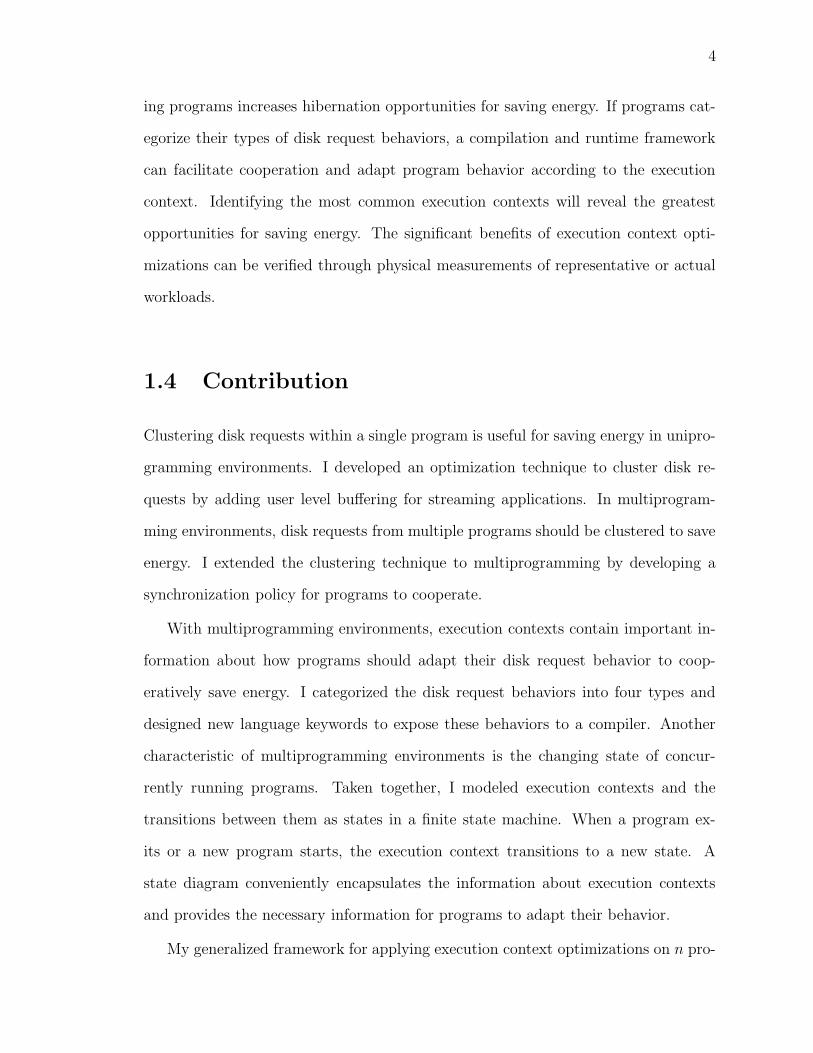
1.4 Contribution
Clustering disk requests within a single program is useful for saving energy in unipro-
gramming environments. I developed an optimization technique to cluster disk re-
quests by adding user level buffering for streaming applications. In multiprogram-
ming environments, disk requests from multiple programs should be clustered to save
energy. I extended the clustering technique to multiprogramming by developing a
synchronization policy for programs to cooperate.
With multiprogramming environments, execution contexts contain important in-
formation about how programs should adapt their disk request behavior to coop-
eratively save energy. I categorized the disk request behaviors into four types and
designed new language keywords to expose these behaviors to a compiler. Another
characteristic of multiprogramming environments is the changing state of concur-
rently running programs. Taken together, I modeled execution contexts and the
transitions between them as states in a finite state machine. When a program ex-
its or a new program starts, the execution context transitions to a new state. A
state diagram conveniently encapsulates the information about execution contexts
and provides the necessary information for programs to adapt their behavior.
My generalized framework for applying execution context optimizations on n pro-
5
grams would consider the 2n possible combinations of running programs. However,
the optimizations can be targeted at the most common cases. I conducted a user
study to identify some of the most common cases in actual user workloads. The user
study also confirmed the intuition that many users typically run a small number of
programs at a time. These activity profiles are important in demonstrating the feasi-
bility of execution context optimizations. If people mostly use a single program at a
time, then the uniprogramming model suffices. If people regularly use ten programs
at a time, then there may likely be no opportunity at all to save energy.
I measured and verified disk energy savings by developing a physical measure-
ment infrastructure. I implemented the execution context optimizations on eight
programs and created ten combinations of programs. I generated synthetic traces
for the ten states and compared the energy consumption of the optimized and base-
line programs. The baseline programs used disk clustering optimizations from the
uniprogramming model. On a laptop class disk, which is already designed for en-
ergy efficiency, execution context optimizations can save up to 63% energy than the
baseline optimizations. Lastly, I developed a disk energy model to estimate energy
savings based on disk activity profiles. If a representative synthetic trace can be gen-
erated for a state, then the energy model can help analyze expected energy savings
and guide the optimization efforts.

6
7
Chapter 2
Literature Review
This thesis work consists broadly of three areas — disk energy management, execution
context aware optimization, and surveying user activity. I will review the literature
according to these areas. The existing literature on energy management is extensive
over the past two decades, but the areas of execution context aware optimization and
surveying user activity have received little attention and only within specific domains.
2.1 Disk Energy Management
In the early 1990’s, computer system energy conservation became a major effort in
the United States, spearheaded by the ENERGY STAR joint program of the Environ-
mental Protection Agency and the Department of Energy. Hardware manufacturers
began designing components with multiple power modes. The simple idea is that
a component should switch to a lower power mode when not being used. However,
performance and energy concerns are often at odds with each other, and tradeoffs
must be evaluated to satisfy performance demands with minimal energy. Researchers
have approached the problem by starting with power models of various components.
The power characteristics of a component may influence the policies to manage a
resource’s power consumption. Different classes of disks may employ energy saving
8
strategies tailored to their environment. Emerging and alternative disk technologies
along with new applications have also led to new strategies for optimizing resource
usage.
2.1.1 Modeling
Some of the earliest efforts at modeling the hard disk were done by Ruemmler and
Wilkes [63], Ganger [27], and Greenawalt [29]. Greenawalt formulated the basic
equations accounting for the power consumed at different operating modes. Without
prior guidance, manufacturers began using fixed timeout thresholds on the order of
minutes. Timeout thresholds monitor the length of past idleness before switching
to a low power mode. For years, the timeout thresholds remained on the order of
minutes even though Greenawalt’s models showed that significant energy could be
saved by using short timeout thresholds. Greenawalt’s analysis agreed with earlier
work by Douglis and Marsh for setting timeout values on the order of seconds.
Golding et al., motivated by disk hibernation issues, investigated the general
aspect of predicting and detecting idle time [28]. Improving such analysis is useful to
enlarge the opportunities for the OS to hibernate resources. Ganger developed the
DiskSim project to simulate the disk storage subsystem while Shriver et al. formulated
analytical performance models of many aspects in storage systems [69]. More recently,
Zedlewski et al. used power modeling to augment DiskSim with a power dimension
[76].
Multi-speed disks have attracted attention due to their unique ability for multiple
power levels in active modes. Independently and simultaneously, Gurumurthi et al.
[31] and Carrera et al. [12] developed the early power models for such disks. The low
power active modes are analogous to a processor’s reduced clock frequency modes. At
lower speeds, energy may be saved proportional to the square of the reduced voltage.
9
2.1.2 Policies
System designers have collaborated to develop holistic system policies governing the
power behavior of various components. The Advanced Power Management [39] speci-
fication sought to standardize and simplify power management between hardware and
the OS. It has been superceded by the Advanced Configuration and Power Interface
[40]. Many previous limitations have been eliminated, however the new interface is
extensive, complex, and prone to implementation errors. It has found broad support,
but simpler policies may prove more effective.
Douglis et al. developed and analyzed several static policies for managing energy
consumption at the OS level [21]. They used a trace-driven simulator to demon-
strate that shorter timeout values can approach an optimal case. However, they note
that any optimal settings will depend on the workload and physical disk. Li et al.
worked on a detailed quantitative analysis of disk power consumption under a range
of timeout values [45]. Without naming a specific policy, their results concluded that
a timeout of two seconds was optimal for their workload traces.
Since optimal timeout values vary with workload, some researchers have designed
adaptive policies. Douglis et al. describe a method for monitoring disk accesses and
adapting the timeout threshold to save energy while keeping performance within an
acceptable level [20]. Helmbold et al. apply a machine learning technique which
adapts the timeout based on the weighted average of other algorithms [34]. The
weights and timeout are adjusted periodically to minimize energy usage. Lu et al.
describe a comprehensive OS approach to manage power for many resources [48].
Adaptive policies attempt to predict future disk request arrivals based on recent
history, but even the best algorithms will lag somewhat in predicting requests. An-
other approach is the use of scheduling policies to transform requests into more pre-
dictable patterns. These policies try to determine expected requests through compiler
or programmer inserted hints. Considerable research has used hints to dynamically
10
adjust processor frequency and voltage [70, 1, 8, 38]. Weissel et al. developed Co-
operative I/O [71] which gives hints to the OS via modified I/O system calls. The
OS may defer requests to be clustered with others or abort requests which have be-
come unnecessary. Hints have also guided disk caches for performance and energy
efficiency [54, 41, 2, 53, 80]. At the file system level, a new scheduling system [17]
uses adaptive buffering and reservations to provide disk bandwidth guarantees for
real-time applications. An extension of the system may implement scheduling for
optimizing power consumption.
My research has developed a scheduling policy which clusters disk requests across
multiple programs. The concept is similar to implicit co-scheduling [7] where a process
infers the status of related jobs and decides whether to yield the processor. My
technique to cluster disk requests is a variant on barrier synchronization [52]. The
net effect of clustering is to optimize for bursts of activity, which contrasts the notion
of scheduling for average utilization and throughput such as with the slotted ALOHA
system [3, 57].
2.1.3 Management Techniques for Various Disks
Different classes of disks have very different performance and power characteristics.
Their intended application use may influence which energy management techniques
are suitable. Broadly speaking, disks are categorized for servers, desktops, laptops,
and handhelds. Handheld class disks refer to the 1.8” or 1” form factors. Some
systems may use a set of disks arranged as a Redundant Array of Inexpensive Disks
(RAID).
Energy management of disk farms for server type systems are important because
they account for a significant portion of the total power consumption [78]. Chase et al.
devised a system to assign monetary costs to various subsystems and demonstrate the
tangible financial costs associated with energy for each resource [13]. For enterprise
11
computing clusters with many disks, Colarelli and Grunwald designed a new type of
storage hierarchy using massive arrays of idle disks (MAID) [14]. They allocate some
drives to serve as large caches and power manage the remaining drives. Zhu et al. [78]
and Pinheiro et al. [55, 56] develop the idea further by adding data migration with
multi-speed disks. Li et al. analyzed several parts of the storage hierarchy for both
performance and energy [46]. Their technique adapts to changing activity workloads
through the use of multi-speed disks and predicting expected slack times. A similar
study investigates the same techniques in systems employing very large disk caches,
on the order of gigabytes [79].
Desktop systems may not be so concerned with energy because the scale is much
smaller than servers. Battery powered systems, typically with laptop and hand-
held class disks, clearly have a prime concern with energy. Some energy conserving
approaches have included remote processing [49, 61] and power management tech-
niques. Power management also arises from strategies such as adaptive applications
and caching. Write caching with the write-back policy is an effective technique for
improving disk performance and energy [62, 80]. The write-back policy allows data
to be written in batches to the disk, but there is a minor concern for data corruption
or loss in the intervening time until the data is flushed to disk. The net effect of
the write-back policy is similar to and overlaps with my technique for clustering disk
requests. My experiments examined both the write-back and write-through policies,
and their differences will be evaluated in Chapter 6.
2.1.4 Alternative Storage
Besides the traditional magnetic hard disk, flash memory has been considered as an
alternative storage device. Douglis et al. explored this alternative and reported on
the tradeoffs compared to the hard disk [19]. Historically, flash memory has had
performance and energy advantages but has not been cost effective due to its high
12
cost. Even today, flash memory still costs about an order of magnitude more than the
hard disk. Disk technology has caught up to be competitive with flash in performance.
Hence, the hard disk continues as the medium of choice for high performance large
storage at low cost.
Flash memory has gained popularity in a variety of products such as video players,
music players, digital cameras, and portable disk storage. High performance is less
of an issue whereas small form factor, low energy use, and motion shock resistance
have enabled emerging market opportunities. For instance, the Apple iPod [6] started
as an audio player and has evolved into a general purpose system with a variety of
applications such as a photo viewer, video player, web browser, and more with the
upcoming availability of a software development kit.
2.2 Adaptive Applications
Energy management may occur at many levels within hardware and software. Several
researchers have used the end-to-end argument [64] to suggest energy management
at the application level. Lorch and Smith discuss the issues at various levels and note
how application level management holds much potential [47]. A group of researchers
developed the Odyssey platform which allows applications to adapt their behavior
for network or energy concerns [50, 51, 25]. Zeng et al. and Ellis make the case for
managing energy as a first class resource at the software levels [23, 77].
Mechanisms for adapting application behavior have been targeted towards qual-
ity of service issues. Such issues are prominent in mobile application domains where
geographic location and wireless network connectivity changes. Katz gave a broad,
seminal overview on the issues and challenges facing mobile systems [42]. Schilit et al.
motivate the issues with practical examples and prototypes of context-aware appli-
cations [67]. As their ParcTab prototype device moves geographically, applications
13
dynamically discover changes in location, neighboring devices, services, and network
bandwidth. Campbell et al. [9] and Capra et al. [10] describe middleware platforms to
expressly support adaptive mobile applications. Services have well-defined interfaces,
appplications have profiles, and their interactions will be correlated through the cur-
rent context. However, I am not aware of any other research investigating adaptive
applications based on the runtime context of other applications. My approach for
execution context aware adaptations aims to be applicable for servers, handhelds,
and everything in between.
2.3 Surveying User Activity
Within experimental computer science, many researchers focus on measuring and
quantifying hardware or software aspects. Entire conferences are devoted to mea-
suring the very tools we work on. Yet little research goes into the interactions of
users and software. The few studies I am aware of deal with characterizing human
interactive behavior over different physical devices. Leland et al. provided one of
the earliest studies on human activity as seen by ethernet traffic [44]. Crovella and
Bestavros also study network traffic but more specifically on world wide web traffic
[15]. Wolski et al. measured processor availability in remote systems [73] using their
Network Weather Service [72]. Gribble et al. [30] and Roselli et al. [59] analyzed
file system workloads with a perspective on how human activity patterns translate
into actual file system activity. The conclusions drawn from all studies describe hu-
man interactivity patterns as self-similar. The inter-arrival times between significant
events can be characterized by a Pareto distribution. In other words, activity is
bursty. Either a user performs many events in a short period of time, or a user is idle
for stretches at a time. The idle periods after bursts may be considered as human
think time [15, 69]. My own user study on application usage patterns agrees with

14
the self-similar characterizations of human activity.
15
Chapter 3
Optimization Framework
Clustering disk accesses is an important strategy for enabling hibernation opportu-
nities. Disk caches and OS file system buffers employ this strategy to some degree of
benefit. According to [62, 30, 59], most disk access patterns are small, bursty, and
scattered across many files. Disk manufacturers, noting the benefits of caches, have
added and increased cache sizes as technology improves. Larger caches increase the
probability of containing relevant file blocks to be read in the near future or increase
the potential efficiency of batched writes at a time. Modern disk caches are typi-
cally on the order of megabytes which can reasonably hold several blocks from many
files. File system buffers replicate the effect of disk caching but use per file buffering
typically on the order of hundreds of kilobytes. The size is smaller because the OS
must consider there may be hundreds of open files in use, and many files tend to be
small for system or metadata use. Applying the end-to-end argument for disk energy
management suggests clustering disk accesses at the application level. I will start
with a review of disk energy accounting. Then I will discuss optimization techniques
in the uniprogramming model, followed by the challenges and possible solutions when
extending the techniques to the multiprogramming model. Lastly, I will describe my
implementation.
16
3.1 Disk Energy Accounting
Practically all hard disks support at least one low power operating mode with trade-
offs between power consumed and time taken to switch between modes. When switch-
ing from the disk’s idle mode to a low power mode, the lower the power mode requires
more time to switch. The same is true for the reverse when switching from a low
power mode to idle mode. The exact power modes, consumption, and switching
time characteristics are unique to each disk model and generally provided by the
manufacturer’s specification sheet. For a given disk, let Pm and Tm be the power
consumed and time spent in mode m. Most manufacturers do not specify transition
mode costs or even average costs because they have a very wide range between the
lower and upper bounds. Instead, I derived these average costs through physical
measurement. The transition cost from mode m to n can be expressed in terms of
average power (Pm→n), time (Tm→n), and energy (Em→n). Therefore, a disk’s total
energy consumption under a given workload period can be given by
Etotal =∑
i
Pi × Ti, (3.1)
i ∈ {all operational and transitional modes}
With this analysis, a disk’s energy break-even threshold can be calculated. The
break-even threshold considers two cases for an idle disk. Either the disk remains in
the idle mode or transitions to a low power mode, hibernates for some period, and
transitions back to idle mode. The energy consumption in both cases can be plotted
on a graph as linear functions of time. Their intersection point is the break-even
threshold. Thus, if the disk will be idle for longer than the break-even threshold,
the disk would save energy by hibernating in a low power mode. A more extensive
treatment than is necessary here of break-even thresholds among multiple operational
17
. . . . . .
� � � �� � � �� � � �
� � �� � �� � �
buf
for (i = 1; i < N; ++i) { read chunk[i] into buf process on buf}
� � � �� � � �� � �� � �
� � �� � �� � �
� � �� � �� � �
disk
chunk[i]
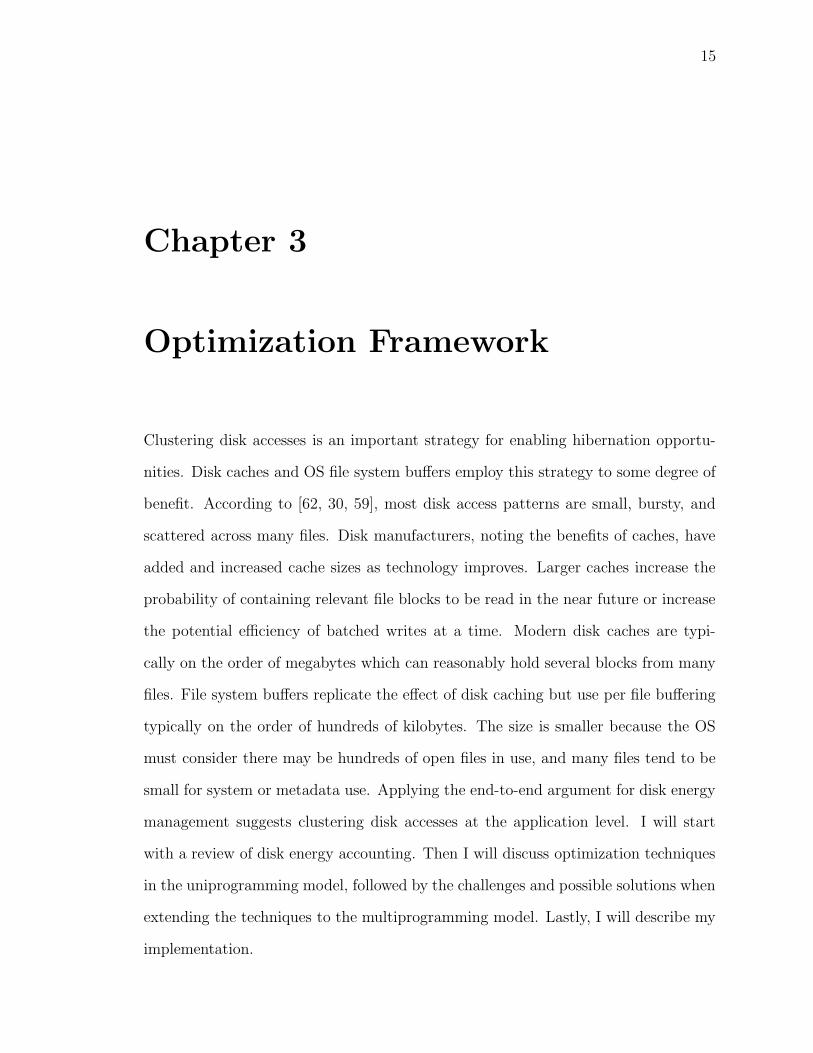
Figure 3.1: File access behavior of streaming applications.
modes can be found in [33]. Note that a disk’s break-even thresholds are directly
computed from its physical specifications which could either be stored on the disk or
derived empirically [74, 68].
3.2 Uniprogramming
Application level clustering will benefit chiefly for accesses larger than the disk cache.
Otherwise, the disk cache is sufficient for clustering. Hence, applications which use
large data files are candidates. One such class of applications is characterized as
streaming. Example programs include an audio player or file transfer. Their file
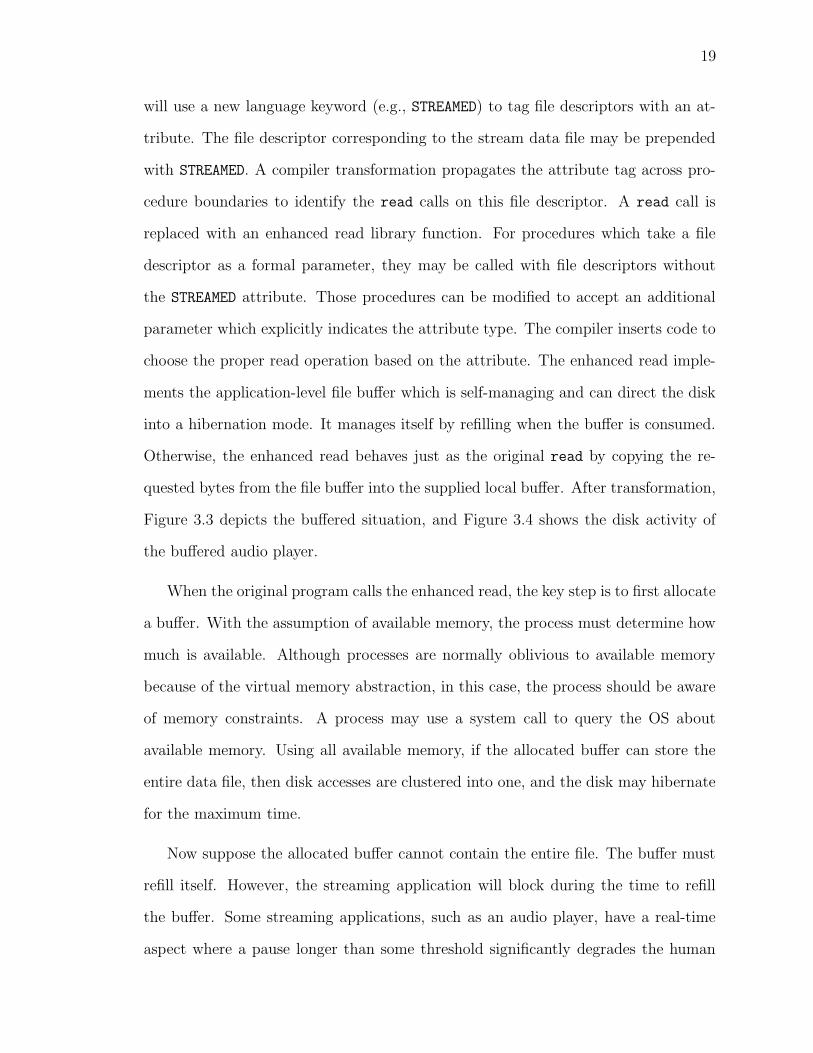
access behavior consists of reading a chunk of data, processing it, and looping until
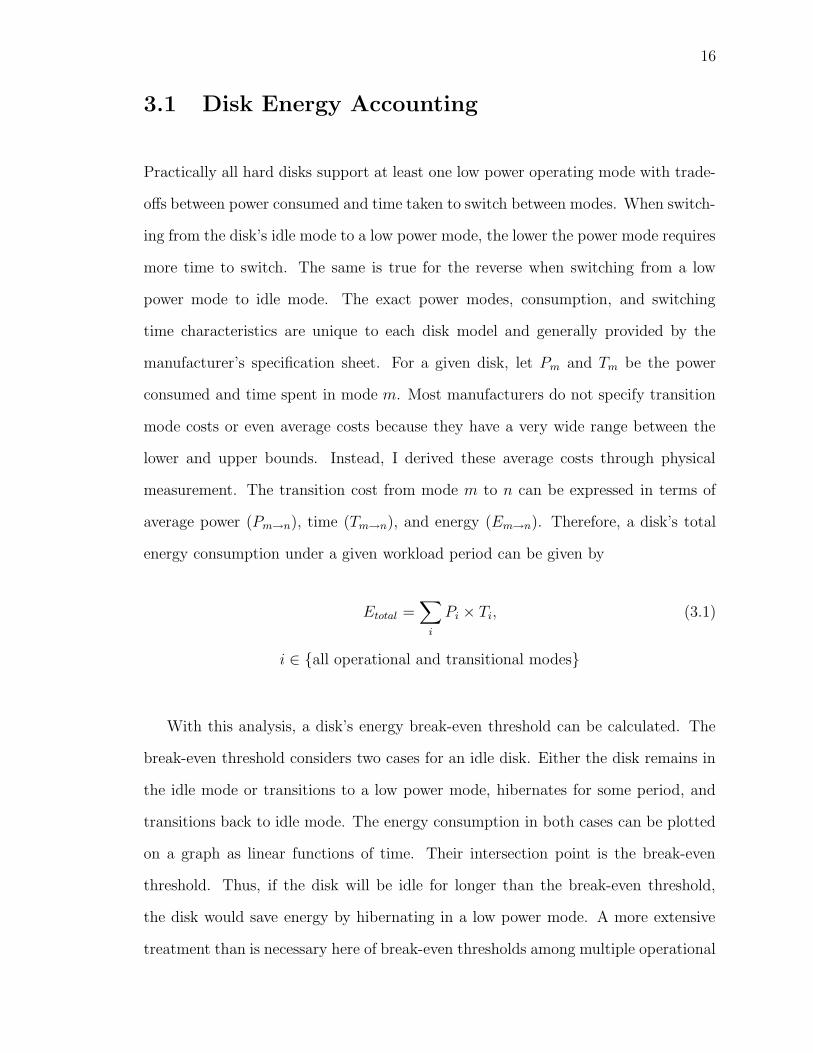
the end. Figure 3.1 illustrates this behavior while Figure 3.2 shows the actual disk
activity of an unmodified audio player.
The OS file buffer and the disk cache may have read-ahead policies which monitor
for contiguous file reads. If consecutive file requests call for contiguous blocks, the
file buffer and disk cache will read ahead and pre-fetch more than what is requested.
However, the OS default file buffer is generally too small for streaming applications.
18
0
0.2
0.4
0.6
0.8
1
0 50 100 150 200 250 300 350 400 450
Cur
rent
(am
pere
s)
Time (seconds)
MPEG audio (unmodified)
Figure 3.2: Disk activity of unmodified audio player.
The pre-fetched data would not be enough to create idle time for hibernation. On
the other hand, the disk’s cache may hold enough data to support hibernation. Now
the question is whether the idle period is greater than the break-even threshold.
The disk knows its cache size, but crucially, it does not and cannot know when the
next physical disk access will occur. In other words, when will the entire cache be
consumed before pre-fetching again?
The information to answer that question resides at the application level. Another
characteristic of streaming applications is their data consumption rate. For example,
audio files may be encoded at different bit rates corresponding to their perceived
playback quality. The encoding bit rate determines the runtime data consumption
rate, which can be used to estimate when a buffer will be consumed. Therefore,
the optimizations here are to add an application-level file buffer and use the data
consumption rate to estimate the length of idle periods for disk hibernation. In order
to add an application-level file buffer, I assume the system contains some amount of
available memory. If at runtime there is not enough memory, then a buffer should
not be added since doing so would induce virtual memory swapping to disk, which
effectively destroys disk idleness.
My framework proposes a mechanism which is almost transparent to the program-
mer. Instead of implementing a buffer into the application directly, the programmer
19
will use a new language keyword (e.g., STREAMED) to tag file descriptors with an at-
tribute. The file descriptor corresponding to the stream data file may be prepended
with STREAMED. A compiler transformation propagates the attribute tag across pro-
cedure boundaries to identify the read calls on this file descriptor. A read call is
replaced with an enhanced read library function. For procedures which take a file
descriptor as a formal parameter, they may be called with file descriptors without
the STREAMED attribute. Those procedures can be modified to accept an additional
parameter which explicitly indicates the attribute type. The compiler inserts code to
choose the proper read operation based on the attribute. The enhanced read imple-
ments the application-level file buffer which is self-managing and can direct the disk
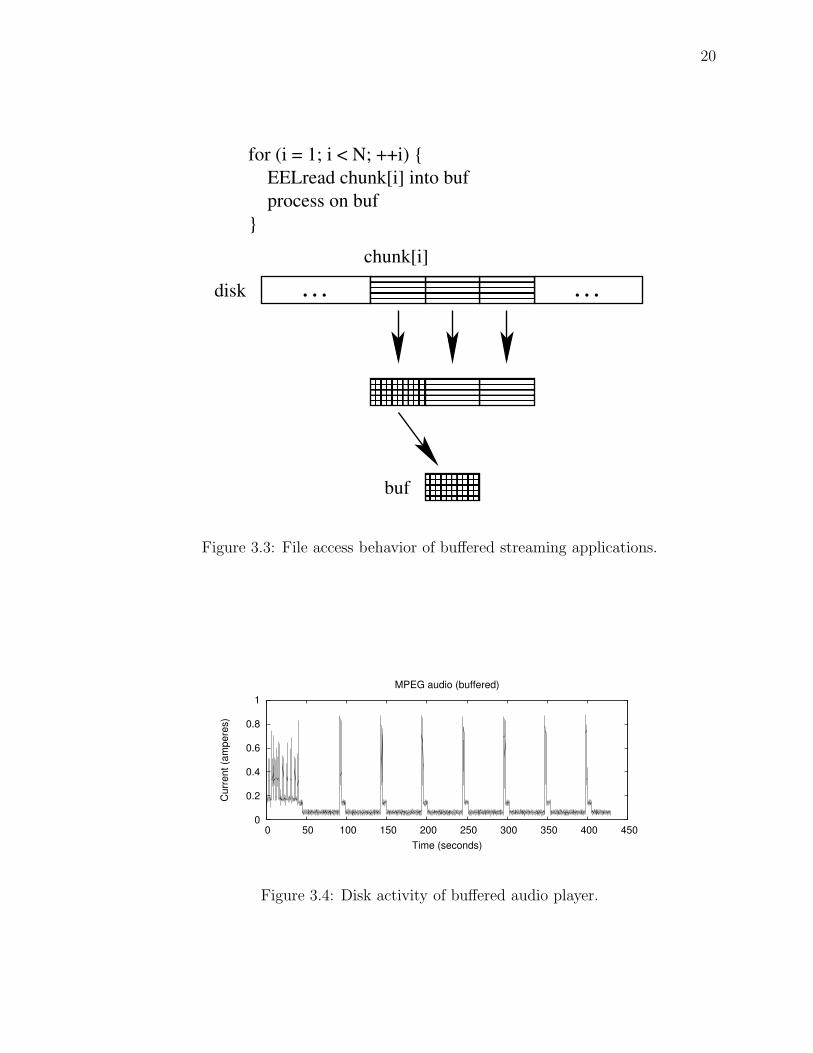
into a hibernation mode. It manages itself by refilling when the buffer is consumed.
Otherwise, the enhanced read behaves just as the original read by copying the re-
quested bytes from the file buffer into the supplied local buffer. After transformation,
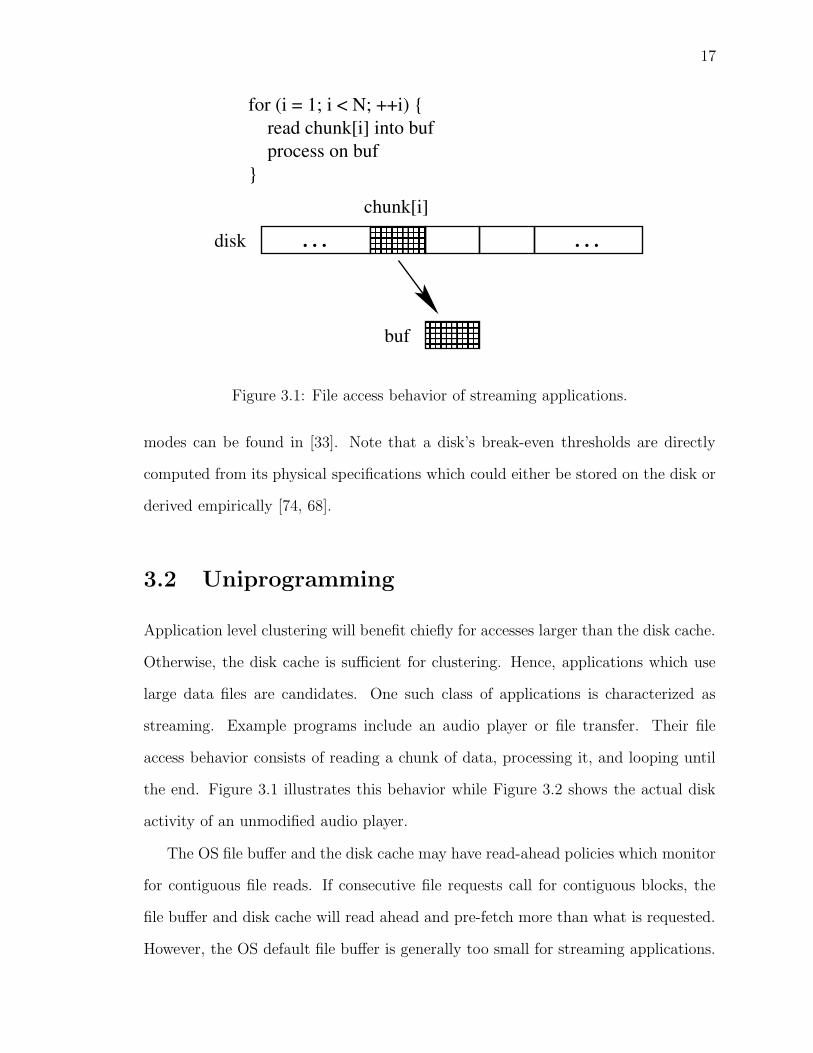
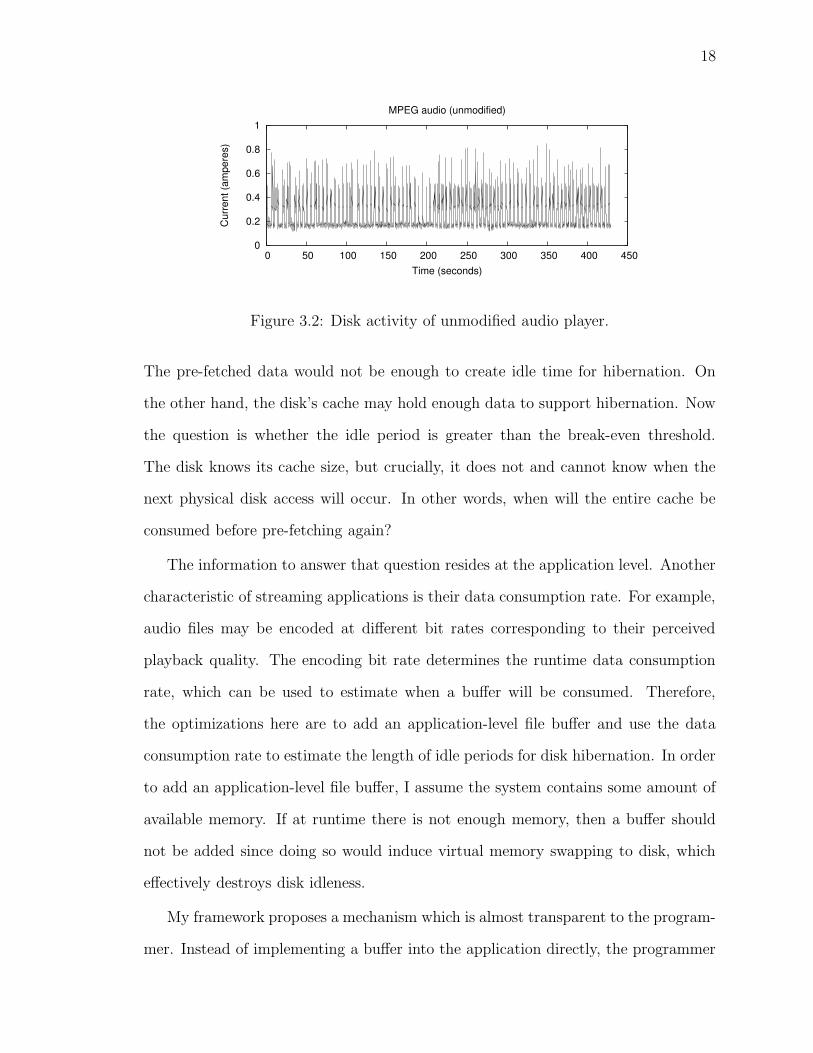
Figure 3.3 depicts the buffered situation, and Figure 3.4 shows the disk activity of
the buffered audio player.
When the original program calls the enhanced read, the key step is to first allocate
a buffer. With the assumption of available memory, the process must determine how
much is available. Although processes are normally oblivious to available memory
because of the virtual memory abstraction, in this case, the process should be aware
of memory constraints. A process may use a system call to query the OS about
available memory. Using all available memory, if the allocated buffer can store the
entire data file, then disk accesses are clustered into one, and the disk may hibernate
for the maximum time.
Now suppose the allocated buffer cannot contain the entire file. The buffer must
refill itself. However, the streaming application will block during the time to refill
the buffer. Some streaming applications, such as an audio player, have a real-time
aspect where a pause longer than some threshold significantly degrades the human
20
. . . . . .
for (i = 1; i < N; ++i) {
process on buf}
EELread chunk[i] into buf
� � � �� � � �� � �� � �
buf
����
����
� � � �� � � �
� � �� � �� � �
� � �� � �� � � � � � �� � � �� � � �� � � �� � � �� � � �
� � � �� � � �� � � �� � � �� � � �� � � �
� � � �� � � �� � � �� � �� � �� � �
� � � �� � � �� � � �� � �� � �� � �
� � � �� � � �� � � �� � �� � �� � �
disk
chunk[i]
Figure 3.3: File access behavior of buffered streaming applications.
0
0.2
0.4
0.6
0.8
1
0 50 100 150 200 250 300 350 400 450
Cur
rent
(am
pere
s)
Time (seconds)
MPEG audio (buffered)
Figure 3.4: Disk activity of buffered audio player.
21
perceived performance of the application. In those cases, the buffer size should be
set to the product of the disk’s bandwidth and the pause threshold.
BufferSize = DiskBandwidth × PauseLimit (3.2)
The pause threshold may be a constant parameter in the compiler transformation, but
the target disk’s bandwidth is unknown at compile time. As with available memory,
a system call would allow a process to query the OS for the disk’s bandwidth, which
should be a constant, as well as its break-even thresholds as noted above.
Once the buffer’s size is set, the buffer needs to know only the data consump-
tion rate to estimate the time until the buffer is consumed. As part of the buffer
setup phase, the enhanced read function transparently profiles the main program’s
operation to estimate the consumption rate. With the buffer’s size and consumption
rate, the time until the buffer is consumed corresponds to the estimated idle period
of the disk. Therefore, the buffer can compare the idle period with the disk’s break-
even thresholds to find the best hibernation mode and immediately direct the disk
to that mode. In contrast to techniques using fixed or adaptive timeout thresholds,
this technique takes advantage of the maximal hibernation time.
Lastly, the buffer should refill itself when empty. Various disk management tech-
niques will have an inherent problem upon the disk’s next access. The disk must
first undergo a transition period from the low power to idle mode before servicing the
next request. Yet the next access is generally unknown in advance, hence the wakeup
transition is often initiated on demand. For streaming applications, the wakeup time
cannot be factored into the buffer setup phase because it is already an order of mag-
nitude greater than the pause threshold. However, the application-level file buffer
contains a unique advantage by computing the idle time. In essence, the buffer does
know when the next disk access will be as well as how long the disk’s wakeup tran-
22
sition takes. The buffer can initiate the wakeup transition in advance such that the
disk will be ready just when the next request arrives. The performance delay and
energy penalty from wakeup is eliminated with just-in-time activation.
3.3 Multiprogramming
Multiprogramming with virtual memory and pre-emption allows many programs to
run concurrently without worrying about interactions between programs. Managing
disk energy is a different story since the disk is a shared, global resource. The
OS pre-empts processes on short time slices to give multiple programs a chance
to execute and give the illusion of simultaneous execution. Process execution is
interleaved as scheduled by the OS. Hence disk access from multiple programs are
also interleaved and increases disk utilization for overall performance. While one
process waits for data from the disk, another process may execute on the processor.
Yet for energy purposes, the disk should be given clustered requests as in the case
for uniprogramming.
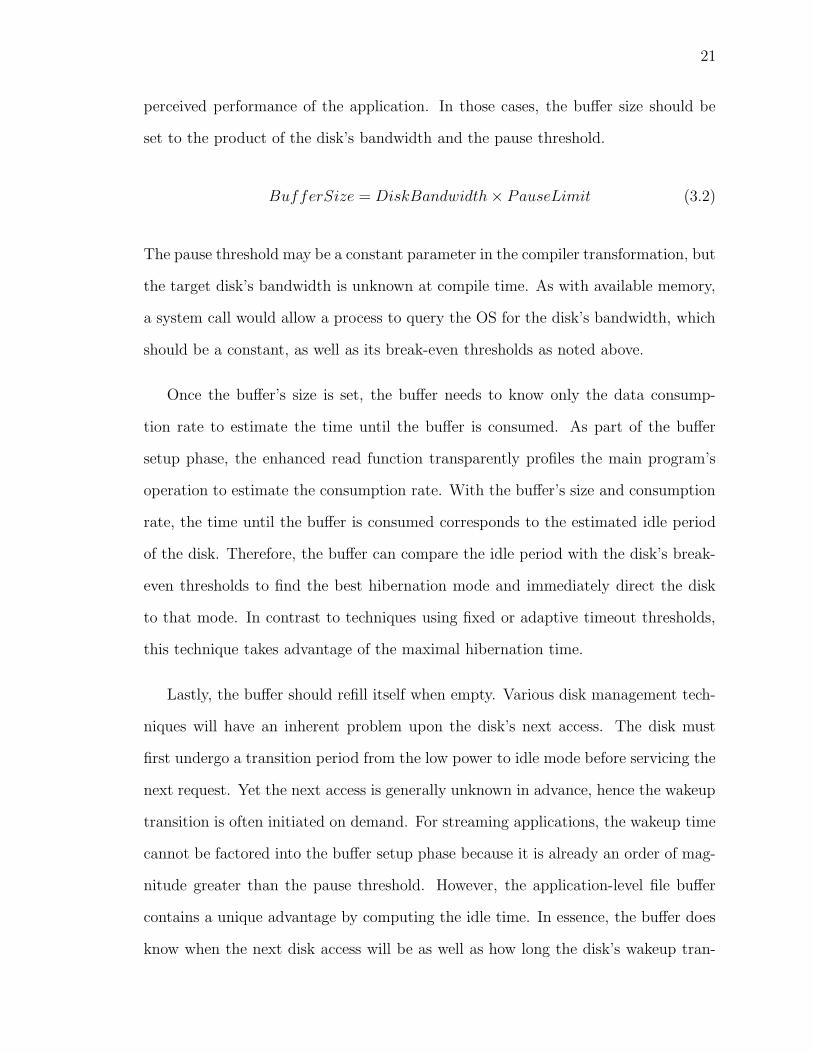
Now suppose two streaming programs have been optimized with buffering and
run concurrently. The disk requests from each program will certainly be clustered,
but the interleaving of even clustered disk requests disrupts and shortens the effec-
tive idle periods of the disk. Figure 3.5 shows the disk access pattern that results
when buffered versions of an audio player and video player are run concurrently.
Some profitable hibernation opportunities still exist, but several have been ruined.
The access pattern begins to degenerate, vaguely resembling the unbuffered case of
uniprogramming. There are a few problems to note. First, while one program’s disk
requests may occur periodically, they interleave with other programs and interfere
with the idle periods. Second, one program’s buffer, taking the uniprogramming view,
assumed that the disk would be idle after a buffer refill and immediately directed the
23
0
0.2
0.4
0.6
0.8
1
1.2
1.4
0 50 100 150 200 250 300 350 400 450
Cur
rent
(am
pere
s)
Time (seconds)
MPEG audio and video (buffered)
Figure 3.5: Disk activity of buffered audio player and video player.
0
0.2
0.4
0.6
0.8
1
1.2
1.4
0 50 100 150 200 250 300 350 400 450
Cur
rent
(am
pere
s)
Time (seconds)
MPEG audio and video (synchronized and buffered)
Figure 3.6: Disk activity of synchronized and buffered audio player and video player.
disk to hibernate while the other program’s buffer became empty soon after and ini-
tiated a wakeup. If the accesses were aligned, the energy costs of transitioning from
idle to low power and back to idle could have been saved. Third, disk requests from
any two programs will never align except by chance because their frequencies are
different. Even if their frequencies happened to be the same, they still need some
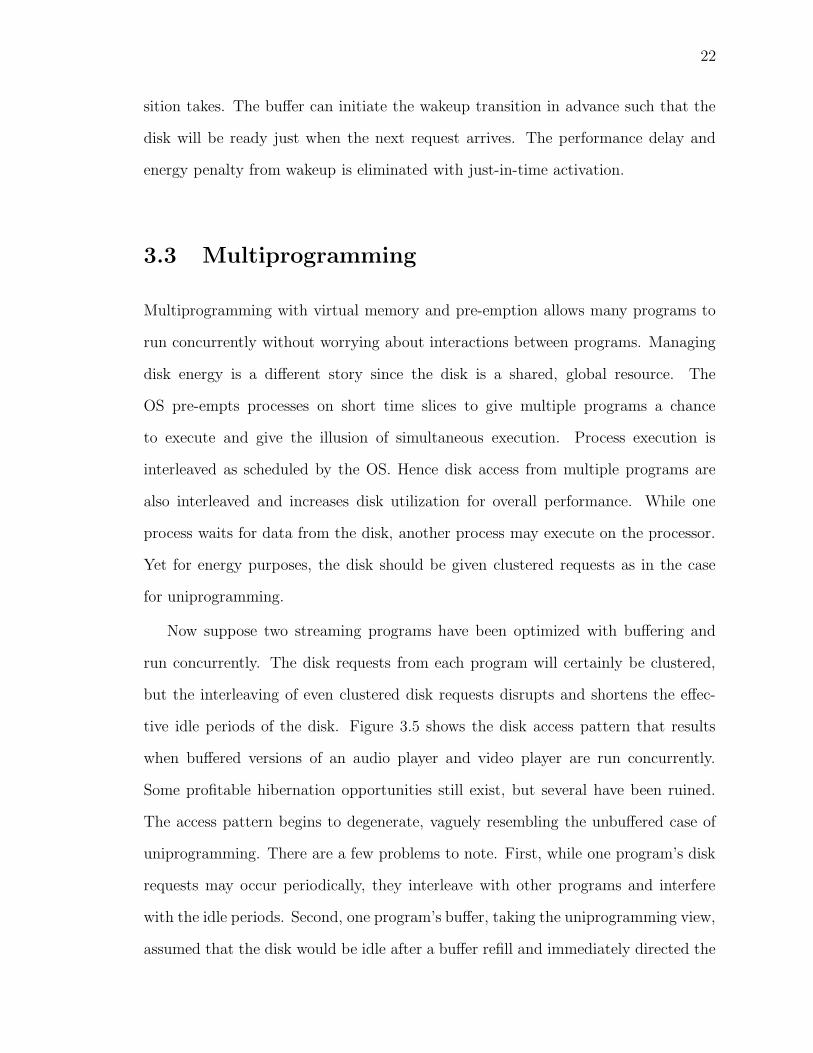
way of first synchronizing their requests. Therefore, just as in the uniprogramming
case, the solution is to cluster disk accesses but now across multiple programs. Fig-
ure 3.6 shows a disk access pattern where a buffered audio player and video player
are cooperating to synchronize their disk requests.
24
3.3.1 Inverse Barrier
The notion of clustering disk requests from multiple programs shares a resemblance
with scheduling jobs on a parallel processing system. To compare the problem domain
with disk energy management, disk requests are like related jobs to be scheduled on
the disk. The disk requests and jobs are unknown in advance when they will be ready
to be scheduled. When jobs are ready on a parallel system, many techniques try to
schedule related jobs together. Due to high communication and context switching
costs, efficiency is increased when related jobs are scheduled together. For disks,
Figure 3.5 demonstrates how each disk request from two applications incurs a transi-
tion cost of wakeup and hibernation. Clustering requests would eliminate transitions,
amortize the costs, and lengthen the disk idle periods.
Many job scheduling policies revolve around some form of co-scheduling. Barrier
techniques are well known and straight forward. A job will wait or suspend execution
when reaching a barrier point until all jobs within its group has reached the barrier.
Then they may be allowed to proceed or be co-scheduled on the ready queue. Using
a barrier to cluster disk requests however will seriously impact performance for real-
time applications. They should not wait for other applications to access the disk.
Instead, quite the opposite should occur. A streaming application whose buffer is
empty should certainly refill itself to maintain performance. Now that the disk has
performed a wakeup transition, other applications may take advantage of the disk’s
ready state. For this purpose, I designed inverse barrier synchronization.
Definition (Inverse Barrier). Let a set of programs belong to a collective group.
The protocol is a logical construct placed at an execution event and consists of a send
and receive notification.
Send When a member program’s execution reaches the inverse barrier, that member
sends an announcement to all other members, informing them that the inverse
25
barrier has been reached. The member may resume normal execution.
Receive When a member receives the announcement, it understands that the inverse
barrier event has just occurred. It may take a relevant action based on its
program state.
In contrast to regular barrier scheduling, the inverse barrier essentially causes all
members to synchronize when one member reaches that point. Instead of waiting for
other members, the inverse barrier conceptually pulls other members forward which
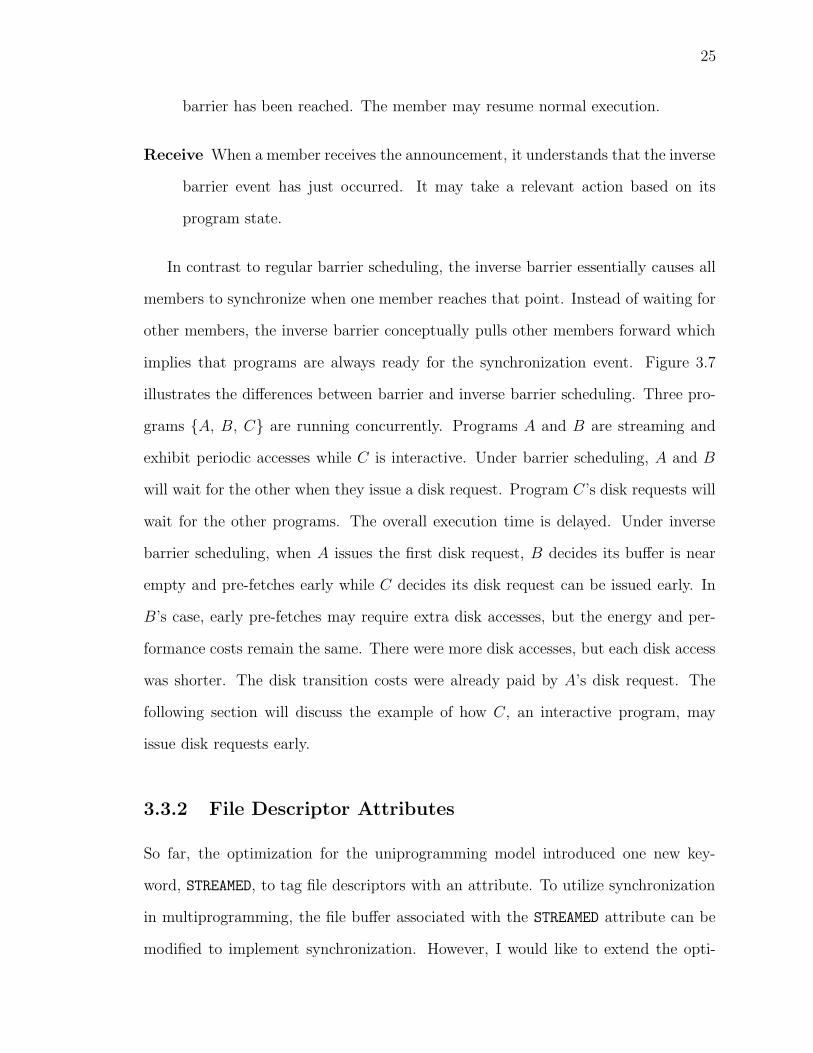
implies that programs are always ready for the synchronization event. Figure 3.7
illustrates the differences between barrier and inverse barrier scheduling. Three pro-
grams {A, B, C} are running concurrently. Programs A and B are streaming and
exhibit periodic accesses while C is interactive. Under barrier scheduling, A and B
will wait for the other when they issue a disk request. Program C’s disk requests will
wait for the other programs. The overall execution time is delayed. Under inverse
barrier scheduling, when A issues the first disk request, B decides its buffer is near
empty and pre-fetches early while C decides its disk request can be issued early. In
B’s case, early pre-fetches may require extra disk accesses, but the energy and per-
formance costs remain the same. There were more disk accesses, but each disk access
was shorter. The disk transition costs were already paid by A’s disk request. The
following section will discuss the example of how C, an interactive program, may
issue disk requests early.
3.3.2 File Descriptor Attributes
So far, the optimization for the uniprogramming model introduced one new key-
word, STREAMED, to tag file descriptors with an attribute. To utilize synchronization
in multiprogramming, the file buffer associated with the STREAMED attribute can be
modified to implement synchronization. However, I would like to extend the opti-
26
Program EventsA
B
C
Unmodified
C
B
A
Barrier
C
B
A
Inverse Barrier
C
B
A
Figure 3.7: The effect of barrier and inverse barrier scheduling policies on disk ac-cesses. Programs A and B are streaming while C is interactive.
27
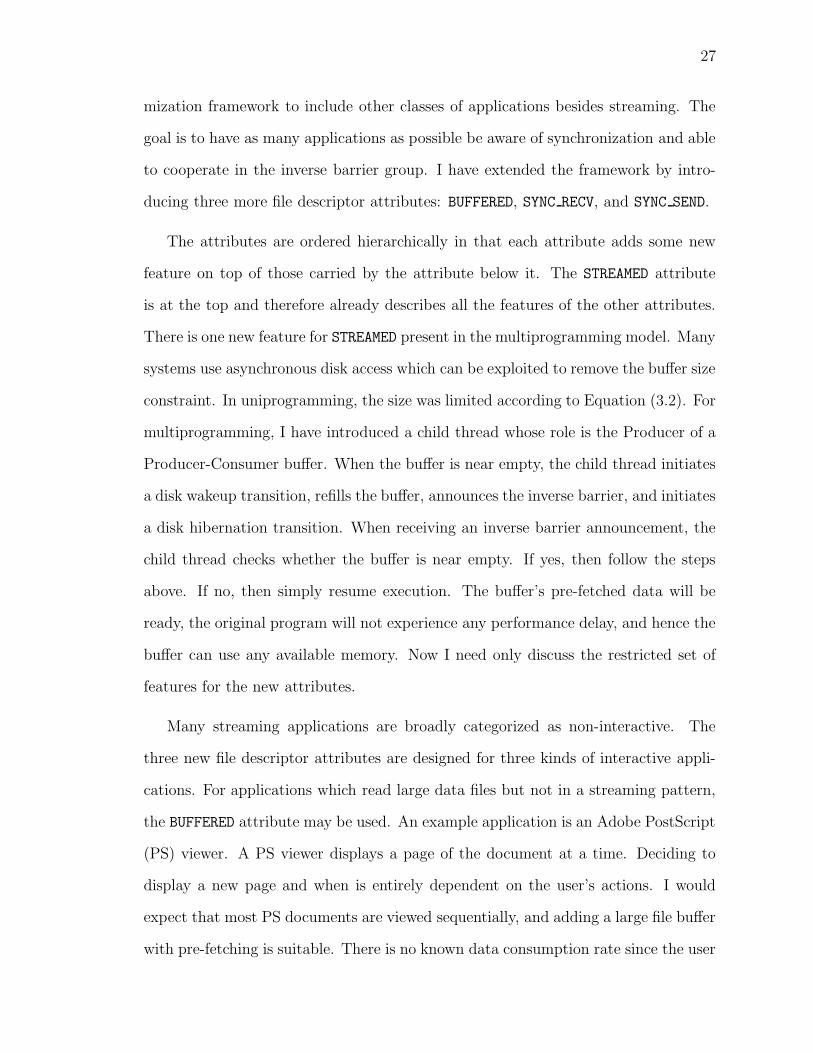
mization framework to include other classes of applications besides streaming. The
goal is to have as many applications as possible be aware of synchronization and able
to cooperate in the inverse barrier group. I have extended the framework by intro-
ducing three more file descriptor attributes: BUFFERED, SYNC RECV, and SYNC SEND.
The attributes are ordered hierarchically in that each attribute adds some new
feature on top of those carried by the attribute below it. The STREAMED attribute
is at the top and therefore already describes all the features of the other attributes.
There is one new feature for STREAMED present in the multiprogramming model. Many
systems use asynchronous disk access which can be exploited to remove the buffer size
constraint. In uniprogramming, the size was limited according to Equation (3.2). For
multiprogramming, I have introduced a child thread whose role is the Producer of a
Producer-Consumer buffer. When the buffer is near empty, the child thread initiates
a disk wakeup transition, refills the buffer, announces the inverse barrier, and initiates
a disk hibernation transition. When receiving an inverse barrier announcement, the
child thread checks whether the buffer is near empty. If yes, then follow the steps
above. If no, then simply resume execution. The buffer’s pre-fetched data will be
ready, the original program will not experience any performance delay, and hence the
buffer can use any available memory. Now I need only discuss the restricted set of
features for the new attributes.
Many streaming applications are broadly categorized as non-interactive. The
three new file descriptor attributes are designed for three kinds of interactive appli-
cations. For applications which read large data files but not in a streaming pattern,
the BUFFERED attribute may be used. An example application is an Adobe PostScript
(PS) viewer. A PS viewer displays a page of the document at a time. Deciding to
display a new page and when is entirely dependent on the user’s actions. I would
expect that most PS documents are viewed sequentially, and adding a large file buffer
with pre-fetching is suitable. There is no known data consumption rate since the user
28
controls when to display a new page. Therefore, the compiler will replace original
read calls with a version of the enhanced read which implements the buffer but does
not include just-in-time activation.
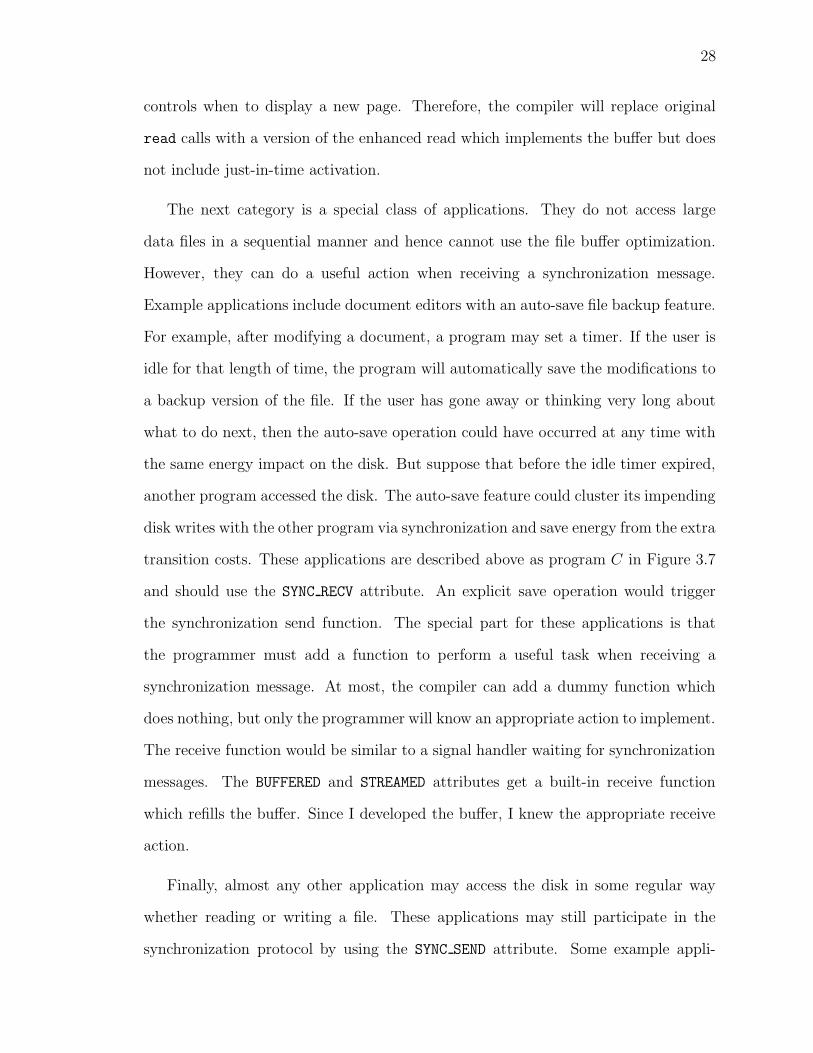
The next category is a special class of applications. They do not access large
data files in a sequential manner and hence cannot use the file buffer optimization.
However, they can do a useful action when receiving a synchronization message.
Example applications include document editors with an auto-save file backup feature.
For example, after modifying a document, a program may set a timer. If the user is
idle for that length of time, the program will automatically save the modifications to
a backup version of the file. If the user has gone away or thinking very long about
what to do next, then the auto-save operation could have occurred at any time with
the same energy impact on the disk. But suppose that before the idle timer expired,
another program accessed the disk. The auto-save feature could cluster its impending
disk writes with the other program via synchronization and save energy from the extra
transition costs. These applications are described above as program C in Figure 3.7
and should use the SYNC RECV attribute. An explicit save operation would trigger
the synchronization send function. The special part for these applications is that
the programmer must add a function to perform a useful task when receiving a
synchronization message. At most, the compiler can add a dummy function which
does nothing, but only the programmer will know an appropriate action to implement.
The receive function would be similar to a signal handler waiting for synchronization
messages. The BUFFERED and STREAMED attributes get a built-in receive function
which refills the buffer. Since I developed the buffer, I knew the appropriate receive
action.
Finally, almost any other application may access the disk in some regular way
whether reading or writing a file. These applications may still participate in the
synchronization protocol by using the SYNC SEND attribute. Some example appli-
29
cations include document editors without auto-save, web browsers with file caching,
and Adobe Portable Document Format (PDF) viewers. These applications access the
disk in some predictable ways and can notify other applications for synchronized disk
access. However, as far as I know, they do not have applicable receive actions. PDF
viewers cannot use the BUFFERED attribute because the data layout uses a pointer-
based index [5]. That is, page content is not stored sequentially as opposed to the
PS format [4].
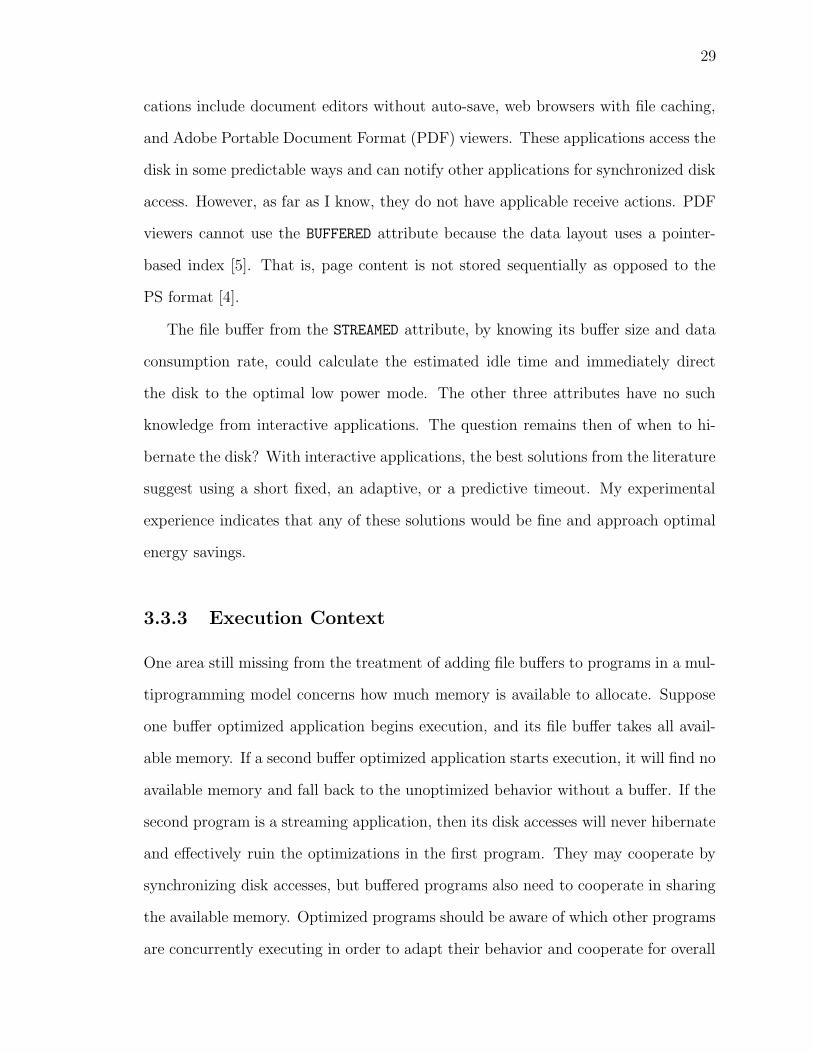
The file buffer from the STREAMED attribute, by knowing its buffer size and data
consumption rate, could calculate the estimated idle time and immediately direct
the disk to the optimal low power mode. The other three attributes have no such
knowledge from interactive applications. The question remains then of when to hi-
bernate the disk? With interactive applications, the best solutions from the literature
suggest using a short fixed, an adaptive, or a predictive timeout. My experimental
experience indicates that any of these solutions would be fine and approach optimal
energy savings.
3.3.3 Execution Context
One area still missing from the treatment of adding file buffers to programs in a mul-
tiprogramming model concerns how much memory is available to allocate. Suppose
one buffer optimized application begins execution, and its file buffer takes all avail-
able memory. If a second buffer optimized application starts execution, it will find no
available memory and fall back to the unoptimized behavior without a buffer. If the
second program is a streaming application, then its disk accesses will never hibernate
and effectively ruin the optimizations in the first program. They may cooperate by
synchronizing disk accesses, but buffered programs also need to cooperate in sharing
the available memory. Optimized programs should be aware of which other programs
are concurrently executing in order to adapt their behavior and cooperate for overall
30
disk energy savings.
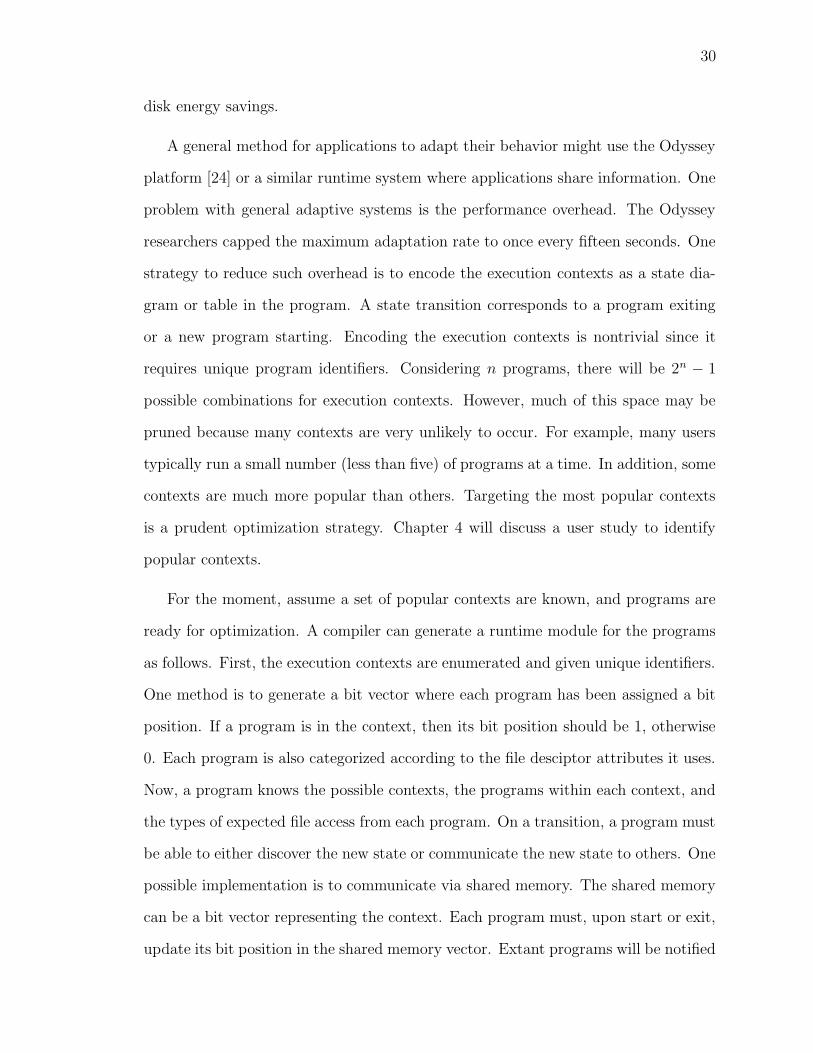
A general method for applications to adapt their behavior might use the Odyssey
platform [24] or a similar runtime system where applications share information. One
problem with general adaptive systems is the performance overhead. The Odyssey
researchers capped the maximum adaptation rate to once every fifteen seconds. One
strategy to reduce such overhead is to encode the execution contexts as a state dia-
gram or table in the program. A state transition corresponds to a program exiting
or a new program starting. Encoding the execution contexts is nontrivial since it
requires unique program identifiers. Considering n programs, there will be 2n − 1
possible combinations for execution contexts. However, much of this space may be
pruned because many contexts are very unlikely to occur. For example, many users
typically run a small number (less than five) of programs at a time. In addition, some
contexts are much more popular than others. Targeting the most popular contexts
is a prudent optimization strategy. Chapter 4 will discuss a user study to identify
popular contexts.
For the moment, assume a set of popular contexts are known, and programs are
ready for optimization. A compiler can generate a runtime module for the programs
as follows. First, the execution contexts are enumerated and given unique identifiers.
One method is to generate a bit vector where each program has been assigned a bit
position. If a program is in the context, then its bit position should be 1, otherwise
0. Each program is also categorized according to the file desciptor attributes it uses.
Now, a program knows the possible contexts, the programs within each context, and
the types of expected file access from each program. On a transition, a program must
be able to either discover the new state or communicate the new state to others. One
possible implementation is to communicate via shared memory. The shared memory
can be a bit vector representing the context. Each program must, upon start or exit,
update its bit position in the shared memory vector. Extant programs will be notified
31
of the transition via an announcement similar to the inverse barrier.
When a program is notified of a transition, it reads the new state and adapts
its behavior as follows. If only one program is extant, then any synchronization
mechanisms can be disabled. If more than one program is extant, and if at least one
program uses the SYNC RECV or higher attribute, then synchronization will be enabled.
If any extant programs are buffered, then they will adjust their use of available
memory according to any suitably fair or proportional policy. A conservative policy,
Divide-by-N, would reallocate each program’s share of memory to be the available
memory divided by the number of buffered programs.
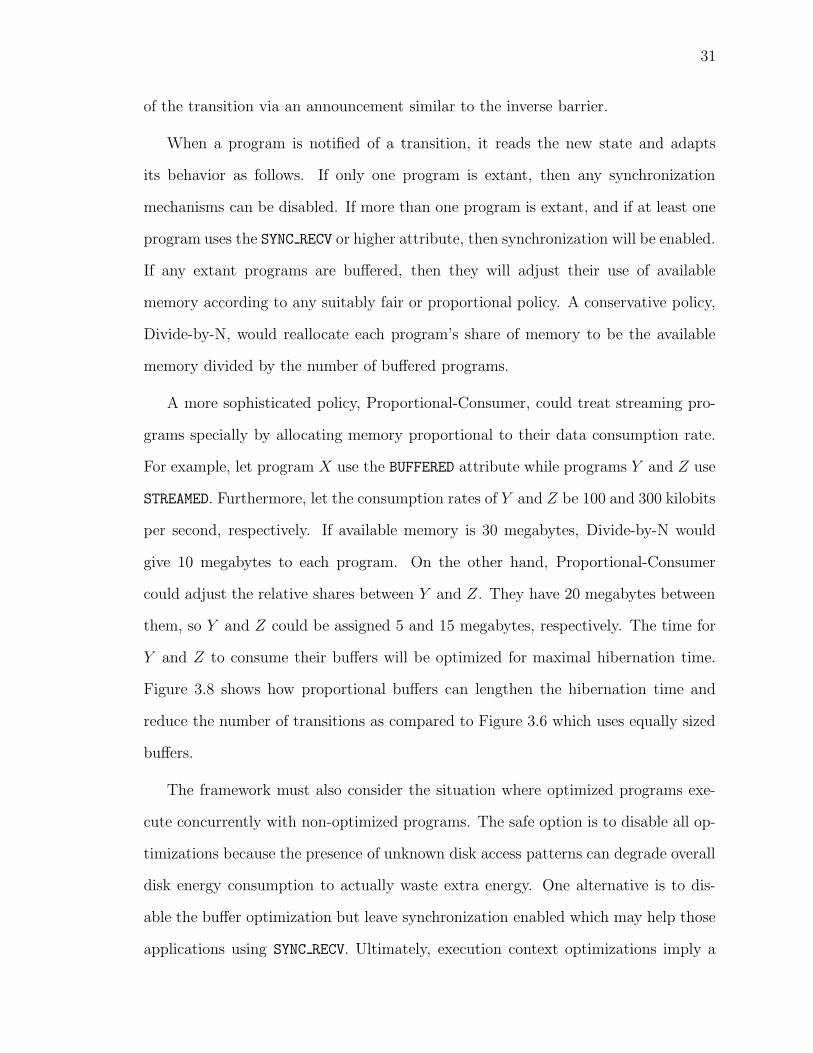
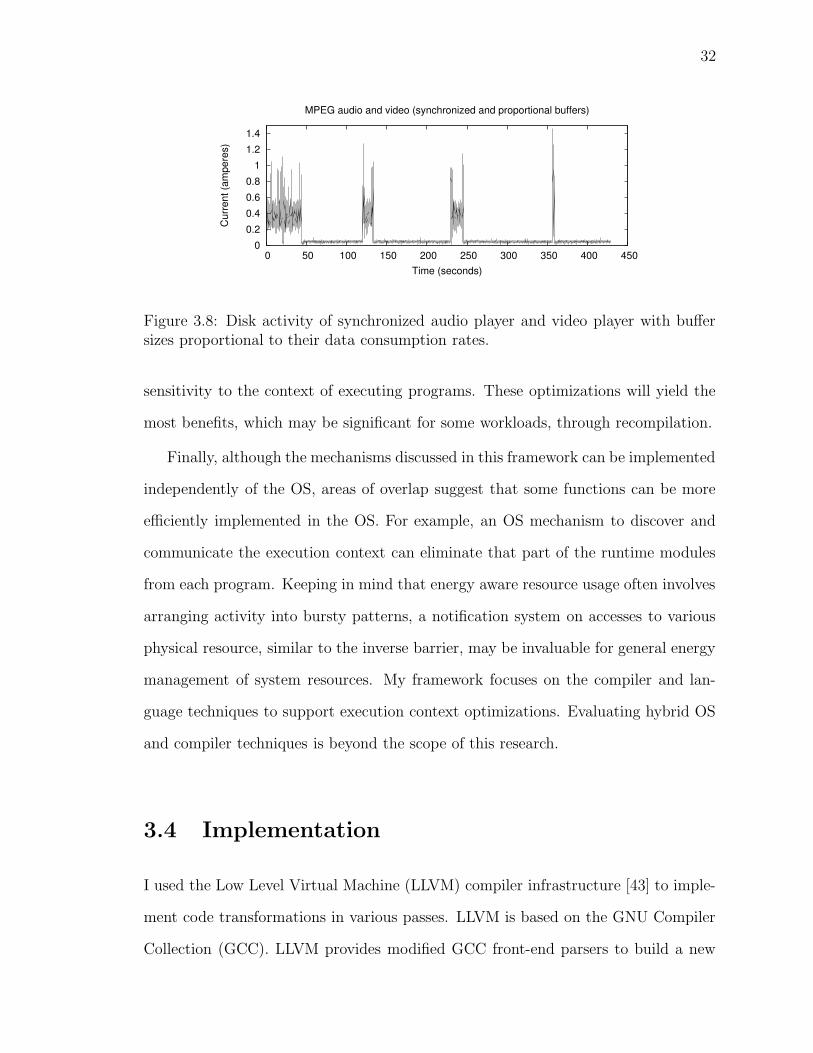
A more sophisticated policy, Proportional-Consumer, could treat streaming pro-
grams specially by allocating memory proportional to their data consumption rate.
For example, let program X use the BUFFERED attribute while programs Y and Z use
STREAMED. Furthermore, let the consumption rates of Y and Z be 100 and 300 kilobits
per second, respectively. If available memory is 30 megabytes, Divide-by-N would
give 10 megabytes to each program. On the other hand, Proportional-Consumer
could adjust the relative shares between Y and Z. They have 20 megabytes between
them, so Y and Z could be assigned 5 and 15 megabytes, respectively. The time for
Y and Z to consume their buffers will be optimized for maximal hibernation time.
Figure 3.8 shows how proportional buffers can lengthen the hibernation time and
reduce the number of transitions as compared to Figure 3.6 which uses equally sized
buffers.
The framework must also consider the situation where optimized programs exe-
cute concurrently with non-optimized programs. The safe option is to disable all op-
timizations because the presence of unknown disk access patterns can degrade overall
disk energy consumption to actually waste extra energy. One alternative is to dis-
able the buffer optimization but leave synchronization enabled which may help those
applications using SYNC RECV. Ultimately, execution context optimizations imply a
32
0
0.2
0.4
0.6
0.8
1
1.2
1.4
0 50 100 150 200 250 300 350 400 450
Cur
rent
(am
pere
s)
Time (seconds)
MPEG audio and video (synchronized and proportional buffers)
Figure 3.8: Disk activity of synchronized audio player and video player with buffersizes proportional to their data consumption rates.
sensitivity to the context of executing programs. These optimizations will yield the
most benefits, which may be significant for some workloads, through recompilation.
Finally, although the mechanisms discussed in this framework can be implemented
independently of the OS, areas of overlap suggest that some functions can be more
efficiently implemented in the OS. For example, an OS mechanism to discover and
communicate the execution context can eliminate that part of the runtime modules
from each program. Keeping in mind that energy aware resource usage often involves
arranging activity into bursty patterns, a notification system on accesses to various
physical resource, similar to the inverse barrier, may be invaluable for general energy
management of system resources. My framework focuses on the compiler and lan-
guage techniques to support execution context optimizations. Evaluating hybrid OS
and compiler techniques is beyond the scope of this research.
3.4 Implementation
I used the Low Level Virtual Machine (LLVM) compiler infrastructure [43] to imple-
ment code transformations in various passes. LLVM is based on the GNU Compiler
Collection (GCC). LLVM provides modified GCC front-end parsers to build a new
33
intermediate representation. Many tools are also provided to support analyses, trans-
formations, and back-end code generators for several popular architectures including
source level C code. LLVM is robust enough to compile many C programs, but it lacks
full support for C++. In addition, using LLVM would require modifying the build
scripts to use LLVM’s tools, and modifying the build system of even one program can
be nontrivial. Thus, I used LLVM to perform source to source level transformations
and kept the original build system of scripts unchanged.
3.4.1 Limitations
There are two limitations of my implementation, one of which is affected by how
LLVM is structured. My framework introduces new file descriptor attributes which
are to be propagated to call sites. An inter-procedural analysis would serve this
purpose. LLVM does support inter-procedural analysis but currently only at the
linking phase of compilation. The LLVM developers have plans to support inter-
procedural analysis on their intermediate representation. Since I am performing
source to source transformations, I emulate the inter-procedural analysis by hand
and use the information to precisely target the code transformations.
The second limitation deals with application adaptation. I have not yet developed
the runtime modules to support dynamic application adaptation according to the
execution context. For now, the code transformations target a specific execution
context when applying optimizations. Hence, multiple versions of program binaries
may be generated depending on the context. Runtime adapation modules are left for
future work.
3.4.2 Synchronization
I implemented inverse barrier synchronization via semaphores. Semaphores provide
a simple way to mimic multicast. A true multicast mechanism with message queues
34
would have been more flexible and elegant. Semaphores do not know which programs
to send a message to and relies upon each program earnestly waiting to process
the message. If programs do not process the message in a timely fashion, a race
condition exists to degrade the semantics of the multicast-like semaphore. I set aside
a global semaphore to be shared by all programs. Each program wanting to receive
notifications will have a child thread to wait on the semaphore. The semaphore
structure in Linux maintains a count of waiting processes. To send a notification, a
process increments the semaphore by the number of waiting processes. Each waiting
child thread will decrement the semaphore by one and take the appropriate action.
The action will vary for SYNC RECV, BUFFERED, and STREAMED.
3.4.3 Greedy Hibernation
Synchronization messages are sent after a program has accessed the disk. A variety
of policies, such as fixed or adaptive thresholds, may be used to govern when a disk
should hibernate. I have chosen to use an aggressive, greedy hibernation policy which
directs the disk to hibernate immediately. Programs using the file buffer optimization
will have finished pre-fetching data to fill their buffer. Programs using SYNC SEND or
SYNC RECV are generally interactive, and the inter-arrival times between disk requests
are described by a Pareto distribution. The activity profile of a program just finishing
its disk access will likely be followed by human think time. Therefore, maximal energy
savings is possible with immediate hibernation.
3.4.4 Optimization Passes
The overall transformations occur in two stages. Stage 1 is specifically for those pro-
grams using the SYNC SEND or SYNC RECV attributes. Programs are instrumented to
collect profiling information which is passed to the next stage. Stage 2 transforms and
35
gccmake binary
LLVM
resultsprofile
gccmake binary
profiledsource
LLVM
source +file descriptor
attributes
EELruntimelibrary
optimizedsource
Stage 1
Stage 2
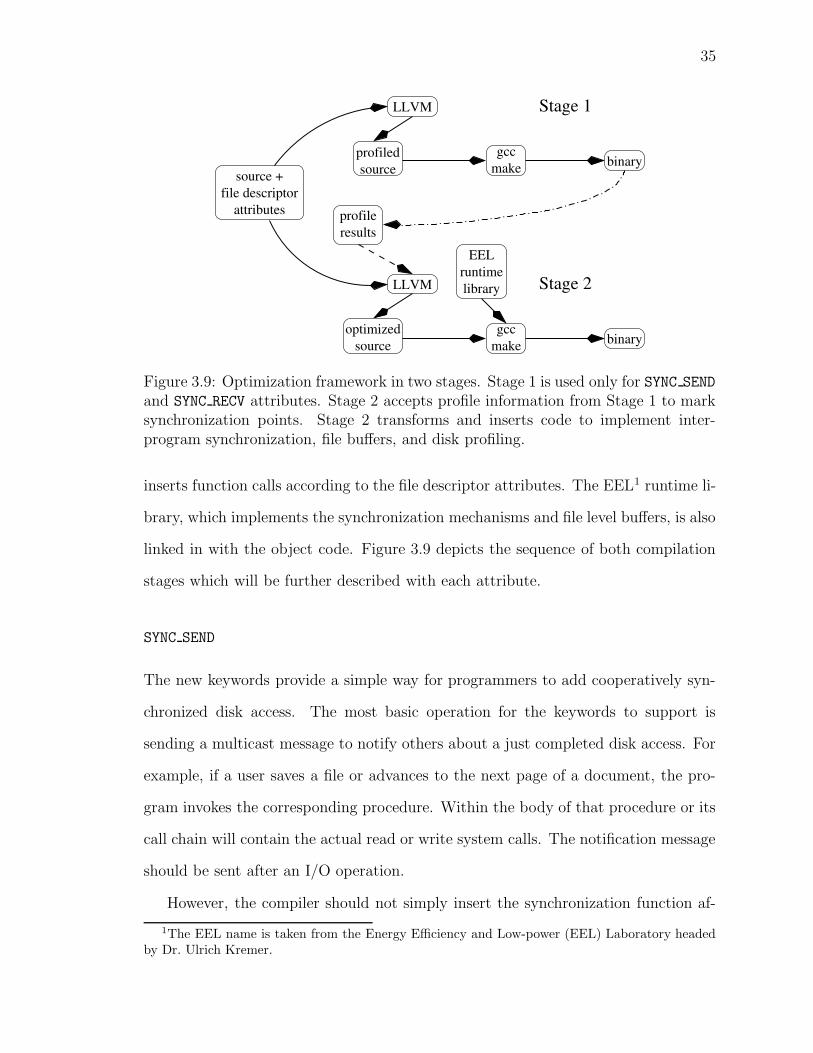
Figure 3.9: Optimization framework in two stages. Stage 1 is used only for SYNC SEND
and SYNC RECV attributes. Stage 2 accepts profile information from Stage 1 to marksynchronization points. Stage 2 transforms and inserts code to implement inter-program synchronization, file buffers, and disk profiling.
inserts function calls according to the file descriptor attributes. The EEL1 runtime li-
brary, which implements the synchronization mechanisms and file level buffers, is also
linked in with the object code. Figure 3.9 depicts the sequence of both compilation
stages which will be further described with each attribute.
SYNC SEND
The new keywords provide a simple way for programmers to add cooperatively syn-
chronized disk access. The most basic operation for the keywords to support is
sending a multicast message to notify others about a just completed disk access. For
example, if a user saves a file or advances to the next page of a document, the pro-
gram invokes the corresponding procedure. Within the body of that procedure or its
call chain will contain the actual read or write system calls. The notification message
should be sent after an I/O operation.
However, the compiler should not simply insert the synchronization function af-
1The EEL name is taken from the Energy Efficiency and Low-power (EEL) Laboratory headedby Dr. Ulrich Kremer.
36
while (NOT FINISHED) { //
read (file, buffer, n); //
SYNCHRONIZE (); // CASE 1
process (buffer); //
} //
while (NOT FINISHED) { //
read (file, buffer, n); //
process (buffer); // CASE 2
} //
SYNCHRONIZE (); //
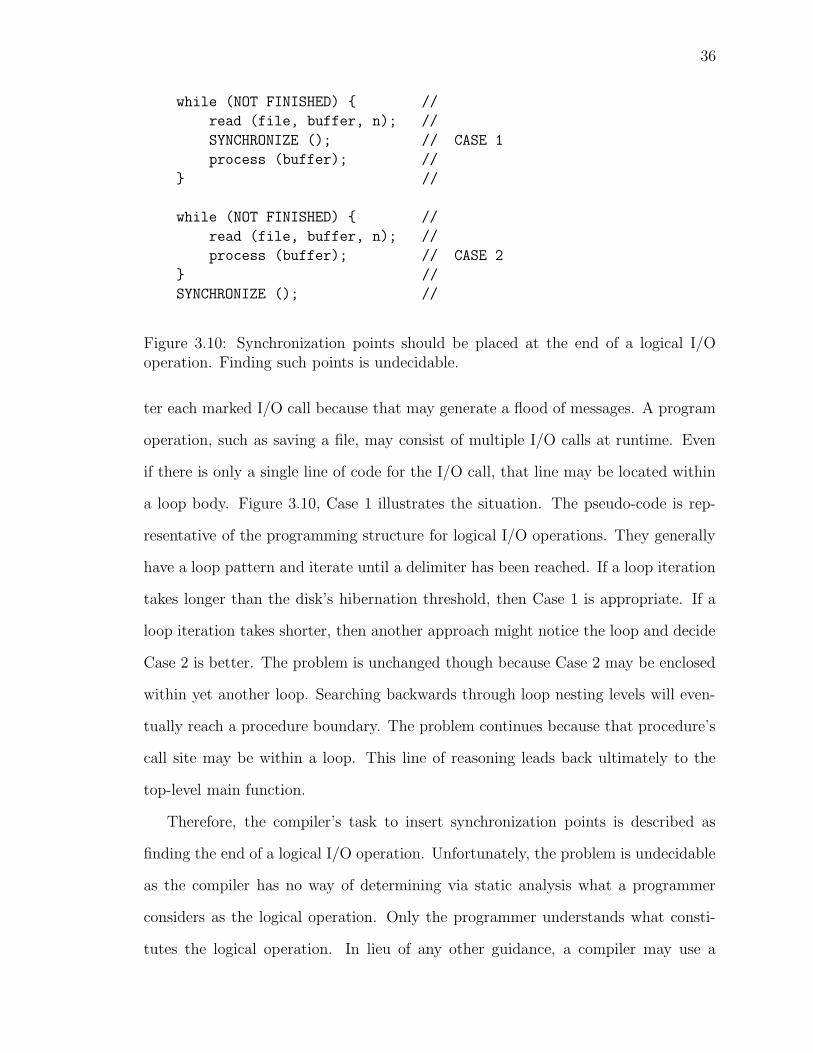
Figure 3.10: Synchronization points should be placed at the end of a logical I/Ooperation. Finding such points is undecidable.
ter each marked I/O call because that may generate a flood of messages. A program
operation, such as saving a file, may consist of multiple I/O calls at runtime. Even
if there is only a single line of code for the I/O call, that line may be located within
a loop body. Figure 3.10, Case 1 illustrates the situation. The pseudo-code is rep-
resentative of the programming structure for logical I/O operations. They generally
have a loop pattern and iterate until a delimiter has been reached. If a loop iteration
takes longer than the disk’s hibernation threshold, then Case 1 is appropriate. If a
loop iteration takes shorter, then another approach might notice the loop and decide
Case 2 is better. The problem is unchanged though because Case 2 may be enclosed
within yet another loop. Searching backwards through loop nesting levels will even-
tually reach a procedure boundary. The problem continues because that procedure’s
call site may be within a loop. This line of reasoning leads back ultimately to the
top-level main function.
Therefore, the compiler’s task to insert synchronization points is described as
finding the end of a logical I/O operation. Unfortunately, the problem is undecidable
as the compiler has no way of determining via static analysis what a programmer
considers as the logical operation. Only the programmer understands what consti-
tutes the logical operation. In lieu of any other guidance, a compiler may use a
37
heuristic of runtime profiling to estimate when a logical I/O operation has ended. In
a generalized I/O operation containing multiple I/O calls, the calls will occur with
short inter-arrival times. If the inter-arrival time between two calls is greater than a
reasonable threshold, then the compiler assumes one I/O operation has completed.
This heuristic is similar to the work in [32] for distinguishing interactive sessions.
For Stage 1, the compiler must first mark the candidate I/O calls. They are
identified by using an inter-procedural analysis to build Definition-Use chains from the
keywords. Uses of the file descriptor are marked. As mentioned above, I performed
the inter-procedural analysis by hand. I instrumented the I/O calls and surrounding
functions with timestamps. The program is run in a training phase where the logical
I/O operations are specifically executed. I analyzed the profile timestamps using
an inter-arrival threshold of ten seconds and identified the synchronization points.
Stage 2 uses the profiling results to pinpoint where the synchronization function is
inserted. The only operations include directing the disk to hibernate and sending a
notification.
SYNC RECV
In addition to the above, the SYNC RECV attribute lets the compiler know to add a
child thread which will listen for synchronization messages. The child thread will
dispatch to the program’s handler and then go back to listening again for the next
message.
BUFFERED
Programs using at least the BUFFERED attribute will not need the profiling phase of
Stage 1. The buffer optimization transforms and clusters the disk request patterns.
The buffer has taken over control of the I/O resulting from the program’s logical
operations. In effect, the logical I/O operation is now mapped to the buffer’s pre-
38
fetch operation. Since I, as the programmer of the buffer, know where this operation
ends, I also know the optimal location for the synchronization point. Thus, the buffer
is entirely self-managed and the synchronization mechanism is built in. A child thread
listens for messages and dispatches to a pre-fetch handler. The handler will check if
the buffer is less than half full before initiating a pre-fetch; otherwise, do nothing.
STREAMED
The STREAMED attribute inserts an enhanced buffer which takes into account the
disk’s bandwidth and the program’s data consumption rate to implement just-in-
time wakeup. Activating the disk early strives to prevent buffer underflow situations
where real-time applications cannot tolerate pausing for data. Furthermore, the child
thread operates asynchronously to pre-fetch data into the buffer for maximum energy
savings and zero performance delay.
39
Chapter 4
Opportunity
Execution context optimizations are a promising new research area. A key enabler
is observing how users interact with applications in routine ways. The computer is
well suited for multi-tasking up to its available memory. Exceeding available memory
causes the system to swap memory to disk to store information about future tasks
when needed. Humans are also quite capable of multi-tasking up to a limit; beyond
that, people may turn to writing notes to remind themselves of future tasks. Daily
experience and psychology experiments demonstrate that humans are less efficient
when multi-tasking with many tasks [60]. Thus, the intuition for computing is that
most users run only a small number of programs at a time.
Computer multi-tasking may also be constrained by various other system re-
sources. Many users recognize that their system’s processor, disk, or network can
handle only a finite number of tasks before the perceived system speed slows down.
Hence, identifying the sweet spots of user activity will reveal the opportunities for
execution context optimizations. Calculator applications may not access the disk
much and consequently, may not merit attention for optimization. But if calculators
often run with a streaming application, perhaps some common disk access operations
could be optimized. To gain insight into actual user activity, I conducted a study
40
on program usage from a population of computer science graduate students. The re-
sults provide a first step in confirming the intuition above and a direction for future
optimizations.
4.1 Tracing Infrastructure
During the spring 2007 semester, with the cooperation and help of the Computer
Science Department system administrators, 40 desktop machines were instrumented
in a style similar to Roselli et al.’s setup to trace file systems [59]. The systems
contain Pentium 4 processors clocked between 2.8–3.4 GHz with either 512 or 1024
MB main memory and a standard installation of Fedora Core 3 Linux. The kernel
was upgraded to version 2.6.18 to support the instrumentation software. The systems
are connected to the Computer Science graduate student network. All but five of the
machines are located in offices designated for graduate student teaching assistants.
Each office generally contains two machines and is shared by up to four students. The
other five machines are located within a computing lab accessible to all Computer
Science graduate students.
The Computer Science graudate network maintains user accounts across the net-
worked machines via NFS mounts. All systems have full network access to the Inter-
net and are suitable for general computing use. The only network restriction I am
aware of is a byte transfer limit to guard against extreme abuse of network band-
width. The systems also do not have external speakers. This is interesting to note
because the types of applications used are influenced by the system capabilities. If
users want audio output, they must connect their own speakers or earphones. Since
all machines are in shared facilities, users may have been reluctant to use recreational
or entertainment applications.
41
4.1.1 LTTng
The Linux Trace Toolkit next generation (LTTng) [18] version 0.6.33 was installed
onto all 40 desktop machines. LTTng is a kernel module which monitors and records
kernel events such as file system read and write, process signal and wakeup, and
kernel interrupt. The events provide a fine-grain view of the system from the kernel’s
perspective. LTTng’s maximum impact on system performance has been estimated
by its developer to be 2% under high system load. LTTng does not significantly
impede system performance or users’ activities nor has any user complained about
system lag.
LTTng is structured with three event rate channels: high, medium, and low.
Events have been categorized into these channels based on their expected frequency
and quantity. For example, most file system events are in the high rate channel
while process events are in the medium rate channel. A partial listing of traceable
kernel events is shown in Table 4.1. One goal for LTTng’s event channels is to
enable selectively switching a channel on and off, meaning that those events can be
selectively recorded to the trace. A fully dynamic event multiplexing interface is a
planned feature by the developer. For now, the rate channels are set according to
the recording mode. Each channel has a buffer to store events. When the buffer is
full, batches of events can be dumped to disk. The default buffer sizes for the high,
medium, and low rate channels are 1 MB, 256 KB, and 64 KB, respectively, though
they can be specified at runtime.
LTTng has three modes of operation: normal, flight recorder, and hybrid. Normal
mode captures all event channels. Flight recorder mode maintains circular buffers
for the event channels and may optionally write the buffers to disk when tracing
has stopped. As its name implies, flight recorder mode is intended to capture the
last buffer’s worth of events after an interesting event has occurred such as a system
crash. This mode can be integrated with the Linux Kernel Crash Dump (LKCD)
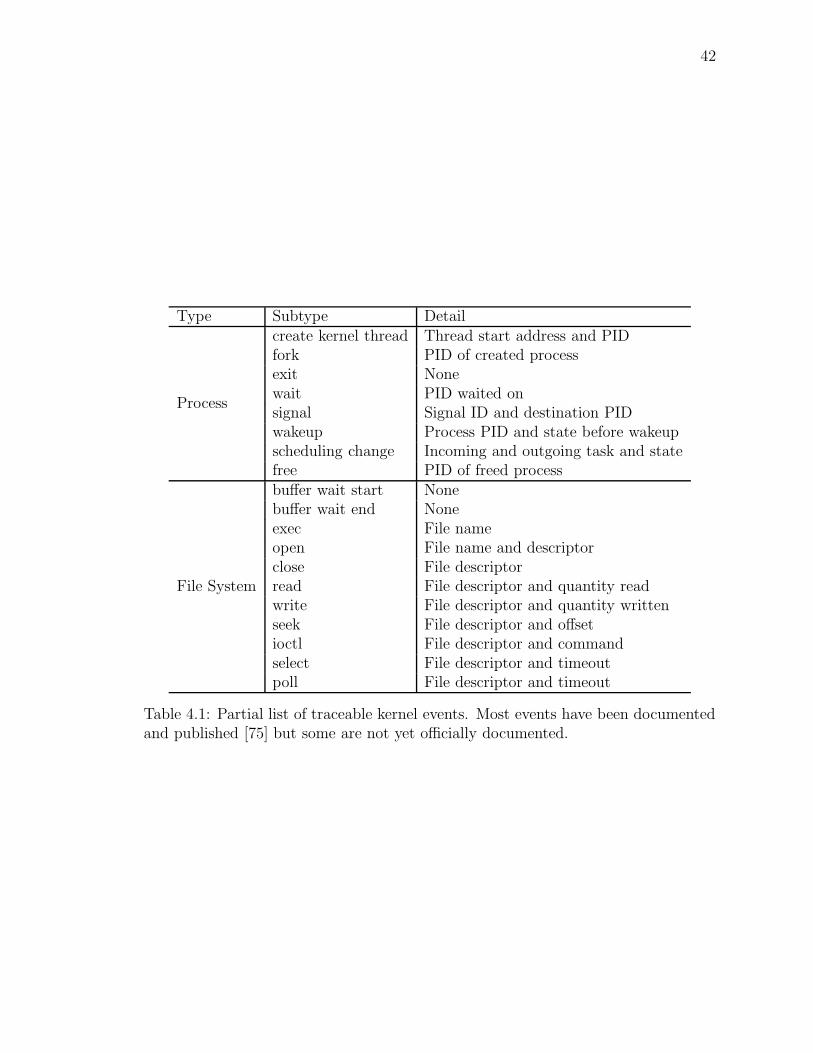
42
Type Subtype Detail
Process
create kernel thread Thread start address and PIDfork PID of created processexit Nonewait PID waited onsignal Signal ID and destination PIDwakeup Process PID and state before wakeupscheduling change Incoming and outgoing task and statefree PID of freed process
File System
buffer wait start Nonebuffer wait end Noneexec File nameopen File name and descriptorclose File descriptorread File descriptor and quantity readwrite File descriptor and quantity writtenseek File descriptor and offsetioctl File descriptor and commandselect File descriptor and timeoutpoll File descriptor and timeout
Table 4.1: Partial list of traceable kernel events. Most events have been documentedand published [75] but some are not yet officially documented.
43
[58] project to recover the buffer contents from memory after a system crash. Hybrid
mode records the medium and low rate channels as in normal mode while the high
rate channel is in flight recorder mode. Hybrid mode was a recent feature which made
this user study feasible. The great advantage was in reducing the trace file size by
recording, in effect, only the medium and low rate channel. The high rate channel in
flight recorder mode can be discarded, if desired, when tracing has stopped. Tracing
tests with earlier versions of LTTng in normal mode revealed that a ten hour trace
generates about 5 GB of compressed data. At those sizes, several of the instrumented
machines have only enough disk space to store a week’s worth of traces. That would
have necessitated weekly cleanup and maintenance of the storage systems. At 40
systems, 1000 GB per week would have been untenable. Alternatively, the scope of
the tracing could have been limited by the number of hours per day or the number
of traced machines in total. Hybrid mode reduced the file size of a ten hour trace by
two orders of magnitude to about 50 MB.
4.1.2 Trace Time Setup
With hybrid mode, the tracing software could have run continuously 24 hours per
day, yet for reporting purposes, a daily snapshot is useful and convenient. For effi-
ciency’s sake, the tracing should record when there is actual user activity as opposed
to user idleness or when no user is logged in to the machine. I want to know when
the most active hours of the day are for tracing. Unix, by default, tracks user ses-
sions by recording when a user logs in and out. Average daily user activity can be
approximated from these user session records.
I examined the user session logs of the 40 instrumented machines over a one week
period. The user sessions recorded 55 distinct users. The one week in particular was
considered ordinary; that is, there were no holidays or special events in the academic
calendar. I divided the session times into 24 hourly buckets. For example, if a session
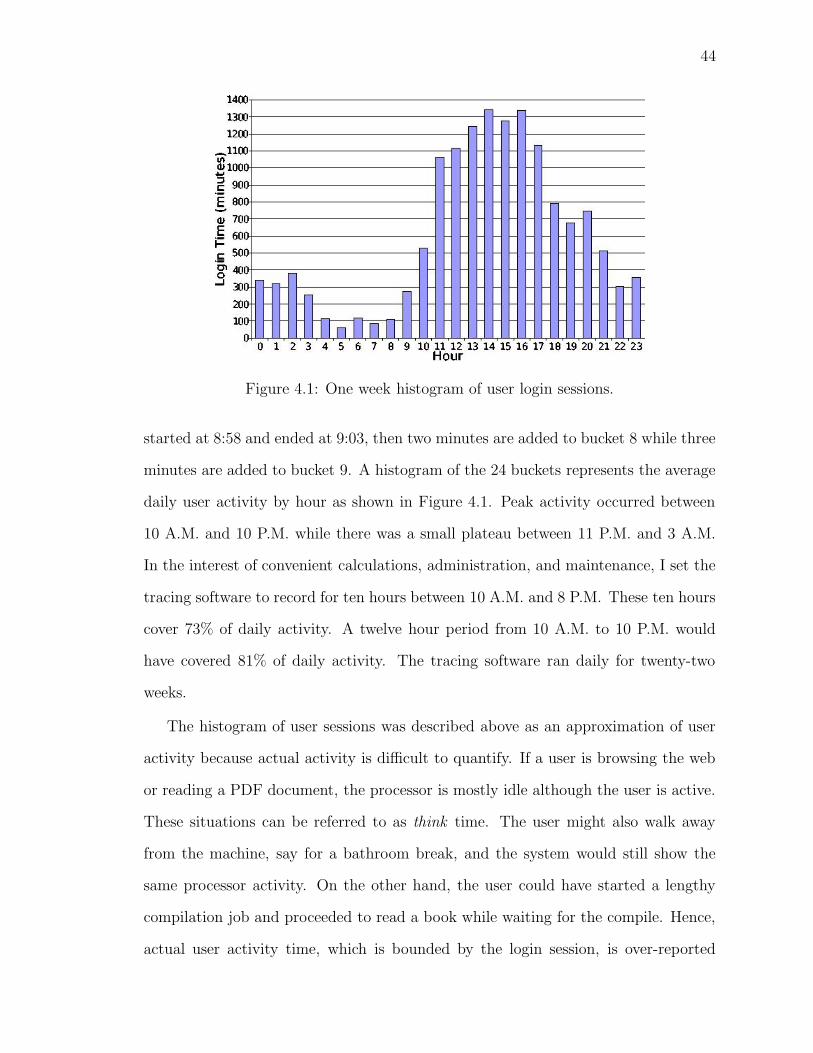
44
Figure 4.1: One week histogram of user login sessions.
started at 8:58 and ended at 9:03, then two minutes are added to bucket 8 while three
minutes are added to bucket 9. A histogram of the 24 buckets represents the average
daily user activity by hour as shown in Figure 4.1. Peak activity occurred between
10 A.M. and 10 P.M. while there was a small plateau between 11 P.M. and 3 A.M.
In the interest of convenient calculations, administration, and maintenance, I set the
tracing software to record for ten hours between 10 A.M. and 8 P.M. These ten hours
cover 73% of daily activity. A twelve hour period from 10 A.M. to 10 P.M. would
have covered 81% of daily activity. The tracing software ran daily for twenty-two
weeks.
The histogram of user sessions was described above as an approximation of user
activity because actual activity is difficult to quantify. If a user is browsing the web
or reading a PDF document, the processor is mostly idle although the user is active.
These situations can be referred to as think time. The user might also walk away
from the machine, say for a bathroom break, and the system would still show the
same processor activity. On the other hand, the user could have started a lengthy
compilation job and proceeded to read a book while waiting for the compile. Hence,
actual user activity time, which is bounded by the login session, is over-reported
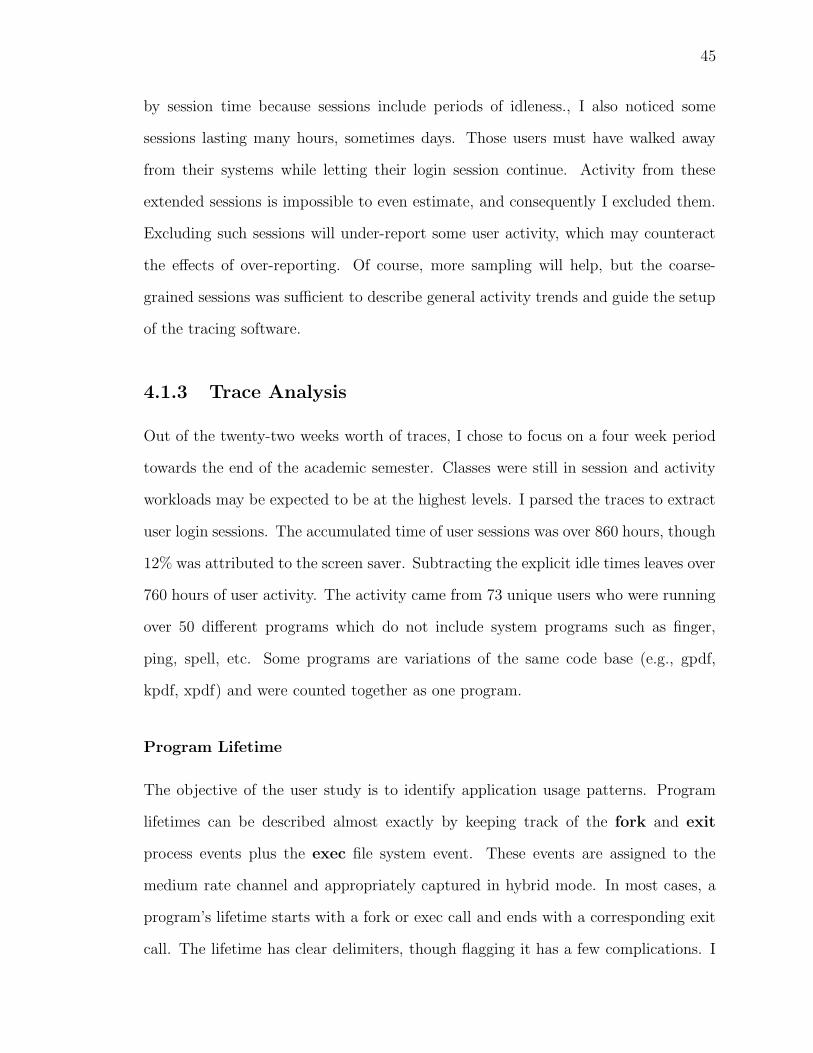
45
by session time because sessions include periods of idleness., I also noticed some
sessions lasting many hours, sometimes days. Those users must have walked away
from their systems while letting their login session continue. Activity from these
extended sessions is impossible to even estimate, and consequently I excluded them.
Excluding such sessions will under-report some user activity, which may counteract
the effects of over-reporting. Of course, more sampling will help, but the coarse-
grained sessions was sufficient to describe general activity trends and guide the setup
of the tracing software.
4.1.3 Trace Analysis
Out of the twenty-two weeks worth of traces, I chose to focus on a four week period
towards the end of the academic semester. Classes were still in session and activity
workloads may be expected to be at the highest levels. I parsed the traces to extract
user login sessions. The accumulated time of user sessions was over 860 hours, though
12% was attributed to the screen saver. Subtracting the explicit idle times leaves over
760 hours of user activity. The activity came from 73 unique users who were running
over 50 different programs which do not include system programs such as finger,
ping, spell, etc. Some programs are variations of the same code base (e.g., gpdf,
kpdf, xpdf) and were counted together as one program.
Program Lifetime
The objective of the user study is to identify application usage patterns. Program
lifetimes can be described almost exactly by keeping track of the fork and exit
process events plus the exec file system event. These events are assigned to the
medium rate channel and appropriately captured in hybrid mode. In most cases, a
program’s lifetime starts with a fork or exec call and ends with a corresponding exit
call. The lifetime has clear delimiters, though flagging it has a few complications. I
46
ParentChild
Time
Figure 4.2: Examples of parent and child process lifetimes.
stored the fork and exec events along with their timestamps in a hierarchical list of
parent-child processes. When parsing an exit event, if the matching process ID and
name is found in the process list, then the difference in timestamps gives the process
lifetime.
However, a program may also fork child threads, which may be responsible for
core code, and let the parent process exit while the child threads continue executing.
Figure 4.2 illustrates these situations. The latter case is typical of programs, such
as Firefox and Xscreensaver, which run an initialization step before child threads
run the program core. In some cases, flagging the lifetime may still be possible by
correlating the process names - parent and child processes often have similar names
- and parent process IDs. But in other cases, such as Xscreensaver, there is no
obvious correlation with its child threads because the children processes are named
according to the screensaver module. The name does not include any indication it
is a screensaver module. In addition, since the child thread is spawned after some
idle time, the child’s lifetime does not overlap with the parent’s lifetime and appears
discontinuously. Therefore, the trace data was parsed in two ways: 1) by manual
inspection to extract the most accurate program lifetimes and 2) by automatic parsing
to quickly identify the most popular execution contexts.
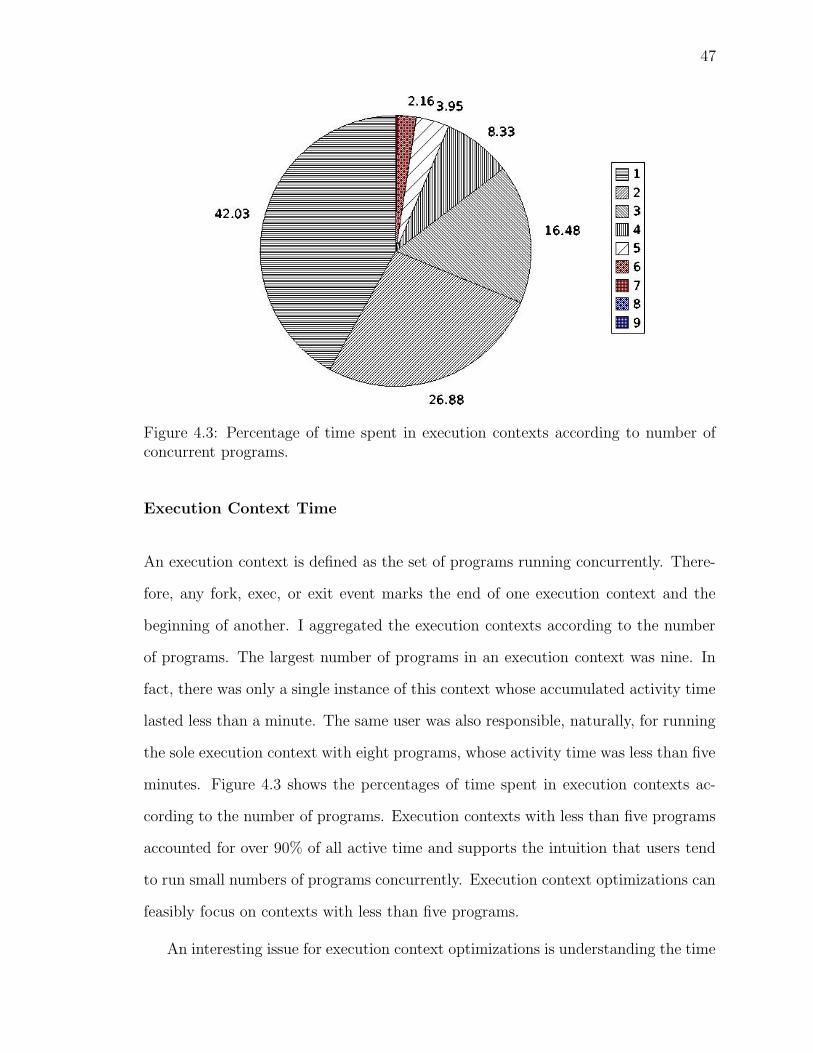
47
Figure 4.3: Percentage of time spent in execution contexts according to number ofconcurrent programs.
Execution Context Time
An execution context is defined as the set of programs running concurrently. There-
fore, any fork, exec, or exit event marks the end of one execution context and the
beginning of another. I aggregated the execution contexts according to the number
of programs. The largest number of programs in an execution context was nine. In
fact, there was only a single instance of this context whose accumulated activity time
lasted less than a minute. The same user was also responsible, naturally, for running
the sole execution context with eight programs, whose activity time was less than five
minutes. Figure 4.3 shows the percentages of time spent in execution contexts ac-
cording to the number of programs. Execution contexts with less than five programs
accounted for over 90% of all active time and supports the intuition that users tend
to run small numbers of programs concurrently. Execution context optimizations can
feasibly focus on contexts with less than five programs.
An interesting issue for execution context optimizations is understanding the time
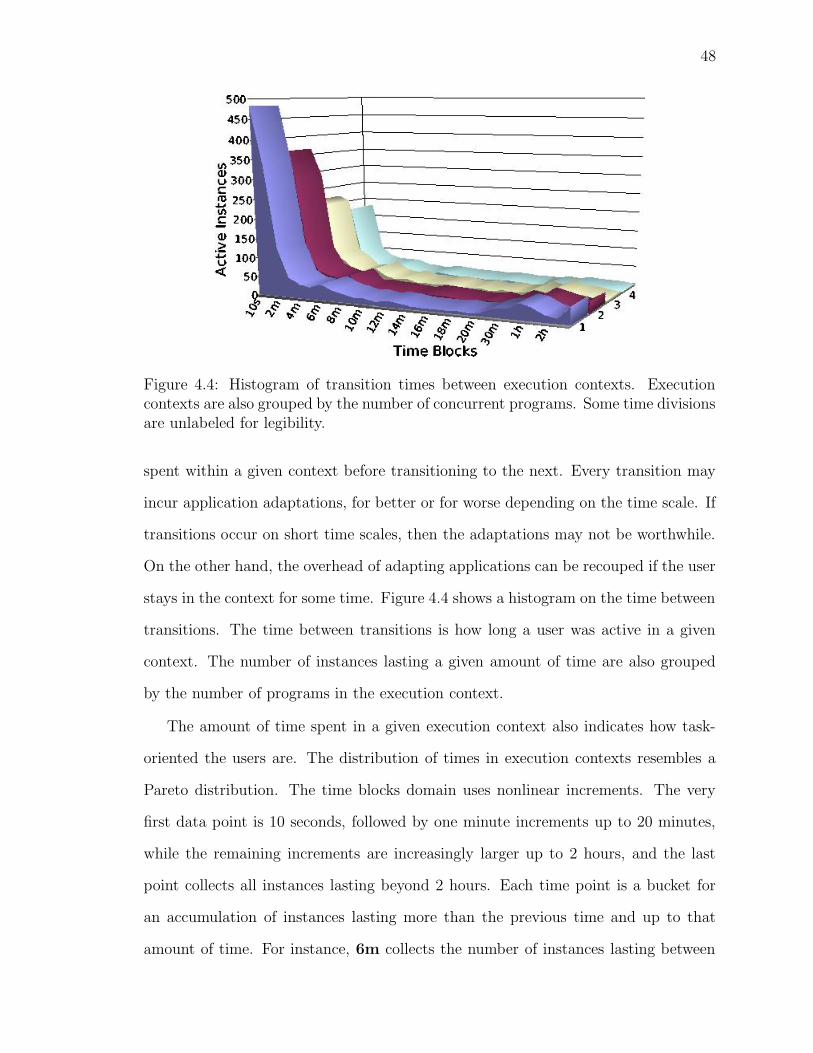
48
Figure 4.4: Histogram of transition times between execution contexts. Executioncontexts are also grouped by the number of concurrent programs. Some time divisionsare unlabeled for legibility.
spent within a given context before transitioning to the next. Every transition may
incur application adaptations, for better or for worse depending on the time scale. If
transitions occur on short time scales, then the adaptations may not be worthwhile.
On the other hand, the overhead of adapting applications can be recouped if the user
stays in the context for some time. Figure 4.4 shows a histogram on the time between
transitions. The time between transitions is how long a user was active in a given
context. The number of instances lasting a given amount of time are also grouped
by the number of programs in the execution context.
The amount of time spent in a given execution context also indicates how task-
oriented the users are. The distribution of times in execution contexts resembles a
Pareto distribution. The time blocks domain uses nonlinear increments. The very
first data point is 10 seconds, followed by one minute increments up to 20 minutes,
while the remaining increments are increasingly larger up to 2 hours, and the last
point collects all instances lasting beyond 2 hours. Each time point is a bucket for
an accumulation of instances lasting more than the previous time and up to that
amount of time. For instance, 6m collects the number of instances lasting between
49
five and six minutes. Since the right portion of the graph uses larger increments, it
appears as though compressed in from the right side. If linear increments were used
throughout, the curve would be a smooth distribution except for a bump at 6m. The
bump at 6m is notable because most of the activity sessions were, in fact, idle. The
screensaver program has a default idle threshold of five minutes before activating.
That is, these sessions were the result of transitioning to a new context and then
remaining idle for five minutes.
The 10s and 1m times also deserve mention. When ending a session, either
the user will manually quit each program or select the logout function where the OS
automatically kills all programs. The general effect is that the context transitions are
in quick succession and describe most of the instances in 10s. When starting a session,
either the user will launch programs in succession until their desired execution context
or the OS launches programs according to a login script. Programs starting execution
generally require more time than exiting, and thus account for many instances in
1m. If those two time points are ignored, then the average and median working
times are 21 and 7 minutes, respectively. Those numbers could be slightly higher
if the 6m time is also ignored. Overall, the results and distribution of active times
implies that users tend to transition quickly, but once reaching a steady state, remain
so for several minutes. Adapting applications on 15–30 second intervals should be
a reasonable tradeoff for adaptability and low amortized overhead. These findings
agree with the Odyssey platform’s settings [24].
Popular Applications
As mentioned above, the most common execution contexts contain less than five
programs. Analysis efforts can focus on such contexts. However, the number of
possible contexts with less than five programs is still considerably large. With n
50
available programs, consider the contexts which contain up to four programs:
4∑
i=1
(
n
i
)
(4.1)
The space of execution contexts for optimization can be pruned in two ways. Let us
first consider the most commonly used applications. These popular applications will
then guide the search for the most popular execution contexts.
The most popular applications are listed in Table 4.2 according to their active
time as a percentage of all traced activity. The symbols are a shorthand notation
to represent an application group. The web browser application, which encompases
several programs such as Firefox and Konqueror, was the most popular by far. A web
browser was active 62% of the time. The next most popular application was email at
34%. However, the growing popularity of web-based email may be shifting application
use towards web browsers. These popular applications portray the average user as
routinely gathering information, such as PDF files, over the web and using email.
Common work related tasks involve a text editor, matlab, DVI viewer, or openoffice.
Internet chat activity is similar to email in that it tends to run continuously as a
background program until needed. Aside from internet chat, no other recreational
applications such as games or multimedia were popular. The scarce activity may be
partly due to the lack of external speakers.
Popular Execution Contexts
The nine popular applications still present a large number of contexts to consider for
optimization. If n = 9, then Equation (4.1) gives 255 possible contexts. However,
just as with applications, some contexts are more popular than others. Users develop
work habits and settle upon favorite sets of programs to accomplish tasks. Besides,
even among popular applications, some combinations are very unlikely to occur. The
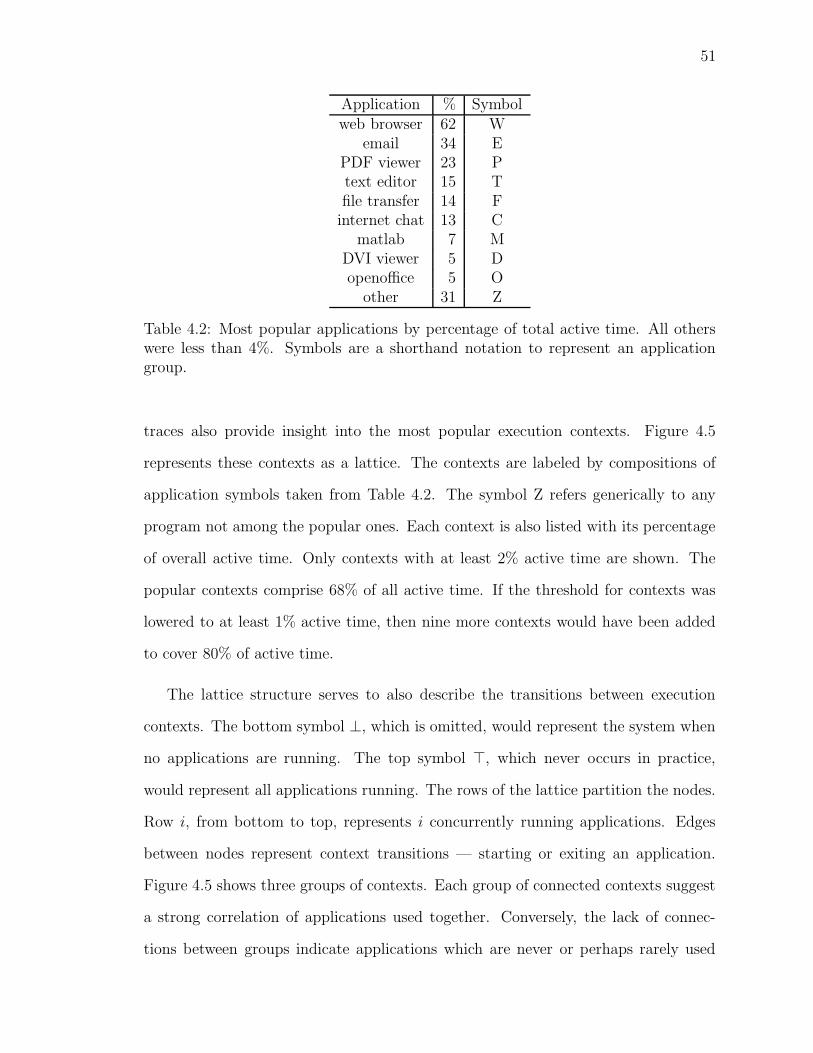
51
Application % Symbolweb browser 62 W
email 34 EPDF viewer 23 Ptext editor 15 Tfile transfer 14 Finternet chat 13 C
matlab 7 MDVI viewer 5 Dopenoffice 5 O
other 31 Z
Table 4.2: Most popular applications by percentage of total active time. All otherswere less than 4%. Symbols are a shorthand notation to represent an applicationgroup.
traces also provide insight into the most popular execution contexts. Figure 4.5
represents these contexts as a lattice. The contexts are labeled by compositions of
application symbols taken from Table 4.2. The symbol Z refers generically to any
program not among the popular ones. Each context is also listed with its percentage
of overall active time. Only contexts with at least 2% active time are shown. The
popular contexts comprise 68% of all active time. If the threshold for contexts was
lowered to at least 1% active time, then nine more contexts would have been added
to cover 80% of active time.
The lattice structure serves to also describe the transitions between execution
contexts. The bottom symbol ⊥, which is omitted, would represent the system when
no applications are running. The top symbol >, which never occurs in practice,
would represent all applications running. The rows of the lattice partition the nodes.
Row i, from bottom to top, represents i concurrently running applications. Edges
between nodes represent context transitions — starting or exiting an application.
Figure 4.5 shows three groups of contexts. Each group of connected contexts suggest
a strong correlation of applications used together. Conversely, the lack of connec-
tions between groups indicate applications which are never or perhaps rarely used
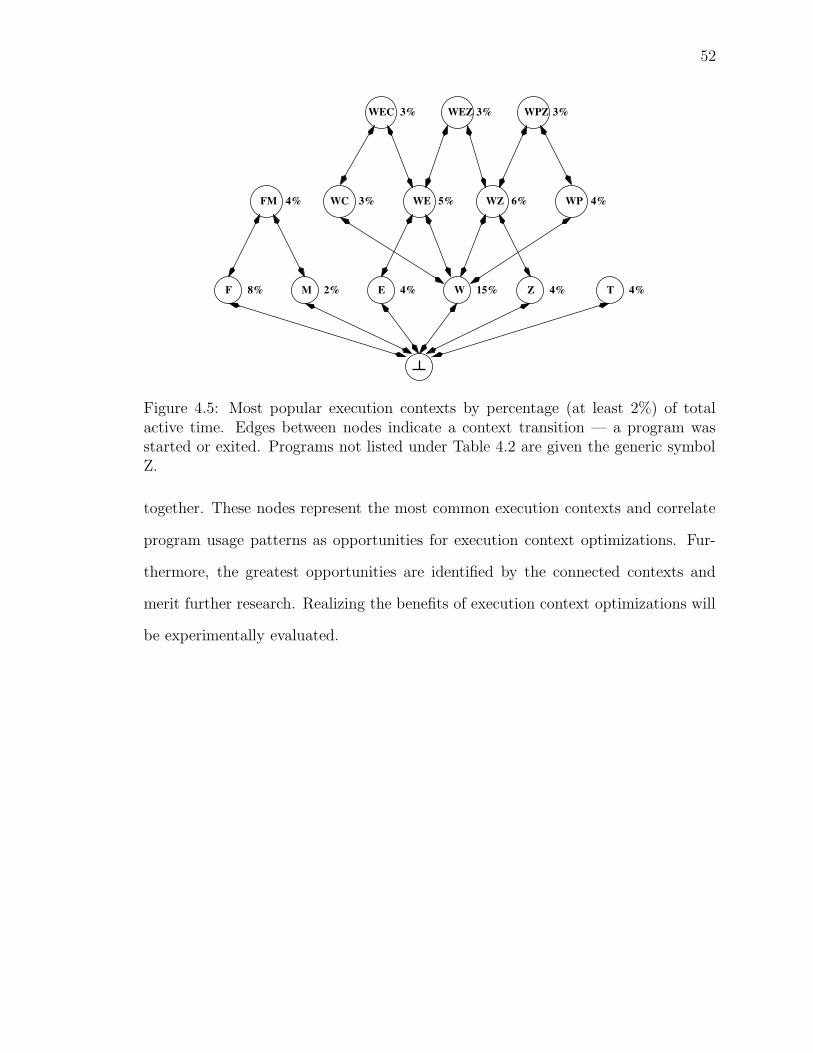
52
WZWE WP
TZWE
WCFM
MF
WEC WEZ WPZ3% 3% 3%
4% 3% 5% 6% 4%
4%4%15%4%2%8%
Figure 4.5: Most popular execution contexts by percentage (at least 2%) of totalactive time. Edges between nodes indicate a context transition — a program wasstarted or exited. Programs not listed under Table 4.2 are given the generic symbolZ.
together. These nodes represent the most common execution contexts and correlate
program usage patterns as opportunities for execution context optimizations. Fur-
thermore, the greatest opportunities are identified by the connected contexts and
merit further research. Realizing the benefits of execution context optimizations will
be experimentally evaluated.
53
Chapter 5
Evaluation Infrastructure
The evaluation infrastructure consists of several hardware and software pieces to
automatically control the measurement recording and experiment test sessions. The
basic idea is to run the baseline and optimized versions of the test programs while
measuring the disk energy. The tests must be repeatable to assure a fair comparison.
However, testing interactive applications is particularly challenging since interactive
implies human intervention. While a human could follow a script of actions, the
precision and timing would be too poor to reliably repeat the tests. A robot who
could emulate a human would be more suitable. Indeed, I will describe such a robot
which greatly improved the precision of the experiments. Figure 5.1 depicts the entire
measurement infrastructure.
5.1 Hardware
The host computer has an AMD Athlon processor operating at 1.2 GHz with a
default workstation installation of Red Hat 9 Linux. The target disk is connected via
Advanced Technology Attachment (ATA). The connector uses an adaptor to attach
the computer’s power supply plug into the disk. Experiments were conducted on
two 2.5” disks, commonly referred to as laptop class disks: Fujitsu MHK2060AT and
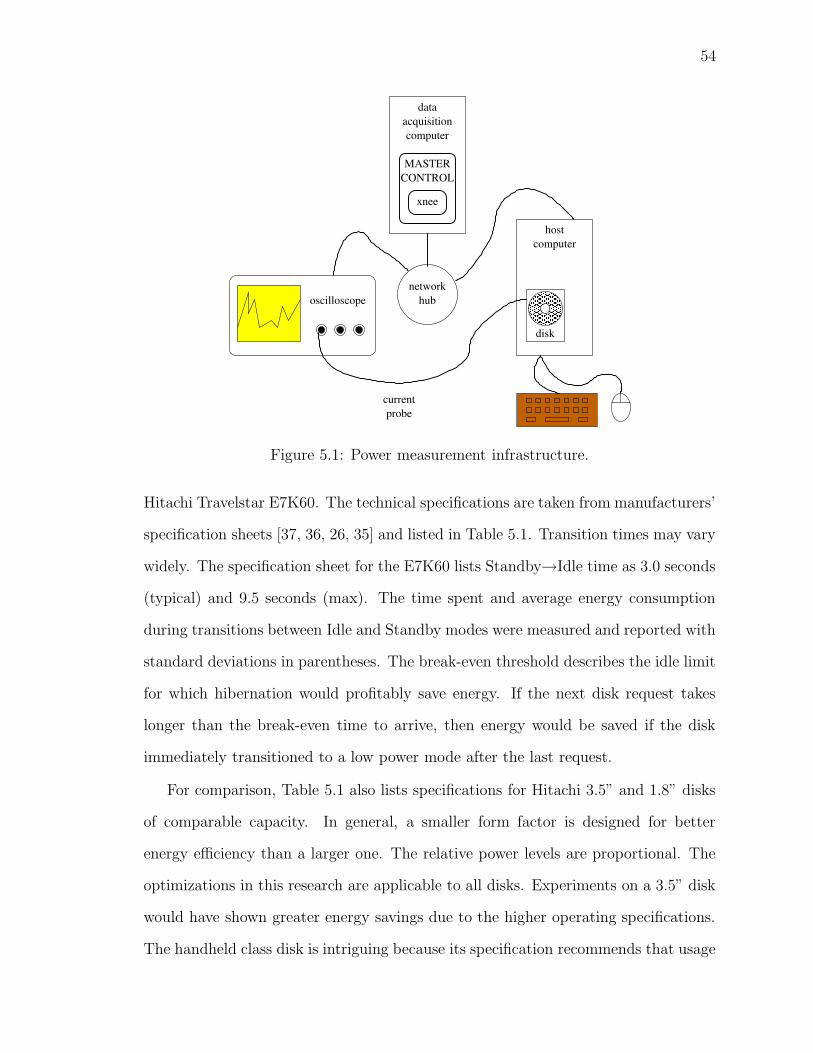
54
hostcomputer
�������������������������
�������������������������
disk
oscilloscope
currentprobe
networkhub
dataacquisitioncomputer
xnee
MASTERCONTROL
Figure 5.1: Power measurement infrastructure.
Hitachi Travelstar E7K60. The technical specifications are taken from manufacturers’
specification sheets [37, 36, 26, 35] and listed in Table 5.1. Transition times may vary
widely. The specification sheet for the E7K60 lists Standby→Idle time as 3.0 seconds
(typical) and 9.5 seconds (max). The time spent and average energy consumption
during transitions between Idle and Standby modes were measured and reported with
standard deviations in parentheses. The break-even threshold describes the idle limit
for which hibernation would profitably save energy. If the next disk request takes
longer than the break-even time to arrive, then energy would be saved if the disk
immediately transitioned to a low power mode after the last request.
For comparison, Table 5.1 also lists specifications for Hitachi 3.5” and 1.8” disks
of comparable capacity. In general, a smaller form factor is designed for better
energy efficiency than a larger one. The relative power levels are proportional. The
optimizations in this research are applicable to all disks. Experiments on a 3.5” disk
would have shown greater energy savings due to the higher operating specifications.
The handheld class disk is intriguing because its specification recommends that usage
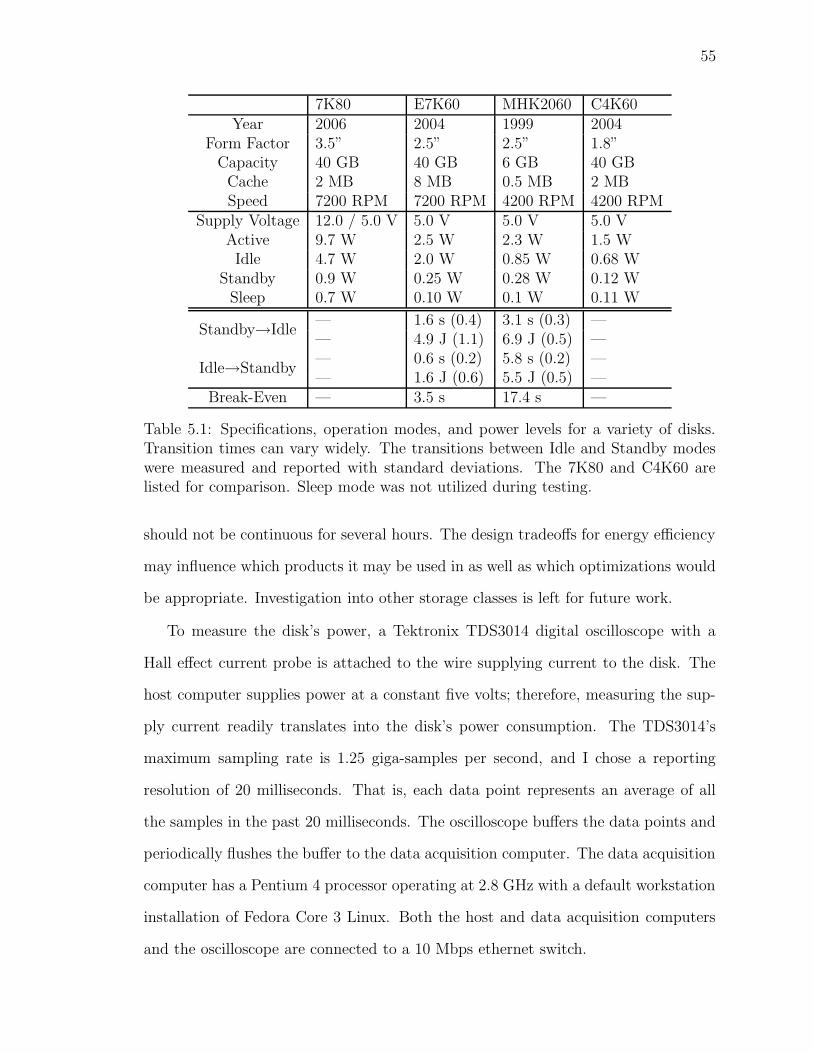
55
7K80 E7K60 MHK2060 C4K60Year 2006 2004 1999 2004
Form Factor 3.5” 2.5” 2.5” 1.8”Capacity 40 GB 40 GB 6 GB 40 GBCache 2 MB 8 MB 0.5 MB 2 MBSpeed 7200 RPM 7200 RPM 4200 RPM 4200 RPM
Supply Voltage 12.0 / 5.0 V 5.0 V 5.0 V 5.0 VActive 9.7 W 2.5 W 2.3 W 1.5 WIdle 4.7 W 2.0 W 0.85 W 0.68 W
Standby 0.9 W 0.25 W 0.28 W 0.12 WSleep 0.7 W 0.10 W 0.1 W 0.11 W
Standby→Idle— 1.6 s (0.4) 3.1 s (0.3) —— 4.9 J (1.1) 6.9 J (0.5) —
Idle→Standby— 0.6 s (0.2) 5.8 s (0.2) —— 1.6 J (0.6) 5.5 J (0.5) —
Break-Even — 3.5 s 17.4 s —
Table 5.1: Specifications, operation modes, and power levels for a variety of disks.Transition times can vary widely. The transitions between Idle and Standby modeswere measured and reported with standard deviations. The 7K80 and C4K60 arelisted for comparison. Sleep mode was not utilized during testing.
should not be continuous for several hours. The design tradeoffs for energy efficiency
may influence which products it may be used in as well as which optimizations would
be appropriate. Investigation into other storage classes is left for future work.
To measure the disk’s power, a Tektronix TDS3014 digital oscilloscope with a
Hall effect current probe is attached to the wire supplying current to the disk. The
host computer supplies power at a constant five volts; therefore, measuring the sup-
ply current readily translates into the disk’s power consumption. The TDS3014’s
maximum sampling rate is 1.25 giga-samples per second, and I chose a reporting
resolution of 20 milliseconds. That is, each data point represents an average of all
the samples in the past 20 milliseconds. The oscilloscope buffers the data points and
periodically flushes the buffer to the data acquisition computer. The data acquisition
computer has a Pentium 4 processor operating at 2.8 GHz with a default workstation
installation of Fedora Core 3 Linux. Both the host and data acquisition computers
and the oscilloscope are connected to a 10 Mbps ethernet switch.
56
5.2 Software
The experiment test programs include several interactive programs such as a web
browser or text editor. A key aspect for these programs is user interaction such as
clicking on a link or typing a web address. User interaction is difficult to reliably
repeat during experiment testing as noted by Crowley [16]. One solution is to have a
robot mechanically perform the user interactions according to a timing-precise script.
In the X Window System, each user interaction (mouse clicks or keyboard presses)
corresponds to an X11 event processed by the X Server. The X Window System
contains extensions, Record and XTEST [81, 22], which provide hooks to record and
replay all keyboard and mouse events. A complete testing software solution exists
in GNU Xnee. Xnee is described by its author as a robot and suitable as a testing
infrastructure [65]. Xnee is designed to record and replay X11 events remotely to
an X Server. The replayed events appear to the X Server as though coming from
the physical keyboard and mouse. For that reason, Xnee is dubbed “Xnee is Not an
Event Emulator”.
Xnee uses a precision of one millisecond to record events with a time stamp. As
a robot, Xnee can be expected to consistently replay events within a margin of ten
milliseconds — the default length of a time slice. Such precision is useful for timing
sensitive programs, but two issues reduce the usefulness, particularly for interac-
tive programs. First, programs which communicate over the network are subject to
latency which varies at any given moment. A repeated experiment will encounter dif-
ferent latencies and must allow for a range of latency delay between program events.
For example, the act of typing a website address into a web browser comprises several
keyboard events with very little delay, but waiting for the webpage to load may last
on the order of tens of seconds. The next user action should wait for an amount of
time on the upper end of the latency delay range. High-level program events, such as
loading a web page or advancing to the next page of a document, require a settling
57
time before the next program event. Second, processor response also has a variable
delay due to the system load of background processes, overhead, disk latency, cache,
and network traffic. The exact state of the system, in memory and cache, when
replaying will be different than while recording. For these reasons, I experimentally
found that when recording, high-level program events should allow a margin of at
least five seconds from the end of the previous event before continuing.
Xnee has a synchronization feature which attempts to flexibly resolve the latency
delay issues. The X11 protocol contains many response events which indicate graph-
ical events with no direct causal event. For example, starting a web browser will
require several seconds of loading before a window will appear. The window ap-
pearing is not directly related to the series of preceding keystrokes. The window
will generate a response event. Xnee can record these events and use them dur-
ing replay as synchronization markers. Xnee will try to match response events with
recorded events and adjust the timing of future replay events accordingly. However,
this feature was not yet robust enough for my purposes. After recording, the event
timings may be fine-tuned as necessary. An actual experiment session script is listed
in Appendix A. An understanding of Xnee’s event encodings will reveal the account
password I used at the time!
The oscilloscope may be remotely controlled from another computer. The basic
operations are connecting to the oscilloscope, downloading data to a file, disconnect-
ing, and closing the log file. I wrote a master control program running on the data
acquisition computer to coordinate logging of the oscilloscope and Xnee’s experiment
sessions. I also wrote a client program running on the host computer to indicate when
it is ready. The control program begins logging the oscilloscope, then runs Xnee with
the next session script. Each session script corresponds to an experiment run. When
the session script has finished, the host computer signals the experiment has ended,
and the control program stops logging the oscilloscope. The host computer will then

58
flush its disk, file, and memory caches before signaling ready again.
59
Chapter 6
Experiments
Using the file descriptor attributes of Section 3.3.2, I analyzed and categorized eight
commonly used programs. The programs are listed in Table 6.1. The symbols are a
shorthand notation to represent the programs in later figures. At the time I inves-
tigated OpenOffice, it was still at version 1 and suitable only for SYNC SEND. With
version 2, I suspect that it may be able to use SYNC RECV because the auto-save
feature was given a passive option. That is, in version 1, when the auto-save timer
expired, OpenOffice would open a dialog box actively asking the user whether to
save. In version 2, OpenOffice has the option of passively saving a backup copy of
the document without asking the user, just as in programs like Emacs. All programs
are written in C or C++ and passed through the LLVM compiler infrastructure as
outlined in Section 3.4. OpenOffice and Firefox also have optional modules written
in Java; they were disabled.
To test the interactions between optimized programs, I mixed the programs into
ten combinations of two or three programs. Each combination represents an execution
context. I designed the contexts to cover a range of interesting combinations. For
example, a web browser and PDF viewer are common together, but a PDF viewer
and video player are probably unlikely together. The execution contexts are listed in
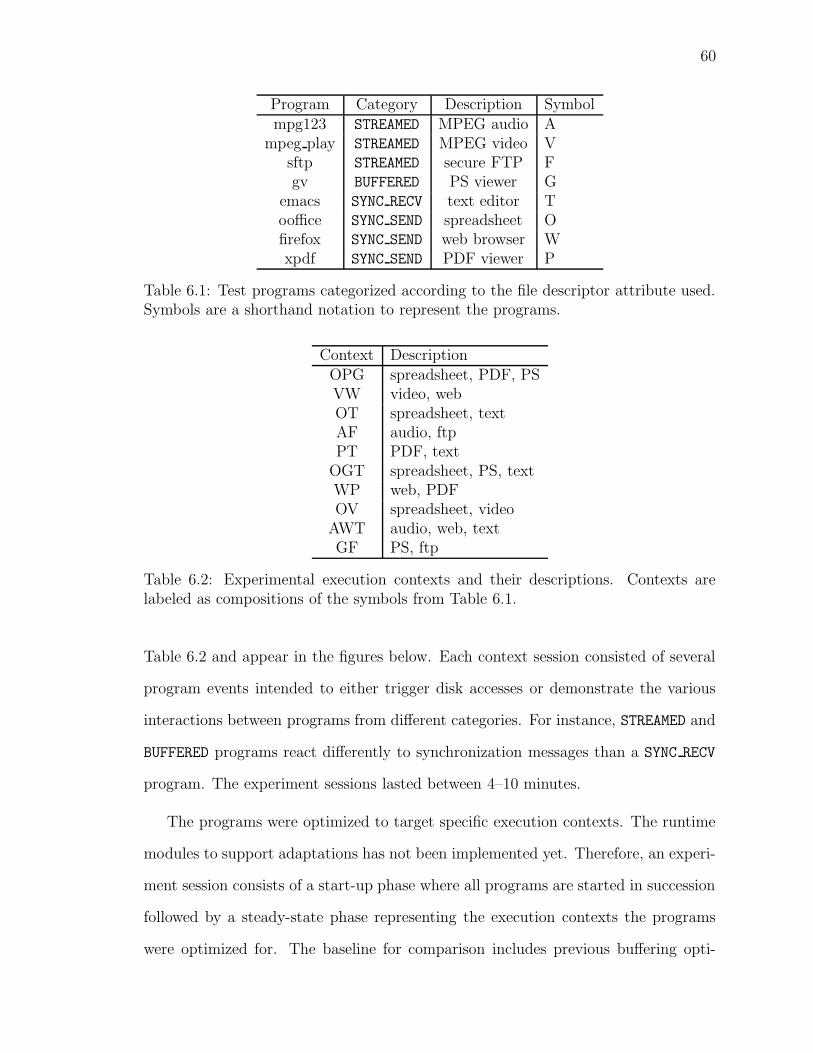
60
Program Category Description Symbolmpg123 STREAMED MPEG audio A
mpeg play STREAMED MPEG video Vsftp STREAMED secure FTP Fgv BUFFERED PS viewer G
emacs SYNC RECV text editor Tooffice SYNC SEND spreadsheet Ofirefox SYNC SEND web browser Wxpdf SYNC SEND PDF viewer P
Table 6.1: Test programs categorized according to the file descriptor attribute used.Symbols are a shorthand notation to represent the programs.
Context DescriptionOPG spreadsheet, PDF, PSVW video, webOT spreadsheet, textAF audio, ftpPT PDF, text
OGT spreadsheet, PS, textWP web, PDFOV spreadsheet, video
AWT audio, web, textGF PS, ftp
Table 6.2: Experimental execution contexts and their descriptions. Contexts arelabeled as compositions of the symbols from Table 6.1.
Table 6.2 and appear in the figures below. Each context session consisted of several
program events intended to either trigger disk accesses or demonstrate the various
interactions between programs from different categories. For instance, STREAMED and
BUFFERED programs react differently to synchronization messages than a SYNC RECV
program. The experiment sessions lasted between 4–10 minutes.
The programs were optimized to target specific execution contexts. The runtime
modules to support adaptations has not been implemented yet. Therefore, an experi-
ment session consists of a start-up phase where all programs are started in succession
followed by a steady-state phase representing the execution contexts the programs
were optimized for. The baseline for comparison includes previous buffering opti-
61
mizations developed for the uniprogramming model [33]. There are two more topics
to familiarize with before getting to the results. I will discuss high-level program
events and the effects of write caching. After analyzing the results, I developed a
model to describe the average expected energy savings from the optimizations.
6.1 Write Caching
The OS maintains a disk cache per open file via its virtual file system buffer cache.
However the default maximum size at 128 KB is an order of magnitude smaller than
the disk’s onboard cache. For read performance, such a relatively small cache has
negligible impact in our experiments. Any supported write cache policies will depend
upon the file system type. The default, Second Extended File System [11], supports
asynchronous and synchronous writes which are analogous to the disk cache’s write-
back and write-through policies. Asynchronous writes improve performance and en-
ergy in the exact same style as the disk cache’s write-back policy. In continuing with
our efforts to test our techniques independent of write-back caches and asynchronous
writes, we set the file system to use synchronous writes.
Many disks have an onboard cache for data while reserving a small portion for
control instructions. The data portion is further divided between reads and writes,
each with their own page replacement policies. The impact of the read cache is
insignificant on the file buffering optimization mainly because the file buffers are
always larger. If not, then the system is likely low on available memory and file buffers
should be disabled. With file buffers, disk accesses are clustered and sequential such
that the disk’s read cache will not experience any locality hits.
The write cache is a different story. Write caches often use the write-back policy
which allows for asynchronous writes and offers performance and energy benefits.
When the disk has received all data blocks into the write cache, it will report com-
62
pletion of the write command before actually writing the data to the physical disk.
Writing to disk occurs when a flush command is issued. A flush may be either explicit
from the host computer or implicit when the write cache is full and blocks must be
evicted. Data may be lost if there is a loss of power. In contrast, write caches may
use the write-through policy which forces synchronous writes. The disk will report
completion of the the write command only when all blocks have been written to the
physical disk. Data safety is ensured at the cost of performance.
6.2 Program Events
In all execution contexts, the recorded sessions followed the same pattern of launching
two or three programs until reaching the target execution context (considered steady
state behavior), performing actions to induce disk activity, then exiting all programs.
Some typical actions or program events include saving a file, loading a web page,
or scrolling to the next page of a document. Since we know the exact user actions
recorded, we can correlate the causal effects between program events and disk activity.
Figure 6.1 shows sample disk activity profiles from the OPG {ooffice, xpdf, gv}
session. The graphs show the measured current over time. The area under the curves
represent the total energy consumption. The experiment trace consists of starting all
three programs in succession. The dashed line indicates where the execution context
steady state begins. Thus, I will focus on the steady state portion of the graphs.
Figure 6.2 shows a zoomed view on the steady state execution after trimming
away the start-up phase. The graphs are overlaid with horizontal ranges indicating
when that program was running as the foreground application. The vertical markers
indicate program events which may lead to disk accesses. The first three events from
gv were advancing to the next page. The first event induced the buffer to refill while
the next two events were buffer hits and did not need to access the disk. The next
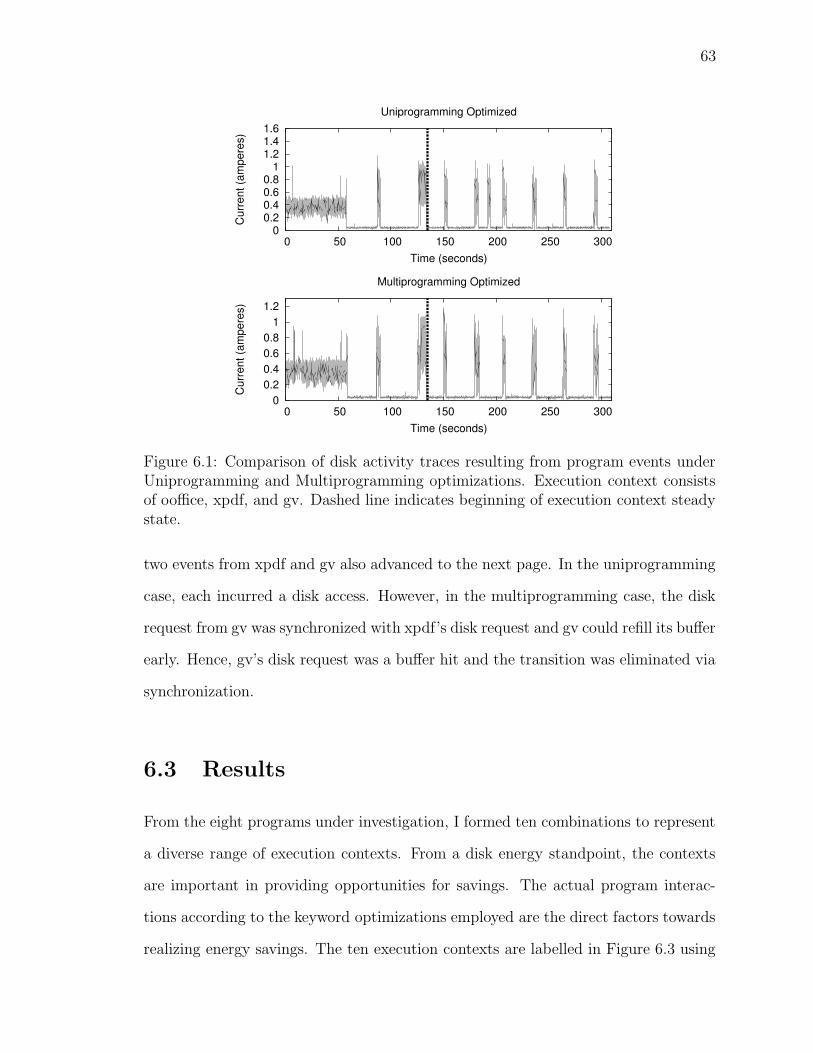
63
0 0.2 0.4 0.6 0.8
1 1.2 1.4 1.6
0 50 100 150 200 250 300C
urre
nt (a
mpe
res)
Time (seconds)
Uniprogramming Optimized
0 0.2 0.4 0.6 0.8
1 1.2
0 50 100 150 200 250 300
Cur
rent
(am
pere
s)
Time (seconds)
Multiprogramming Optimized
Figure 6.1: Comparison of disk activity traces resulting from program events underUniprogramming and Multiprogramming optimizations. Execution context consistsof ooffice, xpdf, and gv. Dashed line indicates beginning of execution context steadystate.
two events from xpdf and gv also advanced to the next page. In the uniprogramming
case, each incurred a disk access. However, in the multiprogramming case, the disk
request from gv was synchronized with xpdf’s disk request and gv could refill its buffer
early. Hence, gv’s disk request was a buffer hit and the transition was eliminated via
synchronization.
6.3 Results
From the eight programs under investigation, I formed ten combinations to represent
a diverse range of execution contexts. From a disk energy standpoint, the contexts
are important in providing opportunities for savings. The actual program interac-
tions according to the keyword optimizations employed are the direct factors towards
realizing energy savings. The ten execution contexts are labelled in Figure 6.3 using
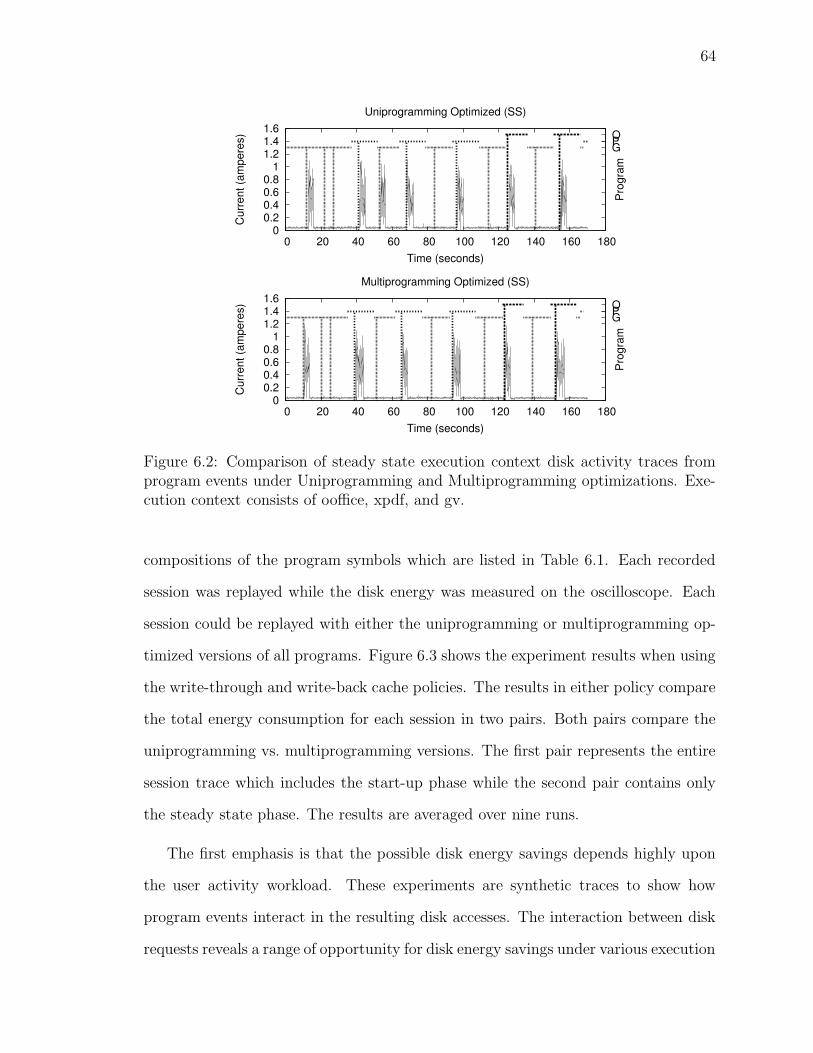
64
0 0.2 0.4 0.6 0.8
1 1.2 1.4 1.6
0 20 40 60 80 100 120 140 160 180
OPG
Cur
rent
(am
pere
s)
Pro
gram
Time (seconds)
Uniprogramming Optimized (SS)
0 0.2 0.4 0.6 0.8
1 1.2 1.4 1.6
0 20 40 60 80 100 120 140 160 180
OPG
Cur
rent
(am
pere
s)
Pro
gram
Time (seconds)
Multiprogramming Optimized (SS)
Figure 6.2: Comparison of steady state execution context disk activity traces fromprogram events under Uniprogramming and Multiprogramming optimizations. Exe-cution context consists of ooffice, xpdf, and gv.
compositions of the program symbols which are listed in Table 6.1. Each recorded
session was replayed while the disk energy was measured on the oscilloscope. Each
session could be replayed with either the uniprogramming or multiprogramming op-
timized versions of all programs. Figure 6.3 shows the experiment results when using
the write-through and write-back cache policies. The results in either policy compare
the total energy consumption for each session in two pairs. Both pairs compare the
uniprogramming vs. multiprogramming versions. The first pair represents the entire
session trace which includes the start-up phase while the second pair contains only
the steady state phase. The results are averaged over nine runs.
The first emphasis is that the possible disk energy savings depends highly upon
the user activity workload. These experiments are synthetic traces to show how
program events interact in the resulting disk accesses. The interaction between disk
requests reveals a range of opportunity for disk energy savings under various execution
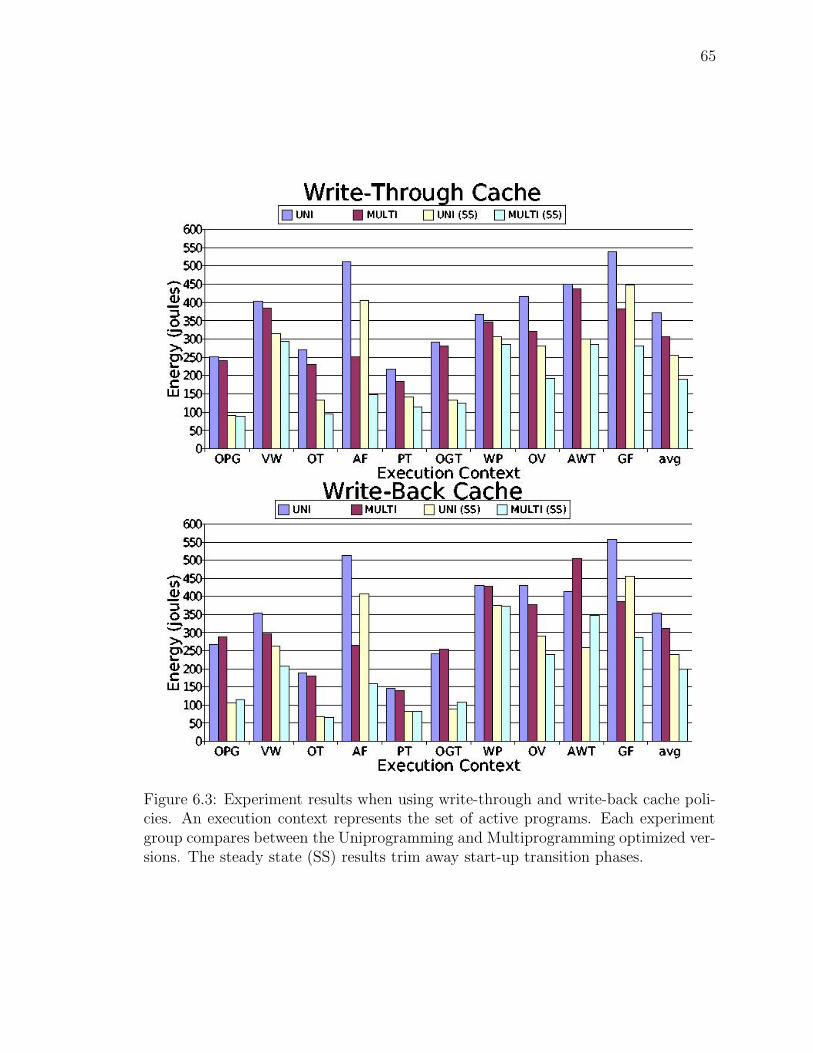
65
Figure 6.3: Experiment results when using write-through and write-back cache poli-cies. An execution context represents the set of active programs. Each experimentgroup compares between the Uniprogramming and Multiprogramming optimized ver-sions. The steady state (SS) results trim away start-up transition phases.
66
contexts. More representative traces would require a more detailed user study and is
left for future work.
The experiments show that with mostly interactive programs such as WP, the
opportunity for energy savings is small. Conversely, streaming programs such as AF
offer plenty of opportunity for savings. Some contexts have moderate opportunity
for savings, such as AWT, though the actual activity did not demonstrate all of
the potential savings. I specifically tried maintaining a balance among the choice
of experiments to span the range of activity. Using the write-through policy, the
average savings was 21% with a range of 3% to 63%. Using the write-back policy,
the average savings was 8% with a range of -33% to 61%.
These optimizations performed well in reducing disk energy consumption yet with
negligible performance costs. The most harmful cases occur when extra disk accesses
are triggered via prefetch and the data is not used, when the disk is repeatedly
accessed at short intervals, or when small writes trigger early accesses. The last case
is harmful only when using a write-back policy. An adversary could perform such
activity, but the user study indicates that it is not typical behavior. User activity
does follow a Pareto or bursty distribution. In all experiment runs, the overhead
of synchronization communication between programs delayed total session execution
times by no more than 1%. For real-time programs with buffering, just-in-time
wakeup is necessary to maintain performance; previous optimizations are insufficient.
Overall, these optimizations are beneficial for saving disk energy with insignificant
performance penalty.
With the write-back policy, there were three sessions {OPG, OGT, AWT} in
which these techniques performed poorly. Those three sessions all involved small
writes, one of the harmful cases described above. There were three other sessions
{OT, PT, WP} with small writes, but the results showed little or no appreciable
energy savings. Of the remaining four sessions {VW, AF, OV, GF}, the results
67
are similar to the write-through policy. The negative results under the write-back
policy are unsurprising given that the multiprogramming optimization techniques
perform a similar write clustering effect. The optimizations, in effect, perform a
synchronous write operation while the write-back policy waits until necessary to flush
the cache. As part of future work, identifying execution contexts with potentially
harmful effects from multiprogramming optimizations may lead to a runtime heuristic
which selectively disables optimizations.
6.4 Energy Model
The optimizations save disk energy via two forms of clustered disk accesses. A file
buffer clusters accesses from the same program while synchronization clusters accesses
from multiple programs. Both forms appear identical to the physical disk and are
modeled as operational power modes over time. Figure 6.4 illustrates the disk activity
of a typical access. Intuitively, the energy savings comes from eliminating wakeup
(E↗) and hibernate (E↘) transitions and combining the active periods together. The
energy saved is proportional to the transition costs of a given disk. Laptop class and
smaller disks are designed for fast transitions with lower energy costs then desktop
or server class disks. The transition costs are
Etransition = E↗ + E↘
The baseline energy consumption with M accesses is
Ebase = M × Etransition + Eactive + Estandby
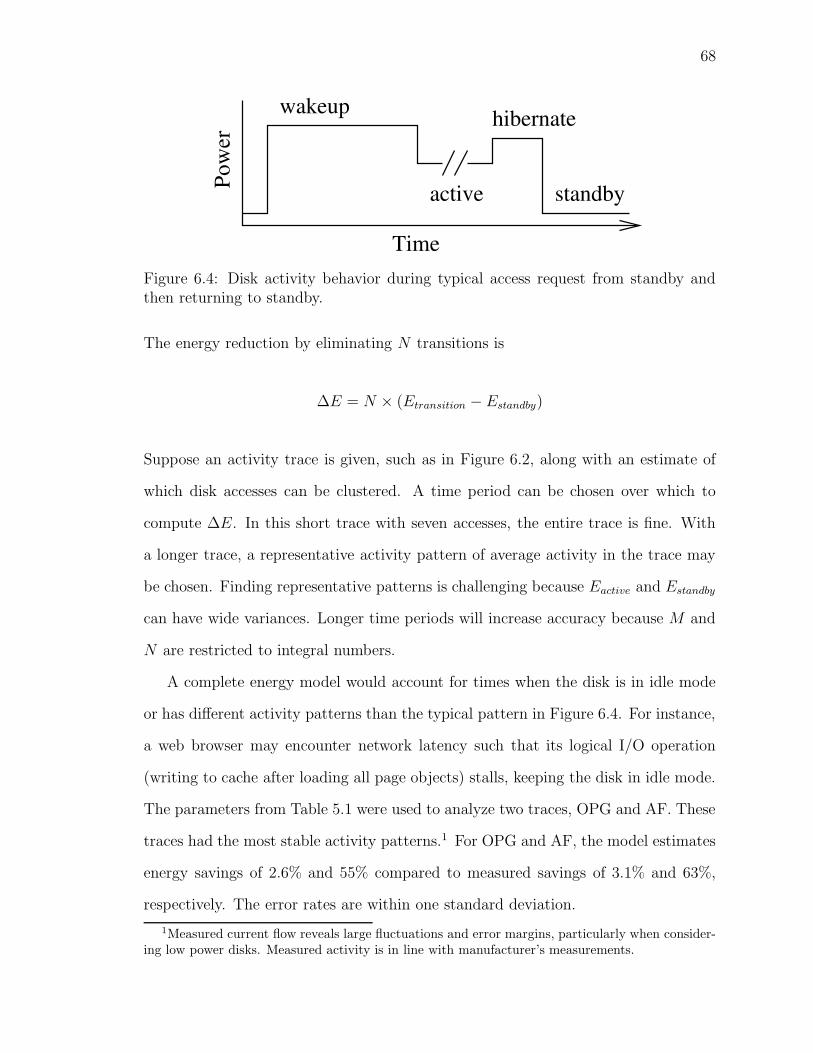
68
Time
wakeup
Pow
erstandby
hibernate
active
Figure 6.4: Disk activity behavior during typical access request from standby andthen returning to standby.
The energy reduction by eliminating N transitions is
∆E = N × (Etransition − Estandby)
Suppose an activity trace is given, such as in Figure 6.2, along with an estimate of
which disk accesses can be clustered. A time period can be chosen over which to
compute ∆E. In this short trace with seven accesses, the entire trace is fine. With
a longer trace, a representative activity pattern of average activity in the trace may
be chosen. Finding representative patterns is challenging because Eactive and Estandby
can have wide variances. Longer time periods will increase accuracy because M and
N are restricted to integral numbers.
A complete energy model would account for times when the disk is in idle mode
or has different activity patterns than the typical pattern in Figure 6.4. For instance,
a web browser may encounter network latency such that its logical I/O operation
(writing to cache after loading all page objects) stalls, keeping the disk in idle mode.
The parameters from Table 5.1 were used to analyze two traces, OPG and AF. These
traces had the most stable activity patterns.1 For OPG and AF, the model estimates
energy savings of 2.6% and 55% compared to measured savings of 3.1% and 63%,
respectively. The error rates are within one standard deviation.
1Measured current flow reveals large fluctuations and error margins, particularly when consider-ing low power disks. Measured activity is in line with manufacturer’s measurements.
69
Lastly, I used the energy model to estimate energy savings of the user study
traces. Only some of the experiment contexts can be compared with the user study
contexts. Referring back to Figure 4.5, the contexts F and FM are characterized by
streaming applications and are similar to AF from my experiments. The opportunity
for energy savings from streaming applications is high and limited mainly by the
buffer size. The experiments with AF used moderate buffer sizes — not so large
to buffer the entire file and not so small that the disk must immediately wakeup
to refill the buffer. The optimized AF was able to save 63% energy. The contexts
WP and WPZ of Figure 4.5 are characterized as a mix of reading PDF documents
and web pages. They correspond most directly to WP from our experiments where
the activity consisted of visiting a web page, reading an eight page PDF document
(scrolling at regular intervals) linked from that web page, and visiting another web
page. This context carries little opportunity for synchronizing disk requests but was
able to cluster two accesses into one and save 7% energy. The four contexts {F,
FM, WP, WPZ} accounted for 21% of the active time, and if optimized, may have
saved about 9% energy over the 760 hours. If the workloads of emerging mobile
systems include more multimedia applications, they may find greater advantage from
streaming execution context optimizations.

70
71
Chapter 7
Summary and Future Work
Execution context information is important in maximizing disk energy savings in
multiprogramming environments. Uniprogramming models for energy management
optimization are insufficient when dealing with shared resources. I described an op-
timization framework designed for multiprogramming models of execution. For disk
power management, I introduced language extensions in the form of file descrip-
tor attributes. These attributes characterize the file access behaviors of programs,
and provide information for a compiler to implement three optimizations. The opti-
mizations include an inter-process communication framework for synchronizing disk
requests, file-level buffers to pre-fetch and cluster disk accesses, and runtime appli-
cation adaptations to transitions in execution context.
The execution context model was formulated as states in a finite state machine.
Transitions between states correspond to starting or exiting a program. Execution
contexts also encapsulate information about expected program interactions in disk
requests. Although an exponential number of execution contexts exists (2n − 1),
optimization efforts may feasibly focus on only a small subset. I used LTTng to
conduct a user study and collected over 760 hours of active traces. The user study
investigated the program usage patterns of computer science graduate students and
72
revealed that 94% of all activity occurred in execution contexts with fewer than five
programs. Furthermore, the top 14 most popular contexts accounted for 68% of all
activity.
Experiments with eight programs in ten execution contexts showed a range of
disk energy savings. Actual energy savings will be capped by the potential opportu-
nity available, and the experiments demonstrated a range of low to high opportunity.
The optimizations are applicable to both streaming and interactive applications. I
developed a measurement infrastructure with Xnee which can reliably repeat exper-
iments on interactive applications. Using a write-through cache policy, execution
context optimizations saved 3% to 63% disk energy with an average of 21%. Using a
write-back cache policy, the savings ranged from -33% to 61% with an average of 8%.
Further analysis to identify execution contexts where the optimizations are harmful
may enable runtime heuristics to selectively disable optimizations based upon the
execution context. In all cases, the runtime overhead from the optimizations resulted
in less than 1% performance delay.
Lastly, I also formulated a simple energy model to estimate savings based on
a disk’s specifications, a disk access profile, and the expected interactions between
programs’ disk requests. The model helps to gauge which programs and execution
contexts should be targeted for optimization. Applying the model to the user study
estimates at least 9% disk energy could have been saved if the users were running
optimized programs. This research has investigated real user workloads and the
associated opportunities and benefits for disk energy savings via execution context
optimizations.
There are several areas for further research. A more comprehensive user study
would collect activity traces with disk events and evaluate the disk energy consump-
tion over a measurement infrastructure such as the one I developed. Additionally,
activity traces should capture user level program events to correlate with correspond-
73
ing disk events. Evaluating activity traces will also require extending the existing
optimizations to a wider range of programs. Analyzing more programs may lead to
new file descriptor attributes for further characterizing disk access interaction. Ana-
lyzing program interactions for accessing other resources besides the disk is another
avenue of research.
Execution context optimizations should be further investigated under different
cache policies. The write-back policy is a competing technique for saving energy.
For small working set sizes which fit in cache, the optimizations may be disabled,
but larger working set sizes merit further analysis. An alternative idea to consider
is adjusting the disk cache partition between read and write. With execution con-
text optimizations out-performing the disk read cache, perhaps the disk might allow
systems to specify a configuration where a greater portion of the cache is allocated
for writes. In this way, file level buffering may work cooperatively with disk caching.
Another optimization to explore is introducing a file level write buffer. Analogous to
the existing file level read buffer, it may perform more efficient clustering of writes
on a file level if data blocks are stored contiguously on disk.
Developing a complete, optimizing compiler infrastructure is a large task for future
work. An infrastructure to support development of simple inter-procedural analysis
will enable new areas for optimization research. I have focused on the disk as a
system resource, but other resources should be explored. Besides power management
techniques, execution context optimizations may also target performance aspects by
clustering computation or working sets.
Research is also needed to compare OS approaches for clustering as well as how
the OS may complement the techniques described here. Indeed, the runtime parts
of the optimization framework may be more efficiently implemented as OS services
to which applications register for. The file descriptor attributes will still provide
compiler-directed hints, which can be more precise, to the OS about future disk

74
requests while the OS manages the disk power. The execution context optimization
framework has several parts which can be implemented in various layers between
the OS, compiler, and runtime system, and the balance and tradeoffs for where to
implement them should be investigated.
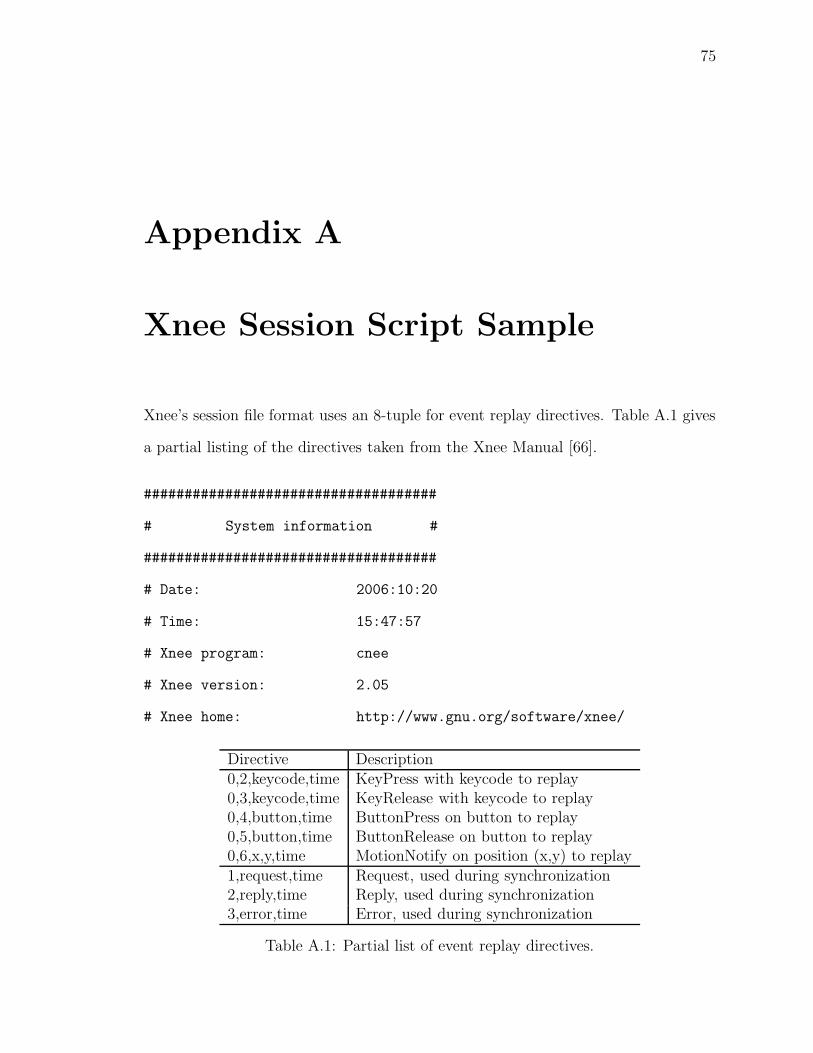
75
Appendix A
Xnee Session Script Sample
Xnee’s session file format uses an 8-tuple for event replay directives. Table A.1 gives
a partial listing of the directives taken from the Xnee Manual [66].
####################################
# System information #
####################################
# Date: 2006:10:20
# Time: 15:47:57
# Xnee program: cnee
# Xnee version: 2.05
# Xnee home: http://www.gnu.org/software/xnee/
Directive Description0,2,keycode,time KeyPress with keycode to replay0,3,keycode,time KeyRelease with keycode to replay0,4,button,time ButtonPress on button to replay0,5,button,time ButtonRelease on button to replay0,6,x,y,time MotionNotify on position (x,y) to replay1,request,time Request, used during synchronization2,reply,time Reply, used during synchronization3,error,time Error, used during synchronization
Table A.1: Partial list of event replay directives.
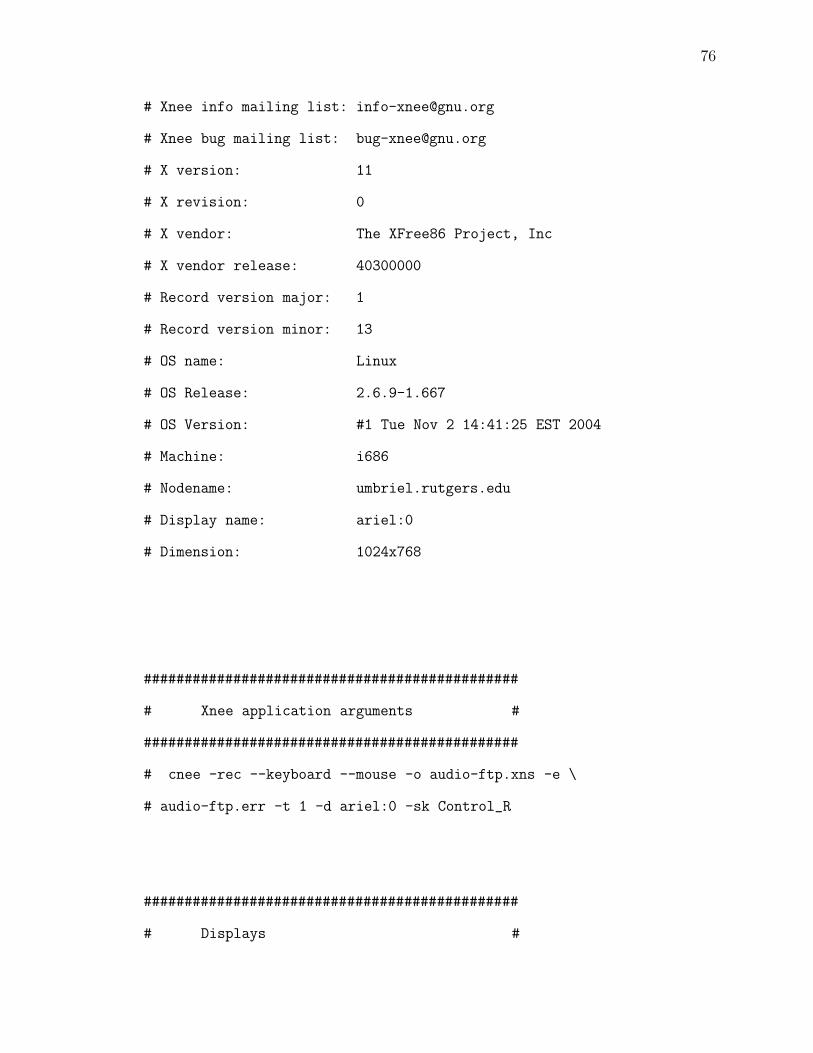
76
# Xnee info mailing list: [email protected]
# Xnee bug mailing list: [email protected]
# X version: 11
# X revision: 0
# X vendor: The XFree86 Project, Inc
# X vendor release: 40300000
# Record version major: 1
# Record version minor: 13
# OS name: Linux
# OS Release: 2.6.9-1.667
# OS Version: #1 Tue Nov 2 14:41:25 EST 2004
# Machine: i686
# Nodename: umbriel.rutgers.edu
# Display name: ariel:0
# Dimension: 1024x768
##############################################
# Xnee application arguments #
##############################################
# cnee -rec --keyboard --mouse -o audio-ftp.xns -e \
# audio-ftp.err -t 1 -d ariel:0 -sk Control_R
##############################################
# Displays #
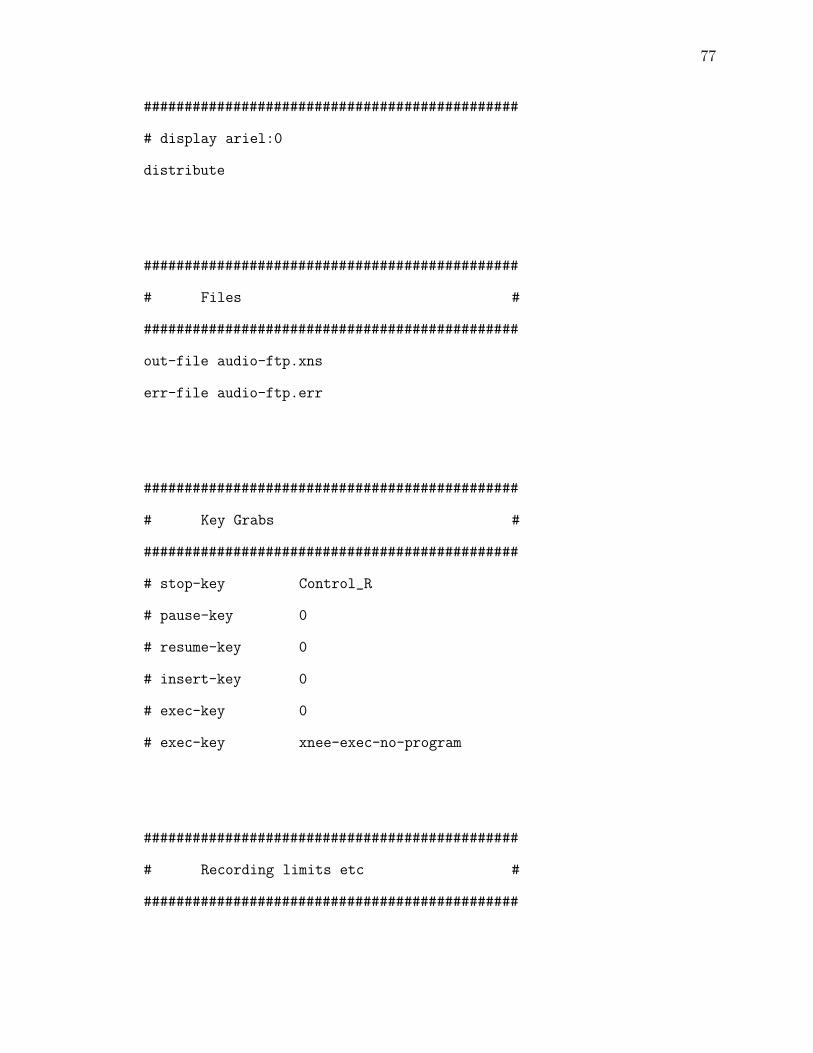
77
##############################################
# display ariel:0
distribute
##############################################
# Files #
##############################################
out-file audio-ftp.xns
err-file audio-ftp.err
##############################################
# Key Grabs #
##############################################
# stop-key Control_R
# pause-key 0
# resume-key 0
# insert-key 0
# exec-key 0
# exec-key xnee-exec-no-program
##############################################
# Recording limits etc #
##############################################
78
events-to-record -1
data-to-record -1
seconds-to-record -1
first-last 0
# Record all (including current) clients or only future ones
all-client
# future-clients
# Store the starting mouse position
# store-mouse-position
##############################################
# Resolution #
##############################################
# Resolution
#recorded-resolution 1024x768
#replay-resolution 1x1
#resolution-adjustment 0
##############################################
# Speed #
##############################################
79
# Speed
#speed-percent 100
##############################################
# Replaying limits etc #
##############################################
max-threshold 20
min-threshold 20
tot-threshold 40
##############################################
# Feedback #
##############################################
#feedback-none
#feedback-stderr
feedback-xosd
##############################################
# Various #
##############################################
# Plugin file (0 means none)
80
plugin 0
# Modes (currently not used)
#synchronised-replay 1
# Replay offset
#xnee_replay_offset 0x0
# Human printout of X11 data (instead of Xnee format)
human-printout 0
# Delay before starting record/replay
# 1
# Various
#########################################
# Record settings #
#########################################
# data_flags 7
# rState 149873200
# xids[0] 35651584
# xids[1] 4194304
# Number of Ranges 1
# RecordRange[0]
request-range 0-0
reply-range 0-0
extension-request-major-range 0-0
81
extension-request-major-range 0-0
extension-request-major-range 0-0
extension-request-major-range 0-0
delivered-event-range 21-21
device-event-range 2-6
error-range 6-6
0,2,0,0,0,58,0,686070317
0,3,0,0,0,58,0,686070416
0,2,0,0,0,33,0,686070451
0,3,0,0,0,33,0,686070557
0,2,0,0,0,42,0,686070635
0,3,0,0,0,42,0,686070725
0,2,0,0,0,10,0,686070981
0,3,0,0,0,10,0,686071101
0,2,0,0,0,11,0,686071204
0,2,0,0,0,12,0,686071341
0,3,0,0,0,11,0,686071371
0,3,0,0,0,12,0,686071431
0,2,0,0,0,20,0,686071875
0,3,0,0,0,20,0,686071968
0,2,0,0,0,39,0,686072202
0,3,0,0,0,39,0,686072270
0,2,0,0,0,23,0,686072661
0,3,0,0,0,23,0,686072721
0,2,0,0,0,12,0,686074341
0,3,0,0,0,12,0,686074431
0,2,0,0,0,20,0,686074875
82
0,3,0,0,0,20,0,686074968
0,2,0,0,0,23,0,686075661
0,3,0,0,0,23,0,686075721
0,2,0,0,0,46,0,686077009
0,3,0,0,0,46,0,686077112
0,2,0,0,0,31,0,686077229
0,3,0,0,0,31,0,686077312
0,2,0,0,0,23,0,686077692
0,3,0,0,0,23,0,686077765
0,2,0,0,0,50,0,686078684
0,2,0,0,0,16,0,686079008
0,3,0,0,0,16,0,686079086
0,3,0,0,0,50,0,686079153
0,2,0,0,0,36,0,686080318
0,3,0,0,0,36,0,686080378
0,2,0,0,0,36,0,686101906
0,3,0,0,0,36,0,686101976
0,2,0,0,0,39,0,686103177
0,3,0,0,0,39,0,686103282
0,2,0,0,0,41,0,686103381
0,3,0,0,0,41,0,686103466
0,2,0,0,0,28,0,686103579
0,3,0,0,0,28,0,686103649
0,2,0,0,0,33,0,686103788
0,3,0,0,0,33,0,686103891
0,2,0,0,0,20,0,686104068
0,3,0,0,0,20,0,686104161
83
0,2,0,0,0,39,0,686104264
0,3,0,0,0,39,0,686104356
0,2,0,0,0,23,0,686104597
0,3,0,0,0,23,0,686104687
0,2,0,0,0,12,0,686105264
0,3,0,0,0,12,0,686105356
0,2,0,0,0,23,0,686105597
0,3,0,0,0,23,0,686105687
0,2,0,0,0,44,0,686106430
0,3,0,0,0,44,0,686106503
0,2,0,0,0,43,0,686106614
0,3,0,0,0,43,0,686106712
0,2,0,0,0,32,0,686106844
0,2,0,0,0,58,0,686106938
0,3,0,0,0,32,0,686107001
0,3,0,0,0,58,0,686107056
0,2,0,0,0,62,0,686107297
0,2,0,0,0,11,0,686107439
0,3,0,0,0,11,0,686107537
0,3,0,0,0,62,0,686107561
0,2,0,0,0,54,0,686107745
0,3,0,0,0,54,0,686107845
0,2,0,0,0,26,0,686108009
0,2,0,0,0,27,0,686108200
0,3,0,0,0,26,0,686108215
0,3,0,0,0,27,0,686108294
0,2,0,0,0,26,0,686108417
84
0,3,0,0,0,26,0,686108505
0,2,0,0,0,38,0,686108693
0,3,0,0,0,38,0,686108783
0,2,0,0,0,46,0,686108881
0,3,0,0,0,46,0,686108977
0,2,0,0,0,36,0,686109421
0,3,0,0,0,36,0,686109506
0,2,0,0,0,62,0,686115540
0,2,0,0,0,41,0,686115738
0,3,0,0,0,41,0,686115830
0,3,0,0,0,62,0,686115913
0,2,0,0,0,30,0,686116045
0,3,0,0,0,30,0,686116123
0,2,0,0,0,28,0,686116215
0,3,0,0,0,28,0,686116278
0,2,0,0,0,20,0,686116372
0,3,0,0,0,20,0,686116472
0,2,0,0,0,50,0,686116571
0,2,0,0,0,44,0,686116693
0,3,0,0,0,50,0,686116786
0,3,0,0,0,44,0,686116800
0,2,0,0,0,38,0,686116924
0,3,0,0,0,38,0,686117009
0,2,0,0,0,45,0,686117027
0,3,0,0,0,45,0,686117110
0,2,0,0,0,36,0,686117318
0,3,0,0,0,36,0,686117401
85
0,2,0,0,0,33,0,686121115
0,3,0,0,0,33,0,686121226
0,2,0,0,0,30,0,686121316
0,3,0,0,0,30,0,686121401
0,2,0,0,0,28,0,686121472
0,3,0,0,0,28,0,686121550
0,2,0,0,0,65,0,686121773
0,3,0,0,0,65,0,686121874
0,2,0,0,0,39,0,686122019
0,3,0,0,0,39,0,686122142
0,2,0,0,0,41,0,686122215
0,3,0,0,0,41,0,686122300
0,2,0,0,0,28,0,686122467
0,3,0,0,0,28,0,686122529
0,2,0,0,0,33,0,686122659
0,3,0,0,0,33,0,686122760
0,2,0,0,0,60,0,686122992
0,3,0,0,0,60,0,686123082
0,2,0,0,0,18,0,686123522
0,3,0,0,0,18,0,686123604
0,2,0,0,0,15,0,686123752
0,3,0,0,0,15,0,686123827
0,2,0,0,0,50,0,686124072
0,2,0,0,0,58,0,686124378
0,3,0,0,0,58,0,686124447
0,2,0,0,0,56,0,686124614
0,3,0,0,0,56,0,686124686
86
0,3,0,0,0,50,0,686124776
0,2,0,0,0,65,0,686125167
0,3,0,0,0,65,0,686125265
0,2,0,0,0,61,0,686125351
0,3,0,0,0,61,0,686125459
0,2,0,0,0,40,0,686125523
0,3,0,0,0,40,0,686125608
0,2,0,0,0,26,0,686125717
0,3,0,0,0,26,0,686125835
0,2,0,0,0,55,0,686125868
0,3,0,0,0,55,0,686125956
0,2,0,0,0,61,0,686126080
0,3,0,0,0,61,0,686126208
0,2,0,0,0,57,0,686126273
0,3,0,0,0,57,0,686126355
0,2,0,0,0,30,0,686126469
0,3,0,0,0,30,0,686126546
0,2,0,0,0,46,0,686126670
0,3,0,0,0,46,0,686126733
0,2,0,0,0,46,0,686126825
0,3,0,0,0,46,0,686126897
0,2,0,0,0,36,0,686127534
0,3,0,0,0,36,0,686130247
0,2,0,0,0,62,0,686376198
0,3,0,0,0,62,0,686376258
0,2,0,0,0,36,0,686575977
0,3,0,0,0,36,0,686576057
87
0,2,0,0,0,24,0,686576906
0,3,0,0,0,24,0,686577026
0,2,0,0,0,30,0,686577104
0,3,0,0,0,30,0,686577191
0,2,0,0,0,31,0,686577288
0,3,0,0,0,31,0,686577371
0,2,0,0,0,28,0,686577450
0,3,0,0,0,28,0,686577517
0,2,0,0,0,36,0,686578269
0,3,0,0,0,36,0,686578354
0,2,0,0,0,36,0,686580272
0,3,0,0,0,36,0,686580344

88
89
Bibliography
[1] N. AbouGhazaleh, D. Mosse, B. Childers, and R. Melhem. Toward the placementof power management points in real time applications. In Proceedings of theWorkshop on Compilers and Operating Systems for Low Power, September 2001.
[2] N. AbouGhazaleh, D. Mosse, B. Childers, R. Melhem, and M. Craven. Collabo-rative operating system and compiler power management for real-time applica-tions. In Proceedings of the 9th Real-Time Embedded Technology and Applica-tions Symposium, pages 133–143, May 2003.
[3] N. Abramson. The ALOHA system — another alternative for computer commu-nications. In Proceedings of the Fall Joint Computer Conference, pages 281–285,1970.
[4] Adobe. PostScript Language Document Structuring Conventions Specification.Adobe Systems Incorporated, third edition, September 1992.
[5] Adobe. Portable Document Format Reference. Adobe Systems Incorporated,sixth edition, October 2007.
[6] Apple. iPod nano, September 2005. Technical specifications on the web at<http:// www.everymac.com / systems / apple / consumer electronics / stats/ ipod nano.html>.
[7] A. Arpaci-Dusseau, D. Culler, and A. Mainwaring. Scheduling with implicitinformation in distributed systems. In Proceedings of the Conference on Mea-surement and Modeling of Computer Systems, pages 233–243, June 1998.
[8] A. Azevedo, I. Issenin, R. Cornea, R. Gupta, N. Dutt, A. Veidenbaum, andA. Nicolau. Profile-based dynamic voltage scheduling using program checkpoints.In Proceedings of the Conference on Design, Automation and Test in Europe,pages 168–175, March 2002.
[9] A. Campbell, M. Kounavis, and R. Liao. Programmable mobile networks. Inter-national Journal of Computer and Telecommunications Networking, 31(7):741–765, April 1999.
[10] L. Capra, W. Emmerich, and C. Mascolo. CARISMA: Context-aware reflectivemiddleware system for mobile applications. IEEE Transactions on SoftwareEngineering, 29(10):929–945, October 2003.
90
[11] R. Card, T. Ts’o, and S. Tweedie. Design and implementation of the secondextended filesystem. In Proceedings of the International Symposium on Linux,December 1994.
[12] E. Carrera, E. Pinheiro, and R. Bianchini. Conserving disk energy in networkservers. In Proceedings of the International Conference on Supercomputing, pages86–97, June 2003.
[13] J. Chase, D. Anderson, P. Thakar, A. Vahdat, and R. Doyle. Managing energyand server resources in hosting centers. In Proceedings of the Symposium onOperating Systems Principles, pages 103–116, October 2001.
[14] D. Colarelli and D. Grunwald. Massive arrays of idle disks for storage archives.In Proceedings of the conference on SuperComputing, pages 1–11, July 2002.
[15] M. Crovella and A. Bestavros. Self-similarity in world wide web traffic: Evidenceand possible causes. IEEE/ACM Transactions on Networking, 5(6):835–846,December 1997.
[16] C. Crowley. TkReplay: Record and Replay for Tk. In Proceedings of the USENIXTcl/Tk Workshop, pages 131–140, July 1995.
[17] G. de Nijs, W. Almesberger, and B. van den Brink. Active block I/O schedulingsystem (ABISS). In Proceedings of the Ottawa Linux Symposium, pages 109–126,July 2005.
[18] M. Desnoyers and M. Dagenais. The LTTng tracer: A low impact performanceand behavior monitor for GNU/Linux. In Proceedings of the Linux Symposium,volume 1, pages 209–223, July 2006.
[19] F. Douglis, R. Caceres, F. Kaashoek, K. Li, B. Marsh, and J. Tauber. Storagealternatives for mobile computers. In Proceedings of the Symposium on OperatingSystems Design and Implementation, pages 25–37, November 1994.
[20] F. Douglis, P. Krishnan, and B. Bershad. Adaptive disk spin-down policies formobile computers. In Proceedings of the Symposium on Mobile and Location-Independent Computing, pages 121–137, April 1995.
[21] F. Douglis, P. Krishnan, and B. Marsh. Thwarting the power-hungry disk. InProceedings of the USENIX Winter Conference, pages 292–306, January 1994.
[22] K. Drake. XTEST Extension Protocol. X Consortium Standard, 1994. Version2.2.
[23] C. Ellis. The case for higher-level power management. In Proceedings of theWorkshop on Hot Topics in Operating Systems, pages 162–167, March 1999.
[24] J. Flinn and M. Satyanarayanan. Energy-aware adaptation for mobile applica-tions. In Proceedings of the Symposium on Operating System Principles, pages48–63, December 1999.
91
[25] J. Flinn and M. Satyanarayanan. Managing battery lifetimes with energy-awareadaptation. ACM Transactions on Computer Systems, 22(2):137–179, May 2004.
[26] Fujitsu. MHK2060AT product manual, October 1999. Edition 3.
[27] G. Ganger. The disksim simulation environment. Technical Report CMU-CS-03-102, Carnegie Mellon University, January 2003. Version 3.0 Reference Manual.
[28] R. Golding, P. Bosch, C. Staelin, T. Sullivan, and J. Wilkes. Idleness is not sloth.In Proceedings of the USENIX Winter Conference, pages 201–212, January 1995.
[29] P. Greenawalt. Modeling power management for hard disks. In Proceedings ofthe Workshop on Modeling, Analysis, and Simulation of Computer and Telecom-munication Systems, pages 62–66, January 1994.
[30] S. Gribble, G. Manku, D. Roselli, E. Brewer, T. Gibson, and E. Miller. Self-similarity in file systems. In Proceedings of the Conference on Measurement andModeling of Computer Systems, pages 141–150, June 1998.
[31] S. Gurumurthi, A. Sivasubramaniam, M. Kandemir, and H. Franke. DRPM: Dy-namic speed control for power management in server class disks. In Proceedingsof the Symposium on Computer Architecture, pages 169–179, June 2003.
[32] S. Gurun and C. Krintz. AutoDVS: An automatic, general-purpose, dynamicclock scheduling system for hand-held devices. In Proceedings of the Conferenceon Embedded Systems Software, September 2005.
[33] T. Heath, E. Pinheiro, J. Hom, U. Kremer, and R. Bianchini. Code transforma-tions for energy-efficient device management. IEEE Transactions on Computers,53(8):974–987, August 2004.
[34] D. Helmbold, D. Long, T. Sconyers, and B. Sherrod. Adaptive disk spin-down formobile computers. Journal of Mobile Networks and Applications, 5(4):285–297,December 2000.
[35] Hitachi. Travelstar C4K60 specification, November 2004. Revision 1.
[36] Hitachi. Travelstar E7K60 specification, October 2004. Revision 3.1.
[37] Hitachi. Deskstar 7K80 specification, September 2006. Version 1.6.
[38] C.-H. Hsu and U. Kremer. The design, implementation, and evaluation of acompiler algorithm for CPU energy reduction. In Proceedings of the Conferenceon Programming Languages, Design, and Implementation, pages 38–48, June2003.
[39] Intel and Microsoft. Advanced power management, February 1996. Revision 1.2.
[40] Intel, Microsoft, and Toshiba. Advanced configuration and power interface, Oc-tober 2006. Revision 3.0b.
92
[41] I. Kadayif, M. Kandemir, and U. Sezer. Collective compilation for I/O-intensiveprograms. In Proceedings of the IASTED Conference on Parallel and DistributedComputing and Systems, August 2001.
[42] R. Katz. Adaptation and mobility in wireless information systems. IEEE Per-sonal Communications, 1(1):6–17, 1994.
[43] C. Lattner and V. Adve. LLVM: A compilation framework for lifelong programanalysis & transformation. In Proceedings of the International Symposium onCode Generation and Optimization, March 2004.
[44] W. Leland, M. Taqqu, W. Willinger, and D. Wilson. On the self-similar natureof ethernet traffic (extended version). IEEE/ACM Transactions on Networking,2(1):1–15, February 1994.
[45] K. Li, R. Kumpf, P. Horton, and T. Anderson. A quantitative analysis of diskdrive power management in portable computers. In Proceedings of the USENIXWinter Conference, pages 279–291, January 1994.
[46] X. Li, Z. Li, Y. Zhou, and S. Adve. Performance directed energy management formain memory and disks. ACM Transactions on Storage, 1(3):346–380, August2005.
[47] J. Lorch and A. Smith. Software strategies for portable computer energy man-agement. IEEE Personal Communications, 5(3):60–73, June 1998.
[48] Y.-H. Lu, L. Benini, and G. De Micheli. Power-aware operating systems forinteractive systems. IEEE Transactions on Very Large Scale Integration Systems,10(2):119–134, April 2002.
[49] S. Narayanaswamy, S. Seshan, E. Amir, E. Brewer, R. Brodersen, F. Burghardt,A. Burstein, Y.-C. Chang, A. Fox, J. Gilbert, R. Han, R. Katz, A. Long,D. Messerschmitt, and J. Rabaey. Application and network support for infopad.IEEE Personal Communications, 3(2):4–17, April 1996.
[50] B. Noble, M. Price, and M. Satyanarayanan. A programming interface forapplication-aware adaptation in mobile computing. In Proceedings of theUSENIX Symposium on Mobile and Location-Independent Computing, pages 57–66, April 1995.
[51] B. Noble, M. Satyanarayanan, D. Narayanan, J. Tilton, J. Flinn, and K. Walker.Agile application-aware adaptation for mobility. In Proceedings of the Symposiumon Operating System Principles, pages 276–287, October 1997.
[52] J. Ousterhout. Scheduling techniques for concurrent systems. In Proceedings ofthe Conference on Distributed Computing Systems, pages 22–30, October 1982.
93
[53] A. Papathanasiou and M. Scott. Energy efficiency through burstiness. In Pro-ceedings of the Workshop on Mobile Computing Systems and Applications, pages44–53, October 2003.
[54] R.H. Patterson, G. Gibson, E. Ginting, D. Stodolsky, and J. Zelenka. Informedprefetching and caching. In Proceedings of the Symposium on Operating SystemsPrinciples, pages 79–95, December 1995.
[55] E. Pinheiro and R. Bianchini. Energy conservation techniques for disk array-based servers. In Proceedings of the International Conference on Supercomputing,pages 68–78, June 2004.
[56] E. Pinheiro, R. Bianchini, and C. Dubnicki. Exploiting redundancy to conserveenergy in storage systems. In Proceedings of the Conference on Measurementand Modeling of Computer Systems, pages 15–26, June 2006.
[57] L. Roberts. ALOHA packet system with and without slots and capture. Com-puter Communications Review, 5:28–42, April 1975.
[58] M. Robinson and T. Morano. Linux kernel crash dump. <http://lkcd.sourceforge.net>.
[59] D. Roselli, J. Lorch, and T. Anderson. A comparison of file system workloads.In Proceedings of the USENIX Technical Conference, pages 41–54, June 2000.
[60] J. Rubinstein, D. Meyer, and J. Evans. Executive control of cognitive processesin task switching. Journal of Experimental Psychology: Human Perception andPerformance, 27(4):763–797, 2001.
[61] A. Rudenko, P. Reiher, G. Popek, and G. Kuenning. The remote processingframework for portable computer power saving. In Proceedings of the Symposiumon Applied Computing, pages 365–372, March 1999.
[62] C. Ruemmler and J. Wilkes. Unix disk access patterns. In Proceedings of theUSENIX Winter Conference, pages 405–420, January 1993.
[63] C. Ruemmler and J. Wilkes. An introduction to disk drive modeling. IEEEComputer, 27(3):17–28, March 1994.
[64] J. Saltzer, D. Reed, and D. Clark. End-to-end arguments in system design. ACMTransactions on Computer Systems, 2(4):277–288, November 1984.
[65] H. Sandklef. Testing applications with xnee. Linux Journal online, January2004. <http:// www.linuxjournal.com / article / 6660>.
[66] H. Sandklef. Xnee manual, November 2006. Version 1.2.
[67] B. Schilit, N. Adams, and R. Want. Context-aware computing applications. InProceedings of the Workshop on Mobile Computing Systems and Applications,pages 85–90, December 1994.
94
[68] J. Schindler, J. Griffin, C. Lumb, and G. Ganger. Track-aligned extents: Match-ing access patterns to disk drive characteristics. In Proceedings of the Conferenceon File and Storage Technologies, pages 259–274, January 2002.
[69] E. Shriver, B. Hillyer, and A. Silberschatz. Performance analysis of storagesystems. In G. Goos, J. Hartmanis, and J. van Leeuwen, editors, PerformanceEvaluation: Origins and Directions, volume 1769 of Lecture Notes in ComputerScience, pages 33–50. Springer, 2000.
[70] M. Weiser, B. Welch, A. Demers, and S. Shenker. Scheduling for reduced CPUenergy. In Proceedings of the Symposium on Operating Systems Design andImplementation, pages 13–23, November 1994.
[71] A. Weissel, B. Beutel, and F. Bellosa. Cooperative I/O — a novel I/O semanticsfor energy-aware applications. In Proceedings of the Conference on OperatingSystems Design and Implementation, pages 117–130, December 2002.
[72] R. Wolski, N. Spring, and J. Hayes. The network weather service: a distributedresource performance forecasting service for metacomputing. Journal of FutureGeneration Computing Systems, 15(5–6):757–768, October 1999.
[73] R. Wolski, N. Spring, and J. Hayes. Predicting the CPU availability of time-shared unix systems on the computational grid. In Proceedings of the Symposiumon High Performance Distributed Computing, August 1999.
[74] B. Worthington, G. Ganger, Y. Patt, and J. Wilkes. On-line extraction of SCSIdisk drive parameters. In Proceedings of the Conference on Measurement andModeling of Computer Systems, pages 146–156, May 1995.
[75] K. Yaghmour and M. Dagenais. Measuring and characterizing system behav-ior using kernel-level event logging. In Proceedings of the USENIX TechnicalConference, June 2000.
[76] J. Zedlewski, S. Sobti, N. Garg, F. Zheng, A. Krishnamurthy, and R. Wang.Modeling hard-disk power consumption. In Proceedings of the USENIX Confer-ence on File and Storage Technologies, pages 217–230, April 2003.
[77] H. Zeng, C. Ellis, A. Lebeck, and A. Vahdat. ECOSystem: Managing energyas a first class operating system resource. In Proceedings of the Conference onArchitectural Support for Programming Languages and Operating Systems, pages123–132, October 2002.
[78] Q. Zhu, Z. Chen, L. Tan, Y. Zhou, K. Keeton, and J. Wilkes. Hibernator:Helping disk arrays sleep through the winter. In Proceedings of the Symposiumon Operating Systems Principles, pages 177–190, October 2005.
[79] Q. Zhu, F. David, C. Devaraj, Z. Li, Y. Zhou, and P. Cao. Reducing energy con-sumption of disk storage using power-aware cache management. In Proceedings
95
of the Symposium on High-Performance Computer Architecture, pages 118–129,February 2004.
[80] Q. Zhu and Y. Zhou. Power aware storage cache management. IEEE Transac-tions on Computers, 54(5):587–602, May 2005.
[81] M. Zimet. Record extension library specification: Version 1.10 public reviewdraft. The X Resource, 14(1):177–193, February 1995.

96
97
Curriculum Vita
Jerry Yin Hom
Education
09/1998–05/2008 Ph.D., Computer ScienceThesis: An Execution Context Optimization Framework for DiskEnergyRutgers UniversityPiscataway, NJ
08/1991–05/1995 B.S., Electrical Engineering and Computer ScienceUniversity of California, BerkeleyBerkeley, CA
Experience
09/1998–05/2008 Teaching AssistantComputer Science DepartmentRutgers UniversityDuties generally involved grading of exams, projects, and home-works, answering questions about course work, and resolving com-plaints. Courses included:
• Programming Languages & Compilers (graduate)
• Compilers
• Principles of Programming Languages
• Numerical Analysis of Computing
• Introduction to Computer Science
For undergraduate courses, I also led recitations (up to three percourse) which supplement the main lecture’s instructional mate-rial. A recitation class ranged between 5–30 students.
09/1995–08/1998 Systems Programmer/AnalystInformation Technology DepartmentAcuson Corporation (now part of Siemens AG)
98
Developed and customized SQL databases, database client appli-cations, and database reports.
List of Publications
J. Hom and U. Kremer. Inter-program optimisations for diskenergy reduction. International Journal of Embedded Systems,3(1/2):8–16, 2007.
J. Hom and U. Kremer. Inter-program optimizations for conserv-ing disk energy. In Proceedings of the International Symposium onLow Power Electronics and Design, pages 335–338, August 2005.
J. Hom and U. Kremer. Inter-program optimizations for diskenergy reduction. In L. Benini, U. Kremer, C. Probst, andP. Schelkens, editors, Power-aware Computing Systems, num-ber 05141 in Dagstuhl Seminar Proceedings, Dagstuhl, Germany,2005. Internationales Begegnungs- und Forschungszentrum fur In-formatik (IBFI), Schloss Dagstuhl, Germany.
T. Heath, E. Pinheiro, J. Hom, U. Kremer, and R. Bianchini.Code transformations for energy-efficient device management.IEEE Transactions on Computers, 53(8):974–987, August 2004.
J. Hom and U. Kremer. Inter-program compilation for disk energyreduction. In B. Falsafi and T. Vijaykumar, editors, Power-AwareComputer Systems, volume 3164 of Lecture Notes in ComputerScience, pages 13–25. Springer, 2003.
J. Hom and U. Kremer. Inter-program compilation for disk en-ergy reduction. In Proceedings of the Workshop on Power-AwareComputer Systems, December 2003.
J. Hom and U. Kremer. Energy management of virtual memory ondiskless devices. In L. Benini, M. Kandemir, and J. Ramanujam,editors, Compilers and Operating systems for Low Power, pages95–113. Kluwer Academic Publishers, 2003.
T. Heath, E. Pinheiro, J. Hom, U. Kremer, and R. Bianchini.Application transformations for energy and performance-awaredevice management. In Proceedings of the Conference on Par-allel Architectures and Compilation Techniques, pages 121–130,September 2002. Best student paper award.
J. Hom and U. Kremer. Energy management of virtual memoryon diskless devices. In Proceedings of the Workshop on Compilersand Operating Systems for Low Power, September 2001.
J. Hom and U. Kremer. Energy management of virtual mem-ory on diskless devices. Technical Report DCS-TR-456, Rutgers

99
University, September 2001.