Embed Size (px)
Citation preview

PICES 2007/11/02 1
An example of operational ocean data assimilation and prediction
Masa KamachiJapan Met. Agency/ Met. Res. Inst.
JMA & MRI Ocean Data Assimilation GroupT. Nakano, S. Matsumoto, N. Usui, Y. Fujii,
T. Yasuda, T. Tsujino, N. Nakano,T. Kuragano, S. Ishizaki,
I. Ishikawa, & T. Soga

PICES 2007/11/02 2
Outline
1. Introduction to status of operational data assimilation (of physical oceanography)(under GOOS/GODAE, CLIVAR/GSOP )
2. JMA/MRI_system: MOVE/MRI.COMSystems for Ocean weather & Ocean climateValidationReanalysis, water mass representation Prediction (Kuroshio, ElNino)
3. Future (on going) direction and recommendationOSE, CDAS, Coastal Appl.
PICES 2007/11/02 3
Data Assimilation
Data assimilation isa procedure that subtracts information from models and observations, and combines them as an optimum estimate.
The aims are1. to obtain optimum initial condition for prediction2. to obtain optimum boundary condition3. to obtain optimum parameter (parameter estimation)4. to understand phenomena with 4D data set (reanalysis)5. to estimate observing system and develop optimum
system (through OSE/OSSE/sensitivity/SV analyses)

PICES 2007/11/02 4
NWPcenters measurement
networkData Assembly
Centers(floats, altimetry)
raw data
GODAE Data Servers
GODAEAssimilation Centers
Atmosphericfields
SST products;Feedback wrt surface f luxproducts
Data
quality/errors
ApplicationCenters Research
users
Users
Observing systemdesign and assessment
QC’d , processed data
Error statist
ics
Data products
Assimilat
ion-ready
products
dataProduct design
and assessmentProductassessment GODAE
ProductdeliverySpecialized
products
Product assessment
Legend:Sources ofInputs
GODAEcommon
Users of GODAEoutputs
Data quality/errors
Data; error statistics; metadata; data products;GODAE-specific data sets
GODAE Product Servers
Products
GODAEProductdelivery
Total System is Important(GODAE)
see “GODAE Implementation Plan” at http://www.godae.org/
Operationor Research
Middle users (mainlyResearchCommunity)
End users
OSECDAS

GODAE
PICES 2007/11/02
GODAE Modelling/Assimilation Centers
cf. GODAE Implementation plan
Australia : (BLUELINK): Regional Australianseas to Global OceanJapan (COMPASS-MOVE projects, …) :N.Pacific to Global OceanUS (ECCO, HYCOM-US projects, …) : N.Atlantic and Global OceanCanada (Fisheries and Oceans Canada)Europe (Mersea Consortium)– Italy (MFS) : Med Sea– France (MERCATOR) : N.Atlantic & Med Sea
to Global Ocean– Norway (TOPAZ) : North Atlantic to Arctic– UK (FOAM) : N.Atlantic / Global ocean to
Northern Shelves

6PICES 2007/11/02
Japan GODAE partnerStatus of Japan-GoDAE Partners 2006/05/01
JMA-OGCMGlobal
(2.0x2.5xz20, y0.5 EQ)NL-
HorizontalDiffusion
MRI-EGCMN. Pac
(1/4x1/4xz21, variable)Arakawa-NLArakawa-NL
Momentum-Topogr. scheme
MRI.COMGlobal(1x1x54)z-sigma
hybridArakawa-NLMomentum-
Topogr. scheme
MY-ML
MRI.COM(MRI Com Ocn Mdl)N. PacDouble nesting
to global (1/2x/1/2xz54)(1/10x1/10x54)z-sigma hybrid
Arakawa-NLmomentumMomentum-Topogr. Scheme, Noh-ML
POM (1996)North Pacific
(1/4x1/4xσ21)Nested NW-
Pac(1/12x1/12xσ4
5)Coastal
version
RIAMOMJapan Sea
(1/12x1/12xz19)
OFESCFESGlobal(1x1xz34)
MRI-Kyoto OGCMGlobal
(1x1xz34)Coastal
(1/12x1/12xz21)Arakawa-NL
Momentum-Topogr. scheme MY-Noh-ML
Model
ClimateOperational
Forecast. Nino3-SST
(El Nino)Init Cond-
CGCM SST for
Season. Forecast
Ocean WeatherKuroshiopredictabilityReanalysis, HindcastNow-Forecasting
(Oper.)
Japan GODAE serverhttp:// godae.kishou.go.jp
ClimateEl Ninovariability
Init Cond(I.C.) for
CGCMReanalysis(1993-2004,1980-2004)
Ocean WeatherKuroshio, Oyashio,Western N. PacVariability &PredictabilityReanalysis(1993-2004,1961-2004)
Ocean Weather
KuroshioVariability &predictability Kyuchou(coastal jet)Jelly fish
Ocean WeatherJapan Sea
Predictability
Oil spillKyuchou(coastal jet)
ClimatePac-
reanalysis(1993-2004)Model
improv.90’s ENI.C.-CGCM
Climate+Ocean WeatherPac-
reanalysisModel improv.90’s ENCoastal
prediction
Aim
JMA/HQ (ClimInfoDep
t)
ODAS(Oper. Syst.)Ishikawa
IshikawaSogaTakayaYamanaka、
JMA/HQ (MarPredDiv)
COMPASS-K(Oper. Syst.)Kuragano,Ishizaki, SakuraiKamachi
JMA/MRIMOVE/MRI.C
OM-G(Res. Syst. &JMA-next
oper.)Fujii,
Yasuda,Matsumoto,YamanakaKamachi
JMA/MRIMOVE/MRI.COM-NP(Res. Syst. &JMA-next oper.)Usui, Tsujino,Fujii, Kamachi
Frontier (FRCGC)
& Tokyo Univ.
& Fisheries
AgencyJ-COPE2(Res. Syst.)Miyazawa,Yamagata
FRA-JCOPE
Kyushu Univ.(RIAM)
(Res. Syst.)HiroseYoon
RIAMOM & Fisheries Agency(FRA-RIAMOM)
Frontier (IMRP)
& Kyoto Univ.
K-7(Res.
Syst.)Masuda,SugiuraAwaji
Kyoto Univ.& Jpn Mar
SciFoundation
(Res. System)Ishikawa, InnAwajiKU-JMSF
Group
GODAE

PICES 2007/11/02 7
Ocean Data Assimilation Systems in Japan Meteorological Agency
& Meteorological Research Institute
COMPASS-KJMA ODASOperation
Initial condition for Ocean Forecasting
around Japan
Initial Condition for ElNino & Seasonal
ForecastingAim
Western North PacificGlobalArea
Multi-variate 3D/4DVARMulti-variate 3DVAR
Research
(Next Operation)
4DOI(simple) 3DVAR
MOVE/MRI.COM

PICES 2007/11/02 8
MRI MOVE/MRI.COM (Multivariate Ocean Variational Estimation) system uses three dimensional Variational (3D-VAR) method with vertical coupled T-S Empirical Orthogonal Function (EOF) modal decomposition with area partition and horizontal Gaussian function.
Obs. Data: Sat-Alt, SST, in situ T & S (e.g., ship, ARGO, Tao/Triton)
Aims
1. Opt. Init. Cond. for Forecasting (Seasonal -Interannual (ElNino), Ocean state around Japan)
2. Reanalysis (ver.3):
Western North Pacific : 1985-2006 North Pacific : 1948-2006
Global : 1948-2006Reanalysis dataset will be opened through JMA Japan_GODAEserver and IPRC/APDRC data centers.
3. OSE, OSSE, SV analyses with 4DVAR-adjoint system4. Coupled assimilation -> Seasonal Forecasting5. Coastal application
MOVE/MRI.COM system

PICES 2007/11/02 9
MOVE-CWith atmospheric model
MOVE-Cst
Global Model-1 : (1×1 deg.:1/3°tropical region, 54 Layers)
Nested-1 N-Pac Model:15S-65N, 100E-75W( 0.5×0.5 deg., 54 Layers)
Nested-2 Kuroshio Model:15N-65N, 115E-160W(0.1×0.1 deg.,54 Layers)
Nested-3 Coastal Model:2km mesh, 54 layers
Five Assimilation Systems
Usui et al. (2005)
PICES 2007/11/02 10
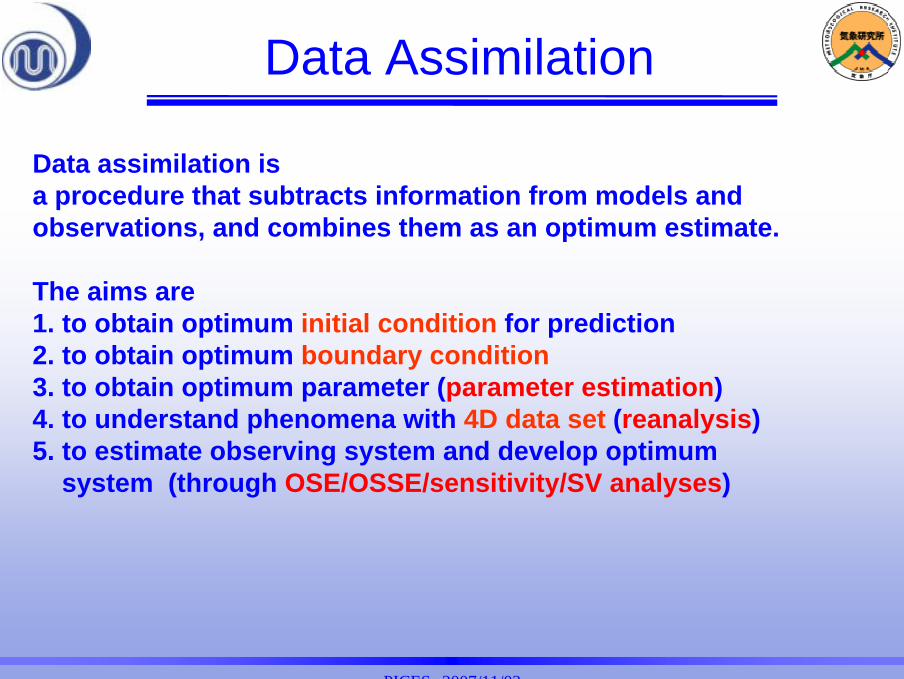
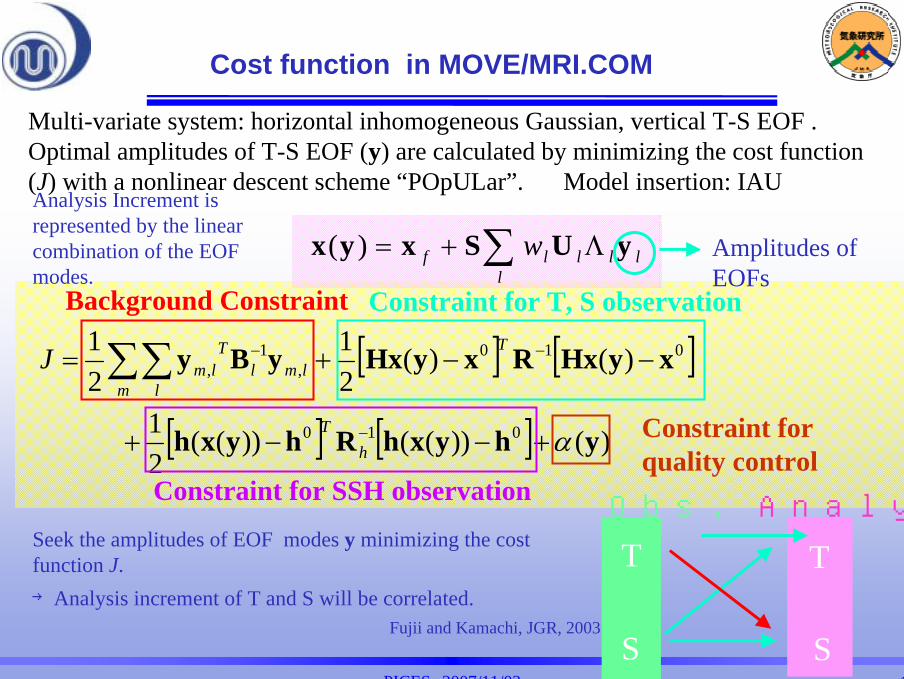
Cost function in MOVE/MRI.COM
Constraint for SSH observation
[ ] [ ]
[ ] [ ] )())(())((21
)()(21
21
010
010,
1,
yhyxhRhyxh
xyHxRxyHxyBy
α+−−+
−−+=
−
−−∑∑
hT
T
m llml
TlmJ
Background Constraint Constraint for T, S observation
Constraint for quality control
Seek the amplitudes of EOF modes y minimizing the cost function J.→Analysis increment of T and S will be correlated.
Fujii and Kamachi, JGR, 2003
Analysis Increment is represented by the linear combination of the EOF modes.
Obs.
T
S
Analysis
T
S
llll
lf w yUSxyx Λ+= ∑)( Amplitudes of EOFs
Multi-variate system: horizontal inhomogeneous Gaussian, vertical T-S EOF . Optimal amplitudes of T-S EOF (y) are calculated by minimizing the cost function (J) with a nonlinear descent scheme “POpULar”. Model insertion: IAU

PICES 2007/11/02 11
Obs.(MGDSST)
Assim.
Model Simulation
August
SST (Climatology)SST (Climatology)
difference

12PICES 2007/11/02
Assimilation Model simulation
Observation (Hydrobase)model - assim
AprilClimatology of Mixed Layer Depth

GODAE
13
Mar.
Jun
Sep.
Salinity impact on the dichothermal structure
With salinity correction Without salinity correction1997-2002 mean Color: Temperature Contour:
θσ
Salinity effect (with Argo float)

1414PICES 2007/11/02
ColorColor::MOVEMOVE--WNPWNPRedRed::55℃℃(COMPASS(COMPASS--K)K) GrayGray::55℃℃((ObsObs--OIOI))
Satellite SST(NOAA@Satellite SST(NOAA@20052005/2/3)/2/3)Temp(100m)Temp(100m)(2005(2005/2/1st1/2/1st1
0days)0days)
Oyashio in subarctic gyre

PICES 2007/11/02 15
Kuroshio Axis (Representation of Kuroshio front)Histgram of the Kuroshio axis position
Assim.
Model Simulation
Obs. (Ambe et al., 2004)

PICES 2007/11/02 16
Horizontal Velocity
2004/1
Correlation Coefficient
V variability is smaller->difficult

PICES 2007/11/02 17
Kuroshiovolume transport
Eastward transport
Assim : 64SvObs : 57Sv
throughflow = eastward – westward
Throughflow transport
Assim : 40SvObs : 42Sv
KuroshioExtension
Ryuky
u Cur
rent
Syst
em
Subarctic Front
Oyashio Front
25
6
1117
4241
12
1114

18
Examples of Water Mass in the North PacificMesoscale eddy and water mass (2000/10,
vertical section along 144E)
Temperature Salinity
North Pacific Intermediate WaterSalinity-min. (165E,2000/4 and 9)
2000/9 2000/4
Assim
Independent
Obs.
Kuroshio (subtropical) and Oyashio (subpolar) waters

PICES 2007/11/02 19
OHC (mean T) and BLT (1949-2005) Eq. Pac.BLT (color), SST (29.0deg., black line), SSS
(35.0psu, white line)

20PICES 2007/11/02
Example of water mass analysis using reanalysis dataset
Take mean in time->Take mean in each region and on each density surface
ENPTW: Eastern North Pacific Tropical WaterESPTW: South ENPCW: Eastern North Pacific Central WaterWNPCW: Western PEW: Pacific Equatorial WaterESPCW: Eastern South Pacifc Central WaterWSPCW: Western
Emery 2001
Water Type (Mean value in 1949-2005 vs. Climatology)
Matsumoto et al., 2007

21PICES 2007/11/02
○: Observation
●: MOVE-WNP
Mean value in 1993 to 2005
Mean along each line (same obs. point, depth, period)
Bias in depth, density (T & S)
Model bias z>800m in Japan Sea (PM)
PH
137E
KS144E
165E
PN
PTPMG
TK
APOK
Matsumoto et al., 2007
137E
Water MassCompared with Obs.
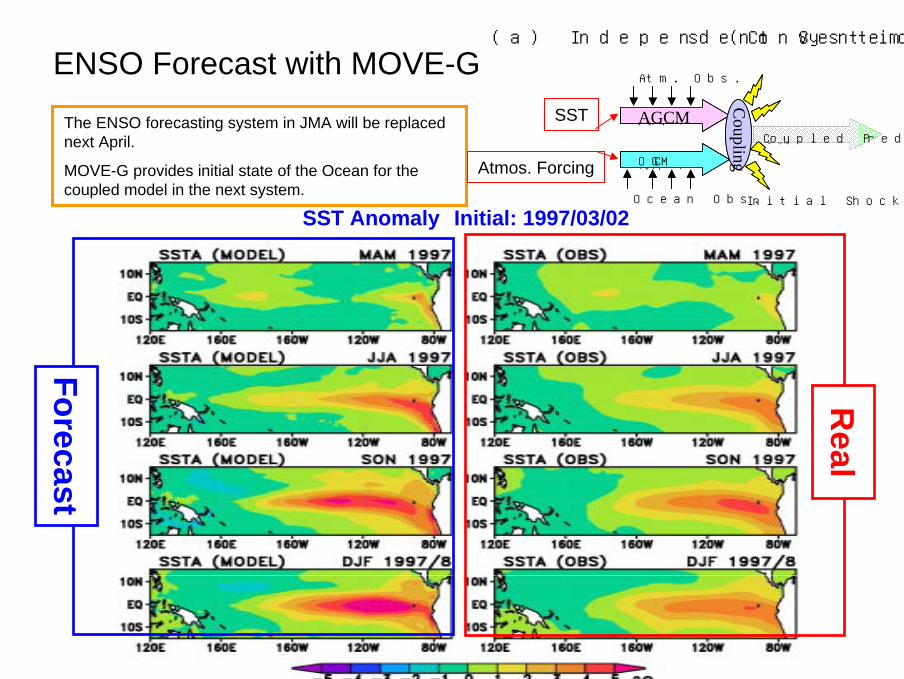
ENSO Forecast with MOVE-G
SST Anomaly Initial: 1997/03/02
Real
Forecast
The ENSO forecasting system in JMA will be replaced next April.
MOVE-G provides initial state of the Ocean for the coupled model in the next system.
大気モデル
海洋モデル
Ocean Obs.
結合
予測△
AGCM
Atm. Obs.
OGCMC
ouplingCoupled Prediction
Initial Shock
(a) Independent Systems (Conventional DAS)
SST
Atmos. Forcing

Best Demonstration:
COMPASS-K(Operational Ocean Assimilation/Prediction System
in Japan Meteorological Agency)Success of 60-day Prediction
of the 2004 Kuroshio Large Meander
Assim/initial state (2004/05/09) Velocity field Forecast (2004/06/30)
JMA Japan-GODAE SERVER http://godae.kishou.go.jp/

PICES 2007/11/02 24
Press Release (Kuroshio Large Meander)
2004/05 -> 2004/08
Mainichi Newspaper2005/04/22Bonito, flying fish decreased markedlyFisherman cries …!
JMA called societies attention to the Kuroshio large meander’s influence to fisheries and shipping industries etc. in May 2004.

PICES 2007/11/02 25
PredictionInitial: July 1st, 2004
•The small meander propagates east-ward and develops in July.
•The Kuroshio has a large meandering path (tLM-type in Fig. 1) in the middle of August.
Horizontal velocity (vector) and temperature (color) at 200m depth.
Prediction
Real state (assimilation)
July
July
Augu
stAu
gust
•Many features in the real state (development of small meander, the period of rapid growth of meander, amplitude of the large meander, etc) are successfully predicted.
•It is because the seed of the meander is properly assimilated in the initial condition.
MOVE-WNP(0.1 deg.)

PICES 2007/11/02 26
Predictability (single prediction)
time evolution of SSHA prediction error
•Predictive limit of our system is roughly 40-60 days. This fine resolution model is better than ¼ deg. model
•Predictive limit is much longer than the persistence.
•The spatial distribution of SSH RMSE shows the largest error south of Tokai (pointed area in Fig. 11).
•The largest error reflects the faster eastward progression speed of the meander as discussed in previous.
•Ensemble prediction is better.
Mean SSH variability = 15.3cm
10 day
30 day
60 day
RM
S er
ror
(cm
)
Lead time (day)
JMA’s newOperationalForecastingSystem(everyday,Real time,2 monthsForecast)

PICES 2007/11/02 27
Data ServerData Server
• JMA Japan-GODAE LAS server
http://godae.kishou.go.jp/
• NEARGOOS Regional Real Time Data Base
http://goos.kishou.go.jp/

PICES 2007/11/02 28
Comments
1. An Example of Operational Systems of physical oceanography2. Future directions=> OSE type leads estimation/reconstruction of observation
Ocean-Atmosphere Coupled Data AssimilationCoastal-shelf sea application Earth system model (coupled physical biogeochemical and
ecosystem, with atmospheric model/assimilation) 3.RecommendationsTo Physical Oceanogr. group=> Improve
Physics model with high resolution and high qualityMixed Layer Depth, Vertical Mixing
(vertical velocity, vertical diffusivity )To Biogeochemical & ecosystem oceanogr. group=> Improve your physics model with data assimilation, when you
assimilate observation into your biogeochemical/ecosystem.