Embed Size (px)
Citation preview
An evaluation study of the total Sanitation
Program at the open defecation free (ODF)
Locations of ACF
Ambuja Cement Foundation, Mumbai
An evaluation study of the total sanitation
program at the open defecation free (ODF)
Locations of ACF
Research Team, ACF
AMBUJA CEMENT FOUNDATION, Mumbai
March 2019
1
Preface
Ambuja Cement Foundation (ACF) has been working with communities in the rural and remote
parts of India. Established in 1993, ACF endeavours to build a prosperous and progressive rural
society.
The Foundation was established as the CSR arm of Ambuja Cements Limited – to help neigh-
bouring communities prosper as the business progresses. In the last 25 years, ACF has successfully
brought in some significant impact on the ground – not only in the villages neighbouring Ambuja’s
plants, but also beyond the core geographies. Today, ACF has its presence in 22 locations across
11 states of India and has reached out to over 24 lakh people.
While Ambuja Cement – ACF’s parents company, has played a major role in the organization’s
success, ACF has also built a robust set of partnerships which has been extremely crucial in the
growth story of the organization. In fact, more than 60% of the total ACF funds are generated
from various partners, including the government and nodal agencies, development agencies as well
as corporates.
Over the years, ACF has built its core strength as an implementing organization. The team’s rap-
port with the local community, effective project execution and strong compliance mechanism is
making ACF one of the most trusted partners. In the coming years, the Foundation wants to
strengthen its network of funding and knowledge partners – thus expanding our work through
new projects and by venturing into new geographies.
This study involves a review of literature about the Swachh Bharat Mission, status of toilet own-
ership by households in the villages, perception and experiences of people about the health im-
pacts. The study has adopted both qualitative and quantitative methods and the qualitative meth-
ods include FGDs with Male and female members of the villages and the quantitative method
includes a sample survey of 600 households about having a toilet and the usage pattern. One ques-
tionnaire per village was also administered to check the toilet facility in the Anganwadi and schools
in the village.
The report is the outcome of the study. Though the study has limitations in measuring the impact
precisely, it provides insights into the program even from community’s point of view. We hope
the report provides a rich source of information not only to ACF but also to the other stakehold-
ers.
The Authors Ambuja Cement Foundation Mumbai
2
Acknowledgements
On behalf of the Ambuja Cement Foundation the Research team of the study is grateful to the
AGMs at the locations for providing all the support required for the study.
We thank the ACF staff of all the ‘team offices’ in different study locations for providing support
to the study teams and sharing information about and facilitating the survey work. We also thank
the ACF field level staff for getting involved in data collection for the study.
At the community level, the study team contacted some influential persons, village leaders and
men and women in the villages and conducted FGDs. The community people participated actively
and shared considerable information including their concerns. We thank them all.
At ACF, the research team worked tirelessly in planning for the study, collecting qualitative and
quantitative information, compiling them and writing the report. We place on record their sincere
and dedicated work.
The Authors Ambuja Cement Foundation Mumbai.
3
Contents
Preface .............................................................................................................................................. 1
Acknowledgements ............................................................................................................................ 2
Contents ............................................................................................................................................ 3
List of Tables ..................................................................................................................................... 4
Study Team ........................................................................................................................................ 5
Abbreviations .................................................................................................................................... 6
Chapter 1 ............................................................................................................................. 7
Introduction to Swachh Bharat Mission and ACFs role in its Locations ........................ 7
Background .................................................................................................................... 7
Open defecation policies in India ..................................................................................................... 7
ACFs role in contributing to Swachh Bharat Mission ................................................... 9
School Sanitation: ............................................................................................................................. 9
Actions for Sustainability: .............................................................................................................. 10
Household level Sanitation in villages: .......................................................................................... 11
Chapter 2 ........................................................................................................................... 12
Study Design and Study Locations ................................................................................. 12
Objectives/Research Questions .................................................................................... 12
Methodology ................................................................................................................ 12
Study Area and Sampling ................................................................................................................ 12
Study Team and Field work ............................................................................................................ 14
Coverage of FGDs and Households ............................................................................. 14
Profile of Households ................................................................................................... 15
Chapter 3 ........................................................................................................................... 18
The Reach of Swachh Bharat Mission and impact of ACFs interventions .................... 18
Availability of toilet facility across Locations ............................................................. 18
Access to toilet facility and Usage and behavior of household members .................... 20
Physical observation of fly-proofing and safe Septage disposal in the household
toilets ............................................................................................................................ 22
Physical observation of Open defecation in or around village and status of Anganwadi
and School toilets ......................................................................................................... 24
Chapter 4 ........................................................................................................................... 26
Case Studies ..................................................................................................................... 26
Case Study 1 ................................................................................................................. 26
Case Study 2 ................................................................................................................. 26
Case Study 3 ................................................................................................................. 27
Case Study 4 ................................................................................................................. 27
Case Study 5 ................................................................................................................. 27
Wall Paintings at Farakka for awareness generation ................................................... 28
Chapter 5 ........................................................................................................................... 29
Summary of Findings ....................................................................................................... 29
4
List of Tables
Table 1.2: Location wise number of schools covered by ACF ......................................... 10 Table 1.2: List of selected Locations and Villages selected for the Sample Study .......... 13 Table 1.3: Gap analysis of number of toilets location wise............................................... 14 Table 2.1: Religion and Caste Composition of Households by Location .......................... 15 Table 2.2: Socioeconomic Characteristics of the Study Population by Location.............. 17 Table 3.1: Availability of toilet facility, how was the toilet constructed and who constructed
the toilet among the households by Location ......................................................... 19 Table 3.2: Availability of toilet facility by caste class ........................................................ 20 Table 3.3: Behavior of household members in toilet usage and other hygiene
indicators ................................................................................................................ 21 Table 3.4: Fly-proofing and safe septage disposal of toilets location wise. ...................... 23 Table 3.5: Physical observation of OD in villages and status of Anganwadi and school
toilets by locations. ................................................................................................. 25
5
Study Team
Principal Investigators Anagha Mahajani, Shilpi Vineet Gupta
Officer Research
Mr. Suryakant Somwanshi
Field Investigators
Mr. Afzal Ahmed,
Mr. Akhtar Sayyad,
Mr. Amit Dewangan,
Mr. Biswajit Satra,
Mr. H K Sharma,
Mr. Jai Singh,
Mr. Kallol Das,
Mr. Khilesh,
Mr. Manjeet Singh,
Mr. Prakash Rawat,
Mr. Rajan Mondal,
Mr. Resh Verma,
Mr. Sourav Mukherjee,
Ms. Sonu Devi,
Mr. Taril Haldar
6
Abbreviations
ACF Ambuja Cement Foundation
APL Above Poverty Line
BPL Below poverty Line
CRSP Central Rural Sanitation Program
FGD Focus Group Discussions
MNB Mission Nirmal Bangla
NBA Nirmal Bharat Abhiyan
ODF Open Defecation Free
SBA Swachh Bharat Abhiyan
SBM Swachh Bharat Mission
SC Schedule Caste
SMC School Management Committee
ST Schedule Tribe
TSC Total Sanitation Campaign
UNICEF United Nations International Children’s Emergency Fund
UP Uttar Pradesh
WB World Bank
WHO World Health Organization
7
Chapter 1
Introduction to Swachh Bharat Mis-
sion and ACFs role in its Locations
Background
India is a developing nation. Around 68% population lives in the rural areas. It is the seventh
largest economy in the world and one of the fastest growing countries. However, significant chal-
lenges to the provision of environmental services such as water, sanitation, solid waste manage-
ment, and drainage. In India Open defecation is one of the major health hazards and it affects
environment. Even when people are not aware of the health risks related to open defecation.
Compare to rural India, urban people are using a toilets health and hygiene. In rural India, open
defecation is everywhere among all socio-economic groups although the bottom two wealth quin-
tiles practice it on the whole rural households.
Open defecation policies in India
The first Indian national campaign to target open defecation launched the Central Rural Sanitation
Program (CRSP-1986). The main ob-
jectives of the program was to provide
25% of the rural population with im-
proving the quality of life and also pro-
vide privacy and dignity to women im-
proved hygiene amenities, with the fo-
cus of latrine construction. As a result,
latrines were built despite low demand
and they went largely unused. In 1999, CRSP as updated as the Total Sanitation Campaign (TSC).
To make India open defecation free by 2017, Total Sanitation Campaign also offered financial
subsidies for Below Poverty Line (BPL) families for toilet construction. But, census 2011, report
shows moderate increase of toilets in India. In 2012, the TSC was replaced by Nirmal Bharat
Abhiyan (NBA) with the new target to improved sanitation facilities for rural households. Under
this scheme, toilet construction subsidies increased to 5,500 rupees including Above Poverty Line
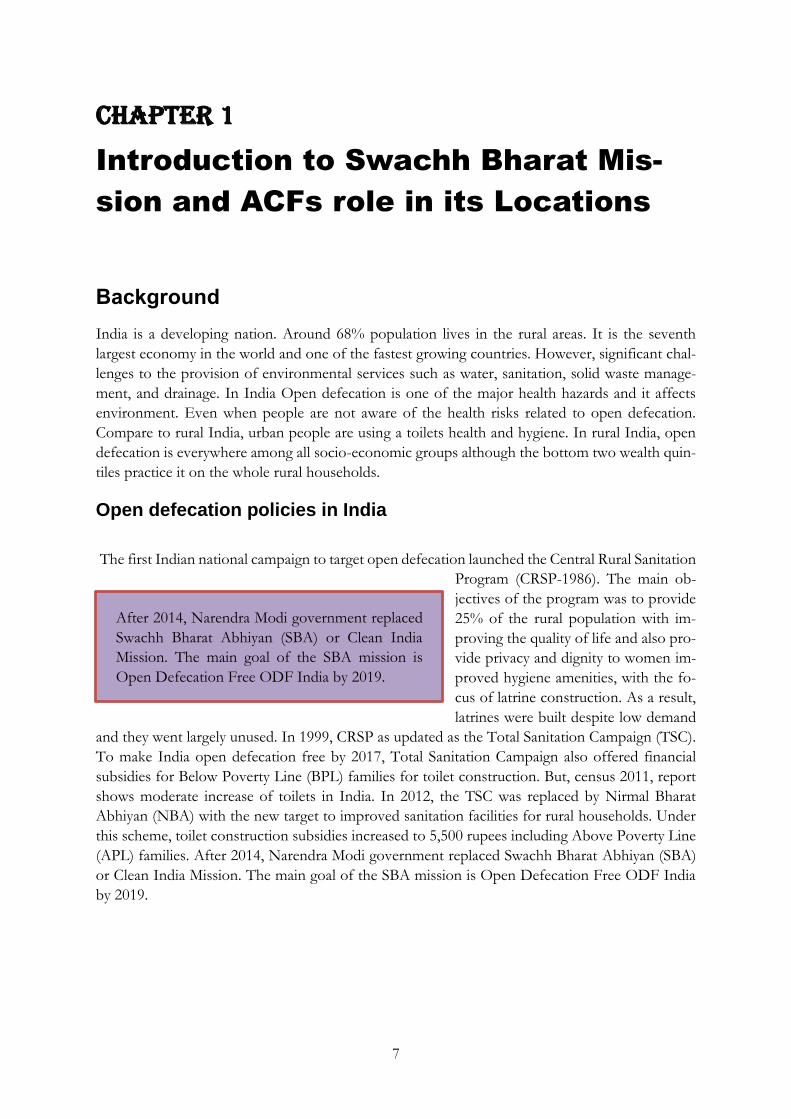
(APL) families. After 2014, Narendra Modi government replaced Swachh Bharat Abhiyan (SBA)
or Clean India Mission. The main goal of the SBA mission is Open Defecation Free ODF India
by 2019.
After 2014, Narendra Modi government replaced
Swachh Bharat Abhiyan (SBA) or Clean India
Mission. The main goal of the SBA mission is
Open Defecation Free ODF India by 2019.

8
Figure No: 1, Open Defecation Per Square Kilometre
*Source: UNICEF-WHO Joint Monitoring Programme.
India has four times in global rate, with nearly 60% of its population practicing open defecation.
The problem is most acute in rural regions and the northern states are practicing more to defecate
in open (UNICEF-WHO Joint Monitoring Programme 2012).
According to the India Assessment 2012 – Water Supply & Sanitation, people do not use toilets
as they are not aware of its potential health benefits and its consequent economic benefits
India is the capital of open defecation, approximately 59% of the people defecate practice in open
places. The 2011 census showed that 46.9% household has toilets and 3.2% use public toilets,
remaining 49.8% of people are defecating in the open. The practice has been widely accepted for
generations, becoming a well-established tradition deeply ingrained from early childhood and is
almost an accepted part of the Indian landscape. Open defecation is rampant in rural India where
it is practiced by nearly 70% of the rural population, compared to 13% in urban areas.
A World Bank (WB) research in India has concluded that merely building toilets won’t stop Indians
from defecating in the open as long as their attitudes towards latrines do not change. The research
was conducted in five villages in the Ghazipur district of eastern Uttar Pradesh (UP). The state has
a high burden of open defecation.
The first round of the survey was conducted at the household level, across 204 households that
owned latrines, between January and February 2017. The second phase was conducted in March
2017.
The researchers measured four key aspects of open defecation including defecation practices, ac-
ceptability of open defecation, enforcement of toilet use, and notions of purity attached to toilet
construction.
9
They found that around 40 per cent of people having toilets in their houses did not use them.
Many of the respondents associated toilets with gandagi (dirt). People’s beliefs were closely linked
to their perception of what others believed. This meant that social norms had a big say on individ-
ual attitudes.
The researchers concluded that policy makers needed to give proper thought and make adequate
efforts to get the desired change in behaviour related to toilet uses.
ACFs role in contributing to Swachh Bharat Mission
Ambuja Cement Foundation has started working on sanitation in its locations one and half decades
back as part of the integrated health programs. In line with Prime Minister of India’s “Swachh
Bharat Mission” initiative with objective to clean cities and make open defecation free rural &
urban area by 2019, Ambuja Cement Foundation (ACF) also took initiative in its core villages to
contribute to Swachh Bharat Mission and made all the core villages Open defecation free by 2019.
ACF has presence in 11 Indian states and working on need based programs such as water, agricul-
ture, health, sanitation, livelihood and education. For this program ACF is working at two levels –
households and schools.
School Sanitation:
The interventions of school sanitation program are
1. Building toilets with proper water facility in the schools especially for girls
2. Repairing dysfunctional toilets
3. Inculcate behavioral change in school children towards using toilets and urinals.
4. Dissemination of benefits of toilets to families and community at large.
5. Innovative and self-sustaining exercises
Implementation Strategy:
A school wise survey was done in 231 core villages where ACF is working. During survey ACF
representatives met schools staff and also physically verified the existing sanitation facilities/toilets.
Total 267 schools were identified where new or repairing of existing toilets were required.
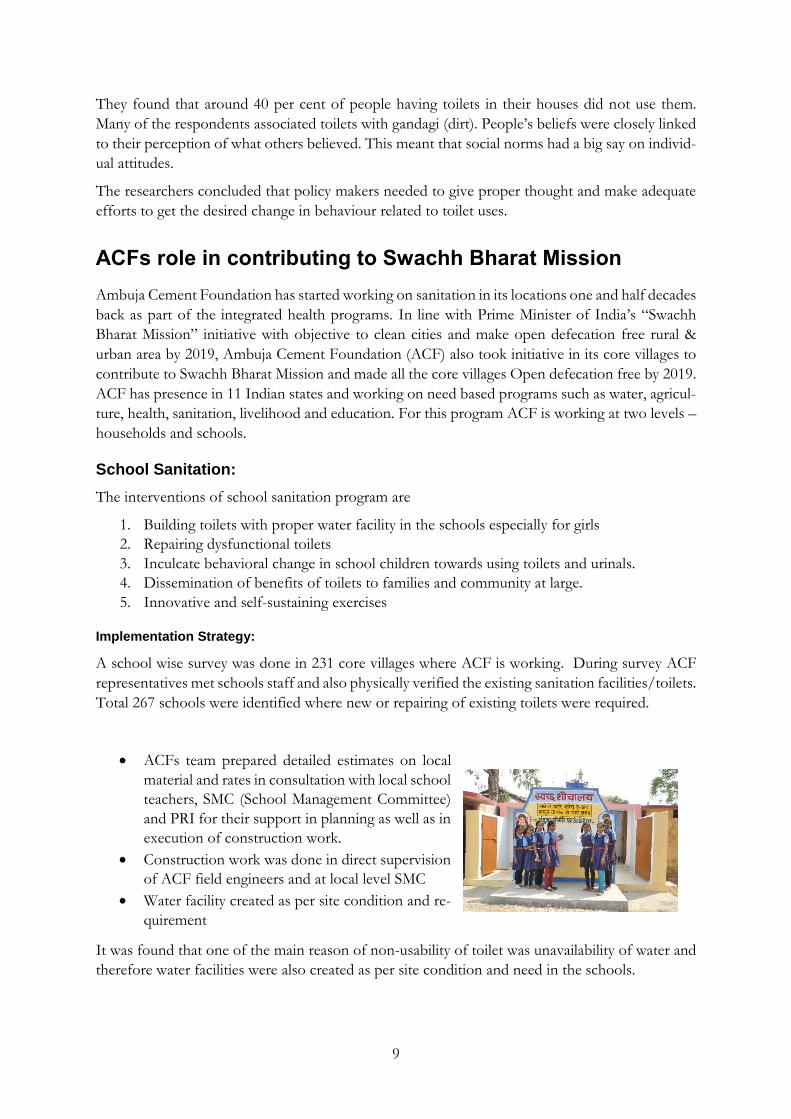
ACFs team prepared detailed estimates on local
material and rates in consultation with local school
teachers, SMC (School Management Committee)
and PRI for their support in planning as well as in
execution of construction work.
Construction work was done in direct supervision
of ACF field engineers and at local level SMC
Water facility created as per site condition and re-
quirement
It was found that one of the main reason of non-usability of toilet was unavailability of water and
therefore water facilities were also created as per site condition and need in the schools.
10
Achievements:
Total number of schools covered : 176
Schools where new toilet blocks constructed : 88
Schools where exiting toilet blocks repaired : 75
School where water facility created for sanitation : 13
Expenditure made : 144.38 Lakhs
Location wise details are given in the table below
Table 1.2: Location wise number of schools covered by ACF
Sl Location States No. of school covered by ACF
1 Bhatinda Punjab 23
2 Ropar Punjab 1
3 Dadri U.P. 12
4 Nalagarh H.P. 8
5 Roorkee U.K. 14
6 Darlaghat H.P. 6
7 Rabriyawas Rajasthan 26
8 Marwar Mundwa Rajasthan 1
9 Ambujanagar Gujarat 22
10 Chandrapur Maharashtra 26
11 Bhatapara Chhattisgarh 12
12 Sankrail W.B. 12
13 Farakka W.B. 10
14 Nadikudi A.P. 3
Total 176
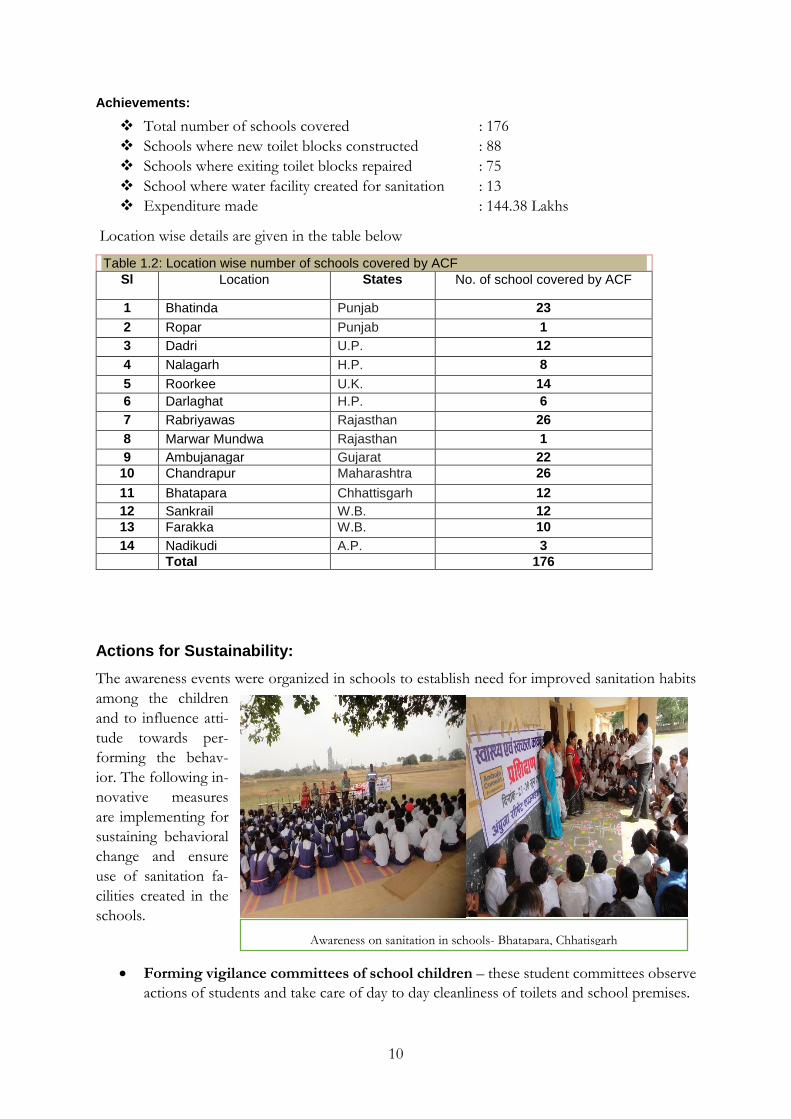
Actions for Sustainability:
The awareness events were organized in schools to establish need for improved sanitation habits
among the children
and to influence atti-
tude towards per-
forming the behav-
ior. The following in-
novative measures
are implementing for
sustaining behavioral
change and ensure
use of sanitation fa-
cilities created in the
schools.
Forming vigilance committees of school children – these student committees observe
actions of students and take care of day to day cleanliness of toilets and school premises.
Awareness on sanitation in schools- Bhatapara, Chhatisgarh
11
Awareness on improved sanitation practices in the schools- these events help in mo-
tivating children to use sanitation facilities and also personal hygiene, washing hands before
and after meal, cleanliness of house and overall cleanliness of the village.
Follow up by SMC & ACF Team – ACF team randomly visit schools to check whether
the toilets are in use or not, if not then it was raised with school administration and school
management committees.
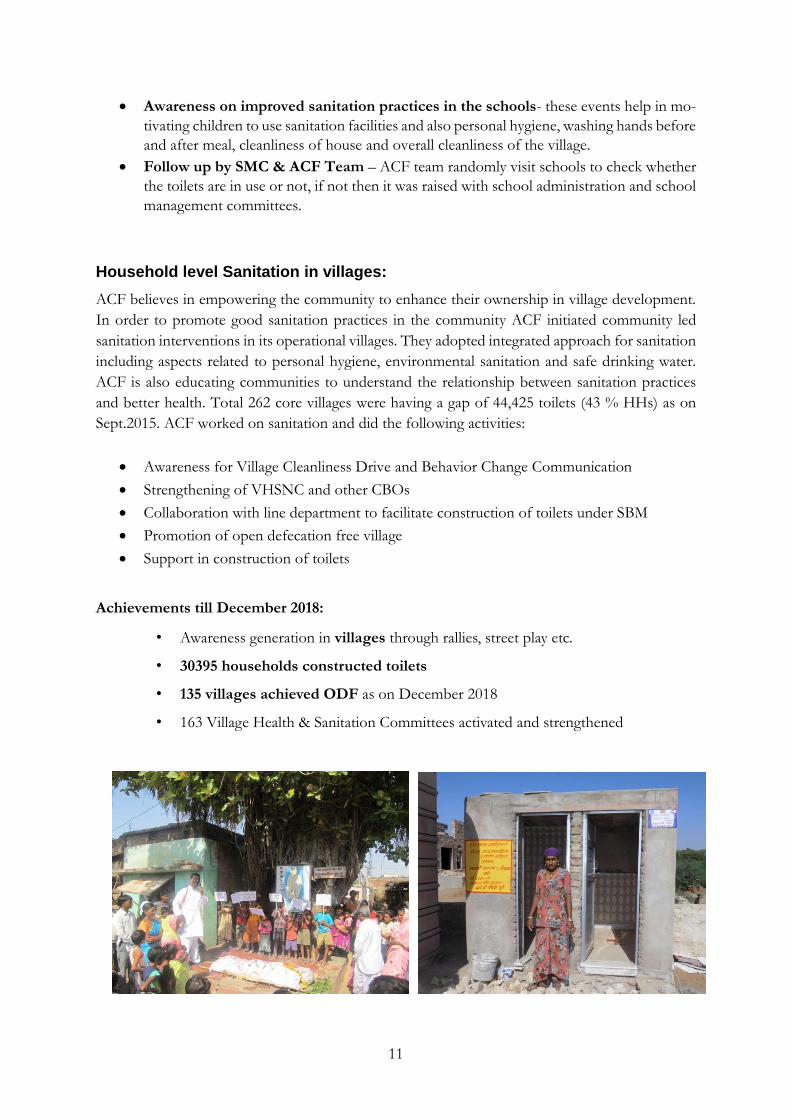
Household level Sanitation in villages:
ACF believes in empowering the community to enhance their ownership in village development.
In order to promote good sanitation practices in the community ACF initiated community led
sanitation interventions in its operational villages. They adopted integrated approach for sanitation
including aspects related to personal hygiene, environmental sanitation and safe drinking water.
ACF is also educating communities to understand the relationship between sanitation practices
and better health. Total 262 core villages were having a gap of 44,425 toilets (43 % HHs) as on
Sept.2015. ACF worked on sanitation and did the following activities:
Awareness for Village Cleanliness Drive and Behavior Change Communication
Strengthening of VHSNC and other CBOs
Collaboration with line department to facilitate construction of toilets under SBM
Promotion of open defecation free village
Support in construction of toilets
Achievements till December 2018:
• Awareness generation in villages through rallies, street play etc.
• 30395 households constructed toilets
• 135 villages achieved ODF as on December 2018
• 163 Village Health & Sanitation Committees activated and strengthened
12
Chapter 2
Study Design and Study Locations
In this chapter, we present the research questions (objectives of the study), research method, sam-
pling, field operations, and an account of the study locations and the study subjects (FGD partic-
ipants and interviewed respondents).
Objectives/Research Questions
The objectives or research questions for the study are to understand
A) If the villages declared as ODF are ODF in reality as per government of India guidelines?
B) If all the members of the households having toilets using the toilets? What are their habits
in terms of the use of toilets?
C) If there a difference between the habits of household members of the toilets constructed
by ACF support and the households where the toilets are constructed by the government
or on their own?
D) What are the solid waste and garbage disposal systems and practices that the villages have
adopted?
E) How do men and women of the ODF villages feel about it?
F) What is the impact on the health of people living in the ODF villages? Is there a decrease
in number of communicable diseases?
G) To have learnings from the review of the program and its strategy and approaches
Methodology
The study involved the following components
1. A short review of literature (already presented)
2. Focus Group Discussions (FGDs) with males and females in the villages.
3. A household survey to ascertain the status of toilets in the households and impact of ACFs
interventions.
Study Area and Sampling
As per the latest report on sanitation, there were 6 ACF locations (Ropar, Nalagarh, Darlaghat,
Bhatapara, Sankrail and Farakka) where all the villages were declared as ODF by Government. It
was proposed to conduct the study in those 6 ODF locations. Two ODF villages from each of the
six locations were selected for the village and household level survey. The schools and Anganwadis
13
coming under these villages were also covered for the audit (physical verification) of toilets in the
schools. The list of the selected locations and villages for the study is presented in the table below.
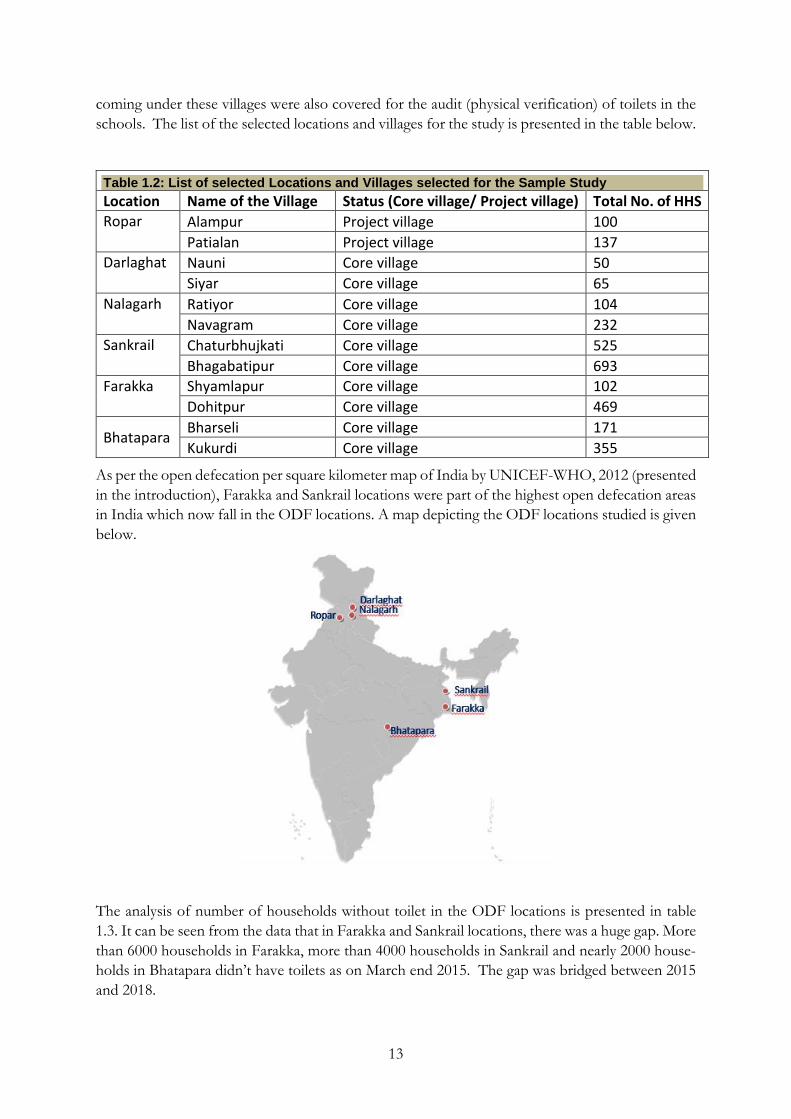
Table 1.2: List of selected Locations and Villages selected for the Sample Study
Location Name of the Village Status (Core village/ Project village) Total No. of HHS
Ropar Alampur Project village 100
Patialan Project village 137
Darlaghat Nauni Core village 50
Siyar Core village 65
Nalagarh Ratiyor Core village 104
Navagram Core village 232
Sankrail Chaturbhujkati Core village 525
Bhagabatipur Core village 693
Farakka Shyamlapur Core village 102
Dohitpur Core village 469
Bhatapara Bharseli Core village 171
Kukurdi Core village 355
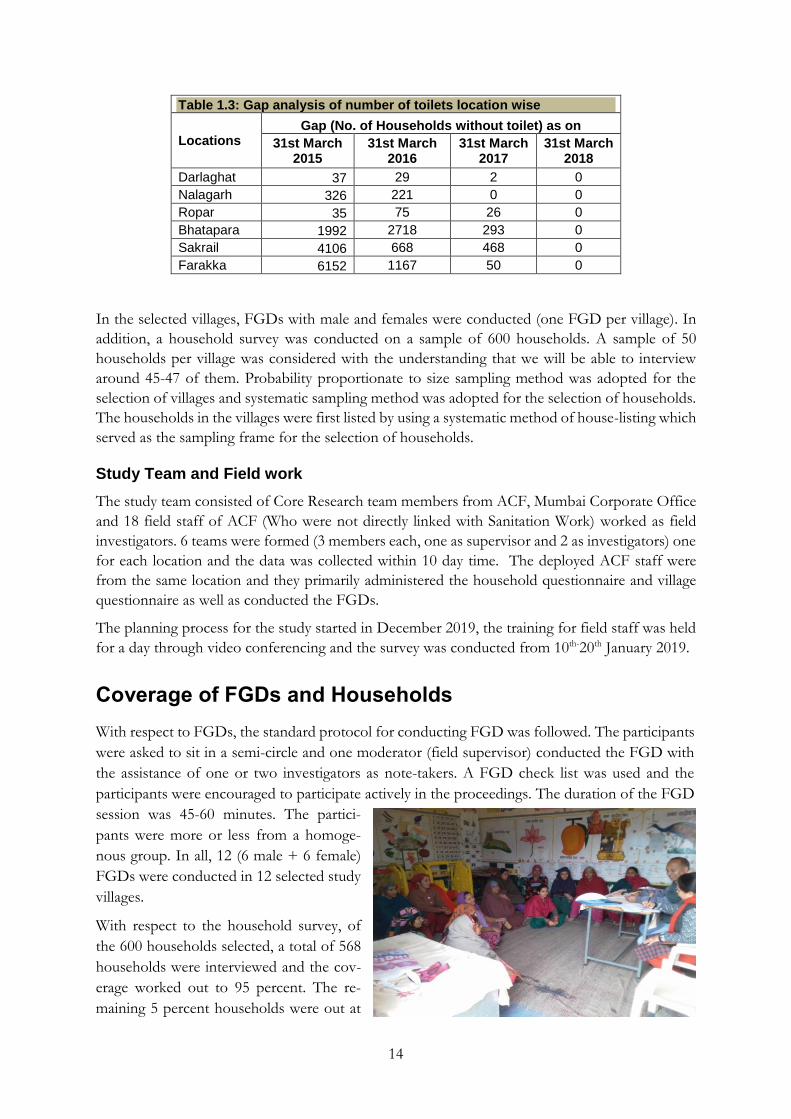
As per the open defecation per square kilometer map of India by UNICEF-WHO, 2012 (presented
in the introduction), Farakka and Sankrail locations were part of the highest open defecation areas
in India which now fall in the ODF locations. A map depicting the ODF locations studied is given
below.
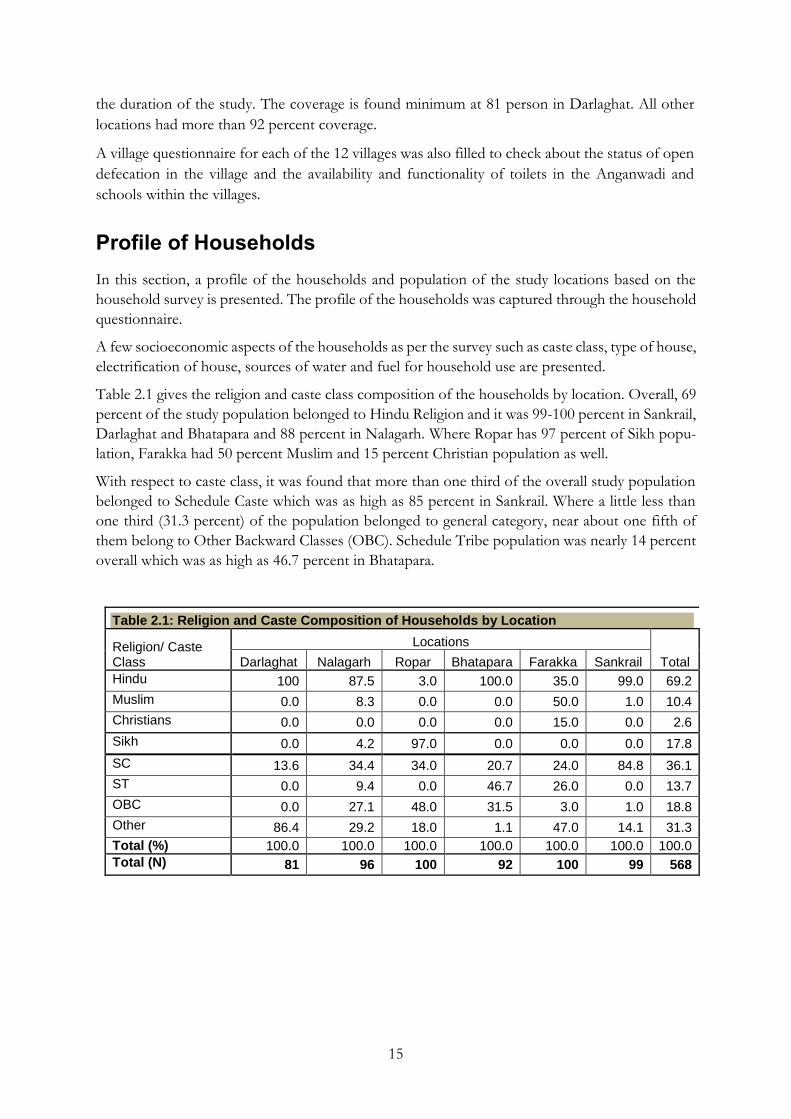
The analysis of number of households without toilet in the ODF locations is presented in table
1.3. It can be seen from the data that in Farakka and Sankrail locations, there was a huge gap. More
than 6000 households in Farakka, more than 4000 households in Sankrail and nearly 2000 house-
holds in Bhatapara didn’t have toilets as on March end 2015. The gap was bridged between 2015
and 2018.
14
Table 1.3: Gap analysis of number of toilets location wise
Locations Gap (No. of Households without toilet) as on
31st March 2015
31st March 2016
31st March 2017
31st March 2018
Darlaghat 37 29 2 0
Nalagarh 326 221 0 0
Ropar 35 75 26 0
Bhatapara 1992 2718 293 0
Sakrail 4106 668 468 0
Farakka 6152 1167 50 0
In the selected villages, FGDs with male and females were conducted (one FGD per village). In
addition, a household survey was conducted on a sample of 600 households. A sample of 50
households per village was considered with the understanding that we will be able to interview
around 45-47 of them. Probability proportionate to size sampling method was adopted for the
selection of villages and systematic sampling method was adopted for the selection of households.
The households in the villages were first listed by using a systematic method of house-listing which
served as the sampling frame for the selection of households.
Study Team and Field work
The study team consisted of Core Research team members from ACF, Mumbai Corporate Office
and 18 field staff of ACF (Who were not directly linked with Sanitation Work) worked as field
investigators. 6 teams were formed (3 members each, one as supervisor and 2 as investigators) one
for each location and the data was collected within 10 day time. The deployed ACF staff were
from the same location and they primarily administered the household questionnaire and village
questionnaire as well as conducted the FGDs.
The planning process for the study started in December 2019, the training for field staff was held
for a day through video conferencing and the survey was conducted from 10th-20th January 2019.
Coverage of FGDs and Households
With respect to FGDs, the standard protocol for conducting FGD was followed. The participants
were asked to sit in a semi-circle and one moderator (field supervisor) conducted the FGD with
the assistance of one or two investigators as note-takers. A FGD check list was used and the
participants were encouraged to participate actively in the proceedings. The duration of the FGD
session was 45-60 minutes. The partici-
pants were more or less from a homoge-
nous group. In all, 12 (6 male + 6 female)
FGDs were conducted in 12 selected study
villages.
With respect to the household survey, of
the 600 households selected, a total of 568
households were interviewed and the cov-
erage worked out to 95 percent. The re-
maining 5 percent households were out at
15
the duration of the study. The coverage is found minimum at 81 person in Darlaghat. All other
locations had more than 92 percent coverage.
A village questionnaire for each of the 12 villages was also filled to check about the status of open
defecation in the village and the availability and functionality of toilets in the Anganwadi and
schools within the villages.
Profile of Households
In this section, a profile of the households and population of the study locations based on the
household survey is presented. The profile of the households was captured through the household
questionnaire.
A few socioeconomic aspects of the households as per the survey such as caste class, type of house,
electrification of house, sources of water and fuel for household use are presented.
Table 2.1 gives the religion and caste class composition of the households by location. Overall, 69
percent of the study population belonged to Hindu Religion and it was 99-100 percent in Sankrail,
Darlaghat and Bhatapara and 88 percent in Nalagarh. Where Ropar has 97 percent of Sikh popu-
lation, Farakka had 50 percent Muslim and 15 percent Christian population as well.
With respect to caste class, it was found that more than one third of the overall study population
belonged to Schedule Caste which was as high as 85 percent in Sankrail. Where a little less than
one third (31.3 percent) of the population belonged to general category, near about one fifth of
them belong to Other Backward Classes (OBC). Schedule Tribe population was nearly 14 percent
overall which was as high as 46.7 percent in Bhatapara.
Table 2.1: Religion and Caste Composition of Households by Location
Religion/ Caste Class
Locations
Total Darlaghat Nalagarh Ropar Bhatapara Farakka Sankrail
Hindu 100 87.5 3.0 100.0 35.0 99.0 69.2
Muslim 0.0 8.3 0.0 0.0 50.0 1.0 10.4
Christians 0.0 0.0 0.0 0.0 15.0 0.0 2.6
Sikh 0.0 4.2 97.0 0.0 0.0 0.0 17.8
SC 13.6 34.4 34.0 20.7 24.0 84.8 36.1
ST 0.0 9.4 0.0 46.7 26.0 0.0 13.7
OBC 0.0 27.1 48.0 31.5 3.0 1.0 18.8
Other 86.4 29.2 18.0 1.1 47.0 14.1 31.3
Total (%) 100.0 100.0 100.0 100.0 100.0 100.0 100.0
Total (N) 81 96 100 92 100 99 568

16
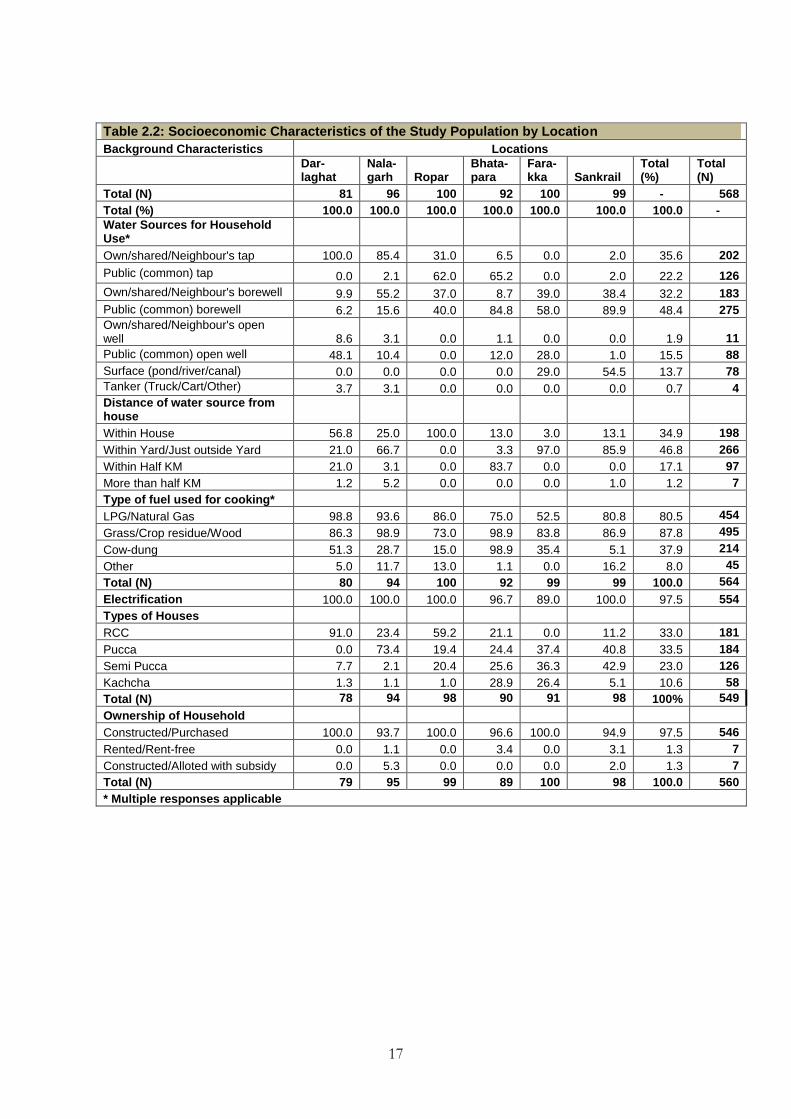
Table 2.2 presents (location-wise) socioeconomic factors of the study population such as type of
house, status of house ownership, electrification of house, sources of water and fuel for household
use and distance to the main water source.
The source of water for household use was largely tap (household/common) in Darlaghat (100
percent) and Nalagarh locations (around 85 percent), largely public tap in Ropar (62 percent),
largely public borewell in Bhatapara and Sankrail (85-90 percent) and Farakka (58 percent). Sur-
prisingly households at Sankrail and Farakka locations nearly have no own/shared tap water con-
nectivity. All of the households in Ropar have some or the other water facility within their prem-
ises which is as less as 3 percent in Farakka and 13 percent in Bhatapara and Sankrail. With respect
to cooking fuel, nearly 80 percent of the households have LPG connection and 88 percent also
use wood/straw/grass as cooking fuel. LPG connection is found lowest at 52 percent in Farakka.
With respect to type of house, one third of the households in the study were RCC and another
one third were found to be pucca houses. 91 percent of the households in Darlaghat were found
RCC followed by Ropar at nearly 60 percent. More than half of the households were semi pucca
or kuchcha in Bhatapara, Farakkka and Sankrail. With respect to electrification of house, it was
observed that all the households were electrified in Darlaghat, Nalagarh, Ropar and Sankrail fol-
lowed by Bhatapara (96.7 percent) and least number of households were electrified in Farakka (89
percent). The households in most of the cases (97.5 percent) were constructed or purchased by
the household members only.
17
Table 2.2: Socioeconomic Characteristics of the Study Population by Location
Background Characteristics Locations
Dar-laghat
Nala-garh Ropar
Bhata-para
Fara-kka Sankrail
Total (%)
Total (N)
Total (N) 81 96 100 92 100 99 - 568
Total (%) 100.0 100.0 100.0 100.0 100.0 100.0 100.0 -
Water Sources for Household Use*
Own/shared/Neighbour's tap 100.0 85.4 31.0 6.5 0.0 2.0 35.6 202
Public (common) tap 0.0 2.1 62.0 65.2 0.0 2.0 22.2 126
Own/shared/Neighbour's borewell 9.9 55.2 37.0 8.7 39.0 38.4 32.2 183
Public (common) borewell 6.2 15.6 40.0 84.8 58.0 89.9 48.4 275
Own/shared/Neighbour's open well 8.6 3.1 0.0 1.1 0.0 0.0 1.9 11
Public (common) open well 48.1 10.4 0.0 12.0 28.0 1.0 15.5 88
Surface (pond/river/canal) 0.0 0.0 0.0 0.0 29.0 54.5 13.7 78
Tanker (Truck/Cart/Other) 3.7 3.1 0.0 0.0 0.0 0.0 0.7 4
Distance of water source from house
Within House 56.8 25.0 100.0 13.0 3.0 13.1 34.9 198
Within Yard/Just outside Yard 21.0 66.7 0.0 3.3 97.0 85.9 46.8 266
Within Half KM 21.0 3.1 0.0 83.7 0.0 0.0 17.1 97
More than half KM 1.2 5.2 0.0 0.0 0.0 1.0 1.2 7
Type of fuel used for cooking*
LPG/Natural Gas 98.8 93.6 86.0 75.0 52.5 80.8 80.5 454
Grass/Crop residue/Wood 86.3 98.9 73.0 98.9 83.8 86.9 87.8 495
Cow-dung 51.3 28.7 15.0 98.9 35.4 5.1 37.9 214
Other 5.0 11.7 13.0 1.1 0.0 16.2 8.0 45
Total (N) 80 94 100 92 99 99 100.0 564
Electrification 100.0 100.0 100.0 96.7 89.0 100.0 97.5 554
Types of Houses
RCC 91.0 23.4 59.2 21.1 0.0 11.2 33.0 181
Pucca 0.0 73.4 19.4 24.4 37.4 40.8 33.5 184
Semi Pucca 7.7 2.1 20.4 25.6 36.3 42.9 23.0 126
Kachcha 1.3 1.1 1.0 28.9 26.4 5.1 10.6 58
Total (N) 78 94 98 90 91 98 100% 549
Ownership of Household
Constructed/Purchased 100.0 93.7 100.0 96.6 100.0 94.9 97.5 546
Rented/Rent-free 0.0 1.1 0.0 3.4 0.0 3.1 1.3 7
Constructed/Alloted with subsidy 0.0 5.3 0.0 0.0 0.0 2.0 1.3 7
Total (N) 79 95 99 89 100 98 100.0 560
* Multiple responses applicable
18
Chapter 3
The Reach of Swachh Bharat Mission
and impact of ACFs interventions
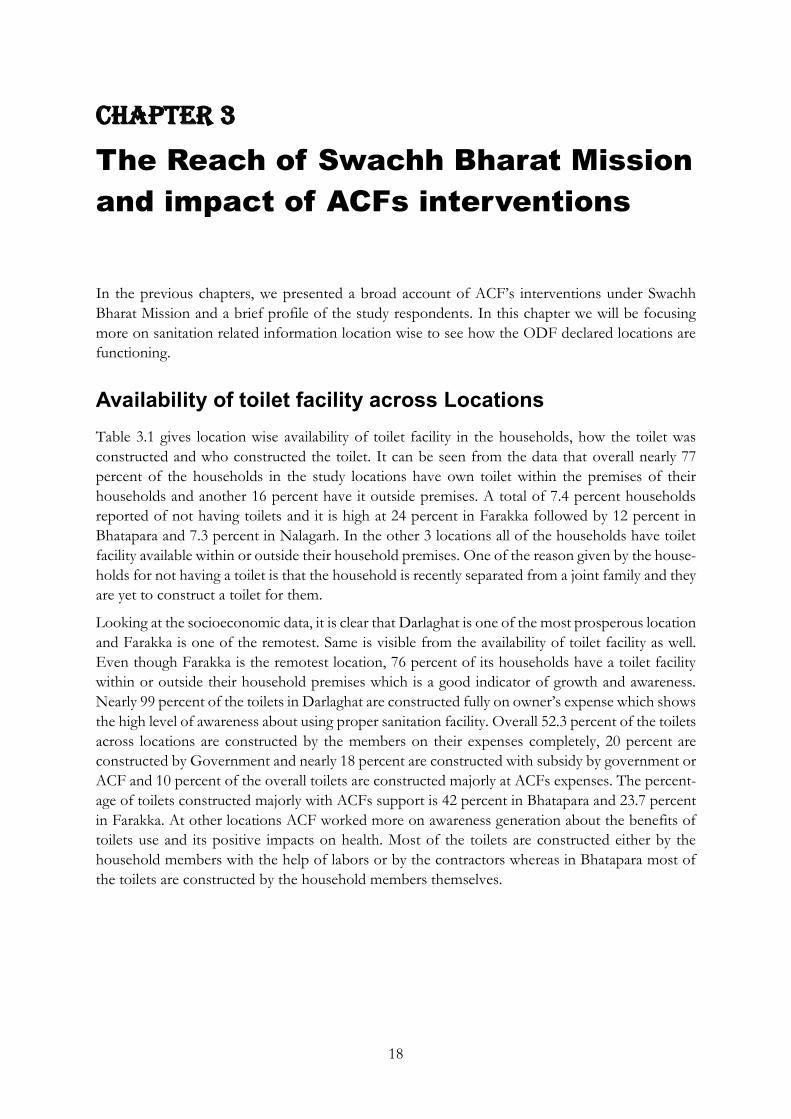
In the previous chapters, we presented a broad account of ACF’s interventions under Swachh
Bharat Mission and a brief profile of the study respondents. In this chapter we will be focusing
more on sanitation related information location wise to see how the ODF declared locations are
functioning.
Availability of toilet facility across Locations
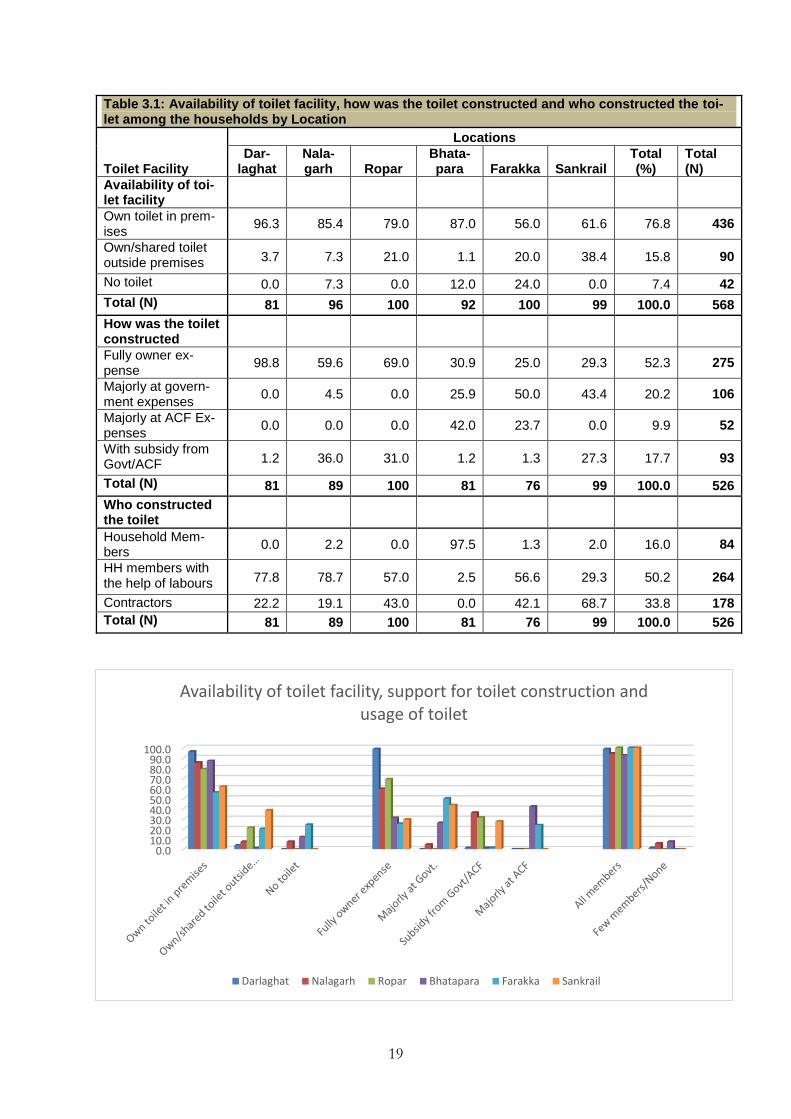
Table 3.1 gives location wise availability of toilet facility in the households, how the toilet was
constructed and who constructed the toilet. It can be seen from the data that overall nearly 77
percent of the households in the study locations have own toilet within the premises of their
households and another 16 percent have it outside premises. A total of 7.4 percent households
reported of not having toilets and it is high at 24 percent in Farakka followed by 12 percent in
Bhatapara and 7.3 percent in Nalagarh. In the other 3 locations all of the households have toilet
facility available within or outside their household premises. One of the reason given by the house-
holds for not having a toilet is that the household is recently separated from a joint family and they
are yet to construct a toilet for them.
Looking at the socioeconomic data, it is clear that Darlaghat is one of the most prosperous location
and Farakka is one of the remotest. Same is visible from the availability of toilet facility as well.
Even though Farakka is the remotest location, 76 percent of its households have a toilet facility
within or outside their household premises which is a good indicator of growth and awareness.
Nearly 99 percent of the toilets in Darlaghat are constructed fully on owner’s expense which shows
the high level of awareness about using proper sanitation facility. Overall 52.3 percent of the toilets
across locations are constructed by the members on their expenses completely, 20 percent are
constructed by Government and nearly 18 percent are constructed with subsidy by government or
ACF and 10 percent of the overall toilets are constructed majorly at ACFs expenses. The percent-
age of toilets constructed majorly with ACFs support is 42 percent in Bhatapara and 23.7 percent
in Farakka. At other locations ACF worked more on awareness generation about the benefits of
toilets use and its positive impacts on health. Most of the toilets are constructed either by the
household members with the help of labors or by the contractors whereas in Bhatapara most of
the toilets are constructed by the household members themselves.
19
Table 3.1: Availability of toilet facility, how was the toilet constructed and who constructed the toi-let among the households by Location
Toilet Facility
Locations
Dar-laghat
Nala-garh Ropar
Bhata-para Farakka Sankrail
Total (%)
Total (N)
Availability of toi-let facility
Own toilet in prem-ises
96.3 85.4 79.0 87.0 56.0 61.6 76.8 436
Own/shared toilet outside premises 3.7 7.3 21.0 1.1 20.0 38.4 15.8 90
No toilet 0.0 7.3 0.0 12.0 24.0 0.0 7.4 42
Total (N) 81 96 100 92 100 99 100.0 568
How was the toilet constructed
Fully owner ex-pense
98.8 59.6 69.0 30.9 25.0 29.3 52.3 275
Majorly at govern-ment expenses
0.0 4.5 0.0 25.9 50.0 43.4 20.2 106
Majorly at ACF Ex-penses
0.0 0.0 0.0 42.0 23.7 0.0 9.9 52
With subsidy from Govt/ACF 1.2 36.0 31.0 1.2 1.3 27.3 17.7 93
Total (N) 81 89 100 81 76 99 100.0 526
Who constructed the toilet
Household Mem-bers
0.0 2.2 0.0 97.5 1.3 2.0 16.0 84
HH members with the help of labours 77.8 78.7 57.0 2.5 56.6 29.3 50.2 264
Contractors 22.2 19.1 43.0 0.0 42.1 68.7 33.8 178
Total (N) 81 89 100 81 76 99 100.0 526
0.010.020.030.040.050.060.070.080.090.0
100.0
Availability of toilet facility, support for toilet construction and usage of toilet
Darlaghat Nalagarh Ropar Bhatapara Farakka Sankrail
20
To have a further understanding of contribution made by the Government and ACF in toilet
construction, the location field teams were approached for discussion. It came out from the dis-
cussion with Farakka team that the state Govt. launched a scheme called ‘Mission Nirmal Bangla’
in 2015 under which the households were supposed to deposit 3200 Rs. to the Panchayat and
remaining 10000 Rs. was contributed by the Govt. and the toilet was constructed for their house-
holds. Some households didn’t have 3200 Rs. so whatever they could contribute they did, and
remaining amount was given by ACF so that they could get toilet constructed for their household
under the scheme. ACF had also given 2000 Rs. as monetary support to the households who
constructed toilets on their own in 2011 and around 1300 toilets were constructed with this sup-
port in Farakka. One of the reason for 24 percent households in Farakka not having toilet facility
is that the households have contributed their share of 3200 Rs. to the panchayat but since the
village is declared as ODF, the scheme is closed and some of the toilets are even left half con-
structed.
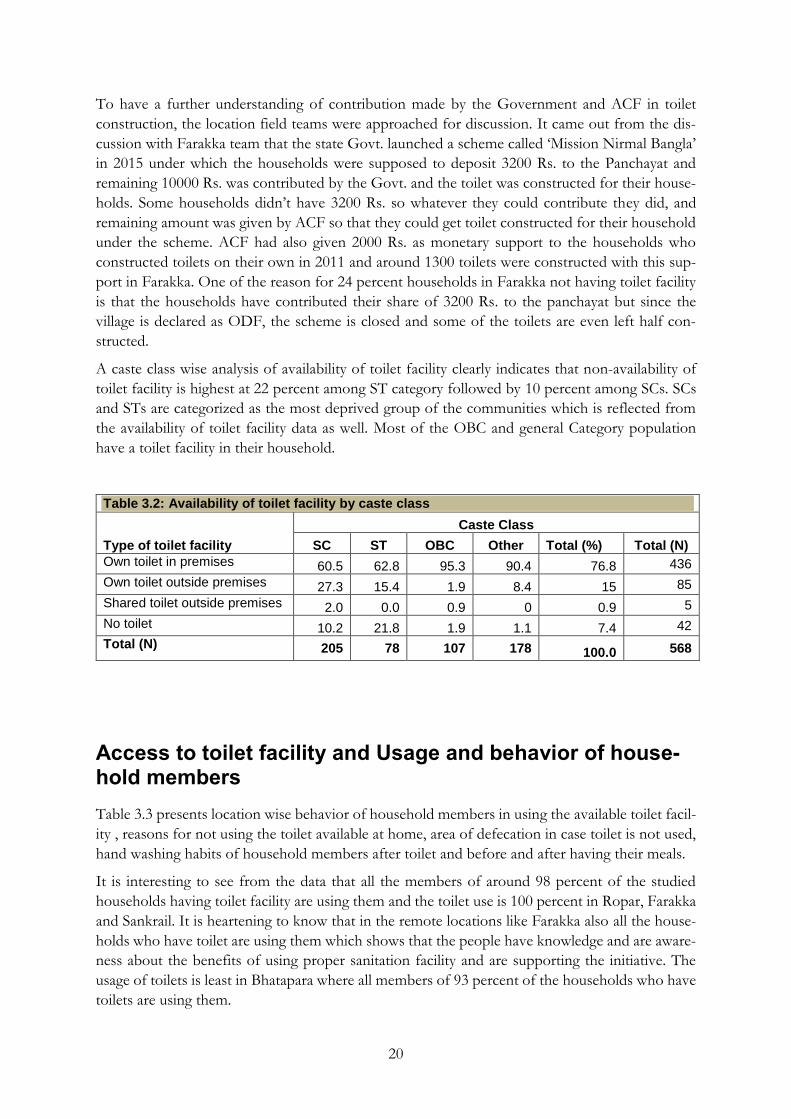
A caste class wise analysis of availability of toilet facility clearly indicates that non-availability of
toilet facility is highest at 22 percent among ST category followed by 10 percent among SCs. SCs
and STs are categorized as the most deprived group of the communities which is reflected from
the availability of toilet facility data as well. Most of the OBC and general Category population
have a toilet facility in their household.
Table 3.2: Availability of toilet facility by caste class
Type of toilet facility
Caste Class
SC ST OBC Other Total (%) Total (N)
Own toilet in premises 60.5 62.8 95.3 90.4 76.8 436
Own toilet outside premises 27.3 15.4 1.9 8.4 15 85
Shared toilet outside premises 2.0 0.0 0.9 0 0.9 5
No toilet 10.2 21.8 1.9 1.1 7.4 42
Total (N) 205 78 107 178 100.0 568
Access to toilet facility and Usage and behavior of house-hold members
Table 3.3 presents location wise behavior of household members in using the available toilet facil-
ity , reasons for not using the toilet available at home, area of defecation in case toilet is not used,
hand washing habits of household members after toilet and before and after having their meals.
It is interesting to see from the data that all the members of around 98 percent of the studied
households having toilet facility are using them and the toilet use is 100 percent in Ropar, Farakka
and Sankrail. It is heartening to know that in the remote locations like Farakka also all the house-
holds who have toilet are using them which shows that the people have knowledge and are aware-
ness about the benefits of using proper sanitation facility and are supporting the initiative. The
usage of toilets is least in Bhatapara where all members of 93 percent of the households who have
toilets are using them.

21
Out of the 12 households who have toilets but are not using them, one third of them do not like
toilet at home, nearly two third of them have mentioned that some of the household members go
to field early morning and one household toilet is not in a usable condition.
Table 3.3: Behavior of household members in toilet usage and other hygiene indicators
Behavior of household members
Location
Dar-laghat
Nala-garh Ropar
Bhata-para Farakka Sankrail
Total (%)
Total (N)
Usage of available toilets
All members 98.8 94.4 100.0 92.6 100.0 100.0 97.7 514
Few members/None 1.2 5.6 0.0 7.4 0.0 0.0 2.3 12
Total (N) 81 89 100 81 76 99 100.0 526
Reasons for not using toilets
Do not like toilet at home 0.0 60.0 - 16.7 - - 33.3 4
Go to field early morning 100.0 40.0 - 66.7 - - 58.3 7
Toilet not in Good Condi-tion
0.0 0.0 - 16.7 - - 8.3 1
Total (N) 1 5 - 6 - - 100.0 12
Area of defecation
Designated defecation area 0.0 0.0 - 88.2 41.7 - 46.3 25
Anywhere/field 0.0 100.0 - 5.9 41.7 - 42.6 23
Community toilet 0.0 0.0 - 5.9 4.2 - 3.7 2
Roadside/Others 100.0 0.0 - 0.0 12.5 - 7.4 4
Total (N) 1 12 - 17 24 -
100.0
54
Habit of washing hands with soap after defeca-tion
100.0 93.8 100.0 97.8 96.0 100.0 97.9 556
Habit of washing hands before and after meals 100.0 72.9 100.0 77.2 97.0 100.0 91.2 518
Total (N) 81 96 100 92 100 99 - 568
Physical verification of availability of Soap and water near the toilet
98.8 69.7 100.0 87.7 75.0 98.0 88.8 467
Total (N) 81 89 100 81 76 99 100.0 526
A further question on where do members go for defecation was asked to the households where
toilet facility is not available including the households which have facility but are not using them.
Nearly half of them reported of going to some designated defecation area, another 43 percent go
anywhere in the field and around 7 percent of the household members defecate roadside. Only 3.7
percent households mentioned of using community toilet. Defecation in some designated area is
as high as 88 percent in Bhatapara where 100 percent households in Nalagarh defecate anywhere
in the fields.
About the habits of hand washing two questions were asked to all the households, one if all the
members wash their hands with soap after defecation and second if all the members wash their
22
hands before and after meals to understand their healthy behavior practices. It can be seen from
the data that overall in 98 percent of the households all the members wash their hands with soap
after defecation which is 100 percent in Darlaghat, Ropar and Sankrail, 96-98 percent in Farakka
and Bhatapara and 94 percent in Nalagarh.
Overall in 91 percent of the households all the members wash their hands before and after meals
and it is also 100 percent in Darlaghat, Ropar and Sankrail. It seems that there is still a need for
ACF to intervene more on knowledge and awareness in Farakka, Bhatapara and Nalagarh. Though
Farakka is close to 100 (97 percent), the habit of people washing their hands before and after meals
is low at 73-77 percent in Nalagarh and Bhatapara.
A physical verification of availability of soap and water near the toilet was conducted by the inves-
tigators in the households having toilet and it was found that overall 89 percent of the households
had soap and water near the toilet. The figure was lowest at 70-75 percent in Nalagarh and Farakka.
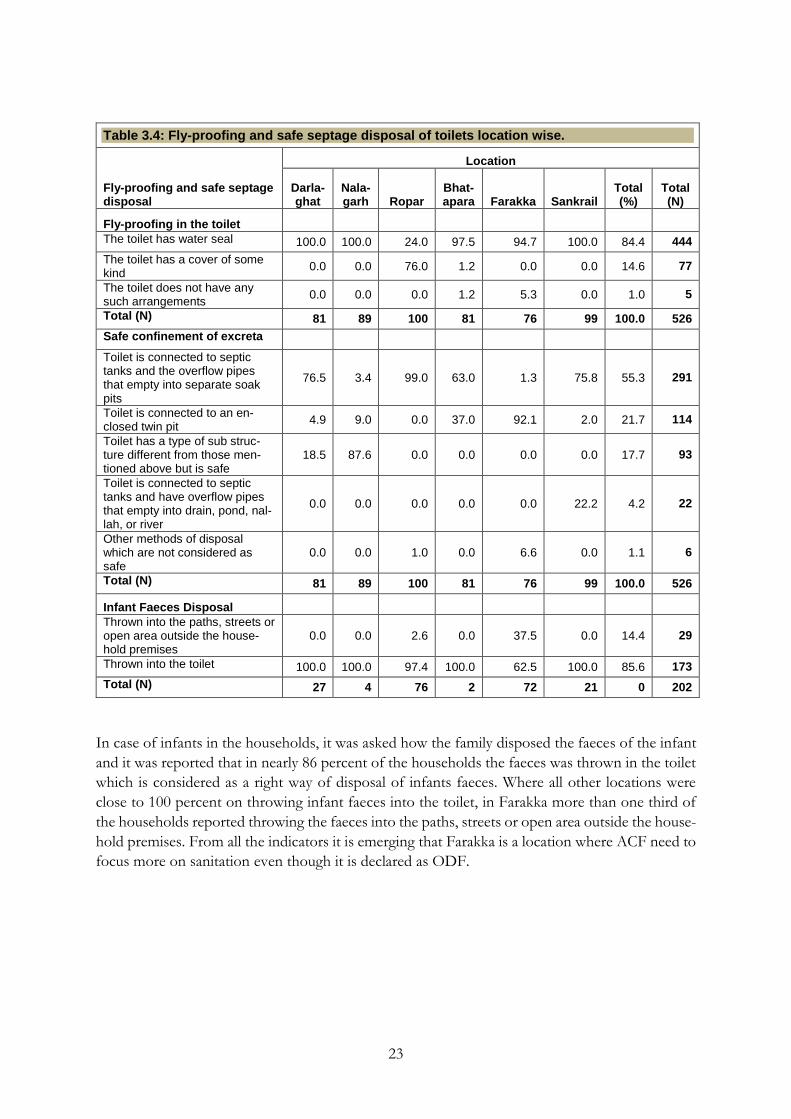
Physical observation of fly-proofing and safe Septage dis-posal in the household toilets
Table 3.4 presents location wise fly-proofing in the toilets, septage disposal system attached to the
toilet and disposal of faeces in case of infants in the households. As per government of India
guidelines, if a toilet has a water seal or some type of cover, it is considered as fly proof. A physical
observation of the toilets was done by the investigators to check if the toilet had arrangements for
fly-proofing and how the septage disposal was done from the toilet. If the toilet is connected to a
closed soak pit or the excreta was disposed to any pond/river/nallah after treatment it is consid-
ered as safe method as per the guidelines.
It is seen from the table that overall 99 percent of the households having toilets have some ar-
rangement for fly-proofing (nearly 84 percent have water seal and 15 percent have cover of some
kind). Only in Farakka little more than 5 percent of the toilets do not have any such arrangements
for fly-proofing. Most of the toilets have water seal in all the locations except for Ropar where 76
percent of the toilets have cover of some kind for fly-proofing.
Only except 5% of the overall toilets, all other toilets are connected to a safe structure for disposal
of excreta. As high as 22 percent of the toilets in Sankrail and 6.6 percent in Farakka are not
connected to a safe excreta disposal system.
23
Table 3.4: Fly-proofing and safe septage disposal of toilets location wise.
Fly-proofing and safe septage disposal
Location
Darla-ghat
Nala-garh Ropar
Bhat-apara Farakka Sankrail
Total (%)
Total (N)
Fly-proofing in the toilet
The toilet has water seal 100.0 100.0 24.0 97.5 94.7 100.0 84.4 444
The toilet has a cover of some kind
0.0 0.0 76.0 1.2 0.0 0.0 14.6 77
The toilet does not have any such arrangements
0.0 0.0 0.0 1.2 5.3 0.0 1.0 5
Total (N) 81 89 100 81 76 99 100.0 526
Safe confinement of excreta
Toilet is connected to septic tanks and the overflow pipes that empty into separate soak pits
76.5 3.4 99.0 63.0 1.3 75.8 55.3 291
Toilet is connected to an en-closed twin pit
4.9 9.0 0.0 37.0 92.1 2.0 21.7 114
Toilet has a type of sub struc-ture different from those men-tioned above but is safe
18.5 87.6 0.0 0.0 0.0 0.0 17.7 93
Toilet is connected to septic tanks and have overflow pipes that empty into drain, pond, nal-lah, or river
0.0 0.0 0.0 0.0 0.0 22.2 4.2 22
Other methods of disposal which are not considered as safe
0.0 0.0 1.0 0.0 6.6 0.0 1.1 6
Total (N) 81 89 100 81 76 99 100.0 526
Infant Faeces Disposal
Thrown into the paths, streets or open area outside the house-hold premises
0.0 0.0 2.6 0.0 37.5 0.0 14.4 29
Thrown into the toilet 100.0 100.0 97.4 100.0 62.5 100.0 85.6 173
Total (N) 27 4 76 2 72 21 0 202
In case of infants in the households, it was asked how the family disposed the faeces of the infant
and it was reported that in nearly 86 percent of the households the faeces was thrown in the toilet
which is considered as a right way of disposal of infants faeces. Where all other locations were
close to 100 percent on throwing infant faeces into the toilet, in Farakka more than one third of
the households reported throwing the faeces into the paths, streets or open area outside the house-
hold premises. From all the indicators it is emerging that Farakka is a location where ACF need to
focus more on sanitation even though it is declared as ODF.
24
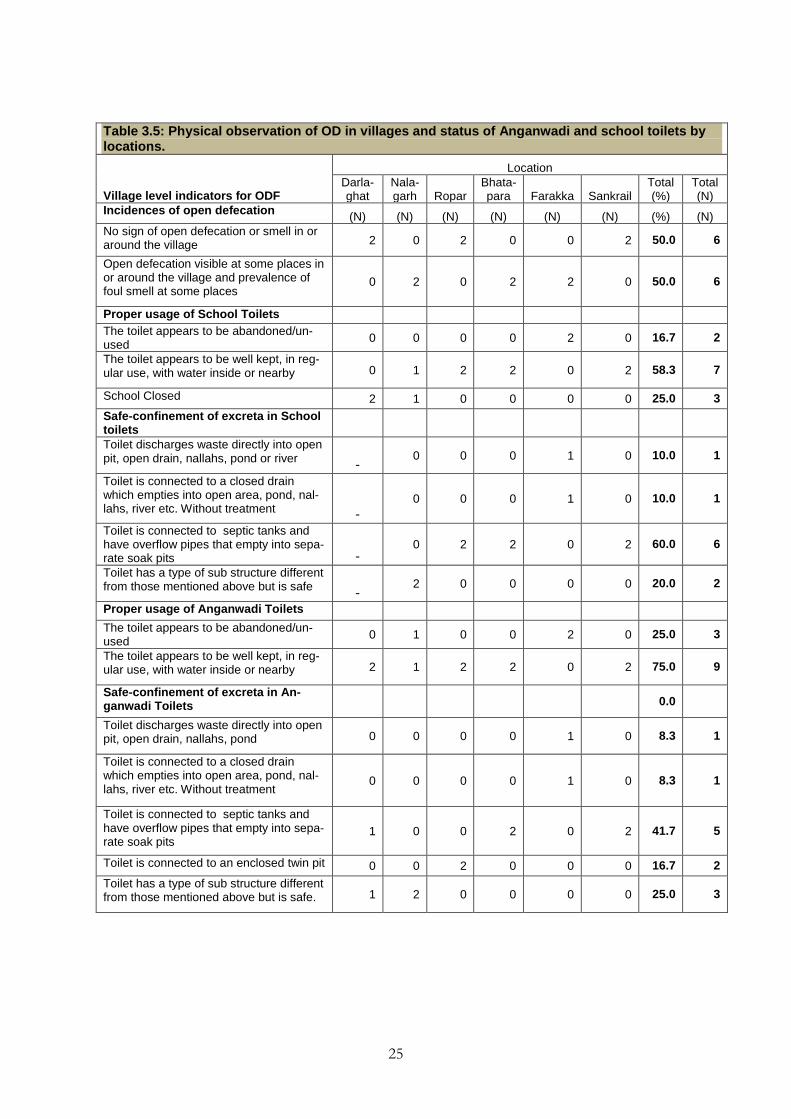
Physical observation of Open defecation in or around vil-lage and status of Anganwadi and School toilets
A village questionnaire was filled for each of the selected village for the survey where a physical
observation was conducted for any sign of open defecation in or around the village and the func-
tioning of Anganwadi and School toilet was also observed and recorded by the investigators. The
findings are presented in table 3.5.
It was observed by the investigators that in both the villages in Nalagarh, Bhatapara and Farakka
open defecation was visible at some places in or around villages and prevalence of foul smell was
also there whereas Darlaghat, Ropar and Sankrail villages did not show any sign of open defecation
or smell in or around the village.
With respect to school toilets in both the villages in Farakka, they were found abandoned/unused
wherein at the other places school toilets were well kept, in regular use, with water inside or nearby.
The schools in both the villages in Darlaghat and one villages in Ropar were closed so the obser-
vation could not be made for the school toilets there. Only except both the villages in Farakka the
school toilets were connected to a method of safe confinement of excreta. In Farakka the excreta
was getting disposed directly or through a closed drain into open pit, open drain, nallah pond or
river without treatment which is considered unsafe.
The Anganwadi toilets in both the villages in Darlaghat, Ropar, Bhatapara and Sankrail appeared
to be well kept, in regular use and with water inside or nearby, whereas in one village in Nalagarh
and both villages in Farakka, the Anganwadi toilets appeared to be abandoned/unused. Except for
both the village Anganwadis in Farakka, toilets were having a method for safe confinement of
excreta where the excreta was disposed through a safe method.
25
Table 3.5: Physical observation of OD in villages and status of Anganwadi and school toilets by locations.
Village level indicators for ODF
Location
Darla-ghat
Nala-garh Ropar
Bhata-para Farakka Sankrail
Total (%)
Total (N)
Incidences of open defecation (N) (N) (N) (N) (N) (N) (%) (N)
No sign of open defecation or smell in or around the village 2 0 2 0 0 2 50.0 6
Open defecation visible at some places in or around the village and prevalence of foul smell at some places
0 2 0 2 2 0 50.0 6
Proper usage of School Toilets
The toilet appears to be abandoned/un-used
0 0 0 0 2 0 16.7 2
The toilet appears to be well kept, in reg-ular use, with water inside or nearby 0 1 2 2 0 2 58.3 7
School Closed 2 1 0 0 0 0 25.0 3
Safe-confinement of excreta in School toilets
Toilet discharges waste directly into open pit, open drain, nallahs, pond or river -
0 0 0 1 0 10.0 1
Toilet is connected to a closed drain which empties into open area, pond, nal-lahs, river etc. Without treatment -
0 0 0 1 0 10.0 1
Toilet is connected to septic tanks and have overflow pipes that empty into sepa-rate soak pits -
0 2 2 0 2 60.0 6
Toilet has a type of sub structure different from those mentioned above but is safe -
2 0 0 0 0 20.0 2
Proper usage of Anganwadi Toilets
The toilet appears to be abandoned/un-used
0 1 0 0 2 0 25.0 3
The toilet appears to be well kept, in reg-ular use, with water inside or nearby 2 1 2 2 0 2 75.0 9
Safe-confinement of excreta in An-ganwadi Toilets
0.0
Toilet discharges waste directly into open pit, open drain, nallahs, pond 0 0 0 0 1 0 8.3 1
Toilet is connected to a closed drain which empties into open area, pond, nal-lahs, river etc. Without treatment
0 0 0 0 1 0 8.3 1
Toilet is connected to septic tanks and have overflow pipes that empty into sepa-rate soak pits
1 0 0 2 0 2 41.7 5
Toilet is connected to an enclosed twin pit 0 0 2 0 0 0 16.7 2
Toilet has a type of sub structure different from those mentioned above but is safe. 1 2 0 0 0 0 25.0 3

26
Chapter 4
Case Studies
This chapter provides an account of 5 case studies from Farakka which are exceptional in nature
and an interesting read about people who went out of the way to get their toilet constructed.
Case Study 1
Bitisoni Todu, 30 years, wife of Samlal Murmu of Kalaidanga Village is a daily wage labourer and
mother of two children. She shared that during 2016-17, ACF’s team used to visit their village to
orient them about the benefits of having a toilet at household level but due to her poor economic
condition she couldn’t build a toilet for their household. When ‘Mission Nirmal Bangla’ launched
in their village she approached PIA for toilet construction but she had only 1500/- Rs. to contrib-
ute instead of Rs. 3200 requesting the panchayat to start the toilet construction work and that she
will contribute the remaining amount in the due course but they refused. Then she approached
ACF for help and started using toilet of others in village. Her son studies in Govt. boarding school
and whenever he visits them he refuses to go out for open defecation so she felt a serious need of
toilet construction. With the help of village health and sanitation committee, ACF got her money
back from the Panchayat. In the mean time she joined ACF’s Goat Based Livelihoods Group
program and started rearing goat.
In Dec- 2018, she with her husband decided to construct toilet on their own. She had nine goats
and 3 pigs out of which she sold three goats and one pig for Rs. 10,000/- and started the toilet
construction work. She invested Rs. 8000/- more from saving and constructed the toilet for her
household. While narrating her story she became emotional saying that if I was told about the
benefits of having a toilet earlier, I would have got it constructed much earlier. I got the courage
when I joined GBLG program of ACF and my economic condition improved because of that.
ACF supported her with the construction of door for her toilet and white washing. She happily
says that she owns her own ‘Maryada Ghar (Toilet)’.
Case Study 2
Golbahara Bewa age 45 years Tildanga village, lost her husband just after 15 days of marriage. Due
to social taboo and other reasons, she returned back to her home and lived with unmarried sister
who is physically challenged. Golbahara sales bangles in the area by going door to door and earns
about Rs. 2500 to Rs. 3000 per month for their survival. After ACFs mobilization, most of the
households in the village had constructed toilets for their household and it became difficult for
her and her sister as they were one of the few going for open defecation. She also didn’t get the
toilet constructed under Nirmal Bangla as she could not afford to contribute 3200 Rs.
She started to construct her toilet but it was half done because of financial constraints. ACF team
visited to her house and looking at her efforts, interest and enthusiasm, ACF supported with Rs.

27
4000 so that the work could be completed. She and her sister are very happy and proud owner of
their toilet. She says, ACF team is FARISHTA (ANGEL) for us.
Case Study 3
Mrs. Nasiruddin Nadab is a resident of Tildanga village of Bewa II Gram Panchayat. She and her
family members used to defecate in open since they did not have toilet facility at home. Once she
attended a meeting conducted by ACF and she came to know about the ill effects of open defeca-
tion. After attending the meeting she felt the need of toilet at home and was determined to con-
struct a toilet for her house. However, her husband was not ready to support.
One day she was going to her mother’s house and her husband advised her to cover her head with
hizab. As a response to that she told her husband that going outside for toilet is more disrespectful
than not covering head with hizab. These words made her husband think and he promised her
that he will get the toilet constructed before she comes back from her mother’s place. He kept his
promise and now all of their family members use the toilet facility.
Case Study 4
Ms Suratun Khatun of village Tildanga ( GP- BEWA-II, Farakka Block) lives with her mother and two brothers. She didn’t have a toilet at home but wanted to construct one after attending the village meeting, road show and rally organised by ACF. She was economically backward and didn’t have money to contribute Rs. 3200 to the panchayat for toilet construction under ‘MISSION NIRMAL BANGLA’.
She is currently studying in 10th standard and is a brilliant student. When she got Rs. 25,000 under KANAYASHREE PROGRAMME, she first withdrew 3200 Rs. and deposited the money to the panchayat for toilet construction. She also motivated her neighbours to construct and use toilets and keep the village clean. Her story was also published in a local newspaper as an inspiring story for others to learn.
Case Study 5
Jai Maa Durga, SHG of Avla village of Bahadurpur panchayat started functioning in 2010 with 12
members. The group is very active, regular in saving and the grading process for the group is
already completed. Since none of the SHG member had a toilet facility at home, ACF started
mobilizing them in 2016 and instructed that all SHG members must have toilets for their house-
holds and they should stop open defecation. ACF also organized street plays and short films to
make them aware about the benefits of having a toilet. All of the SHG members were ready to
construct toilets and seven of them immediately contributed Rs. 3200 to panchayat for getting
toilet constructed for their households under Mission Nirmal Bangla, but rest of five members
being from very poor economic background were not able to contribute. The SHG group then
decided to give them loan for constructing toilets. They withdrew Rs. 15,000/- as loan from SHG
for 5 members and deposited to panchayat for toilet construction. The work has started and very
soon all will have toilets at their home.
28
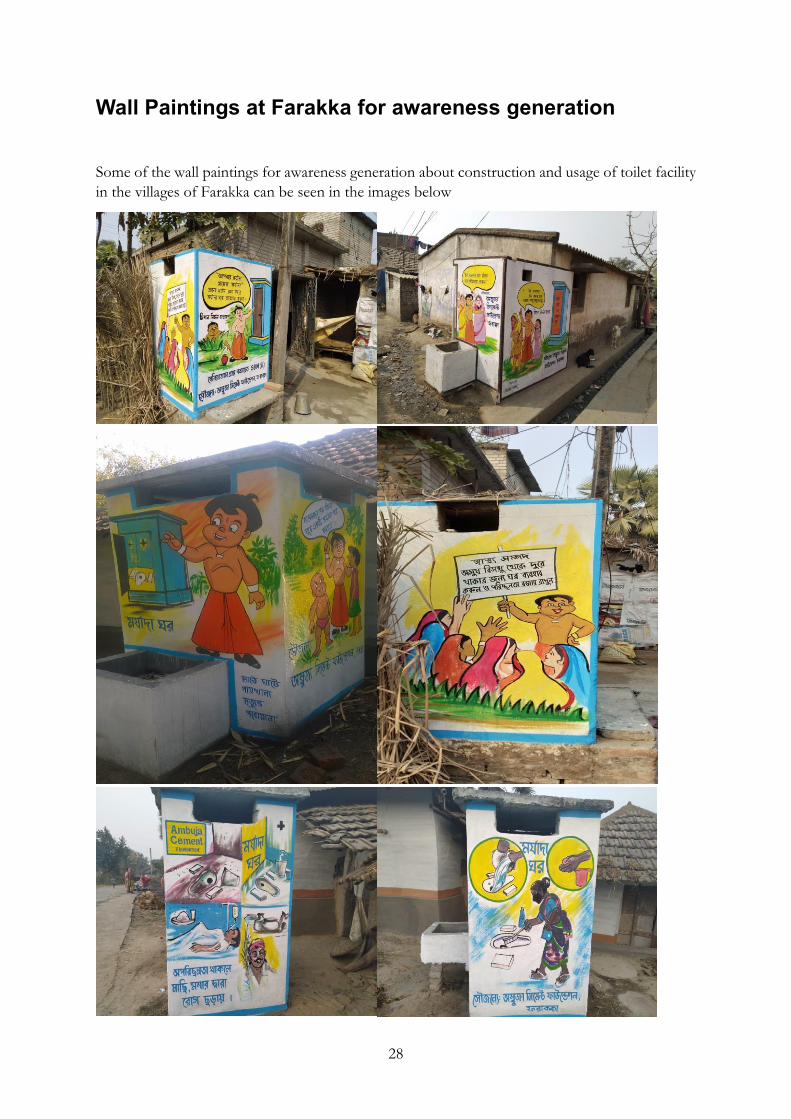
Wall Paintings at Farakka for awareness generation
Some of the wall paintings for awareness generation about construction and usage of toilet facility
in the villages of Farakka can be seen in the images below

29
Chapter 5
Summary of Findings
In this chapter, we summarize the findings and present it along the lines of the research questions
of the study.
We know that India is a developing nation. Around 68% population lives in the rural areas. It is
the seventh largest economy in the world and one of the fastest growing countries. However,
significant challenges to the provision of environmental services such as water, sanitation, solid
waste management, and drainage. In India Open defecation is one of the major health hazards and
it affects environment.
Ambuja Cement Foundation has started working on sanitation in its locations one and half decades
back as part of the integrated health programs. In line with Prime Minister of India’s “Swachh
Bharat Mission” initiative with objective to clean cities and make open defecation free rural &
urban area by 2019, Ambuja Cement Foundation (ACF) also took initiative in its core villages to
contribute to Swachh Bharat Mission and made all the core villages Open defecation free by 2019.
ACF has presence in 11 Indian states and working on need based programs such as water, agricul-
ture, health, sanitation, livelihood and education. For this program ACF is working at two levels –
households and schools.
As per the latest report on sanitation, there were 6 ACF locations (Ropar, Nalagarh, Darlaghat,
Bhatapara, Sankrail and Farakka) where all the villages were declared as ODF by Government by
March 2018. It was proposed to conduct the study in those 6 ODF locations. Two ODF villages
from each of the six locations were selected for the village and household level survey. The schools
and Anganwadis coming under these villages were also covered for the audit (physical verification)
of toilets in the schools.
In the selected villages, FGDs with male and females were conducted (one FGD per village). In
addition, a household survey was conducted on a sample of 600 households. A sample of 50
households per village was considered with the understanding that we will be able to interview
around 45-47 of them. The study team consisted of Core Research team members from ACF,
Mumbai Corporate Office and 18 field staff of ACF (Who were not directly linked with Sanitation
Work) worked as field investigators.
It is seen from the household survey that overall, 69 percent of the study population belonged to
Hindu Religion and it was 99-100 percent in Sankrail, Darlaghat and Bhatapara and 88 percent in
Nalagarh. Where Ropar has 97 percent of Sikh population, Farakka had 50 percent Muslim and
15 percent Christian population as well. One third of the overall study population belonged to
Schedule Caste, where a little less than one third (31.3 percent) of the population belonged to
general category, near about one fifth of them belong to Other Backward Classes (OBC). Schedule
Tribe population was nearly 14 percent overall.
The source of water for household use was largely tap (household/common) in Darlaghat (100
percent) and Nalagarh locations (around 85 percent), largely public tap in Ropar (62 percent),
30
largely public borewell in Bhatapara and Sankrail (85-90 percent) and Farakka (58 percent). Sur-
prisingly households at Sankrail and Farakka locations nearly have no own/shared tap water con-
nectivity. All of the households in Ropar have some or the other water facility within their prem-
ises which is as less as 3 percent in Farakka and 13 percent in Bhatapara and Sankrail. With respect
to cooking fuel, nearly 80 percent of the households have LPG connection and 88 percent also
use wood/straw/grass as cooking fuel. LPG connection is found lowest at 52 percent in Farakka.
One third of the households in the study were RCC and another one third were found to be pucca
houses. With respect to electrification of house, it was observed that all the households were elec-
trified in Darlaghat, Nalagarh, Ropar and Sankrail followed by Bhatapara (96.7 percent) and least
number of households were electrified in Farakka (89 percent). The households in most of the
cases (97.5 percent) were constructed or purchased by the household members only.
Nearly 77 percent of the households in the study locations have own toilet within the premises of
their households and another 16 percent have it outside premises. A total of 7.4 percent house-
holds reported of not having toilets and it is high at 24 percent in Farakka followed by 12 percent
in Bhatapara and 7.3 percent in Nalagarh.
Nearly 99 percent of the toilets in Darlaghat are constructed fully on owner’s expense which shows
the high level of awareness about using proper sanitation facility. Overall 52.3 percent of the toilets
across locations are constructed by the members on their expenses completely, 20 percent are
constructed by Government and nearly 18 percent are constructed with subsidy by government or
ACF and 10 percent of the overall toilets are constructed majorly at ACFs expenses. The percent-
age of toilets constructed majorly with ACFs support is 42 percent in Bhatapara and 23.7 percent
in Farakka.
Around 98 percent of the studied households having toilet facility are using them and the toilet
use is 100 percent in Ropar, Farakka and Sankrail. Overall 99 percent of the households having
toilets have some arrangement for fly-proofing (nearly 84 percent have water seal and 15 percent
have cover of some kind). Only in Farakka little more than 5 percent of the toilets do not have
any such arrangements for fly-proofing. Most of the toilets have water seal in all the locations
except for Ropar where 76 percent of the toilets have cover of some kind for fly-proofing.
Only except 5% of the overall toilets, all other toilets are connected to a safe structure for disposal
of excreta. As high as 22 percent of the toilets in Sankrail and 6.6 percent in Farakka are not
connected to a safe excreta disposal system.