Embed Size (px)
Citation preview

Regional Information Report No. 5J12-05
An Evaluation of the Tutka Bay Lagoon Salmon Hatchery for Consistency with Statewide Policies and Prescribed Management Practices
By
Mark Stopha and
Jake Musslewhite
April 2012
Alaska Department of Fish and Game Division of Commercial Fisheries

Symbols and Abbreviations
The following symbols and abbreviations, and others approved for the Système International d'Unités (SI), are used without definition in the following reports by the Divisions of Sport Fish and of Commercial Fisheries: Fishery Manuscripts, Fishery Data Series Reports, Fishery Management Reports, Special Publications and the Division of Commercial Fisheries Regional Reports. All others, including deviations from definitions listed below, are noted in the text at first mention, as well as in the titles or footnotes of tables, and in figure or figure captions. Weights and measures (metric) centimeter cm deciliter dL gram g hectare ha kilogram kg kilometer km liter L meter m milliliter mL millimeter mm Weights and measures (English) cubic feet per second ft3/s foot ft gallon gal inch in mile mi nautical mile nmi ounce oz pound lb quart qt yard yd Time and temperature day d degrees Celsius °C degrees Fahrenheit °F degrees kelvin K hour h minute min second s Physics and chemistry all atomic symbols alternating current AC ampere A calorie cal direct current DC hertz Hz horsepower hp hydrogen ion activity pH (negative log of) parts per million ppm parts per thousand ppt, ‰ volts V watts W
General Alaska Administrative Code AAC all commonly accepted abbreviations e.g., Mr., Mrs.,
AM, PM, etc. all commonly accepted professional titles e.g., Dr., Ph.D., R.N., etc. at @ compass directions:
east E north N south S west W
copyright corporate suffixes:
Company Co. Corporation Corp. Incorporated Inc. Limited Ltd.
District of Columbia D.C. et alii (and others) et al. et cetera (and so forth) etc. exempli gratia (for example) e.g. Federal Information Code FIC id est (that is) i.e. latitude or longitude lat. or long. monetary symbols (U.S.) $, ¢ months (tables and figures): first three letters Jan,...,Dec registered trademark trademark United States (adjective) U.S. United States of America (noun) USA U.S.C. United States
Code U.S. state use two-letter
abbreviations (e.g., AK, WA)
Mathematics, statistics all standard mathematical signs, symbols and abbreviations alternate hypothesis HA base of natural logarithm e catch per unit effort CPUE coefficient of variation CV common test statistics (F, t, 2, etc.) confidence interval CI correlation coefficient (multiple) R correlation coefficient (simple) r covariance cov degree (angular ) ° degrees of freedom df expected value E greater than > greater than or equal to harvest per unit effort HPUE less than < less than or equal to logarithm (natural) ln logarithm (base 10) log logarithm (specify base) log2, etc. minute (angular) ' not significant NS null hypothesis HO percent % probability P probability of a type I error (rejection of the null hypothesis when true) probability of a type II error (acceptance of the null hypothesis when false) second (angular) " standard deviation SD standard error SE variance population Var sample var
REGIONAL INFORMATION REPORT NO. 5J12-05
AN EVALUATION OF THE TUTKA BAY LAGOON SALMON HATCHERY FOR CONSISTENCY WITH STATEWIDE POLICIES AND
PRESCRIBED MANAGEMENT PRACTICES
by Mark Stopha
Alaska Department of Fish and Game, Division of Commercial Fisheries, Juneau and
Jake Musslewhite Armstrong-Keta, Inc., P. O. Box 21990, Juneau, AK 99802
Alaska Department of Fish and Game Division of Commercial Fisheries
333 Raspberry Road, Anchorage, AK 99518
April 2012
The Regional Information Report Series was established in 1987 and was redefined in 2006 to meet the Division of Commercial Fisheries regional need for publishing and archiving information such as project operational plans, area management plans, budgetary information, staff comments and opinions to Board of Fisheries proposals, interim or preliminary data and grant agency reports, special meeting or minor workshop results and other regional information not generally reported elsewhere. Reports in this series may contain raw data and preliminary results. Reports in this series receive varying degrees of regional, biometric and editorial review; information in this series may be subsequently finalized and published in a different department reporting series or in the formal literature. Please contact the author or the Division of Commercial Fisheries if in doubt of the level of review or preliminary nature of the data reported. Regional Information Reports are available through the Alaska State Library and on the Internet at http://www.adfg.alaska.gov/sf/publications/
Mark Stopha, Alaska Department of Fish and Game, Division of Commercial Fisheries,
1255 W. 8th St. P. O. Box 115526, Juneau, AK 99811-5526, USA
Jake Musslewhite, Operations Manager Armstrong-Keta, Inc.
PO Box 21990, Juneau, AK 99802, USA
This document should be cited as: Stopha, M. and J. Musslewhite. 2012. An evaluation of the Tutka Bay Lagoon salmon hatchery for consistency
with statewide policies and prescribed management practices . Alaska Department of Fish and Game, Division of Commercial Fisheries, Regional Information Report 5J12-05, Anchorage.
The Alaska Department of Fish and Game (ADF&G) administers all programs and activities free from discrimination based on race, color, national origin, age, sex, religion, marital status, pregnancy, parenthood, or disability. The department administers all programs and activities in compliance with Title VI of the Civil Rights Act of 1964, Section 504 of the Rehabilitation Act of 1973, Title II of the Americans with Disabilities Act (ADA) of 1990, the Age Discrimination Act of 1975, and Title IX of the Education Amendments of 1972. If you believe you have been discriminated against in any program, activity, or facility please write:
ADF&G ADA Coordinator, P.O. Box 115526, Juneau AK 99811-5526 U.S. Fish and Wildlife Service, 4040 N. Fairfax Drive, Suite 300 Webb, Arlington VA 22203 Office of Equal Opportunity, U.S. Department of the Interior, Washington DC 20240
The department’s ADA Coordinator can be reached via phone at the following numbers: (VOICE) 907-465-6077, (Statewide Telecommunication Device for the Deaf) 1-800-478-3648, (Juneau TDD) 907-465-3646, or (FAX) 907-465-6078
For information on alternative formats and questions on this publication, please contact: ADF&G, Division of Commercial Fisheries, P.O. Box 115526, Juneau AK 99811 (907)465-4210.
i
TABLE OF CONTENTS Page
LIST OF TABLES......................................................................................................................................................... ii
LIST OF FIGURES ....................................................................................................................................................... ii
LIST OF APPENDICES ............................................................................................................................................... ii
ABSTRACT .................................................................................................................................................................. 1
INTRODUCTION ......................................................................................................................................................... 1
OVERVIEW OF POLICIES ......................................................................................................................................... 8
OVERVIEW OF HATCHERY PERMITS AND PLANS ............................................................................................ 9
TUTKA BAY LAGOON HATCHERY OVERVIEW ................................................................................................ 12
PROGRAM EVALUATION....................................................................................................................................... 15
Hatchery Permits and Operating Plans ........................................................................................................................ 16
Comprehensive Salmon Enhancement Plan ................................................................................................................ 18
Consistency with policy ............................................................................................................................................... 18
Genetics .................................................................................................................................................................. 21 Fish Health and Disease ......................................................................................................................................... 23 Fisheries Management ............................................................................................................................................ 23
OTHER REQUIREMENTS ........................................................................................................................................ 25
Annual reporting and carcass logs ............................................................................................................................... 25
DISCUSSION AND RECOMMENDATIONS ........................................................................................................... 25
ACKNOWLEDGEMENTS ......................................................................................................................................... 26
REFERENCES CITED ............................................................................................................................................... 27
ii
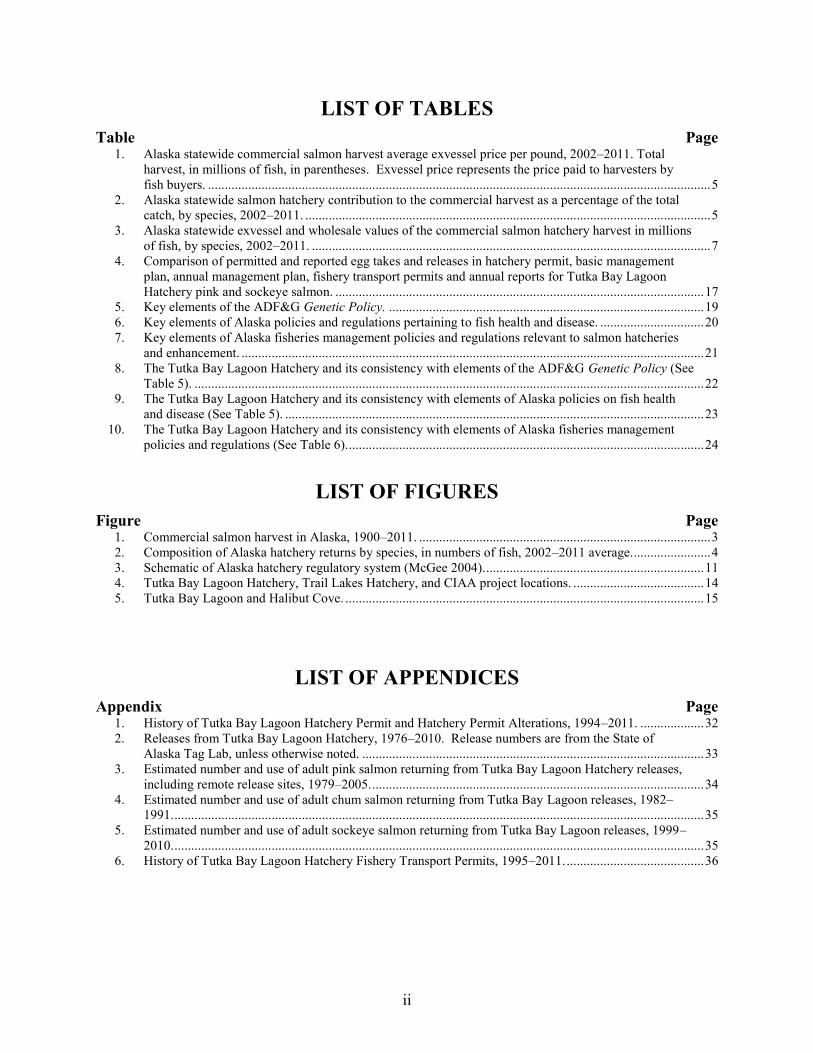
LIST OF TABLES
Table Page 1. Alaska statewide commercial salmon harvest average exvessel price per pound, 2002–2011. Total
harvest, in millions of fish, in parentheses. Exvessel price represents the price paid to harvesters by fish buyers. ...................................................................................................................................................... 5
2. Alaska statewide salmon hatchery contribution to the commercial harvest as a percentage of the total catch, by species, 2002–2011. ......................................................................................................................... 5
3. Alaska statewide exvessel and wholesale values of the commercial salmon hatchery harvest in millions of fish, by species, 2002–2011. ....................................................................................................................... 7
4. Comparison of permitted and reported egg takes and releases in hatchery permit, basic management plan, annual management plan, fishery transport permits and annual reports for Tutka Bay Lagoon Hatchery pink and sockeye salmon. .............................................................................................................. 17
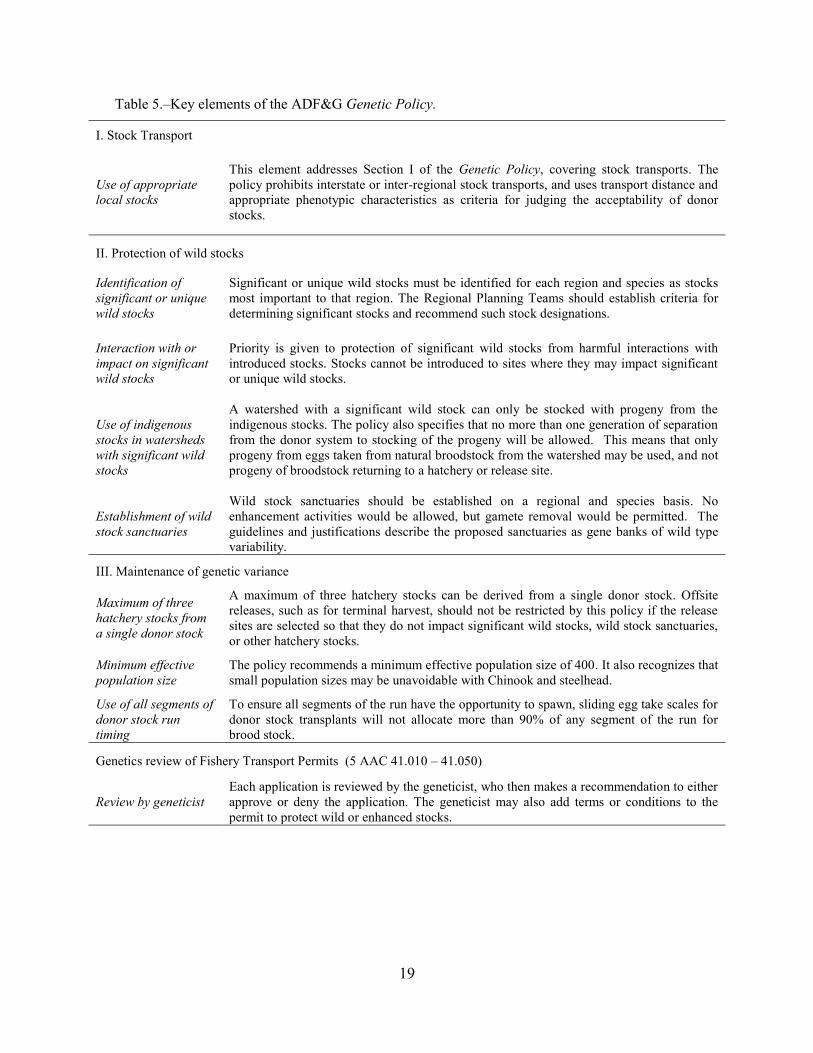
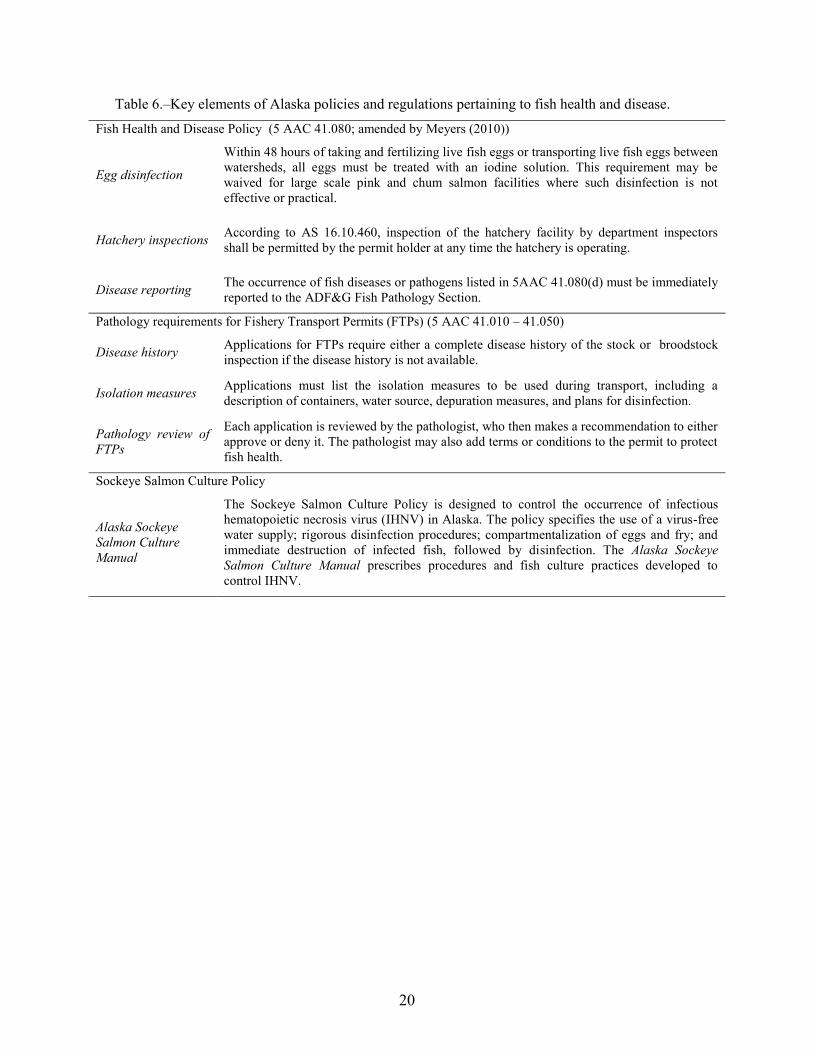
5. Key elements of the ADF&G Genetic Policy. .............................................................................................. 19 6. Key elements of Alaska policies and regulations pertaining to fish health and disease. ............................... 20 7. Key elements of Alaska fisheries management policies and regulations relevant to salmon hatcheries
and enhancement. .......................................................................................................................................... 21 8. The Tutka Bay Lagoon Hatchery and its consistency with elements of the ADF&G Genetic Policy (See
Table 5). ........................................................................................................................................................ 22 9. The Tutka Bay Lagoon Hatchery and its consistency with elements of Alaska policies on fish health
and disease (See Table 5). ............................................................................................................................. 23 10. The Tutka Bay Lagoon Hatchery and its consistency with elements of Alaska fisheries management
policies and regulations (See Table 6). .......................................................................................................... 24
LIST OF FIGURES
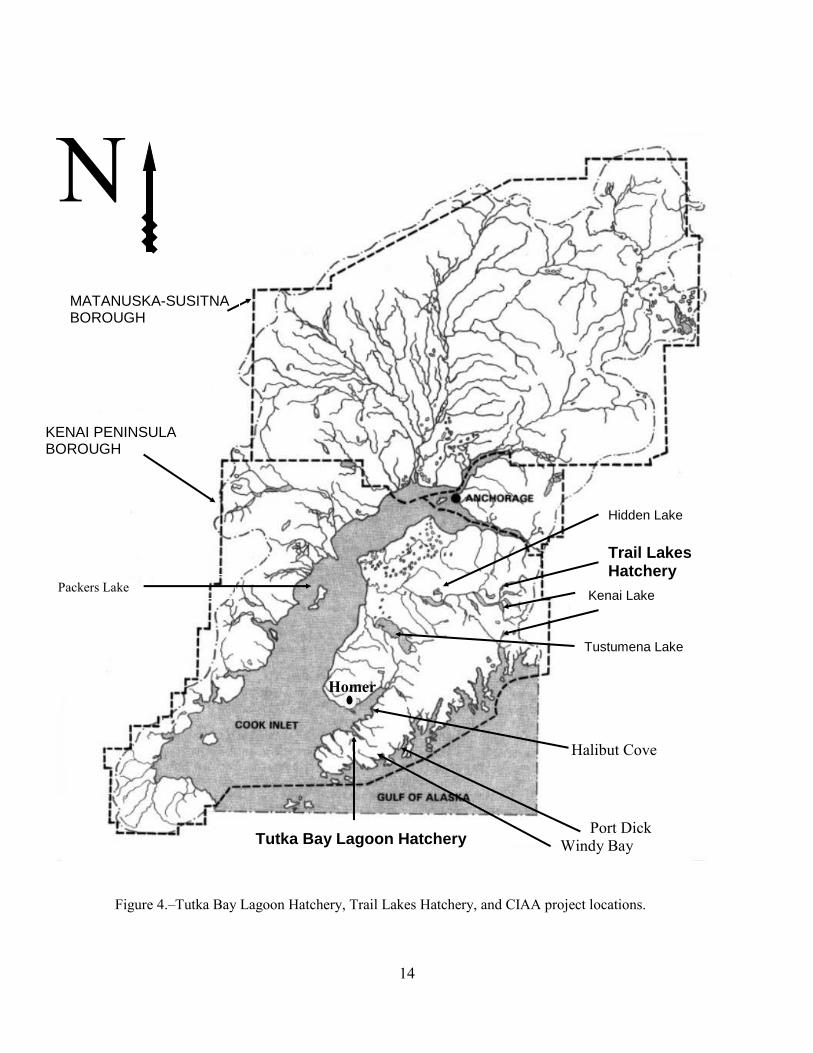
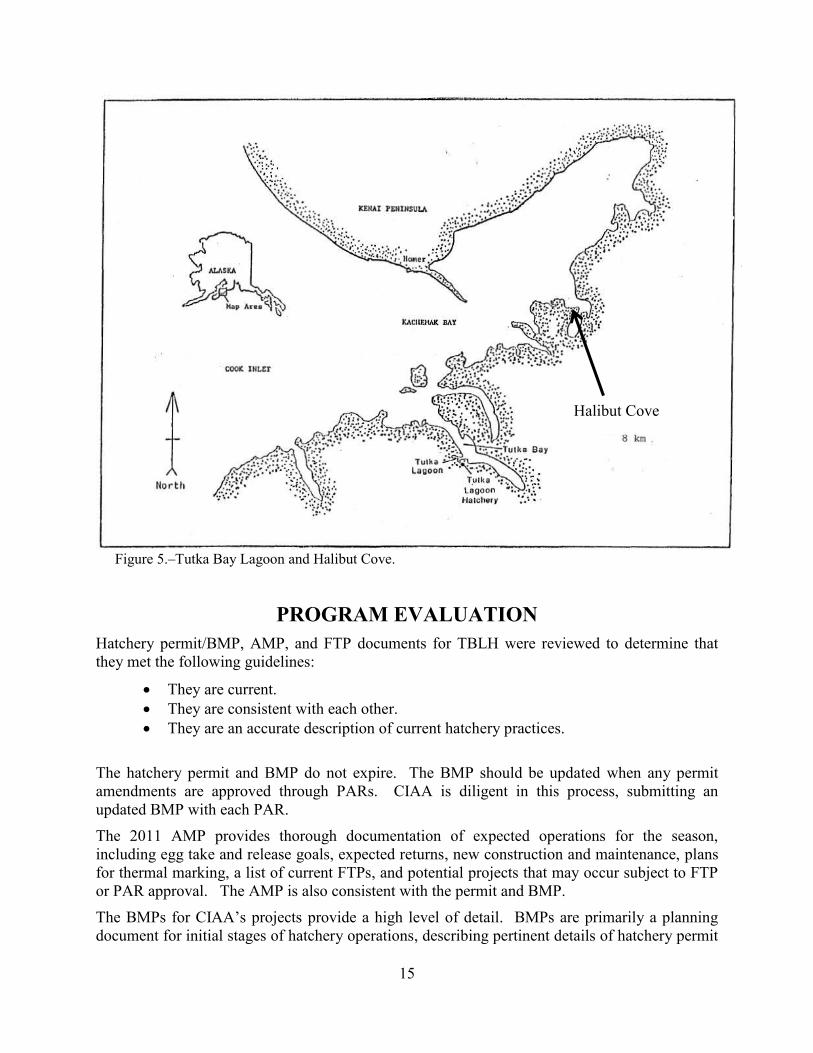
Figure Page 1. Commercial salmon harvest in Alaska, 1900–2011. ....................................................................................... 3 2. Composition of Alaska hatchery returns by species, in numbers of fish, 2002–2011 average. ....................... 4 3. Schematic of Alaska hatchery regulatory system (McGee 2004). ................................................................. 11 4. Tutka Bay Lagoon Hatchery, Trail Lakes Hatchery, and CIAA project locations. ....................................... 14 5. Tutka Bay Lagoon and Halibut Cove. ........................................................................................................... 15
LIST OF APPENDICES
Appendix Page 1. History of Tutka Bay Lagoon Hatchery Permit and Hatchery Permit Alterations, 1994–2011. ................... 32 2. Releases from Tutka Bay Lagoon Hatchery, 1976–2010. Release numbers are from the State of
Alaska Tag Lab, unless otherwise noted. ...................................................................................................... 33 3. Estimated number and use of adult pink salmon returning from Tutka Bay Lagoon Hatchery releases,
including remote release sites, 1979–2005. ................................................................................................... 34 4. Estimated number and use of adult chum salmon returning from Tutka Bay Lagoon releases, 1982–
1991. .............................................................................................................................................................. 35 5. Estimated number and use of adult sockeye salmon returning from Tutka Bay Lagoon releases, 1999–
2010. .............................................................................................................................................................. 35 6. History of Tutka Bay Lagoon Hatchery Fishery Transport Permits, 1995–2011. ......................................... 36
1
ABSTRACT
The private nonprofit salmon hatchery program in Alaska is governed by policies, plans, and regulations that emphasize protection of wild salmon stocks. A rotational series of hatchery evaluations will examine the consistency of each hatchery with those policies and prescribed management practices. The evaluation includes a review of the hatchery management plans and permits, an assessment of each hatchery program’s consistency with statewide policies, and recommendations to address any deficiencies found. Management plans, permits, and similar documents were examined to determine whether they were current, consistent with each other, and accurately described hatchery operations. The consistency with policy was assessed by identifying applicable policies and aspects of hatchery programs relevant to those policies. The hatchery evaluation process began with hatcheries in the Kodiak region and continues with Cook Inlet hatcheries.
The Tutka Bay Lagoon Hatchery is located on the Kenai Peninsula in Kachemak Bay and produces pink salmon to enhance local fisheries. The hatchery’s management plans, permits, and operations were reviewed under the hatchery evaluation process. The hatchery’s programs appear to be consistent with statewide policies on genetics, fish health, and fisheries management.
Key words: Tutka Bay Lagoon Hatchery, hatchery evaluation, hatchery, Cook Inlet Aquaculture Association, Kachemak Bay, basic management plan, annual management plan, fish transport permit
INTRODUCTION
Alaska’s constitution mandates that fish are harvested sustainably under Article 8, section 4: “Fish, forests, wildlife, grasslands, and all other replenishable resources belonging to the state shall be utilized, developed and maintained on the sustained yield principle, subject to preferences among beneficial uses.” Alaska’s salmon hatchery program was developed under this mandate, and designed to supplement—not replace—sustainable wild stock production.
Alaska’s modern salmon fisheries enhancement program began in 1971 when the Alaska Legislature established the Division of Fisheries Rehabilitation Enhancement and Development (FRED) within the Alaska Department of Fish and Game (ADF&G; FRED 1976). In 1974, the Alaska Legislature expanded the program, authorizing private nonprofit corporations (PNPs) to operate salmon hatcheries:
“It is the intent of this Act to authorize the private ownership of salmon hatcheries by qualified nonprofit corporations for the purpose of contributing, by artificial means, to the rehabilitation of the state’s depleted and depressed salmon fishery. The program shall be operated without adversely affecting natural stocks of fish in the state and under a policy of management which allows reasonable segregation of returning hatchery-reared salmon from naturally occurring stocks.”(Alaska Legislature 1974)
Salmon restoration efforts came in response to statewide annual salmon harvests of just 30 million fish, among the lowest catches since 1900 (Figure 1, ADF&G 2012). The FRED Division and PNPs engaged in a variety of activities to increase salmon production. New hatcheries were built to raise salmon. Fish ladders were constructed to provide adult salmon access to previously nonutilized spawning and rearing areas. Lakes with waterfall outlets too high for adult salmon to reach were stocked with salmon fry. Log jams were removed in streams to enable returning adults to reach spawning areas. Nursery lakes were fertilized to increase juvenile salmon growth (FRED 1975). A combination of favorable environmental conditions, limited fishing effort, abundance-based salmon management, habitat improvement, and hatchery

2
production gradually boosted salmon catches over the years, with recent commercial salmon harvests (2002–2011) averaging 170 million fish (ADF&G 2012).
In Alaska, the purpose of salmon hatcheries is to supplement wild stock production for public benefit. Hatcheries are efficient in improving survival from the egg to fry or smolt stage, and therefore require fewer spawners than in wild systems to produce equivalent numbers of adult returns. In natural production, survival of eggs to fry or smolt is highly variable. Estimates for pink salmon survival in two Southeast Alaska creeks ranged from less than 1% up to 22%, with average survivals from 4% to 9% (Croot and Margolis 1991). Under hatchery conditions, egg to fry survival is usually 80% or higher.
Alaska hatcheries do not grow fish to adulthood as fish farms do, but release juveniles, usually at a similar time as their wild system counterparts are migrating to the sea. Juveniles imprint on the freshwater source while reared at the hatchery, just as salmon juveniles to their natal stream, and return to the hatchery as mature adults. At hatchery start-up, gametes are collected from naturally occurring salmon stocks, brought to the hatchery, and placed in incubators. Per state policy, hatcheries generally use naturally occurring stocks from close proximity to the hatchery so that any straying of hatchery returns will have similar genetic makeup as the nearby streams they may stray to. Also per state policy, Alaska hatcheries do not selectively breed. Large numbers of broodstock are used for gamete collection, without regard to size or other characteristic, to maintain genetic diversity.
Hatchery production is limited by freshwater capacity and freshwater rearing space. After hatching from the egg, pink and chum salmon fry can be transferred from freshwater to salt-water. Most Chinook, sockeye and coho salmon, on the other hand, must spend a year or more in freshwater before fry develop to smolt and can tolerate saltwater. These species require a higher volume of fresh water and holding ponds for freshwater rearing, as well as higher feed costs and higher risk of disease mortality due to the extended rearing phase. There are economic tradeoffs between the costs of production versus the value of the fish at harvest. Although Chinook, sockeye and coho salmon garner higher prices per pound as adults, chum and pink salmon are more economical to raise in the hatchery and generally provide a higher economic return.
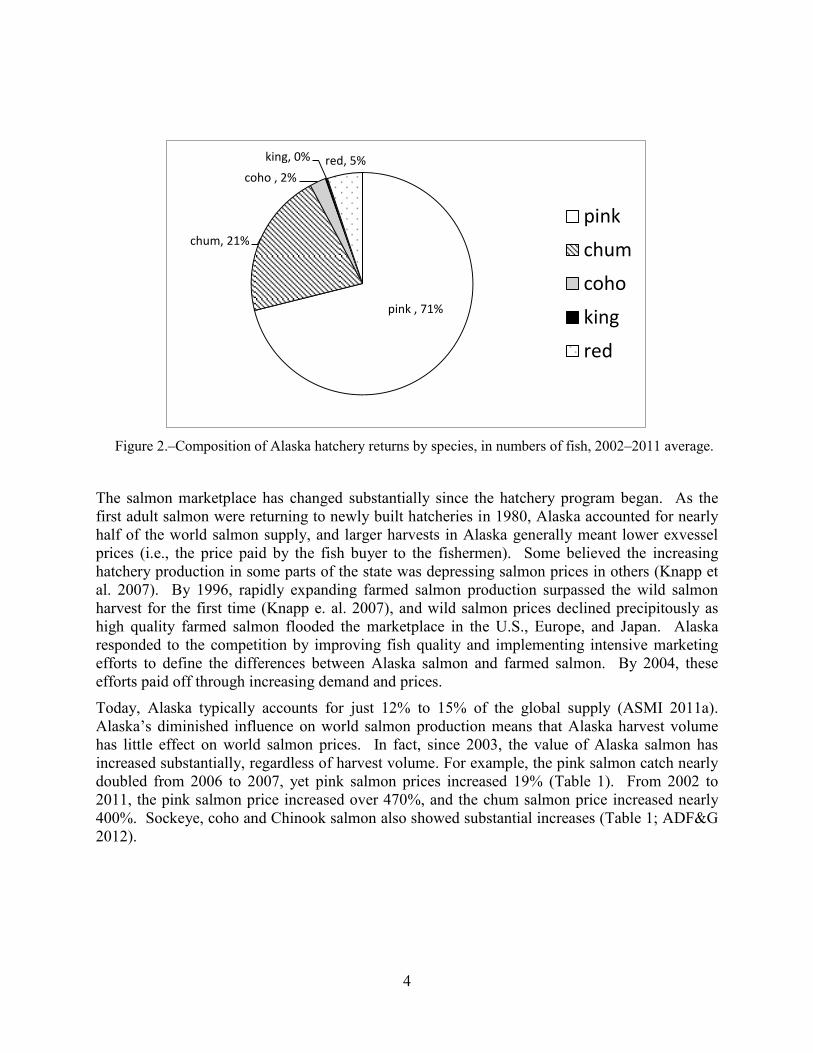
Pink salmon, which have the shortest life cycle of Pacific salmon (two years), provide a quick return on investment and provide the bulk of Alaska hatchery production. From 2002 to 2011, pink salmon accounted for an average 71% of Alaska hatchery salmon returns by number, followed by chum (21%), sockeye (5%), coho (2%), and Chinook salmon (<1%) (Vercessi 2012, White 2005–2011, Farrington 2003–2004; Figure 2).

3
Figure 1.–Commercial salmon harvest in Alaska, 1900–2011.
0
50,000
100,000
150,000
200,000
250,000
1900 1910 1920 1930 1940 1950 1960 1970 1980 1990 2000 2010
Harv
est
in T
ho
usan
ds o
f S
alm
on
Year
Hatchery
Natural
Legislation Authorizing PNP Hatchery Operations
4
Figure 2.–Composition of Alaska hatchery returns by species, in numbers of fish, 2002–2011 average.
The salmon marketplace has changed substantially since the hatchery program began. As the first adult salmon were returning to newly built hatcheries in 1980, Alaska accounted for nearly half of the world salmon supply, and larger harvests in Alaska generally meant lower exvessel prices (i.e., the price paid by the fish buyer to the fishermen). Some believed the increasing hatchery production in some parts of the state was depressing salmon prices in others (Knapp et al. 2007). By 1996, rapidly expanding farmed salmon production surpassed the wild salmon harvest for the first time (Knapp e. al. 2007), and wild salmon prices declined precipitously as high quality farmed salmon flooded the marketplace in the U.S., Europe, and Japan. Alaska responded to the competition by improving fish quality and implementing intensive marketing efforts to define the differences between Alaska salmon and farmed salmon. By 2004, these efforts paid off through increasing demand and prices.
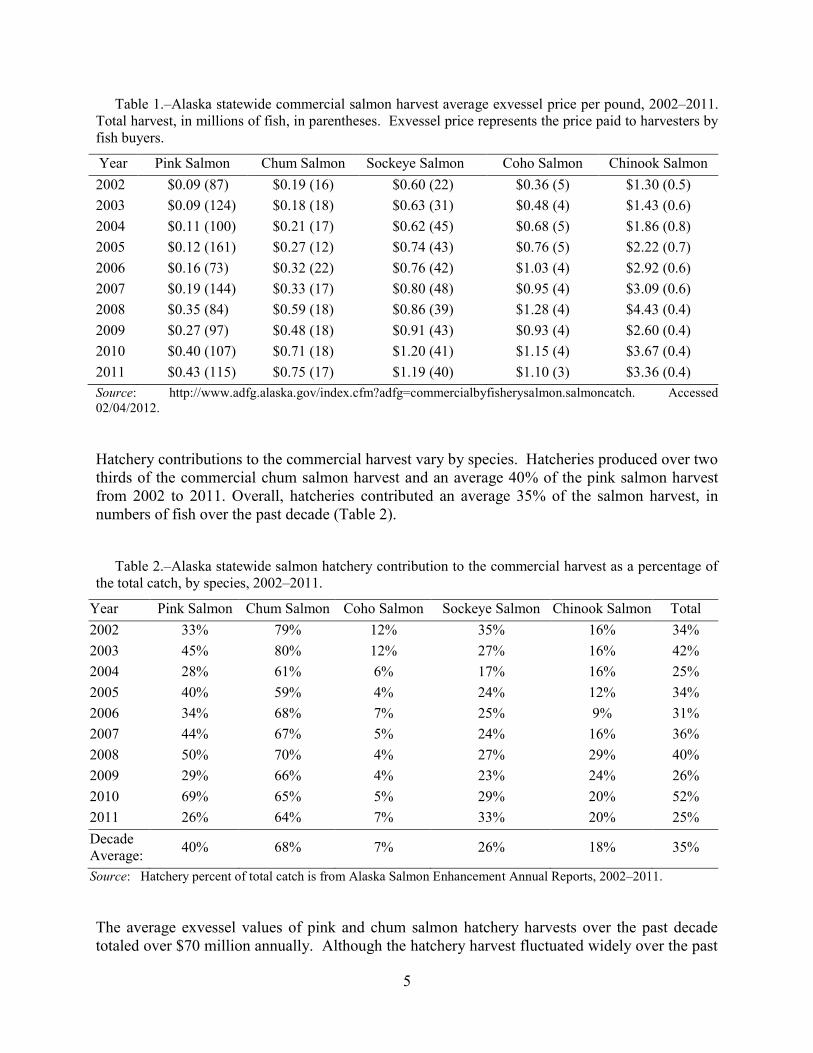
Today, Alaska typically accounts for just 12% to 15% of the global supply (ASMI 2011a). Alaska’s diminished influence on world salmon production means that Alaska harvest volume has little effect on world salmon prices. In fact, since 2003, the value of Alaska salmon has increased substantially, regardless of harvest volume. For example, the pink salmon catch nearly doubled from 2006 to 2007, yet pink salmon prices increased 19% (Table 1). From 2002 to 2011, the pink salmon price increased over 470%, and the chum salmon price increased nearly 400%. Sockeye, coho and Chinook salmon also showed substantial increases (Table 1; ADF&G 2012).
pink , 71%
chum, 21%
coho , 2%
king, 0% red, 5%
pink
chum
coho
king
red
5
Table 1.–Alaska statewide commercial salmon harvest average exvessel price per pound, 2002–2011. Total harvest, in millions of fish, in parentheses. Exvessel price represents the price paid to harvesters by fish buyers.
Year Pink Salmon Chum Salmon Sockeye Salmon Coho Salmon Chinook Salmon 2002 $0.09 (87) $0.19 (16) $0.60 (22) $0.36 (5) $1.30 (0.5) 2003 $0.09 (124) $0.18 (18) $0.63 (31) $0.48 (4) $1.43 (0.6) 2004 $0.11 (100) $0.21 (17) $0.62 (45) $0.68 (5) $1.86 (0.8) 2005 $0.12 (161) $0.27 (12) $0.74 (43) $0.76 (5) $2.22 (0.7) 2006 $0.16 (73) $0.32 (22) $0.76 (42) $1.03 (4) $2.92 (0.6) 2007 $0.19 (144) $0.33 (17) $0.80 (48) $0.95 (4) $3.09 (0.6) 2008 $0.35 (84) $0.59 (18) $0.86 (39) $1.28 (4) $4.43 (0.4) 2009 $0.27 (97) $0.48 (18) $0.91 (43) $0.93 (4) $2.60 (0.4) 2010 $0.40 (107) $0.71 (18) $1.20 (41) $1.15 (4) $3.67 (0.4) 2011 $0.43 (115) $0.75 (17) $1.19 (40) $1.10 (3) $3.36 (0.4) Source: http://www.adfg.alaska.gov/index.cfm?adfg=commercialbyfisherysalmon.salmoncatch. Accessed 02/04/2012.
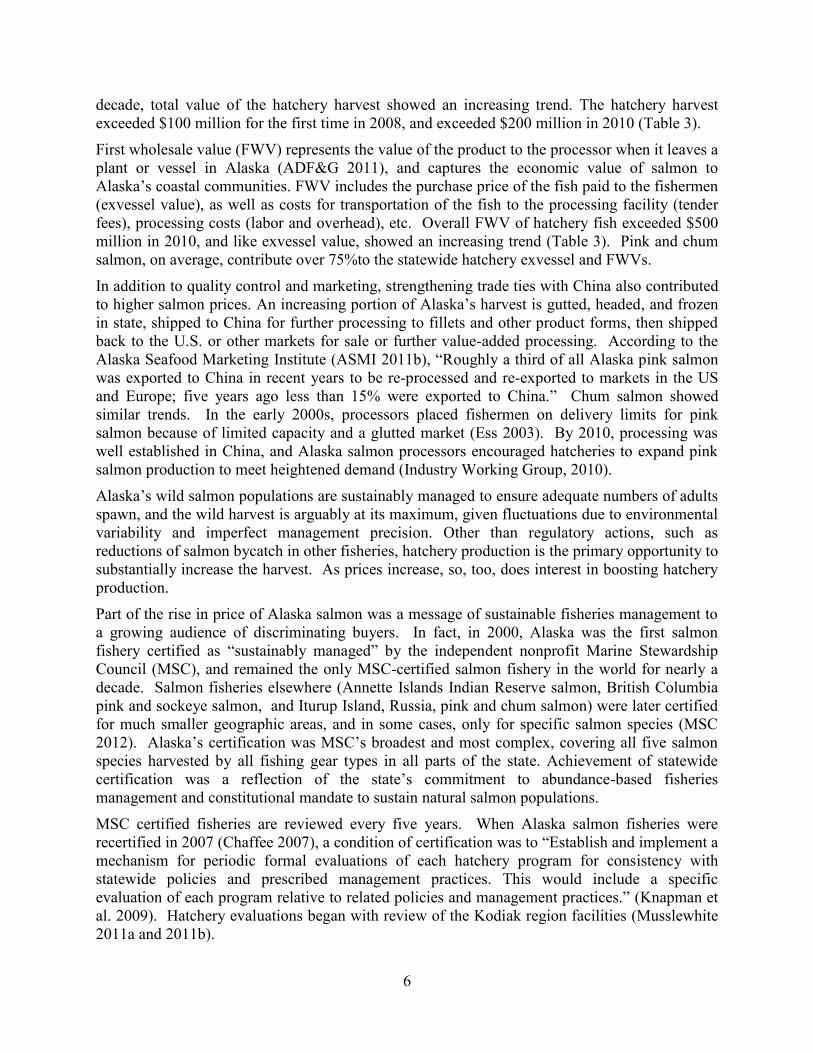
Hatchery contributions to the commercial harvest vary by species. Hatcheries produced over two thirds of the commercial chum salmon harvest and an average 40% of the pink salmon harvest from 2002 to 2011. Overall, hatcheries contributed an average 35% of the salmon harvest, in numbers of fish over the past decade (Table 2).
Table 2.–Alaska statewide salmon hatchery contribution to the commercial harvest as a percentage of
the total catch, by species, 2002–2011.
Year Pink Salmon Chum Salmon Coho Salmon Sockeye Salmon Chinook Salmon Total 2002 33% 79% 12% 35% 16% 34% 2003 45% 80% 12% 27% 16% 42% 2004 28% 61% 6% 17% 16% 25% 2005 40% 59% 4% 24% 12% 34% 2006 34% 68% 7% 25% 9% 31% 2007 44% 67% 5% 24% 16% 36% 2008 50% 70% 4% 27% 29% 40% 2009 29% 66% 4% 23% 24% 26% 2010 69% 65% 5% 29% 20% 52% 2011 26% 64% 7% 33% 20% 25% Decade Average: 40% 68% 7% 26% 18% 35%
Source: Hatchery percent of total catch is from Alaska Salmon Enhancement Annual Reports, 2002–2011.
The average exvessel values of pink and chum salmon hatchery harvests over the past decade totaled over $70 million annually. Although the hatchery harvest fluctuated widely over the past
6
decade, total value of the hatchery harvest showed an increasing trend. The hatchery harvest exceeded $100 million for the first time in 2008, and exceeded $200 million in 2010 (Table 3).
First wholesale value (FWV) represents the value of the product to the processor when it leaves a plant or vessel in Alaska (ADF&G 2011), and captures the economic value of salmon to Alaska’s coastal communities. FWV includes the purchase price of the fish paid to the fishermen (exvessel value), as well as costs for transportation of the fish to the processing facility (tender fees), processing costs (labor and overhead), etc. Overall FWV of hatchery fish exceeded $500 million in 2010, and like exvessel value, showed an increasing trend (Table 3). Pink and chum salmon, on average, contribute over 75%to the statewide hatchery exvessel and FWVs.
In addition to quality control and marketing, strengthening trade ties with China also contributed to higher salmon prices. An increasing portion of Alaska’s harvest is gutted, headed, and frozen in state, shipped to China for further processing to fillets and other product forms, then shipped back to the U.S. or other markets for sale or further value-added processing. According to the Alaska Seafood Marketing Institute (ASMI 2011b), “Roughly a third of all Alaska pink salmon was exported to China in recent years to be re-processed and re-exported to markets in the US and Europe; five years ago less than 15% were exported to China.” Chum salmon showed similar trends. In the early 2000s, processors placed fishermen on delivery limits for pink salmon because of limited capacity and a glutted market (Ess 2003). By 2010, processing was well established in China, and Alaska salmon processors encouraged hatcheries to expand pink salmon production to meet heightened demand (Industry Working Group, 2010).
Alaska’s wild salmon populations are sustainably managed to ensure adequate numbers of adults spawn, and the wild harvest is arguably at its maximum, given fluctuations due to environmental variability and imperfect management precision. Other than regulatory actions, such as reductions of salmon bycatch in other fisheries, hatchery production is the primary opportunity to substantially increase the harvest. As prices increase, so, too, does interest in boosting hatchery production.
Part of the rise in price of Alaska salmon was a message of sustainable fisheries management to a growing audience of discriminating buyers. In fact, in 2000, Alaska was the first salmon fishery certified as “sustainably managed” by the independent nonprofit Marine Stewardship Council (MSC), and remained the only MSC-certified salmon fishery in the world for nearly a decade. Salmon fisheries elsewhere (Annette Islands Indian Reserve salmon, British Columbia pink and sockeye salmon, and Iturup Island, Russia, pink and chum salmon) were later certified for much smaller geographic areas, and in some cases, only for specific salmon species (MSC 2012). Alaska’s certification was MSC’s broadest and most complex, covering all five salmon species harvested by all fishing gear types in all parts of the state. Achievement of statewide certification was a reflection of the state’s commitment to abundance-based fisheries management and constitutional mandate to sustain natural salmon populations.
MSC certified fisheries are reviewed every five years. When Alaska salmon fisheries were recertified in 2007 (Chaffee 2007), a condition of certification was to “Establish and implement a mechanism for periodic formal evaluations of each hatchery program for consistency with statewide policies and prescribed management practices. This would include a specific evaluation of each program relative to related policies and management practices.” (Knapman et al. 2009). Hatchery evaluations began with review of the Kodiak region facilities (Musslewhite 2011a and 2011b).

7
Table 3.–Alaska statewide exvessel and wholesale values of the commercial salmon hatchery harvest in millions of fish, by species, 2002–2011.
Pink Salmon Chum Salmon Sockeye Salmon Coho Salmon Chinook Salmon Total
Year Exvessel
Value Wholesale
Value Exvessel
Value Wholesale
Value Exvessel
Value Wholesale
Value Exvessel
Value Wholesale
Value Exvessel
Value Wholesale
Value Exvessel
Value Wholesale
Value
2002 $9 $51 $20 $66 $10 $27 $5 $13 $2 $3 $46 $160
2003 $19 $86 $20 $57 $14 $33 $4 $9 $2 $4 $59 $188
2004 $11 $51 $16 $50 $9 $22 $5 $10 $4 $6 $45 $138
2005 $27 $102 $15 $38 $9 $19 $6 $12 $3 $4 $59 $175
2006 $15 $65 $38 $109 $13 $30 $8 $17 $3 $4 $78 $224
2007 $43 $159 $30 $86 $10 $22 $6 $11 $4 $6 $92 $283
2008 $52 $160 $61 $146 $7 $16 $12 $22 $7 $9 $140 $353
2009 $23 $80 $42 $96 $8 $18 $6 $12 $3 $5 $83 $211
2010 $112 $318 $64 $136 $15 $30 $10 $20 $4 $5 $204 $509
2011 $44 $125 $60 $128 $20 $40 $8 $15 $4 $6 $136 $314
Ave.: $35 $120 $37 $91 $12 $26 $7 $14 $4 $5 $94 $256
Source: Hatchery percent of total catch is from Alaska Salmon Enhancement Annual Reports, 2002–2011. Exvessel value is the total harvest value paid by fish buyers to fishermen from http://www.adfg.alaska.gov/index.cfm?adfg=commercialbyfisherysalmon.salmoncatch (accessed 02/04/2012) multiplied by the hatchery percent of the commercial harvest in the previous table. First wholesale value is the price paid to primary processors for processed fish from ADF&G commercial operator annual reports. Hatchery harvest values calculated as the percent of hatchery fish in the commercial catch multiplied by the exvessel or first wholesale value of the total catch, by species, from ADF&G 2012 , except for 2011, where the First Wholesale Value was estimated by multiplying the 2010 ratio of the First Wholesale Value to Exvessel Value by the 2011 Exvessel Value, because the First Wholesale Values were not yet reported.
8
ADF&G changed to a new sustainable fishery certification under the Food and Agriculture Organization in 2011. The hatchery evaluations started under the MSC certification continued as an important systematic assessment of Alaska salmon enhancement and its relation to wild stock production at a time of heightened interest for increased hatchery production and potential impacts on wild salmon production. ADF&G established a five-year rotational schedule to review PNP hatchery programs. Musslewhite (2011a, 2011b) completed hatchery reviews for the Kodiak region in 2011. This report for the Tutka Bay Lagoon Hatchery is the first for the Cook Inlet region. Following completion of hatchery reviews in Cook Inlet, reviews of hatcheries in Prince William Sound, Southern Southeast Alaska, and Northern Southeast Alaska will follow.
OVERVIEW OF POLICIES
Numerous Alaska mandates and policies for hatchery operations were specifically developed to minimize potential adverse impacts to wild stocks. The design and development of the hatchery program is described in detail in McGee (2004): “The success of the hatchery program in having minimal impact on wild stocks can be attributed to the development of state statutes, policies, procedures, and plans that require hatcheries to be located away from significant wild stocks, and constant vigilance on the part of ADF&G and hatchery operators to improve the program through ongoing analysis of hatchery performance.” Through a comprehensive permitting and planning process, hatchery operations are subject to continual review by a number of Alaska Department of Fish and Game (ADF&G) fishery managers, geneticists and pathologists.
A variety of policies guide the permitting process. They include Genetic Policy (Davis et al. 1985), Regulation Changes, Policies, and Guidelines for Fish and Shellfish Health and Disease Control (Meyers 2010), and various fisheries management policies, such as the Sustainable Salmon Fisheries Policy (5 AAC 39.222). These policies are used by ADF&G staff to assess hatchery operations for genetic, health and fishery management issues in the permitting process.
The State of Alaska ADF&G Genetic Policy (Davis et al. 1985) and back ground of the ADF&G Genetic Policy (Davis and Burkett 1989) sets out restrictions and guidelines for stock transport, protection of wild stocks, and maintenance of genetic variance. Policy guidelines include banning importation of salmonids from outside the state for enhancement (except transboundary rivers); prohibiting transportation of stocks between the major geographic areas in the state (Southeast, Kodiak Island, Prince William Sound, Cook Inlet, Bristol Bay, AYK and Interior); and maintaining genetic diversity by use of large populations of broodstock collected across the entire run. A maximum of three hatchery stocks can be derived from a single donor stock to maintain genetic diversity.
The Genetic Policy also calls for the identification and protection of “significant and unique” wild stocks on a regional and species basis: “Stocks cannot be introduced to sites where the introduced stock may have significant interaction or impact on significant or unique wild stocks.” Davis and Burkett (1989) suggest that regional planning teams (RPT) are an appropriate body to designate those stocks.
The Genetic Policy also recommends the designation of watersheds to serve as wild stock sanctuaries to preserve genetic variability. “These sanctuaries will be areas in which no enhancement activity is permitted except gamete removal for broodstock development.”

9
Salmon fisheries enhancement efforts are guided by comprehensive salmon plans for each region. These plans are developed by the RPTs, which are composed of six members: three from ADF&G and three appointed by the regional aquaculture association (RAA) Board of Directors (5 AAC 40.310). According to McGee (2004),
“Regional comprehensive planning in Alaska progresses in stages. Phase I sets the long-term goals, objectives and strategies for the region. Phase II identifies potential projects and establishes criteria for evaluating the enhancement and rehabilitation potentials for the salmon resources in the region. In some instance, a Phase III in planning has been instituted to incorporate Alaska Board of Fisheries approved allocation and fisheries management plans with hatchery production plans.”
The Alaska Fish Health and Disease Control Policy (5 AAC 41.080) is designed to protect fish health and prevent spread of infectious disease in fish and shellfish. The policy and associated guidelines are discussed in Regulation Changes, Policies, and Guidelines for Fish and Shellfish Health and Disease Control (Meyers 2010). It includes regulations and guidelines for wild fish transports, brood stock screening, disease histories, and transfers between hatcheries. The Alaska Sockeye Salmon Culture Manual (McDaniel et al. 1994) also specifies practices and guidelines specific to the culture of sockeye salmon. As with the Genetic Policy, these regulations and guidelines are used by the principal pathologist and ADF&G geneticist to review hatchery plans and permits.
The Alaska Policy for the Management of Sustainable Salmon Fisheries (5AAC 39.222) mandates protection of wild salmon stocks in the management of salmon fisheries. Other applicable policies include the Policy for the Management of Mixed-Stock Salmon Fisheries (5AAC 39.220), the Salmon Escapement Goal Policy (5AAC 39.223), and local fishery management plans (5AAC 39.200). These policies require biologists to consider the interactions of wild and enhanced salmon stocks when reviewing hatchery management plans and permits.
The guidance provided by these policies is sometimes very specific, and sometimes less so. For example, the Alaska Fish Health and Disease Control Policy mandates the use of an iodine solution on salmon eggs transported between watersheds—a prescribed practice that requires little interpretation. In contrast, several policies prioritize the protection of wild stocks from the potential effects of fisheries enhancement projects without specifying or mandating how to assess those effects. These less specific policies provide principles and priorities, but not specific direction, for decision making.
A key principle of Alaska policy is to protect wild salmon stocks. The initial rotation of these reports will assess the consistency of individual hatcheries with state policies by (1) confirming that permits have been properly reviewed using applicable policies, and (2) identifying information relevant to each program’s consistency with state policies. Future reports may assess regional impacts of multiple hatcheries on wild stocks and fishery management.
OVERVIEW OF HATCHERY PERMITS AND PLANS
The FRED Division built and operated several hatcheries across the state in the 1970s, and gradually transferred operations of most facilities to PNP corporations. RAAs, comprised of commercial salmon permit holders, operate most of the PNP hatchery operations in Kodiak,

10
Cook Inlet, Prince William Sound, and Southeast Alaska. Each RAA’s Board of Directors establish goals for enhanced production, oversee business operations of the hatcheries, and work with ADF&G staff to comply with state permitting and planning regulations. RAAs may vote to implement a salmon enhancement tax on salmon landings in their region to finance hatchery operations. Independent PNP corporations not affiliated with the RAAs also operate hatcheries in several areas of the state. Both the RAA and independent PNP hatcheries may sell salmon returning to their hatcheries, referred to as “cost recovery”, to pay for operations. Several hatcheries have tourist and educational programs that support their programs, as well.
Public participation is an integral part of the PNP hatchery system. Hearings are held before a hatchery is permitted for operation. RPTs comprised of ADF&G and RAA personnel define production goals by species, area, and time in a Salmon Enhancement Plan (5 AAC 40.300). RPTs review applications for new hatcheries to determine compatibility with the Salmon Enhancement Plan, and make recommendations to the ADF&G commissioner for changes to existing hatchery operations, new hatchery production and new hatchery facilities. Municipal, commercial, sport, and subsistence fishing representatives commonly hold seats on both RAA and independent PNP hatchery boards, providing broad public oversight of operations.
Alaska PNP hatcheries operate under four documents required in regulation (5 AAC 40.110–990 and 5 AAC 41.005–100) and statue (AS 16.05.092): hatchery permit with basic management plan, annual management plan, fish transport permit, and annual management report (Figure 3). The hatchery permit authorizes operation of the hatchery, specifies the maximum number of eggs of each species that a facility can incubate, and may identify requested stocks to be used for broodstock. The basic management plan (BMP) is an addendum to the hatchery permit and outlines the general operations of the hatchery. The BMP may describe the facility design, operational protocols, hatchery practices, broodstock development schedule, donor stocks, harvest management, release sites, and consideration of wild stock management. The BMP functions as part of the hatchery permit and the two documents should be revised together if the permit is altered. The permit and BMP are not transferrable. Permits remain in effect unless revoked or withdrawn.
Hatchery permits/BMPs may be amended through a Permit Alteration Request (PAR). Requested changes are reviewed by the RPT and ADF&G staff, and a recommendation is sent to the commissioner for consideration. If approved, the permit alteration becomes part of the permit. Reference to a “permit” or “hatchery permit” in this document also includes approved PARs to the hatchery permit unless otherwise noted.
The annual management plan (AMP) outlines operations for the current year, and is in effect until superseded by the following year’s AMP. It should, by regulation (5 AAC 40.840), “organize and guide the hatchery’s operations, for each calendar year, regarding production goals, brood stock development, and harvest management of hatchery returns.” Typically, AMPs include the upcoming year’s egg take goals, fry or smolt releases, expected adult returns, harvest management plans, fish transport permits (described below) required or in place, and fish culture techniques. The AMP must be consistent with the hatchery permit and BMP.
A fish transport permit (FTP) is required for egg collections, transports, and releases (5 AAC 41.001–41.100). The FTP authorizes the specific activities in the hatchery permit and management plans, including broodstock source, gamete collections, and release sites. All proposed FTPs are reviewed by the ADF&G fish pathologist, fish geneticist, regional resource

11
development biologist, the Division of Commercial Fisheries regional supervisor, the Division of Sport Fish regional supervisor, and Division of Commercial Fisheries deputy director of before final consideration by the ADF&G commissioner. An FTP is issued for a fixed time period and includes both the specifics of the planned operation and any conditions added by ADF&G.
Each PNP hatchery files an annual report documenting egg collections, juvenile releases, and hatchery returns for the year. Information for all hatcheries is compiled into an annual ADF&G report (e.g., White 2010) to the Alaska Legislature (AS 16.05.092).
The administration of hatchery permitting, planning and reporting requires regular, direct communication between ADF&G staff and hatchery operators. The serial documentation from hatchery permit/BMP to AMP to FTP to annual report necessarily spans generations of hatchery and ADF&G personnel, providing an important history of each hatchery’s species cultured, stock lineages, releases, returns, and pathology.
Figure 3.–Schematic of Alaska hatchery regulatory system (McGee 2004).

12
TUTKA BAY LAGOON HATCHERY OVERVIEW
The Cook Inlet Aquaculture Association (CIAA) is the RAA for Cook Inlet, and operates the Tutka Bay Lagoon Hatchery (TBLH). The CIAA Board of Directors has 24 members. Five board members are elected by commercial fishermen. The remaining seats are appointed by commercial fishing groups (10 seats), local municipalities (7 seats) and other organizations (2 seats). The 5 elected seats and the 10 commercial fishing group seats are held by commercial fishermen.
Tutka Bay Lagoon Hatchery is located in Kachemak Bay near Homer, Alaska (Figures 4 and 5). The State of Alaska constructed the hatchery in 1976. The FRED Division operated the hatchery to enhance pink and chum salmon runs in Tutka Creek, the water source for the hatchery (Boyle and Dudiak 1981). Tutka Creek pink salmon and Port Dick chum salmon were the original brood sources for the hatchery (FRED 1977; FRED 1979; FRED 1980). In 1991, ADF&G contracted with CIAA to operate the hatchery, and in 1994, CIAA took over operations under their own permit (Appendix 1), and the state retained ownership of the facility.
Pink, chum, and sockeye salmon have been produced at TBLH. The original permit allowed a maximum incubation capacity of 125 million pink and chum salmon eggs, with no more than 20 million of the total in chum salmon eggs. The permit was altered in 1994 to allow incubation of 660,000 sockeye salmon eggs for release into Tutka Bay Lagoon (Appendix 1). The sockeye broodstock source was not specified. Chum salmon was removed from the permit at the same time, presumably because chum salmon may be susceptible to Infectious Hematopoietic Necrosis Virus (IHNV) when cultured in the same facility as sockeye salmon, according to McDaniel et al., 1994 (Ted Meyers, ADF&G Fish Pathologist, personal communication).
The first release of pink salmon from TBLH was by ADF&G in 1976 (Appendix 2). When CIAA took over operations in 1991, about 30 million fry were produced annually. From 1994 to 2004, releases averaged 77 million, with a peak release of 105 million in 1996. Adult pink salmon returns exceeded a million fish in several years (Appendix 3). Broodstock collection, cost recovery and common property fisheries of TBLH returns occur in Special Harvest Areas (SHAs) in Tutka Bay and Halibut Cove (Figure 5).
In 2004, CIAA suspended pink salmon operations due to low pink salmon prices. Pink salmon prices later recovered, and CIAA opted to renew the pink salmon program in 2010. CIAA collected eggs from Tutka Creek broodstock in 2011. ADF&G approved PARs for supplemental wild stock egg takes from the Port Dick and Windy Bay systems as a temporary measure until sufficient eggs can be collected from returns to TBLH (Appendix 1). Release of these two stocks is only permitted at Halibut Cove. CIAA will use the sale of adult returns to Halibut Cove to financially support the TBLH project. When returns of Tutka Creek stock to the hatchery provide the full 125 million permitted egg capacity, that stock will be used for both Tutka Bay and Halibut Cove releases.
ADF&G released chum salmon at TBLH from 1979 to 1990 (Appendix 2). The early chum salmon program operated by ADF&G experienced high mortality when transferring fry from fresh to saltwater (McDaniel 1984; McMullen and Kissel 1979). Except for the return of over 9,000 chum salmon in 1982, returns to the hatchery were minimal, ranging from 700 to 2,400 fish from 1986 to 1991 (Appendix 4). The author did not find additional data regarding the Tutka chum program in ADF&G reports.

13
Sockeye fry incubated at TBLH were released intermittently from 1977 to 1999 (Appendix 2). The ADF&G Mark, Tag and Age Laboratory records indicate sockeye fry were reared in Tutka Bay in 1977 and 1978. The 1977 fry were released to Leisure Lake and the 1978 fry to Tustumena Lake. It was not clear where the eggs were incubated for these releases.
An egg take occurred in 1989 from English Bay Lakes sockeye salmon. Eggs were incubated in TBLH and released as fry to English Bay Lakes in 1990. Egg incubation for English Bay Lakes was moved to Big Lake Hatchery in 1990 (FRED 1991). In 1991, CIAA conducted a one-year experimental release of sockeye fry at TBLH from eggs incubated at Crooked Creek Hatchery. In 1994, CIAA initiated a sockeye salmon project at TBLH, incubating eggs taken from Packer’s Lake broodstock (Appendix 1). IHNV in the hatchery water supply in 1998 caused suspension of the program following the 1999 release. Sockeye returns from the 1996 and later releases occurred from 1999 through 2002 (Appendix 5).
From 2005 to 2010, CIAA reared sockeye smolt in Tutka Bay that were reared at Trail Lakes Hatchery under the Trail Lakes Hatchery permit. These releases will be reviewed under the Trail Lakes Hatchery evaluation.
14
Figure 4.–Tutka Bay Lagoon Hatchery, Trail Lakes Hatchery, and CIAA project locations.
Tutka Bay Lagoon Hatchery
Packers Lake
KENAI PENINSULA BOROUGH
Hidden Lake
Tustumena Lake
Trail Lakes Hatchery
N MATANUSKA-SUSITNA BOROUGH
Homer
Port Dick Windy Bay
Kenai Lake
Halibut Cove
15
Figure 5.–Tutka Bay Lagoon and Halibut Cove.
PROGRAM EVALUATION
Hatchery permit/BMP, AMP, and FTP documents for TBLH were reviewed to determine that they met the following guidelines:
They are current. They are consistent with each other. They are an accurate description of current hatchery practices.
The hatchery permit and BMP do not expire. The BMP should be updated when any permit amendments are approved through PARs. CIAA is diligent in this process, submitting an updated BMP with each PAR. The 2011 AMP provides thorough documentation of expected operations for the season, including egg take and release goals, expected returns, new construction and maintenance, plans for thermal marking, a list of current FTPs, and potential projects that may occur subject to FTP or PAR approval. The AMP is also consistent with the permit and BMP.
The BMPs for CIAA’s projects provide a high level of detail. BMPs are primarily a planning document for initial stages of hatchery operations, describing pertinent details of hatchery permit
Halibut Cove

16
conditions such as species, numbers of eggs, broodstock source, and harvest management. After a hatchery is fully operational, the AMP becomes the primary document of current operations and programs. ADF&G is working with CIAA and other PNPs to generalize BMPs when these documents are updated for PAR approvals, moving specific operation details, such as incubator type, from the BMP to the AMP. This will reduce the administrative burden of submitting PARs for approval of routine adjustments to hatchery operations. The FTP covering pink salmon production at TBLH was renewed several times after the initial FTP was issued in the late 1970s, and expired in 2010. CIAA submitted a renewal request for a 10-year extension of the FTP. However, ADF&G staff requested the extension be limited to five years, with subsequent renewal contingent on the hatchery establishing a thermal otolith marking program for “evaluation of biological interactions” and “quantification of returns.” ADF&G listed no specific plan for using the thermal marking to evaluate the return, nor indicated that a plan would be developed. The FTP was approved with the requested 10-year extension, and CIAA addressed the marking request with a commitment in the 2011 AMP to implement a thermal marking program within five years.
CIAA applied for PARs and FTPs for additional pink salmon broodstock collection sites, as they did not anticipate securing enough gametes from Tutka Creek alone to meet program goals. An FTP and PAR were first approved for gamete collection at Port Dick for release at Halibut Cove only. Port Dick was chosen because of its early run timing, which would provide harvest segregation from the later returning Humpy Creek wild stock near Halibut Cove, and because the Port Dick stock is of sufficient run size to provide adequate broodstock numbers after escapement requirements were met for the system. The 2010 pink salmon return was not as strong as expected, and CIAA submitted a PAR to add Windy Bay as a broodstock source to supplement the Port Dick returns (Figure 4). The PAR was approved on short notice, and the FTP approved for only one year pending further assessment of the Windy Bay stock as part of the Halibut Cove releases. Unlike Port Dick, Windy Bay pink stocks will return to Halibut Cove at about the same time as Humpy Creek pink salmon, and fishery management actions may be required to assure escapement goals to Humpy Creek are met. About 9 million eggs were collected from Tutka Creek and 4 million from Windy Bay in 2011.
HATCHERY PERMITS AND OPERATING PLANS
A comparison of hatchery permit/BMP, AMP, FTPs and annual reports indicates that pink salmon egg takes were above the 125 million permitted level in 1998, and from 2000 thru 2002. Sockeye salmon egg takes exceeded the permitted capacity of 660,000 eggs in 1995 and 1997. The sockeye release limit was not exceeded in any year (Table 4). It should be noted that egg take and release numbers are estimates, and not actual counts.

17
Table 4.–Comparison of permitted and reported egg takes and releases in hatchery permit, basic management plan, annual management plan, fishery transport permits and annual reports for Tutka Bay Lagoon Hatchery pink and sockeye salmon.
Hatchery Permit
including PARs
Basic Management Plan
in effect Annual
Management Plan FTPs Annual Report Year Eggs Eggs Release Eggs Release Eggsa Releaseb Eggs Releasec
Pink Salmon (in millions) 1994 125 125 125 89.2 61.1 1995 125 125 125 125 125.6 63.0 1996 125 125 125 125 116.0 105.0 1997 125 125 125 125 117.4 89.0 1998 125 125 125 125 129.0 90.0 1999 125 125 125 125 114.1 60.1 2000 125 125 125 125 131.5 65.1 2001 125 125 125 125 144.7 99.3 2002 125 125 125 125 159.4 99.3 2003 125 125 125 125 95.4 68.0 2004 125 125 125 125 48.0 2005 125 125 125 125 2006 125 125 125 125 2007 125 125 125 125 2008 125 125 125 125 2009 125 125 125 125 2010 125 125 125 125 2011 125 125 125 125 13.6
Sockeye Salmon (in thousands) 1994 660 660 330 660 550 0 1995 660 660 330 660 330 660 330 729 0 1996 660 660 330 660 330 660 330 500d 75 1997 660 660 330 660 330 660 330 667 245 1998 660 660 330 660 330 1999 660 660 330 660 330 100 2000 660 660 330 660 330 2001 660 660 330 660 330 2002 660 660 330 660 330 2003 660 660 330 660 330 2004 660 660 330 2005 660 660 330 2006 660 660 330 2007 660 660 330 2008 660 660 330 2009 660 660 330 2010 660 660 330 2011 660 660 330
a FTP’s state combined total from all pink salmon egg takes from Port Dick, Windy Bay and Tutka Bay will not exceed 125 million total eggs.
b Pink salmon release numbers stated in the FTPs are the “resulting fry” of the egg take; no specific fry number is listed. c No fish were released from Tutka in 2011. d Sockeye eggs transferred from Trail Lakes Hatchery to Tutka Bay.

18
COMPREHENSIVE SALMON ENHANCEMENT PLAN
With regard to TBLH, the 1981 Phase I Cook Inlet Comprehensive Salmon Enhancement Plan states:
“Overall production is expected to increase at this facility, and in the process there will be a change in emphasis so that by the year 2000 chum salmon will be approximately 36 percent of the annual production. Assuming funding and staffing support annual production is expected to reach 360,000 adult pink salmon and 200,000 adult chum salmon.”(CIRPT 1981).
Production goals were met for pink salmon prior to suspension of the program, but not for chum salmon (Appendix 4). The chum salmon program was abandoned in favor of sockeye production in 1994. Pink salmon production is expected to surpass goals of the Phase I plan when the program again reaches permitted capacity.
The Phase II Cook Inlet Comprehensive Salmon Enhancement Plan (CIRPT 2007) established criteria for significant stocks by species and run size as follows: Chinook salmon: 400 fish; sockeye salmon: 2,000 fish; coho and chum salmon: 800 fish; and pink salmon: 5,000 fish. Significant pink salmon stocks in and near Kachemak Bay include Tutka, Barabara, China Poot, Jakolof and Humpy creeks and Seldovia and Port Graham rivers. English Bay Lakes sockeye salmon, located about 15 miles southwest of Tutka Bay, is the only significant sockeye salmon stock in Kachemak Bay. Clearwater Creek coho salmon are a significant stock, as are chum stocks in Seldovia and Port Graham rivers.
The CIRPT established wild stock sanctuaries in the Phase II plan based on the concepts set out in the Genetic Policy. A total of seven Chinook, six sockeye, five coho, four chum, and five pink salmon stocks were designated in the Cook Inlet region, but none of these stocks are in or near Kachemak Bay.
Pink salmon from Windy Creek and Port Dick watersheds, located in the Resurrection Bay unit, were permitted as broodstock to restart the TBLH pink salmon program. Windy Bay is a significant stock and Port Dick Creek is both a significant stock and a wild stock sanctuary.
CONSISTENCY WITH POLICY
The policies governing Alaska hatcheries were divided into three categories for this review: genetics, fish health, and fisheries management. The key elements of the policies in each of those categories are summarized in Tables 5 through 7. These templates were used to assess compliance of the TBLH salmon program with each policy element in Tables 8 through 10.
19
Table 5.–Key elements of the ADF&G Genetic Policy.
I. Stock Transport
Use of appropriate local stocks
This element addresses Section I of the Genetic Policy, covering stock transports. The policy prohibits interstate or inter-regional stock transports, and uses transport distance and appropriate phenotypic characteristics as criteria for judging the acceptability of donor stocks.
II. Protection of wild stocks
Identification of significant or unique wild stocks
Significant or unique wild stocks must be identified for each region and species as stocks most important to that region. The Regional Planning Teams should establish criteria for determining significant stocks and recommend such stock designations.
Interaction with or impact on significant wild stocks
Priority is given to protection of significant wild stocks from harmful interactions with introduced stocks. Stocks cannot be introduced to sites where they may impact significant or unique wild stocks.
Use of indigenous stocks in watersheds with significant wild stocks
A watershed with a significant wild stock can only be stocked with progeny from the indigenous stocks. The policy also specifies that no more than one generation of separation from the donor system to stocking of the progeny will be allowed. This means that only progeny from eggs taken from natural broodstock from the watershed may be used, and not progeny of broodstock returning to a hatchery or release site.
Establishment of wild stock sanctuaries
Wild stock sanctuaries should be established on a regional and species basis. No enhancement activities would be allowed, but gamete removal would be permitted. The guidelines and justifications describe the proposed sanctuaries as gene banks of wild type variability.
III. Maintenance of genetic variance
Maximum of three hatchery stocks from a single donor stock
A maximum of three hatchery stocks can be derived from a single donor stock. Offsite releases, such as for terminal harvest, should not be restricted by this policy if the release sites are selected so that they do not impact significant wild stocks, wild stock sanctuaries, or other hatchery stocks.
Minimum effective population size
The policy recommends a minimum effective population size of 400. It also recognizes that small population sizes may be unavoidable with Chinook and steelhead.
Use of all segments of donor stock run timing
To ensure all segments of the run have the opportunity to spawn, sliding egg take scales for donor stock transplants will not allocate more than 90% of any segment of the run for brood stock.
Genetics review of Fishery Transport Permits (5 AAC 41.010 – 41.050)
Review by geneticist Each application is reviewed by the geneticist, who then makes a recommendation to either approve or deny the application. The geneticist may also add terms or conditions to the permit to protect wild or enhanced stocks.
20
Table 6.–Key elements of Alaska policies and regulations pertaining to fish health and disease.
Fish Health and Disease Policy (5 AAC 41.080; amended by Meyers (2010))
Egg disinfection
Within 48 hours of taking and fertilizing live fish eggs or transporting live fish eggs between watersheds, all eggs must be treated with an iodine solution. This requirement may be waived for large scale pink and chum salmon facilities where such disinfection is not effective or practical.
Hatchery inspections According to AS 16.10.460, inspection of the hatchery facility by department inspectors shall be permitted by the permit holder at any time the hatchery is operating.
Disease reporting The occurrence of fish diseases or pathogens listed in 5AAC 41.080(d) must be immediately reported to the ADF&G Fish Pathology Section.
Pathology requirements for Fishery Transport Permits (FTPs) (5 AAC 41.010 – 41.050)
Disease history Applications for FTPs require either a complete disease history of the stock or broodstock inspection if the disease history is not available.
Isolation measures Applications must list the isolation measures to be used during transport, including a description of containers, water source, depuration measures, and plans for disinfection.
Pathology review of FTPs
Each application is reviewed by the pathologist, who then makes a recommendation to either approve or deny it. The pathologist may also add terms or conditions to the permit to protect fish health.
Sockeye Salmon Culture Policy
Alaska Sockeye Salmon Culture Manual
The Sockeye Salmon Culture Policy is designed to control the occurrence of infectious hematopoietic necrosis virus (IHNV) in Alaska. The policy specifies the use of a virus-free water supply; rigorous disinfection procedures; compartmentalization of eggs and fry; and immediate destruction of infected fish, followed by disinfection. The Alaska Sockeye Salmon Culture Manual prescribes procedures and fish culture practices developed to control IHNV.

21
Table 7.–Key elements of Alaska fisheries management policies and regulations relevant to salmon hatcheries and enhancement.
Sustainable Salmon Fishery Policy (5 AAC 39.222)
I. Management principles and criteria
Assessment of wild stock interaction and impacts
As a management principle, the effect of enhanced stocks on wild stocks should be assessed. Wild stocks should be protected from adverse impacts from enhanced stocks.
Use of precautionary approach
Managers should use a conservative approach, taking into account any inherent uncertainty and risks.
Salmon Escapement Goal Policy (5 AAC 39.223)
Establishment of escapement goals
Management of fisheries is based on scientifically-based escapement goals that result in sustainable harvests.
Mixed Stock Salmon Fishery Policy (5 AAC 39.220)
Wild stock conservation priority
The conservation of wild stocks consistent with sustained yield is the highest priority in management of mixed-stock fisheries.
Fisheries management review of FTPs (5 AAC 41.010 – 41.050)
Review by management staff
All proposed FTPs are reviewed by the regional supervisors for the Divisions of Commercial Fisheries and Sport Fish, the deputy director of Commercial Fisheries, and the local Regional Resource Development Biologist before consideration by the ADF&G Commissioner. Department staff may recommend approval or denial of the permit, and recommend permit conditions.
Genetics Tutka Creek pink salmon are a significant stock in the salmon enhancement plan, and only this stock is released at Tutka Bay Lagoon (Table 8). Gametes from Windy Bay and Port Dick egg collections are incubated separately from the Tutka Creek gametes at TBLH for release only at Halibut Cove. Humpy Creek is a significant stock near Halibut Cove, so full harvest of the enhanced returns is imperative to minimize straying. The Windy Bay stock has similar run timing to Humpy Creek, and fishery management actions may be necessary to assure adequate escapement to Humpy Creek. The pink salmon program uses thousands of fish for brood stock for each release, well in excess of the 400 minimum effective population size prescribed in the Genetic Policy.
The Windy Bay and Port Dick systems are near each other on the southeastern Kenai Peninsula, and somewhat distant (about 80 water miles) from the Halibut Cove release site to the northwest (Figure 3). The geneticist expressed concern in comments on the Port Dick FTP about the distance between the brood sources and release site: “First, we are concerned by the distance of Port Dick from the release site at Halibut Cove. Little is known about the genetic population structure of pink salmon in this area and hence little is known about the extent of the genetic risk to pink salmon populations in lower Cook Inlet.” Similar comments were made for the Windy Bay FTP. The geneticist recommended the FTP for Port Dick be limited to five years to “allow for an evaluation of this program.” The FTP for Windy Bay was limited to one year. Evaluation plans in FTPs for Port Dick and Windy Bay state “CIAA will monitor the return for marked fish as directed by ADF&G”. However, no plans were indicated to look for the thermal marks, such as sampling streams for straying or sampling the commercial catch to estimate hatchery contribution.

22
Table 8.–The Tutka Bay Lagoon Hatchery and its consistency with elements of the ADF&G Genetic Policy (See Table 5).
I. Stock Transport
Use of appropriate local stocks
TBLH was built by ADF&G on a stream with an existing run of pink salmon, which would not be permitted today. The indigenous run was used as the donor stock for the hatchery.
II. Protection of wild stocks
Identification of significant or unique wild stocks
Tutka Creek pink salmon, the brood source for the TBLH, is a significant stock. Barabara Creek is a nearby significant pink salmon stock to the TBLH release site, and Humpy Creek is a significant stock to the Halibut Cove release site. Tutka Creek, Windy Creek and Port Dick Creek, brood sources for the Halibut Cove release, are significant stocks.
Interaction with or impact on significant wild stocks
Straying is addressed with intensive harvest of returning fish in special harvest areas (SHAs) adjacent to release sites. ADF&G can further restrict fishing to meet escapement goals to significant stocks near SHAs (Barabara Creek and Humpy Creek). The incidental harvest of Barabara Creek pink salmon is limited by closing the adjacent area to seining, and with mesh size restrictions on nearby set gillnetters. Port Dick and Windy Bay pink salmon return in mid-July, providing some degree of temporal separation to the Humpy Creek pink salmon return timing in late July and August. Achieving minimum SEGs are required prior to taking brood stock from significant stocks in Tutka Creek, Port Dick and Windy Bay. A planned marking program will enable estimates of straying.
Use of indigenous stocks in watersheds with significant wild stocks
Tutka Creek is the indigenous stock in the watershed and used as the donor stock for the hatchery per the Genetic Policy.
Establishment of wild stock sanctuaries
Port Dick Creek is a pink salmon wild stock sanctuary. No gametes or fry from brood stock taken from Port Dick will be returned to the stream per the Genetic Policy.
III. Maintenance of genetic variance
Maximum of three hatchery stocks from a single donor stock
Tutka Creek, Port Dick and Wind Bay pink salmon are only used at TBLH. Tutka Creek stock is the only stock released at Tutka.
Minimum effective population size CIAA will use more than 400 adult broodstock to achieve pink salmon egg take goals.
Use no more than 90% of any run segment of return
Broodstock will only be taken after the lower SEG is met at Tutka Creek, Port Dick, and Windy Bay. Brood stock collections are from a cross-section of the run, and are unlikely to take more than 90% of any part of the run.
Genetics review of FTPs (5 AAC 41.010 – 41.050)
Review by geneticist
In the review of pink salmon FTPs 11A-0056, 11A-0057 and 11A-0078, the principal geneticist stated some concern about the distance between the brood stock sources at Port Dick and Windy Bay, and the release site at Halibut Cove. He emphasized the need to harvest all fish returning to Halibut Cove to minimize straying to lower Cook Inlet streams.
23
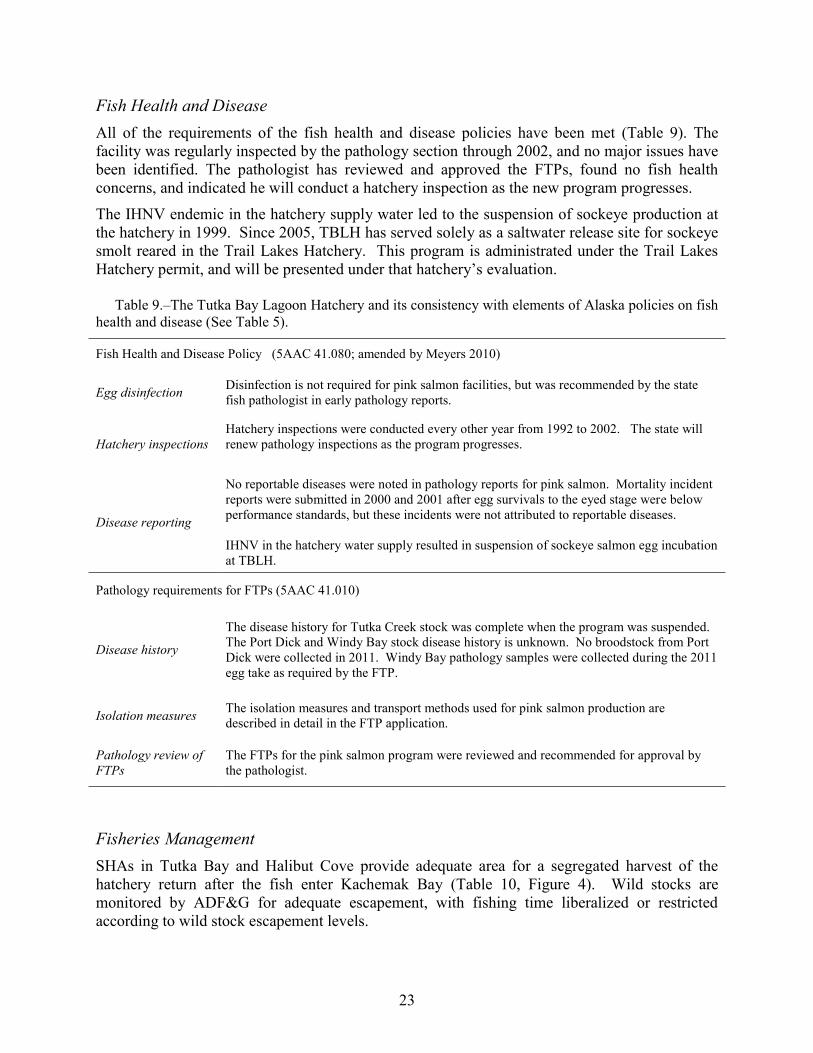
Fish Health and Disease All of the requirements of the fish health and disease policies have been met (Table 9). The facility was regularly inspected by the pathology section through 2002, and no major issues have been identified. The pathologist has reviewed and approved the FTPs, found no fish health concerns, and indicated he will conduct a hatchery inspection as the new program progresses.
The IHNV endemic in the hatchery supply water led to the suspension of sockeye production at the hatchery in 1999. Since 2005, TBLH has served solely as a saltwater release site for sockeye smolt reared in the Trail Lakes Hatchery. This program is administrated under the Trail Lakes Hatchery permit, and will be presented under that hatchery’s evaluation.
Table 9.–The Tutka Bay Lagoon Hatchery and its consistency with elements of Alaska policies on fish health and disease (See Table 5).
Fish Health and Disease Policy (5AAC 41.080; amended by Meyers 2010)
Egg disinfection Disinfection is not required for pink salmon facilities, but was recommended by the state fish pathologist in early pathology reports.
Hatchery inspections Hatchery inspections were conducted every other year from 1992 to 2002. The state will renew pathology inspections as the program progresses.
Disease reporting
No reportable diseases were noted in pathology reports for pink salmon. Mortality incident reports were submitted in 2000 and 2001 after egg survivals to the eyed stage were below performance standards, but these incidents were not attributed to reportable diseases. IHNV in the hatchery water supply resulted in suspension of sockeye salmon egg incubation at TBLH.
Pathology requirements for FTPs (5AAC 41.010)
Disease history
The disease history for Tutka Creek stock was complete when the program was suspended. The Port Dick and Windy Bay stock disease history is unknown. No broodstock from Port Dick were collected in 2011. Windy Bay pathology samples were collected during the 2011 egg take as required by the FTP.
Isolation measures The isolation measures and transport methods used for pink salmon production are described in detail in the FTP application.
Pathology review of FTPs
The FTPs for the pink salmon program were reviewed and recommended for approval by the pathologist.
Fisheries Management SHAs in Tutka Bay and Halibut Cove provide adequate area for a segregated harvest of the hatchery return after the fish enter Kachemak Bay (Table 10, Figure 4). Wild stocks are monitored by ADF&G for adequate escapement, with fishing time liberalized or restricted according to wild stock escapement levels.

24
Table 10.–The Tutka Bay Lagoon Hatchery and its consistency with elements of Alaska fisheries management policies and regulations (See Table 6).
Sustainable Salmon Fishery Policy (5 AAC 39.222)
I. Management principles and criteria
Assessment of wild stock interaction and impacts
A thermal marking program of all released fish will be implemented by the fifth year of resuming hatchery operations. No plan for evaluating enhanced fish contribution or straying was prescribed by ADF&G in approving the FTP.
Use of precautionary approach ADF&G may restrict fishing to meet wild stock escapement goals in area streams.
Salmon Escapement Goal Policy (5 AAC 39.223)
Establishment of escapement goals
Humpy, China Poot, Barabara, Tutka, Port Dick, Windy Right, Windy Left creeks and Seldovia and Port Graham Rivers have established sustainable pink salmon escapement goals (SEGs).
Mixed Stock Salmon Fishery Policy (5 AAC 39.220)
Wild stock conservation priority
The lower SEG must be met before any broodstock is taken at Tutka Creek or Port Dick. Windy Creek brood stock will be purchased during a regular commercial fishing period. Port Dick brook stock can be similarly purchased. The use of SHAs for TBLH origin pink salmon allows their targeted harvest and minimizes incidental catch of other stocks.
Fisheries management review of FTPs (5 AAC 41.010 – 41.050)
Review by management staff
The FTPs for TBLH program were reviewed and approved by fisheries management staff.
Barabara Creek pink salmon may be incidentally harvested by purse seine and set gillnet gear in the Tutka Bay subdistrict where TBLH releases would be targeted. Barabara Creek has a sustainable escapement goal (SEG) range of 1,900 to 9,000 pink salmon, and ADF&G records indicate the lower SEG escapement level was achieved every year since 1989 (Hammarstrom and Ford 2011).
As noted in the BMP, Humpy Creek, near the Halibut Cove SHA, has an SEG range of 21,650 to 85,550 fish, and may require ADF&G management action to achieve adequate escapement. Humpy Creek has achieved the lower SEG every year for the past decade except 2009, which occurred in a year of no enhanced pink salmon returns in the area. Pink salmon escapements to other local streams appear to be stable, with most above their lower SEG every year (Hammarstrom and Ford 2011).
A trend of low escapements in recent years to Tutka Creek may impede a quick return to full capacity at TBLH. Fried (1994) indicated escapement goals used in 1994 were based on historical escapements, but made no mention of hatchery fish consideration in the escapement goal. The hatchery was not in operation when the current SEGs were established, although
25
escapements counted after 1978 were an unknown mix of hatchery and wild fish (Otis 2001). Pink salmon returns to Tutka Creek did not achieve the lower SEG of 6,500 fish from 2006 to 2010, (Hammarstrom and Ford 2011) but rebounded to 20,000 fish in 2011, exceeding the upper SEG of 17,000 (Glenn Hollowell, personal communication).
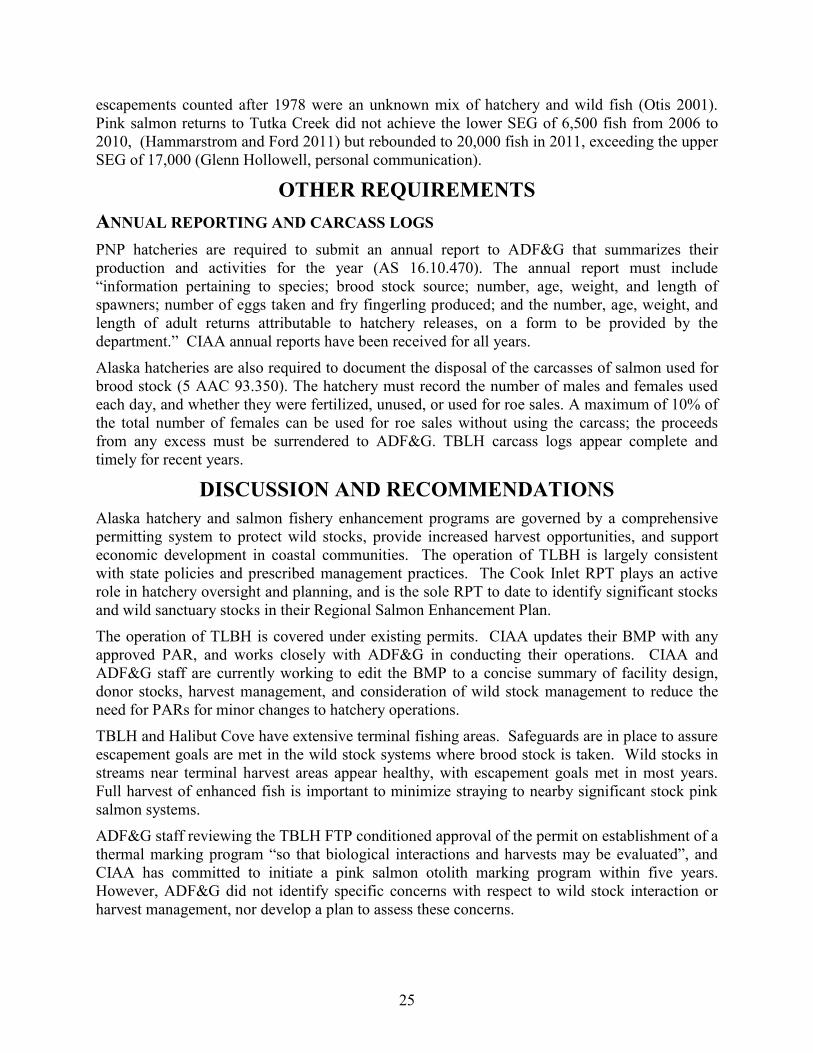
OTHER REQUIREMENTS
ANNUAL REPORTING AND CARCASS LOGS
PNP hatcheries are required to submit an annual report to ADF&G that summarizes their production and activities for the year (AS 16.10.470). The annual report must include “information pertaining to species; brood stock source; number, age, weight, and length of spawners; number of eggs taken and fry fingerling produced; and the number, age, weight, and length of adult returns attributable to hatchery releases, on a form to be provided by the department.” CIAA annual reports have been received for all years.
Alaska hatcheries are also required to document the disposal of the carcasses of salmon used for brood stock (5 AAC 93.350). The hatchery must record the number of males and females used each day, and whether they were fertilized, unused, or used for roe sales. A maximum of 10% of the total number of females can be used for roe sales without using the carcass; the proceeds from any excess must be surrendered to ADF&G. TBLH carcass logs appear complete and timely for recent years.
DISCUSSION AND RECOMMENDATIONS
Alaska hatchery and salmon fishery enhancement programs are governed by a comprehensive permitting system to protect wild stocks, provide increased harvest opportunities, and support economic development in coastal communities. The operation of TLBH is largely consistent with state policies and prescribed management practices. The Cook Inlet RPT plays an active role in hatchery oversight and planning, and is the sole RPT to date to identify significant stocks and wild sanctuary stocks in their Regional Salmon Enhancement Plan.
The operation of TLBH is covered under existing permits. CIAA updates their BMP with any approved PAR, and works closely with ADF&G in conducting their operations. CIAA and ADF&G staff are currently working to edit the BMP to a concise summary of facility design, donor stocks, harvest management, and consideration of wild stock management to reduce the need for PARs for minor changes to hatchery operations.
TBLH and Halibut Cove have extensive terminal fishing areas. Safeguards are in place to assure escapement goals are met in the wild stock systems where brood stock is taken. Wild stocks in streams near terminal harvest areas appear healthy, with escapement goals met in most years. Full harvest of enhanced fish is important to minimize straying to nearby significant stock pink salmon systems.
ADF&G staff reviewing the TBLH FTP conditioned approval of the permit on establishment of a thermal marking program “so that biological interactions and harvests may be evaluated”, and CIAA has committed to initiate a pink salmon otolith marking program within five years. However, ADF&G did not identify specific concerns with respect to wild stock interaction or harvest management, nor develop a plan to assess these concerns.

26
Thermal marking at Tutka Bay will be done with diesel boilers at a significant expense in additional infrastructure, fuel, training, and labor, as well as increased air pollution and fuel spill risk. To justify the costs and associated risks of thermal marking, ADF&G should (1) specify the biological or harvest management issue of concern, (2) define a detailed evaluation plan for addressing the concerns, (3) develop a budget and funding source with CIAA to carry out the plan, and (4) provide a flexible timeframe to allow CIAA to adjust their operational and monitoring plans accordingly.
ACKNOWLEDGEMENTS
Appreciation is given to Gary Fandrei and Caroline Cherry, CIAA, for assistance with data collection, historical information, and review of this document.
27
REFERENCES CITED ADF&G 2012. Information by fishery. Commercial salmon catch, effort & value.
http://www.adfg.alaska.gov/index.cfm?adfg=commercialbyfisherysalmon.salmoncatch. (Accessed January 2012).
ADF&G 2011. 2011 Commercial operator’s annual report booklet. Alaska Department of Fish and Game. Commercial Fisheries Division. Juneau.
Alaska Legislature 1974. An Act authorizing the operation of private nonprofit salmon hatcheries. Sec. 1, ch. 111, SLA 1974, in the Temporary and Special Acts.
ASMI 2011a. May 2011 seafood market bulletin. Alaska Seafood Marketing Institute. Juneau. www.alaskaseafood.org.
ASMI 2011b. Summer 2011 seafood market bulletin. Alaska Seafood Marketing Institute. Juneau. www.alaskaseafood.org.
Bedford, D. 2007. Action plan to address conditions for MSC recertification, July 2, 2007. Alaska Department of Fish and Game, Office of the Commissioner, Juneau.
Boyle, L., and N. Dudiak. 1981. Tutka Bay Lagoon hatchery 1981 adult return evaluation. Alaska Department of Fish and Game, Division of Fisheries Rehabilitation, Enhancement and Development, Number 61. (http://www.ADF&G.alaska.gov/FedAidPDFs/fred.061.pdf).
Chaffee, C., G. Ruggerone, R. Beamesderfer, and L. W. Botsford. 2007. The commercial Alaska salmon fisheries managed by the Alaska Department of Fish and Game, a 5-year re-assessment based on the Marine Stewardship Council program. Final draft assessment report, October 30, 2007 (IHP-05-069), Emeryville, CA. Prepared by Scientific Certification Systems, Inc., for the Alaska Department of Fish and Game, Division of Commercial Fisheries, Juneau.
Cook Inlet Regional Planning Team, 1981. Cook Inlet regional salmon enhancement plan 1981-2000. Alaska Department of Fish and Game, Juneau.
Cook Inlet Regional Planning Team. 2007. Cook Inlet regional salmon enhancement plan phase II 2006-2025. Alaska Department of Fish and Game, Juneau.
Croot, C., and L. Margolis, editors. 1991. Pacific salmon life histories. UBC Press, Vancouver, BC Canada.
Davis, B., B. Allee, D. Amend, B. Bachen, B. Davidson, T. Gharrett, S. Marshall, and A. Wertheimer. 1985. Genetic policy. Alaska Department of Fish and Game, Division of Fisheries Rehabilitation, Enhancement and Development, Juneau.
Davis, B., and B. Burkett. 1989. Background of the genetic policy of the Alaska Department of Fish and Game. FRED Report No. 95. Alaska Department of Fish and Game, Division of Fisheries Rehabilitation, Enhancement and Development, Juneau.
Ess, C. 2003. Market Updates: North Pacific- Salmon 2003 fish forecast speaks volumes about market problems facing fleet. National Fisherman Magazine, June 2003.
FRED (Division of Fisheries Rehabilitation, Enhancement and Development). 1975. Report to the 1975 Legislature. Alaska Department of Fish and Game. Juneau.
FRED (Division of Fisheries Rehabilitation, Enhancement and Development). 1976. Report to the 1976 Legislature. Alaska Department of Fish and Game. Juneau.
FRED (Division of Fisheries Rehabilitation, Enhancement and Development). 1977. Report to the 1977 Legislature. Alaska Department of Fish and Game. Juneau.
FRED (Division of Fisheries Rehabilitation, Enhancement and Development). 1979. Report to the 1979 Legislature. Alaska Department of Fish and Game. Juneau.
FRED (Division of Fisheries Rehabilitation, Enhancement and Development). 1980. Report to the 1980 Legislature. Alaska Department of Fish and Game. Juneau.

28
REFERENCES CITED (Continued) FRED (Division of Fisheries Rehabilitation, Enhancement and Development). 1991. Report to the 1991 Legislature.
Alaska Department of Fish and Game. Juneau.
Fried, S. M. 1994. Pacific salmon spawning escapement goals for the Prince William Sound, Cook Inlet, and Bristol Bay areas of Alaska. Alaska Department of Fish and Game, Division of Commercial Fisheries, Special Publication No. 8, Juneau.
Farrington, C. 2003. Alaska salmon enhancement program 2002 annual report. Alaska Department of Fish and Game, Division of Commercial Fisheries, Regional Information Report 5J03-05, Juneau.
Farrington, C. 2004. Alaska salmon enhancement program 2003 annual report. Alaska Department of Fish and Game, Division of Commercial Fisheries, Regional Information Report 5J04-02, Juneau.
Hammarstrom, L. F., and E. G. Ford. 2011. 2010 Lower Cook Inlet annual finfish management report. Alaska Department of Fish and Game, Fishery Management Report No. 11-26, Anchorage.
Industry Working Group, 2010. Open Letter to Alaska Hatcheries, April 16, 2010. Industry Working Group (Trident Seafoods, Pacific Seafood Processors Association, Icicle Seafoods, Ocean Beauty Seafoods LLC, and Alaska General Seafoods, PSPA member companies with salmon processing operations).
Knapman, P. G. Ruggerone, J. Brady, and A. Hough. 2009. Alaska salmon fisheries: first annual surveillance report 2007/08. February 2009 (MML-F-017), Houston, TX. Prepared by Moody Marine Ltd., for the Alaska Department of Fish and Game.
Knapp, G., K Roheim, and J. Anderson. 2007. The Great Salmon Run: Competition between wild and farmed salmon. TRAFFIC North America. Washington, D.C.: World Wildlife Fund.
Marine Steward Ship Council. 2012. www.msc.org. Accessed February 6, 2012.
McDaniel, T. 1984. Evaluation of Seawater Tolerance of Emergent Chum Salmon (Onchorhynchus keta) fry at Main Bay hatchery, Prince William Sound, Alaska (1983). Number 38. ADF&G Division of Fisheries Rehabilitation, Enhancement and Development. Juneau.
McDaniel T. R., K. M. Pratt., T. R. Meyers, T. D. Ellison, J. E. Follett, and J. A. Burke. 1994. Alaska sockeye salmon culture manual. Alaska Department of Fish and Game, Division of Commercial Fisheries Management and Development, Special Publication No. 6, Juneau.
McGee, S.G. 2004. Salmon hatcheries in Alaska – plans, permits, and policies designed to provide protection for wild stocks. Pages 317-331 [In] M. Nickum, P. Mazik, J. Nickum, and D. MacKinlay, editors. Symposium 44: Propagated fish in resource management. American Fisheries Society, Bethesda, MD.
McMullen, J. C., and M. Kissel. 1979. Annual report, 1979 Division of Fisheries Rehabilitation, Enhancement and Development (FRED). Juneau: Alaska Department of Fish and Game.
Meyers, T. 2010. Regulation changes, policies, and guidelines for Alaska fish and shellfish health and disease control. Alaska Department of Fish and Game, Regional Information Report 5J10-01, Anchorage.
Musslewhite, J. 2011a. An evaluation of the Kitoi Bay salmon hatchery for consistency with statewide policies and prescribed management practices. Alaska Department of Fish and Game, Division of Commercial Fisheries, Regional Information Report 5J11-01, Anchorage.
Musslewhite, J. 2011b. An evaluation of the Pillar Creek salmon hatchery for consistency with statewide policies and prescribed management practices. Alaska Department of Fish and Game, Division of Commercial Fisheries, Regional Information Report 5J11-02, Anchorage.
Vercessi, L. 2012. Alaska salmon enhancement program 2012 annual report. Alaska Department of Fish and Game, Fishery Management Report No. 12-04, Anchorage.
White, B. 2005. Alaska salmon enhancement program 2004 annual report. Alaska Department of Fish and Game, Fishery Management Report No. 05-09, Anchorage.

29
REFERENCES CITED (Continued) White, B. 2006. Alaska salmon enhancement program 2005 annual report. Alaska Department of Fish and Game,
Fishery Management Report No. 06-19, Anchorage.
White, B. 2007. Alaska salmon enhancement program 2006 annual report. Alaska Department of Fish and Game, Fishery Management Report No. 07-04, Anchorage.
White, B. 2008. Alaska salmon enhancement program 2007 annual report. Alaska Department of Fish and Game, Fishery Management Report No. 08-03, Anchorage.
White, B. 2009. Alaska salmon enhancement program 2008 annual report. Alaska Department of Fish and Game, Fishery Management Report No. 09-08 Anchorage.
White, B. 2010. Alaska salmon enhancement program 2009 annual report. Alaska Department of Fish and Game, Fishery Management Report No. 10-05, Anchorage.
White, B. 2011. Alaska salmon enhancement program 2010 annual report. Alaska Department of Fish and Game, Fishery Management Report No. 11-04, Anchorage.

30

31
APPENDIX

32
Appendix 1.–History of Tutka Bay Lagoon Hatchery Permit and Hatchery Permit Alterations, 1994–2011.
Permitted Capacity (green eggs)
Date Description Pink Chum Sockeye
1/5/1994
Original permit number 32 issued to CIAA. Permitted combined total of 125 million pink and chum salmon eggs, with no more than 20 million chum. Broodstock sources were from TBLH returns. The hatchery was built and operated by ADF&G since 1978 and so had pre-existing returns to the hatchery.
125 million 20 million 0
7/11/1994
Permit alteration allowing 660 thousand sockeye salmon eggs for release into Tutka Lagoon and removing chum salmon capacity. Sockeye broodstock source was not listed.
125 million 0 660,000
05/20/2011 Permit alteration adding Port Dick as a pink salmon broodstock source. 125 million 0 660,000
08/10/2011 Permit alteration adding Windy Bay as a pink salmon broodstock source. 125 million 0 660,000

33
Appendix 2.–Releases from Tutka Bay Lagoon Hatchery, 1976–2010. Release numbers are from the State of Alaska Tag Lab, unless otherwise noted.
Year Pink Salmon Released
Sockeye Salmon Released
Chum Salmon Released
1976 250,000a 1977 318,000 91,000 1978 4,821,000 400,000b 1979 9,244,000 797,000 1980 6,795,000 1981 10,269,000 8,000 1982 15,475,000 15,000 1983 15,233,000 1,118,000 1984 18,142,000 141,000 1985 23,537,000 26,000 1986 26,235,000 18,000 1987 8,241,000 446,000 1988 15,589,000 3,211,000 1989 36,977,000 2,164,000 1990 36,685,000 355,000c 1,509,000 1991 30,000,000 1992 31,950,000 1993 48,700,000 1994 61,100,000 1995 63,000,000 1996 105,000,00
0 75,000
1997 89,000,000 245,000 1998 90,000,000 d 1999 60,132,000 100,000 2000 65,121,000 2001 99,336,000 2002 99,371,000 2003 67,967,000 2004 47,964,000 2005 96,000 e 2006 260,000 e 2007 144,000 e 2008 483,000 e 2009 301,000 e 2010 278,000 e
a 1976 release number from CIAA 2011 AMP. b Emergent fry released to Tustemena Lake and Halibut Cove. c Fed fry released to English Bay Lake. d Fry infected with IHNV and destroyed so no smolt for release in 1998. e Trail Lakes Hatchery-reared smolt released to Tutka Bay.
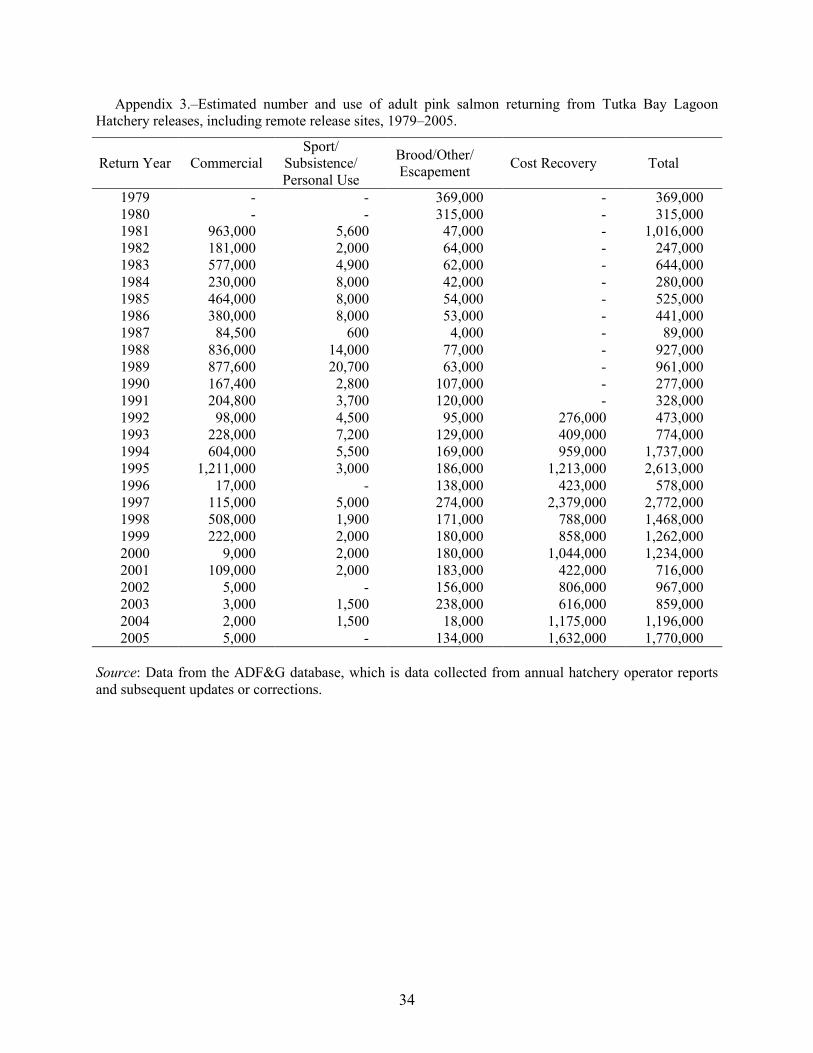
34
Appendix 3.–Estimated number and use of adult pink salmon returning from Tutka Bay Lagoon Hatchery releases, including remote release sites, 1979–2005.
Return Year Commercial Sport/
Subsistence/ Personal Use
Brood/Other/ Escapement Cost Recovery Total
1979 - - 369,000 - 369,000 1980 - - 315,000 - 315,000 1981 963,000 5,600 47,000 - 1,016,000 1982 181,000 2,000 64,000 - 247,000 1983 577,000 4,900 62,000 - 644,000 1984 230,000 8,000 42,000 - 280,000 1985 464,000 8,000 54,000 - 525,000 1986 380,000 8,000 53,000 - 441,000 1987 84,500 600 4,000 - 89,000 1988 836,000 14,000 77,000 - 927,000 1989 877,600 20,700 63,000 - 961,000 1990 167,400 2,800 107,000 - 277,000 1991 204,800 3,700 120,000 - 328,000 1992 98,000 4,500 95,000 276,000 473,000 1993 228,000 7,200 129,000 409,000 774,000 1994 604,000 5,500 169,000 959,000 1,737,000 1995 1,211,000 3,000 186,000 1,213,000 2,613,000 1996 17,000 - 138,000 423,000 578,000 1997 115,000 5,000 274,000 2,379,000 2,772,000 1998 508,000 1,900 171,000 788,000 1,468,000 1999 222,000 2,000 180,000 858,000 1,262,000 2000 9,000 2,000 180,000 1,044,000 1,234,000 2001 109,000 2,000 183,000 422,000 716,000 2002 5,000 - 156,000 806,000 967,000 2003 3,000 1,500 238,000 616,000 859,000 2004 2,000 1,500 18,000 1,175,000 1,196,000 2005 5,000 - 134,000 1,632,000 1,770,000
Source: Data from the ADF&G database, which is data collected from annual hatchery operator reports and subsequent updates or corrections.

35
Appendix 4.–Estimated number and use of adult chum salmon returning from Tutka Bay Lagoon releases, 1982–1991.
Return Year Commercial Sport/Subsistence/
Personal Use Brood/
Escapement Cost Recovery Total
1982 7,400 1,800 9,200 1983 1984 1985 1986 500 200 700 1987 2,200 200 2,400 1988 2,000 200 2,200 1989 2,000 2,000 1990 1,000 1000 2,000 1991 800 100 900
Source: Data from the ADF&G database, which is data collected from annual hatchery operator reports and subsequent updates or corrections.
Appendix 5.–Estimated number and use of adult sockeye salmon returning from Tutka Bay Lagoon releases, 1999–2010.
Return Year Commercial Sport/Subsistence/
Personal Use Brood/Other/ Escapement Cost Recovery Total
1999 18,700 16,300 100 35,100 2000 1,500 900 2,400 2001 500 150 650 2002 400 400 2003 2004 2005 2006 2007 2008 5,500 14,500 20,000 2009 3,500 11,500 15,000 2010 6,000 38,000 44,000
Source: Data from the ADF&G database, which is data collected from annual hatchery operator reports and subsequent updates or corrections. Returns from 2008 to 2010 are from eggs incubated at Trail Lakes Hatchery under that hatchery’s permit.

36
Appendix 6.–History of Tutka Bay Lagoon Hatchery Fishery Transport Permits, 1995–2011.
Issue Date FTP Number Expiration Description
05/25/1995
95A-0051
12/31/2005
Collect up to 125 million eggs from pink salmon returning to Tutka Hatchery. Release surviving short term reared fry at Tutka Bay Lagoon.
06/1/1995
95A-0052
12/31/2003
Collect up to 660,000 eggs from Packers Lake sockeye. Transport to Tutka Hatchery for incubation and rearing. Release up to 330,000 age-1 smolt at Tutka Bay Lagoon.
11/20/1996
96A-0087
12/31/1996
A one-time transport of approximately 500,000 eyed sockeye eggs of Packers Lake origin from Trail Lakes Hatchery to Tutka Lagoon Hatchery. This one-year activity was necessitated by the ongoing realignment of CIAA projects among three hatcheries instead of four.
9/14/2011 00A-0073 12/31/2016
Collect up to 125 million eggs from pink salmon returning to Tutka Bay Lagoon. Allows transport and release of Tutka Hatchery pink salmon at up to a mile distance from the hatchery as a predation avoidance measure. Originally permitted through 12/31/2010 and amended for permitting through 12/31/2016.
07/1/2011 11A-0056 6/30/2019
Authorizes collection and transport of adult pink salmon from Port Dick to TBLH, collection and incubation of eggs at TBLH, and short-term rearing and release of resulting progeny in Halibut Cove Lagoon. Maximum egg take of 120 million eggs. Total from all egg takes at Tutka Bay not to exceed the permitted capacity of 125 million.
07/1/2011 11A-0057 6/30/2019
Authorizes instream collection of gametes in Port Dick for transport to TBLH for incubation and short-term rearing and release of resulting progeny in Halibut Cove Lagoon. Maximum egg take of 120 million eggs. Total from all egg takes at Tutka Bay not to exceed the permitted capacity of 125 million.
07/1/2011 11A-0060 12/31/2016 Authorizes collection of Tutka Bay Lagoon/Tutka Creek broodstock, the collection and incubation of eggs at TBLH, and short-term rearing and release of resulting progeny in Tutka Bay Lagoon/Tutka Bay. Maximum egg take of 125 million eggs. Total from all egg takes at Tutka Bay not to exceed the permitted capacity of 125 million.
07/1/2011 11A-0078 06/30/2012 Authorizes the collection and transport of adult pink salmon from Windy Bay to TBLH as an alternative brood source for Port Dick. Maximum egg take of 120 million eggs. Total from all egg takes at Tutka Bay not to exceed the permitted capacity of 125 million.

37