Embed Size (px)
Citation preview
AN EVALUATION OF THE SHELTER POTENTIALIN MINES, CAVES AND TUNNELS
By
Robert A. Krupka
HI-507-RR June 11, 1965
Prepared under Contract Number OCD-PS-64-116,Subtask Number 4211-B, for the Office of CivilDefense, Department of the Army, Washington 25,D.C.
OCD REVIEW NOTICE
This report has been reviewed in the Office ofCivil Defense and approved for publication.Approval does not signify that the contentsnecessarily reflect the views and policies ofthe Office of Civil Defense.
Qualified requestors may obtain copies of thisreport from Defense Documentation Center, CameronStation, Alexandria, Virginia 22314.
The DDC will make copies of this report avail-able to the Clearinghouse for Federal Scientificand Technical Information, National Bureau ofStandards, Department of Commerce, for sale tothe general public.
HUDSON INSTITUTE, INC.Quaker Ridge Road
Harmon-on-HudsonNew York
Bees-t Available Copy~ O O~b50b
HI-507-RR
ACKNOWLEDGMENTS
The author wishes to thank the following people for their
advice and assistance.
Mr. Ronald D. Doremus, Vice President, National'Limestone Institute, Inc.
Mr. Robert H. Rose, National Speleological Society.
Mr. C.M. Kasparian, Office of Civil Defense, Officeof the Secretary of the Army.
At Hudson Instiute, helpful advice was received fr 'Frederick C.
Rockett and William M. Brown, and assistance from Roberta Siegel and
Michael Feilding.
HI-507-RR iii
SUMMARY
Some of the current interest in the active-passive defense field
involves the design of high-performance damage-limiting systems. This
study examines the availability and the potential of using mine space
(and to a much lesser extent, cave and tunnel space) in future civil
defense programs.
The study gives some background information concerning the previous
research on the use of mines for shelter and suggests that the available
survey information was inadequate to allow reasonable estimates to be
made of potential. New estimates of usable space and yearly space in-
creases are given,based on a sample survey of a few mines. The paper
also discusses the possibilities and costs of developing new mine space
and adapting mines to shelter use.
Information on caves and tunnels is also given. The study estimates
cave potential at about 4 million spaces and railroad and vehicular tun-
nels at about 2 to 3 million spaces. Although this potential is very
small cnmpared to that available in mines, caves and tunnels may prove
to be important assets in particular locations.
The study concludes that:
1. The use of mine space deserves renewed interest because previous
estimates of the potential were probably grossly underestimated. Our
estimate of current high-quality mine space potential is about one billion
square feet augmented by a minimum growth rate of 55 to 70 million square
feet per year. This space is available as follows:
iv HI -507-RR
Limestone Mines: 600-700 million square feet in more than 200underground workings. Estimated increase is43 to 57 million square feet per year.
Salt.Hines: 200-300 million square feet located 600 to 1,200 feetbelow ground level accessible only by small shafts.The space is dry and regular in shape. Increase isestimated at 8 million square feet per year.
Gypsum and Sandstone Mines: About 50 million square feet locatedin a few large mines and Increasingat 2 to 3 million square feet per year.
Our total estimates do not include space available in the lead-zinc
mines, high-priced ore mines or in coal mines which could be considered in
some programs. Coal mines, which had previously been considered too
hazardous for use as shelters, are included (substantially) in the NFSS.
As of June, 1964, the NFSS contained about 1,000 mines totaling 5.4
million spaces. Of these, approximately 370,000 spaces are located in
about 80 coal .lInes, mostly in Kentucky.
2. Presuming willingness to have shelter space further than the
25-mile limit currently used in the NFSS,* mine space might prove impor-
tant In making up non-city deficits and for possiole use by some of the
urban population.
3. Mines offer the possibility of superior protection which could
save many lives as compared to home basements and many NFSS shelters.
4. It appears possible to create new shelter space in selected
areas by encouraging operators of limestone quarries to convert to
*Facillities which lie outside a Standard Metropolitan Statistical
Area boundary and which are between 25 and 50 miles from the center of apopulated area can ,be considered for use in the I1FSS upon request of local,state or regional CD directors.
HI-507-RR v
underground operations or to develop new mines. This mine space would
become available at about one-tenth the cost of constructed fallout
shelter space.
5. The cost of adapting mines to shelter use will vary from zero
to about $100 per space, depending on existing facilities, access, loca-
tion and geological factors. In a national program using mines to a
large extent, we believe it possible to develop 100 million high-quality
spaces for under $5 billion.
6. Developing undergroung space might prove an attractive alterna-
tive to building she'ters in accelerated programs (1-4 years), since the
construction force is in place and structural material requirements would
be reduced.
The following recommendations are made:
I. An underground assets survey should be undertaken to increase
the knowledge of existing and potential mine space and to determine feasi-
bility of its use in nation-wide programs. A survey of this kind should
include a study of the relationship between the location of space and
population centers and the amount of space which could be planned for use.
2. A study of the feasibility of underground shelter systems using
existing and new mine space should be undertaken and might be part of the
"5 City Study."
3. Further investigation should be made to determine alternative
means of acquiring and encouraging the development of suitable mine space
at specific locations.
vi HI -507-RR
4. Alternative implementation plans and preparations should be
considered for using mines in various kinds of Increased Readiness
Programs.
A separately buund volume containing three appendices is included
as part of this report. It contains detailed listings of NFSS mines and
caves and detailed listings and locations of railroad and vehicular
tunnels. This data is intended for possible use by those researchers
desiring to undertake more specific studies of shelter potential in
mines, caves and tunnels.
HI-507-RR vii
TABLE OF CONTENTS
ACKNOWLEDGMENTS ................ ........................ i
SUMMARY ....................... ....................... .. ii
INTRODUCTION ................ ......................... I
GENERAL CHARACTERISTICS ................... ............... . 4
BACKGROUND INFORMATION ON MINE STUDIES ...... ........... 8
Qualification to the Data ...... ............ .. II
CURRENT ESTIMATES OF MINE SPACE POTENTIAL .... ........ ... .. 16
Salt Mines. ...... ........................ 16
Limestone, Sandstone and Gypsum Mines ... ......... .... 21
Lead and Zinc Mines ............... ................... 25
NATIONAL FALLOUT SHELTER SURVEY .......... ................ 31
NEW SITE POTENTIAL ........... .................... .... 36
Site Adaptation ........... ..................... ... 40
Ventilation and heat dissipation .................. 44
CAVES AND TUNNELS .............. ....................... ... 47
CONCLUSIONS ............ .......................... ... 55
RECOMMENDATIONS .............. ........................ ... 57
REFERENCES ............... .......................... 58
ATTACHMENT #1: LIMESTONE QUARRIES AND MINES BY OCD REGION(NATIONAL LIMESTONE INSTITUTE MAP)
H 1-507-RR
INTRODUCT ION
This study examines the availability and some costs of mines and, to
a lesser extent, caves and tunnels for possible use as sh-lter in future
civil defense programs. The importance of these potential resources is
now considered by us to be greater than it was in the past owing to the
apparent usefulness and practicality of civil defense programs aspiring
to levels of protection heretofore thought to have excessive cost. Very
effective civil defense programs seem to have a procurement cost that is
comparable to the figure assumed for the fallout shelter program in DOD
damage-limiting studies. The extensive use of mines could constitute an
important element in these programs not only because they meet such basic
life-saving criteria as often being located outside expected blast areas
and always providing at least minimum fallout protection for survival, but
because they also offer considerable hardness at low cost and protection
of health from radiation effects, and they tend to avoid or reduce domes-
tic debate and unfavorable international responses.
The development of highly effective, low-cost civil defense prog ams
is possible for situations in which (I) there would be a period of two or
more days during which preparations and operations could take olace; (2)
plans and preparations had been made which took advantage of time avail-
able; and in which (3) survival measures do not stop with the first deto-
nation, but continue during and after attack. A more complete discussion
of these points is contained in a report by William M. Brown1 and will not
be repeated here. This study of mines, caves, and tunnels is intended to
explore tentatively a potential source of shelter which may be more impor-
tant when these assumptions are made. In particular, these ,esources are
2 HI-507-RR
made more practical by population movement from expected target areas--a
passible pri-'ary protective measure against blast and thermal effects in
low-cost "zero-casualty" civil defense programs.
If high-quality blast shelters were not available and urban evacuation
was e-iployed, it is only reasonable to utilize the best available fallout
protection. In many possible contexts and locations, mines offer an attrac-
tive option. They have a PF which approaches infinity, thus insuring sur-
vival from radiation even in areas having extremely high radiation fields.
Also, mines offer scome blast and a high degree of thermal protection. These
qualities suggest that mines have advantages in predicted attacks that raise
the confidence for survival, and they have more effectiveness than non-city
baseeientsand NFSS shelters in unexpected attacks.
One of the .most ir-'portant advantages of space in mines, caves and tun-
nels is its low cost conpared to d:.veloped shelter. Many mines offer space
at about the cost of NFSS shelter in existing buildings. Few mines would
reeuirc expenditures equal to the cost of developed shelter. Thus, from
a cost standpoint alone, mines are attractive.
The cost and effectiveness of mines are significant in DOD procurement
rilarvin for diiaoe-lil'iting capability. Recent studies reported to the
Arrý-.d Services Committee have assumed about $5 billion for a fallout shel-
t2r program. For the same budget exten-ive use of mines would radically
change the characteristics and total effectiven~ess of an optimum datiage-
limiting program." For low to moderate procurement budgets ($1-3 billion
per annum) civil defense appears to have greater marginal utility than
*Some calculations bearing on this ma r are presented in a report
by William M. Brown. 2
HI-507-RR 3
more bomber defense or BMD. Mines could contribute to this favorable
cost/effectiveness estimate.
Another but possibly lesser advantage of mines as shelter is their
low dompstic and international visibility. The acquisition and develop-
ment of mines would probably be less noticeable to the public and to
allies and potential enemies.* Low visibility contributes to reduced
possibility of arousing domestic controversy and strategic responses.
This paper represents the results of a limited study of the shel-
ter potential in existing mines and the possibilities of developing new
space. The study examines some of the available data on mines and esti-
mates the current and the yearly increase of potential space in suitable
mines.
Some information is given on adapting mines for use as shelters, in-
cluding site and cost examples. Data on caves and tunnels is also included.
"*Less noticeable than, say, an urban blast shelter building programor the deployment of an ABH system.
4 HI-507-RR
GENERAL CHARACTER IST ICS
The mining industry consists basically of two types of operations.
The first is quarrying or open-pit mining and the second is tunneling.
We are primarily interested in the tunneling operations, although it is
possible that with proper incentives" some open-pit operations might pos-
sibly be converted to tunnel operations.
Mining is generally carried out in a single-ore vein. The operator
is interested in removing as much of the vein as possible and in doing it
as cheaply as possible. In mining high-priced ores** (gold, silver, platinum
etc.) the vein will be followed in any direction and the operation con-
tinued even if it is required to support the entire length of the exca-
vation.
Due to the interest in removing all of the vein, the operator will
shave any remaining supporting pillars and will usually excavate a com-
plete formation between two others representing the floor and the ceiling.
These residual pillars are often calculated as part of the value of the
diggings and their removal assumed when the main operation is completed.
Miners c-1l this "robbing the pillars." This often results (especially
in coal mines) in collapse of the ceiling or in severe instability of the
cavity.
With regard to such mines, it is known that the space which might be
available for use as underground installations is generally irregular in
chamber size, floor elevation and ceiling height. We can therefore conclude
that spaces resulting from mining high-priced ores may not be considered
"*Especially for limestone operations.
*AThe price is high enough to justify mining the entire vein, seam orbed, or even much adjacent country rock as well as in the case of rich gold
veins.
HI-507-RR 5
highly habitable and safe shelter space. This does not mean that the use
of such space is a last-order alternative.* For example, sone large lead
and zinc mines in Oklahoma and Kansas could possibly be uscd with little
loss of habitability compared to other mines and with little expense in
safety measures.
Generally, the more suitable space for shelter results from mining
low-priced ores such as limestone, halite (rocksalt) and gypsum which are
found sufficiently below the surface to require a tunneling operation for
remova I.
The operator of the low-grade ore mh'e has different interests from
the operator of the high-priced ore mine. He is interested in rapid ad-
vances and extracting large volumes of rock from a limited number of ac-
cess portals or shaft heads. He will therefore not be concerned with rob-
bing pillars but will be very interested in maintaining the structural
integrity of the space between the working faces and the exits.
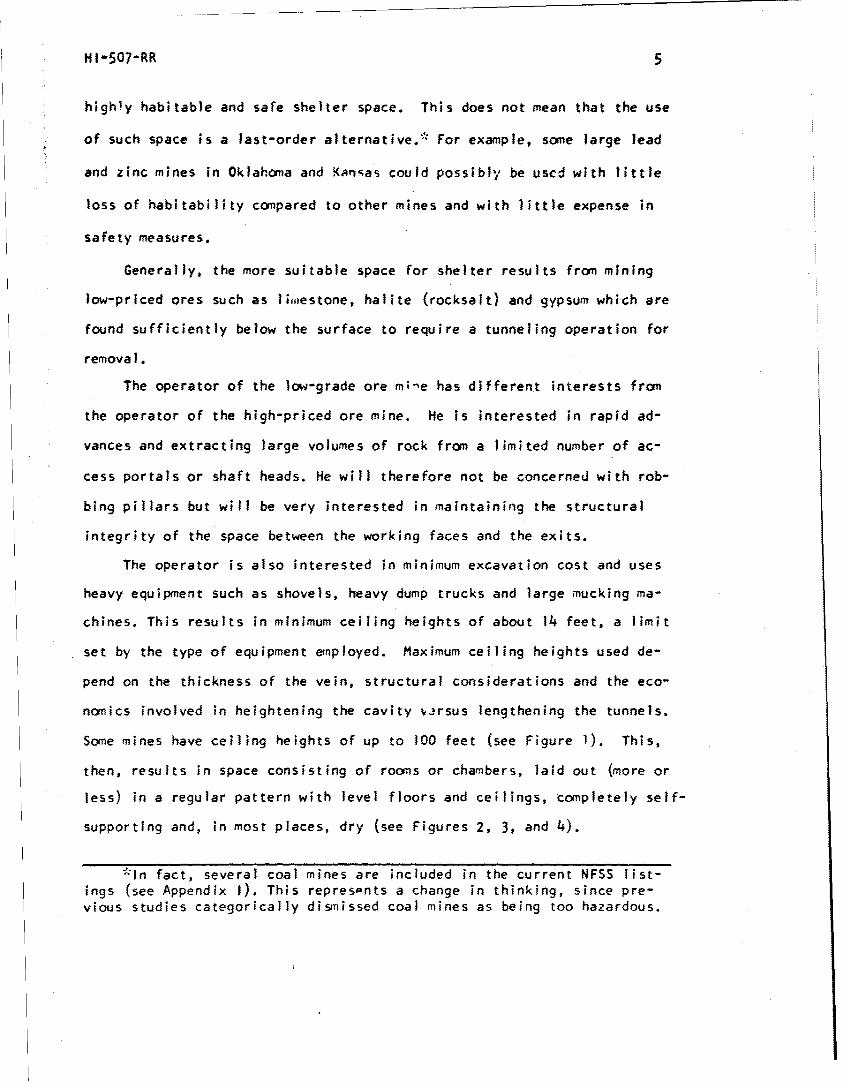
The operator is also interested in minimum excavation cost and uses
heavy equipment such as shovels, heavy dump trucks and large mucking ma-
chines. This results in minimum ceiling heights of about 14 feet, a limit
set by the type of equipment employed. Maximum ceiling heights used de-
pend on the thickness of the vein, structural considerations and the eco-
nomics involved in heightening the cavity v2rsus lengthening the tunnels.
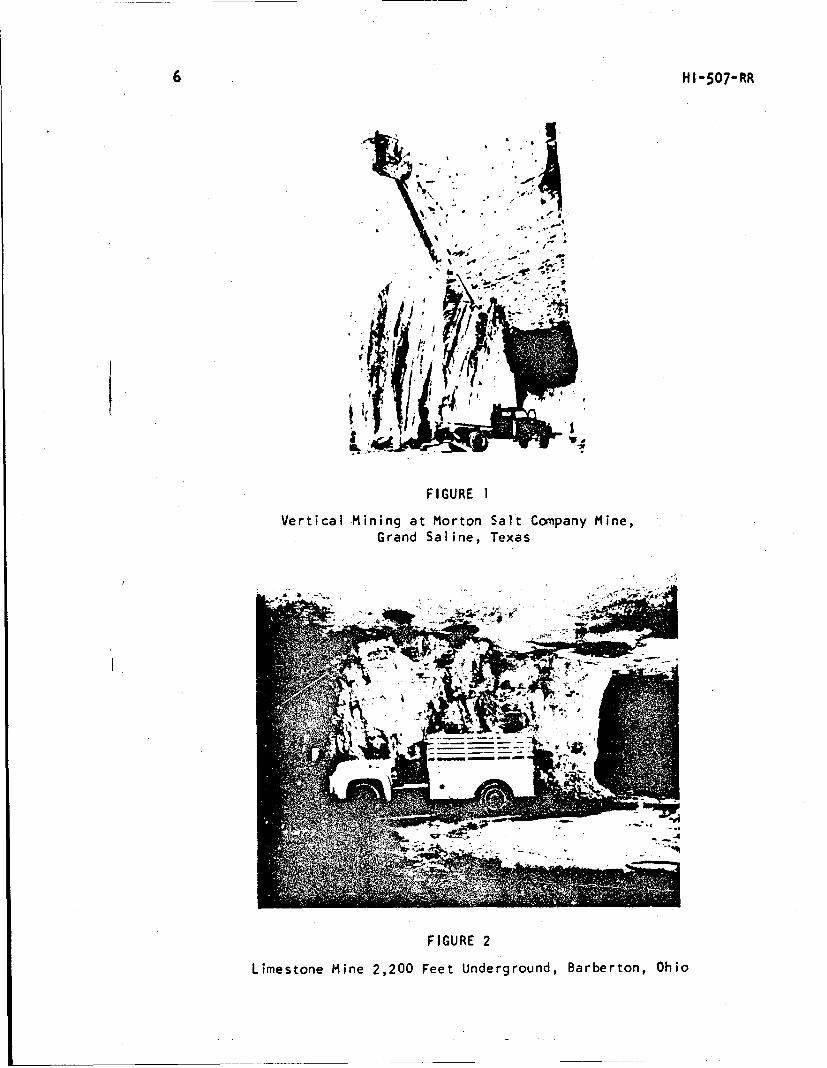
Some mines have ceiling heights of up to 100 feet (see Figure 1). This,
then, results in space consisting of rooms or chambers, laid out (more or
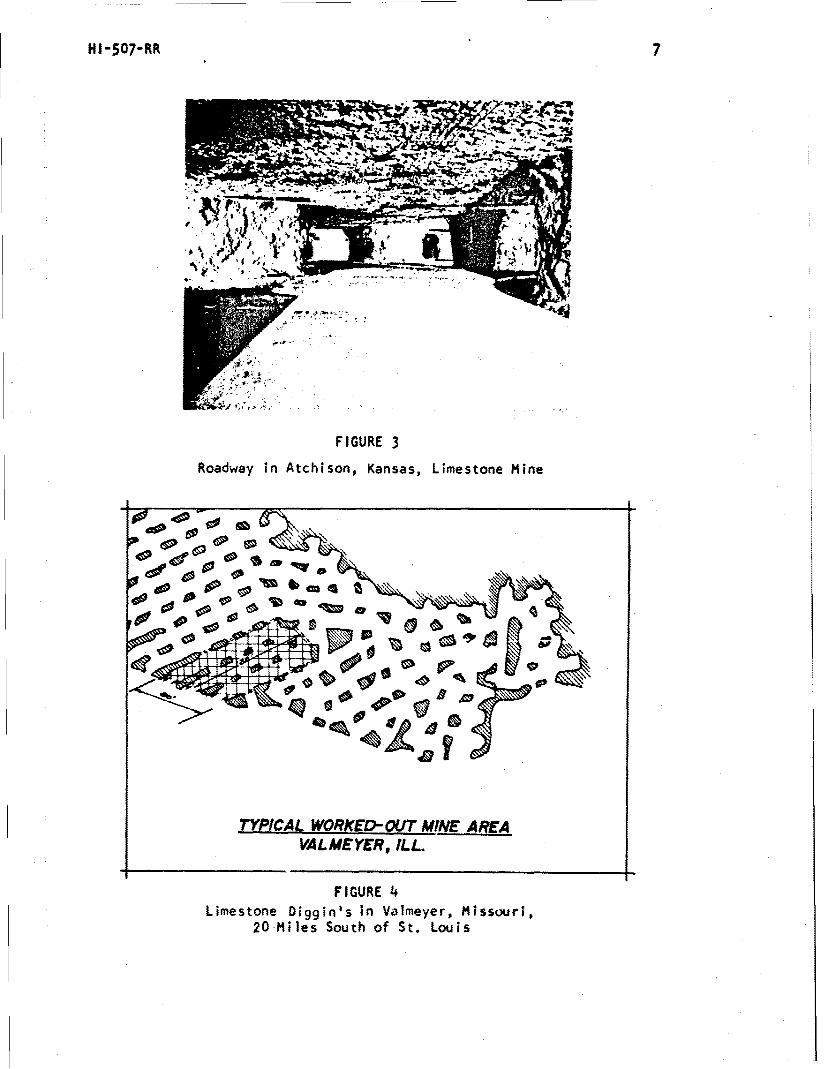
less) in a regular pattern with level floors and ceilings, completely self-
supporting and, in most places, dry (see Figures 2, 3, and 4).
*ln fact, several coal mines are included in the current NFSS list-ings (see Appendix 1). This represents a change in thinking, since pre-vious studies categorically dismissed coal mines as being too hazardous.
6 HI-507-RR
h4I
FIGURE 1
Vertical Mining at Morton Salt Company Mine,Grand Saline, Texas
FIGURE 2
Limestone Mine 2,200 Feet Underground, Barberton, Ohio
HI-507-RR 7
FIGURE 3
Roadway in Atchison, Kansas, Limestone Mine
40
TYPICAL. WORKED-OUT MINE AREAVALMEYER, ILL.
FIGURE 4Limestone Diggin's in Valmeyer, Missouri,
20-Miles South of St. Louis
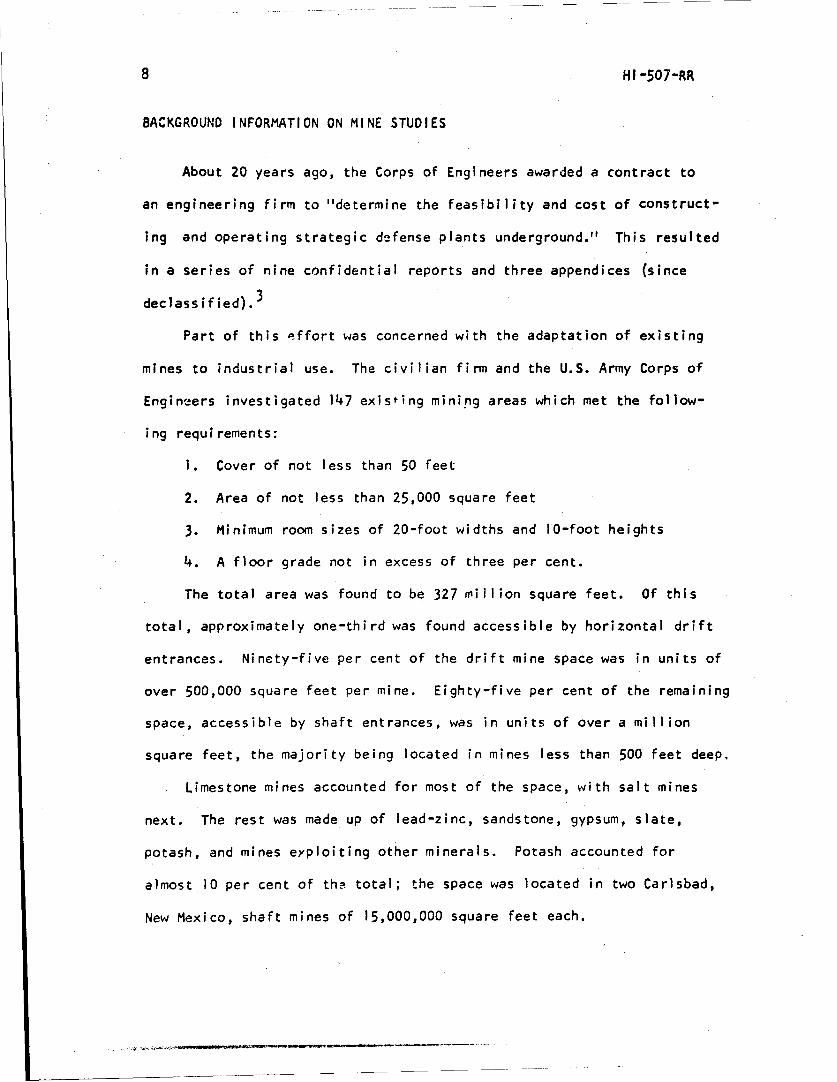
8 HI -507-RR
BACKGROUND INFORMATION ON MINE STUDIES
About 20 years ago, the Corps of Engineers awarded a contract to
an engineering firm to "determine the feasibility and cost of construct-
ing and operating strategic defense plants underground." This resulted
in a series of nine confidential reports and three appendices (since
declassified). 3
Part of this effort was concerned with the adaptation of existing
mines to industrial use. The civilian firm and the U.S. Army Corps of
Engineers investigated 147 existing mining areas which met the follow-
ing requirements:
1. Cover of not less than 50 feet
2. Area of not less than 25,000 square feet
3. Minimum room sizes of 20-foot widths and 10-foot heights
4. A floor grade not in excess of three per cent.
The total area was found to be 327 million square feet. Of this
total, approximately one-third was found accessible by horizontal drift
entrances. Ninety-five per cent of the drift mine space was in units of
over 500,000 square feet per mine. Eighty-five per cent of the remaining
space, accessible by shaft entrances, was in units of over a million
square feet, the majority being located in mines less than 500 feet deep,
Limestone mines accounted for most of the space, with salt mines
next. The rest was made up of lead-zinc, sandstone, gypsum, slate,
potash, and mines exploiting other minerals. Potash accounted for
almost 10 per cent of th! total; the space was located in two Carlsbad,
New Mexico, shaft mines of 15,000,000 square feet each.
HI -507-RR 9
Discounting the New Mexico sites and other "disproportionate"
sites,* states with large amounts of space distributed in many mines
included Pnnsylvania, Missouri, New York, Kansas, and Illinois.
This, then, comprised the basic data for estimating existing under-
ground space. Around 1952, an attempt was made to update the original
information. The results of the updating (along with some of the orig-
inal data) were prepared in unclassified form by the Office of the Chief
of Engineers.4 This document contains a composite listing of some 310
mines totaling about 470 million square feet of space. The updating
procedures, as will be discussed later, are somewhat hazy and misleading
and the final listing contains some significant errors.
The last known updating of this information was done in 1957 and is
contained in a study prepared first for the RAND Corporation5 and then
for the Federal Civil Defense Administration. It attempted not only to
estimate the increase in suitable space but also to use and adapt the
original 1948 information for civil defense (shelter) purposes.
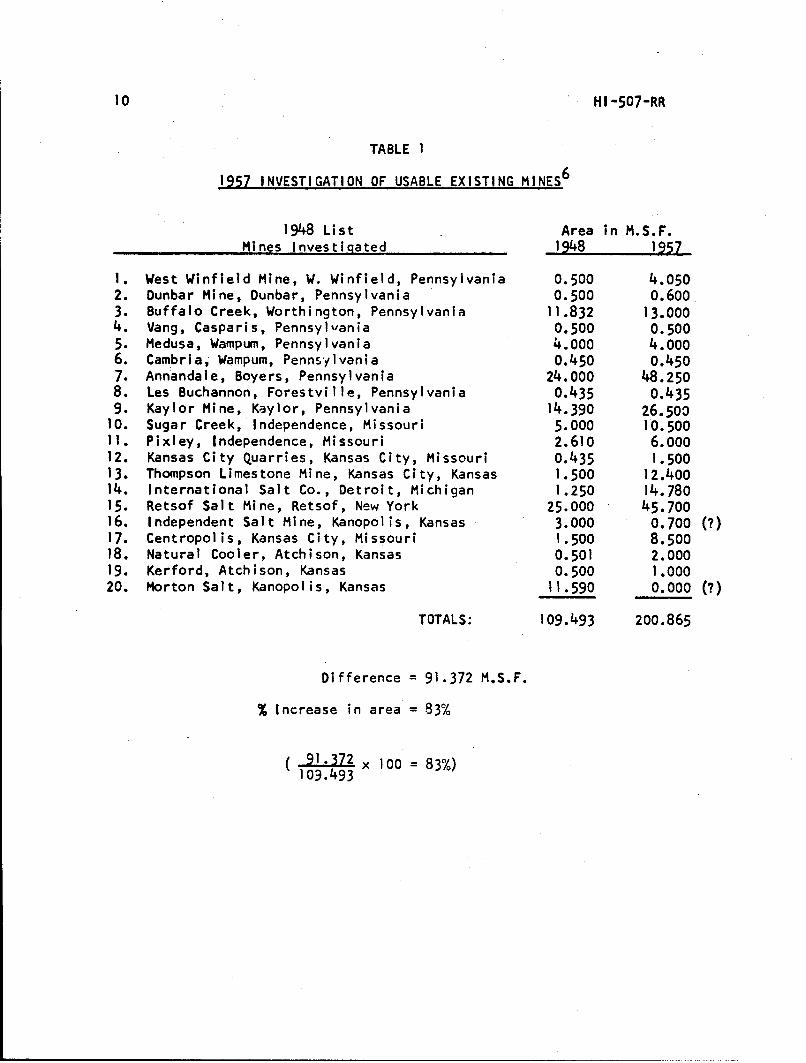
This effort, insofar as estimating existing mine space was con-
cerned, was very limited. The updating procedure consisted basically of
telephone spot-checks of 20 mines listed in the original data** and ap-
plying the apparent percentage increase on a nation-wide basis. In
addition, some new mines were identified in 1957 and Included In the
listings. The 20 mines comprising about one-third of the total original
area of 327 million square feet are listed in Table I. The percentage in-
crease was determined as shown and applied to the 1948 listings.
*55 million square feet of lead-zinc space around Picher, Oklahoma.
"-'The data published in 1948 (Ref. 3), not the Corps data as publishedin 1956 (Ref. 4).
10 HI-507-RR
TABLE I
1957 INVESTIGATION OF USABLE EXISTING MINES 6
1948 List Area in M.S.F.Mines Investigated 1948 1957
1. West Winfield Mine, W. Winfield, Pennsylvania 0.500 4.0502. Dunbar Mine, Dunbar, Pennsylvania 0.500 0.6003. Buffalo Creek, Worthington, Pennsylvania 11.832 13.0004. Vang, Casparis, Pennsylvania 0.500 0.5005. Medusa, Wampum, Pennsylvania 4.000 4.0006. Cambria, Wampum, Pennsylvania 0.450 0.4507. Annandale, Boyers, Pennsylvania 24.000 48.2508. Les Buchannon, Forestville, Pennsylvania 0.435 0.4359. Kaylor Mine, Kaylor, Pennsylvania 14.390 26.500
10. Sugar Creek, Independence, Missouri 5.000 10.500H1. Pixley, Independence, Missouri 2.610 6.00012. Kansas City Quarries, Kansas City, Missouri 0.435 1.50013. Thompson Limestone Mine, Kansas City, Kansas 1.500 12.40014. International Salt Co., Detroit, Michigan 1.250 14.78015. Retsof Salt Mine, Retsof, New York 25.000 45.70016. Independent Salt Mine, Kanopolis, Kansas 3.000 0.700 (?)17. Centropolis, Kansas City, Missouri 1.500 8.50018. Natural Cooler, Atchison, Kansas 0.501 2.00019. Kerford, Atchison, Kansas 0.500 1.00020. Morton Salt, Kanopolis, Kansas 11.590 0.000 (?)
TOTALS: 109.493 200.865
Difference = 91.372 M.S.F.
% Increase in area = 83%
( 91.372 x 100 = 83%)103.493
HI -507-RR Il
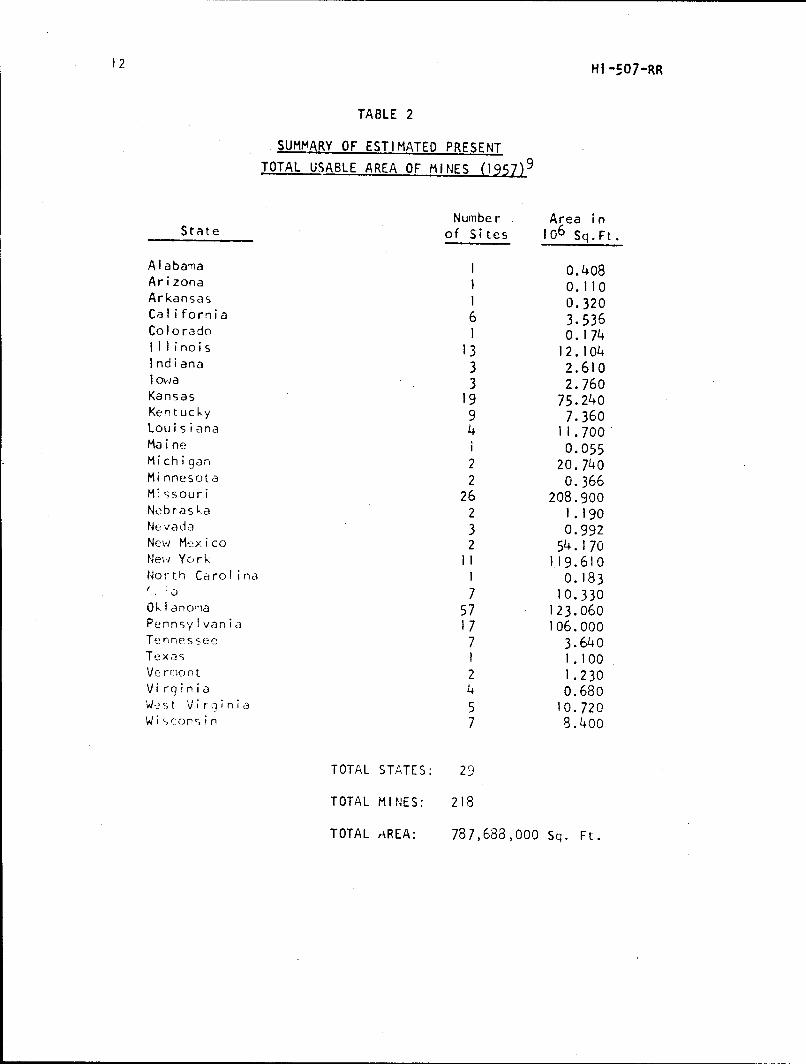
Now, although this should have resulted in an estimate of about
600 million square feet, the published estimate was more than 750 million
square feet (Table 2). The difference presumably represented the addi-
tional space found during the study. In checking the data, our investi-
gation indicated that an additional 150 million square feet of limestone
and lead-zinc space was located in Missouri and about 20 million square
feet of additional lead-zinc space in Oklahoma. We have not been able
to corroborate these estimates.
Qualification to the Data
For several years this background information has been considered
"best-source" research information by the Office of Civil Defense and
some of its contractors. Specific estimates of available shelter in
mines have been made using this data, particularly in the 1961 Technical
Operations report entitled, "Shelter from Fallout." 7 This report used
the original Corps data directly and concluded that under some condi-
tions (mines close to people, drift entries, proper habitability pro-
visions, etc.)...
... 2,000,000 to 4,000,000 people of the continentalUnited States might realistically take advantage ofthe theoretical 47,000,000.. shelter spaces in mines ....
Because such estimates are made, we are inclined to comment on the valid-
ity of the source information.
First, the original 1948, 1952 Corps compilation of mine space was
never intended to be taken as a comprehensive list of available underground
*From 470,000,000 square feet at 10 square feet per space.
12 HI -507-RR
TABLE 2
SUMMARY OF ESTIMATED PRESENT
TOTAL USABLE AREA OF MINES (1957)9
Number Area inState of Sites 106 Sq.Ft.
Alabama 1 0.408Arizona 1 0.110Arkansas I 0.320California 6 3.536Colorado 1 0.174Illinois 13 12.104Indiana 3 2.610Iowa 3 2.760Kansas 19 75.240Kentucky 9 7.360Louisiana 4 11.700Maine i 0.055Michigan 2 20.740Minnesota 2 0.366M• ssouri 26 208.900Nebraska 2 ).190Nevada 3 0.992New Mexi co 2 54.170New York I1 119.610North Carolina I 0.183n., o 7 10.330Okl anoma 57 123.060Pennsy Ivan i a 17 106.000Tennessee 7 3.640Texas 1 1.100Vermont 2 1.230Virginia 4 0.680West Virginia 5 10.720Wi scors in 7 8.400
TOTAL STATES: 29
TOTAL MINES: 218
TOTAL AREA: 787,688,000 Sq. Ft.
HI -507-RR 13
space. It was only supposed to be "taken as indicativw of the types
of mines existing for possible utilization by industry." That means
the investigators were interested only in big areas--near railroads,
in industrial area complexes, and deep (i.e., 50 feet--very deep for
fallout protection). '_ess than 10 per cent of the sites were under
75,000 square feet (bg shelter).
The 1948 study had these particular caveats:
The sites listed do not include all existing mines, butonly those which appear reasona ty adaptable in case ofemergency. Many mines were eliminated as being small,dangerous or otherwise impractical to adapt to industrialuse. No coal mines are included, due to dangerous natureof their roofs, the low headroom, and the extreme gas andwater conditions. 10
So far as the usefulness of the data for our purposes is concerned,
these caveats have interesting implications. The first statement seems
to convey the feeling that all underground space was located and that
the list was trimmed to fit the application. The second sentence implies
that these were investigated (or at least the plans or descriptions pre-
used) to eliminate sites which did not me~t the criteria. The third is
obvious. For industrial use, most coal mines would not be attractive.
Although attempts were made to cover the country in the 1948 study,
it was not possible to gather all of the mine data. The study was very
selective. It concentrated on industrial areas only, using data as it was
readily available through large mineral producers or through those state
geological departments which were able to make such information available.
Only 28 states were noted as having suitable space.
14 HI -507-RR
In our limited investigations, we were not able to determine the
extent of the 1948 survey nor to obtain an estimate of the number or
total space failing to meet the industrial criteria used in the study.
Presumably, since current criteria for adequate fallout shelter space
is less stringent, more than 327 million square feet of usable mine
space existed in 1948. In addition, we do not categorically exclude all
space in coal mines. Although many sites may not be usable for industrial
or shelter use (due to gas hazards, instability, low headrooms, etc.), a
significant number of shelter spaces may be considered usable at selected
sites or in the portals of others. (NFSS shelter location efforts have
included many coal mines.)
A second set of comments concerns the data published in 1956 con-
taining the list of 310 mines totaling some 470 million square feet. In
spot-checking the list, we found some errors. Some are significant, some
are not. Among these are the following:
I. The New Mexico listing shows three potash mines at Carlsbad,
each at about 14 million square feet. Two of these mines (one
under the name "Union" and the other under the name "Union
International Corp.") are the same mine. This changes the
apparent total New Mexico space from 43,600,000 square feet
to 28,000,000 square feet.
2. The Pennsylvania listing shows a 24,500,000 square foot lime-
stone mine under the name "West Pennsylvania Cement Company,
West Winfield." A check of the area failed to verify the
existence of this facility.
HI -507-RR 15
3. The Detroit, Michigan, listing shows two salt mines, one under
the heading "Detroit Salt Mine" having 7,405,000 square feet and
the other listed as "International Salt Company" having 1,250,000
square feet. These are the same mine.
Other listings which appeared in this data but not in the 1948 re-
port also appear suspect. However, we were not able to uncover other
significant errors. These examples are given as a caution to those using
such information in estimating shelter potential in mines.
In conclusion, we suggest Lhat the mine information needs "gathering"
and updating. Mine space potential is a dynamic parameter. Total space
is changing. It is the sum of the area increases in working mines and the
potential in new diggings. The characteristics of mines as shelters have
not been studied closely. This too requires additional effort to make
sound developments of civil defense plans.

16 HI-507-RR
CURRENT ESTIMATES OF MINE SPACE POTENTIAL
In this section we will make some estimates concerning the current
potential space and possible increases. These estimates are made without
benefit of any survey work or extensive sampling.* The information used
came from the following sources:
1. Existing Corps of Engineer data
2. National Limestone Institute
3. Some large producers (i.e., International Salt, National Gypsum)
4. Some independent operators
5. NFSS data as of June, 1964.
Salt Mines
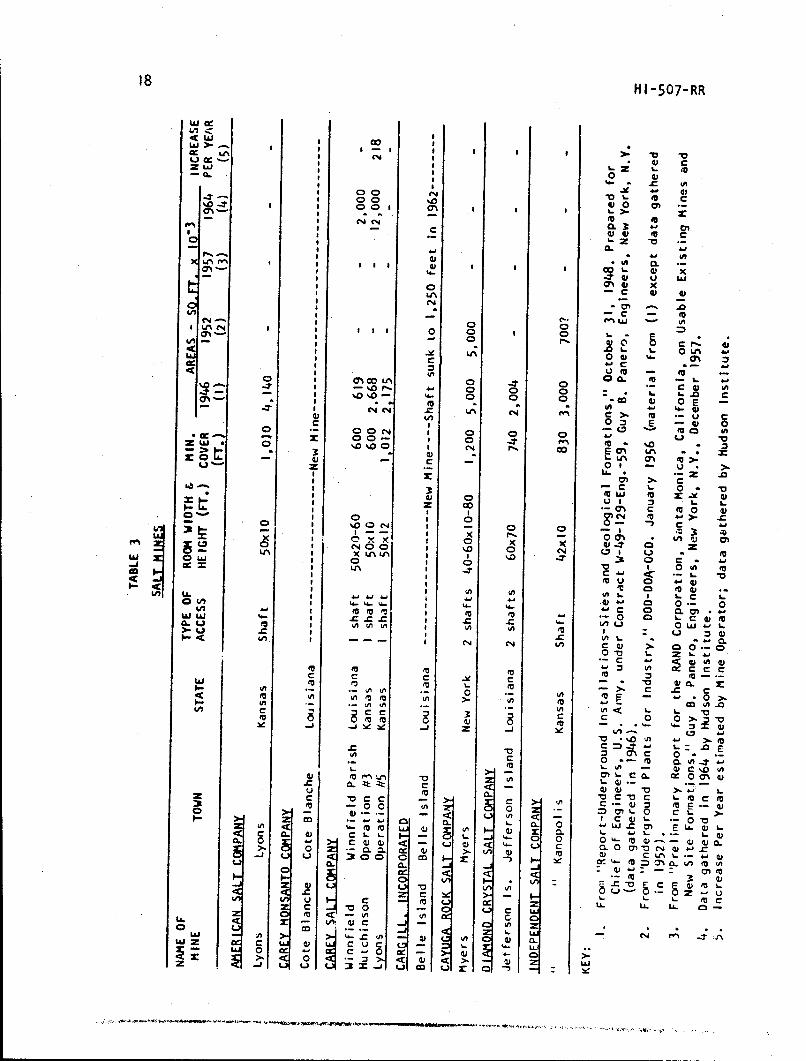
A summary of information obtained on salt mine space is shown in
Table 3. This is a fairly comprehensive listing of existing mines, al-
though much of the data on area is lacking. Using a sample of mines in
existence in 1946 and the data gathered by Hudson Institute in 1964, the
over-all space has apparently increased by a factor of about 3.5. Assum-
ing all salt mines increased by the same factor, one would judge the exist-
ing space to be around 300 million square feet.
However, because it is possible that some of the mines not included
in the sample may have ceased operations, or did not increase at the same
rate, this figure might be high. Using only the 1961 data and rocksalt
production figures,!1 we estioiate the potential to be not less than 200
million square feet.
-We did not contact official agencies (i.e., Bureau of Mines, stategeologists, etc.) outside of the Office of Civil Defense, and did not sys-tematically contact mine operators. Such detailed work is beyond the scopeof this report.

HI-507-RR 17
Rocksalt production is now about 8 million tons per year and over a
ten-year period showed a rate increase of about one-third million tons per
year. All of this production comes from the deep mines. Solid halite
weighs about 1.8 tons per cubic yard. The expected increase in mine vol-
ume is then:
8 x 106 = 4.4 x 10⁶ cubic yards or1.8
120 x 106 cubic feet
Most of this space has a ceiling height between 10 and 20 feet. Assuming
an over-all average of 15 feet, the annual increase in area would be about
8 million square feet. This seems about right, judging from information
supplied by large producers.
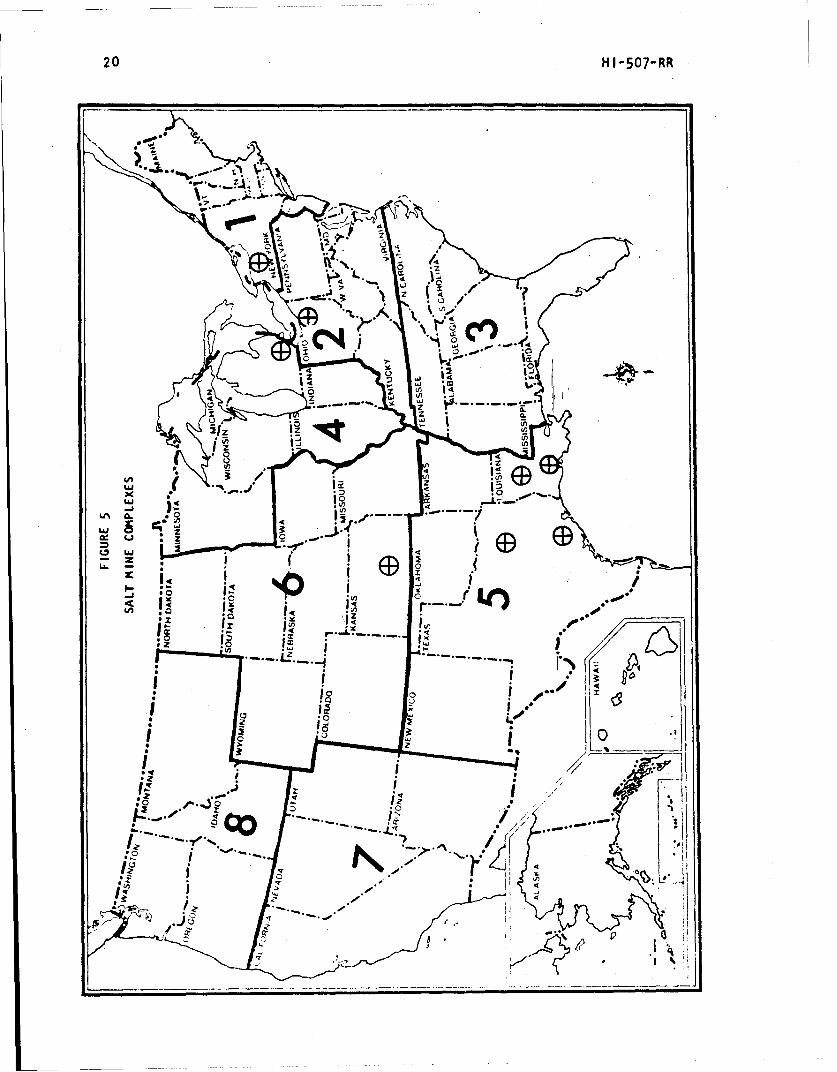
The distribution of salt complexes is shown in Figure 5. All of the
space is deep underground (600-1,200 feet) and has very limited shaft ac-
cess. The Retsof, New York, complex encompasses about 2,700 acres of salt
vein and is perhaps the largest salt mine in the world. 1 2 Locations of
other large mines include Detroit, Cleveland, Hutchinson (near Wichita)
and central and southern Louisiana.
The excavated areas are typically flat, regular in shape, and would
require very minor trimming and cleanup to permit installation of shelter
facilities. The mines are very dry. Ambient temperature Is between 500
and 600 F.
Although much of this space is available and convertible to use as
shelter, performance problems arise in terms of distribution with respect
to the population, access rates and habitability (especially ventilation).
In these respects salt mines are less suitable than, say, the multiple-
drift entry limestone mines.
18 HI-507-RR
LU
La. L a* 6 4- 4AE
m .M
CD a 0 EU0 QNE 6. a% 0.
6)4 *E 0
- to
.0 L
-Vd- LA 00
0I 0A -) IC -L / ) - . O L t o OL. LIý .M m ~ 06) 4- 0
IN C4 z4 LA W
I E C.2 EU 0- .
4 ~ ~ ~ C r. co~ - 0 0 .-0 I - U4
6-~~~~U 4 I(.( C L Ne . >U z-
0~~ ~~~~ O 0 NI 0 -DLz w .~~~~= 0 v.s O I ( E ' L
VC 1. 0 #
Il m m fu0 C CL 6vi0 0 (A LA 0 0 - 'u3 '
-~~C a -- a ((r. - 0 sU( N O 0~ ~~~ I 3 0- . I Li -
I~~ 0 0 . O ) (UI LAI 4C4- * ~ CL X~
EUU 0 ,6&A ., uac L En UL . L-
U)~ 4- 1 E E' I ' U4 0 0 L 6 E
4jL LA Ed¶ 0I--c~. -i c N ( d a 0 -
0 C .- 4) 6E6C 0 0 -2C- - 0 ).>- En * E m- 0l% *-0
Ln CL EnUE En c- E U-m- mn a) 0--E *- *- En C" L 6 4 En.
to CaC C 0 L-
an CO 0-- E 0.EiL) CO. aN 00'a V) m
6) ~ ~ ~ L 'V' A~EnL ).
c C1 -06 0 L4- LL.L
Z C2 -C C- C - 6 1 E U . a
I-~~~~~~ *- c0z. - 0. 0 L .)
0. 0 >a < - j a)w'0 ~ ~ ~ ~ ~ C L-)0 :r) > l )EU a L L - a

HI -507-RR 19
WE
cc L 00 # ,f- .f 0 i ccc 0 Cc
-t 0 0'. I.,
$L a
OA 0 0 %a ,
ON 0.
VN mO 0 * CmetD 00 0 .0 cC4 a- - m .o -ai
cc c o I c oI aet
-z 1 4
N~ N- -- -- #4 I V
Vaft- 00 0 0001 .- c
ZW - COCO 0 1 0- 4 a 1- aM
0o& -a-ax I 4, cO
vi I I Ig-4
# 4v - 'DO# C -C4 ~ rq ft2 4 C n . 4 0
a~ N: 0%&-.i4
CA. O 0e0 0 0f ELV
III# 1;~. vfK ' t CW3 O01 00 A :z mvW9 40 # A
.4~4 1 'L
C~~ IA 404 4 44 gC;a r"4
£1 > vi *aI C> N N N N I. NN A 1 n -
-'~~ C~44 4
c ýr x >~ CC * L4-AI- 0)lu00- '-v I *"- KPU
of .2LLj Kj Ce 0 .rzzz~~~ao V-~- 4,4-az
L. "oo 4, CL 0 voc c 0=CL
0, t-c 0t. 01 0-a 0)L. C4, L. >i E)e 0 uI ID
>C 'a. a2 a c c'U vi !e 4,4- L4~
20 H I-507-RR
-f z
* Ix I-
ui
LL. f .7 ~
.40,
,4-
_____ 'v4-
HI-507-RR 21
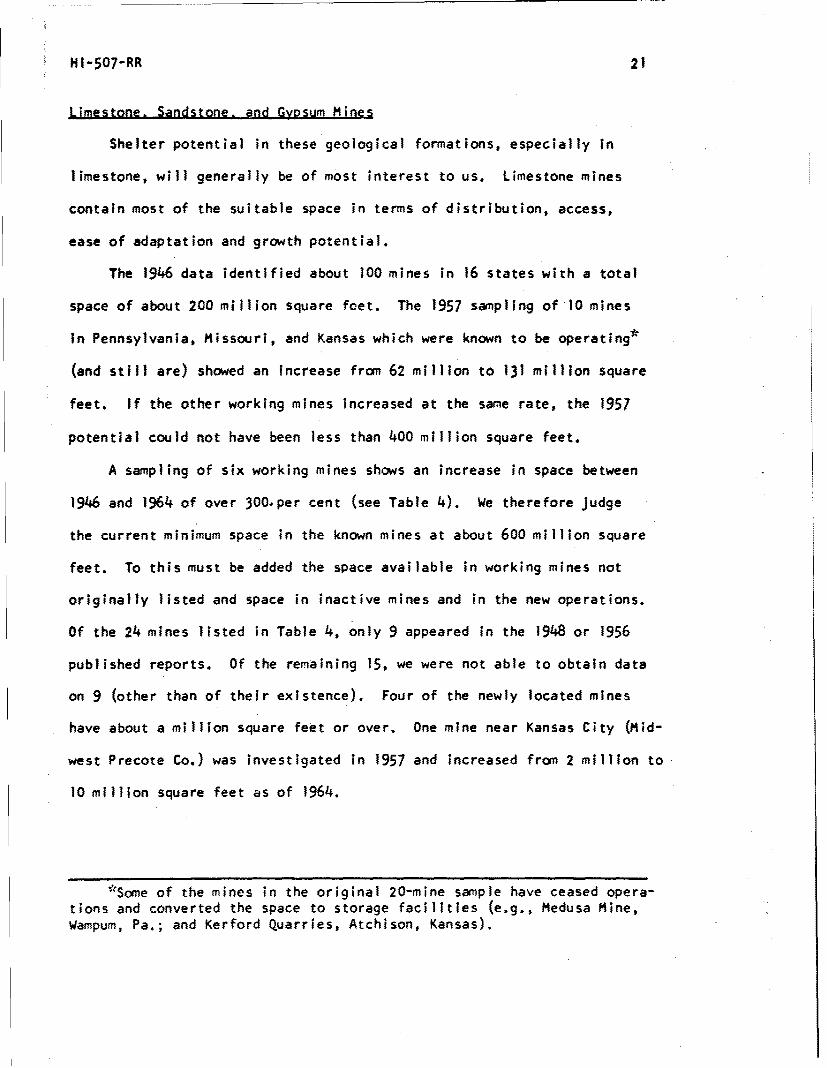
Limestone. Sandstone. and Gypsum Mines
Shelter potential in these geological formations, especially In
limestone, will generally be of most interest to us. Limestone mines
contain most of the suitable space in terms of distribution, access,
ease of adaptation and growth potential.
The 1946 data identified about 100 mines in 16 states with a total
space of about 200 million square feet. The 1957 sampling of 10 mines
in Pennsylvania, Missouri, and Kansas which were known to be operating*
(and still are) showed an increase from 62 million to 131 million square
feet. If the other working mines increased at the same rate, the 1957
potential could not have been less than 400 million square feet.
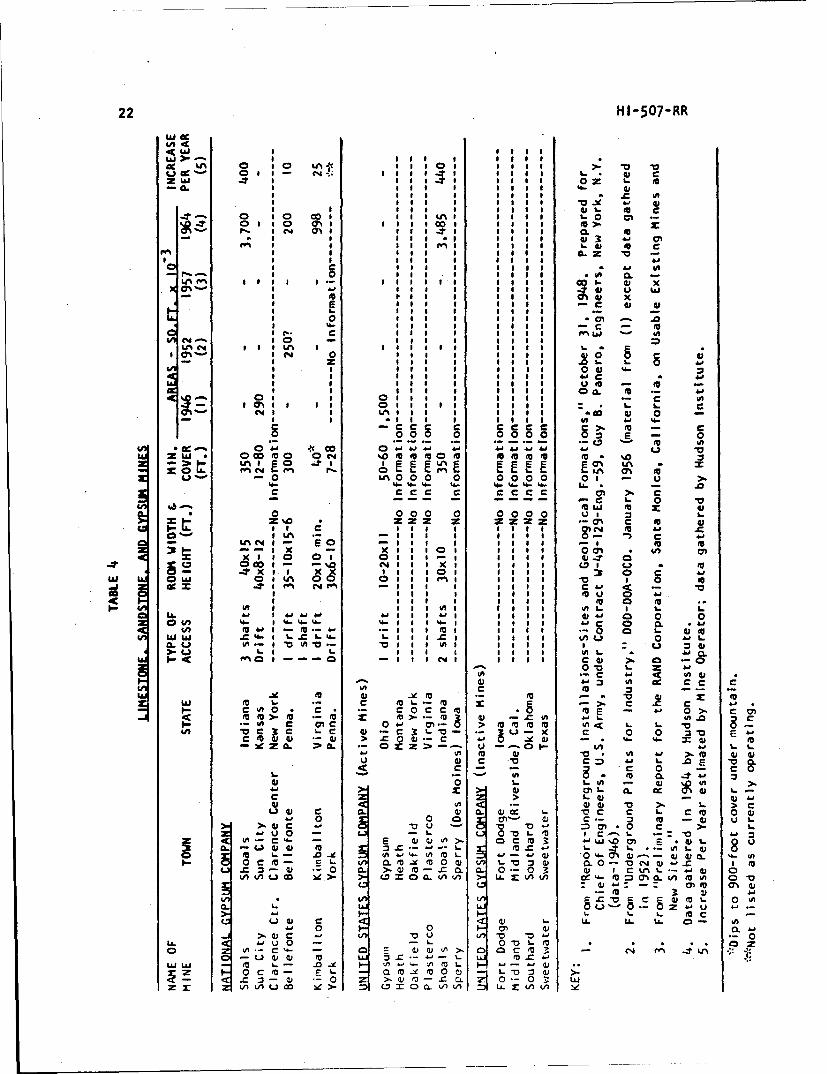
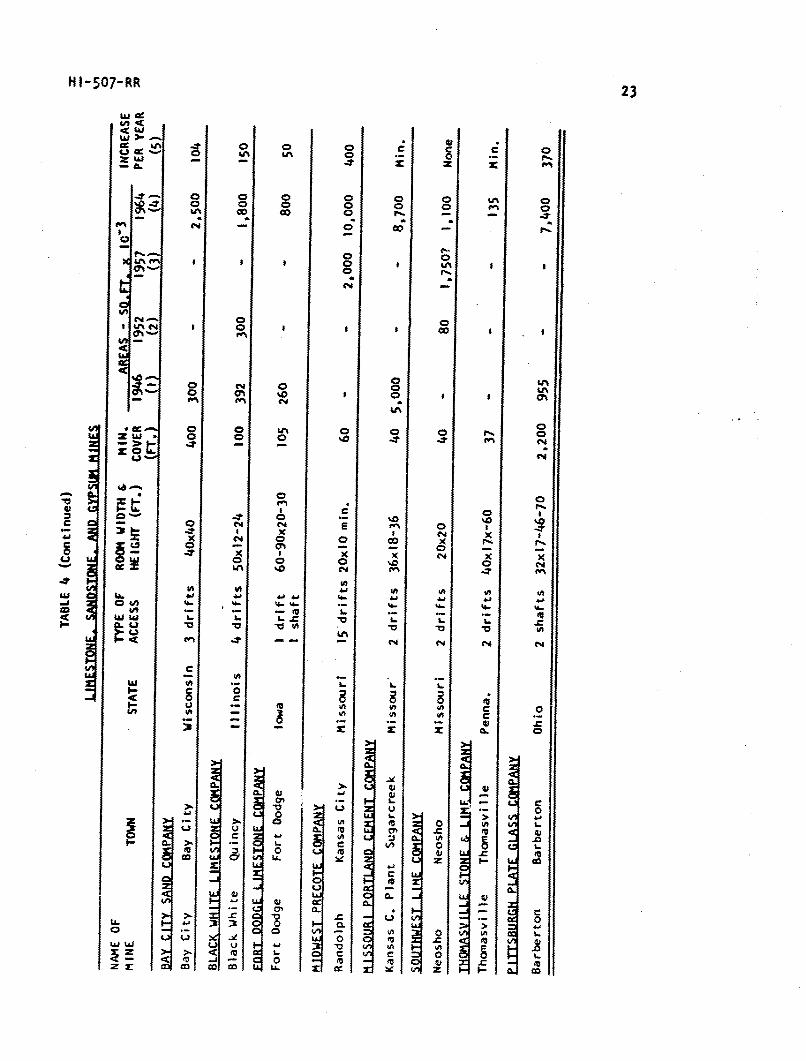
A sampling of six working mines shows an increase in space between
1946 and 1964 of over 300.per cent (see Table 4). We therefore judge
the current minimum space in the known mines at about 600 million square
feet. To this must be added the space available in working mines not
originally listed and space in inactive mines and in the new operations.
Of the 24 mines listed in Table 4, only 9 appeared in the 1948 or 1956
published reports. Of the remaining 15, we were not able to obtain data
on 9 (other than of their existence). Four of the newly located mines
have about a million square feet or over. One mine near Kansas City (Mid-
west Precote Co.) was investigated in 1957 and increased from 2 million to
10 million square feet as of 1964.
"*Some of the mines in the original 20-mine sample have ceased opera-
tions and converted the space to storage facilities (e.g., Medusa Mine,Wampum, Pa.; and Kerford Quarries, Atchison, Kansas).
22 HI-507-RR
w cctA 4<Wag LAtj cc 0 LC,41 S.
Lu 0f
151 0 1 1 1 # 0 S. m
1 L. 0 m1 0 CO I L" C% co m :I-
CLLI z M
LA ONto u wV x
CP
V C4 C)61% C4 u's I I I I I I I I I L.
1 C4 0 0
u m
o'C4 1 LA f t I
c c c0.2.2- .- 2 - 0to m viOr u2; w 0 c m 0 6 WCM %0 m m m m m m m 4 m %0
6m p 0 -r E E E E E U-%C%4 E m 1!. 0, E E E IN E I- ChU 0 LA 0 0 0 0 0 0 0 0 0 u4- 4- 4- 4- 44.. m- 4. LA.
c c c c c Im- C 0
0 0 0 00 0 0 0 0 0 u
z z z z z c mm
10 01 1 1 1. cm toT -x 0", t7l7g C6 2 2 m52 1 C'4 1. 1.w T x x 41uj 0 a I I M 0 mag m C4 f" cm
L16 4a 4.0 *j 162 1. 11 V Ai 0 0 0cm 4- 0 4.4-14. 0 1 1 4- 1 1 1 1 1 41 C 0 a(A 4.0
w w 4- 1. Ica 1. 1. 1. 1. t0i o' lo- IT
CL
IA cW 4A cc c c
wc IA c 0 c c m m E 0 c Im
IAc cri c 0 m mc C 4) c 3 IL-71 ý31 X c 04) 0 > 0 0349 Z CL :P. CL z
u w c L. in E 87dc 0 -Z
x 4) CL>
V >W 4) 0) CL 4) at 'V c c c m 0 w4, 0 0 0 CP- a .- 3 -c u -0 :3 a)U 0 0.0 eo 0 a 1. - = 10 ýp 3
C) c 3 uCL ao) 1-0 8m C -1ýj 41 4) 0 4- a% w
0 c 'v - E 0. m m 0 4) L. m 0 0 - "0 C,4 0) x I toX I z; (1) 0 CL >- 4) ;L- -C Cl CL 0 0 3 to C Lm %- *j 4) 04A %n w C5 x 0 CA tA LL. tA t/) cc , = m CL (0 0 0
4) m ON w
0 Aj
IOL- z u
u 4) c IA. LL. c-
0 hiu kn '0 -Z) &j 0
U. u 00 C4 A U;
-06 cc) ý4) -,a LLJ ui (0 j;L&J ui a L- z m ., 41 m L- I.- - -
0 c eo r- %- t: CL. m -ýe eo 0 a) - L- 10 :3 w-C n - V .:ý 0 = >1 1) eo - z (1 7, 0.- 0 3 LLIv) fA u co le >- ZD, 0 = C> 0- v) U- r V) tA ýt
HI-507-RR 23
< ta
j :0 -t v
WN - N 00
CC
C4.0o 0
o(M 00%
au a
C4 -
0 0SIA 1U 00 a a0or -x W '
o I&4 1n. 14
*~* e it0 04
t^ 0
> - L0 0=- 41t 3t 0 L.
0 j w ~ 00 to C 0C~ - N mr
C3 10 K I Nr o
24 HI-507-RR
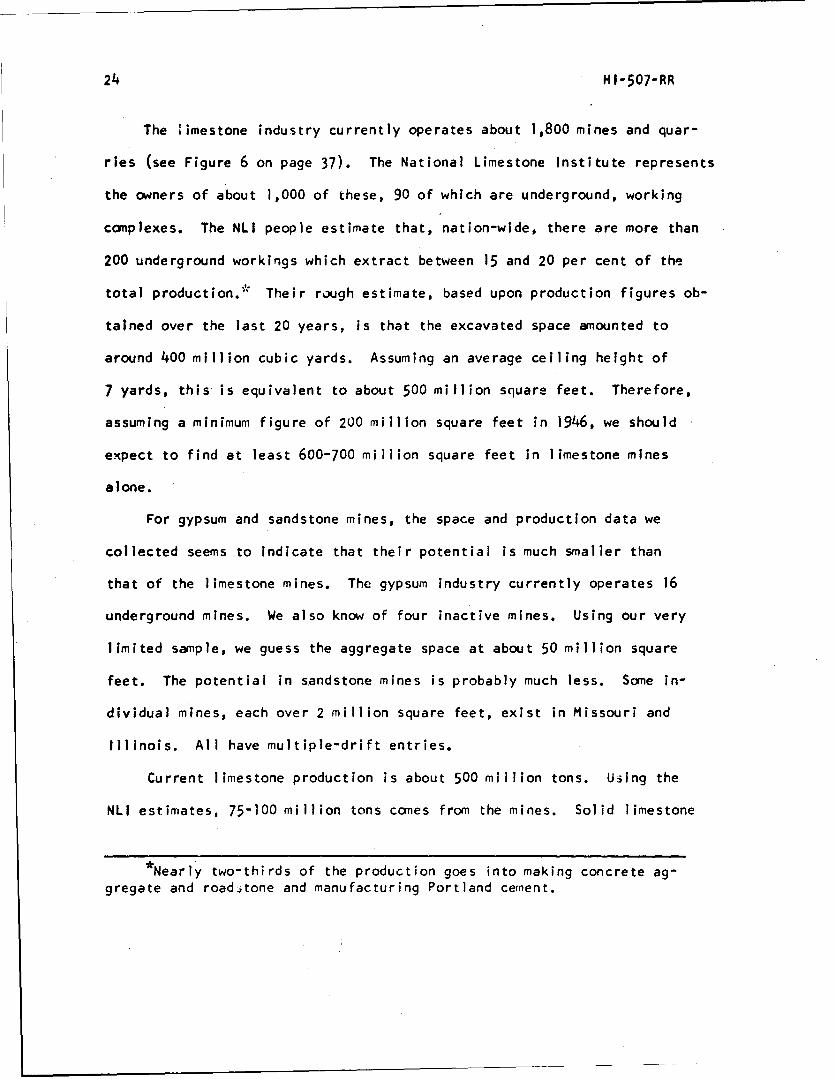
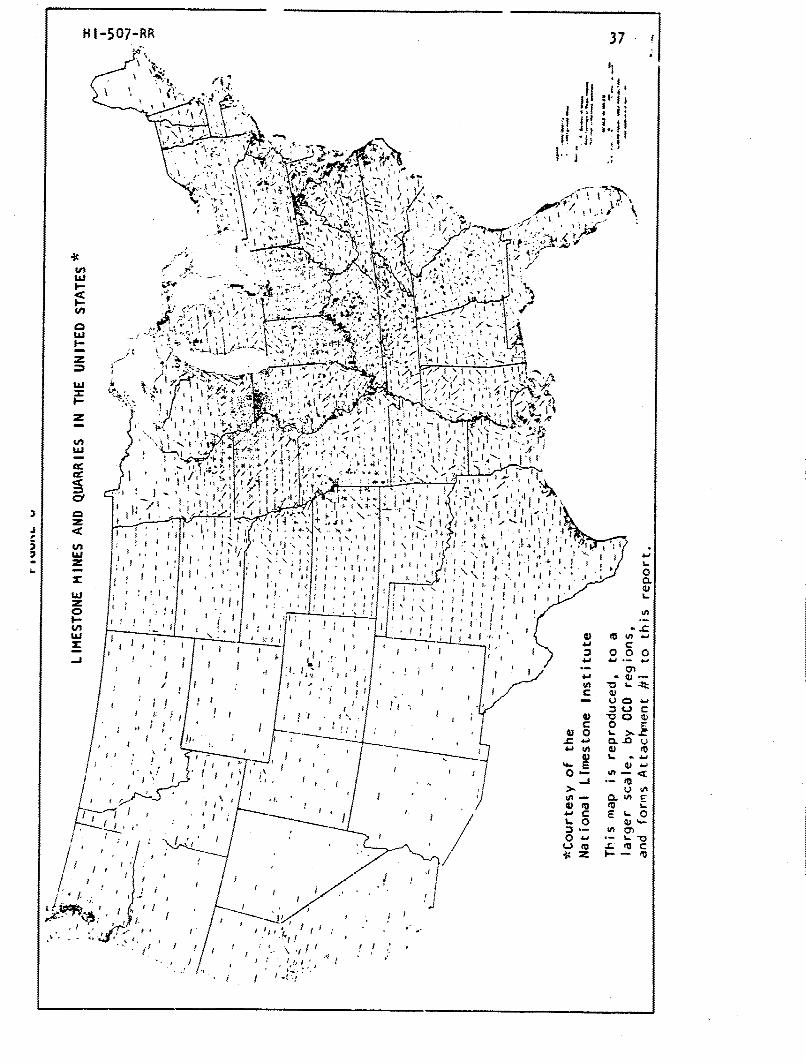
The limestone industry currently operates about 1,800 mines and quar-
ries (see Figure 6 on page 37). The National Limestone Institute represents
the owners of about 1,000 of these, 90 of which are underground, working
complexes. The NLI people estimate that, nation-wide, there are more than
200 underground workings which extract between 15 and 20 per cent of the
total production.* Their rough estimate, based upon production figures ob-
tained over the last 20 years, is that the excavated space amounted to
around 400 million cubic yards. Assuming an average ceiling height of
7 yards, this is equivalent to about 500 million square feet. Therefore,
assuming a minimum figure of 200 million square feet in 1946, we should
expect to find at least 600-700 million square feet in limestone mines
alone.
For gypsum and sandstone mines, the space and production data we
collected seems to indicate that their potential is much smaller than
that of the limestone mines. The gypsum industry currently operates 16
underground mines. We also know of four inactive mines. Using our very
limited sample, we guess the aggregate space at about 50 million square
feet. The potential in sandstone mines is probably much less. Some in-
dividual mines, each over 2 million square feet, exist in Missouri and
Illinois. All have multiple-drift entries.
Current limestone production is about 500 million tons. Using the
NLI estimates, 75-100 million tons comes from the mines. Solid limestone
Nearly two-thirds of the production goes into making concrete ag-gregate and roaditone and manufacturing Portland cement.
H I-507-RR 25
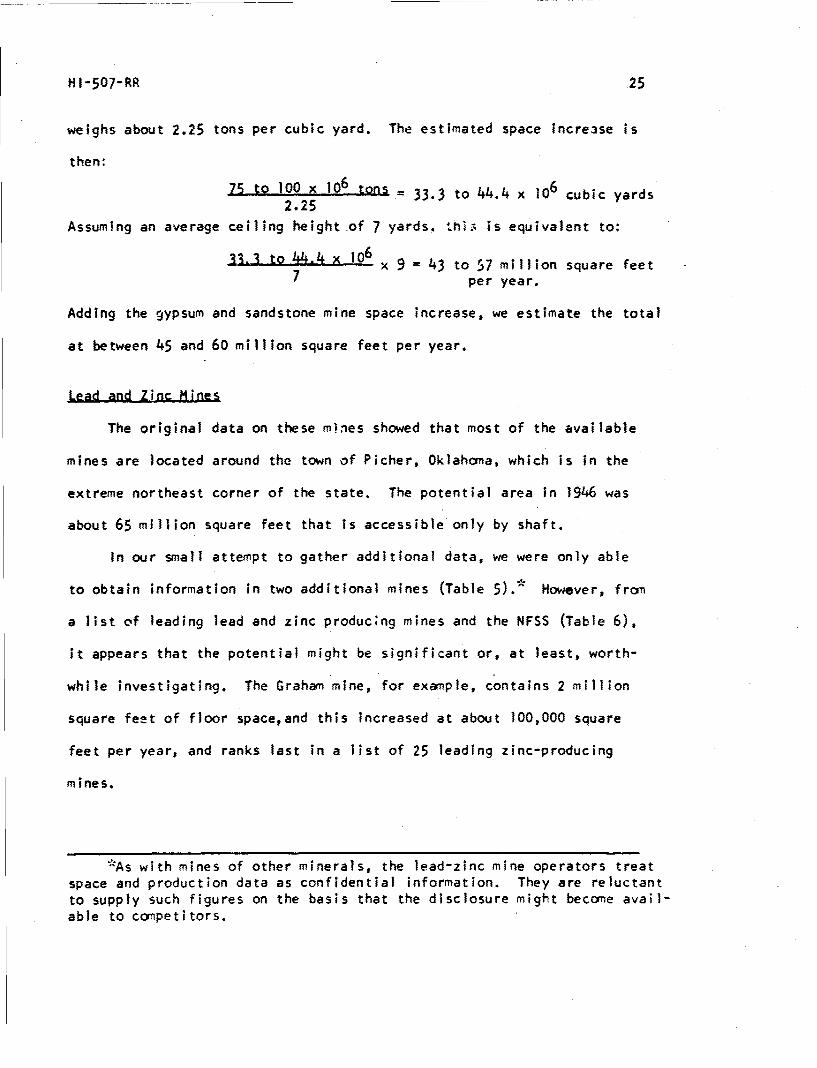
weighs about 2.25 tons per cubic yard. The estimated space increase is
then:
75 to 100 x i06 tons = 33.3 to 44.4 x 10⁶ cubic yards2.25
Assuming an average ceiling height of 7 yards. tlhis is equivalent to:
13ý to 44.4 X 106 x 9 = 43 to 57 million square feet7 per year.
Adding the gypsum and sandstone mine space increase, we estimate the total
at between 45 and 60 million square feet per year.
Lead and Zinc Mines
The original data on these mines showed that most of the available
mines are located around the town of Picher, Oklahoma, which is in the
extreme northeast corner of the state. The potential area in 1946 was
about 65 million square feet that is accessible only by shaft.
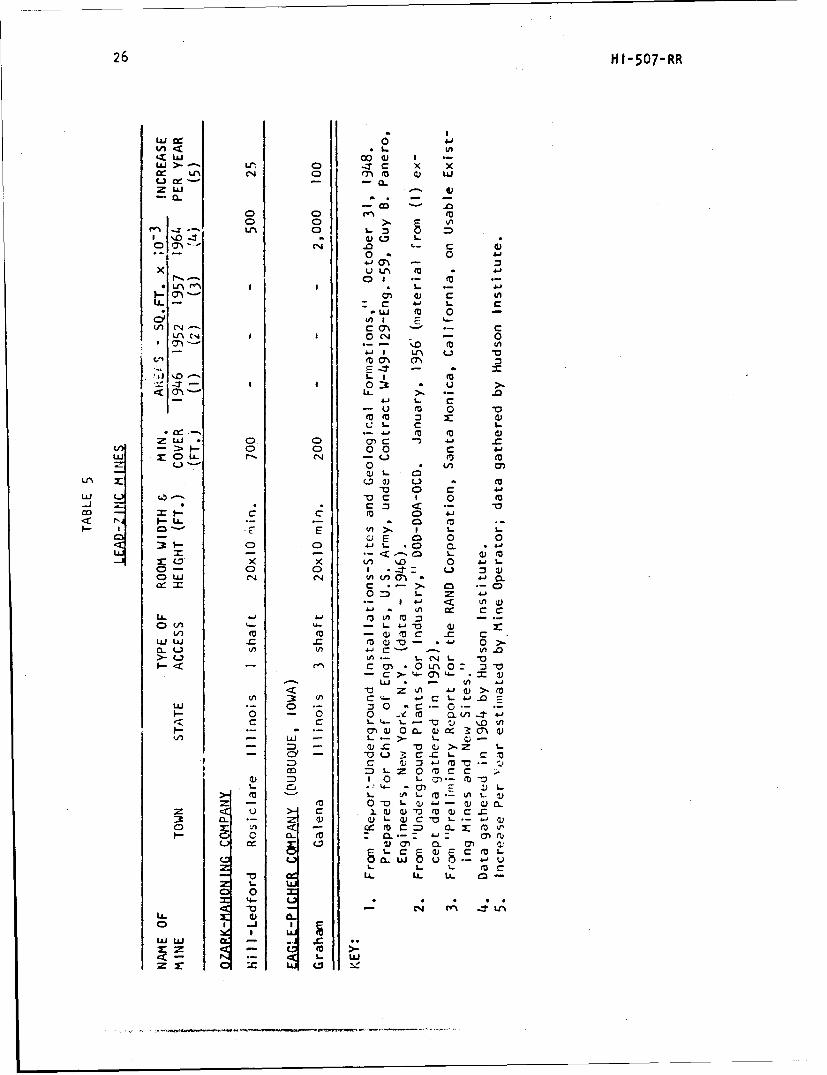
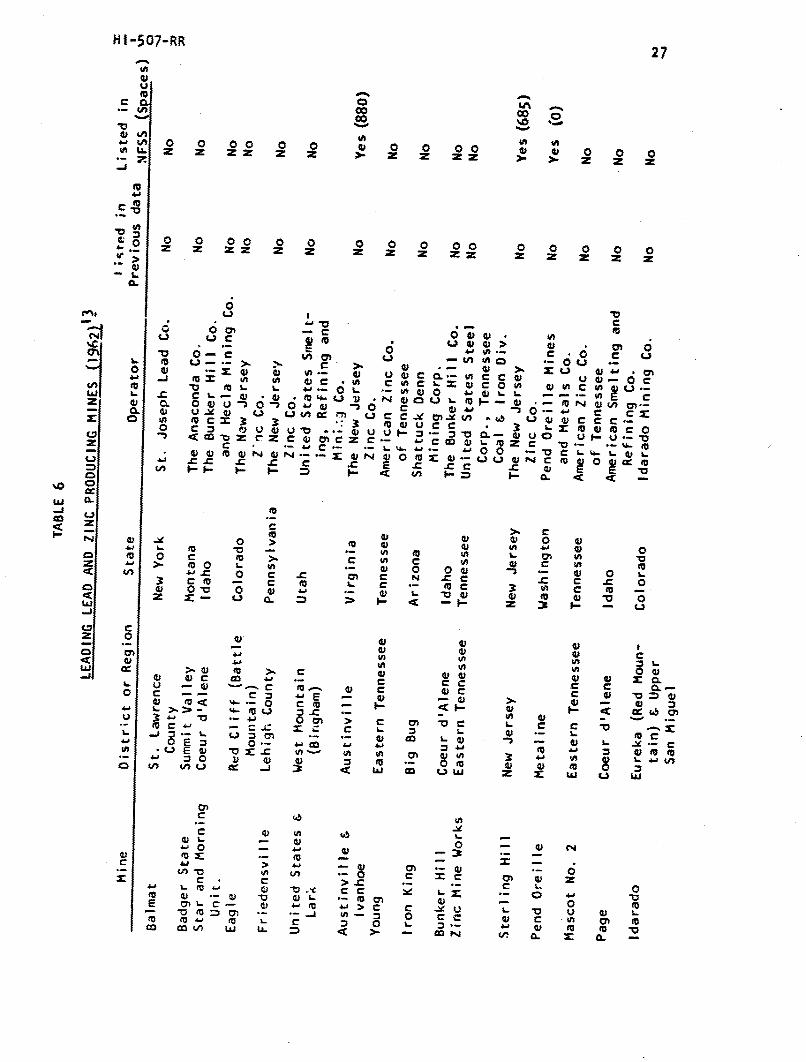
In our small attempt to gather additional data, we were only able
to obtain information in two additional mines (Table 5).* However, from
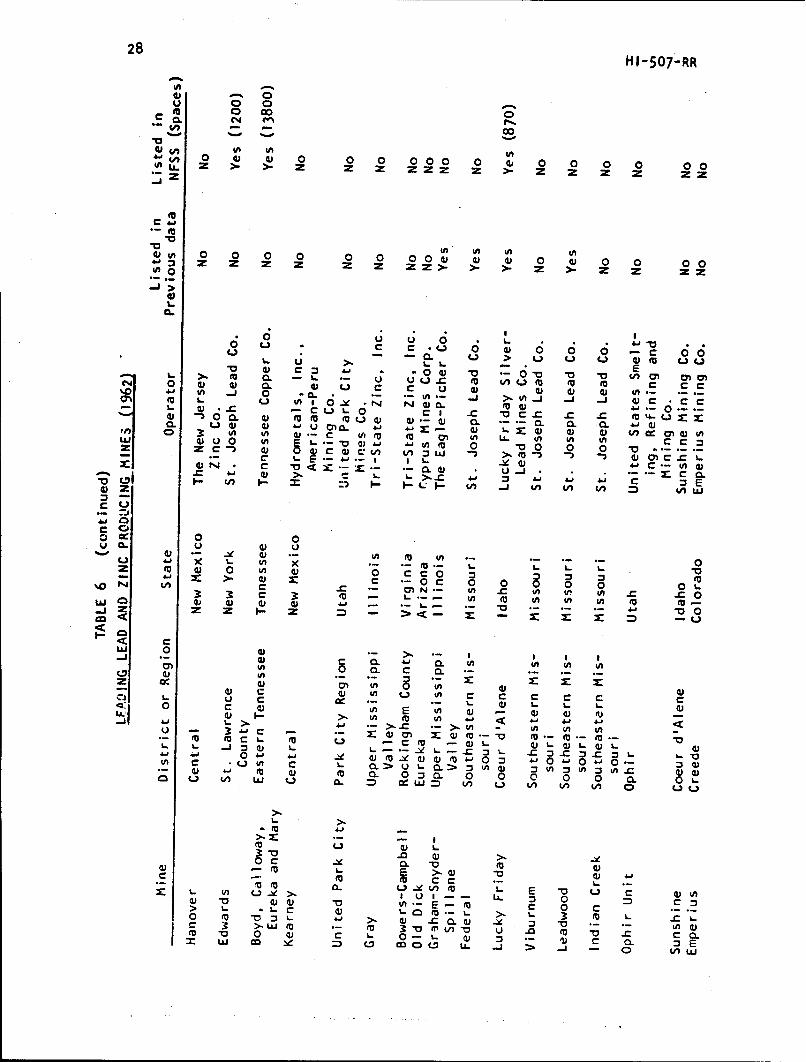
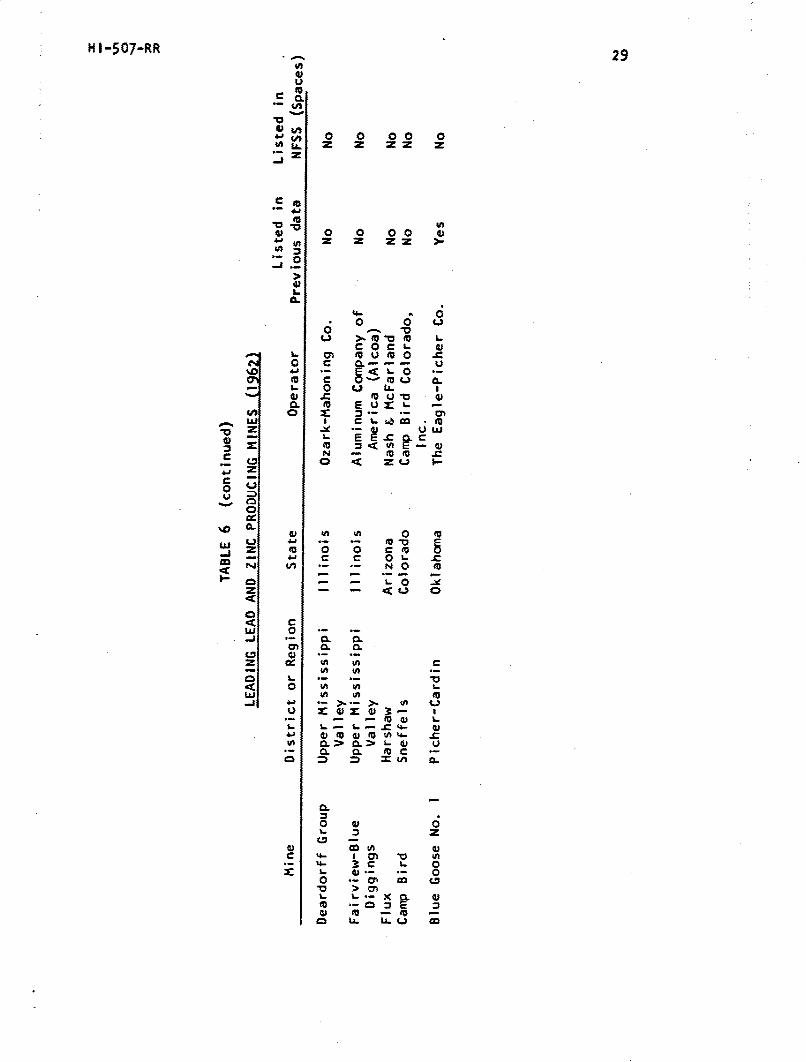
a list of leading lead and zinc producing mines and the NFSS (Table 6),
it appears that the potential might be significant or, at least, worth-
while investigating. The Graham mine, for example, contains 2 million
square feet of floor space,and this increased at about 100,000 square
feet per year, and ranks last in a list of 25 leading zinc-producing
mines.
"*As with mines of other minerals, the lead-zinc mine operators treatspace and production data as confidential information. They are reluctantto supply such figures on the basis that the disclosure might become avail-able to competitors.
26 HI-507-RR
u~ CC a.
o~ 0
12 M~ 0) W
oL m 0
Ln -4 0 C
LL -C L -' cA1.J m 0 a)
I.AC 0 U- Oe'. C - 0'0 0 C')
E-4 -3
LL. (n 0
QLLE n 0 0 O) ~ 4.
0 C) t - 0 C. . 4<) L. 01
X. C.3 Xt0 0 CC4
~C I 0- < )0
LA. -3 -C0 C3 (0 0
(o c -C0LA
0- c 0) 0 U"%- 0~
C0 :2 - 0 *
Ln ~ ~ D-' Ul C'-
La. 0- .- z 0
(0 (0 0C( C .
WLAJA .C >C t l- L4-' >
=).(.) *C Q- zI) .
M e ZU) 7.J)>(
0o *- 00 C*-
0. -n 0- 0u t.AI I.- 4 )C -0 LL - v 41 ) af)i"
::- a. .- 1) L- c -0 L-.C) W1 - Ix-m- Ia. 1: 0 -
u CC- w C -a) . .C
LL La L) C L CL
0(
U- 0 .40
L.0 0. L CzC rO
HI -507-RR 27
V 00 0a@ nVI U. z VIz
= 1/0 0 0 0 0 0 02 0 0 0 02 0 0 0 0V0t 1 r z Zr z z z' z Zr 3- z' 2 z>1
0c45w
0j w
1- -.v w 0 0C.----C Mc -c 0'D0 - VIMU t t ýUsi Wo 0 @# - . *j 0)iv ~ ~ 4'VI- m '0 Vcn- n ub t C U-Vw 0-C 10 U V1VI m-~ w-o- 0 V--. S CD - -0 u1- * - @2 10 - Xu U I.- v 0@2 =-@ @2 wI' 4j U@2c - CatovImCCV 0.. C .- S-VI@20 .51 - ,a
2~ C -C c-~' -14-5 M50 *V L.L1
0 )f'0 0 ) i4
UwU0 vv 41 @ 0 @>- 1- 0 V w *- V 0. ~VO 0 0 C 0 3- CC cIC V 2 C V 0iv O45 0' 00 1- VI
020 0 2 -, - 4< zf . CL . ) C N .C C C .
-j
2 j 0 @2 *)@O) 0) 4 1
0I I 2@2 OC C M5 - C CCC
0 J C - t- f Ch 0E C- 41 @2 t- @2 Z41 o < 0-0 CEO -1 A- Ci1 @2 -45 X-- > 4 - C~ uC ' -V @U~ 345 VD m~0) 3 C 1
oC In >n~ -J3 C W0ia 2
4D) .- - @2 0 @,aQ -=5 41 -3 o- -30 coM *- ' - -0 -WtCoV LJ L pq 0.0 0~'-- 0 -
28 HI -507-RR
m 0 000 00
"~0 U )0 0 0 0 00 0 U) 0 0 0 0 0 0zn Z - Z Z Z Z Z z >- Z z Z z zz
U 0 0 0 0 0 0 00U ) U 0 U) 0 0 0 04J~ zz z z z z zz. >- -z. z
0-
C -U 0 U) 0 0 0 -C 0U - -0. U > U) u U ) U'0 0) c~ 3 J * -U 0 0-0o Eou~ o ~m aU 0. L. 'a (^. (M CAUE a)((. U ) 0. U) u C c 0 z -0) > 0 (U) Ud) U) on.-'.h m- un 1 0 - Y- *-1. .- >I. 1 .. )11 L. 0) *.u -CU 0 C I ..C m a X .C X . 4C4I ) n 00. U) m m m (UUU W)-U 0. *--0 CL Q. 4l(U)0. UU ) U 0) CL 4- 1 a-Z- U) 4~) 0) 0) V) cc a) U m0 U) 00 In ViM m (1 L Izi ) 0C IA L.-a 4 -) "( 0 0 o0o(D 9f~ ?-,)C m ,DL >%U -) n, n D c c Lc). L- C O - .- I * -. U _.g a)~Z 0. 1 0) >- . >. . 4J 4.1 4.1 C1- n I ~ I- I-L- ( ..J $ L I (A u (AUZ
C0w0 0
00.~ 4 ) U). )I E n *
z (U U) 0 I U)0 c O c 0U- - x >- ) .- 0 - c 0 0 0 0 0 OL.'.o 4 CA c C rnN- IA WC In #A n C 03 3 C m ( - L-.-. #A (U IA vi IA MU (-U)J U) w ) U) - L. .- 4-.0
Wi 0 I I)-I U)c 0. 0. (Al 0n 0n(n ( 0 (a. C 0. *
Z U)o cc 01 0n 4)U) C ) In U 0n C C c C cCu U Ccc L- U) L. &L I-Cj jL .4 U) >I r E -In U) I U) V) ii)In 4 cX (U In X - .. _m mc L - c *->I - n s- W n L-WcLU -=41. -34 'C -- -U0 =UE - r- = -C == - t
o m -)C w~ 0. -m U)(-W)40 m 4.610 j0 4-10.- UUn C: *Uu CLa 0. U 0>~I 0 = U)U) 0-(D 4. cU U) a- 0. 0 3 c 0 0 0 0 CL 0~-(i U IA Lai U 0 LLJZ L) CL m cU IA) (n 0) V)
I- a
OC - 0. -0 U)C-~ (U >-C (D *- q.10.1 C u. U-ýe tn L- E -0 u C nL) a..I In U.->
0 ~ ~ La. mU)) aiU I -E~( C 0 C(a> 11 . L. U) LOE.j -.. a.. 3 UC >-LJ( *- (U m 3oi'tn U .0 (D c . C0.m D 0 4) C L- 0-I 0) :3 ) a 0.E
H 1 -507-RR 29
bLL.
V i
4) L-a~ 0 0 0
emm
41 0 S 0 4
Utz
C- -) 0
* 0 0 (
00 -g-
O ~ ~ t 0100
o CL a- -
0 0 ( A
41 .C > >1-V ina u EUS-L
N .- . tuu0~ ~ m 24.1 1-
0
0S a. -
"- e C L .c
In2L CLL.) cc
30 HI-507-RR
In summary, we estimate the current minimum mine shelter potential
as one billion square feet in salt, limestone, gypsum and sandstone mines
alone. It is felt, over all, that this figure is on the low side because:
I. The basic data used for estimating purposes was primarily con-
cerned with space adpptable to industrial use and was never considered
to represent the total availlable mine area in the country.
2. We have not included estimates of space available in high-priced
ore mines or in iron mines.
3. Coal mine space is not included. Over the years, shelter re-
searchers have eliminated such space from consideration because using
coal mines was considered impractical due to "robbing the pillars" which
leads to unstable excavations or collapse, frequent presence of natural
gas and uneven dimensions. Presumably, this is an overcautious viewpoint
to take. Over 100 coal mines are identified in the NFS3, totaling at
least 370,000 spaces;* 270,000 in Kentucky alone (10 per cent of the
population of that state and one-third of the total spaces identified).
One mine near Evanston, Kentucky, is stocked for 45,000 spaces.
Our estimate of the minimum yearly increase in potential mine space
is between 55 and 70 million square feet not including high-priced ore or
coal mine space. This is the "normal" potential of the mining industry
and could be much greater given proper incentives.
*Our NFSS information does not distinguish mine space according to
the type of material extracted. This is the toial of spaces in mines spe-cifically identified as coal mines (e.g., XYZ Coal Co., Acme Collieries,etc.).
HIi-507-RR 31
NATIONAL FALLOUT SHELTER SURVEY
A detailed listing of mines and spaces located including stocking
information is given in Appendix I. This date, complete as of June 1964,
is an excellent source of information for those interested in undertaking
more detailed studies of mine space potential.
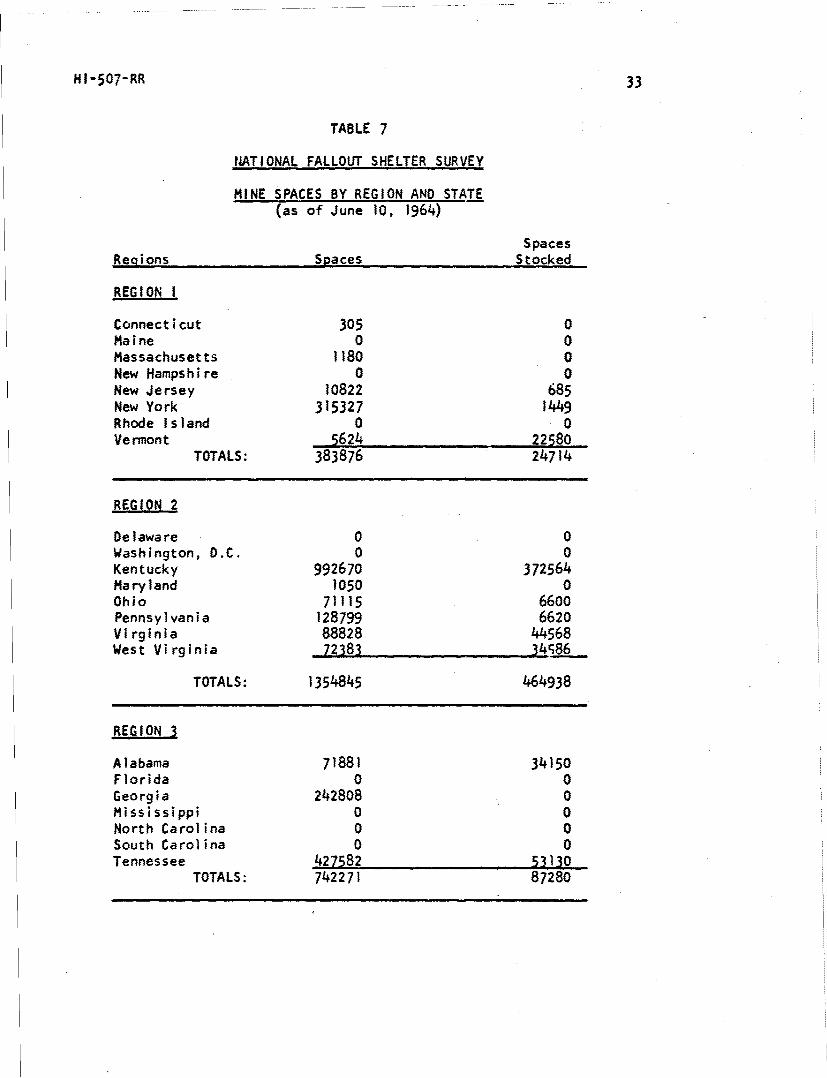
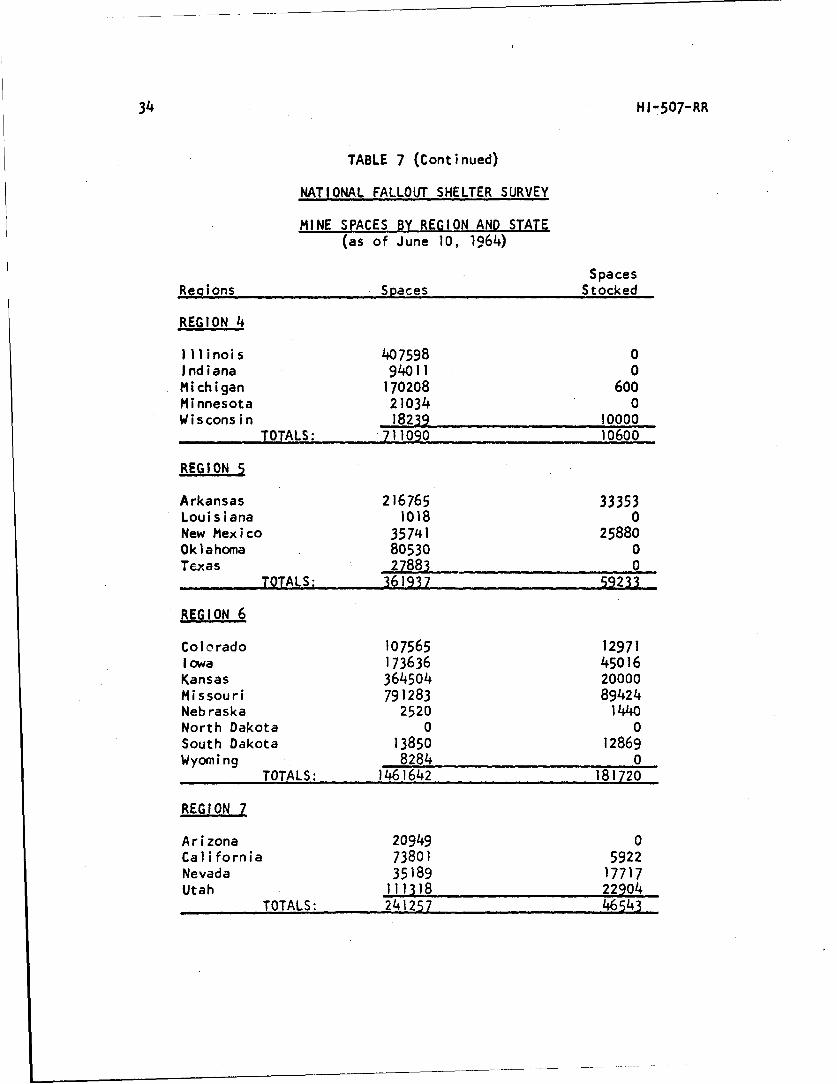
Besides its value as a directory, the NFSS data sumnmarized in Table 7
is siSnificant in the following ways:
1. The list indicates space (and potential for more space) in
states and regions where previously little was thought to exist. This is
notable in Vermont, New Jersey, Virginia, Alabama, Georgia, Colorado,
Utah and Washington. In other states, the NFSS spaces greatly exceed the
previous estimates. Kentucky (coal mines), Tennessee, and Arkansas
are examples.
2. It tends to corroborate the evidence that mine space may be
difficult to find in the southeastern states and in some of the New
England states.
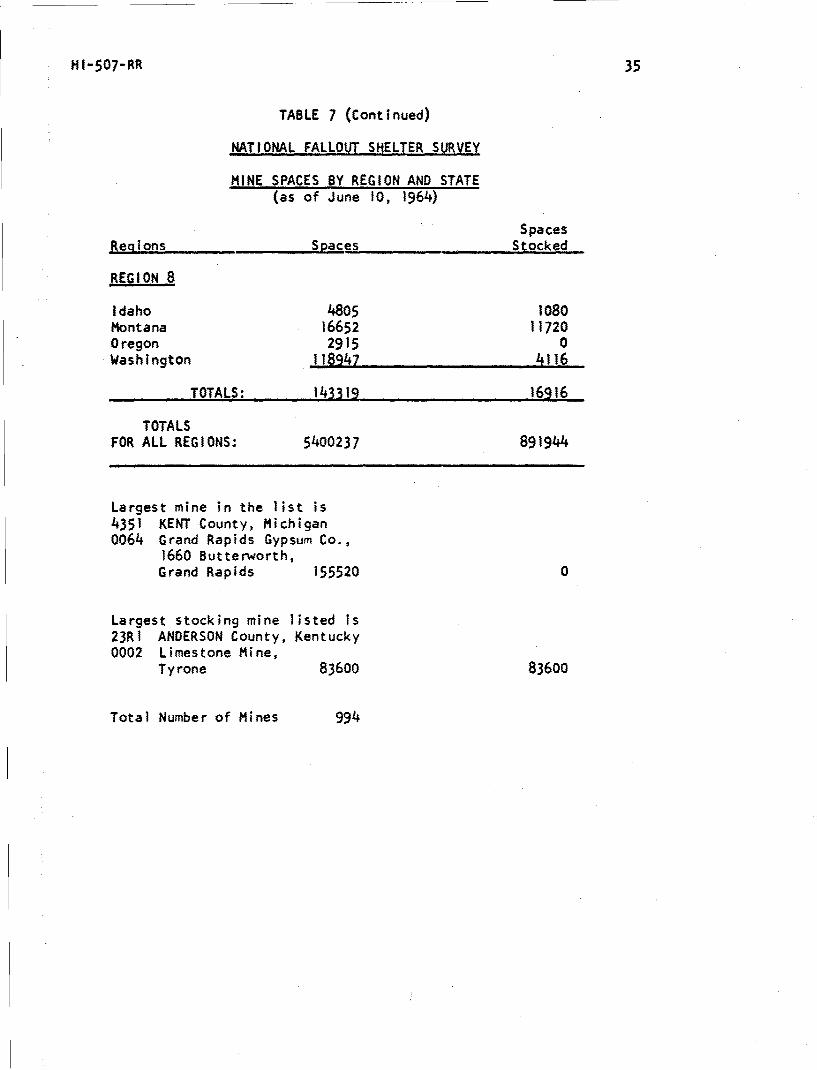
3. It contains facilities which probably set precedents or indicate
feasibility for very large single-unit shelters. The largest mine is
listed at 155,520 spaces and another is stocked for 83,600.
4. Most of the space is probably "vent" space, that is, based on
500 cubic feet per person. Assuming an average ceiling height of from
20 to 25 feet, we estimate the potential capacity in the located mines to
be 2 to 2.5 times greater than the listed capacity or from IC million to
13 million spaces with adequate ventilation and -'ithout using overcrowd-
ing options.
32 HI-507-RR
In addition, the number of spaces located in any given mine does
not necessarily represent its maximum capacity even at 500 cubic feet
per space. A sampling of 10 gypsum and limestone mines from Table 4,
which are also listed in the NFSS, indicates the potential space (at
500 cubic feet) to be ten times greater than the number actually located.
If this proportion held true across-the-board, spaces available in the
1,000 mines might be as much as 50 million without ventilation additions
and as much as 100 million or so with ventilation and other adaptations
(entries, water, sewerage, etc.).
Of course, this does not mean that all of this potential would be
usable. This depends on the distribution of the space with respect to
the population, movement capabilities, allowable time and other per-
formance factors. However, we would argue that the potential exists and
could prove valuable for shelter programs which specify some redistri-
bution of the population.
HI-507-RR 33
TABLE 7
NATIONAL FALLOUT SHELTER SURVEY
MINE SPACES BY REGION AND STATE(as of June 10, 1964)
SpacesRegions Spaces Stocked
REGION I
Connecticut 305 0Maine 0 0Massachusetts 1180 0New Hampshire 0 0New Jersey 10822 685New York 315327 1449Rhode Island 0 0Vermont 5624 22580
TOTALS: 383876 24714
REGION 2
Delaware 0 0Washington, D.C. 0 0Kentucky 992670 372564Maryland 1050 0Ohio 71115 6600Pennsylvania 128799 6620Virginia 88828 44568West Virginia 72383 34S86
TOTALS: 1354845 464938
REGION 3
Alabama 71881 34150Florida 0 0Georgia 242808 0Mississippi 0 0North Carolina 0 0South Carolina 0 0Tennessee 427582 53130
TOTALS: 742271 87280
34 HI-507-RR
TABLE 7 (Continued)
NATIONAL FALLOUT SHELTER SURVEY
MINE SPACES BY REGION AND STATE(as of June 10, 1964)
SpacesRegions Spaces Stocked
REGION 4
Illinois 407598 0Indiana 94011 0Michigan 170208 600Minnesota 21034 0Wisconsin 18239 10000
TOTALS: 711090 10600
REGION 5
Arkansas 216765 33353Louisiana 1018 0New Mexico 35741 25880Oklahoma 80530 0Texas 27883 0
TOTALS: 361937 59233
REGION 6
Colorado 107565 12971Iowa 173636 45016Kansas 364504 20000Missouri 791283 89424Nebraska 2520 1440North Dakota 0 0South Dakota 13850 12869Wyoming 8284 0
TOTALS: 1461642 181720
REGION 7
Arizona 20949 0California 73801 5922Nevada 35189 17717Utah 111318 22904
TOTALS: 241257 46543
H I-507-RR 35
TABLE 7 (Continued)
NATIONAL FALLOUT SHELTER SURVEY
MINE SPACES BY REGION AND STATE(as of June 10, 1964)
SpacesRegions Spaces Stocked
REGION 8
Idaho 4805 1080Montana 16652 11720Oregon 2915 0Washington 118947 4116
TOTALS: 143319 16916
TOTALSFOR ALL REGIONS: 5400237 891944
Largest mine in the list is4351 KENT County, Michigan0064 Grand Rapids Gypsum Co.,
1660 Butterworth,Grand Rapids 155520 0
Largest stocking mine listed is23R] ANDERSON County, Kentucky0002 Limestone Mine,
Tyrone 83600 83600
Total Number of Mines 994
36 HI-507-RR
NEW SITE POTENTIAL
In the event that the area in existing mines is insufficient or too
poor in quality to meet the regional needs, new excavations in suitable
formations or the conversion of open-pit operations to underground mining
can be considered.
Limestone far exceeds the other types of formations in frequency of
occurrence and in the volume of generally massive formations. Limestone
is most commonly mined as dolomite having a porosity of less than 2 per
cent and a compressive strength ranging from 11,000 to 35,000 psi, as
compared with a compressive strength of good structural concrete of 3,500
psi and about 5,000 psi for rocksalt.
Limestone formations can be found in almost every state. Present
quarrying operations are widely distributed. A map of existing mines
and quarries is shown in Figure 6. A rough comparison between this map
and the current distribution of population indicates that most of the
quarrying operations could qualify as sites for potential shelter.
There are two basic ways to develop a new facility. One is to arrange
with the mine operator to open a new site by normal operations and the
second is to convert the existing operation to underground mining. The
National Limestone Institute addressed itself to these possibilities in
1962 at the request of Secretary Pittman. The Institute estimated that
at least one-third of the open-pit operations could convert to below-
ground mining by opening existing faces. The cost incentive, where such
conversion was clearly i:easible, was estimated at up to 2.5 cents per
cubic foot of space.lk
The NLI estimates of incentive based on unit volume led to our in-
vestigation of optimum ceiling height. We found that 14 feet is a practical
HI-507-RR 37 1
rI T
1h N1 0;1 p 4
_4 -I CIA
Nu - 1 ; 1 j, -n
-~4 1ý 1 *~~~ " ,y r is 111', ~~.
r1 Q¶# <4 N
UJIA
2 4w
-I 1
r- Q. /
38 HI-507-RR
limit due to the type of mucking equipment used. However, the actual
ceiling height for any given location will depend on the extent of the
limestone formation and the economics involved in digging it out. It was
suggested that an arbitrary height of 21 feet should be used for comput-
ing prices on a square-foot basis. Using this data a bare non-vent space
would cost $12.50 and a vent space (10 square feet) would cost $5.25.
This, the NLI agrees, would include the cost of some drift access. They
also concluded that development cost could Ic much less depending on
location and the extent of competitive bidding. Their Shelter Committee
statv :
Because of the many variables, it was agreed that the onlypractical means of developing suitable shelter space wouldbe through a contract based on competitive bids on Govern-ment specifications. In some cases, the unit incentivewould provide the Government with a rough space after thedesired area was obtained by mining. In others, rentalagreements would have to be consummated by the owner and theGovernment inasmuch as some properties, because of theirlocation, would be worthless while others could have a mar-ket value. It was suggested that bid invitation(s) includealternatives with respect to unit incentive payments andrentals and their combinations. Provision in contractagreements would have to be made in those cases where theoperator wants to retain the right of occupancy in orderto continue mining, or for some other reason, after hehas provided the required space desired by the Government.Known examples show that this is practical. 1 5
Legal and contract problems aside, -50 cents a square foot with high
ceilings is evidently a source of very cheap shelter space. New shelter
construction would cost much more, at least $5 per square foot without
land costs, in large units (1,000 spaces and up), and with lower headrooms.
The mine space is also of higher quality with respect to protection factor
and blast protection.
HI-507-RR 39
If such conversion was clearly feasible, one might be interested in
determining the development times involved. The NLI made inquiries of its
members asking them to estimate the amount of production which they con-
sidered convertible to underground operations. The sample showed this to
be between one-third and one-half of the total production. As an example,
let us assume that we were interested in a dispersed shelter system
involving mine space and desired to create 100 million spaces and were
able to funnel one-third of the annual limestone production into the pro-
gram. One-third of the production (067 x 106 tons) would result in about
10 million (10 square foot) spa es per year. We estimate the program
could be completed within 15 years including a lot of planning but with-
out trying very hard. The cost would be about $50 million per year for
developing the bare space.
Suppose we wanted to try harder, that is, to have a rapid "mobiliza-
tion" program. In this case we ignore some production requirements
and concentrate on excavating rock. We pay the operators a premium for
converting and relocating to underground operations near population
centers and guarantee the going market price for-any rock they cannot
sell. We believe this could automatically double (at least) the produc-
tion (2 shifts) and result in 60 million spaces per year. The maximum
cost for 100 million spaces would be $2 x 10% including the premium and
buying the excess rock (I billion) and the program would be completed in
18 months.
Salt formations may be of interest in planning high-quality blast shel-
ter programs. The known formations are deep (-1,000 feet) and extensive.
* Not including habitability items. These would probably cost lessin mines than in new shelter construction mainly because of lower environ-
mental control due to the high heat absorption characteristics of the rock.
40 HI-507-RR
They exist from Albany to Detroit in the northeast, from New Orleans to
Dallas in the south-central regions, and cover most of central Kansas.
Site Adaptation
The cost and time required to adapt existing mine space to shelter
use will depend upon many factors. Among these are:
1. Existing access capability--shaft or drift and their number,
roads, etc., and the desired access rate
2. Geographical location
3. Geology
4. Existing utilities
5. Protection criteria--stay times, blast rating, degree of
habitability ("plushness")
6. The design scenarios.
The range in cost is from zero to "very expensive," depending on the
design factors. A "zero cost" facility might be one which has been con-
verted to storage use or one of many listed in the NFSS which is under-
crowded and has sufficient power, water, sanitation and ventilation to
support the shelter population for extended periods.
Converted facilities can be found in New York, Pennsylvania,
Missouri, Oklahoma and Kansas. The Atchison mines of the Kerford Quarry
Company contain 3 million square feet of developed space with dehumidi-
fication and ventilation and other utilities sufficent for at least
100,000 people. This and other similar facilities are essentially
"zero cost" facilities--imnediately available, clean, pleasant, and
well lighted.
*Even in the areas under storage lease the space available is enor-mous due to allowances for wide loading aisles and truck areas.
HI-507-RR 41
Beyond using these installations, we have "easy" and "hard" problems
in adapting mine space, roughly according to the difficulties involved
in providing access. Relatively, the multiple-drift mines are "easy"
and the deep, limited-access shaft mines are "hard."16
A 1957 report included detailed estimates for adapting a West Win-
field, Pennsylvania, drift mine for 156,000 people and the International
Salt Mine, 1,300 feet under Detroit, for 1,125,000 people. The first mine
contains multiple entries and was assumed not to require additional access.
The estimates of the salt mine included four 16-degree inclined drifts
with three entrances each to achieve a maximum entry rate of 7,000 per-
sons per minute.* The estimates were based on very plush habitability
criteria and up to 90-day occupancy. The adaptation cost for the drift
mine was about $7 per square foot and for the shaft mine, about $11 per,
square foot, the difference apparently attributable to cost of providing
inclined drift access.
A recent study1 7 estimated (more austerely) that a typical drift
access mine rated at 20 psi could be adapted for about $0.95 per square
foot. The same study budgeted a 20-psi, about 80-foot deep, abandoned
lead mine at about $1.15 per square foot...-
These examples are especially indicative of the extra costs involved
in providing entries. Now this will depend on required entry rate. The
first study assumed an optimistic walking rate of 4 miles an hour and cal-
culated that a 20-foot drift could accormodate up to 2,300 persons per
"*Both the figures are highly optimistic, Inclined drifts will rarelyexceed 10 per cent slope due to equipment limitations. Drifts from sur-face portals are most economically driven with rubber-tired equipmentwhich must return to the surface loaded. The Building Exits Code 16 ratesexiting capacity at about 2 persons per minute per inch opening. For a20-foot tunnel, this is equal to 500 persons per minute or 2,000 for thefour drifts.
'"No ventilation improvements for either mine.
42 HI-507-RR
minute. The study team was interested in a very fast entry capability
and included four such drifts which (with their assumption) would allow
everyone to enter in under 3 hours. The cost of the inclined drifts was
about $8 million or $7 per person sheltered.
The existing access capabilities of the deep mines is, of course,
very limited. For example, there is an excellent limestone mine located
near Akron, Ohio, containing over 7 million square feet and increasing
at over 350,000 square feet per year. Although there is much room, acces-
sibility is a difficult problem for mass use. The floor is 2,200 feet
below the ground and the facility has one elevator which takes 8-10 minutes
for a round trip. The elevator is limited to 16 persons, although it is
equipped with a second platform which could increase the rated capacity
to about 30 persons. If efficient loading schemes could be worked out
(i.e., mixture of 3dults and children), this might be increased to 50
persons. So, at best, the elevator would accommodate 375 people per hour
and 9,000 per day. At this rate, it would take months to utilize the
space.
At some sites it may not be possible to fully utilize the space
potzntial due to movement limitations. An example is the Retsof, New
York, salt mine, with a potential of 100 million square feet of space.
The mine is 1,100 feet below the surface and is situated about 35 road
miles east of Buffalo. The population within 60 miles is about 2.5 mil-
lion, which the mine could conceivably accommodate.
We estimated a potential of 4 lanes of continuous traffic to the
site while preserving an additional lane for official traffic and another
for return traffic. Assuming 1,000 cars per hour, 4 persons per car, and
HI-507-RR 43
that the cars could be parked and unloaded without slowing down the opera-
tion, autos might deliver 16,000 people per hour to the site under good
conditions.
The Retsof site also contains rail facilities. The Delaware, Lacka-
wanna and Western, the Pennsylvania, and the Genesee and Wyoming all spur
into a loading yard at the mine mouth. We did not have sufficient data
on the loading yard and the available rolling stock to make a good esti-
mate of movement by rail. However, from another study18 we guess it to
be much less than by private cars.
Over all, the potential might be 20,000 persons per hour or roughly
half a million per day. It takes a minimum of 5 days to move 2.5 million
people to the mines and probably a month to utilize the full space poten-
tial.* The rate of arrival of people is one way of determining access
requirements, and assumed movement time will determine the limits of the
design capacity.
The minimum size of access tunnel is about 10 feet in diameter and
has a horeshoe-shaped section. Horizontal drifts of this size, driven
from portals in dry, crystalline formations, will cost about $200 per
foot without lining. A 10 per cent downslope drift will pass through
many different formations and would probably be concrete-lined through-
out. The inclined drift will also possibly incur additional costs due
to flooding at the working face. The total cost is then estimated at
$250-300 per linear foot (10 feet finished) including (for this job) site
Concentrating millions of people at one site may turn the place intoan attractive target. It would probably need 3 blast rating of severalhundred psi to compete with smaller, more dispersed shelter systems.
44 HI-507-RR
and portal preparations, cleanup and profit and contingencies.* Each
entry required would be almost 2 miles long and cost about $3.5 mil-
lion, including vestibules, ventilation ductwork, lighting, piping,
and finishing, and would normally take a year to complete.
If we used the fire exits design criteria, the drift would have a
capacity of 250 persons per minute. If we assumed an optimistic walking
rate for mass groups of people at 4 miles per hour and each person occupy-
ing 24 inches of width and 24 inches in the direction of flow, we calcu-
late that 5 persons abreast can move down the drift at the rate of 900
persons per minute. Consultation with elevator and escalator companies
(Westinghouse and Otis) experienced in mass movement indicate that for
ramps the exits design criterion is too low and the 4-mph computation is
too optimistic. It was their feeling that for extended periods a realistic
maximum is more like 500 people per minute.
The drift capacity is then somewhere between 15,000 and 54,000 per-
sons per hour and probably capable of accommodating the expected rate of
arrivals. Cost per space now depends on time allowed for movement. For
10 hours the entry costs $11 per person; for 50 hcurs, $3.50 per person.
In either case, the Retsof mine is underused.
Ventilation and Heat Dissipation
Among the most critical habitability requirements in the adaptation
of underground facilities are those involving ventilation, heat dissipa-
tion, and moisture control. The rated capacity and total adaptation costs
will be influenced by these requirements.
*The 10-foot tunnel may not be optimum. Larger double-deck drifts
may be mcre economical. These costs are applicable to other deep mines.Exception will be found where the geological conditions are unfavorable,such as at the Louisiana salt mines. The shafts to these mines were sunkin very poor soil. At one mine the soil had to be stabilized by freezingtechniques to support the construction operations. These mines requirefurther geological analyses to determine feasibility and cost of increasingentry capabilities.
HI-507-RR 45
The minimum amount of air required in any shelter is usually deter-
mined by a limitation in the concentration of carbon dioxide. This limit
is taken at 3 per cent by volume. Studies indicate that the oxygen limit
when the CO2 reached 3 per cent would not be critical in terms of damaging
pathological changes. For unventilated spaces the allowable time may be
calculated as follows:T = o.o4 V/N
where: T is the time after entry, hoursV is the total volume of the space, cubic feetN is the total number of shelter spaces
Using this equation, 500 cubic feet of volume would possibly afford one
day's supply of air per person.
The minimum ventilating rate required to prevent excess carbon dioxide
is about one-half cubic foot of outside air per minute per person. Cur-
rent OCD practice calls for a minimum of 3 cfm per person, which corre-
sponds to a terminal concentration of about 0.5 per cent CO2 .
In selecting the capacity of underground space in terms of ventila-
tion requirements, several options are possible. Among these are the
following:
I. In limited-access mines with no ventilation, long periods of oc-
cupancy are available by grossly undercrowding the space (thousands of
cubic feet per person). Such shelters may require equipment to monitor
the CO2 level and to provide some air movement to prevent high CO2 pockets.
2. In multiple-access mines, some natural ventilation may be pro-
duced by wind action or when a pressure differential exists between the
cavity air and the outside air. Installations with tunnels and shafts
tend to be self-ventilating during all seasons. Others will ventilate
better during the winter than during the summer. The effect of natural
ventilation on capacity ratings will vary from site to site but should
be valuable in most places in reducing area allocations.
46 HI-507-RR
3. In other mines it may be desirable to provide for mechanical
ventilation and air distribution systems to augment existing ventilating
capacity, further reduce space allocations, or increase performance.
Some means must also be available to control psychrometric conditions
within acceptable physiological limits. For normally occupied shelters,
this turns out to be a problem of dissipating the metabolic heat produced
by the occupants. In unventilated underground mines it is a function of
a variety of parameters such as shelter shap , surface area, rock tem-
perature, air temperature, rock diffusivity and conductivity and the film
coefficient of heat transfer at the mine surfaces.
Given these parameters, the quantity of heat (and moisture) produced
and the physical data of the mine space, it is possible to estimate hab-
itability performance at various levels of occupancy and shelter stay
times. In mines with suitable rock characteristic, it is possible to
allocate space such that the total heat production could be absorbed by
the surfaces by radiation, convection and moisture ccndensation. In
other mines (or for increased occupancy) it may be necessary to provide
environmental control equipment to provide foir heat dissipation to the
outside air or to another heat sink (e.g., water).
Most of the usable mine space is initially cold (50 0 -60 0 F) and. except
for salt mines, humid. In underground mines, this may be uncomfortable.
For normally occupied space, we would expect the occupants to be uncom-
fortable only during a short initial warmup period (a few hours).
The cost of providing for environmental control will vary between
sites and may range from zero to about $30 per space.* The latter figure
is for a large shaft-access mine with a water-cooled refrigeration system
including ajxiliary poqer.
An adaptation estimate of the International Salt mine under Detroit,used about $17 per person without auxiliary power.
H|-507-RR 47
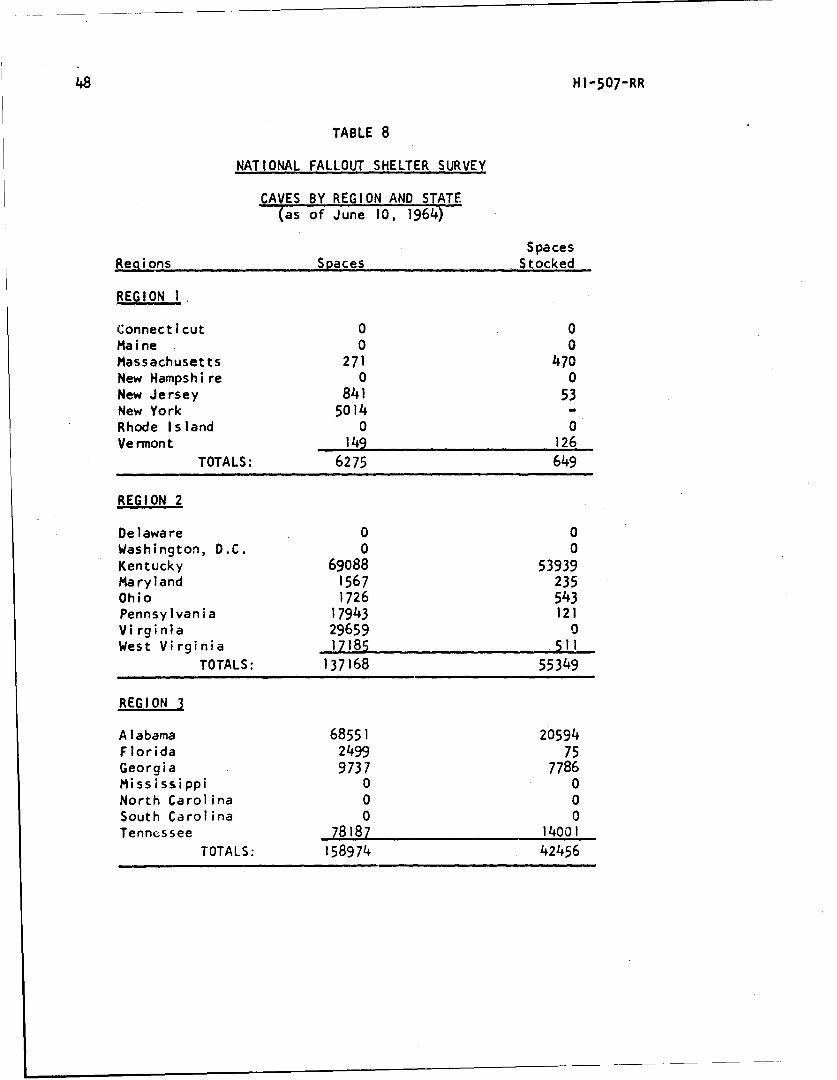
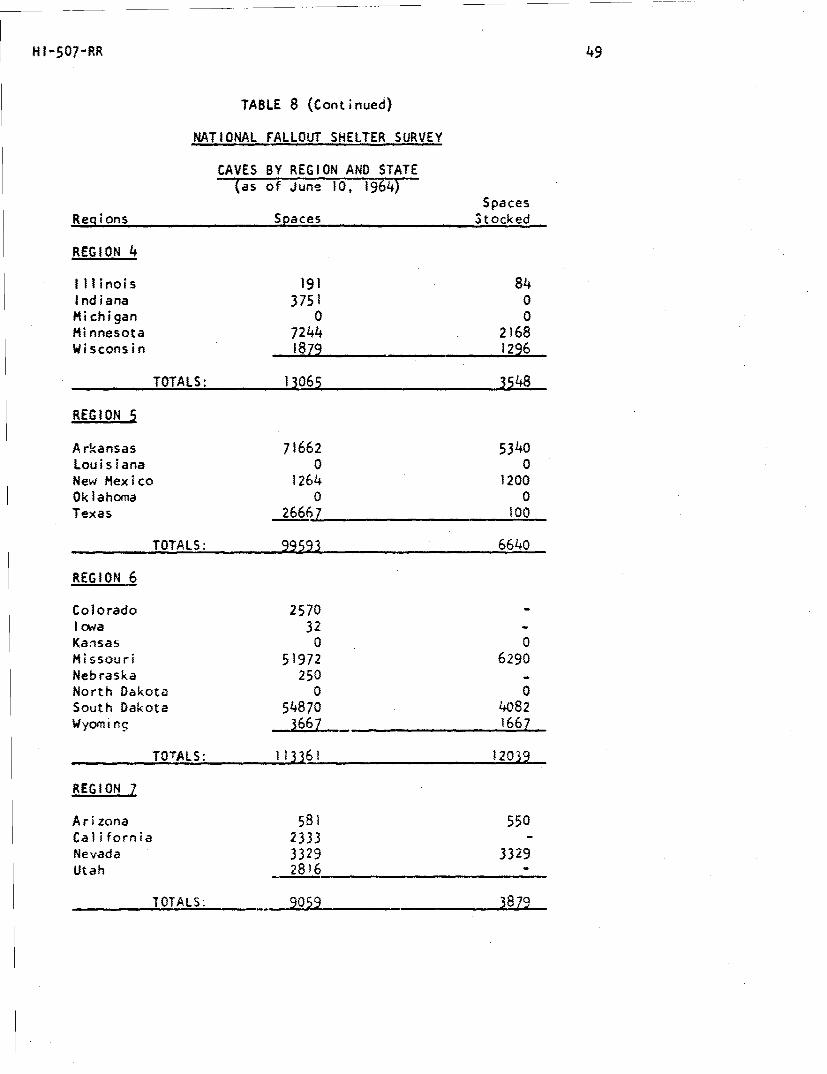
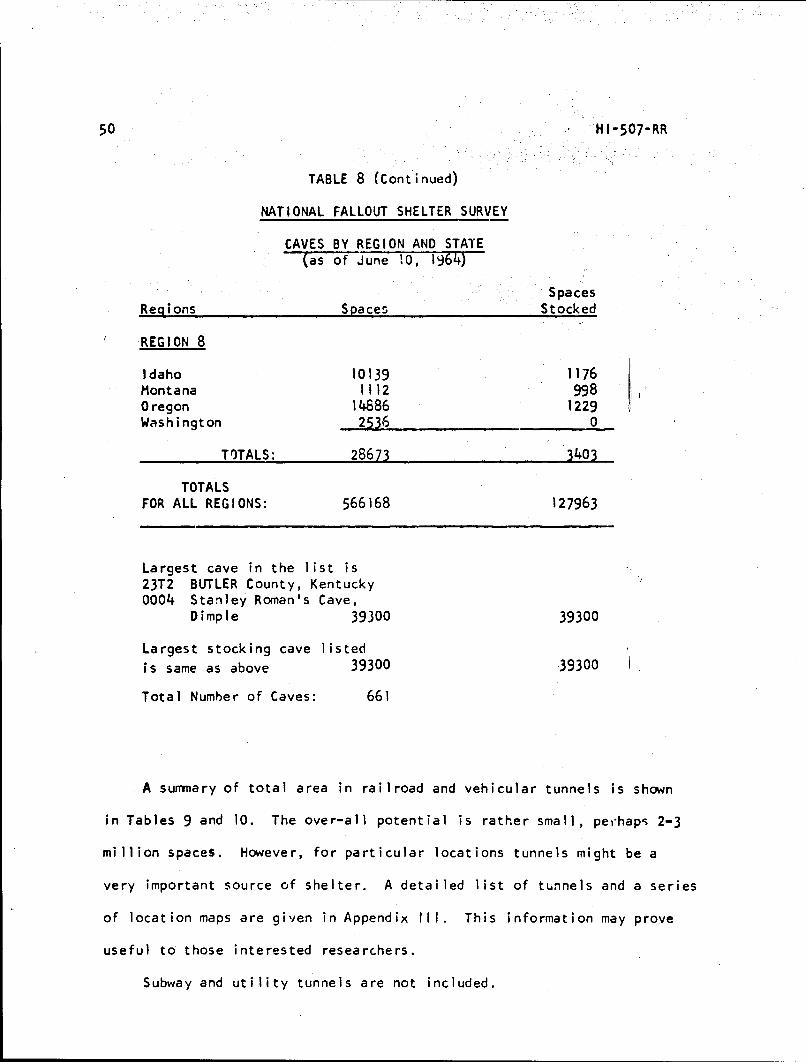
CAVES AND TUNNELS
The current NFSS information concerning available space in caves is
tabulated in Appendix II. Summaries are gi ,en in Table 8. The total
number of located spaces is about 570,000 in '60 caves.
The National Speleological Society (NSS) has been cooperating with
the Office of Civil Defense in locating caves and determining habitability
factors. The NSS maintains a library containing detailed listings of
noncommercial caves, their locations and physical characteristics. The
list totals some 10,000 individual grottos.
The several NSS chapters are currently investigating a selected
group of 200-300 caves for safety, accessibility, habitability, and
proximity to utilities. This is being done by questionnaires sent to the
local groups. From a sample of 59 returns, about half the sites were
considered unsuitable* because of poor access, irregularity, or insta-
bility within the cavities, because of flooding or the possibilities of
flash flooding or other hazardous features.
The average number of located spaces per cave in the sample of "good"
caves is about 800,which is roughly equal to the number of spaces in the
average NFSS located cave. If only half the caves were suitable and this
average held true for the total known caves, then we might expect the po-
tential to be about 4 million spaces. Adaptations to these spaces and/or
modifications to unsuitable grottos might increase the potential to about
10 million spaces.
*The criteria for suitability was not clearly defined in the instruc-
tions to the questionnaire.
48 HI-507-RR
TABLE 8
NATIONAL FALLOUT SHELTER SURVEY
CAVES BY REGION AND STATE(as of June 10, 1964)
SpacesRegions Spaces Stocked
REGION 1
C;onnecticut 0 0Maine 0 0Massachusetts 271 470New Hampshire 0 0New Jersey 841 53New York 5014 -Rhode Island 0 0Vermont 142 126
TOTALS: 6275 649
REGION 2
Delaware 0 0Washington, D.C. 0 0Kentucky 69088 53939Maryland 1567 235Ohio 1726 543Pennsylvania 17943 121Virginia 29659 0West Virginia ,17185 5•;
TOTALS: 137168 55349
REGION 3
Alabama 68551 20594Florida 2499 75Georgia 9737 7786Mississippi 0 0North Carolina 0 0South Carolina 0 0Tenncssee ,78187 14001
TOTALS: 158974 42456
HI-507-RR 49
TABLE 8 (Continued)
NATIONAL FALLOUT SHELTER SURVEY
CAVES BY REGION AND STATE(as of June 10, 1964)
SpacesRegions Spaces . tocked
REGION 4
Illinois 191 84Indiana 3751 0Michigan 0 0Minnesota 7244 2168Wisconsin 1879 1296
TOTALS: 13065 3548
REGION 5
Arkansas 71662 5340Louisiana 0 0New Mexico 1264 1200Oklahoma 0 0Texas 26667 100
TOTALS: 99593 6640
REGION 6
Colorado 2570 -I owa 32 -Kansas 0 0Missouri 51972 6290Nebraska 250 -North Dakota 0 0South Dakota 54870 4082Wyominc 3667 1667
TOTALS: 113361 12039
REGION 7
Arizona 581 550California 2333 "Nevada 3329 3329Utah 2816 -
TOTALS: 9059 3879
50 HI-507-RR
TABLE 8 (Continued)
NATIONAL FALLOUT SHELTER SURVEY
CAVES BY REGION AND STATE(as of June 1O, 1964)
SpacesRegions Spaces Stocked
REGION 8
Idaho 10139 1176Montana 1112 998Oregon 14886 1229Washington 2536 0
TOTALS: 28673 3403
TOTALSFOR ALL REGIONS: 566168 127963
Largest cave in the list is23T2 BUTLER County, Kentucky0004 Stanley Roman's Cave,
Dimple 39300 39300
Largest stocking cave listed
is same as above 39300 39300
Total Number of Caves: 661
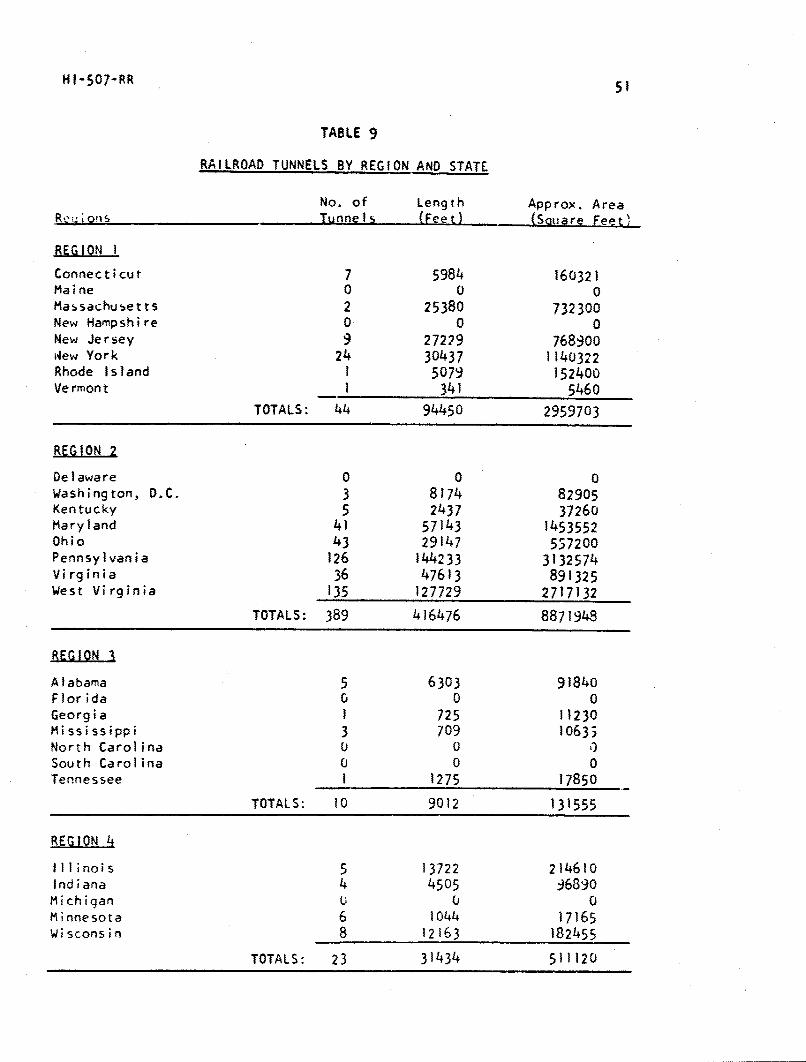
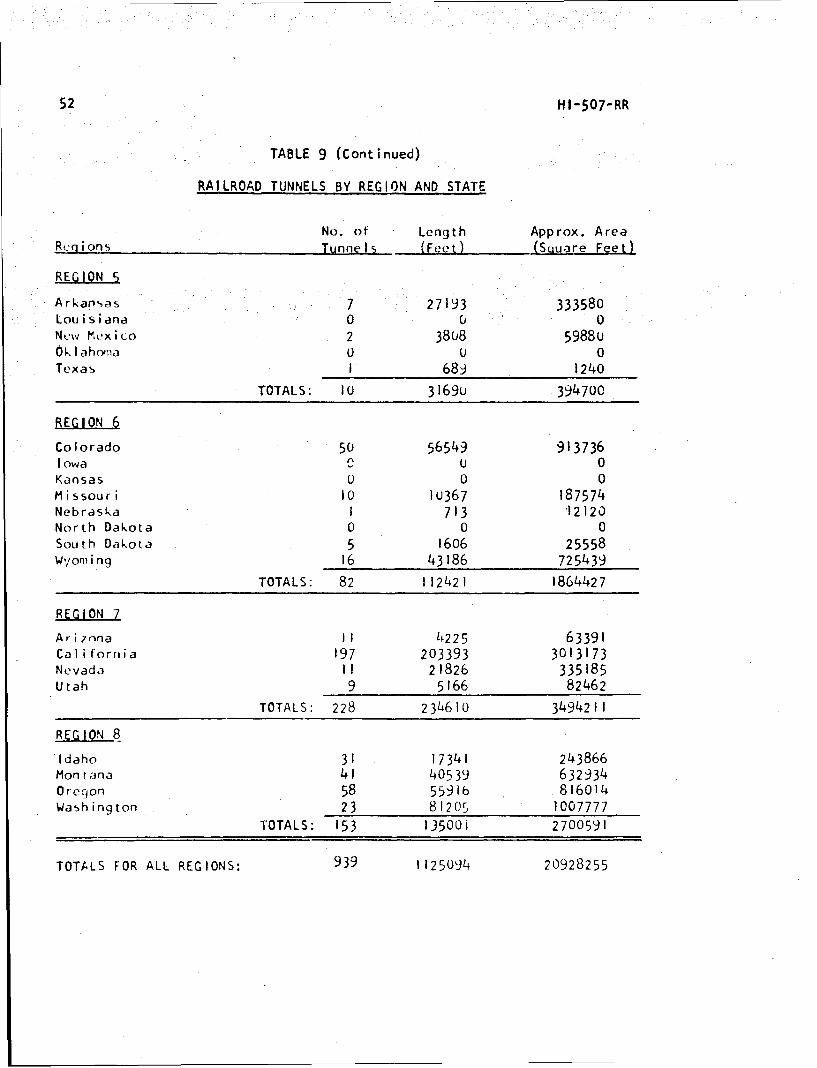
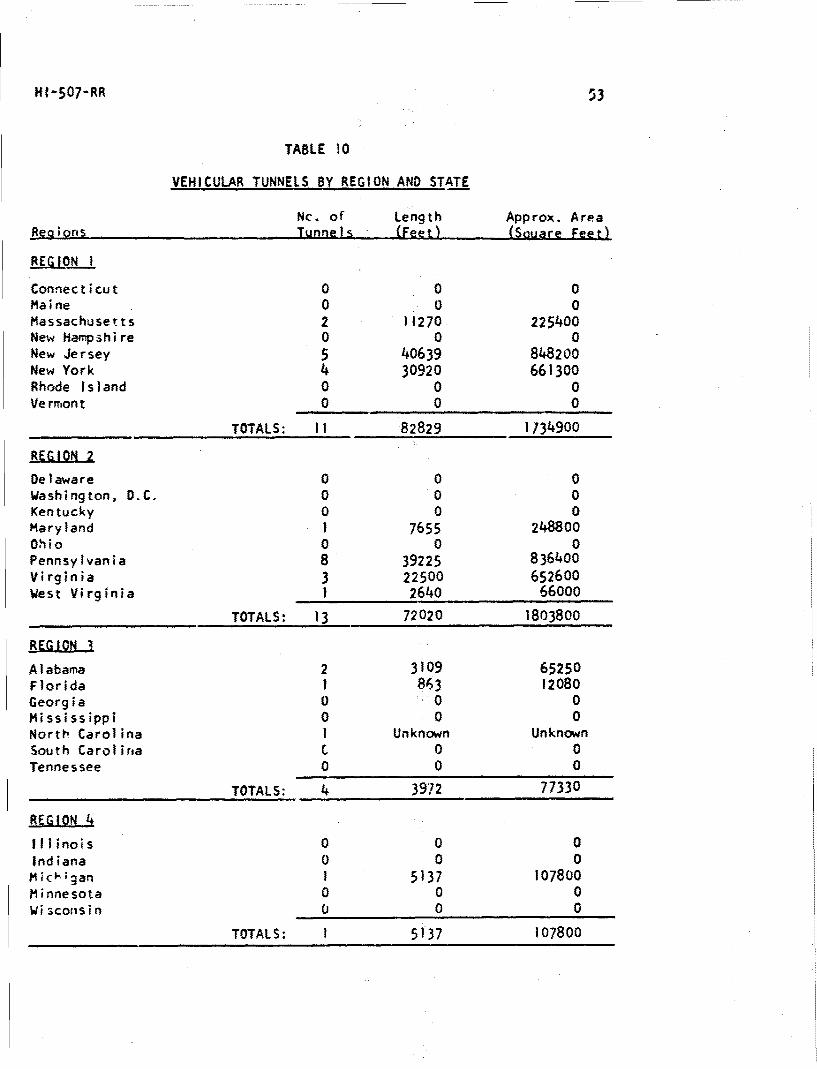
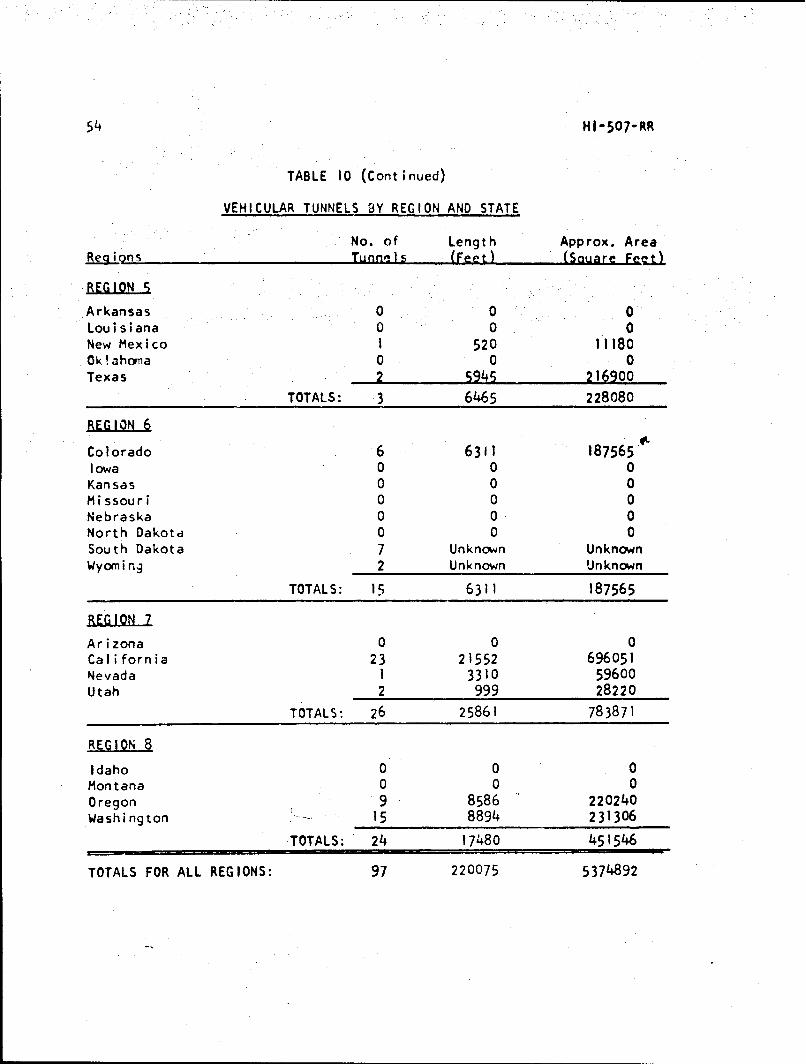
A summary of total area in railroad and vehicular tunnels is shown
in Tables 9 and 10. The over-all potential is rather small, perhaps 2-3
million spaces. However, for particular locations tunnels might be a
very important source of shelter. A detailed list of tunnels and a series
of location maps are given in Appendix III. This information may prove
useful to those interested researchers.
Subway and utility tunnels are not included.
HI-507-RR 51
TABLE 9
RAILROAD TUNNELS BY REGION AND STATE
No. of Length Approx. AreaRc- on s Tunnels (Feet) (Sauare Feet)
REGION I
Connecticut 7 5984 160321Maine 0 0 0Massachusetts 2 25380 732300New Hampshire 0 0 0New Jersey 9 27229 768900New York 24 30437 1140322Rhode Island 1 5079 152400Vermont 1 341 5460
TOTALS: 44 94450 2959703
REGION 2
Delaware 0 0 0Washington, D.C. 3 8174 82905Kentucky 5 2437 37260Maryland 41 57143 1453552Ohio 43 29147 557200Pennsylvania 126 144233 3132574Virginia 36 47613 891325West Virginia 135 127729 2717132
TOTALS: 389 416476 8871948
REGION 3
Alabama 5 6303 91840Florida 0 0 0Georgia 1 725 11230Mississippi 3 709 10633North Carolina 0 0 0South Carolina 0 0 0Tennessee 1 1275 17850
TOTALS: 10 9012 131555
REGION 4
Illinois 5 13722 214610Indiana 4 4505 96890Michigan U 0 0Minnesota 6 1044 17165Wisconsin 8 12163 182455
TOTALS: 23 31434 511120
52 HI-507-RR
TABLE 9 (Continued)
RAILROAD TUNNELS BY REGION AND STATE
No. of Length Approx. Area
Rtqions Tunnelk (Feet) ,Suuare Feet)
REGION 5
Arkansas 7 27193 333580Lou i s i ana 0 0 0New Mexico 2 3808 59880Ok I ahoma 0 0 0Texas I 689 1240
TOTALS: 10 3169u 394700
REGION 6
Colorado 50 56549 913736Iowa C U 0Kansas 0 0 0Missouri 10 IU367 187574Nebraska I 713 12120North Dakota 0 0 0South Dakota 5 1606 25558Wy orn i ng 16 43186 725439
TOTALS: 82 112421 1864427
REGION 7
Arizona II 4225 63391California 197 203393 3013173Nevada II 21826 335185Utah 9 5166 82462
TOTALS: 228 234610 3494211REGION
Idaho 31 17341 243866Montana 41 40539 632934Oregon 58 55916 816014Washington 23 81205 1007777
TOTALS: 153 1)5001 2700591
TOTALS FOR ALL REGIONS: 939 1125094 20928255
HI-507-RR 53
TABLE 10
VEHICULAR TUNNELS BY REGION AND STATE
Nc. of Length Approx. AreaRecgions Tunnels (Feet) (Sauare Feet)
REGION I
Connecticut 0 0 0Ma ine 0 0 0Massachusetts 2 11270 225400New Hampshire 0 0 0New Jersey 5 40639 848200New York 4 30920 66)300Rhode Island 0 0 0Ve rmon t 0 0 0
TOTALS: II 82829 1734900
Delaware 0 0 0Washington, D.C. 0 0 0Kentucky 0 0 0Maryland 1 7655 248800Ohio 0 0 0Pennsylvania 8 39225 836400Virgin ia 3 22500 652600West Virginia 1 2640 66000
TOTALS: 13 72020 1803800
_REG ION 3
Alabama 2 3109 65250Florida 1 863 12080Georgia 0 0 0Mississippi 0 0 0North Carolina I Unknown UnknownSouth Carolirna C 0 0Tennessee 0 0 0
TOTALS: 4 3972 77330
REGION 4
Illinois 0 0 0
Indiana 0 0 0Mic ;an 1 5137 107800Minnesota 0 0 0
Wisconsin 0 0 0
TOTALS: 1 5137 107800
54 HI-507-RR
TABLE 10 (Continued)
VEHICULAR TUNNELS BY REGION AND STATE
No. of Length Approx. AreaReqions Tunnels (Feet) (Square Feetj
REG ION S
Arkansas 0 0 0Louisiana 0 0, 0New Mexico 1 520 11180Ok!ahoma 0 0 0Texas 2 S945 216900
TOTALS: 3 6465 228080
REGION 6
Colorado 6 6311 1875654Iowa 0 0 0Kansas 0 0 0Missouri 0 0 0Nebraska 0 0 0North Dakota 0 0 0South Dakota 7 Unknown UnknownWyoming 2 Unknown Unknown
TOTALS: 15 6311 187565
RE GION 7
Arizona 0 0 0California 23 21552 696051Nevada 1 3310 59600Utah 2 999 28220
TOTALS: 26 25861 783871
REGION 8
Idaho 0 0 0Montana 0 0 0Oregon 9 8586 220240Washington 15 8894 231306
TOTALS: 24 17480 451546
TOTALS FOR ALL REGIONS: 97 220075 5374892
HI-507-RR 55
CONCLUS IONS
In this study, which is limited in its coverage of the shelter
potential in underground space, we believe the following general obser-
vations are in order:
I. Though the use of mine space has always been included in civil
defense planning, we believe it deserves some renewed interest because
the previous estimates of usable space were grossly underestimated. We
estimate that the current high-quality space pýDtential is at least one
billion square feet. This is augmented by a minimum growth rate of 55 to
70 million square feet per year. These figures do not include space in
high-priced ore mines or in coal mines which could be considered in some
programs.
2. Mine space might prove to be an important asset in making up
NFSS non-city deficits and for possible use by part of the urban popu-
lation. This presumes willingness to have shelter space further than
the 25-mile limit currently used in the NFSS.
3. The superior protection afforded in mines (or tunnels, or caves)
as compared to home basements and many NFSS shelters could save many
lives. Mines offer the possibility of providing almost perfect protec-
tion from fallout and thermal effects and of providing some blast pro-
tection. In comparison, home basements are generally rated at 10-20 PF
with the possibility of im.r•ovising additional protectiott up to 100 PF,
but they afford very little thermal and blast protection.
56 HI-507-RR
4. It may be possible to create new space in some deficit areas
and near population centers by encouraging the operators of limestone
quarries to convert to underground operations or to develop new mines.
The required premium to the mine operator is estimated at up to $12.50
per 500 cubic foot space. Competitive bidding and/or ventilation im-
provements might result in lower costs (i.e., $5 per 10 square foot
space with 20-foot headroom plus $1-3 for ventilation improvements).
New shelter space with such qualities of protection would be much more
expensive (i.e., $5 per square foot minimum for bare shelter space with
7- to 8-foot headroom plus ventilation cost).
5. Adaptation costs will range from zero to about $100 per shelter
space dependhn3 on eoisting facilities, acccss "pab!lity, location,
and geological factors. The "zerdo figure is for a mine that has been
converted to a storage facility. The Kerford Mine in Kansas was con-
verted to dehumidified storage space for $2 per square foot. The $100
figure applies to the deep salt mines in the North. Adaptation costs for
"difficult" mines (i.e., the Louisiana salt mines and the 2,200 foot deep
Barberton, Ohio, limestone mine) might prove to be more than $100 per
space. These estimates do not include the costs of acquiring, leasing,
or maintaining the space. In a national program using mines to a large
extent, we believe it is possible to develop 100 million high-quality
spaces for under $5 billion.
6. The development of undergrounc; space might be an attractive
alternative to building shelters for accelerated programs (1-4 years),
since the construction force of the mining industry is already in place
and the requirements for structural materials would be reduced.
HI-507-RR 57
RECOMMENDATIONS
1. It is necessary to increase our knowledge of the existing and
potential mines and quarries to provide a basis for determining the
feasibility of using underground space in nationwide shelter programs.
We recommend an underground assets survey which would assemble, cata-
logue, and evaluate such information. Sources of information include
the NFSS, the Corps of Engineers, state geologists, the National Geo-
logical Survey, the Bureau of Mines, mineral institutes, and mine and
quarry operators.
2. A study of the feasibility of underground shelter systems
utilizing existing and new mine space. This might be part of the "5
City Study" and would include design and adaptation examples, protection,
habitability, and other performance ratings and costs. The examples
should reflect variations in urgency and austerity.
3. An investigation of alternative means of acquiring shelter
space when needed. This study should include subsidies required to en-
courage the development of suitable mine space at specific locations.
4. Alternative implementation plans and preparations should be
considered for the use of mines in Increased Readiness Programs of
various kinds.
58 HI-507-RR
REFERENCES
I. William M. Brown, A New Look at the Design of Low-Budget Civil DefenseSystems, HI-478-RR (Draft). Hudson Institute, Harmon-on-Hudson, Newyork, March 10, 1965.
2. William M. Brown, Some Aspects of Effectiveness of Active-PassiveDefense Programs, HI-381-RR. Hudson Institute, Harmon-on-Hudson,New York, July 2, 1964.
3. A Series of Nine Reports Prepared for the Chief of Engineers, U.S.- Army, under Contract W-49-129-Eng-59 by Guy B. Panero, Engineers,
420 Lexington Avenue, New York, New York.1. Report--Underground Installations--Summary (AD-144-574)2. Report--Underground Installations--Foreign Installations
(AD-144-578)3. Report--Underground Installations--Precision Manufacturing
Plant (AD-144-573)4. Report--Underground Installations--Chemical Process Plant
(AD-144-601)5. Report--Underground Installations--Storage Depot (AD-144-580)6. Report--Underground Installations--Sites and Geological
Format ions (AD-112-342)7. Report--Underground Instpllations--Adaptations of Existing
Mines for Emergency Use (AD-144-575)8. Report--Underground Installations--Working Conditions
(AD- 1i - IS)9. Report--Underground Installations--Excavation and Construc-
tion Methods (AD-144-577)Report--Underground Installations--Storage Depot--Appendix
(AD- 144-579)Report--Underground Installations--Precision Manufacturing
Plant--Appendix Volume I (AD-144-602)Report--Underground Installations--Pr-cision Manufacturing
Plant--Appendix Volume 2 (AD-144-603)
L4. Department of Defense. .Lnderaround Plants for Industry. Departmentof the Army, Office of the Chief of Engineers, Washington, D.C.,January, 1956.
5. Guy B. Panero, Engineers. Manhattan Shelter Study for Federal CivilDefense Administration. Battle Creek. Michiqan. Volumes I and IIand Appendices. 420 Lexington Avenue, New York, New York April, 1958.
6. Ibid.
7. E. G. Callahan, et al. Shelter from Fallout. Report No. TO-B-60-30.Technical Operations Incorporated, Burlington, Massachusetts, April 7,1961.
H 1-507-RR 59
8. ibid.
9. Manhattan Shelter Study, op. cit.
10. A Series of Nine Reports..., op. cit.
I1. Bureau of Mines. Mineral Yearbook, Vol. 1, "Metals and Minerals."U. S. Department of the Interior, Washington, D.C., 1962.
12. Skillings Mining Review, "International Salt's Retsof Mine,"
Vol. 51, No. 16. Duluth, Minnesota, April 21, 1962.
13. Mineral Yearbook, oM. cit.
14. Personal Communication ,o Steuart L. Pittman, Assistant Secretaryof Defense for Civil Defense, from The National Limestone Insti-
tute, May 4, 1962.
I , Ibid.
16. National Fire Protection Association. Building Exits Code forLife Safety from Fire. Boston, Massachusetts, 1961.
17. Office of Civil Defense. Incorporation of Shelter into Tunnels,Mines. Caves and Similar Structures. Professional Guide Series,Washington, D.C. (Not Released).
18. William M. Brown. Strategic and Tactical Aspects of Civil Defense
with Special Emphasis on Crisis Situations. HI-160-RR. HudsonInstitute, Harmon-on-Hudson, New York, January 7, 1963.
HI-507-RR A-I
ATTACHMENT #1
LIMESTONE QUARRIES AND MINES
(NATIONAL LIMESTONE INSTITUTE MAP)
BY OCD REGIONS
)"t r... ' a.n,½- rr.-W"S • It \ .....
,......• o'-n -t -"A. %I.,. .* -l :•". -
.. o AO -% !
½,
A-2
REGION I
Legend:0 - Open Quarry+ - Underground Mine
Sources:U. S. Bureau of MinesState Geological DepartmentsNational Limestone Institute
SCALE IN MILES0 100 200 300
ALBERS EQUAL-AREA PROJECTION
County boundaries s of April 1, 1960
A_
7et$
- -. - -/ ,or
n$ e? .4'#C "" t.t• -. .. " .. ... ,• S /6 "
~...wf
S•- , . - • . .. a-*"- wC --- ;* .....
a . a ".."
IF - Und er.g 9 ine
+ Und. **round Mine
State Geological Departments
National Limestone Institute
SCALE IN MILES0 to. 200 300
ALBERS EQUAL -AREA PROJECTION
Couct, bondgies a of April 1. 19/0
A4.t~
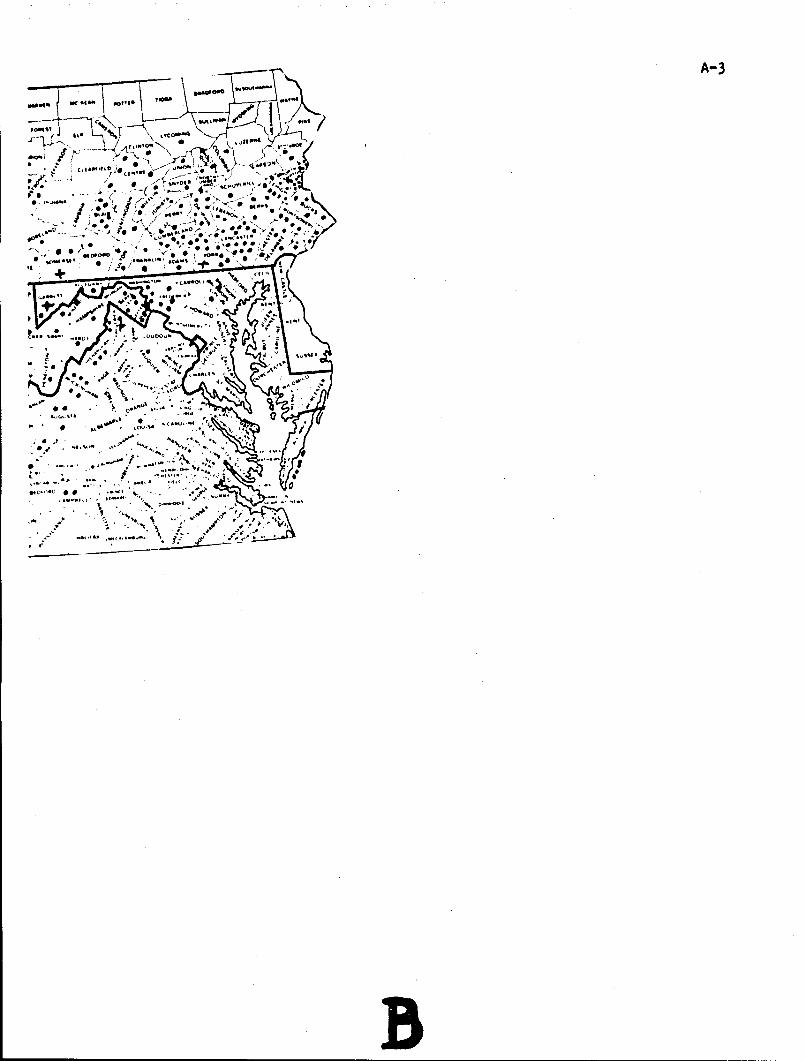
C A-3
p•I9
ItI
.0
• 1.
lb T
. ,.-. ---
* . , ., *.'.,., : , .* .. . .. -- 9., ' -•,,0 ** *
""** :" . "':" * * Y3 '; . ..
• - , " ". "o, . ., "s" * a * * *
• , . . . .? ". -
* 0
* 44~.Olt
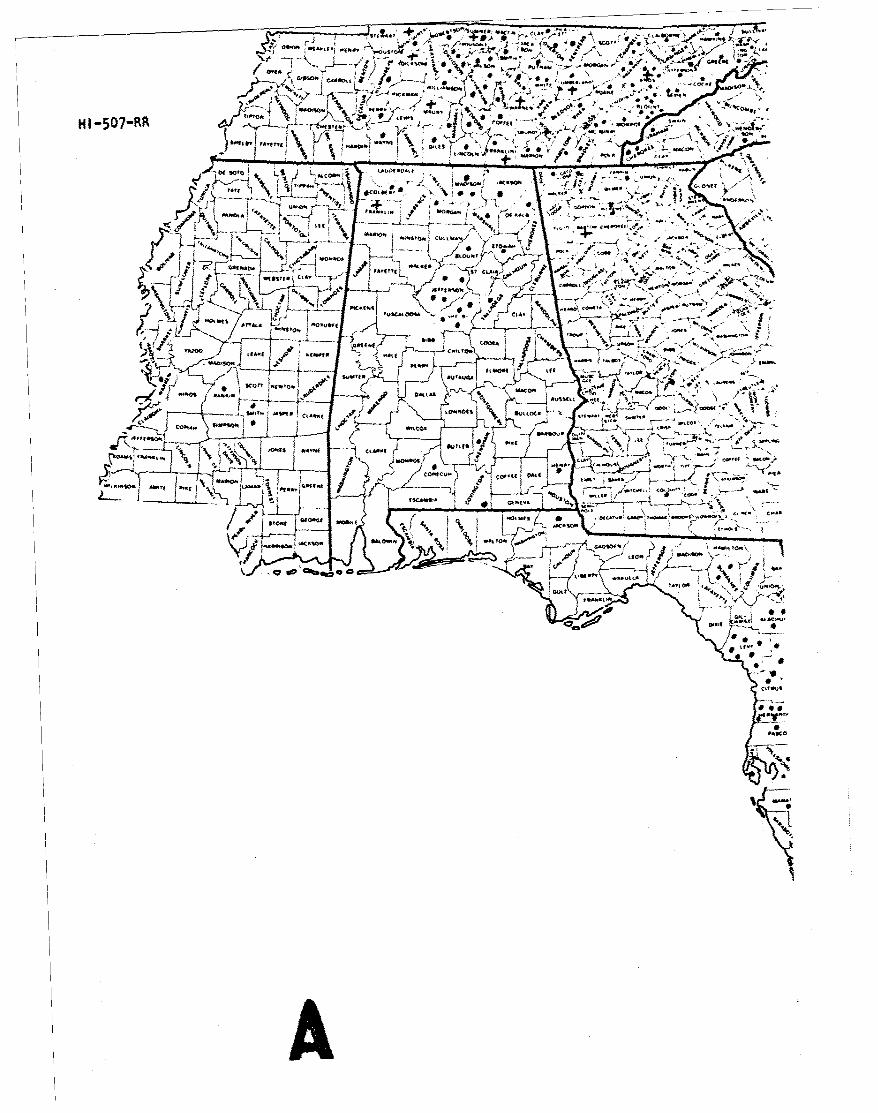
IS to-"-' o,
" "Nt' F*.csoj *
tw N.~
ta ~ ;~l~ N ~(on. - / 1 ~ -~Y~"r
/~"Wfl4 Jf*~ tAof NNA
L T* *Z:.*
*<.D-z c.±4-- 4 0.. - 4
HI -507-R
~ --- ~Ct4A 4A aI--
91 1 *won1 c-oo% rN,
*(m ---ot,"-ACO
\,,t 4'r ilk
-71I
It t
At,
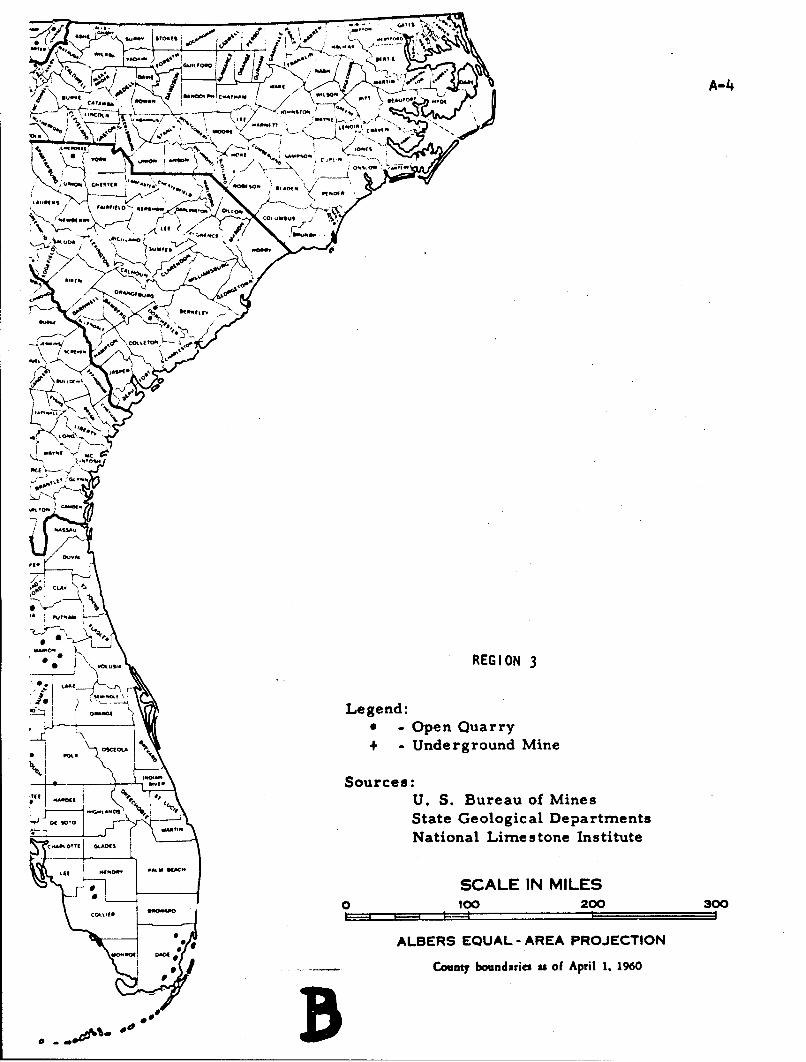
-A-
am PC- It 04-'? -h
OtA,
I 'Ft0'-.g~... 'qo~' 0.0.
V04 'ý
C f----I'-C4 ~ ~ ~ 901 V,{,-
.,.,,. o - .
CLAC
6 - OenQurr
-, U.S ura f ie
Laca -C0 \ . L W.t'*
SCALE IN MIE
0 100 20030
cowtv
ALBER REGION ARAPOETO
OWNC o nty bo nd aie a L e g e n d :. 96
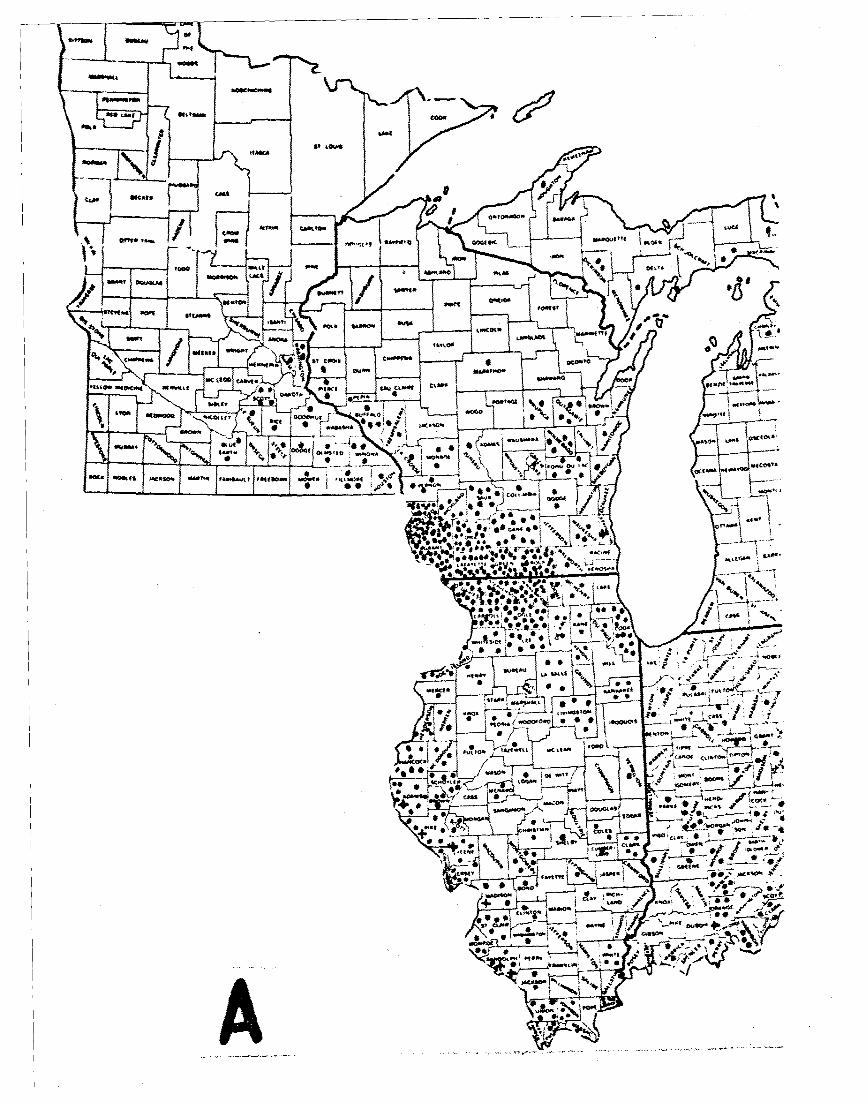
of O1
F~l #
ook/
so..w -"of %W.w
t0 Itno1o. **.
.; fth It__ C~ 0 -i.7" *topc -
MC ISO*t C ". i0 M-D~f 41w AOt to
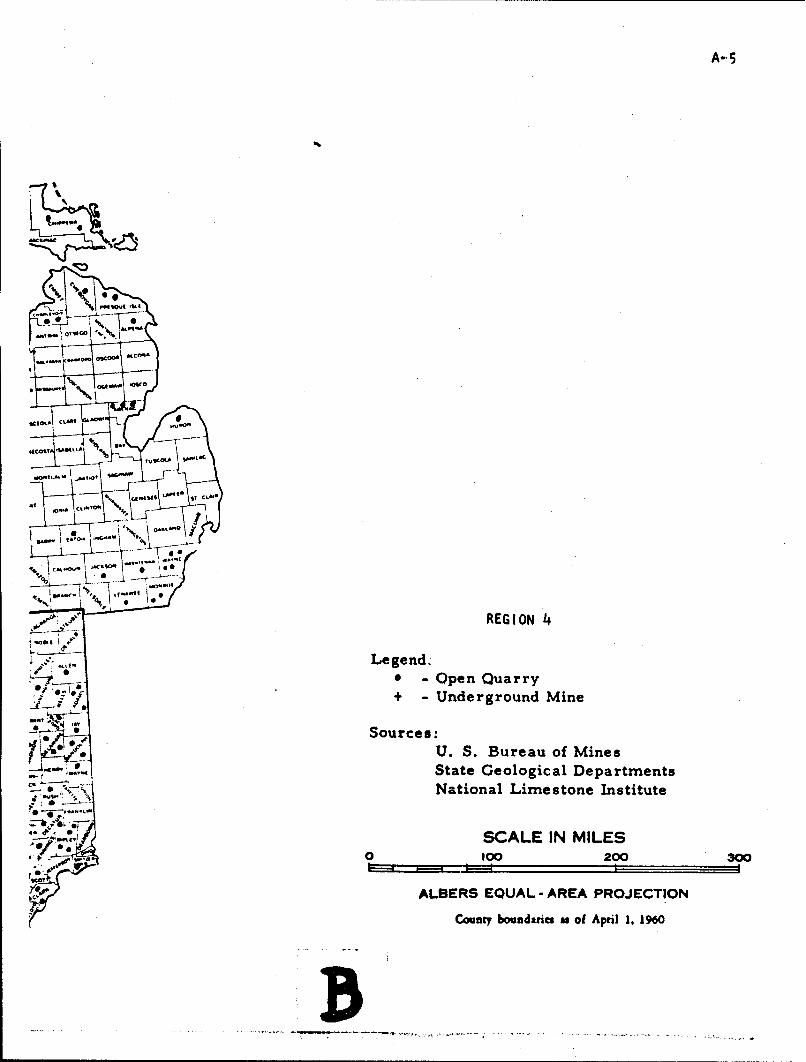
A-- 5
S• Sources"
sdCOS? CO
% Aw 4A W.
ii-
• •"• A.st U.S.* Bue0.fMie
'.C•. . 000 0 0
*1,.CALBERREGUIAON 4
Legend-
C 0 -Open Quarry+ -Underground Mine
SournsyU. S. Bureau of M ines
FB
State Geological DepartmentsNational Limestone Institute
SCALE IN MILES/00 100 200 300
ALBERS EQUAL -AREA PROJECTION
County boundaries as of April 1, 1960
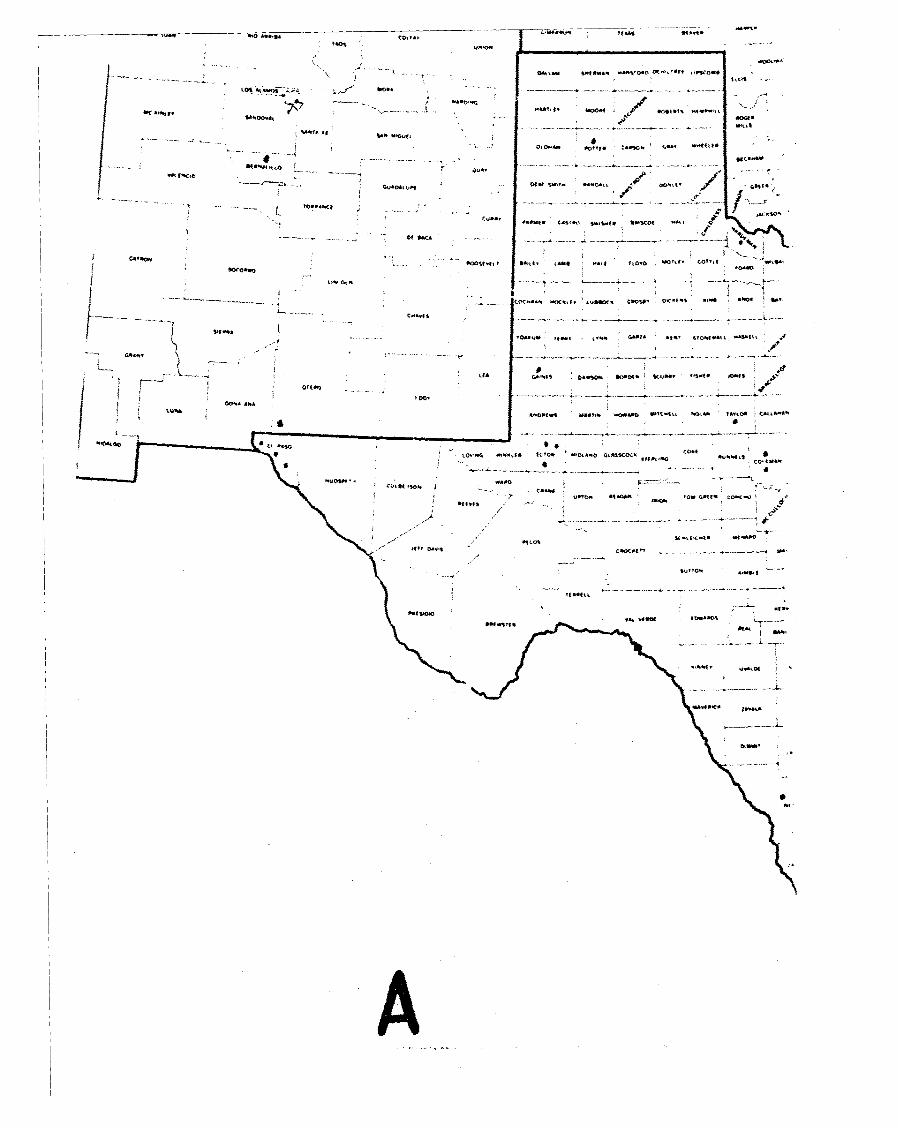
~~10,
.AD"
% Aft.Y sAf 1W.,r
010 ~ t*ffo. '
4.4-tl~ rft UY- -
of" -*. - o '
a-.. - -----
ItAf D.wkstnt# *v c. ,,o scf
-of5*4ftS 41Soo ~ IY C'l
00"A*
tuýA
de,1#. A' OCA.AAOSAC~
sto *4--G---I"-4"t - -c4*5*
oft.%,t If v
AA
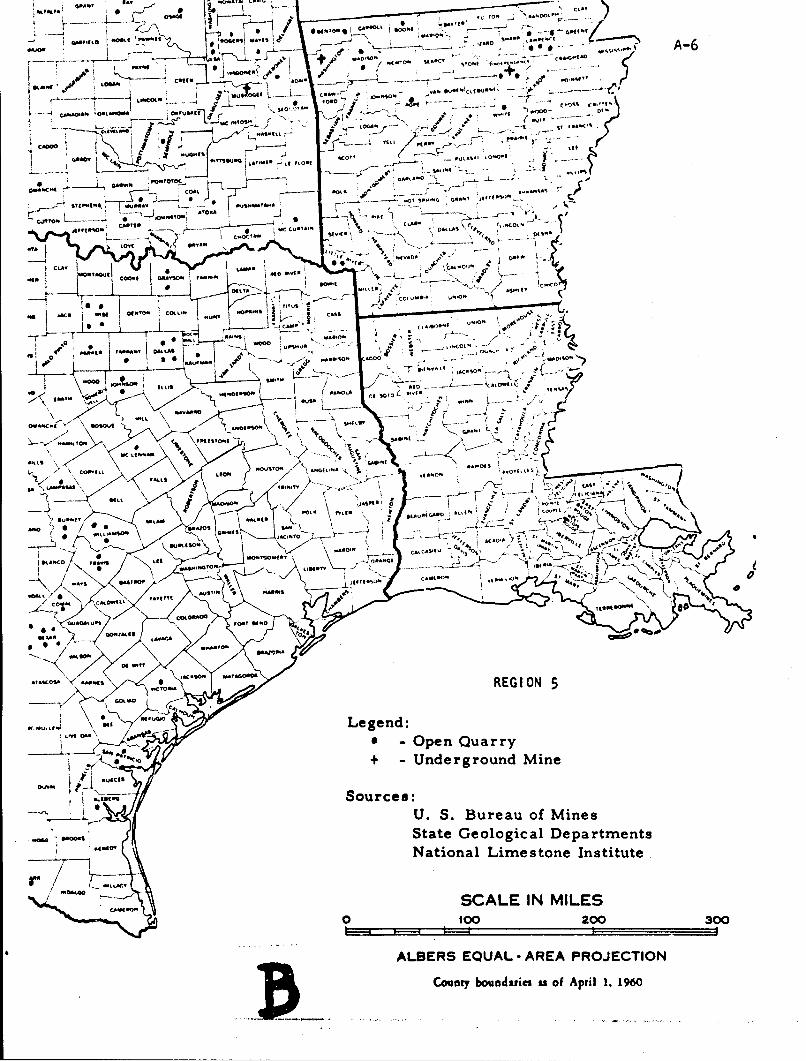
I a ... i -' CLAW
F---- ... *S'408OW?4L0 I.0#., WAV44 ~ ~ 7.I-*- ~;:'~~A-6
fl:Xi.... ... .o 4
- - -, . Ie _ -7 ,.' 4Iý- A.A '
1otSW*AA! C4 ~-4 JJf o.JI9 rj " I sto rA ,o
L,*CL6 L.L~. c*4 - 4.44 *C I''
7 jAW 0 0 .uil ' --- oo
PoloO4. GA.4LA.O o
jvrofP 4i0a _j
Stflt.4IN I s~ea - -
4CLAY L A lo-- DAIWA
.t .. ,AA~u c~4
GA~lC4
CS.40Uow.o",
(0006 40 ~ C ~ ., s
_ *o-.
TD L" -QW, c.o-- 0c,
.4I *.44. I-i---7,
-"6o i .~.."-I IOC to TQ4
k. . , WL .S0
.40001 It IlVA~~.--.L
w
LIGAW R..4A.0 .' '11 t',V'j'~f ý - j 4
* AL % - -O C - -.U - ",
'JI-
MIA "A ;o A
---- ----- 01 L%~
*~~'tI ''AGL0ALL ANP. 44
0 .. j~cw" "AG0,0AREGION 5
0Open Quarry+ - Underground Mine
A.191"Sources:- U. S. Bureau of Mines
.Ao" State Geological DepartmentsNational Limestone Institute.
AASCALE IN MILES
0 too 200 300
ALBERS EQUAL -AREA PROJECTION
County boundaries ws of April 14 1960
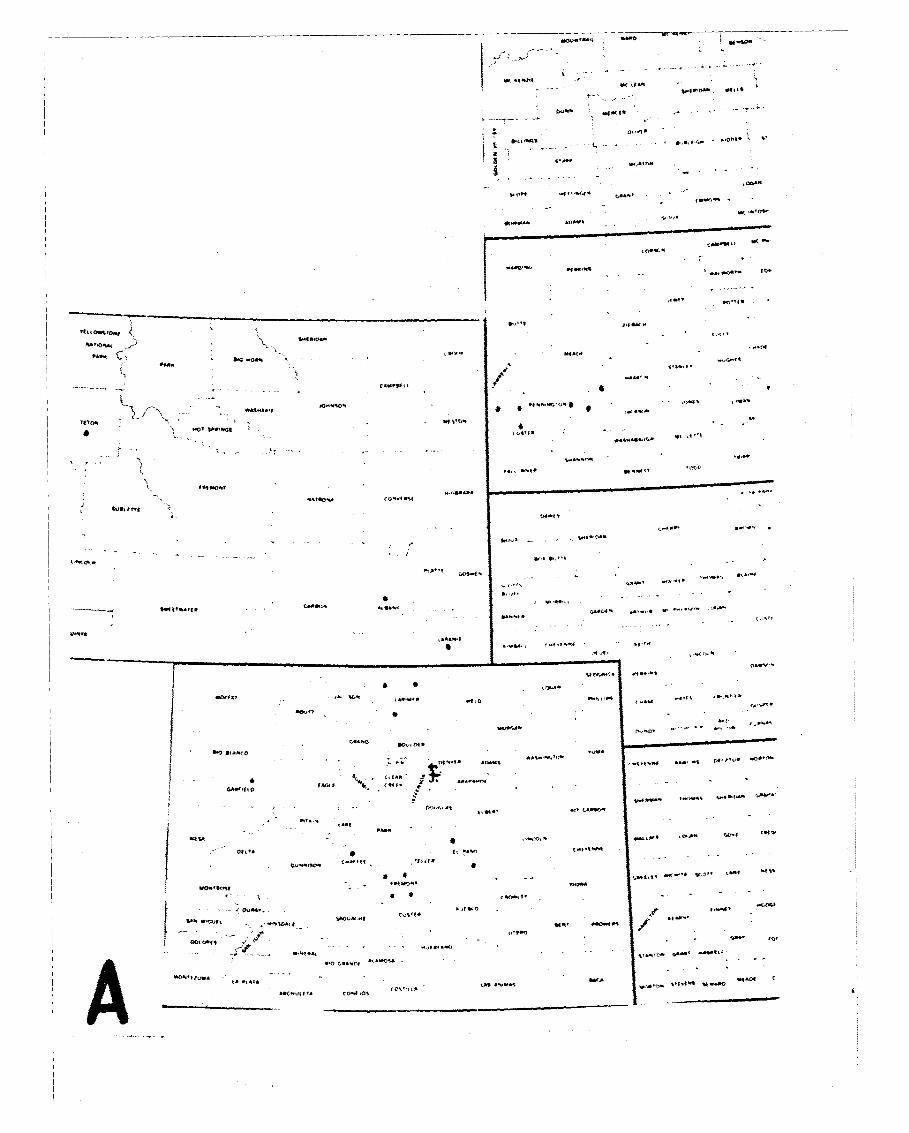
ja f;0'
I&C
n.. .. C...96
V.-' f
CKI
0",t*~~' -4-jA~ .
f~~. C": f .A.
'.4-"
C0~#*.0
WSA
vfl nl
l - t w
w~lt oo Nfl
fA-tf V- I P
I oclo4ts
.QN~p." G-~4~f
cof '
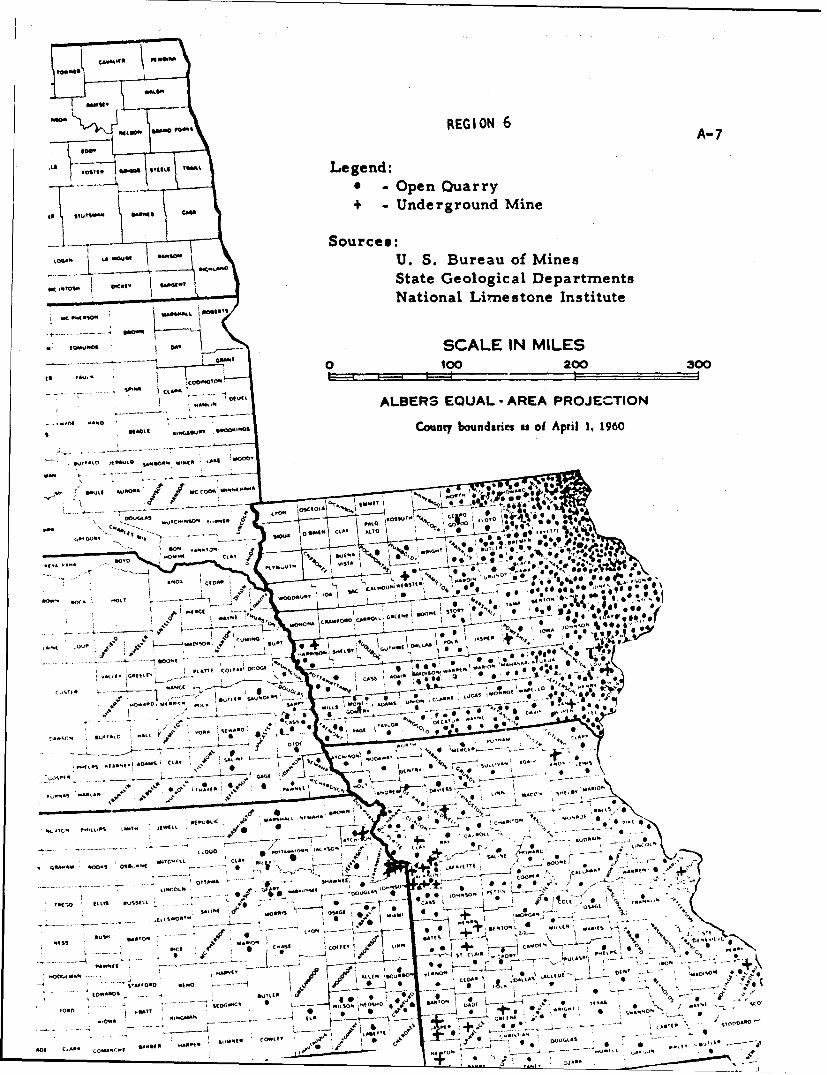
w, .REG ION 6 A S-7
'041o 60014,Legend:* AA Open Quarry+ - Underground Mine
Sources:
- .C..) U. S. Bureau of Mines
W.W&VA, State Geological DepartmentsNational Lim'e stone Institute
ttIAU"CSSCALE IN MILES0 100 200 300
* o'u'~ALBER3 EQUAL -AREA PROJEC-TION
County boundarcie as of April 1, 1960
w~~% C C SSJ L 0 ,f
e c o s *
::1 CCA
CI' '10 * *
W1 0JY.P* 0* **0**
+r -0 It 0 40'
.. 0.~OLA Cm L -e't," o, - -- 0 V 1
40 .. SAC 0 .4 3 0 Y 00
-0 St.,- to fiew Yo LY LJA ~O~
1C*
0'fl0
- ------ --- 4 0 CA
* IIL
tIMCL -- ' OODWE O.S * * . ~S a " 4
A AOCASS' 0
C ",f CLS AL*- -01.
' tN AA - - IL L' .. GR.N-*a' 0
*r if C
I -" * 0 1
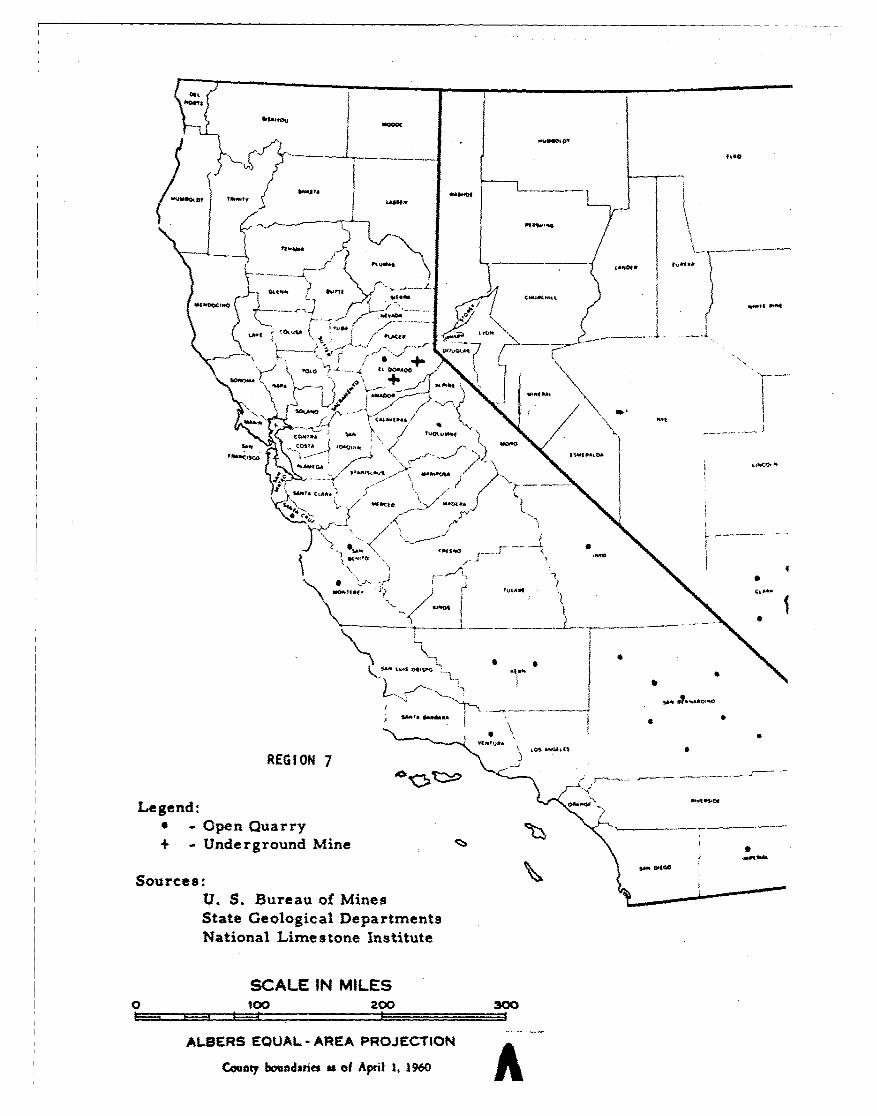
NOW
.suEatO?
g .1 ft,,
SRfSG ITffaON .5 74 -n,-Of:= , --. .. --
s,÷- Unrodi
U. S.OtfB.rea o.tine
1 % ,f~~n t, . iA cM
ttD arn
(ainlLm stonej A nstitute-
SRAEG ION 7IE
K/II
Stt elgcOal Departmetstf~
Naioa Lietn Intiut
SCALE INRMILE
0. t0 0 0
pnN
ALBER EQUA -ARE PROJCTIO
Conybudsisao Attil 1. 1t
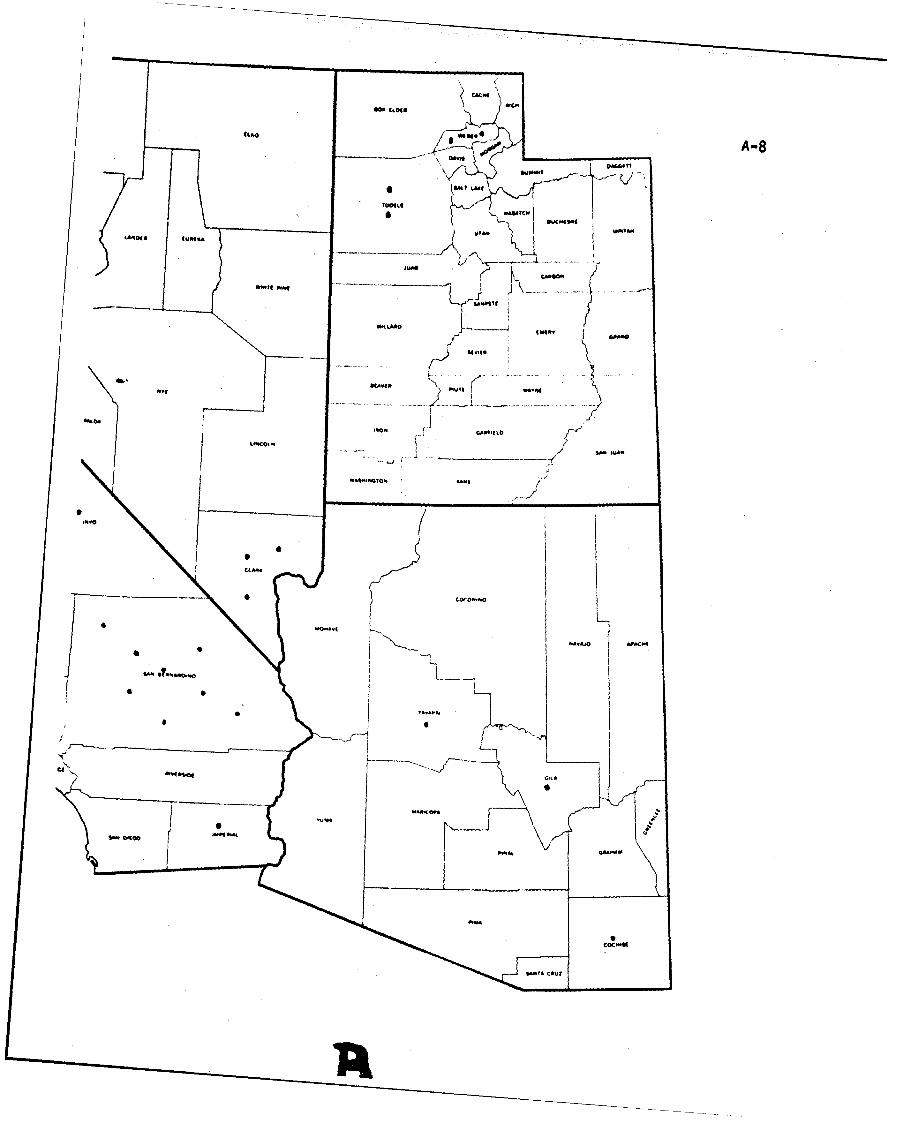
I, A-8
Itk CA* t ot
U.1
'AN"
SA.
".*NcII
Uft &IM
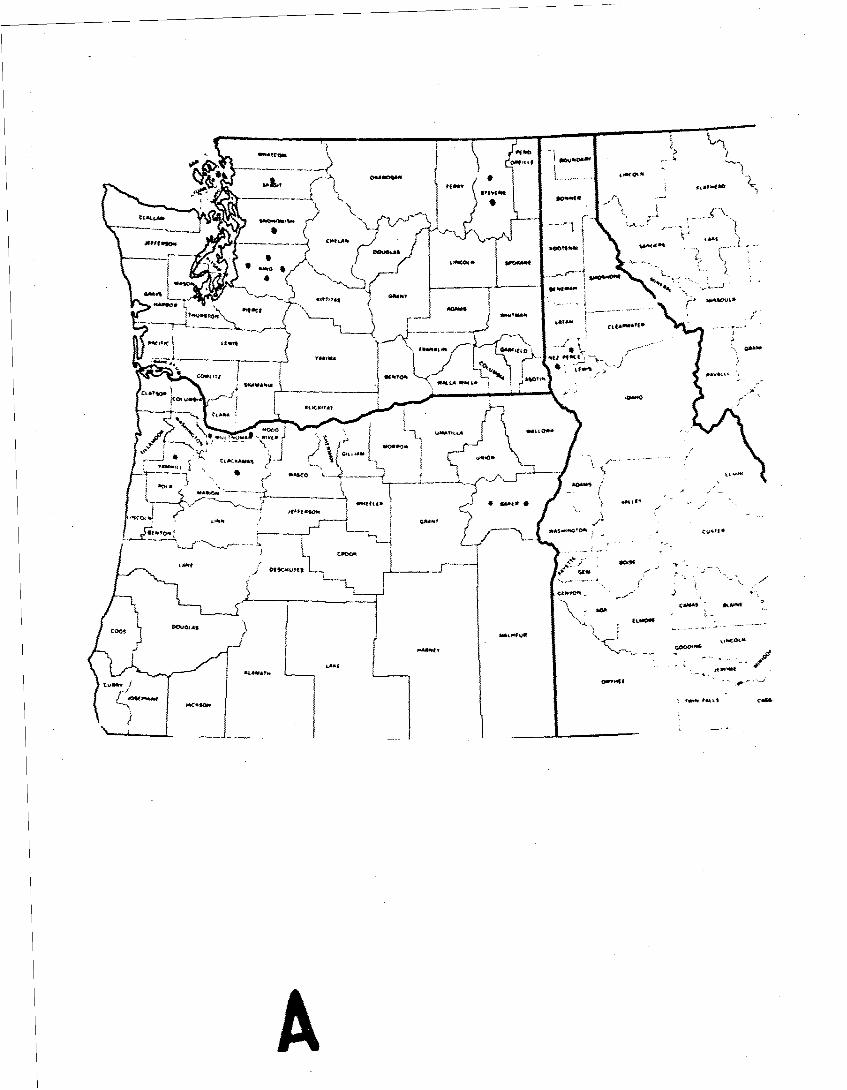
.W1
DOWOAS *.'?t
riot
O.N. WftitjLC-10 ! S
4-- '0-
Al
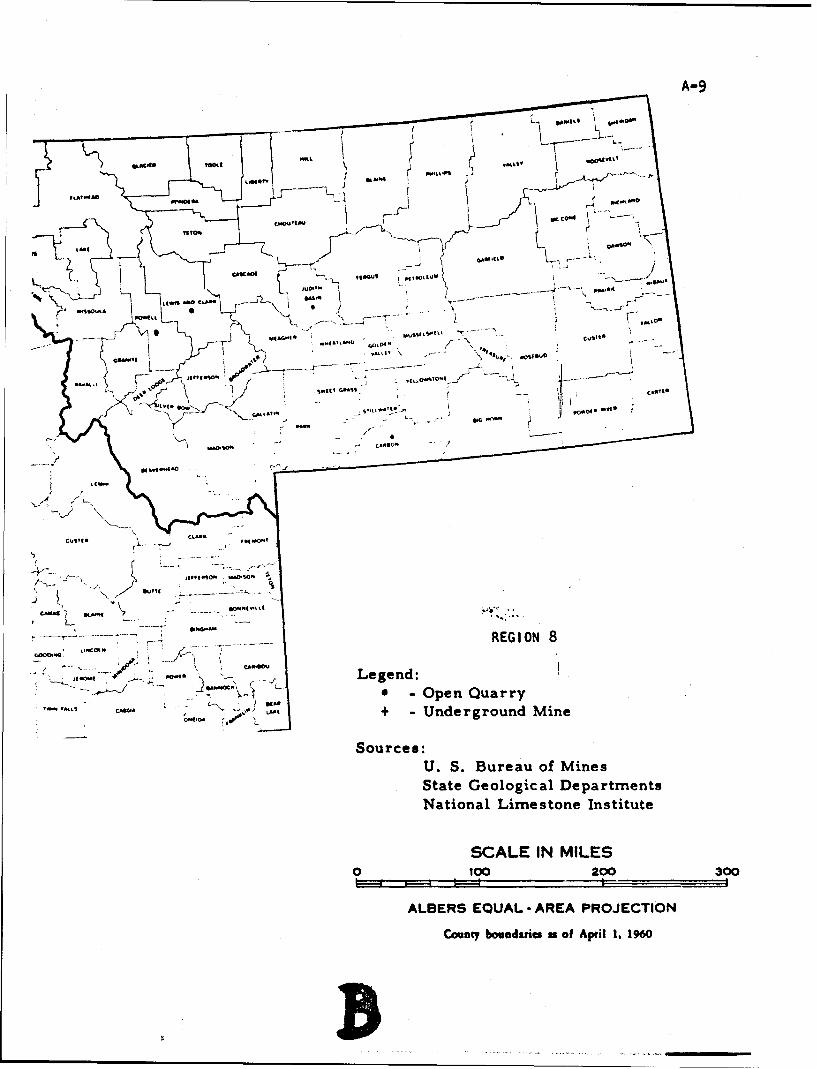
A-9
' LL
Ot -dh
~IS M0 A * t.x
y ,s ~~iMS~fVeto"tisA-- c~s~
LK \ i
)AC0 l w ot-
A ''1
';ot ý j2
£ulf Pawl0
AL
g,( V fA-f ttI'SIt *
REGION.G000*@ j
p.opO,7ofi Gos ovegnd-I
U.~t S.Bueu fMie
SCAEG ION MIE
Sonurceds:sa f pil1 16
B.S ueuo ie