Embed Size (px)
Citation preview
Proceedings World Geothermal Congress 2015
Melbourne, Australia, 19-25 April 2015
1
An Evaluation of the Impact of MatRidge Injection to Matalibong Production, Tiwi
Geothermal Field, Philippines
Aimee A. Calibugan1, Larry B. Villaseñor
2, Anthony J. Menzies
1 and Mitchel A. Stark
2
1Chevron Geothermal Services Company, 5F 6750 Building, Ayala Avenue, Makati City, Philippines
2Philippine Geothermal Production Company, 14F 6750 Building, Ayala Avenue, Makati City, Philippines
[email protected]; [email protected]; [email protected]; [email protected]
Keywords: Breakthrough, tracer, microgravity, geochemistry, downhole monitoring, capillary tubing, liquid level, economics
ABSTRACT
The Matalibong production sector of the Tiwi Geothermal Field is currently contributing ~35% of the total steam flow to the Tiwi
power plants. The MatRidge Hot Brine Injection System (MatRidge) wells are located north of the Matalibong area near the
northeastern edge of the geothermal reservoir. Initially, the injection rate at MatRidge was ~60 kg/s but starting in 2004, the
injection rate increased significantly due to operational changes and decreasing enthalpy of produced fluids. By 2006, the total
injection at MatRidge had quadrupled compared with the initial injection rate.
Geochemistry, geophysics, downhole pressure, tracer and production data all indicate that MatRidge injection has had a negative
impact on Matalibong production. From 2004-2010, it was estimated that approximately 60 kg/s of steam production was lost due
to the rising liquid level within the reservoir that could be directly attributed to high brine injection rates in the MatRidge injectors.
Continued high injection at MatRidge is expected to result in additional liquid level rise and further loss of steam production in the
Matalibong area.
To test this prediction, injection into the MatRidge injectors was significantly reduced from March to July 2010 by temporarily
diverting some of the brine eastward to injection wells in the North Naglagbong area. Continuous downhole pressure monitoring
showed that the diversion of brine quickly resulted in the stabilization and possible slight reduction of deep reservoir liquid
pressures in the vicinity. These changes, which quickly reversed after the diversion was terminated, provided evidence that
reduction of injection in MatRidge can have a favorable result on production in the area.
To permanently mitigate the detrimental impact of MatRidge injection, a pipeline was constructed in 2012 to allow diversion of
brine away from MatRidge to the South East Hot Brine Injection System (SEHBIS), an injection area in southeast Tiwi. With this
diversion in place, it is expected that deep reservoir pressures and liquid levels in the Matalibong area will stabilize or even recede
toward the 2006 values. Partial brine diversion from MatRidge to SEHBIS has been implemented on a continuous basis starting in
July 2013 but the amount diverted has not yet been sufficient to cause any appreciable reduction in the deep pressures and more
diversion is necessary. The impact on Matalibong production is also not yet clear. Modeling of the downhole pressure response
indicates that injection would need to be reduced by more than 50% to cause deep pressures to decline appreciably.
1. INTRODUCTION
The Tiwi Geothermal Field (Menzies et al., 2010a) is located on the northeast flank of Mt. Malinao in Albay Province, Philippines,
approximately 350 km southeast of Manila (Figure 1). Commercial operation began on May 15, 1979 with the start-up of the first
National Power Corporation (NPC) 55 MWe unit and over the next three years, the installed capacity was increased to 330 MWe.
The field has been affected by a number of resource management challenges (Figure 2), including meteoric-water influx, pockets of
high non-condensible gas (NCG) concentrations, injection breakthrough, production of acid fluids, scaling and corrosion (Barker et
al., 1990; Gambill and Beraquit, 1993; Sugiaman et al., 2004). Despite these difficulties, the field has provided steam to the power
plants for 35 years (Figure 3). Gross generation has averaged 160 MWe over those 35 years and a total of 49.5 TWhrs of electricity
has been provided to the national grid up to the end of 2013, offsetting the importation of 74 million barrels of oil (or equivalent
fuel). Philippine Geothermal Production Company (PGPC), the exclusive service contractor for supplying steam from Tiwi, is
committed to harness in a sustainable and efficient manner the Philippines’ geothermal resources to provide clean, renewable, and
reliable geothermal energy.
Figure 1 shows the location and layout of the Tiwi field. The field has a known productive area of about 12 km2 and is divided into
four distinct geographic sectors: Naglagbong (Nag), Kapipihan (Kap), Matalibong (Mat) and Bariis (Bar). The current conceptual
model of the field is summarized in Figure 2. The heat sources are thought to be related to intrusions underlying small dacitic to
andesitic domes located south of the Kap and Bar sectors, as well as a broader heat source beneath Mt. Malinao. There appear to be
three upflow zones at initial-state (Bar, South Kap and Nag) within the Tiwi geothermal system. The upflows produce neutral-
chloride fluids with source temperatures ranging from 280 to 315°C (Na/K/Ca-Mg geothermometer), reservoir chloride
concentrations of between 4,000 to 5,200 ppm and 2.0 to 2.5 wt% NCG in steam. Acid-sulfate fluids are also present beneath the
flanks of Mt. Malinao to the south and southwest of the field, prevalent at depths near the top of the liquid reservoir.
The argillically-altered cap rock that overlies the productive reservoir is dominated by smectite clay. It is thinnest in the northeast
portion of the Nag sector where the reservoir top is shallowest. The reservoir top is also shallow in the Mat, South Kap and Bar
areas and deepens in the central part of the field between the Kagumihan and Tiwi faults.
Calibugan, Villaseñor, Menzies and Stark
2
Figure 1. A) Location Map of the Tiwi Geothermal Field; B) Major Production Sectors of the Field.
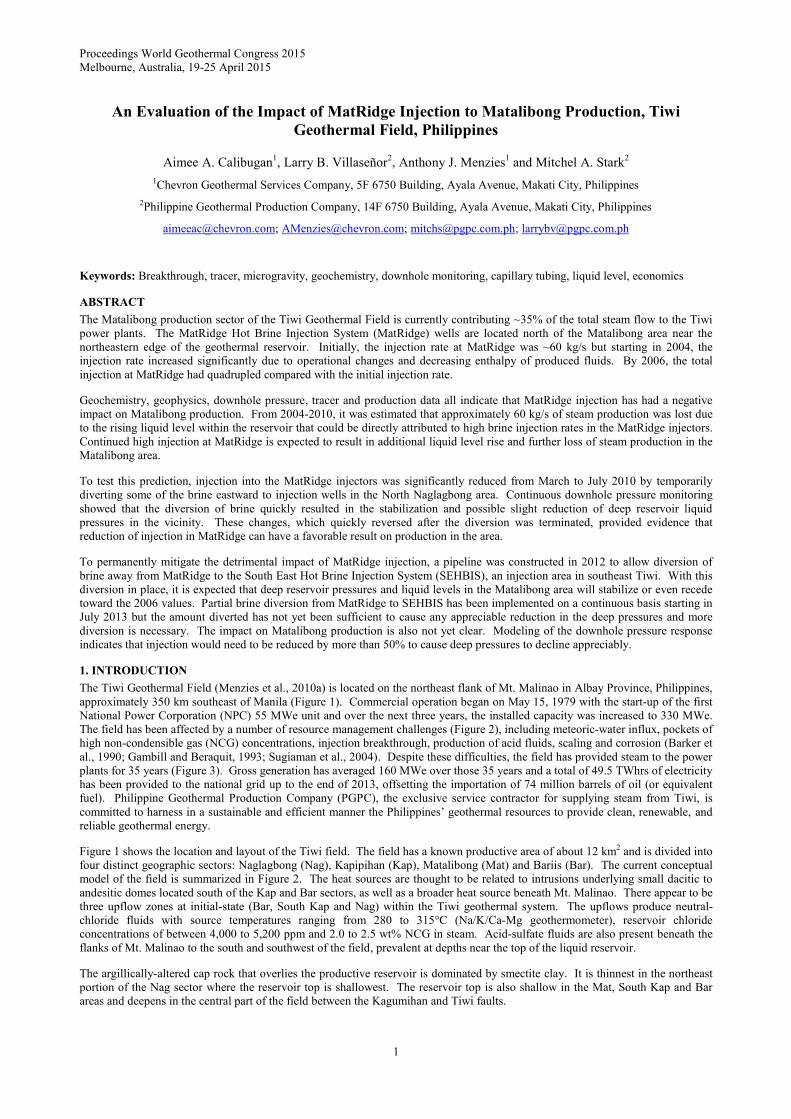
Figure 2. Map Showing the Current Tiwi Conceptual Model (modified from Sunio et al., 2005). Also shown are the major
hot brine injection systems (MatRidge and SEHBIS).
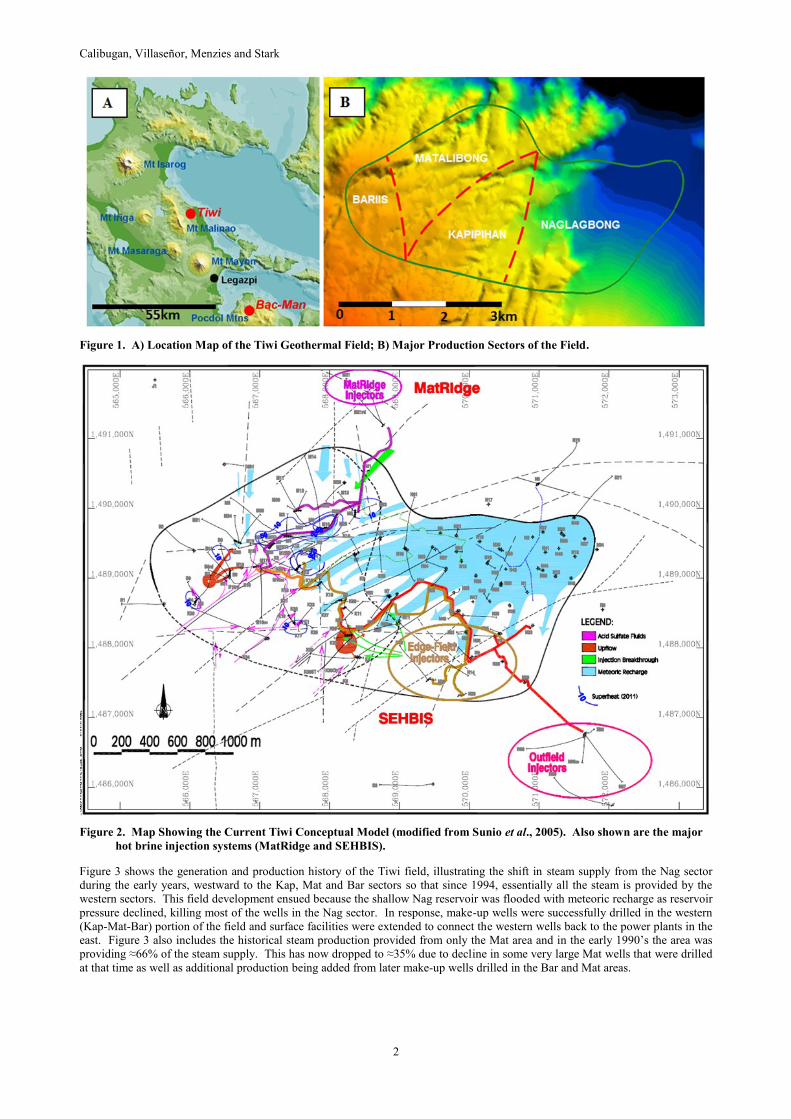
Figure 3 shows the generation and production history of the Tiwi field, illustrating the shift in steam supply from the Nag sector
during the early years, westward to the Kap, Mat and Bar sectors so that since 1994, essentially all the steam is provided by the
western sectors. This field development ensued because the shallow Nag reservoir was flooded with meteoric recharge as reservoir
pressure declined, killing most of the wells in the Nag sector. In response, make-up wells were successfully drilled in the western
(Kap-Mat-Bar) portion of the field and surface facilities were extended to connect the western wells back to the power plants in the
east. Figure 3 also includes the historical steam production provided from only the Mat area and in the early 1990’s the area was
providing ≈66% of the steam supply. This has now dropped to ≈35% due to decline in some very large Mat wells that were drilled
at that time as well as additional production being added from later make-up wells drilled in the Bar and Mat areas.
Calibugan, Villaseñor, Menzies and Stark
3
Figure 3: Generation and Steam Production History of Tiwi Geothermal Field (T – generation curtailments due to typhoons).
The injection history of Tiwi has been driven by the shifting location of production and by attempting to avoid detrimental effects
on the reservoir. As production shifted from the Nag area to the west, the brine from the eastern production wells continued to be
injected to the Southeast Hot Brine Injection System (SEHBIS), while the western wells initially used Mat-21 as a “cold” brine
injection well. Mat-21 was later converted to a “hot” brine injector and is now part of the MatRidge Hot Brine Injection System
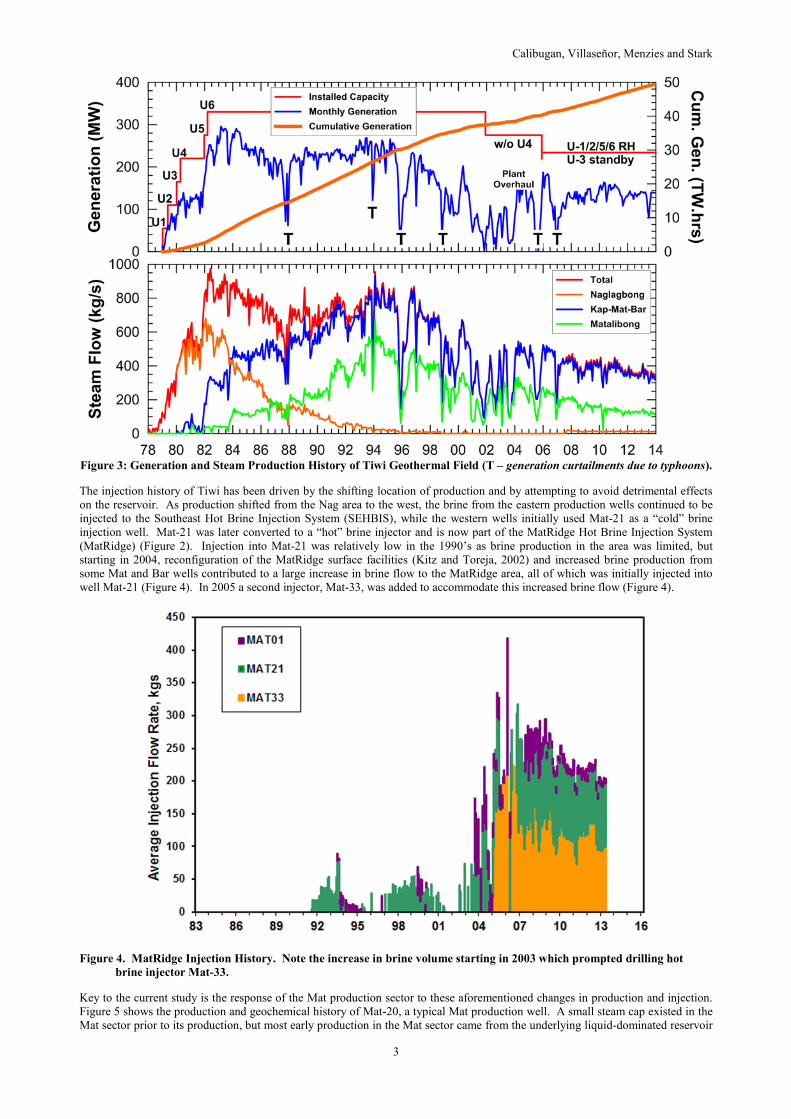
(MatRidge) (Figure 2). Injection into Mat-21 was relatively low in the 1990’s as brine production in the area was limited, but
starting in 2004, reconfiguration of the MatRidge surface facilities (Kitz and Toreja, 2002) and increased brine production from
some Mat and Bar wells contributed to a large increase in brine flow to the MatRidge area, all of which was initially injected into
well Mat-21 (Figure 4). In 2005 a second injector, Mat-33, was added to accommodate this increased brine flow (Figure 4).
Figure 4. MatRidge Injection History. Note the increase in brine volume starting in 2003 which prompted drilling hot
brine injector Mat-33.
Key to the current study is the response of the Mat production sector to these aforementioned changes in production and injection.
Figure 5 shows the production and geochemical history of Mat-20, a typical Mat production well. A small steam cap existed in the
Mat sector prior to its production, but most early production in the Mat sector came from the underlying liquid-dominated reservoir
Calibugan, Villaseñor, Menzies and Stark
4
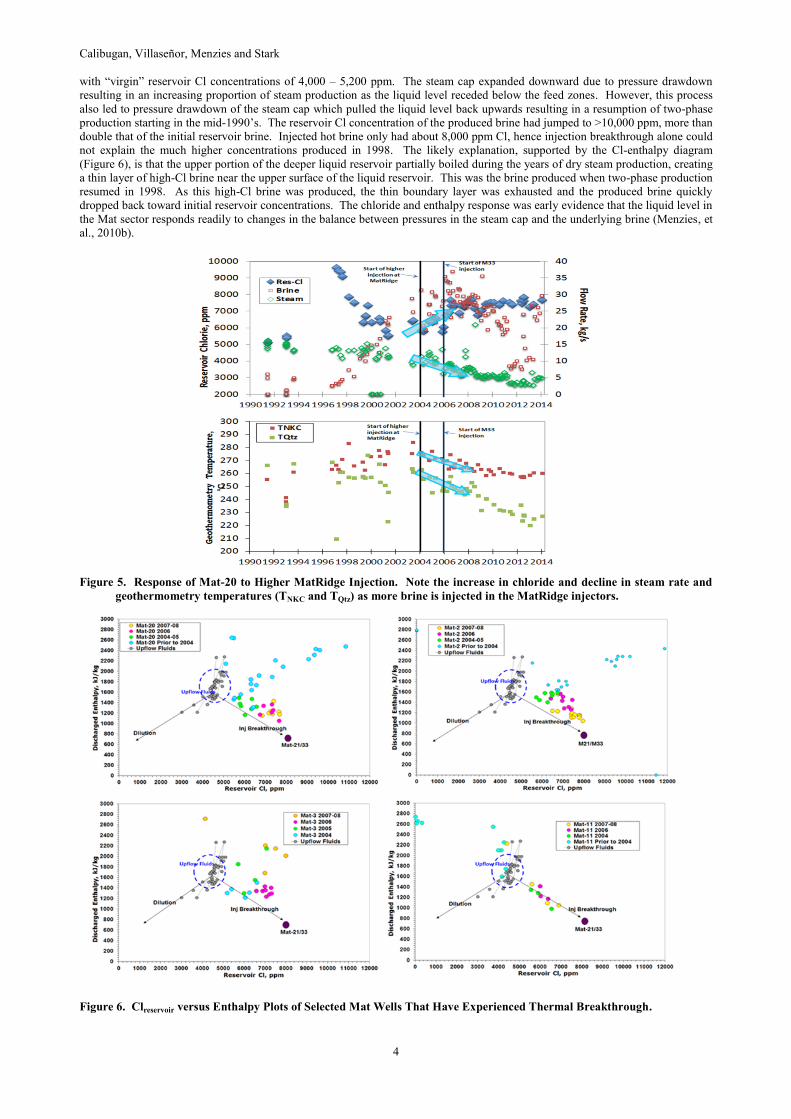
with “virgin” reservoir Cl concentrations of 4,000 – 5,200 ppm. The steam cap expanded downward due to pressure drawdown
resulting in an increasing proportion of steam production as the liquid level receded below the feed zones. However, this process
also led to pressure drawdown of the steam cap which pulled the liquid level back upwards resulting in a resumption of two-phase
production starting in the mid-1990’s. The reservoir Cl concentration of the produced brine had jumped to >10,000 ppm, more than
double that of the initial reservoir brine. Injected hot brine only had about 8,000 ppm Cl, hence injection breakthrough alone could
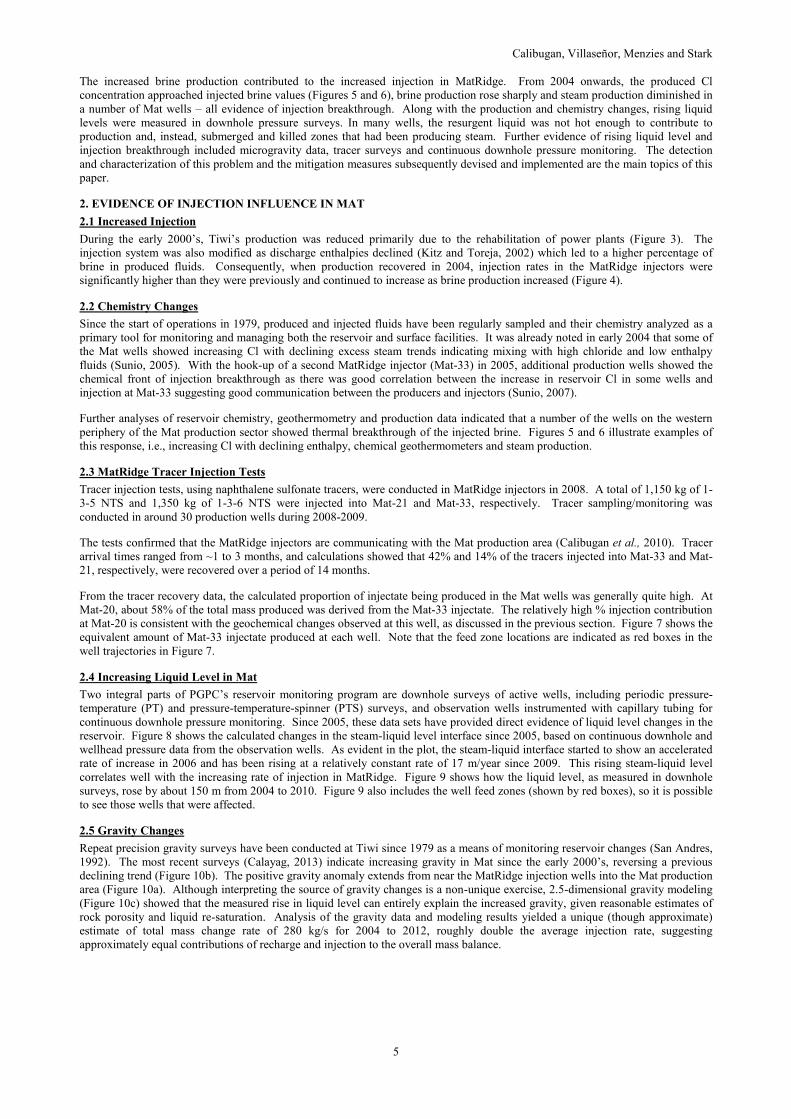
not explain the much higher concentrations produced in 1998. The likely explanation, supported by the Cl-enthalpy diagram
(Figure 6), is that the upper portion of the deeper liquid reservoir partially boiled during the years of dry steam production, creating
a thin layer of high-Cl brine near the upper surface of the liquid reservoir. This was the brine produced when two-phase production
resumed in 1998. As this high-Cl brine was produced, the thin boundary layer was exhausted and the produced brine quickly
dropped back toward initial reservoir concentrations. The chloride and enthalpy response was early evidence that the liquid level in
the Mat sector responds readily to changes in the balance between pressures in the steam cap and the underlying brine (Menzies, et
al., 2010b).
Figure 5. Response of Mat-20 to Higher MatRidge Injection. Note the increase in chloride and decline in steam rate and
geothermometry temperatures (TNKC and TQtz) as more brine is injected in the MatRidge injectors.
Figure 6. Clreservoir versus Enthalpy Plots of Selected Mat Wells That Have Experienced Thermal Breakthrough.
Calibugan, Villaseñor, Menzies and Stark
5
The increased brine production contributed to the increased injection in MatRidge. From 2004 onwards, the produced Cl
concentration approached injected brine values (Figures 5 and 6), brine production rose sharply and steam production diminished in
a number of Mat wells – all evidence of injection breakthrough. Along with the production and chemistry changes, rising liquid
levels were measured in downhole pressure surveys. In many wells, the resurgent liquid was not hot enough to contribute to
production and, instead, submerged and killed zones that had been producing steam. Further evidence of rising liquid level and
injection breakthrough included microgravity data, tracer surveys and continuous downhole pressure monitoring. The detection
and characterization of this problem and the mitigation measures subsequently devised and implemented are the main topics of this
paper.
2. EVIDENCE OF INJECTION INFLUENCE IN MAT
2.1 Increased Injection
During the early 2000’s, Tiwi’s production was reduced primarily due to the rehabilitation of power plants (Figure 3). The
injection system was also modified as discharge enthalpies declined (Kitz and Toreja, 2002) which led to a higher percentage of
brine in produced fluids. Consequently, when production recovered in 2004, injection rates in the MatRidge injectors were
significantly higher than they were previously and continued to increase as brine production increased (Figure 4).
2.2 Chemistry Changes
Since the start of operations in 1979, produced and injected fluids have been regularly sampled and their chemistry analyzed as a
primary tool for monitoring and managing both the reservoir and surface facilities. It was already noted in early 2004 that some of
the Mat wells showed increasing Cl with declining excess steam trends indicating mixing with high chloride and low enthalpy
fluids (Sunio, 2005). With the hook-up of a second MatRidge injector (Mat-33) in 2005, additional production wells showed the
chemical front of injection breakthrough as there was good correlation between the increase in reservoir Cl in some wells and
injection at Mat-33 suggesting good communication between the producers and injectors (Sunio, 2007).
Further analyses of reservoir chemistry, geothermometry and production data indicated that a number of the wells on the western
periphery of the Mat production sector showed thermal breakthrough of the injected brine. Figures 5 and 6 illustrate examples of
this response, i.e., increasing Cl with declining enthalpy, chemical geothermometers and steam production.
2.3 MatRidge Tracer Injection Tests
Tracer injection tests, using naphthalene sulfonate tracers, were conducted in MatRidge injectors in 2008. A total of 1,150 kg of 1-
3-5 NTS and 1,350 kg of 1-3-6 NTS were injected into Mat-21 and Mat-33, respectively. Tracer sampling/monitoring was
conducted in around 30 production wells during 2008-2009.
The tests confirmed that the MatRidge injectors are communicating with the Mat production area (Calibugan et al., 2010). Tracer
arrival times ranged from ~1 to 3 months, and calculations showed that 42% and 14% of the tracers injected into Mat-33 and Mat-
21, respectively, were recovered over a period of 14 months.
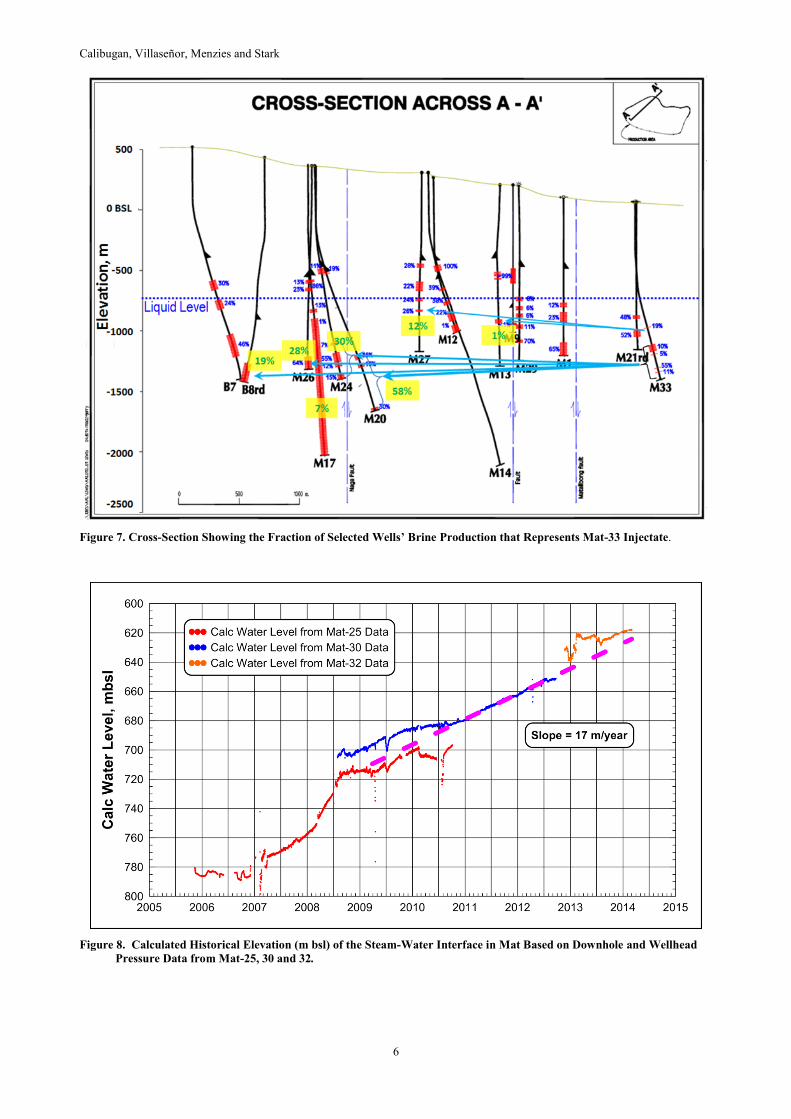
From the tracer recovery data, the calculated proportion of injectate being produced in the Mat wells was generally quite high. At
Mat-20, about 58% of the total mass produced was derived from the Mat-33 injectate. The relatively high % injection contribution
at Mat-20 is consistent with the geochemical changes observed at this well, as discussed in the previous section. Figure 7 shows the
equivalent amount of Mat-33 injectate produced at each well. Note that the feed zone locations are indicated as red boxes in the
well trajectories in Figure 7.
2.4 Increasing Liquid Level in Mat
Two integral parts of PGPC’s reservoir monitoring program are downhole surveys of active wells, including periodic pressure-
temperature (PT) and pressure-temperature-spinner (PTS) surveys, and observation wells instrumented with capillary tubing for
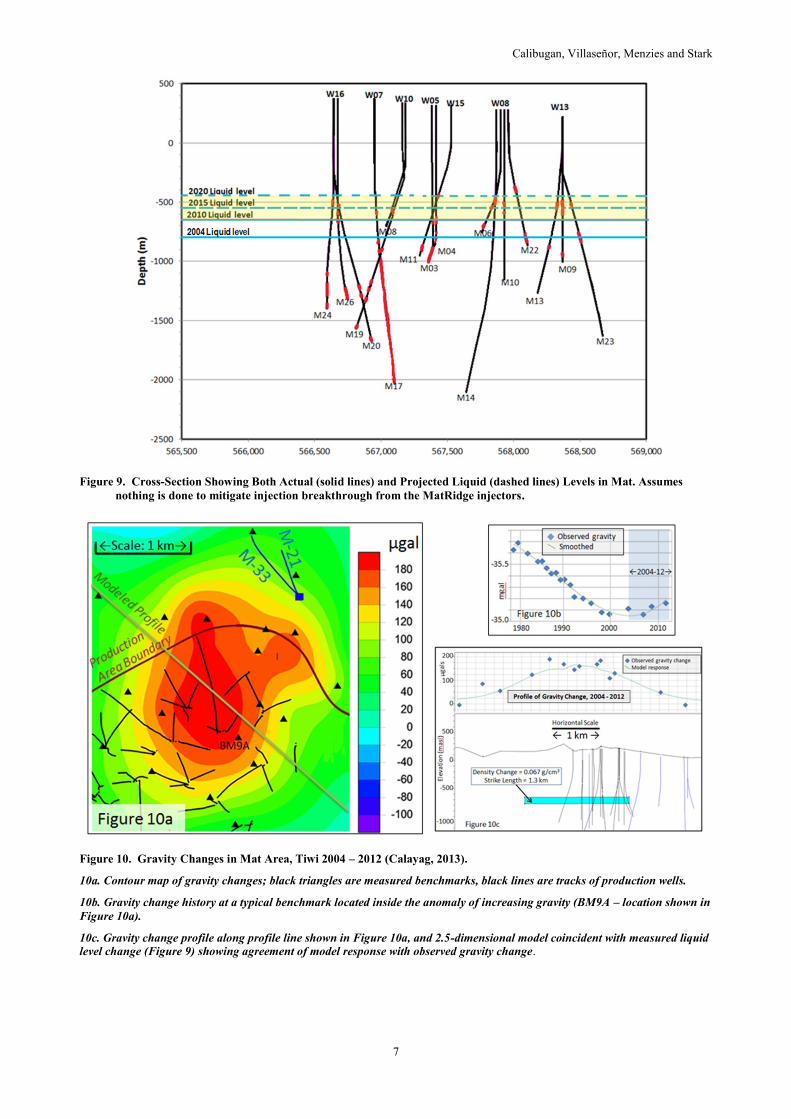
continuous downhole pressure monitoring. Since 2005, these data sets have provided direct evidence of liquid level changes in the
reservoir. Figure 8 shows the calculated changes in the steam-liquid level interface since 2005, based on continuous downhole and
wellhead pressure data from the observation wells. As evident in the plot, the steam-liquid interface started to show an accelerated
rate of increase in 2006 and has been rising at a relatively constant rate of 17 m/year since 2009. This rising steam-liquid level
correlates well with the increasing rate of injection in MatRidge. Figure 9 shows how the liquid level, as measured in downhole
surveys, rose by about 150 m from 2004 to 2010. Figure 9 also includes the well feed zones (shown by red boxes), so it is possible
to see those wells that were affected.
2.5 Gravity Changes
Repeat precision gravity surveys have been conducted at Tiwi since 1979 as a means of monitoring reservoir changes (San Andres,
1992). The most recent surveys (Calayag, 2013) indicate increasing gravity in Mat since the early 2000’s, reversing a previous
declining trend (Figure 10b). The positive gravity anomaly extends from near the MatRidge injection wells into the Mat production
area (Figure 10a). Although interpreting the source of gravity changes is a non-unique exercise, 2.5-dimensional gravity modeling
(Figure 10c) showed that the measured rise in liquid level can entirely explain the increased gravity, given reasonable estimates of
rock porosity and liquid re-saturation. Analysis of the gravity data and modeling results yielded a unique (though approximate)
estimate of total mass change rate of 280 kg/s for 2004 to 2012, roughly double the average injection rate, suggesting
approximately equal contributions of recharge and injection to the overall mass balance.
Calibugan, Villaseñor, Menzies and Stark
6
Figure 7. Cross-Section Showing the Fraction of Selected Wells’ Brine Production that Represents Mat-33 Injectate.
Figure 8. Calculated Historical Elevation (m bsl) of the Steam-Water Interface in Mat Based on Downhole and Wellhead
Pressure Data from Mat-25, 30 and 32.
Calibugan, Villaseñor, Menzies and Stark
7
Figure 9. Cross-Section Showing Both Actual (solid lines) and Projected Liquid (dashed lines) Levels in Mat. Assumes
nothing is done to mitigate injection breakthrough from the MatRidge injectors.
Figure 10. Gravity Changes in Mat Area, Tiwi 2004 – 2012 (Calayag, 2013).
10a. Contour map of gravity changes; black triangles are measured benchmarks, black lines are tracks of production wells.
10b. Gravity change history at a typical benchmark located inside the anomaly of increasing gravity (BM9A – location shown in
Figure 10a).
10c. Gravity change profile along profile line shown in Figure 10a, and 2.5-dimensional model coincident with measured liquid
level change (Figure 9) showing agreement of model response with observed gravity change.
Calibugan, Villaseñor, Menzies and Stark
8
3. STEAM LOSS DUE TO INJECTION
3.1 Actual Steam Loss
Because majority of the Mat wells produce mainly from the steam cap, the fairly modest liquid level increase had a significant
impact on production in many wells. As shown in Figure 9, permeable zones that previously produced dry steam were submerged
as the liquid level rose from 2004 to 2010. These submerged zones either reverted to two-phase production or quit flowing entirely.
The cumulative estimate of the actual injection-related steam losses in Mat from 2004-2010 is ~60 kg/s, equivalent to a 24-MW
loss in generation assuming a usage rate of 2.5 kg/s/MW. This estimate of loss is attributed solely to liquid level rise, and does not
include losses due to wellbore problems and fieldwide decline rate (Calibugan and Villaseñor, 2010).
3.2 Projected Future Steam Losses
The process of liquid level rise causing production loss was used to calculate and project losses for 2008 and beyond, assuming that
the liquid level continues to rise at the same rate and have the same impact on production, and that nothing is done to remediate the
problem. Figure 9 illustrates both actual (2010) and projected steam-liquid levels in the Mat area by 2015 and 2020. Also shown
are the various feed zones that, in the future, may become submerged by liquid and eventually lose production.
Analysis indicates that an additional ~40 kg/s of steam may be lost from 2011 to 2015 (Calibugan and Villaseñor, 2010). This
estimate was obtained by adding together the average steam production during 2009 to Feb 2010 of the affected wells, i.e. wells
with feed zones that would be below the projected liquid level by 2015. During 2016 to 2020, an additional ~37 kg/s of steam flow
may be lost as a result of continued liquid level rise.
4. MITIGATION OF STEAM LOSS IN MAT
The above projections of steam loss provided motivation to find ways to reduce injection into MatRidge and thereby stabilize the
liquid level in Mat and, hopefully, even cause it to subside. After evaluating several alternatives, it was decided to build a new
pipeline that would allow diversion of up to 125 kg/s of brine from MatRidge to the SEHBIS injection area.
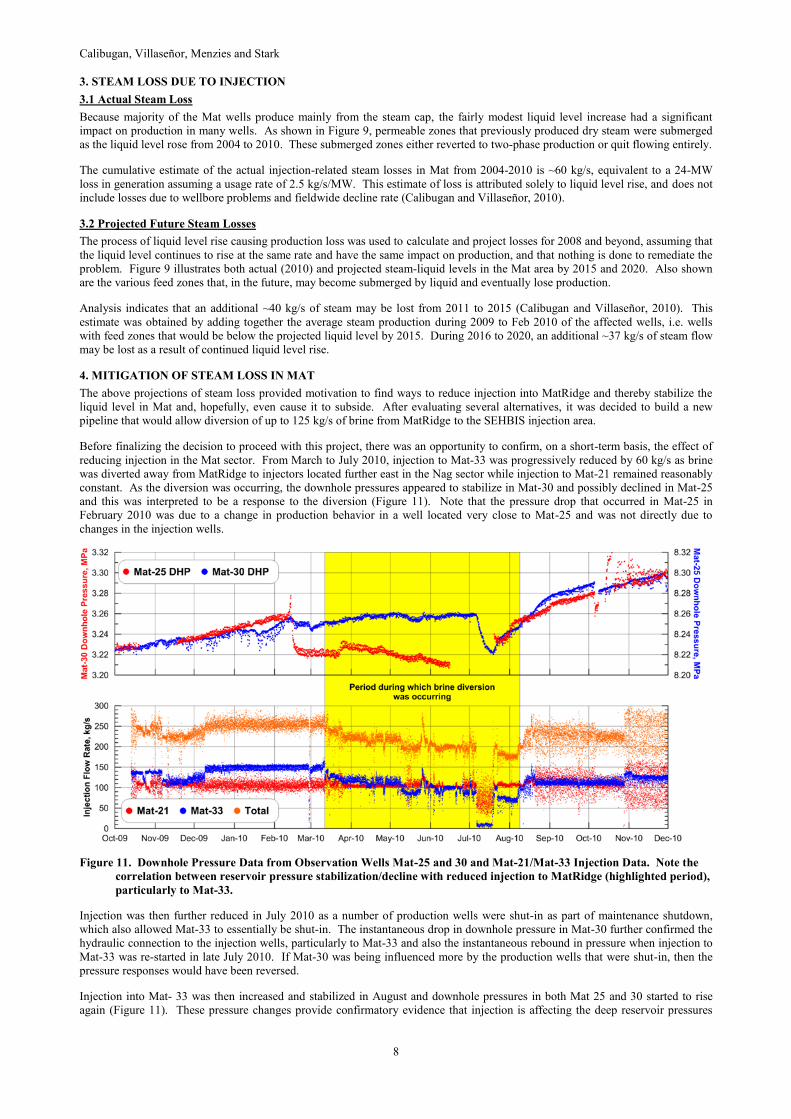
Before finalizing the decision to proceed with this project, there was an opportunity to confirm, on a short-term basis, the effect of
reducing injection in the Mat sector. From March to July 2010, injection to Mat-33 was progressively reduced by 60 kg/s as brine
was diverted away from MatRidge to injectors located further east in the Nag sector while injection to Mat-21 remained reasonably
constant. As the diversion was occurring, the downhole pressures appeared to stabilize in Mat-30 and possibly declined in Mat-25
and this was interpreted to be a response to the diversion (Figure 11). Note that the pressure drop that occurred in Mat-25 in
February 2010 was due to a change in production behavior in a well located very close to Mat-25 and was not directly due to
changes in the injection wells.
Figure 11. Downhole Pressure Data from Observation Wells Mat-25 and 30 and Mat-21/Mat-33 Injection Data. Note the
correlation between reservoir pressure stabilization/decline with reduced injection to MatRidge (highlighted period),
particularly to Mat-33.
Injection was then further reduced in July 2010 as a number of production wells were shut-in as part of maintenance shutdown,
which also allowed Mat-33 to essentially be shut-in. The instantaneous drop in downhole pressure in Mat-30 further confirmed the
hydraulic connection to the injection wells, particularly to Mat-33 and also the instantaneous rebound in pressure when injection to
Mat-33 was re-started in late July 2010. If Mat-30 was being influenced more by the production wells that were shut-in, then the
pressure responses would have been reversed.
Injection into Mat- 33 was then increased and stabilized in August and downhole pressures in both Mat 25 and 30 started to rise
again (Figure 11). These pressure changes provide confirmatory evidence that injection is affecting the deep reservoir pressures
Calibugan, Villaseñor, Menzies and Stark
9
and the removal of brine from MatRidge should therefore have a favorable effect on the liquid level in the Mat production area,
reinforcing the need to build the brine diversion pipeline.
4.1 Implementation of Mitigation Schemes
To divert brine away from MatRidge, a pipeline was constructed in 2011 - 2012 to link MatRidge to the Southeast Hot Brine
Injection System (SEHBIS). Since July 2013, 76 kg/s brine from MatRidge has been diverted through this pipeline to SEHBIS.
Monitoring and modeling (Menzies et al, 2011) has been focused on detecting the reservoir response to this diversion, and
determining if more diversion is needed to optimize the benefit.
Conversely, the diversion has increased injection in SEHBIS, so monitoring of injection effects in that eastern sector is also on-
going. In addition, some idle wells within the northeastern portion of the field are being considered for connection to the SEHBIS
not only to provide additional injection capacity for the diverted brine but also to increase the flexibility in distributing the brine
farther from the production sector.
5. CONCLUSIONS
Geochemistry, geophysics, downhole pressure and production data clearly indicate the impact of MatRidge injection to Mat
production. Maintaining the current injection rates at MatRidge will likely increase production loss due to a rising steam-liquid
level, which is assumed to be impacted by the rise in deep reservoir pressures associated with the high injection rates at Mat-21 and
Mat-33. The projected injection-related steam losses would total ~78 kg/s by the end of 2020 if no mitigation is undertaken.
The temporary brine diversion undertaken in March to July 2010 resulted in stabilization of deep reservoir pressures in the vicinity
of Mat-30 and, possibly, a reduction of pressure in Mat-25. Similar changes have been seen when injection has been reduced for
short periods since then. These changes provide supporting evidence that the removal of brine from MatRidge can have a favorable
result on the Mat production area.
Mitigation of injection influence in the Mat production area, by diverting brine away from MatRidge, is expected to stabilize or
result in a decline in deep reservoir pressures which should make the liquid level stabilize or, hopefully, descend. This will likely
reduce the projected steam losses in the Mat sector and possibly lead to the recovery of the deeper production zones of some Mat
wells. On the other hand, there is a risk that the diverted brine will be replaced by other sources of natural recharge. In this case,
the projected steam losses may either be the same as if the diversion project had not been done or could even be worse if the
inflowing groundwater is cooler than the returning injectate thus worsening the thermal effects of breakthrough.
The possible outcomes of the brine diversion project range from a net steam production gain of 115 kg/s (avoided future loss of 78
kg/s plus recovery of past losses of 37 kg/s) to no gain at all, or even a slight additional loss in production. Geochemical,
geophysical and downhole monitoring programs are in place to keep track of the reservoir response to brine diversion and
determine if the project has achieved its goals.
6. ACKNOWLEDGEMENTS
The authors would like to acknowledge the many scientists and engineers at PGPC and CGSC who have contributed to the better
understanding of the Matalibong production sector of the Tiwi Geothermal Field. Angel Calayag and Riki Irfan interpreted the
geophysical data and provided the figures for this publication. We would also like to thank PGPC and CGSC for encouraging and
allowing publication of this paper.
REFERENCES
Barker, B.J., Atkinson, P.G. and Powell, T.S. (1990): “Development and Production Performance of the Tiwi Field,” Proceedings,
Stanford Workshop on Geothermal Reservoir Engineering, Report SGP-TR-130, pp 245-251 (1990).
Calayag, A.B. (2013): “Tiwi Geophysics Update,” CGPHI Internal Presentation (2013).
Calibugan, A.A., Sunio, E.G. and Villaseñor, L.B. (2010): “MatRidge Tracer Injection Test Results,” CGPHI Internal Report
(2010).
Calibugan, A.A. and Villaseñor, L.B. (2010): “An Evaluation of the Impact of MatRidge Injection to North Mat Production,”
CGPHI Internal Memo (2010).
Gambill, D.T. and Beraquit, D.B. (1993): “Development History of the Tiwi Geothermal Field, Philippines,” Geothermics, 22, No.
5/6, pp 403-416 (1993).
Kitz, K., and Toreja, J.: “Maintaining Steam Purity in Response to Changing Reservoir Conditions in Tiwi, Philippines,”
Geothermal Resources Council Transactions, v. 26, p. 763-768 (2002).
Menzies, A.J., Villasenor, L.B. and Sunio, E.G. (2010a): “Tiwi Geothermal Field, Philippines: 30 Years of Commercial Operation,”
Proceedings, World Geothermal Congress 2010, Bali, Indonesia, 25-29 April 2010.
Menzies, A. J., Villasenor, L.B., Sunio, E.G. and Lim, W.Q. (2010b): “Characteristics of the Matalibong Steam Zone, Tiwi
Geothermal Field, Philippines,” Proceedings, World Geothermal Congress 2010, Bali, Indonesia, 25-29 April 2010.
Menzies, A.J., Co, C.K.D. and Sotunde, O. (2011): “Correlation and Modeling of Reservoir Pressure Changes in Tiwi Geothermal
Field, Republic of The Philippines,” Proceedings of the New Zealand Geothermal Workshop (2011).
San Andres, R.B. (1992): “Precision Gravity Monitoring at the Tiwi Geothermal Field, Philippines,” Proceedings of the New
Zealand Geothermal Workshop, pp 189 – 194 (1992).

Calibugan, Villaseñor, Menzies and Stark
10
Sugiaman, F.J., Sunio, E.G., Molling, P.A. and Stimac, J.A. (2004): “Geochemical Response to Production of the Tiwi Geothermal
Field, Philippines,” Geothermics, Vol. 33, No. 1/2, pp 57-86 (2004).
Sunio, E.G. (2005): “2004 Tiwi Annual Geochemical Review,” CGPHI Internal Report (2005).
Sunio, E.G. (2007): “Tiwi Mid-2007 Geochemical Monitoring Report,” CGPHI Internal Report (2007).
Sunio, E.G., Villasenor, L.B., Protacio, J.P., Regulacion, R.E., Batayola, G.J. (2005): “2004 Tiwi Conceptual Model Update, Part 2:
Exploitation State,” CGPHI Internal Report (2005).