Embed Size (px)
Citation preview
Development and Evaluation of Shallow Injection of Slurry into Ley
Lena Rodhe Department of Biometry and Engineering
Uppsala
Doctoral thesis Swedish University of Agricultural Sciences
Uppsala 2004

Acta Universitatis Agriculturae Sueciae
Agraria 482 ISSN 1401-6249 ISBN 91-576-6755-1 © 2004 Lena Rodhe, Uppsala Tryck: SLU Service/Repro, Uppsala 2004
Abstract Rodhe, L. 2004. Development and evaluation of shallow injection of slurry into ley. Doctoral dissertation ISSN 1401-6249. ISBN 91-576-6755-1 Shallow injection of slurry on grassland can reduce ammonia emissions compared to surface spreading and increase plant nitrogen utilisation. Other advantages include enhanced silage quality and lower odour. Disadvantages include higher investment costs, increased draught requirements and potential crop damage. The objective of this thesis was to determine appropriate techniques for slurry injection into ley that would minimise ammonia emissions, contamination of crops and energy inputs, while resulting in high plant utilisation of slurry nitrogen. Slurry injector performance was validated in field trials. Conventional slurry tankers with different types of injectors were used to shallow-inject (less than 0.05 m) slurry into open slots after the first cut. Slurry placement after spreading, ammonia volatilisation, yield and crop nitrogen uptake were measured and compared to the results of band spreading. In the first year, silage quality and an economic analysis were also included. Only one injector, with double disc tines, could place the slurry below the soil surface in all three soils tested. Ammonia release was on average 39% of the total ammoniacal nitrogen (TAN) applied, half the level with band spreading, but this did not result in higher dry matter (DM) yield or higher apparent nitrogen recovery (ANR) for the injector by the second cut. Despite inefficient injection, silage quality tended to be better than after band spreading. However, shallow injection was less financially viable. To find a tine that shallow-injected the slurry into closed slots on grassland, six different designs of tubulator tines were compared to double disc tines by measuring horizontal and vertical forces and ammonia emissions. The tubulator tine required significantly lower vertical forces to penetrate the soil and minimised ammonia losses at similar energy requirements to a conventional double disc injector. With appropriate tine design, slurry could be injected below the soil surface even in hard soil conditions and ammonia emissions minimised, but extra energy and financial investment were required. Key words: Slurry application, grassland, ley, shallow injection, band spreading, crop contamination, slurry in soil, ammonia emissions, yield, nitrogen uptake by plants, silage quality, economy. Author’s address: Lena Rodhe, JTI – Swedish Institute of Agricultural and Environmental Engineering, P.O.Box 7033, SE-750 07 Uppsala, Sweden. E-mail: [email protected]
Sammanfattning Ytmyllning av flytgödsel i vall kan minska ammoniakavgången och ge ökat kväveupptag i plantan jämfört med att sprida gödseln på markytan. Andra fördelar är förbättrad ensilagekvalitet och mindre lukt. Nackdelar kan vara ökad investeringskostnad och dragkraftsbehov samt risk för grödskador. Syftet med denna avhandling var att ta fram lämplig teknik för att mylla flytgödsel i slåttervall för att minimera ammoniakavgången, nedsmutsningen av grödan och energibehovet, samtidigt som den ger ett högt utnyttjande av kvävet i flytgödseln.
Ytmyllare för flytgödsel värderades i fältförsök. Konventionella spridartank-vagnar med olika typer av ytmyllare (myllningsdjup mindre än 0,05 m) användes för att placera flytgödsel i öppna skåror, s.k. öppen ytmyllning. Gödselns placering efter ytmyllning, ammoniakavgång, skörd och kväveupptag hos gröda mättes och jämfördes med bandspridning. Under första året ingick också studier av ensilagekvalitet och en ekonomisk analys. Endast en av de studerade ytmyllarna, utrustad med billar bestående av två vinklade skivtallrikar klarade av att placera flytgödseln under markytenivån på alla tre jordarna. Då avgick i medeltal 39% av ammoniumkvävet som spreds med flytgödseln som ammoniak, vilket var hälften av förlusten efter bandspridning. Den lägre ammoniakavgången med denna ytmyllare jämfört med bandspridning innebar dock inte någon skördeökning eller högre kväveupptag i andra skörd. Trots en bristfällig myllning, tenderade ensilagekvaliteten att vara högre än efter bandspridning. De ekonomiska simuleringarna visade dock att ytmyllningen var mindre lönsam än bandspridning.
I syfte att hitta en lämplig bill, som ytmyllar flytgödseln i täckta skåror, s.k. täckt ytmyllning utvecklades en tubulatorbill i sex olika utföranden. Tubulatorbillarna jämfördes med en skivbill vid mätning av horisontella och vertikala krafter på billarna och ammoniakavgång efter spridning. Tublulatorbillen krävde lägre krafter för att penetrera marken och minimerade ammoniakförlusterna vid motsvarande energiförbrukning som för skivbillen.
Sammanfattningsvis kan sägas, att vid lämpligt utförande på ytmyllningsbillen kan flytgödsel placeras i vallen i täckta skåror även under hårda markförhållanden. Detta innebär att ammoniakavgången minimeras, men att dragkraftsbehovet och investeringskostnaden ökar jämfört med bandspridning på markytan.
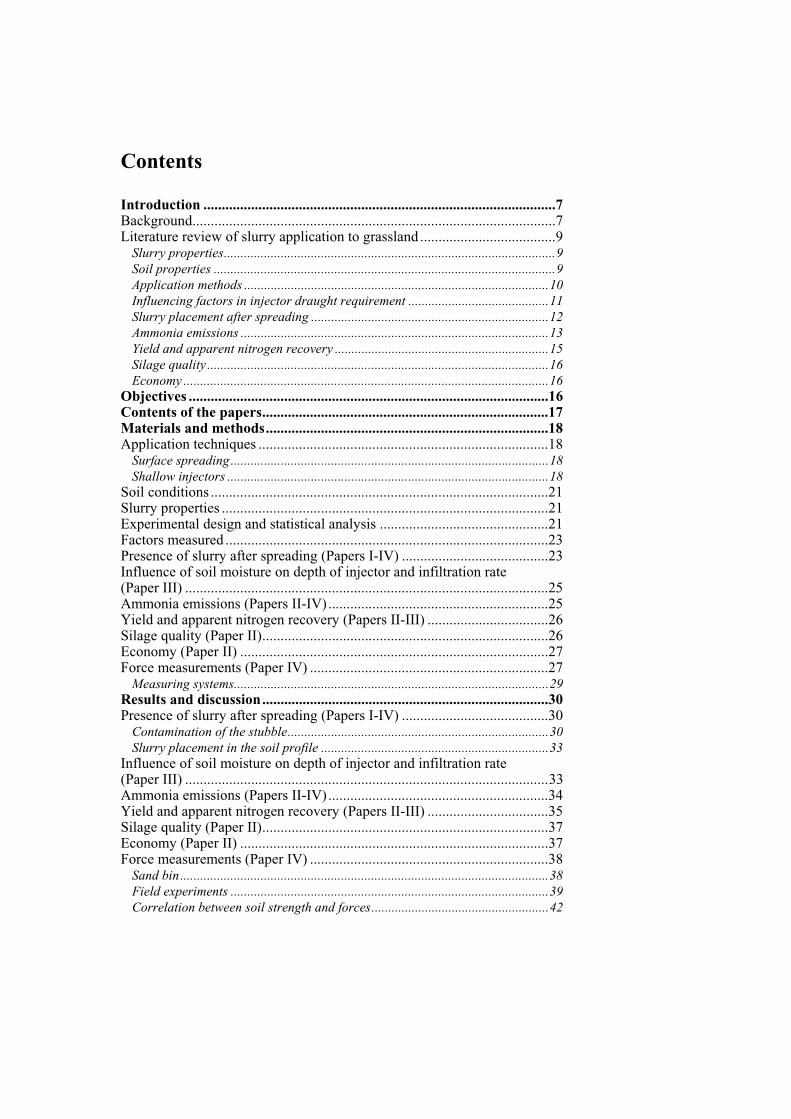
Contents
Introduction ................................................................................................7 Background...................................................................................................7 Literature review of slurry application to grassland .....................................9
Slurry properties...................................................................................................9 Soil properties ......................................................................................................9 Application methods ...........................................................................................10 Influencing factors in injector draught requirement ..........................................11 Slurry placement after spreading .......................................................................12 Ammonia emissions ............................................................................................13 Yield and apparent nitrogen recovery ................................................................15 Silage quality ......................................................................................................16 Economy .............................................................................................................16
Objectives ..................................................................................................16 Contents of the papers..............................................................................17 Materials and methods.............................................................................18 Application techniques ...............................................................................18
Surface spreading...............................................................................................18 Shallow injectors ................................................................................................18
Soil conditions ............................................................................................21 Slurry properties .........................................................................................21 Experimental design and statistical analysis ..............................................21 Factors measured ........................................................................................23 Presence of slurry after spreading (Papers I-IV) ........................................23 Influence of soil moisture on depth of injector and infiltration rate (Paper III) ...................................................................................................25 Ammonia emissions (Papers II-IV)............................................................25 Yield and apparent nitrogen recovery (Papers II-III) .................................26 Silage quality (Paper II)..............................................................................26 Economy (Paper II) ....................................................................................27 Force measurements (Paper IV) .................................................................27
Measuring systems..............................................................................................29 Results and discussion..............................................................................30 Presence of slurry after spreading (Papers I-IV) ........................................30
Contamination of the stubble..............................................................................30 Slurry placement in the soil profile ....................................................................33
Influence of soil moisture on depth of injector and infiltration rate (Paper III) ...................................................................................................33 Ammonia emissions (Papers II-IV)............................................................34 Yield and apparent nitrogen recovery (Papers II-III) .................................35 Silage quality (Paper II)..............................................................................37 Economy (Paper II) ....................................................................................37 Force measurements (Paper IV) .................................................................38
Sand bin..............................................................................................................38 Field experiments ...............................................................................................39 Correlation between soil strength and forces.....................................................42

General discussion.................................................................................... 43 General conclusions.................................................................................. 45 Future research ........................................................................................... 46 References ................................................................................................. 46 Acknowledgements................................................................................... 55

List of papers This thesis is based upon the following papers, referred to in the text by their Roman numerals.
I. Rodhe, L. (2003). Methods for determining the presence of slurry on the crop and in the upper soil layer after application to grassland. Bioresource technology 90(1), 81-88. Doi: 10.1016/S0960-8524(03)00092-0.
II. Rodhe, L. & Rammer, C. (2002). Application of slurry to ley by band spreading and injection methods. Biosystems Engineering 83(1), 107-118. Doi: 10.1006/bioe.2002.0097.
III. Rodhe, L. & Etana, A. Performance of slurry injectors compared with band spreading on three Swedish soils with ley. Submitted to Biosystems Engineering.
IV. Rodhe, L., Rydberg, T. & Gebresenbet, G. (2004). The influence of shallow injector design on ammonia emissions and draught requirement under different soil conditions. Biosystems Engineering, in press.
The published papers are reproduced by permission of the journals concerned.

7
Introduction
Background International agreements like the Gothenburg protocol (UNECE, 2004) are aimed at reducing global environmental problems such as eutrophication and acidification by reducing emissions of pollutants to air. For the EC15 countries, emission ceilings are set for certain atmospheric pollutants, among others NH3, to be attained by 2010 (Directive 2001/81/EC). The emission ceiling value for Sweden, according to Directive 2001/81/EC, is 57,000 tonnes ammonia per year. The Swedish Parliament has established 15 environmental quality objectives, such as "Clean air" and "Good-quality groundwater", to guide Sweden towards a sustainable society (Swedish EPA, 2002). During 2001, 53,800 tonnes of ammonia were released to air (SCB, 2003), whereof 85% originated from agriculture. The main sources of ammonia emissions in Sweden are manure storage and spreading of manure. Ammonia losses contribute both to eutrophication and acidification. The national goal for Sweden is to limit ammonia emissions per year to 51,700 tonnes by 2010, which means a reduction of at least 15% from the 1995 level (SCB, 2003).
On cattle farms in Sweden, ley is a dominant crop for hay or silage production. Grass requires high amounts of potassium, which together with phosphorus could very well be supplied by an annual application of 25 t manure ha-1 (Steineck et al., 2000a). Therefore it is both necessary, because of a lack of alternative land for application, and recommended from a plant nutrient view to apply cattle slurry and manure to ley (Steineck et al., 2000a). Swedish statistics (SCB, 2002) show that in the growing season of 2000/1, 49% of the leys in Sweden were fertilised with slurry or manure at an average rate of 27 t ha-1.
On the other hand, spreading of manure onto ley can lead to high losses of nitrogen as ammonia (Smith et al., 2000; Misselbrook et al., 2002). In addition, there is a risk for deteriorated quality of the fodder (Rammer et al., 1994; Rodhe, Salomon & Rammer, 1996). Malmqvist & Spörndly (1993) showed in a survey in Sweden that spreading of manure compared to mineral fertilisers on ley increases the risk for deterioration in milk quality. In Sweden and Denmark, farmers get a reduced price for milk if the content of spores is above certain limits (Arla Foods, 2003).
Farmers can influence the above-mentioned disadvantages by choice of spreading technique and time for the slurry application. Incorporation of the slurry into the ley reduces ammonia losses (Huijsmans, Hol & Hendriks, 2001; Misselbrook et al., 2002; Mattila & Joki-Tokola, 2003) and the bacterial contamination of plants (Lorenz & Steffens, 1997). Incorporation can also lead to reduced odour problems (Phillips, Pain & Klarenbeek 1991; Moseley et al., 1998).
In a crop, special devices are required in order to achieve an efficient incorporation. For grassland, there are shallow injectors available that incorporate the slurry into the upper soil level to a depth of less than 0.1 m. The injectors are not designed to work for all soil conditions and, especially in dry and hard soils,
8
the injectors do not penetrate to a sufficient depth (Smith et al., 2000; Hansen, Sommer & Madsen, 2003) and reduction of ammonia losses is consequently not achieved. Injection tines on ley can cause crop damage (Prins & Snijders, 1987; Rees et al., 1993) and the use of injectors increases the energy required for applying the slurry compared to spreading on the soil surface (Hansen, Sommer & Madsen, 2003). Incorporation can also mean an increase in greenhouse gases such as N2O and CH4 compared with surface spreading (Thompson, Ryden & Lockyer, 1987; Flessa & Beese, 2000; Wulf et al., 2001). Table 1 gives an overview of the advantages and disadvantages associated with incorporation of slurry into ley with an injector compared with surface spreading. Table 1. Advantages and disadvantages associated with incorporation of slurry into ley with an injector compared to surface spreading
Advantages Disadvantages Lower ammonia emissions Increased draught requirements Higher N-utilisation by plants Higher costs for spreading Enhanced silage quality Risk of crop damage Lower odour emissions Risk of increased N2O and CH4 emissions
Alternative methods to improve the incorporation of surface-spread slurry or
manure, such as irrigation after spreading (Rodhe, Salomon, & Rammer, 1996; Lorenz & Steffens, 1997), have often proven not to be very efficient in limiting the ammonia losses or improving silage quality. However, dilution of the slurry (Morken, 1992; Frost, 1994) can reduce the ammonia emissions after spreading to grassland but consequently increase the volume of effluent to be spread.
On ley, recommended seasonal times for application of slurry are in spring or to individual harvests (Steineck et al., 2000a). Spreading in autumn is also practised (SCB, 2002). Spring can be a busy period, leading to costs for timeliness (de Toro & Hansson, 2004), and there is also a risk of soil compaction caused by heavy tankers on wet soils (Arvidsson & Håkansson, 1991; Etana, 1995). Therefore, after the first or second cut could be desirable times for slurry spreading on ley. On these occasions, the preceding harvest period has often been dry and relatively warm and the soil is compacted by traffic. From a hygiene point of view, the time period between spreading and harvest should be as long as possible (FAO, 1985). Accordingly, slurry should preferably be spread soon after cutting. However, the stubble height is then too low to protect the slurry against sun radiation and wind (Sommer et al., 1997). This means that techniques for incorporation into grassland are needed, especially at these spreading times, in order to avoid high ammonia losses. Dry and hard soil conditions place high demands on the performance of the injectors to achieve sufficient incorporation. Consequently, there is a need for a reliable technique that ensures adequate incorporation of the slurry into ley, even in hard soil conditions.
9
Literature review of slurry application to grassland At spreading of slurry, there are interactions between the components slurry, soil, and application technique. The properties of each of these components are important for the spreading result (Malgeryd & Wetterberg, 1996; Smith et al., 2000; Sommer, Hansen & Søgaard, 2004). Slurry properties
Slurry properties of interest at spreading can be divided into chemical, physical and hygiene properties. The chemical content concerns mainly plant macro-nutrients such as nitrogen (N), phosphorus (P), and potassium (K), but also micro-nutrients such as manganese (Mn), zinc (Zn), and copper (Cu) (Steineck et al., 2000b). Steineck et al. (2000b) sampled and analysed the content of plant nutrients and trace elements in slurry originating from farms in different regions of Sweden with different production and manure management systems. Cattle slurry (n=15) in conventional production had on average 3.9 kg total-N, 1.8 kg ammonium nitrogen (NH4-N), 0.75 kg P and 4.0 kg K per tonne. In organic production, the contents were slightly lower. The nitrogen supply is one of the general decisive factors in crop production (Jansson & Persson, 1982). The NH4-N is easily available to plants, but the rest of the total-N is organically bound and must be mineralised to NH4
+-N or NH3-N (total ammoniacal nitrogen, TAN) before plants can utilise the nitrogen. However, TAN can be volatilised as ammonia under unfavourable conditions (Svensson, 1994; Sommer et al., 2003). After mineralisation, other microbiological processes in the soil can transform the TAN to NO3
- (nitrification), the NO3
- to N2 (denitrification) or immobilise it in microbial biomass (Jansson & Persson, 1982). In the process of ammonia volatilisation, the pH is of importance for the balance between dissolved NH4
+ and dissolved NH3 in the slurry (Sommer et al., 2003). With increased pH, the proportion of NH3 increases and thereby amount of N lost through volatilisation.
It is important to know the physical properties of the soil when deciding which spreading technique to use (Malgeryd & Wetterberg, 1996). Appropriate physical properties for describing the slurry to be spread include dry matter (DM) content and fluidity (Malgeryd, 1994; CEN, 2002a). For solid manure, the properties DM content and bulk density give a good description (Malgeryd, 1994; CEN, 2002b).
The content of bacteria in slurry can show its pathogenicity and the risk for fodder deterioration when spreading in fodder crops (Rammer, 1996a). Species like Clostridium are responsible for spoiling silage under anaerobic conditions (Gibson, 1965). These bacteria and their spores is found in manure but also in soil (Rammer, 1996a). Soil properties
The classification of arable soils in Sweden is presented in Eriksson, Andersson & Andersson (1999) according to the Swedish classification system (Ekström, 1927). According to this system, about 55% of Swedish arable soils are classified as clay soils, which means that more than 15% of the dry soil weight consists of particles less than 0.002 mm in diameter (Eriksson, Andersson & Andersson, 1999). The
10
arable soils in Sweden are mainly young soils (Inceptisols) and swelling clay soils (Vertisols) according to Brady & Weil (2002) or in other words glacial and post-glacial sediments of different origins and characteristics (Steineck et al., 2001).
Physical properties relevant for describing the soil conditions at tillage, e.g. spreading of slurry with injector tines, include texture (FAO, 1990), water content, bulk density, cone index, plastic limit and soil strength (cohesion, angle of internal friction) (Kepner, Bainer & Barger, 1972; Palmer & Smith, 1988).
Penetrometers may be used to make an empirical assessment of soil strength (Campbell & O’Sullivan, 1991). The penetrometer measures the force required to push a steel cone into the soil and the result is presented in kiloPascal (kPa) (ASAE, 2004). It is an index of soil strength, also called the cone index (ASAE, 2004). The penetration resistance varies not only with the size and shape of the probe penetrating the soil, but also with a range of soil properties, including soil-metal friction, particle size distribution, water content, resistance to compression and shear strength, which includes both internal friction and cohesion (Campbell & O’Sullivan, 1991).
Palmer & Smith (1988) studied the soil parameters affecting tillage implements as reported in the literature and found that important soil parameter data were only included in a small percentage of cases: soil moisture (54%), dry bulk density (42%), cone index (11%) and plastic limit (16%).
A soil chemical property influencing the infiltration of slurry NH4+ into soil and
ammonia emission after spreading is the cation exchange capacity (CEC) (Sommer et al., 2003). CEC is defined as the sum total of exchangeable cations that a soil can absorb (Brady & Weil, 2002). NH4
+ adsorbs to negatively charged soil particles (mainly clays), reducing the transport of TAN into the soil. The pH of the slurry/soil mixture has an influence on the ammonia emission (Sommer et al., 2003), see section on slurry properties. Application methods
In principle, the spreading methods for slurry can be divided into surface spreading and injection. The slurry can be surface spread over the whole surface of an area of land or band spread in parallel bands (RAMIRAN, 2003). On average in Sweden, most of the slurry and urine is broadcast spread (64%) but an increasing amount was band spread (29%) in the 2000/1 growing season (SCB, 2002). Only 1% was applied with injectors during that season, the rest spread with unknown spreading method.
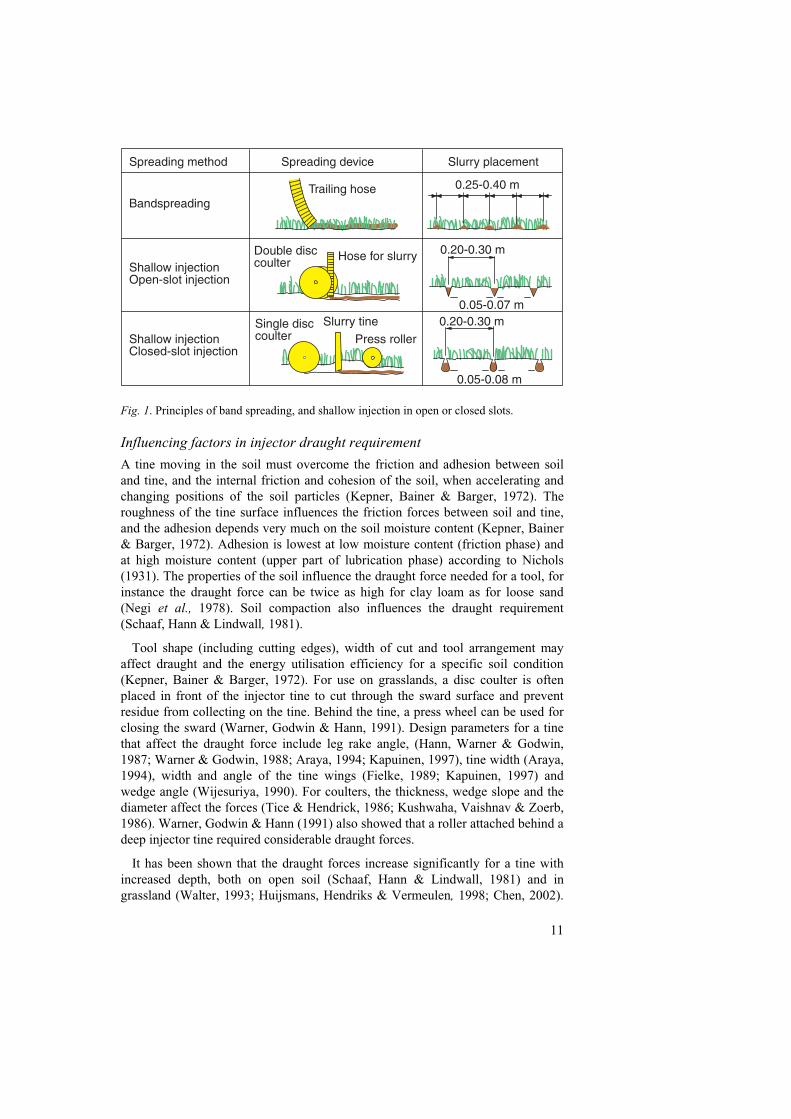
Injection can be described as shallow injection or deep injection. The present study includes just shallow injection, defined as incorporation into the upper soil level to a depth of less than 0.10 m. Fig. 1 illustrates shallow injection in open slots, where the soil is left open after filling with slurry, and in closed slots, where the soil is closed up after filling with slurry, e.g. by press rollers. For deep injection, the depth exceeds 0.1 m.
11
����������� ��������� ���� ��
����������� ������������ ���� ��
�������������������������� �� ���������������
������� ���� ����������� �� !�����������
"���������
���#���$���%����� �����
���#����&�������������
���#����'��
������� ��� ��� ������� ���(��� ��������������
Fig. 1. Principles of band spreading, and shallow injection in open or closed slots.
Influencing factors in injector draught requirement
A tine moving in the soil must overcome the friction and adhesion between soil and tine, and the internal friction and cohesion of the soil, when accelerating and changing positions of the soil particles (Kepner, Bainer & Barger, 1972). The roughness of the tine surface influences the friction forces between soil and tine, and the adhesion depends very much on the soil moisture content (Kepner, Bainer & Barger, 1972). Adhesion is lowest at low moisture content (friction phase) and at high moisture content (upper part of lubrication phase) according to Nichols (1931). The properties of the soil influence the draught force needed for a tool, for instance the draught force can be twice as high for clay loam as for loose sand (Negi et al., 1978). Soil compaction also influences the draught requirement (Schaaf, Hann & Lindwall, 1981).
Tool shape (including cutting edges), width of cut and tool arrangement may affect draught and the energy utilisation efficiency for a specific soil condition (Kepner, Bainer & Barger, 1972). For use on grasslands, a disc coulter is often placed in front of the injector tine to cut through the sward surface and prevent residue from collecting on the tine. Behind the tine, a press wheel can be used for closing the sward (Warner, Godwin & Hann, 1991). Design parameters for a tine that affect the draught force include leg rake angle, (Hann, Warner & Godwin, 1987; Warner & Godwin, 1988; Araya, 1994; Kapuinen, 1997), tine width (Araya, 1994), width and angle of the tine wings (Fielke, 1989; Kapuinen, 1997) and wedge angle (Wijesuriya, 1990). For coulters, the thickness, wedge slope and the diameter affect the forces (Tice & Hendrick, 1986; Kushwaha, Vaishnav & Zoerb, 1986). Warner, Godwin & Hann (1991) also showed that a roller attached behind a deep injector tine required considerable draught forces.
It has been shown that the draught forces increase significantly for a tine with increased depth, both on open soil (Schaaf, Hann & Lindwall, 1981) and in grassland (Walter, 1993; Huijsmans, Hendriks & Vermeulen, 1998; Chen, 2002).
12
The desired depth together with the tine design determines the maximum possible application rate into the soil without any slurry appearing on top of the soil surface. For the same application rate, a tine without wings has to be placed deeper than a winged tine (Warner & Godwin, 1988; Kapuinen, 1997; Moseley et al., 1998).
The draught forces can be expected to increase when the speed is increased because of soil acceleration (Kepner, Bainer & Barger, 1972). In open soil, the draught force for rigid tines increases linearly with speed for sandy clay loam and is linear with a discontinuity between 2 and 3 m/s for clay (Stafford, 1981). Others studies have not found an increase in forces for injector tines with increased speed (Walter, 1993; Rahman & Chen, 2001). Concerning furrow openers and cutting coulters (direct seed driller), the variations in speed of operation have very little effect on either draught or vertical force (Schaaf, Hann & Lindwall, 1981).
Desbiolles et al. (1997) established in a reference soil condition some comparative draught relationships (tool index I) between a standard tine and different tillage tools. From forces measured with the standard tine in fields, the draught for different tillage tools could be predicted in different fields. Desbiolles et al. (1999) also predicted the tillage implement draught using standard tine draught values estimated from cone penetration data. The error was somewhat higher by this procedure, but the cone penetrometer method provides quicker results in a practical manner than the standard tine alone (Desbiolles et al., 1999). Slurry placement after spreading
When the slurry is placed on the soil surface or in open slots, the infiltration of the slurry is important in reducing ammonia losses and improving crop uptake of nutrients. Limited studies have been carried out concerning the infiltration rate of slurry into arable soils, but it is much lower than that of water due to sealing effects (Davis, Faibank & Weissheit, 1973; De Tar, 1979; Miller, Robinson & Gillham, 1985) and water retention by the solid phase of the manure (Petersen et al., 2003). Barrington & Madramootoo (1989) described the profile after infiltration of slurry into soil as consisting of three distinct layers: a surface organic mat of manure particles too large to move through the soil pores, a manure-soil interface, where manure particles get lodged inside soil pores, and the underlying soil. They found that a clay loam soil accumulated more manure solids in the interface layer than a sand soil. However, infiltration rate is not a determining factor for the contact between the soil and the slurry as long as incorporation into the soil is possible, e.g. with a harrow directly after spreading. However, the redistribution of slurry in soil after injection is influenced by the injection method and the properties of the slurry (Petersen et al., 2003). Two trials have indicated that disc injection results in higher permeability of the slots compared with harrow tine injection (Petersen et al., 2003). Those authors also showed that cattle slurry was more concentrated around the injection slit than pig slurry after injection. Other studies with 15N-labelled ammonium in slurry confirm that mass transport and diffusion transport of labelled inorganic N compounds occurs both laterally and vertically from injection slots (Chadwick et al., 2001).
13
The performance of injectors for grassland has been evaluated with respect to soil disturbance (Negi et al., 1978; Warner, Godwin & Hann, 1991) and manure distribution after injection (Negi et al., 1978; Chen & Tessier, 2001). Chen & Tessier (2001) defined for injectors the tool capacity (tc) as the maximum amount of slurry that can be injected in a slot of 1 m length by the tool without occurrences of overflow slurry. In studies of shallow injectors, mainly in open slots, Hansen, Sommer & Madsen (2003) found that the volume of the slots was often too small to contain the volume of slurry applied and that the reduction in ammonia emissions was correlated to injection depth and volume of the slots created. Ammonia emissions
Methodologies Misselbrook, Pain & Genermont (2001) present a review of techniques for measuring ammonia emissions after land spreading of manure. The authors divide the methods into two main groups:
1. Micrometeorological methods 2. Enclosed methods - chamber methods.
The most common methods used according to Misselbrook, Pain & Genermont (2001) are micrometeorological mass balance (IHF; Integrated Horizontal Flux) (Denmead, 1983), equilibrium concentration (JTI) (Svensson, 1994), both in Group 1, and wind tunnels (Lockyer, 1984) in Group 2. The micrometeorological mass balance method (IHF) is practised in large plots (circular plots with diameters around 40 m) and the other two methods in small plots (about 5 by 10 m2). According to Misselbrook, Pain & Genermont (2001), the micro-meteorological mass balance (IHF) is non-intrusive and integrates the emission rate over a large area, thereby accounting for any variations in source strength across the plot. Disadvantages are the requirement for large uniform areas of land, which may limit the number of plots and hence replication. For comparative studies, small plot experiments are suitable and the chamber methods can be used. Both the wind tunnel method and the equilibrium concentration method are relatively simple to operate, but interfere (the wind tunnels to a greater extent) with the microclimate in the plot (Misselbrook, Pain & Genermont, 2001). The equilibrium concentration method The equilibrium concentration method was developed at JTI in co-operation with IVL (Svensson & Ferm, 1993; Svensson, 1993; Svensson, 1994) and is mainly a method for small plots. It has been compared with the integrated horizontal flux technique and no significant differences between the measurement techniques have been found (Misselbrook & Hansen, 2001). Those authors concluded that the method is a practical and relatively inexpensive technique but needs care in preparation of the samplers, replicates of chambers and ambient samplers, and consideration to be given to the choice of exposure times. The method has been practised during more than 10 years at JTI (Svensson, 1994; Malgeryd, 1998; Rodhe & Karlsson, 2002; Rodhe, Richert Stintzing & Steineck, 2004) and also by several researchers around Europe (Morken & Sakshaug, 1997; Smith et al., 2000; Misselbrook & Hansen, 2001; Mattila & Joki-Tokola, 2003).
14
Influencing factors on ammonia (NH3) emissions In a review, Sommer & Hutchings (2001) compiled the factors directly affecting NH3 volatilisation from field-applied manures into four groups: 1) concentration of NH3 at manure surface, 2) transfer of NH3 from surface to atmosphere, 3) area of manure exposed, and 4) the time manure is exposed to air. With proper injection, the area and time of manure exposure can be minimised and therefore the influence from groups 1 and 2 can also be reduced. However, for surface spreading and injection into open slots, the slurry surface is in direct contact with the air. The concentration of NH3 at the liquid surface is primarily a function of the chemical and physical conditions within the manure. Temperature, manure DM-content, pH and NH4
+ concentration are important factors (Sommer, Olesen & Christensen, 1991; Bussink, Huijsmans & Ketelaars, 1994; Svensson, 1994; Vandré & Clemens, 1997). The transfer of NH3 from the air at the surface to the atmosphere is mainly a function of the local meteorological conditions, i.e. wind speed, surface roughness of field, crust formation or crop canopy size and complexity (Sommer & Hutchings, 2001). In the UK, Misselbrook, Nicholson & Chambers (2002) found in field experiments on ley that the most important variables influencing emissions were wind speed and slurry DM content. In addition, rainfall immediately following application reduced ammonia emissions from cattle slurry applied to grassland by approximately 50%. Huijsmans, Hol & Hendriks (2001) found that the volatilisation rate increased with an increase in TAN content of the manure, manure application rate, wind speed, radiation or air temperature. The influencing factors identified and their magnitude differed with the application technique. Grass height affected NH3 volatilisation when manure was applied in narrow bands (Sommer et al., 1997; Huijsmans, Hol & Hendriks, 2001). Sommer & Jacobsen (1999) studied the influence of soil moisture content on infiltration of NH4
+ and ammonia volatilisation in coarse loamy sand in the laboratory and found that low soil water content enhanced the infiltration of slurry liquid and hence the mass transport of NH4
+ into the soil, which meant a lower ammonia emission.
The cumulated NH3 volatilisation presented as a proportion of TAN in the applied slurry has been estimated by a Michaelis-Mententype equation as shown by Equation (1):
N(t) = Nmax (t/(t+Km)) (1)
where:
T is the time from start of experiment (h), N(t) is the cumulated NH3 volatilisation after t hours (NH3 lost as percentage of TAN applied) Nmax is the maximum NH3 loss as time approaches infinity, and Km (h) is the time when N(t) = ½Nmax (Husted, Jensen & Storgaard Jørgensen, 1991; Sommer & Ersbøll, 1994; Huijsmans, Hol & Hendriks, 2001). The ammonia volatilisation is highest during the first hours after application independent of spreading with broadcast spreader, band spreader or shallow injector (Huijsmans, Hol & Hendriks, 2001). As upwards of 50% of total emission can occur within the first few hours following application to grassland, differences in emission rates during this period can lead to appreciable differences in total cumulative emission (Misselbrook et al., 2002).
15
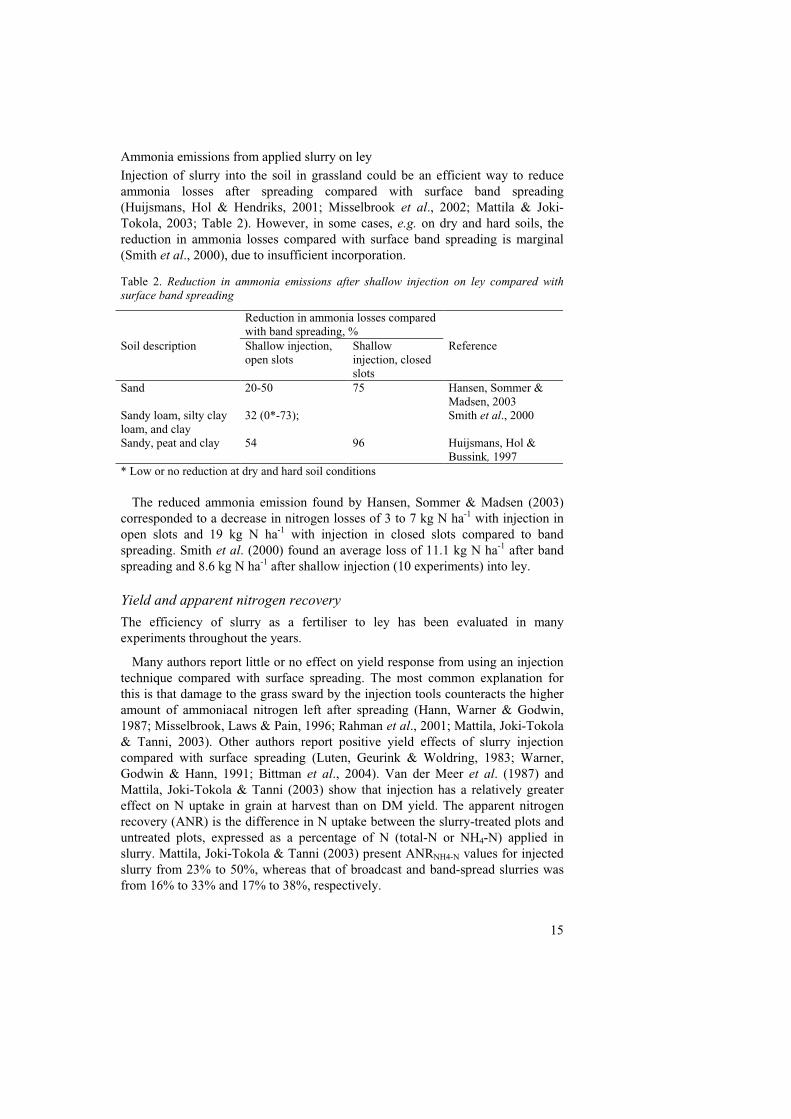
Ammonia emissions from applied slurry on ley Injection of slurry into the soil in grassland could be an efficient way to reduce ammonia losses after spreading compared with surface band spreading (Huijsmans, Hol & Hendriks, 2001; Misselbrook et al., 2002; Mattila & Joki-Tokola, 2003; Table 2). However, in some cases, e.g. on dry and hard soils, the reduction in ammonia losses compared with surface band spreading is marginal (Smith et al., 2000), due to insufficient incorporation. Table 2. Reduction in ammonia emissions after shallow injection on ley compared with surface band spreading
Reduction in ammonia losses compared with band spreading, %
Soil description Shallow injection, open slots
Shallow injection, closed slots
Reference
Sand 20-50 75 Hansen, Sommer & Madsen, 2003
Sandy loam, silty clay loam, and clay
32 (0*-73); Smith et al., 2000
Sandy, peat and clay 54 96 Huijsmans, Hol & Bussink, 1997
* Low or no reduction at dry and hard soil conditions
The reduced ammonia emission found by Hansen, Sommer & Madsen (2003) corresponded to a decrease in nitrogen losses of 3 to 7 kg N ha-1 with injection in open slots and 19 kg N ha-1 with injection in closed slots compared to band spreading. Smith et al. (2000) found an average loss of 11.1 kg N ha-1 after band spreading and 8.6 kg N ha-1 after shallow injection (10 experiments) into ley.
Yield and apparent nitrogen recovery
The efficiency of slurry as a fertiliser to ley has been evaluated in many experiments throughout the years.
Many authors report little or no effect on yield response from using an injection technique compared with surface spreading. The most common explanation for this is that damage to the grass sward by the injection tools counteracts the higher amount of ammoniacal nitrogen left after spreading (Hann, Warner & Godwin, 1987; Misselbrook, Laws & Pain, 1996; Rahman et al., 2001; Mattila, Joki-Tokola & Tanni, 2003). Other authors report positive yield effects of slurry injection compared with surface spreading (Luten, Geurink & Woldring, 1983; Warner, Godwin & Hann, 1991; Bittman et al., 2004). Van der Meer et al. (1987) and Mattila, Joki-Tokola & Tanni (2003) show that injection has a relatively greater effect on N uptake in grain at harvest than on DM yield. The apparent nitrogen recovery (ANR) is the difference in N uptake between the slurry-treated plots and untreated plots, expressed as a percentage of N (total-N or NH4-N) applied in slurry. Mattila, Joki-Tokola & Tanni (2003) present ANRNH4-N values for injected slurry from 23% to 50%, whereas that of broadcast and band-spread slurries was from 16% to 33% and 17% to 38%, respectively.
16
Silage quality
Manure contains organisms unfavourable to silage fermentation and slurry application increases the risk of contaminating the silage crop with such organisms (Rammer, 1996a). Applying solid manure in particular to ley results in reduced silage quality, e.g. high pH values, high ammonia N and butyric acid, and high numbers of Bacillus and Clostridium spores (Rammer et al., 1994). Harvesting method also has a strong influence on fermentation pattern and silage quality, as wilting and additives generally improve silage quality (Rammer et al., 1994). The spreading technique can also influence silage quality, e.g. it is improved by shallow injection compared to surface application (Lorenz & Steffens, 1998). Economy
The profitability of injection depends very much on the set conditions for the calculations, e.g. utilisation of slurry nitrogen, soil compaction, machinery and labour cost (Pahl et al., 2001; Huijsmans et al., 2004). Sometimes, the decrease in nitrogen loss through reduced ammonia emissions with injection is accounted as an income (Huijsmans et al., 2004). However, due to crop damage by the injector, no yield increase has been reported compared with surface application by some authors (Hann, Warner & Godwin, 1987; Misselbrook, Laws & Pain, 1996; Rahman et al., 2001; Mattila, Joki-Tokola & Tanni, 2003). Consequently, there is not always an income rise from additional yield. The fixed costs for machinery are reduced by the amount of slurry handled, and therefore with large amounts of slurry, a more advanced spreading equipment such as a boom with trailing hoses may be profitable (Brundin & Rodhe, 1994).
Objectives
The over-all objective of the present study was to determine appropriate methods for slurry injection on ley for different soil conditions. The methods had to minimise ammonia emissions, contamination of crops and energy inputs, while at the same time resulting in high utilisation of slurry nitrogen by plants.
Specific objectives were to:
I. Identify and develop methods for determining the placement of slurry after slurry application to ley (Paper I).
II. Evaluate injection methods in terms of slurry placement, ammonia emissions, crop yield, silage quality and economy (Papers II and III).
III. Determine an appropriate design of a tine for shallow-injection of the slurry into closed slots on ley. The tine had to have lower, or at least not higher, draught forces than tines that inject slurry into open slots and the ammonia emissions had to be small, close to zero (Paper IV).
17
Contents of the papers
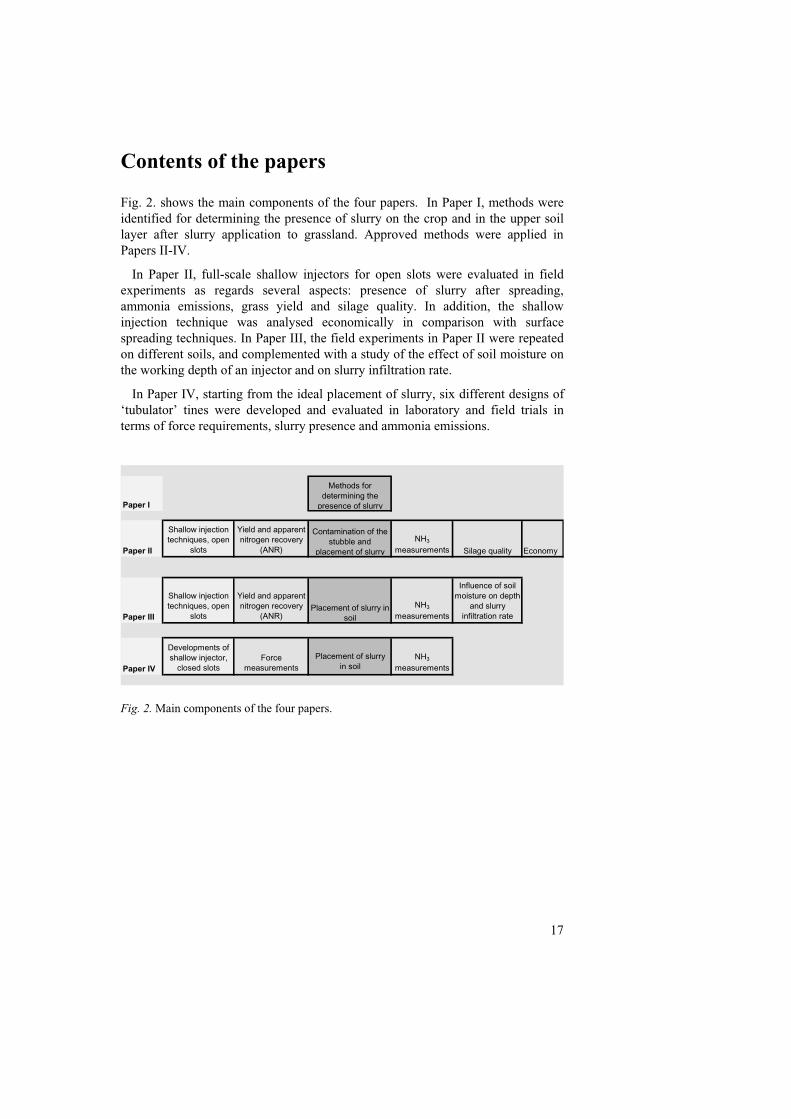
Fig. 2. shows the main components of the four papers. In Paper I, methods were identified for determining the presence of slurry on the crop and in the upper soil layer after slurry application to grassland. Approved methods were applied in Papers II-IV.
In Paper II, full-scale shallow injectors for open slots were evaluated in field experiments as regards several aspects: presence of slurry after spreading, ammonia emissions, grass yield and silage quality. In addition, the shallow injection technique was analysed economically in comparison with surface spreading techniques. In Paper III, the field experiments in Paper II were repeated on different soils, and complemented with a study of the effect of soil moisture on the working depth of an injector and on slurry infiltration rate.
In Paper IV, starting from the ideal placement of slurry, six different designs of ‘tubulator’ tines were developed and evaluated in laboratory and field trials in terms of force requirements, slurry presence and ammonia emissions.
Paper I
Paper II
Shallow injection techniques, open
slots
Yield and apparent nitrogen recovery
(ANR)NH3
measurements Silage quality Economy
Paper III
Shallow injection techniques, open
slots
Yield and apparent nitrogen recovery
(ANR)NH3
measurements
Influence of soil moisture on depth
and slurry infiltration rate
Paper IV
Developments of shallow injector,
closed slotsForce
measurementsNH3
measurementsPlacement of slurry in
soil
Placement of slurry insoil
Contamination of the stubble and
placement of slurry
Methods for determining the
presence of slurry
Placement of slurry in soil
Fig. 2. Main components of the four papers.
18
Materials and methods
A summary of the materials and methods used is presented below. More detailed descriptions are given in Papers I-IV.
Application techniques
Surface spreading
In Paper I, the contamination was studied by broadcasting or band-applying the slurry with a dosage device previously described by Svensson (1994). This application was carried out on small plots of 0.48 by 0.32 m2.
In the full-scale experiments (Papers II and III), band spreaders with trailing hoses (0.3 m centre-to-centre distance) were used for surface spreading. Band spreading was the reference technique compared with the different injector techniques. Shallow injectors
For shallow injection into open slots on a small scale, a section of a Holaras-injector (two tines 0.25 m apart) was used (Paper I, Fig. 4). With this injector, it was possible to adjust the application rate by changing the rotation speed of the dosage wheel. Furthermore, in the study on the influence of soil moisture on the performance of an injector and slurry infiltration rate (Paper III), the Holaras-injector was used to create slots and to study the working depth at different soil moisture contents.
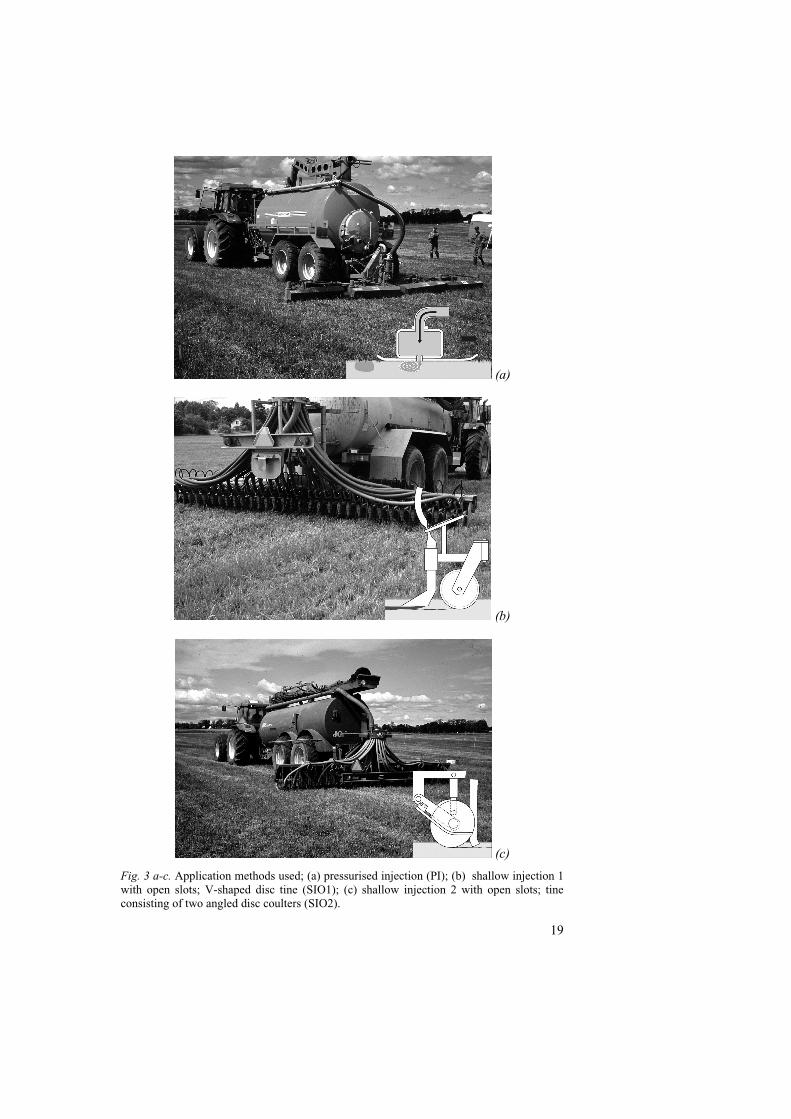
In Papers II and III, full-scale spreaders were used as shown in Fig. 3. The injectors SIO1 and SOI2 worked on the principle of shallow injection into open slots. In practice, the pressurised injection (PI) also worked as shallow injection into open slots as the slurry was partly still on the surface.
19
(a)
(b)
(c)
Fig. 3 a-c. Application methods used; (a) pressurised injection (PI); (b) shallow injection 1 with open slots; V-shaped disc tine (SIO1); (c) shallow injection 2 with open slots; tine consisting of two angled disc coulters (SIO2).
20
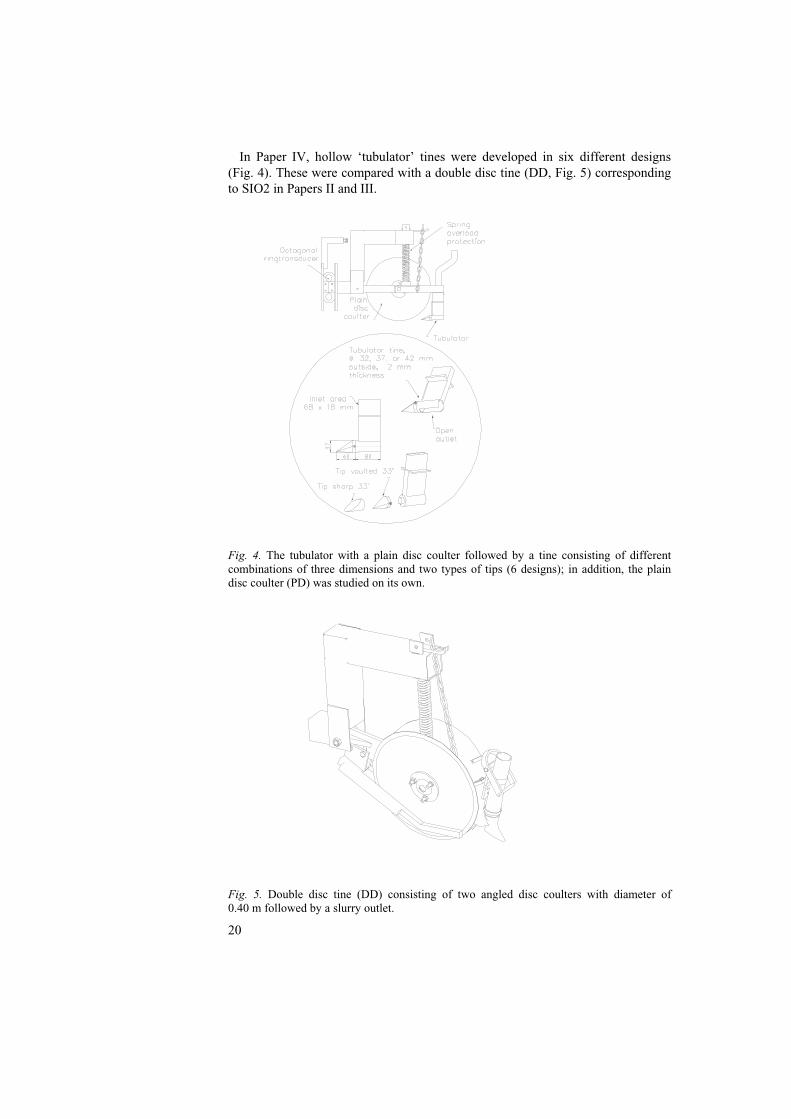
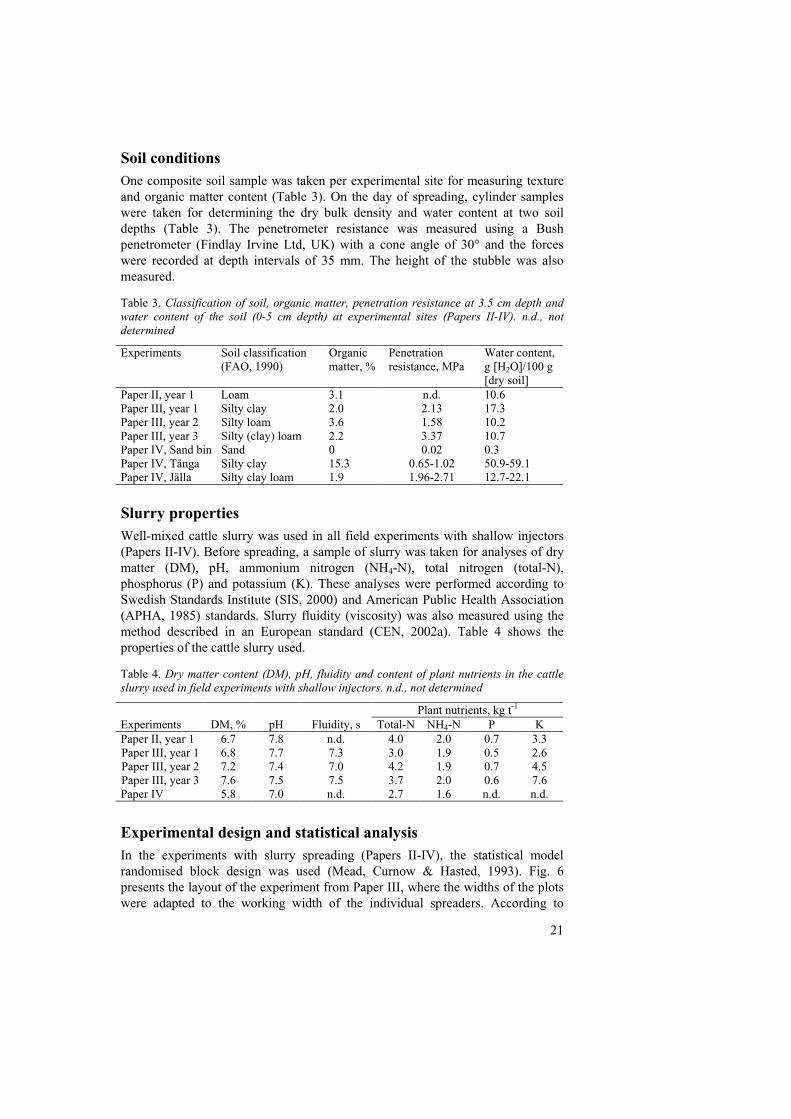
In Paper IV, hollow ‘tubulator’ tines were developed in six different designs (Fig. 4). These were compared with a double disc tine (DD, Fig. 5) corresponding to SIO2 in Papers II and III.
Fig. 4. The tubulator with a plain disc coulter followed by a tine consisting of different combinations of three dimensions and two types of tips (6 designs); in addition, the plain disc coulter (PD) was studied on its own.
Fig. 5. Double disc tine (DD) consisting of two angled disc coulters with diameter of 0.40 m followed by a slurry outlet.
21
Soil conditions One composite soil sample was taken per experimental site for measuring texture and organic matter content (Table 3). On the day of spreading, cylinder samples were taken for determining the dry bulk density and water content at two soil depths (Table 3). The penetrometer resistance was measured using a Bush penetrometer (Findlay Irvine Ltd, UK) with a cone angle of 30° and the forces were recorded at depth intervals of 35 mm. The height of the stubble was also measured. Table 3. Classification of soil, organic matter, penetration resistance at 3.5 cm depth and water content of the soil (0-5 cm depth) at experimental sites (Papers II-IV). n.d., not determined
Experiments Soil classification (FAO, 1990)
Organic matter, %
Penetration resistance, MPa
Water content, g [H2O]/100 g [dry soil]
Paper II, year 1 Loam 3.1 n.d. 10.6 Paper III, year 1 Silty clay 2.0 2.13 17.3 Paper III, year 2 Silty loam 3.6 1.58 10.2 Paper III, year 3 Silty (clay) loam 2.2 3.37 10.7 Paper IV, Sand bin Sand 0 0.02 0.3 Paper IV, Tånga Silty clay 15.3 0.65-1.02 50.9-59.1 Paper IV, Jälla Silty clay loam 1.9 1.96-2.71 12.7-22.1
Slurry properties Well-mixed cattle slurry was used in all field experiments with shallow injectors (Papers II-IV). Before spreading, a sample of slurry was taken for analyses of dry matter (DM), pH, ammonium nitrogen (NH4-N), total nitrogen (total-N), phosphorus (P) and potassium (K). These analyses were performed according to Swedish Standards Institute (SIS, 2000) and American Public Health Association (APHA, 1985) standards. Slurry fluidity (viscosity) was also measured using the method described in an European standard (CEN, 2002a). Table 4 shows the properties of the cattle slurry used. Table 4. Dry matter content (DM), pH, fluidity and content of plant nutrients in the cattle slurry used in field experiments with shallow injectors. n.d., not determined
Plant nutrients, kg t-1 Experiments DM, % pH Fluidity, s Total-N NH4-N P K Paper II, year 1 6.7 7.8 n.d. 4.0 2.0 0.7 3.3 Paper III, year 1 6.8 7.7 7.3 3.0 1.9 0.5 2.6 Paper III, year 2 7.2 7.4 7.0 4.2 1.9 0.7 4.5 Paper III, year 3 7.6 7.5 7.5 3.7 2.0 0.6 7.6 Paper IV 5.8 7.0 n.d. 2.7 1.6 n.d. n.d.
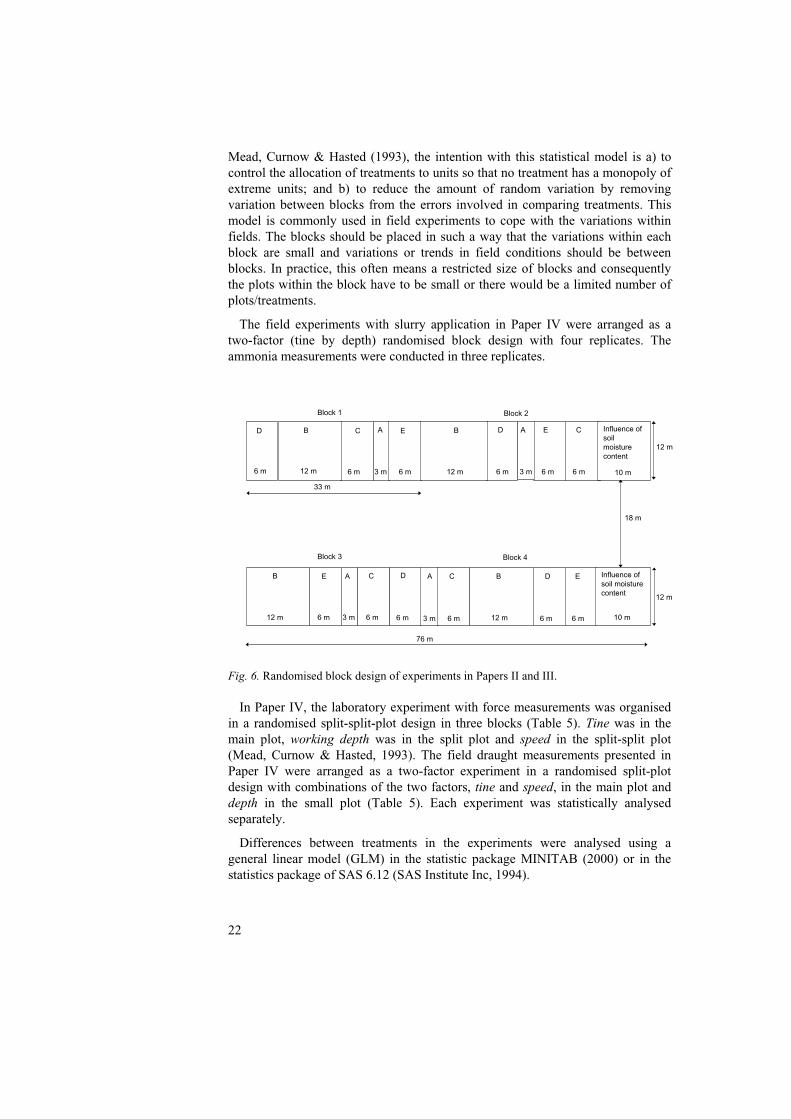
Experimental design and statistical analysis In the experiments with slurry spreading (Papers II-IV), the statistical model randomised block design was used (Mead, Curnow & Hasted, 1993). Fig. 6 presents the layout of the experiment from Paper III, where the widths of the plots were adapted to the working width of the individual spreaders. According to
22
Mead, Curnow & Hasted (1993), the intention with this statistical model is a) to control the allocation of treatments to units so that no treatment has a monopoly of extreme units; and b) to reduce the amount of random variation by removing variation between blocks from the errors involved in comparing treatments. This model is commonly used in field experiments to cope with the variations within fields. The blocks should be placed in such a way that the variations within each block are small and variations or trends in field conditions should be between blocks. In practice, this often means a restricted size of blocks and consequently the plots within the block have to be small or there would be a limited number of plots/treatments.
The field experiments with slurry application in Paper IV were arranged as a two-factor (tine by depth) randomised block design with four replicates. The ammonia measurements were conducted in three replicates.
6 m
D
6 m
C
6 m
E
6 m
E
3 m
A
12 m
B
6 m
D
Block 1
6 m
C
33 m
3 m12 m
B A
6 m
D
Block 2
6 m
E
12 m
B
6 m
C
6 m
D
3 m
A
6 m
E
3 m
A
6 m
C
18 m
10 m
Influence of soil moisture content
10 m
Influence of soil moisture content
12 m
12 m
76 m
Block 3 Block 4
12 m
B
Fig. 6. Randomised block design of experiments in Papers II and III.
In Paper IV, the laboratory experiment with force measurements was organised in a randomised split-split-plot design in three blocks (Table 5). Tine was in the main plot, working depth was in the split plot and speed in the split-split plot (Mead, Curnow & Hasted, 1993). The field draught measurements presented in Paper IV were arranged as a two-factor experiment in a randomised split-plot design with combinations of the two factors, tine and speed, in the main plot and depth in the small plot (Table 5). Each experiment was statistically analysed separately.
Differences between treatments in the experiments were analysed using a general linear model (GLM) in the statistic package MINITAB (2000) or in the statistics package of SAS 6.12 (SAS Institute Inc, 1994).
23
Factors measured In the experiments, several factors were often measured in each plot on the assumption that it would be possible to see relationships between different factors and hopefully to be able to explain results.
Factors measured in Papers II and III were presence of slurry after application, ammonia emissions, yield and nitrogen (N) uptake by the crop. In Paper II, silage quality was also included in the first year. In Paper III, the effect of soil moisture on the working depth of an injector and on the slurry infiltration rate was additionally studied in separate trials adjacent to the main experiment.
In Paper IV, the horizontal and vertical forces on tines, presence of slurry after application and ammonia emissions were included.
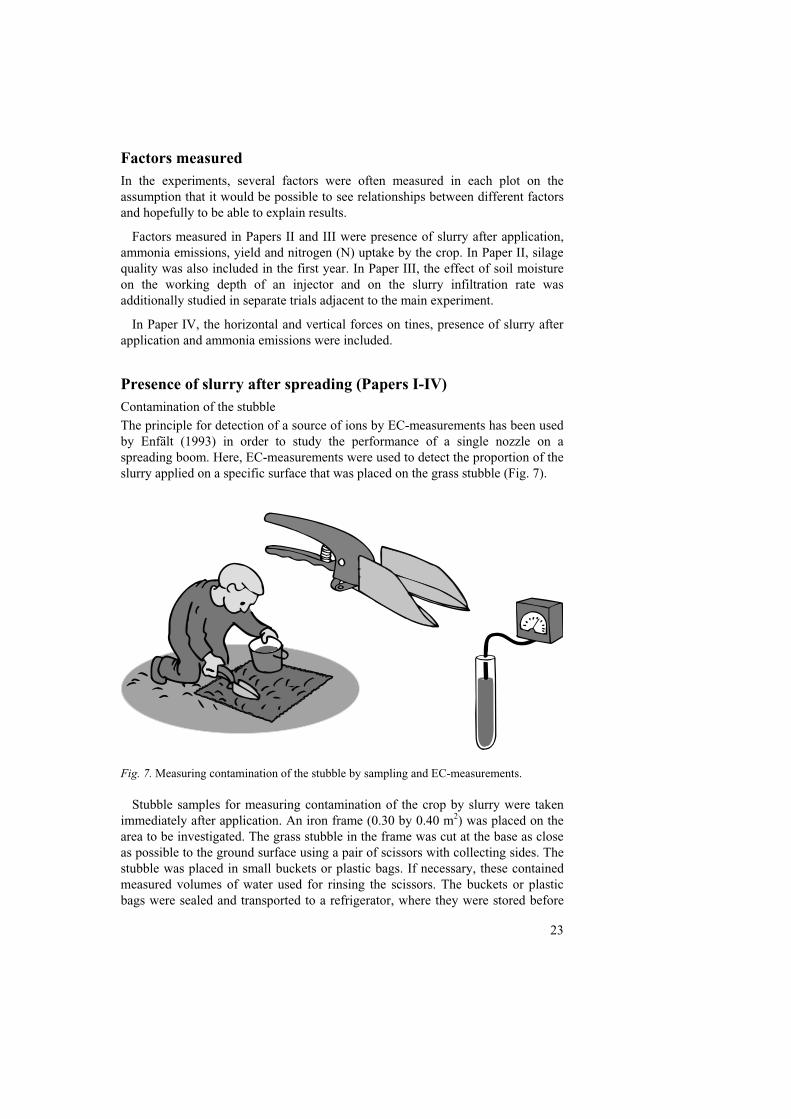
Presence of slurry after spreading (Papers I-IV) Contamination of the stubble The principle for detection of a source of ions by EC-measurements has been used by Enfält (1993) in order to study the performance of a single nozzle on a spreading boom. Here, EC-measurements were used to detect the proportion of the slurry applied on a specific surface that was placed on the grass stubble (Fig. 7).
Fig. 7. Measuring contamination of the stubble by sampling and EC-measurements.
Stubble samples for measuring contamination of the crop by slurry were taken immediately after application. An iron frame (0.30 by 0.40 m2) was placed on the area to be investigated. The grass stubble in the frame was cut at the base as close as possible to the ground surface using a pair of scissors with collecting sides. The stubble was placed in small buckets or plastic bags. If necessary, these contained measured volumes of water used for rinsing the scissors. The buckets or plastic bags were sealed and transported to a refrigerator, where they were stored before
24
analysis. In the laboratory, the stubble pieces were rinsed with de-ionised water. The amount of rinsing water added was proportional to the stubble weight. The stubble pieces were separated from the rinsing water, which was then mixed well. Samples were then taken from the mixed liquid and the EC measured at 20°C. EC of the slurry was also measured, as well as the EC in de-ionised water used to rinse non-manured stubble. The proportion of the applied slurry found on the stubble was calculated from Equation (2):
P = 100 (((mws γ ws) - (mwg γ wg)) / ms γ s) (2)
where:
P is the proportion of the applied slurry/manure contaminating the stubble in % of amount applied; mws is the mass of water added to grass sample with slurry residues in g; γ ws is the EC of rinsing water with slurry/manure residues in S/m; mwg is the mass of water added to grass sample of non-manured stubble in g; γ wg is EC of rinsing water with non-manured stubble in S/m; ms is the mass of slurry/manure added to the sampling area in g; and γ s is the EC of slurry in S/m.
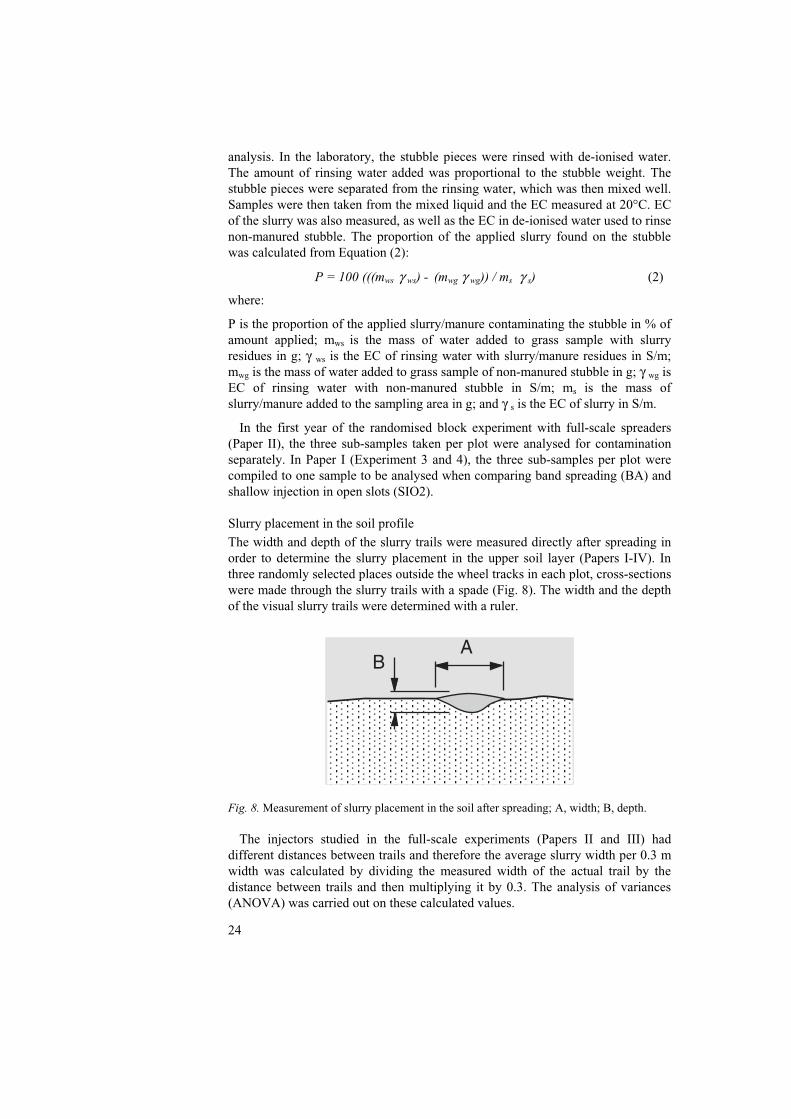
In the first year of the randomised block experiment with full-scale spreaders (Paper II), the three sub-samples taken per plot were analysed for contamination separately. In Paper I (Experiment 3 and 4), the three sub-samples per plot were compiled to one sample to be analysed when comparing band spreading (BA) and shallow injection in open slots (SIO2). Slurry placement in the soil profile The width and depth of the slurry trails were measured directly after spreading in order to determine the slurry placement in the upper soil layer (Papers I-IV). In three randomly selected places outside the wheel tracks in each plot, cross-sections were made through the slurry trails with a spade (Fig. 8). The width and the depth of the visual slurry trails were determined with a ruler.
AB
Fig. 8. Measurement of slurry placement in the soil after spreading; A, width; B, depth.
The injectors studied in the full-scale experiments (Papers II and III) had different distances between trails and therefore the average slurry width per 0.3 m width was calculated by dividing the measured width of the actual trail by the distance between trails and then multiplying it by 0.3. The analysis of variances (ANOVA) was carried out on these calculated values.
25
In Paper IV, both the upper and lower depth of the slurry trail was determined after injection into closed slots. The upper depth is also a measure of the thickness of the soil layer covering the slurry trail.
Influence of soil moisture on depth of injector and infiltration rate (Paper III) To study the influence of soil water content on working depth of an injector and the rate of slurry infiltration, an investigation was conducted on a piece of land adjacent to the main experiment (Paper III). Four different moisture contents of the soil were achieved using irrigation. Slots were created using the two-tine section of a Holaras shallow injector (Paper I) and the depth measured.
The infiltration rate of slurry on dry soil was measured in the slots using a steel frame. The frame was pressed into the soil to 50 mm depth. Slurry was filled into the soil slots to 35 mm height. In most of the slots, the infiltration rate of the slurry was rather low, so only two measurements of height changes were recorded during the infiltration using a measuring rod. Water infiltration rate into an undisturbed soil profile near the slots was also measured. Bulk density, soil water content and cone penetration resistance in undisturbed soil were determined.
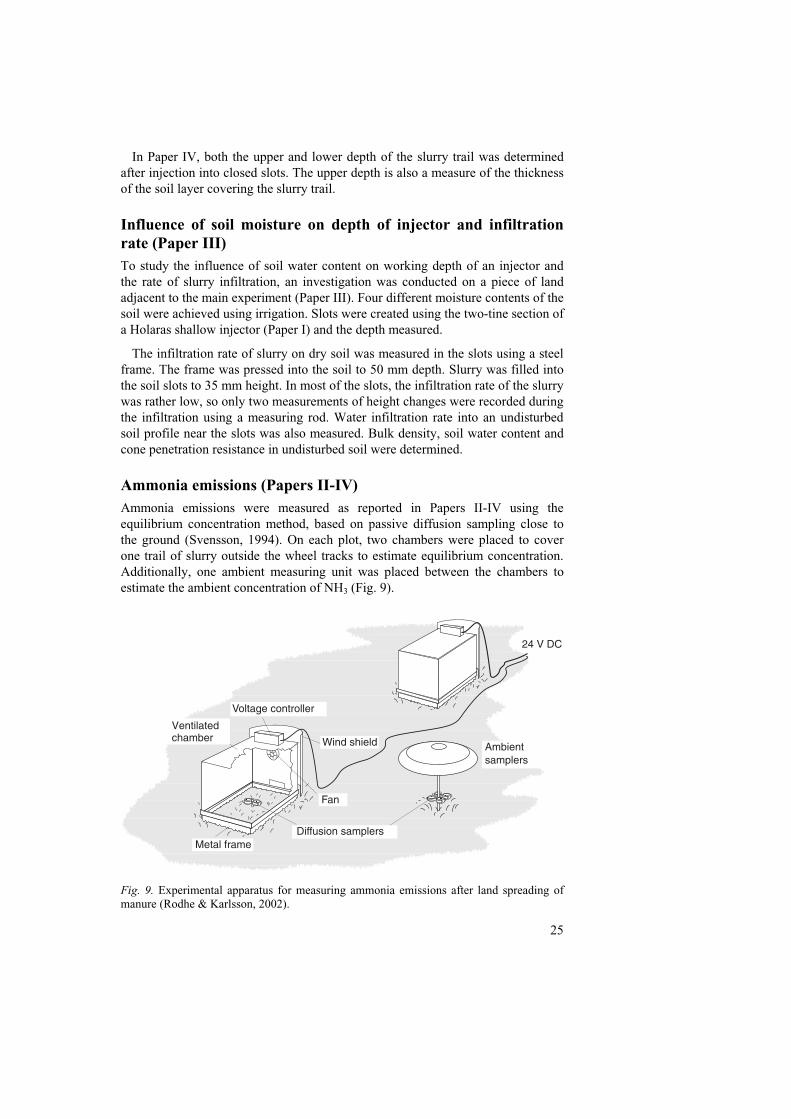
Ammonia emissions (Papers II-IV) Ammonia emissions were measured as reported in Papers II-IV using the equilibrium concentration method, based on passive diffusion sampling close to the ground (Svensson, 1994). On each plot, two chambers were placed to cover one trail of slurry outside the wheel tracks to estimate equilibrium concentration. Additionally, one ambient measuring unit was placed between the chambers to estimate the ambient concentration of NH3 (Fig. 9).
�$�)���
)� ��� ���������
*� �������������������������
+�
,���������
)�� � ���� ������
-���� ��������
Fig. 9. Experimental apparatus for measuring ammonia emissions after land spreading of manure (Rodhe & Karlsson, 2002).
26
The ammonia emissions were measured on several occasions over a period of 4 to 5 days after spreading. In order to determine the exposure times for the samplers, the ammonia concentrations in the ventilated chambers were measured using a gas detector tube system Kitagawa (Komyo Rikagaku Kogyo K. K.) at the start of the exposure. Using Fig. 4 in Svensson & Ferm (1993), the maximum exposure time before saturation of the samplers was set from the concentration value measured with the detector tube. The emissions between measuring periods were calculated from interpolated values of the NH3 emission corrected for soil surface temperature and wind speed prevailing during the intervals (Malgeryd, 1998). When no measuring occurred, the ventilated chambers were removed from the measuring plots, allowing the soil surface covered by the chambers to re-acclimatise to the prevailing weather conditions (wetting/drying).
Air temperature at 1.5 m height, soil surface temperature and wind speed at 2 m height were measured with a Vicon WS 801 weather station (Vicon Ltd., Ipswich, U.K.) during the four days when NH3 emissions from the plots were measured.
Yield and apparent nitrogen recovery (Papers II-III) The crop was harvested with a plot harvester (1.5 m working width) at the normal time for silage making (end of July-beginning of August). A 10 m long cut was made in the middle of each plot. The fresh crop was weighed and samples taken for analysis of dry matter (DM) content and Kjeldahl-N. Directly after harvest, the samples were pre-dried at 60 °C for 24 h. The analysis of total nitrogen (Kjeldahl-N) were carried out according to the methodology described by the Nordic Methodology Committee (NMKL, 1976), also an EU-method (Directive 93/199/EEG).
The uptake of nitrogen in the harvested crop part was estimated from DM-yield and the nitrogen content of the harvested crop. The apparent nitrogen recovery (ANRNH4-N) was calculated from Equation (3) according to van der Meer et al. (1987):
ANRNH4-N = (Nyield slurry - Nyield control)/TANapplied (3)
where:
ANR NH4-N is the proportion of the nitrogen uptake related to the slurry application set in relation to the total ammoniacal nitrogen (TAN) applied with slurry, %; Nyield
slurry is the total N uptake of the slurry fertilised crop, kg N ha-1; Nyield control is the N uptake of the crop in the unfertilised plots, kg N ha-1; and TANapplied is the TAN applied with slurry, kg N ha-1.
Silage quality (Paper II) In Paper II, the silage quality in one of the years was studied in terms of pH, content of ammonia nitrogen and number of clostridial spores. Samples of fresh plant material from each slurry-treated field plot were chopped and ensiled in 900 ml glass silos, equipped with water-sealed metallic lids (three replicates per field plot). The silos were stored at +24°C and were opened after 100 days of
27
fermentation. When opened, the contents of each silo were carefully mixed before being analysed.
To estimate the ensilability of the fresh material, DM, crude protein (CP) and water-soluble carbohydrates (WSC) were determined using methods described by Rammer et al. (1994) and buffering capacity according to Weissbach (1992). The number of clostridial spores was determined on reinforced clostridial agar (RCA, Oxoid CM 151) containing 0.2 g l–l cycloserine and 0.05 g l–l neutral red (Jonsson, 1990).
For the ensiled material, the DM was determined using a method described by Rammer (1996b). To estimate silage quality, ammonia nitrogen was determined by direct distillation on a Kjeltec autosystem 1030, and pH was measured in the silage effluent by a Metrohm 654 pH-meter. The number of clostridial spores was measured as described above.
Economy (Paper II) In Paper II, an economic evaluation of the handling and application of slurry to grassland was made using a mathematical model (Brundin & Rodhe, 1994). Spreading techniques included were band application (BA) and shallow injection (SIO) and, as a reference, the most common spreading technique for slurry, broadcast spreading (BR). The model describes the manure handling system and the relationships between soil, crop, technology and the organisation that influence the profitability of different systems. It is a mixed integer linear programming model and the annuity of the net value for a manure handling system is maximised. The model optimises storage capacity, quantities spread during each season and input of complementary chemical fertiliser. The revenue is calculated as the sum of nutrients (N, P and K) available to plants. Costs are included for storage, machinery, labour and soil compaction. The cost of soil compaction is expressed as a yield loss in accordance with Arvidsson & Håkansson (1991).
Values for the ammonia losses after broadcasting and band spreading were set according to default values (Jordbruksverket, 1999) and for shallow injection in closed slots in accordance with Huijsmans, Hol & Bussink (1997). The organic-N utilised in the 10 years following application is assumed to replace nitrogen in chemical fertilisers (Brundin & Rodhe, 1994). For more details about the set parameters, see Paper II.
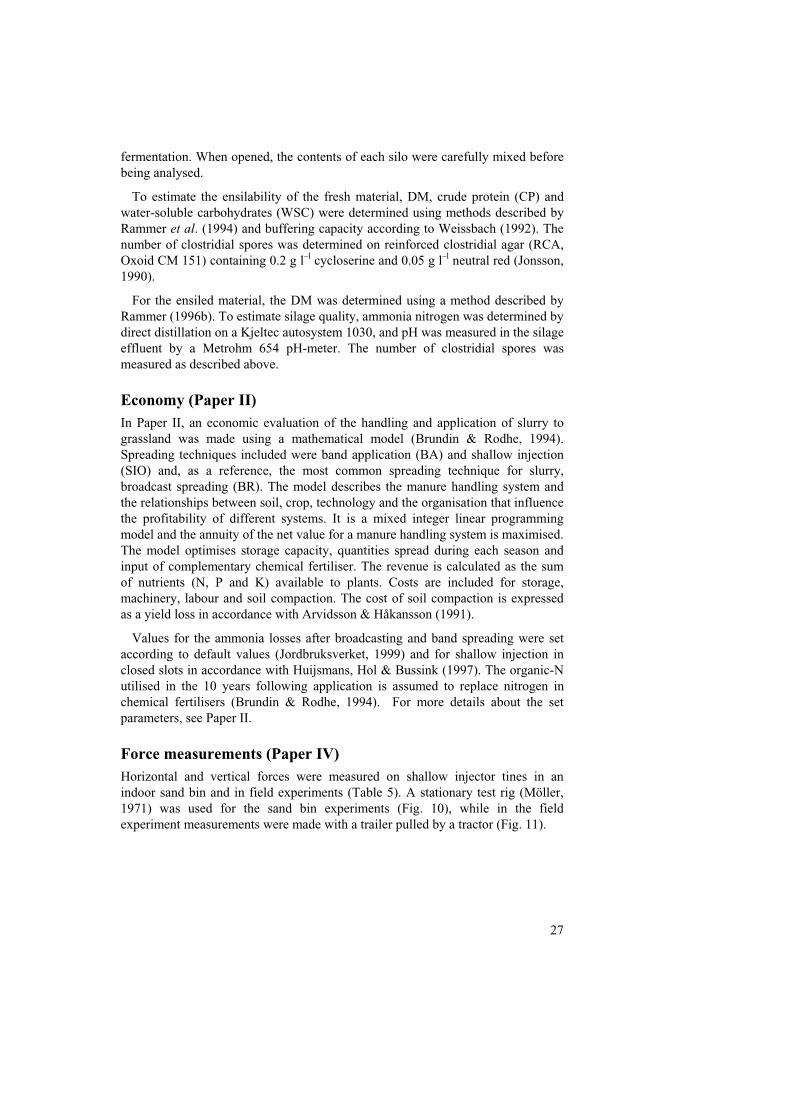
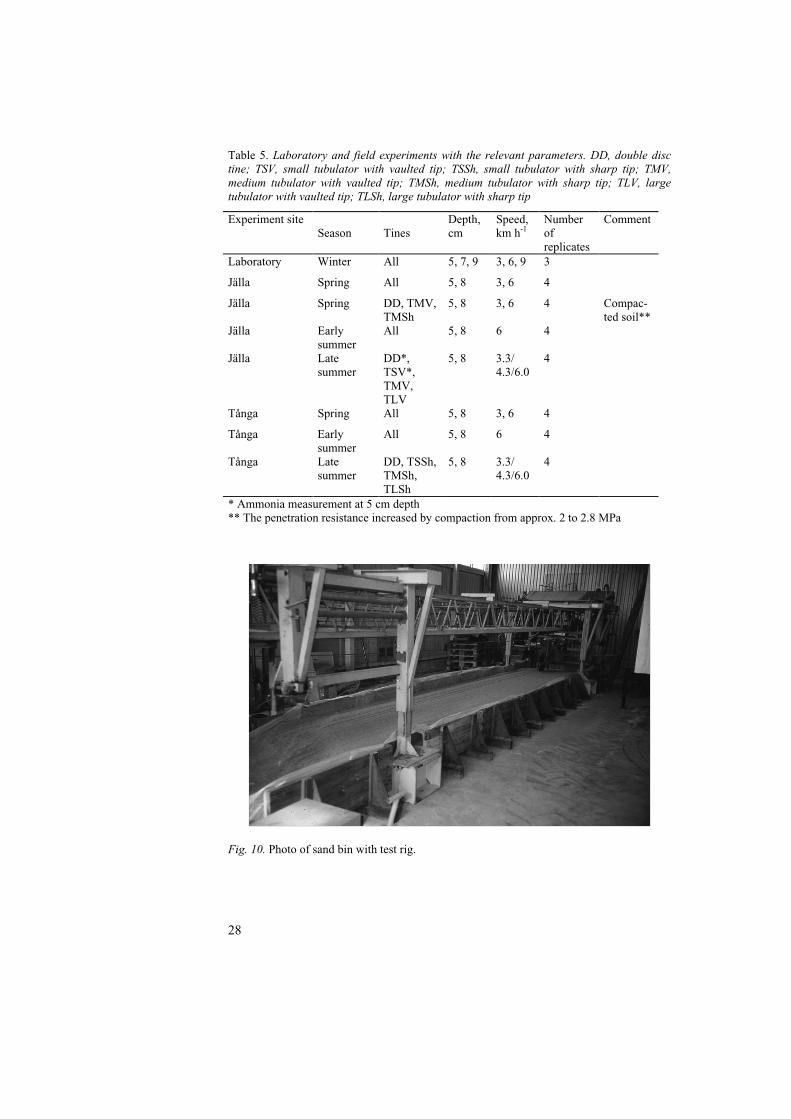
Force measurements (Paper IV) Horizontal and vertical forces were measured on shallow injector tines in an indoor sand bin and in field experiments (Table 5). A stationary test rig (Möller, 1971) was used for the sand bin experiments (Fig. 10), while in the field experiment measurements were made with a trailer pulled by a tractor (Fig. 11).
28
Table 5. Laboratory and field experiments with the relevant parameters. DD, double disc tine; TSV, small tubulator with vaulted tip; TSSh, small tubulator with sharp tip; TMV, medium tubulator with vaulted tip; TMSh, medium tubulator with sharp tip; TLV, large tubulator with vaulted tip; TLSh, large tubulator with sharp tip
Experiment site Season
Tines
Depth, cm
Speed, km h-1
Number of replicates
Comment
Laboratory Winter All 5, 7, 9 3, 6, 9 3 Jälla Spring All 5, 8 3, 6 4 Jälla Spring DD, TMV,
TMSh 5, 8 3, 6 4 Compac-
ted soil** Jälla Early
summer All 5, 8 6 4
Jälla Late summer
DD*, TSV*, TMV, TLV
5, 8 3.3/ 4.3/6.0
4
Tånga Spring All 5, 8 3, 6 4 Tånga Early
summer All 5, 8 6 4
Tånga Late summer
DD, TSSh, TMSh, TLSh
5, 8 3.3/ 4.3/6.0
4
* Ammonia measurement at 5 cm depth ** The penetration resistance increased by compaction from approx. 2 to 2.8 MPa
Fig. 10. Photo of sand bin with test rig.
29
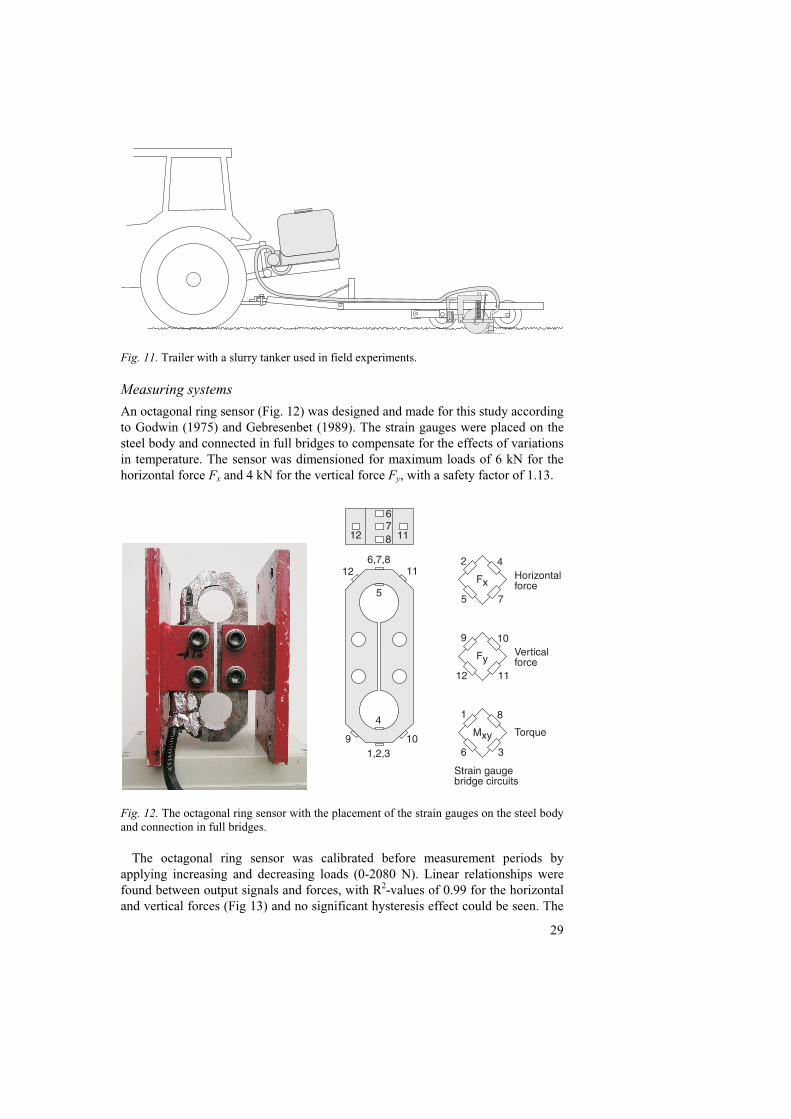
Fig. 11. Trailer with a slurry tanker used in field experiments.
Measuring systems
An octagonal ring sensor (Fig. 12) was designed and made for this study according to Godwin (1975) and Gebresenbet (1989). The strain gauges were placed on the steel body and connected in full bridges to compensate for the effects of variations in temperature. The sensor was dimensioned for maximum loads of 6 kN for the horizontal force Fx and 4 kN for the vertical force Fy, with a safety factor of 1.13.
.&'/� //
/� //.0&0'
#
$
1 /�/0�0�
+2
� $
&#
+�
1 /�
///�
*2�
/ '
�.
����3� �������
)�� ���������
%��4��
� ���� �� ����� �������� �
Fig. 12. The octagonal ring sensor with the placement of the strain gauges on the steel body and connection in full bridges.
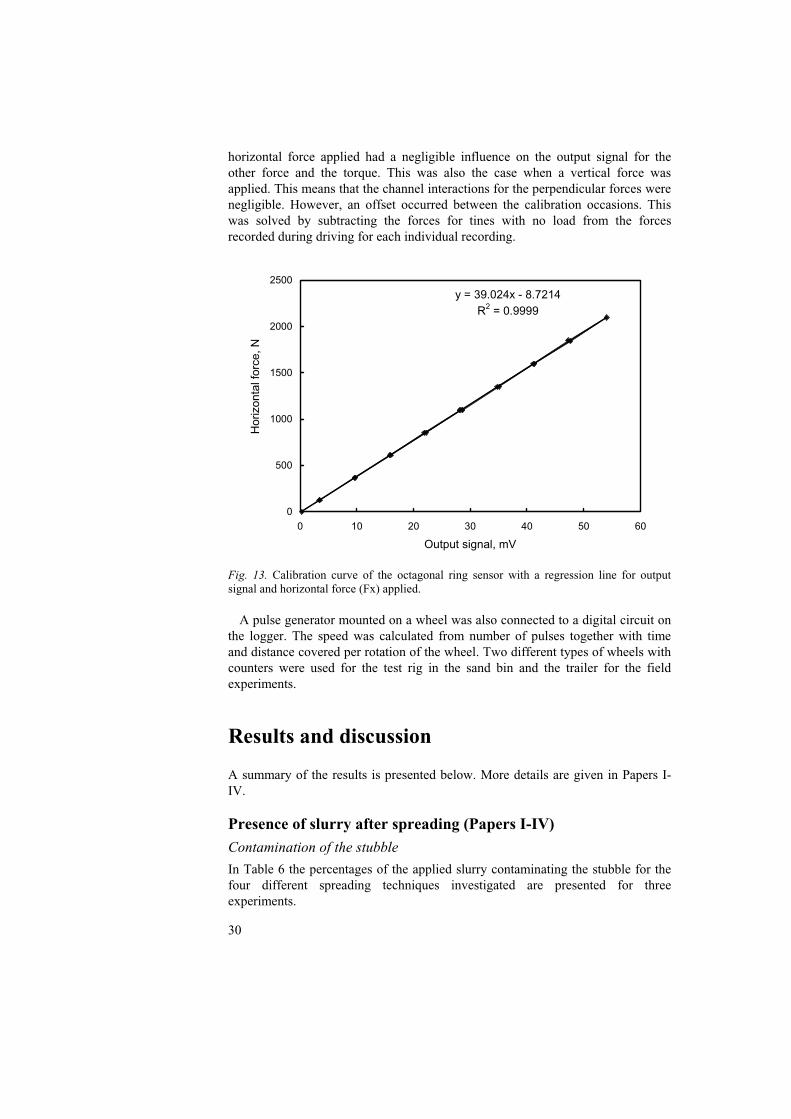
The octagonal ring sensor was calibrated before measurement periods by applying increasing and decreasing loads (0-2080 N). Linear relationships were found between output signals and forces, with R2-values of 0.99 for the horizontal and vertical forces (Fig 13) and no significant hysteresis effect could be seen. The
30
horizontal force applied had a negligible influence on the output signal for the other force and the torque. This was also the case when a vertical force was applied. This means that the channel interactions for the perpendicular forces were negligible. However, an offset occurred between the calibration occasions. This was solved by subtracting the forces for tines with no load from the forces recorded during driving for each individual recording.
y = 39.024x - 8.7214R2 = 0.9999
0
500
1000
1500
2000
2500
0 10 20 30 40 50 60
Output signal, mV
Hor
izon
tal f
orce
, N
Fig. 13. Calibration curve of the octagonal ring sensor with a regression line for output signal and horizontal force (Fx) applied.
A pulse generator mounted on a wheel was also connected to a digital circuit on the logger. The speed was calculated from number of pulses together with time and distance covered per rotation of the wheel. Two different types of wheels with counters were used for the test rig in the sand bin and the trailer for the field experiments.
Results and discussion
A summary of the results is presented below. More details are given in Papers I-IV.
Presence of slurry after spreading (Papers I-IV)
Contamination of the stubble
In Table 6 the percentages of the applied slurry contaminating the stubble for the four different spreading techniques investigated are presented for three experiments.
31
Table 6. Percentage of applied slurry contaminating stubble after application of slurry on ley with the techniques: 1) band application (BA), 2) pressurised injection (PI), 3) shallow injection 1 (SIO1) with open slots, V-shaped disc tines, and 4) shallow injection 2 (SIO2) with open slots, two angled disc coulters. n.d, not determined
Application techniques Source
DM of slurry, %
Height of stubble, cm BA PI SIO1 SIO2 LSD 0.05
Paper II, Year 1 6.7 8 (3.1) 17 23 14 n.d. 10.1 Paper I, Exp. 3 7.2 11.1 (2.2) 13 n.d. n.d. -1.1 12.1 Paper I, Exp. 4 7.6 9.4 (2.3) 26 n.d. n.d. 4.3 19.1
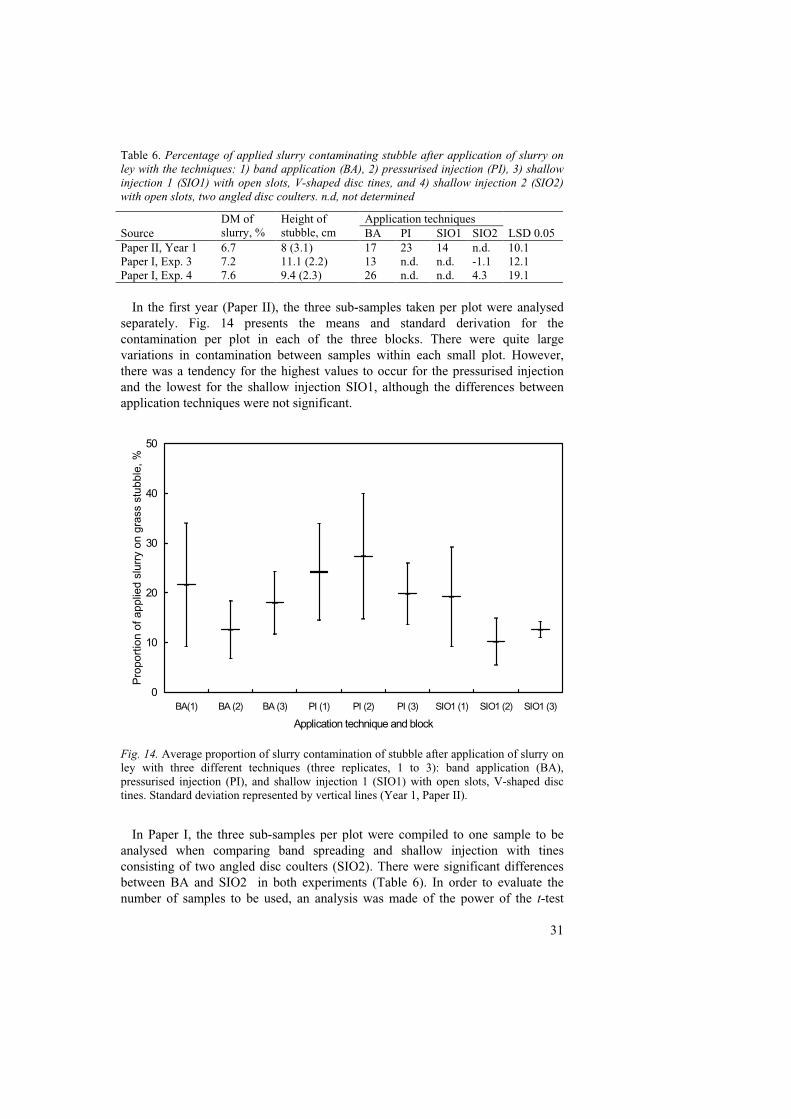
In the first year (Paper II), the three sub-samples taken per plot were analysed separately. Fig. 14 presents the means and standard derivation for the contamination per plot in each of the three blocks. There were quite large variations in contamination between samples within each small plot. However, there was a tendency for the highest values to occur for the pressurised injection and the lowest for the shallow injection SIO1, although the differences between application techniques were not significant.
0
10
20
30
40
50
BA(1) BA (2) BA (3) PI (1) PI (2) PI (3) SIO1 (1) SIO1 (2) SIO1 (3)
Application technique and block
Pro
port
ion
of a
pplie
d sl
urry
on
gras
s st
ubbl
e, %
Fig. 14. Average proportion of slurry contamination of stubble after application of slurry on ley with three different techniques (three replicates, 1 to 3): band application (BA), pressurised injection (PI), and shallow injection 1 (SIO1) with open slots, V-shaped disc tines. Standard deviation represented by vertical lines (Year 1, Paper II).
In Paper I, the three sub-samples per plot were compiled to one sample to be analysed when comparing band spreading and shallow injection with tines consisting of two angled disc coulters (SIO2). There were significant differences between BA and SIO2 in both experiments (Table 6). In order to evaluate the number of samples to be used, an analysis was made of the power of the t-test
32
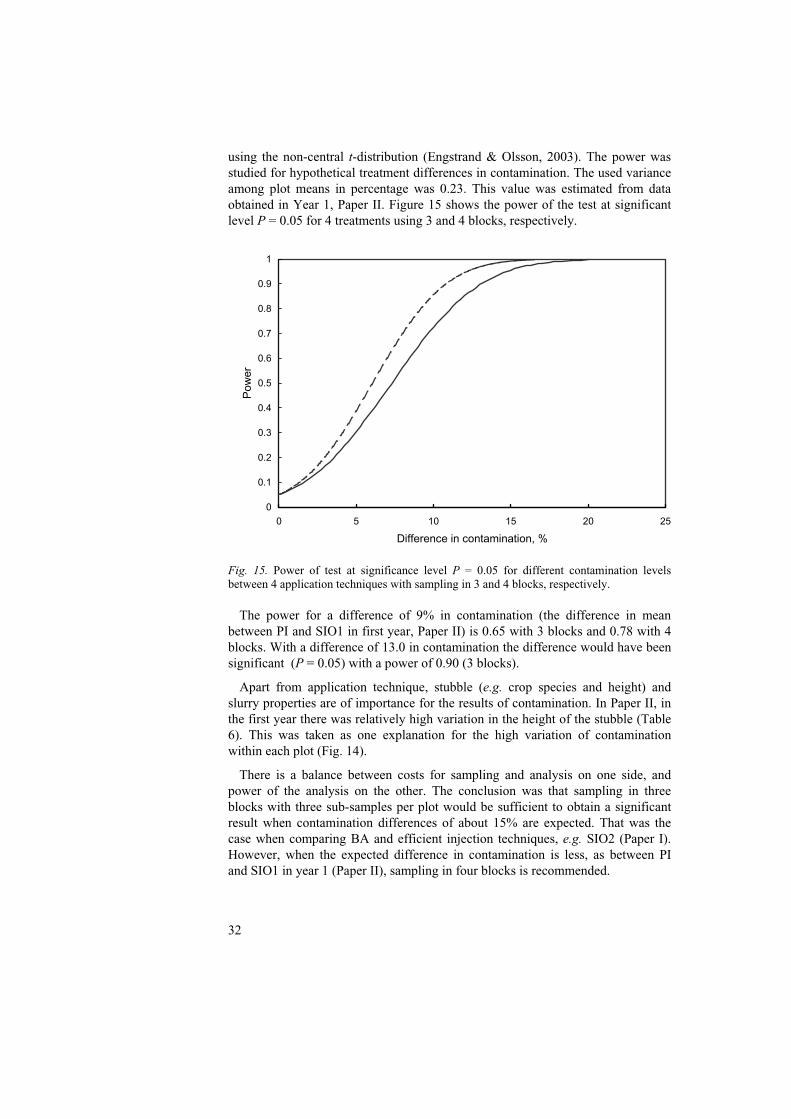
using the non-central t-distribution (Engstrand & Olsson, 2003). The power was studied for hypothetical treatment differences in contamination. The used variance among plot means in percentage was 0.23. This value was estimated from data obtained in Year 1, Paper II. Figure 15 shows the power of the test at significant level P = 0.05 for 4 treatments using 3 and 4 blocks, respectively.
0
0.1
0.2
0.3
0.4
0.5
0.6
0.7
0.8
0.9
1
0 5 10 15 20 25
Difference in contamination, %
Pow
er
Fig. 15. Power of test at significance level P = 0.05 for different contamination levels between 4 application techniques with sampling in 3 and 4 blocks, respectively.
The power for a difference of 9% in contamination (the difference in mean between PI and SIO1 in first year, Paper II) is 0.65 with 3 blocks and 0.78 with 4 blocks. With a difference of 13.0 in contamination the difference would have been significant (P = 0.05) with a power of 0.90 (3 blocks).
Apart from application technique, stubble (e.g. crop species and height) and slurry properties are of importance for the results of contamination. In Paper II, in the first year there was relatively high variation in the height of the stubble (Table 6). This was taken as one explanation for the high variation of contamination within each plot (Fig. 14).
There is a balance between costs for sampling and analysis on one side, and power of the analysis on the other. The conclusion was that sampling in three blocks with three sub-samples per plot would be sufficient to obtain a significant result when contamination differences of about 15% are expected. That was the case when comparing BA and efficient injection techniques, e.g. SIO2 (Paper I). However, when the expected difference in contamination is less, as between PI and SIO1 in year 1 (Paper II), sampling in four blocks is recommended.
33
Slurry placement in the soil profile
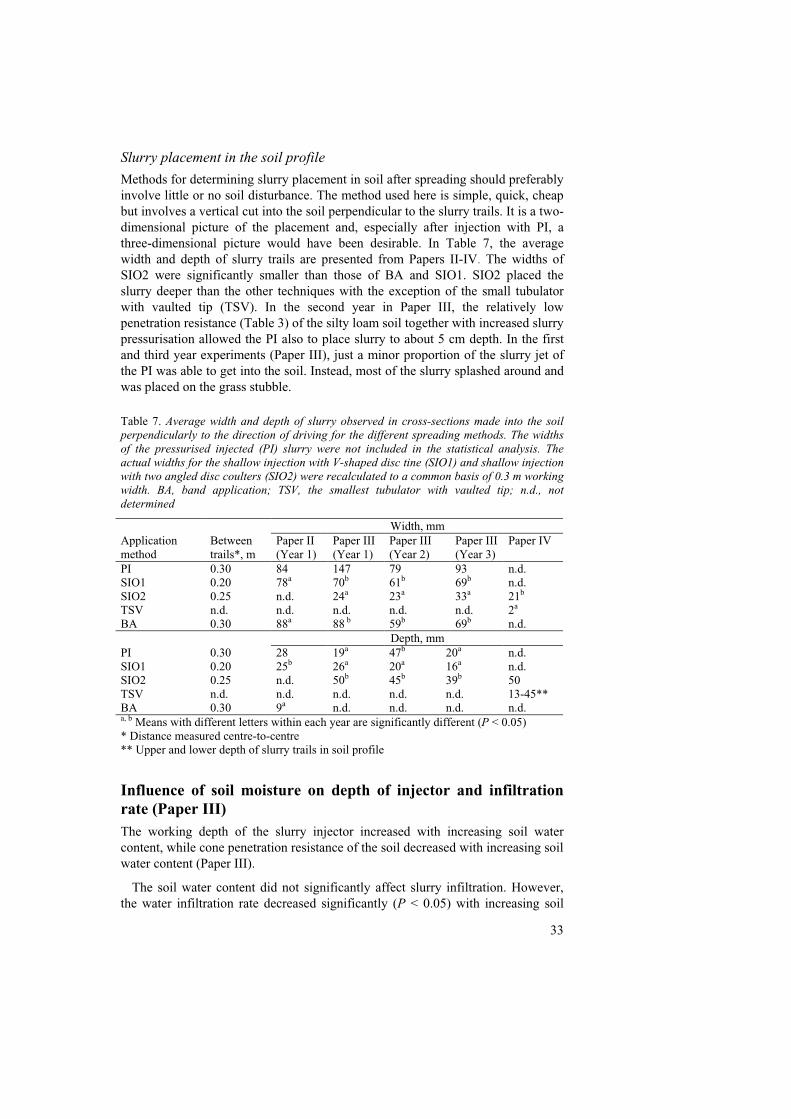
Methods for determining slurry placement in soil after spreading should preferably involve little or no soil disturbance. The method used here is simple, quick, cheap but involves a vertical cut into the soil perpendicular to the slurry trails. It is a two-dimensional picture of the placement and, especially after injection with PI, a three-dimensional picture would have been desirable. In Table 7, the average width and depth of slurry trails are presented from Papers II-IV. The widths of SIO2 were significantly smaller than those of BA and SIO1. SIO2 placed the slurry deeper than the other techniques with the exception of the small tubulator with vaulted tip (TSV). In the second year in Paper III, the relatively low penetration resistance (Table 3) of the silty loam soil together with increased slurry pressurisation allowed the PI also to place slurry to about 5 cm depth. In the first and third year experiments (Paper III), just a minor proportion of the slurry jet of the PI was able to get into the soil. Instead, most of the slurry splashed around and was placed on the grass stubble.
Table 7. Average width and depth of slurry observed in cross-sections made into the soil perpendicularly to the direction of driving for the different spreading methods. The widths of the pressurised injected (PI) slurry were not included in the statistical analysis. The actual widths for the shallow injection with V-shaped disc tine (SIO1) and shallow injection with two angled disc coulters (SIO2) were recalculated to a common basis of 0.3 m working width. BA, band application; TSV, the smallest tubulator with vaulted tip; n.d., not determined
Width, mm Application method
Between trails*, m
Paper II (Year 1)
Paper III (Year 1)
Paper III (Year 2)
Paper III (Year 3)
Paper IV
PI 0.30 84 147 79 93 n.d. SIO1 0.20 78a 70b 61b 69b n.d. SIO2 0.25 n.d. 24a 23a 33a 21b TSV n.d. n.d. n.d. n.d. n.d. 2a BA 0.30 88a 88 b 59b 69b n.d. Depth, mm PI 0.30 28 19a 47b 20a n.d. SIO1 0.20 25b 26a 20a 16a n.d. SIO2 0.25 n.d. 50b 45b 39b 50 TSV n.d. n.d. n.d. n.d. n.d. 13-45** BA 0.30 9a n.d. n.d. n.d. n.d. a, b Means with different letters within each year are significantly different (P < 0.05) * Distance measured centre-to-centre ** Upper and lower depth of slurry trails in soil profile
Influence of soil moisture on depth of injector and infiltration rate (Paper III) The working depth of the slurry injector increased with increasing soil water content, while cone penetration resistance of the soil decreased with increasing soil water content (Paper III).
The soil water content did not significantly affect slurry infiltration. However, the water infiltration rate decreased significantly (P < 0.05) with increasing soil
34
water content. Slurry infiltration rate was greatest in the light soil (14 to 21 mm h-1), while in the other two soil it was in the range of 4-8 mm h-1 (Paper III). The infiltration rate of slurry was 2 to 11 times lower than that of water.
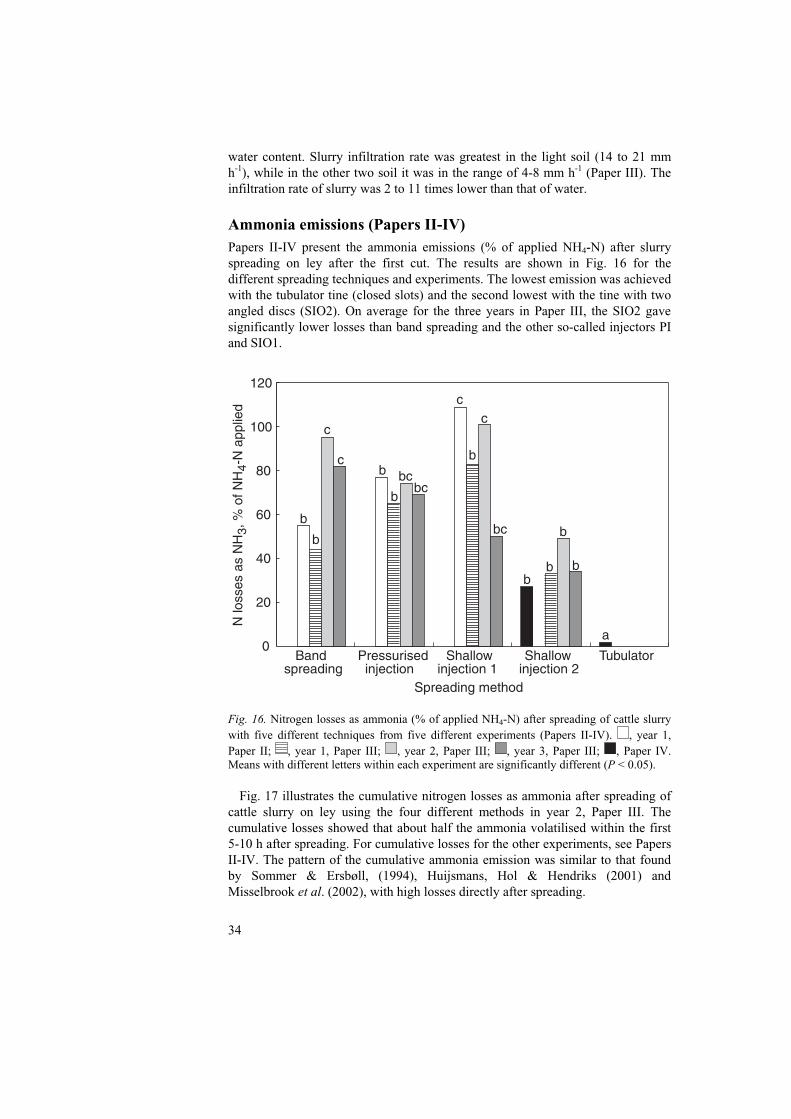
Ammonia emissions (Papers II-IV) Papers II-IV present the ammonia emissions (% of applied NH4-N) after slurry spreading on ley after the first cut. The results are shown in Fig. 16 for the different spreading techniques and experiments. The lowest emission was achieved with the tubulator tine (closed slots) and the second lowest with the tine with two angled discs (SIO2). On average for the three years in Paper III, the SIO2 gave significantly lower losses than band spreading and the other so-called injectors PI and SIO1.
"���������
!������������� ��
���������� ���/
���������� ����
%����� ��
������� ��� ���
�
��
$�
.�
'�
/��
/��
5�����������5��0�6
����5
�$�5��������
�
�
�
�
�
��
�
�
�
�
��
����
��
�
Fig. 16. Nitrogen losses as ammonia (% of applied NH4-N) after spreading of cattle slurry with five different techniques from five different experiments (Papers II-IV). , year 1, Paper II; , year 1, Paper III; , year 2, Paper III; , year 3, Paper III; , Paper IV. Means with different letters within each experiment are significantly different (P < 0.05).
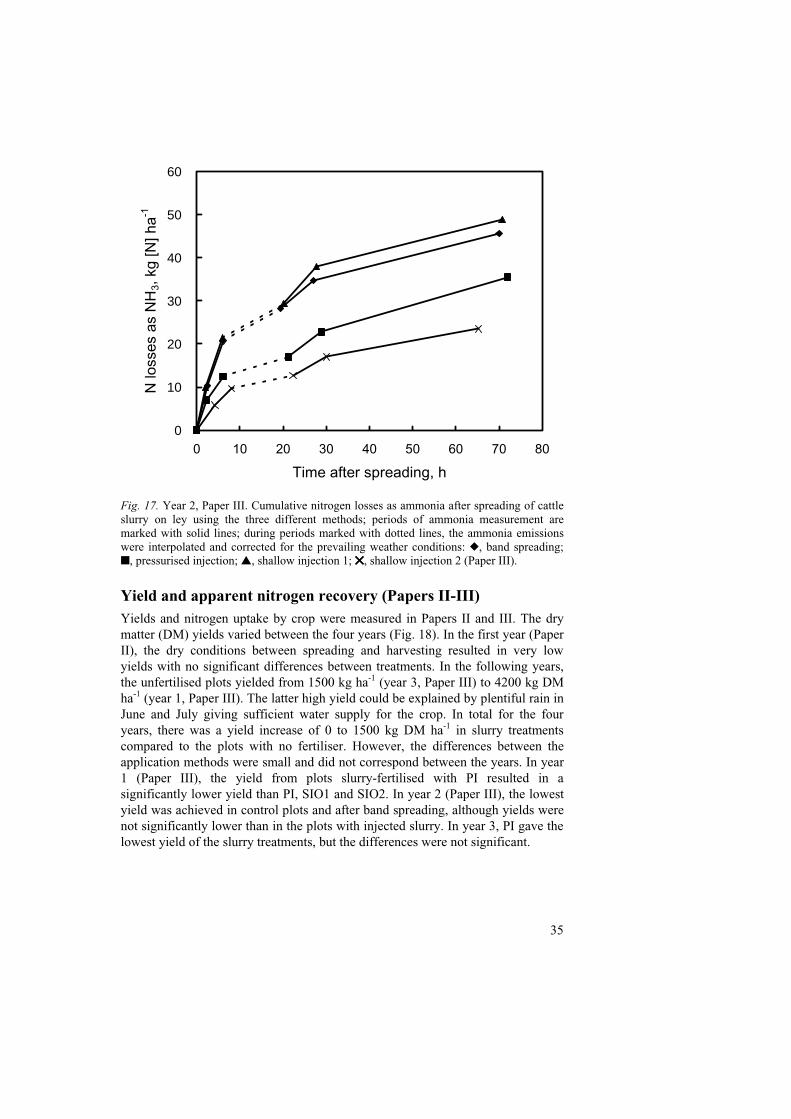
Fig. 17 illustrates the cumulative nitrogen losses as ammonia after spreading of cattle slurry on ley using the four different methods in year 2, Paper III. The cumulative losses showed that about half the ammonia volatilised within the first 5-10 h after spreading. For cumulative losses for the other experiments, see Papers II-IV. The pattern of the cumulative ammonia emission was similar to that found by Sommer & Ersbøll, (1994), Huijsmans, Hol & Hendriks (2001) and Misselbrook et al. (2002), with high losses directly after spreading.
35
0
10
20
30
40
50
60
0 10 20 30 40 50 60 70 80
Time after spreading, h
N lo
sses
as
NH
3, k
g [N
] ha-1
Fig. 17. Year 2, Paper III. Cumulative nitrogen losses as ammonia after spreading of cattle slurry on ley using the three different methods; periods of ammonia measurement are marked with solid lines; during periods marked with dotted lines, the ammonia emissions were interpolated and corrected for the prevailing weather conditions: �, band spreading; �, pressurised injection; �, shallow injection 1; ✕✕✕✕, shallow injection 2 (Paper III).
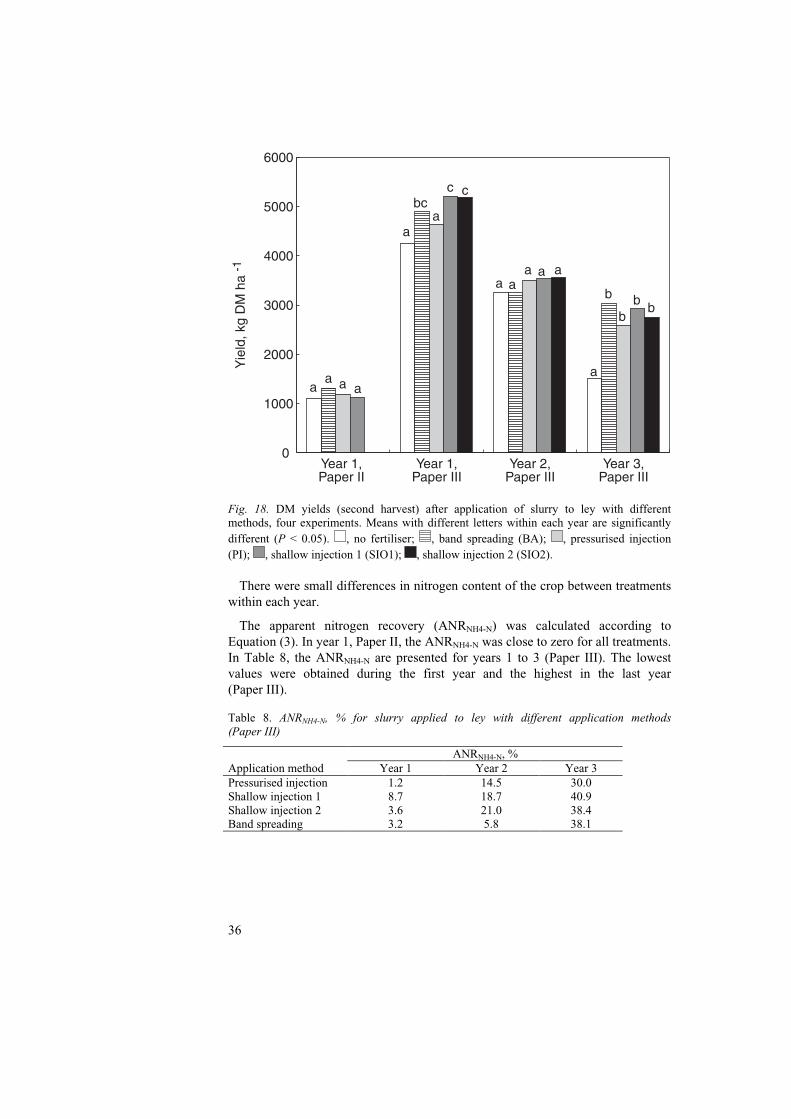
Yield and apparent nitrogen recovery (Papers II-III) Yields and nitrogen uptake by crop were measured in Papers II and III. The dry matter (DM) yields varied between the four years (Fig. 18). In the first year (Paper II), the dry conditions between spreading and harvesting resulted in very low yields with no significant differences between treatments. In the following years, the unfertilised plots yielded from 1500 kg ha-1 (year 3, Paper III) to 4200 kg DM ha-1 (year 1, Paper III). The latter high yield could be explained by plentiful rain in June and July giving sufficient water supply for the crop. In total for the four years, there was a yield increase of 0 to 1500 kg DM ha-1 in slurry treatments compared to the plots with no fertiliser. However, the differences between the application methods were small and did not correspond between the years. In year 1 (Paper III), the yield from plots slurry-fertilised with PI resulted in a significantly lower yield than PI, SIO1 and SIO2. In year 2 (Paper III), the lowest yield was achieved in control plots and after band spreading, although yields were not significantly lower than in the plots with injected slurry. In year 3, PI gave the lowest yield of the slurry treatments, but the differences were not significant.
36
�
/���
����
����
$���
#���
.���
7����/0!�����88
7����/0!�����888
7�����0!�����888
7�����0!�����888
7����0�9 ��*�����/
��
� ���
�� � �
�
�
�
� � �
�� � �
Fig. 18. DM yields (second harvest) after application of slurry to ley with different methods, four experiments. Means with different letters within each year are significantly different (P < 0.05). , no fertiliser; , band spreading (BA); , pressurised injection (PI); , shallow injection 1 (SIO1); , shallow injection 2 (SIO2).
There were small differences in nitrogen content of the crop between treatments within each year.
The apparent nitrogen recovery (ANRNH4-N) was calculated according to Equation (3). In year 1, Paper II, the ANRNH4-N was close to zero for all treatments. In Table 8, the ANRNH4-N are presented for years 1 to 3 (Paper III). The lowest values were obtained during the first year and the highest in the last year (Paper III). Table 8. ANRNH4-N, % for slurry applied to ley with different application methods (Paper III)
ANRNH4-N, % Application method Year 1 Year 2 Year 3 Pressurised injection 1.2 14.5 30.0 Shallow injection 1 8.7 18.7 40.9 Shallow injection 2 3.6 21.0 38.4 Band spreading 3.2 5.8 38.1
37
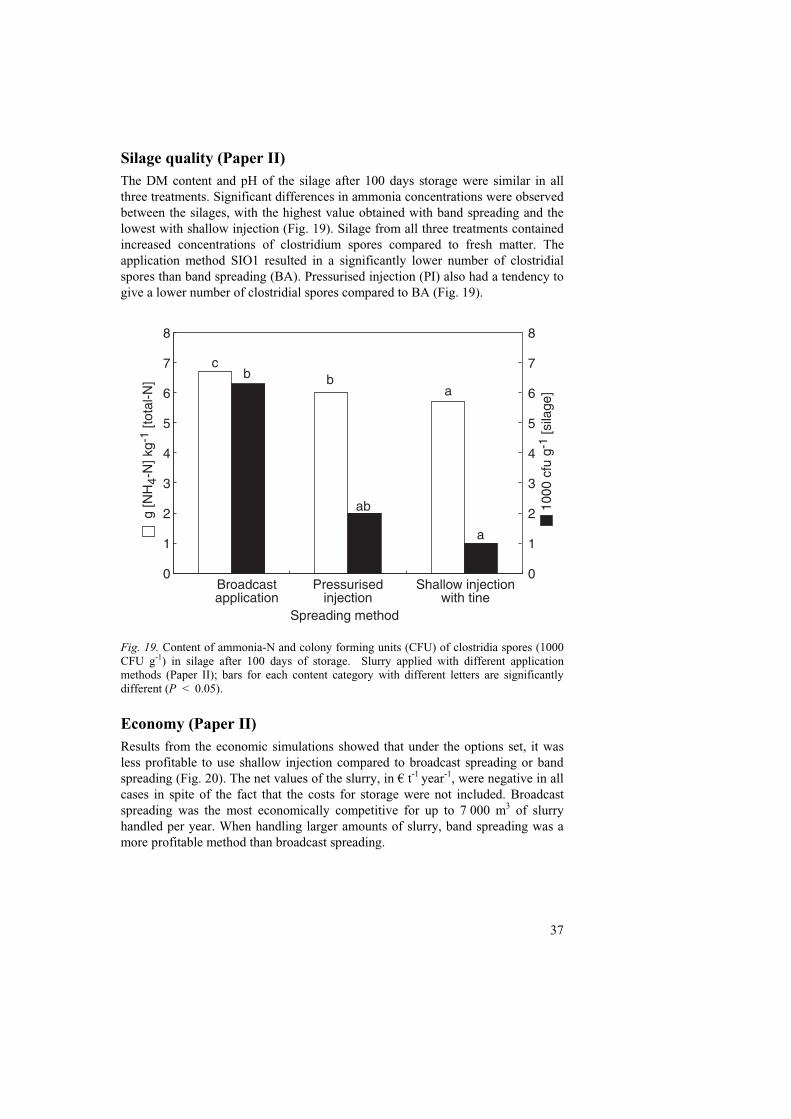
Silage quality (Paper II) The DM content and pH of the silage after 100 days storage were similar in all three treatments. Significant differences in ammonia concentrations were observed between the silages, with the highest value obtained with band spreading and the lowest with shallow injection (Fig. 19). Silage from all three treatments contained increased concentrations of clostridium spores compared to fresh matter. The application method SIO1 resulted in a significantly lower number of clostridial spores than band spreading (BA). Pressurised injection (PI) also had a tendency to give a lower number of clostridial spores compared to BA (Fig. 19).
"������� ������� ��
!������������� ��
����������� ���� �� ��
������� ��� ���
��
��
��
�
�
/
�
�
$
#
.
&
'
�
/
�
�
$
#
.
&
'
/�������� �/�:���� �
;
�:5�$�5;�9 �/ �: � ���5
;
Fig. 19. Content of ammonia-N and colony forming units (CFU) of clostridia spores (1000 CFU g-1) in silage after 100 days of storage. Slurry applied with different application methods (Paper II); bars for each content category with different letters are significantly different (P < 0.05).
Economy (Paper II) Results from the economic simulations showed that under the options set, it was less profitable to use shallow injection compared to broadcast spreading or band spreading (Fig. 20). The net values of the slurry, in € t-1 year-1, were negative in all cases in spite of the fact that the costs for storage were not included. Broadcast spreading was the most economically competitive for up to 7 000 m3 of slurry handled per year. When handling larger amounts of slurry, band spreading was a more profitable method than broadcast spreading.
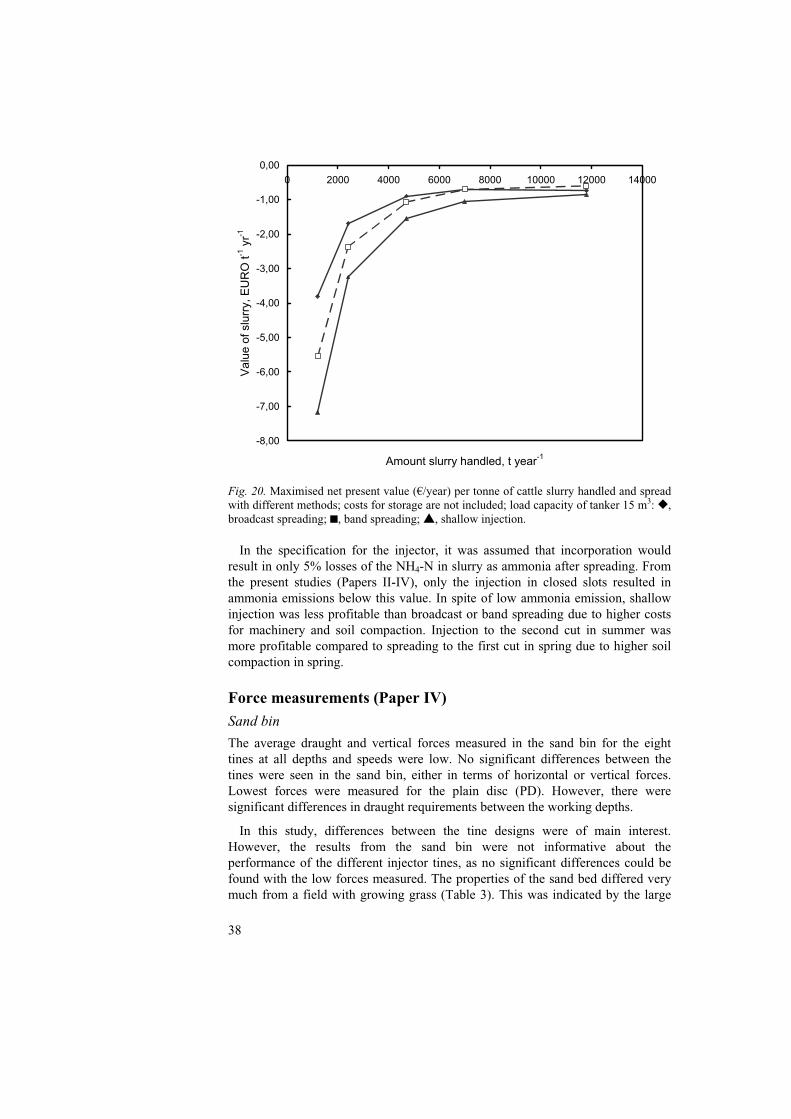
38
-8,00
-7,00
-6,00
-5,00
-4,00
-3,00
-2,00
-1,00
0,000 2000 4000 6000 8000 10000 12000 14000
Amount slurry handled, t year-1
Val
ue o
f slu
rry,
EU
RO
t-1 y
r-1
Fig. 20. Maximised net present value (€/year) per tonne of cattle slurry handled and spread with different methods; costs for storage are not included; load capacity of tanker 15 m3: �, broadcast spreading; �, band spreading; �, shallow injection.
In the specification for the injector, it was assumed that incorporation would result in only 5% losses of the NH4-N in slurry as ammonia after spreading. From the present studies (Papers II-IV), only the injection in closed slots resulted in ammonia emissions below this value. In spite of low ammonia emission, shallow injection was less profitable than broadcast or band spreading due to higher costs for machinery and soil compaction. Injection to the second cut in summer was more profitable compared to spreading to the first cut in spring due to higher soil compaction in spring.
Force measurements (Paper IV)
Sand bin
The average draught and vertical forces measured in the sand bin for the eight tines at all depths and speeds were low. No significant differences between the tines were seen in the sand bin, either in terms of horizontal or vertical forces. Lowest forces were measured for the plain disc (PD). However, there were significant differences in draught requirements between the working depths.
In this study, differences between the tine designs were of main interest. However, the results from the sand bin were not informative about the performance of the different injector tines, as no significant differences could be found with the low forces measured. The properties of the sand bed differed very much from a field with growing grass (Table 3). This was indicated by the large
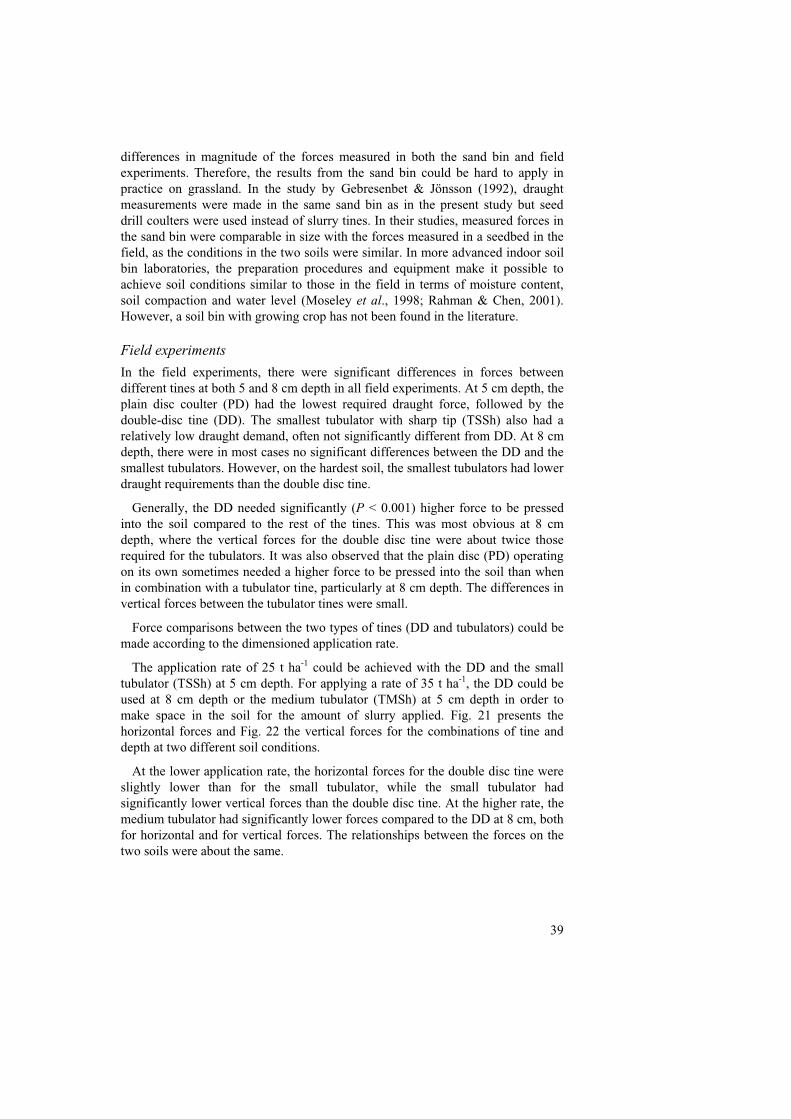
39
differences in magnitude of the forces measured in both the sand bin and field experiments. Therefore, the results from the sand bin could be hard to apply in practice on grassland. In the study by Gebresenbet & Jönsson (1992), draught measurements were made in the same sand bin as in the present study but seed drill coulters were used instead of slurry tines. In their studies, measured forces in the sand bin were comparable in size with the forces measured in a seedbed in the field, as the conditions in the two soils were similar. In more advanced indoor soil bin laboratories, the preparation procedures and equipment make it possible to achieve soil conditions similar to those in the field in terms of moisture content, soil compaction and water level (Moseley et al., 1998; Rahman & Chen, 2001). However, a soil bin with growing crop has not been found in the literature. Field experiments
In the field experiments, there were significant differences in forces between different tines at both 5 and 8 cm depth in all field experiments. At 5 cm depth, the plain disc coulter (PD) had the lowest required draught force, followed by the double-disc tine (DD). The smallest tubulator with sharp tip (TSSh) also had a relatively low draught demand, often not significantly different from DD. At 8 cm depth, there were in most cases no significant differences between the DD and the smallest tubulators. However, on the hardest soil, the smallest tubulators had lower draught requirements than the double disc tine.
Generally, the DD needed significantly (P < 0.001) higher force to be pressed into the soil compared to the rest of the tines. This was most obvious at 8 cm depth, where the vertical forces for the double disc tine were about twice those required for the tubulators. It was also observed that the plain disc (PD) operating on its own sometimes needed a higher force to be pressed into the soil than when in combination with a tubulator tine, particularly at 8 cm depth. The differences in vertical forces between the tubulator tines were small.
Force comparisons between the two types of tines (DD and tubulators) could be made according to the dimensioned application rate.
The application rate of 25 t ha-1 could be achieved with the DD and the small tubulator (TSSh) at 5 cm depth. For applying a rate of 35 t ha-1, the DD could be used at 8 cm depth or the medium tubulator (TMSh) at 5 cm depth in order to make space in the soil for the amount of slurry applied. Fig. 21 presents the horizontal forces and Fig. 22 the vertical forces for the combinations of tine and depth at two different soil conditions.
At the lower application rate, the horizontal forces for the double disc tine were slightly lower than for the small tubulator, while the small tubulator had significantly lower vertical forces than the double disc tine. At the higher rate, the medium tubulator had significantly lower forces compared to the DD at 8 cm, both for horizontal and for vertical forces. The relationships between the forces on the two soils were about the same.
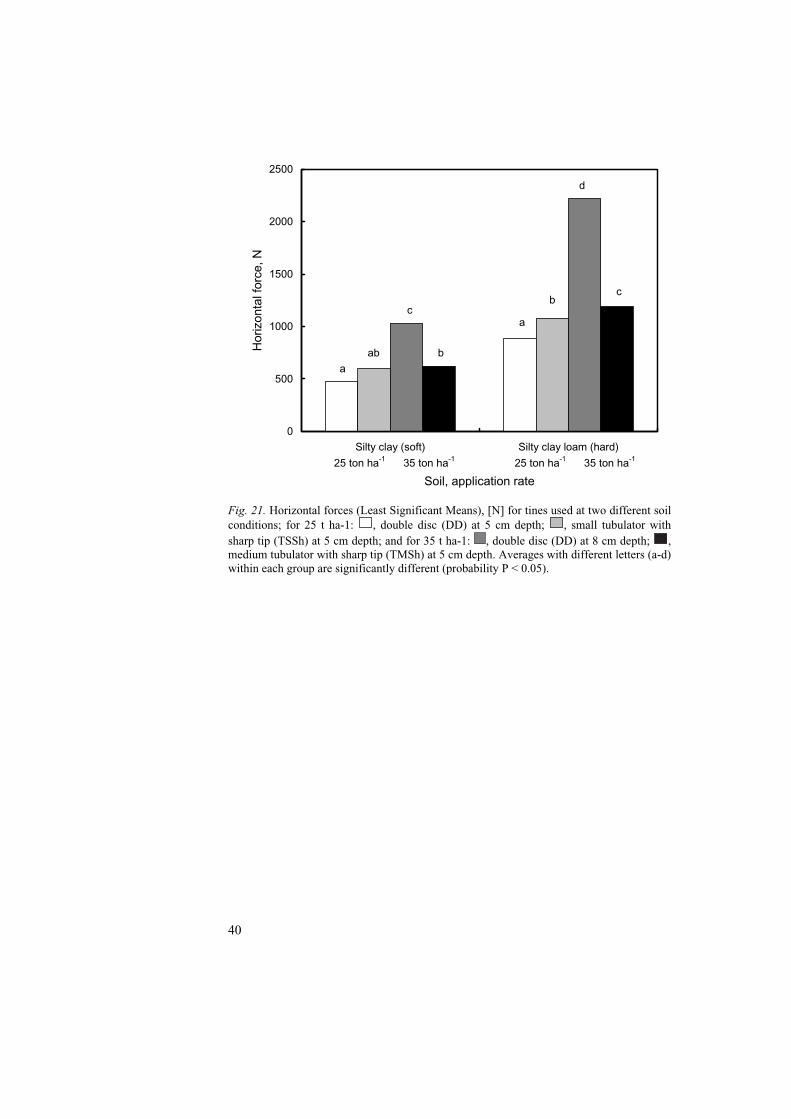
40
0
500
1000
1500
2000
2500
Silty clay (soft) Silty clay loam (hard)
Soil, application rate
Hor
izon
tal f
orce
, N
25 ton ha-1 35 ton ha-1 25 ton ha-1 35 ton ha-1
a
ab
c
b
a
b
d
c
Fig. 21. Horizontal forces (Least Significant Means), [N] for tines used at two different soil conditions; for 25 t ha-1: , double disc (DD) at 5 cm depth; , small tubulator with sharp tip (TSSh) at 5 cm depth; and for 35 t ha-1: , double disc (DD) at 8 cm depth; , medium tubulator with sharp tip (TMSh) at 5 cm depth. Averages with different letters (a-d) within each group are significantly different (probability P < 0.05).
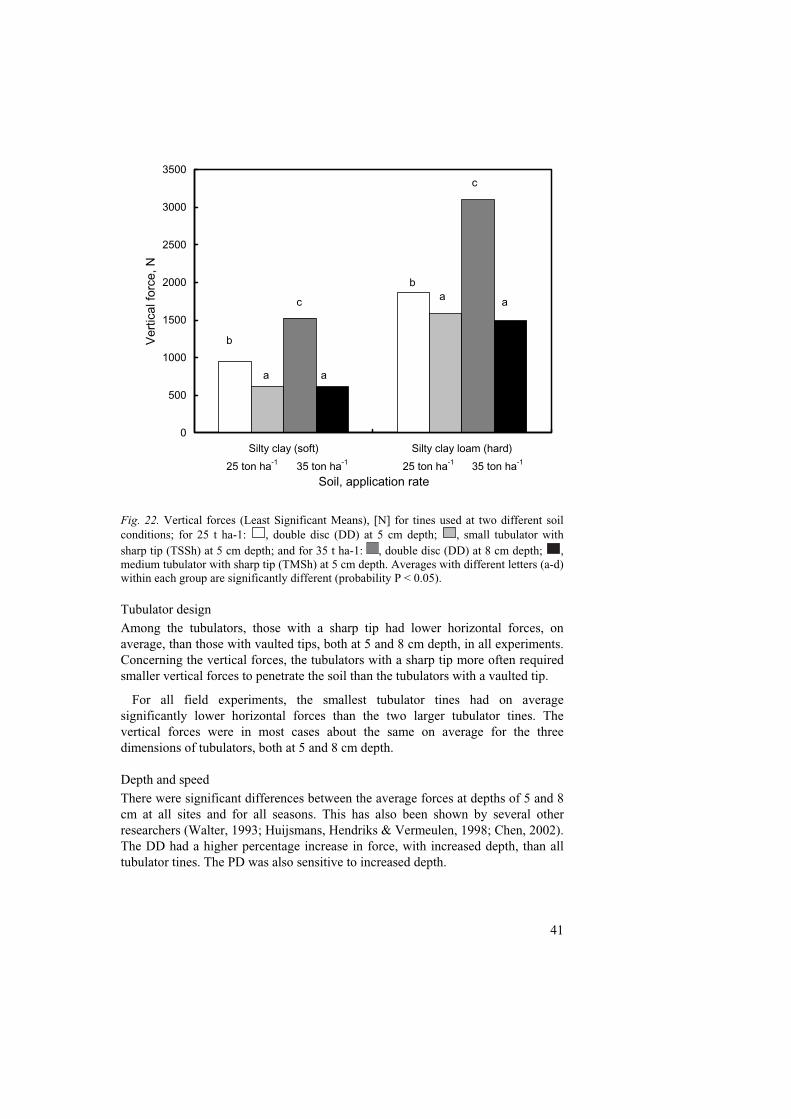
41
0
500
1000
1500
2000
2500
3000
3500
Silty clay (soft) Silty clay loam (hard)
Soil, application rate
Ver
tical
forc
e, N
25 ton ha-1 25 ton ha-135 ton ha-1 35 ton ha-1
b
a
c
a
ba
c
a
Fig. 22. Vertical forces (Least Significant Means), [N] for tines used at two different soil conditions; for 25 t ha-1: , double disc (DD) at 5 cm depth; , small tubulator with sharp tip (TSSh) at 5 cm depth; and for 35 t ha-1: , double disc (DD) at 8 cm depth; , medium tubulator with sharp tip (TMSh) at 5 cm depth. Averages with different letters (a-d) within each group are significantly different (probability P < 0.05).
Tubulator design Among the tubulators, those with a sharp tip had lower horizontal forces, on average, than those with vaulted tips, both at 5 and 8 cm depth, in all experiments. Concerning the vertical forces, the tubulators with a sharp tip more often required smaller vertical forces to penetrate the soil than the tubulators with a vaulted tip.
For all field experiments, the smallest tubulator tines had on average significantly lower horizontal forces than the two larger tubulator tines. The vertical forces were in most cases about the same on average for the three dimensions of tubulators, both at 5 and 8 cm depth. Depth and speed There were significant differences between the average forces at depths of 5 and 8 cm at all sites and for all seasons. This has also been shown by several other researchers (Walter, 1993; Huijsmans, Hendriks & Vermeulen, 1998; Chen, 2002). The DD had a higher percentage increase in force, with increased depth, than all tubulator tines. The PD was also sensitive to increased depth.
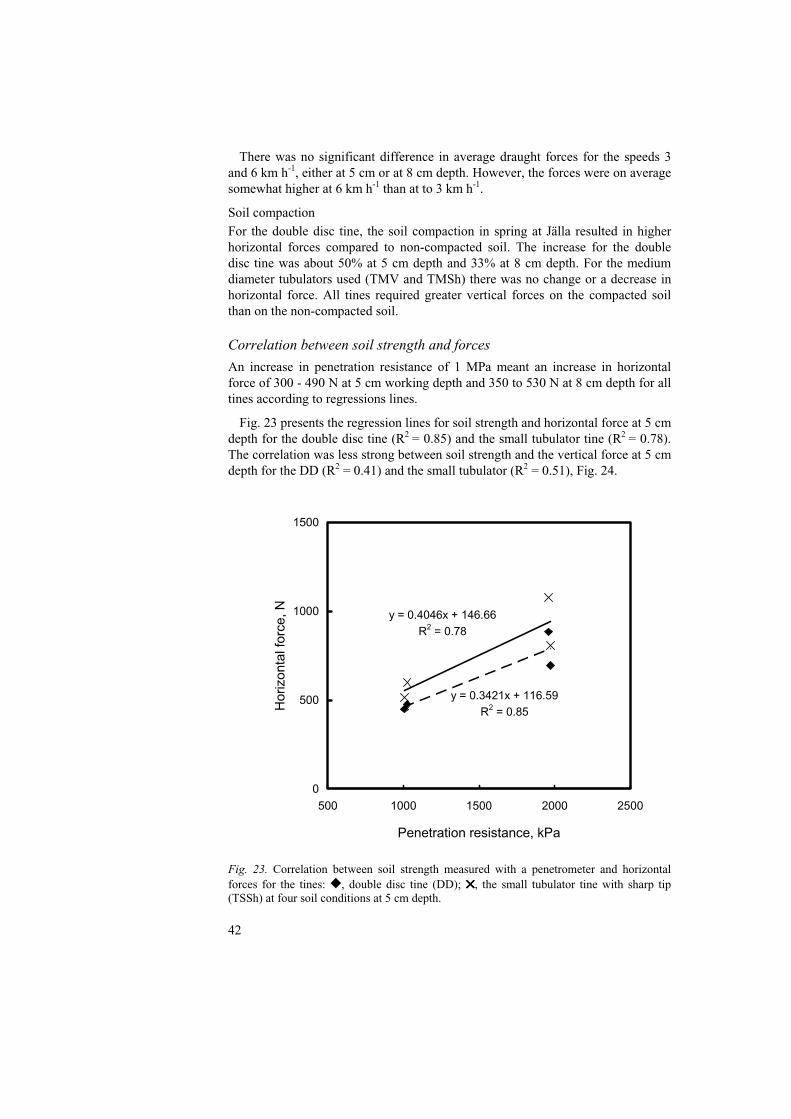
42
There was no significant difference in average draught forces for the speeds 3 and 6 km h-1, either at 5 cm or at 8 cm depth. However, the forces were on average somewhat higher at 6 km h-1 than at to 3 km h-1.
Soil compaction For the double disc tine, the soil compaction in spring at Jälla resulted in higher horizontal forces compared to non-compacted soil. The increase for the double disc tine was about 50% at 5 cm depth and 33% at 8 cm depth. For the medium diameter tubulators used (TMV and TMSh) there was no change or a decrease in horizontal force. All tines required greater vertical forces on the compacted soil than on the non-compacted soil. Correlation between soil strength and forces
An increase in penetration resistance of 1 MPa meant an increase in horizontal force of 300 - 490 N at 5 cm working depth and 350 to 530 N at 8 cm depth for all tines according to regressions lines.
Fig. 23 presents the regression lines for soil strength and horizontal force at 5 cm depth for the double disc tine (R2 = 0.85) and the small tubulator tine (R2 = 0.78). The correlation was less strong between soil strength and the vertical force at 5 cm depth for the DD (R2 = 0.41) and the small tubulator (R2 = 0.51), Fig. 24.
y = 0.4046x + 146.66R2 = 0.78
y = 0.3421x + 116.59R2 = 0.85
0
500
1000
1500
500 1000 1500 2000 2500
Penetration resistance, kPa
Hor
izon
tal f
orce
, N
Fig. 23. Correlation between soil strength measured with a penetrometer and horizontal forces for the tines: �, double disc tine (DD); ✕✕✕✕, the small tubulator tine with sharp tip (TSSh) at four soil conditions at 5 cm depth.
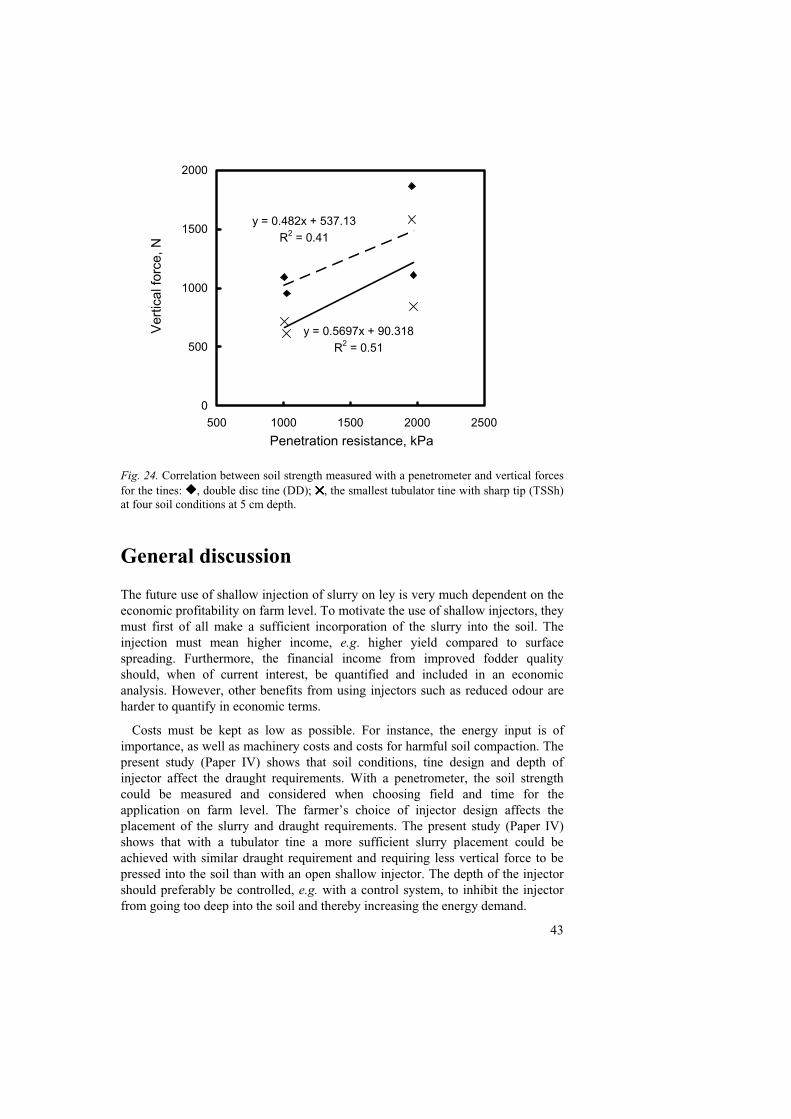
43
y = 0.482x + 537.13R2 = 0.41
y = 0.5697x + 90.318R2 = 0.51
0
500
1000
1500
2000
500 1000 1500 2000 2500
Penetration resistance, kPa
Ver
tical
forc
e, N
Fig. 24. Correlation between soil strength measured with a penetrometer and vertical forces for the tines: �, double disc tine (DD); ✕✕✕✕, the smallest tubulator tine with sharp tip (TSSh) at four soil conditions at 5 cm depth.
General discussion
The future use of shallow injection of slurry on ley is very much dependent on the economic profitability on farm level. To motivate the use of shallow injectors, they must first of all make a sufficient incorporation of the slurry into the soil. The injection must mean higher income, e.g. higher yield compared to surface spreading. Furthermore, the financial income from improved fodder quality should, when of current interest, be quantified and included in an economic analysis. However, other benefits from using injectors such as reduced odour are harder to quantify in economic terms.
Costs must be kept as low as possible. For instance, the energy input is of importance, as well as machinery costs and costs for harmful soil compaction. The present study (Paper IV) shows that soil conditions, tine design and depth of injector affect the draught requirements. With a penetrometer, the soil strength could be measured and considered when choosing field and time for the application on farm level. The farmer’s choice of injector design affects the placement of the slurry and draught requirements. The present study (Paper IV) shows that with a tubulator tine a more sufficient slurry placement could be achieved with similar draught requirement and requiring less vertical force to be pressed into the soil than with an open shallow injector. The depth of the injector should preferably be controlled, e.g. with a control system, to inhibit the injector from going too deep into the soil and thereby increasing the energy demand.
44
The slurry infiltration rate in soil was very low with the properties of slurry and soils shown in Paper III. Together with the prevailing warm weather conditions and low stubble height, this led to high ammonia emissions after surface spreading. Before the slurry had infiltrated into the soil, large amounts of ammonia had volatilised. Altogether, this stresses the importance of quick and efficient incorporation on ley preferably by using shallow injectors with closed slots.
Machinery test and research results are important as a decision support for farmers when choosing spreading equipment including injectors. The placement of slurry after the injection on ley is one important parameter for judging the performance of an injector, as it influence the size of the ammonia emissions and the contamination of the crop. Methods for measuring the placement in field experiments should be practical, inexpensive, relatively fast and non-sensitive to disturbances like rain. The methods for contamination of crop and slurry placement in the soil identified here (Paper I) fulfil the desired properties. Additional demands on the method for slurry placement in soil are non-destructiveness of soil and three-dimensional slurry placement. The latter gives the possibility to calculate the proportion of the slurry applied that is placed below the soil surface.
The main argument for using injectors is that lower ammonia emissions lead to increased yield. However, this was not confirmed in the present experiments (Papers II and III). Other researchers have attributed the lack of yield increase to crop damage caused by the tines counteracting the yield increase (Misselbrook, Laws & Pain, 1996; Rahman et al., 2001; Mattila, Joki-Tokola, & Tanni, 2003). On the other hand, yield increases have also been recorded when using shallow or deep injectors compared with surface spreading (Luten, Geurink & Woldring, 1983; Warner, Godwin & Hann, 1991; Bittman et al., 2004). In the present experiments, shortage of water (dry season) could be another reason for the low response from slurry application. The presumption may be that fertilisation must be combined with irrigation during dry periods to promote high nitrogen utilisation and yield.
However, the implementation of new environmental technology could also be governed by authorities through legalisation or subsidies, in order to reduce environmental problems like acidification and eutrophication. Farmers may also make a decision in favour of the injection technology for reasons other than strictly economic considerations e.g. low ammonia emissions, improved fodder quality, reduced odour. In organic farming, the nitrogen price in commercial organic fertilisers is about three times higher than that in mineral fertilisers. This means that the shallow injector with reduced ammonia emissions could be economically profitable on an organic farm at lower amounts of slurry handled than on a conventional farm.
45
General conclusions
The general conclusion is that with appropriate design of the injector tines, such as the tubulator, slurry could be placed below the soil surface even in hard soil conditions, with minimised ammonia emissions but at an extra energy input and investment cost.
It was possible to measure the amount of slurry present on the grass stubble after spreading by a method based on EC-measurements of stubble rinse water. The method developed was practically applicable and considered reliable. Depth and width of slurry trails in the soil described the location of the slurry in the soil. The measurements were fast and simple and required minimal data processing.
The name ‘injector’ on a spreader does not guarantee a sufficient injection of slurry. Only one of three injectors, that with double disc tines, was able to place the slurry 50 mm deep into the soil in all years when spreading after the first cut. The tines of this spreader place the slurry in open slots, which leaves the slurry surface in direct contact with the air and allows some losses of ammonia. The ammonia emissions were reduced by 50% with the double disc tine injector compared with band spreading of the slurry on the soil surface. This meant on average a reduced loss of nitrogen corresponding to 18 kg N/ha.
However, the reduced loss of ammonia nitrogen did not result in higher dry matter (DM) yield or apparent nitrogen recovery (ANR) by the crop compared to band spreading. Reasons for this could be dry weather conditions and/or crop damage by the tines.
The slurry infiltration rate in soil was very low with the properties of slurry and soils shown in Paper III. Together with the prevailing warm weather conditions and low stubble height, this gave rise to high ammonia emissions after surface spreading. Before the slurry had infiltrated into the soil, large amounts of ammonia had volatilised. Altogether, this emphasises the importance of quick and efficient incorporation on ley, preferably by using shallow injectors with closed slots.
When spreading slurry after the first cut, the soil is often dry and hard. The strength of the soil is reduced with increased moisture content (MC) and thereby the working depth of the injector also increases. Force measurements showed a positive linear relationship between soil strength and draught requirement. By making preliminary measurements of the soil strength with a penetrometer, it can be possible to predict the draught demand for the two types of injectors studied.
The draught forces required for injection into closed slots compared to open slots were similar or slightly higher. An advantage with the tubulator was that higher rates of slurry could be placed into the soil at a lower depth than for the double disc tine. As the draught requirements increase more with depth than body size, this meant about half of the draught requirements for the tubulator at higher rates compared with the double disc tine. For a tubulator tine (closed slots), design parameters such as tip shape and body size influence the draught requirements. The design of the tubulator meant significantly lower forces to be pressed into the
46
soil than for the double disc tine. Ammonia losses after injection with the tubulator were 1.6% and for the double disc tine 27% of the ammonia nitrogen applied.
Slurry spreading on ley increases the risk of reduced fodder quality due to the increased content of clostridial spores in silage compared with no slurry. Despite the insufficient incorporation achieved, silage quality seemed to be improved by shallow injection compared to band spreading of slurry on ley.
Economic simulations showed that shallow injection was less profitable than broadcast spreading or band spreading under the options set in this study. The low cost method (broadcast spreading) was the most economically competitive for up to 7 000 m3 of slurry handled per year. With larger amounts of slurry, band spreading was a more profitable method compared to broadcast spreading. Shallow injection was less profitable up to at least 14 000 t yr-1. Possible improvements in fodder quality by injection on ley were not included in the economic analysis.
Future research These studies have raised the following issues, which will require further research:
• Injection depth has a great influence on slurry placement and draught requirement. There is a need for a depth control system in order to control and optimise the slurry placement and minimise the draught requirements of a shallow injector for closed slots.
• Does the placement of slurry in narrow, concentrated trails into the soil influence the nutrient availability for plants compared with surface spreading?
• Do choice of crop species and shape of injection cut influence crop yield?
• In the present studies, only the harvest directly after spreading was measured. Long-term field experiments with shallow injection in grassland are needed in order to monitor the yield effect and ANR over longer periods (several harvests), possibly with complementary irrigation in dry seasons.
• Incorporation could also mean a slight increase in greenhouse gases such as N2O and CH4 compared with surface spreading. In an ongoing project, a 4 m wide injector with tubulator tines has been constructed and the greenhouse gases N2O and CH4 are being measured. More studies are needed to understand the influencing factors, e.g. soil conditions, for different spreading seasons and diurnal variations.
References
APHA 1985. Standard Methods (16th edition) 1985. American Public Health Association, St. Meth. 417A+d. Washington D.C., USA.
Araya, K. 1994. Optimization of the design of subsoiling and pressurized fluid injection equipment. Journal of Agricultural Engineering Research 57, 39-52.
47
Arla Foods 2003. Kvalitetsprogram för svenska och danska mjölkproducenter i Arla Foods [Quality program for Swedish and Danish milk producers in Arla Foods], Chapter 8. Århus, Denmark.
Arvidsson, J. & Håkansson, I. 1991. A model for estimating crop yield losses caused by soil compaction. Soil and Tillage Research 20, 319-332.
ASAE (American Society of Agricultural Engineers) 2004. Standard S313.3 FEB04: Soil cone penetrometer. ASAE Standards, Engineering Practices and Data. St. Joseph, MI, USA, 843-844.
Barrington, S.F. & Madramootoo, C.A. 1989. Investigating seal formation from manure infiltration into soils. Transactions of the ASAE 32(3), 851-856.
Bittman, S., van Vliet, L.J.P., Kowalenko, C.G., McGinn, S., Lau, A.K., Patni, N., Forge, T., McLaughlin, N., Hunt, D.E., Bounaix, F. & Friesen, A. 2004. A low disturbance technique for applying slurry on forage land. In: Controlling nitrogen flows and losses (Hatch, D.J., Chadwick, D.R., Jarvis, S.C. & Roker, J.A. eds). Wageningen Academic Publishers, The Netherlands. ISBN 9076998434.
Brady, N.C. & Weil, R.R. 2002. The Nature and Properties of Soils. 13th ed. New Jersey, USA. ISBN 0-13-016763-0.
Brundin, S.G. & Rodhe, L.K.K. 1994. Comparisons of manure handling systems under Swedish conditions. Journal of Agricultural and Engineering Research 58, 181-190.
Bussink, D.W., Huijsmans, J.F.M. & Ketelaars, J.J.M.H. 1994. Ammonia volatilization from nitric-acid-treated cattle slurry surface applied to grassland. Netherlands Journal of Agricultural Science 42(4), 293-309.
Campbell, D.J. & O’Sullivan, M.F. 1991. The cone penetrometer in relation to trafficability, compaction, and tillage. In: Soil Analysis: Physical Method. (Smith, K.A. & Mullins, C.E. eds). New York, USA: Marcel Dekker Inc.
CEN (European Committee for standardization) 2002a. Agricultural machinery – Slurry tankers and spreading devices – Environmental protection – Requirements and test methods for the spreading precision. European Standard EN 13406.
CEN (European Committee for standardization) 2002b. Agricultural machinery – Manure spreaders – Environmental protection – Requirements and test methods. European Standard EN 13080.
Chadwick, D.R., Martinez, J., Marol, C. & Béline, F. 2001. Nitrogen transformations and ammonia loss following injection and surface application of pig slurry: a laboratory experiment using slurry labelled with 15N-ammonium. Journal of Agricultural Science 136, 231-240.
Chen, Y. & Tessier, S. 2001. Criterion for design and selection of injection tools to minimize liquid manure on the soil surface. Transactions of the ASAE 44(6), 1421-1428.
Chen, Y. 2002. A liquid manure injection tool adapted to different soil conditions. Transactions of the ASAE 45(6), 1729-1736.
Davis, S., Faibank, W. & Weissheit, H. 1973. Dairy waste ponds effectively self-sealing. Transactions of the ASAE 16(1), 69-71.
Denmead, O.T. 1983. Micrometeorological methods for measuring gaseous losses of nitrogen in the field. In: Gaseous Loss of Nitrogen from Plant-Soil Systems.
48
(Freney J.R. & Simpson J.R. eds). Martinus Nijhoff/Dr W. Junk publishers, The Hague, 133-158.
Desbiolles, J.M.A., Godwin, R.J., Kilgour, J. & Blackmore B.S. 1997. A novel approach to the prediction of tillage tool draught using a standard tine. Journal of Agricultural Engineering Research 66, 295-309.
Desbiolles, J.M.A., Godwin, R.J., Kilgour, J. & Blackmore, B.S. 1999. Prediction of tillage implement draught using cone penetrometer data. Journal of Agricultural Engineering Research 73, 65-76.
De Tar, W.R. 1979. Infiltration of liquid dairy manure into soil. Transactions of ASAE 22(3), 520-528.
de Toro, A. & Hansson, P.-A. 2004. Machinery Co-operatives – a case study in Sweden. Biosystems Engineering 87(1), 13-25. Doi: 10.1016/j.biosystemseng. 2003.10.010.
Ekström, G. 1927. Classification of Swedish soils. Geological Survey of Sweden (SGU), Serial C, Dissertation and Essays, No. 345. Stockholm, Sweden (In Swedish).
Enfält, P. 1993. A method for measuring single-nozzle distributions influenced by other nozzles. Dep. of Agricultural Engineering, Report 173. Swedish University of Agricultural Sciences, Uppsala, Sweden.
Engstrand, U. & Olsson, U. 2003. Variansanalys och försöksplanering [Analysis of variance and experiment planning]. Lund, Sweden. ISBN 91-44-03025-8.
Eriksson, J., Andersson, A. & Andersson, R. 1999. Åkermarkens matjordstyper [Texture of agricultural topsoils in Sweden]. Swedish Environmental Protection Agency, Report 4955. Stockholm, Sweden (In Swedish). ISBN91-620-4955-0.
Etana, A. 1995. Compaction effects of mechanical stress on some Swedish arable soils. Ph D Thesis, Department of Soil Sciences, Reports and dissertations 24, Swedish University of Agricultural Sciences, Uppsala, Sweden.
FAO (Food and Agriculture Organisation of the United Nations) 1985. Guidelines concerning hygienic animal manure handling. Elaborated on behalf of FAO by subnetwork 1 in the FAO network ‘Animal Waste Utilization’. Department of animal hygiene, Report 14. Swedish University of Agricultural Sciences, Skara, Sweden.
FAO (Food and Agriculture Organisation of the United Nations) 1990. Guidelines for soil profile description (3rd ed., revised), 1-70. Land and water development division, FAO, Rome, Italy.
Fielke, J.M. 1989. The influence of chisel plough share wing geometry on tillage forces. In: Land and Water Use (Dodd, V.A. & Grace, P.M. eds), 1531-1538, Balkema, Rotterdam. ISBN 9061919800.
Flessa, H. & Beese, F. 2000. Atmospheric pollutants and trace gases. Laboratory estimates of trace gas emissions following surface application and injection of cattle slurry. Journal of Environmental Quality 29, 262-268.
Frost, J.P. 1994. Effect of spreading method, application rate and dilution on ammonia volatilization from cattle slurry. Grass and forage science 49, 391-400.
Gebresenbet, G. 1989. Measurement and prediction of forces on plough bodies – 1. Measurement of forces and soil dynamic parameters. In: Land and Water Use (Dodd, V.A. & Grace, P.M. eds), 1539-1546. Balkema, Rotterdam. ISBN 9061919800.
49
Gebresenbet, G. & Jönsson, H. 1992. Performances of seed drill coulters in relation to speed, depth and rake angles. Journal of Agricultural Engineering Research 52, 121-145.
Gibson, T. 1965. Clostridia in silage. Journal of Applied Bacteriology 28, 56-62. Godwin, R. J. 1975. An extended octagonal ring transducer for use in tillage
studies. Journal of Agricultural Engineering Research 20, 347-352. Hann, M.J., Warner, N.L. & Godwin, R.J. 1987. Slurry injector design and
operational practices for minimising soil surface disturbance and crop damage. ASAE Paper No 87-1610.
Hansen, M.N., Sommer, S.G. & Madsen, N.P. 2003. Reduction of ammonia emission by shallow slurry injection: Injection efficiency and additional energy demand. Journal of Environmental Quality 32, 1099-1104.
Huijsmans, J.F.M., Hol, J.M.G. & Bussink, D.W. 1997. Reduction of ammonia emission by new application techniques on grassland. In: Gaseous Nitrogen Emissions from Grasslands (Jarvis, S.C. & Pain, B.F. eds), 281-285. CAB International, UK. ISBN 0-85199-192-0.
Huijsmans, J.F.M., Hendriks, J.G.L. & Vermeulen, G.D. 1998. Draught requirement of trailing-foot and shallow injection equipment for applying slurry to grassland. Journal of Agricultural Engineering Research 71, 347-356. Article No. Ag980332.
Huijsmans, J.F.M., Hol, J.M.G. & Hendriks, M.M.W.B. 2001. Effect of application technique, manure characteristics, weather and field conditions on ammonia volatilization from manure applied to grassland. Netherlands Journal of Agricultural Science 49, 323-342.
Huijsmans, J., Verwijs, B., Rodhe, L. & Smith, K. 2004. Costs of emission-reducing manure application. Bioresource Technology 93(1), 11-19.
Husted, S., Jensen, L.S. & Storgaard Jørgensen, S. 1991. Reducing ammonia loss from cattle slurry by the use of acidifying additives: the role of the buffer system. Journal of the Science of Food and Agriculture 57, 335-349.
Jansson, S.L. & Persson, J. 1982. Mineralization and immobilisation of soil nitrogen. Nitrogen in Agricultural Soils, Agronomy Monograph No. 22, ASA-CSSA-SSSA, Madison, USA.
Jonsson A. 1990. Enumeration and confirmation of C. tyrobutyricum in silage using neutral red, D-cycloserine and lactate dehydrogenase activity. Journal of Dairy Science 73, 719 – 725.
Jordbruksverket 1999. Kalkylprogrammet STANK 4.0. [Computer program Manure – recycling of nutrients]. Swedish Board of Agriculture, Jönköping, Sweden.
Kapuinen, P. 1997. Pulling force requirement of a light liquid manure injector on silty clay soil. AUE (Agricultural University of Estonia), Transactions 193, 61-68. Tartu, Estland.
Kepner, R.A., Bainer, R. & Barger, E.L. 1972. Principles of Farm Machinery. 2nd edition. The AVI publishing company, inc. Westport, Connecticut, USA.
Kushwaha, R.L., Vaishnav, A.S. & Zoerb, G.C. 1986. Soil bin evaluation of disc coulters under no-till crop residue conditions. Transactions of ASAE 29(1), 40-44.
50
Lockyer, D.R. 1984. A system for the measurement in the field of losses of ammonia through volatilisation. Journal of the Science of Food and Agriculture 35, 837-848.
Lorenz, F. & Steffens, G. 1997. Effect of application techniques on ammonia losses and herbage yield following slurry application to grassland. In: Gaseous Nitrogen Emissions from Grasslands (Jarvis, S.C. & Pain, B.F. eds), 287-292. CAB International, UK.
Luten, W., Geurink, J.H. & Woldring J.J. 1983. Yield response and nitrate accumulation of herbage by injection of cattle slurry in grassland. In: Efficient Grassland Farming (Corrall, A.J. ed). Occasional Symposium No 14, British Grassland Society, 185-191.
Malgeryd, J. 1994. Manure characterization. International Agrophysics 8(1), 93-101. Polish Academy of Sciences, Lublin.
Malgeryd, J. 1998. Technical measures to reduce ammonia losses after spreading of animal manure. Nutrient Cycling in Agroecosystems 51(1), 51-57.
Malgeryd, J. & Wetterberg, C. 1996. Physical properties of solid and liquid manures and their effects on the performance of spreading machines. Journal of Agricultural Engineering Research 64, 289-298.
Malmqvist, O. & Spörndly, R. 1993. Stallgödsel på slåttervall. Inverkan på djurhälsa och mjölkkvalitet [Application of manure on ley - Influence on animal health and milk quality.] Aktuellt från lantbruksuniversitetet 417, Husdjur, Uppsala, Sweden (In Swedish).
Mattila, P.K. & Joki-Tokola, E. 2003. Effect of treatment and application technique of cattle slurry on its utlization by ley: I. Slurry properties and ammonia volatilization. Nutrient Cycling in Agroecosystems 65, 221-230.
Mattila, P.K., Joki-Tokola, E. & Tanni, R. 2003. Effect of treatment and application technique of cattle slurry on its utilization by ley : II. Recovery of nitrogen and composition of herbage yield. Nutrient Cycling in Agroecosystems 65, 231-242.
Mead, R., Curnow, R.N. & Hasted, A.M. 1993. Statistical Methods in Agriculture and Experimental Biology. 2nd edition. Chapman & Hall, London, UK. ISBN 0 412 35470 5.
Miller, M.H., Robinson, J.B. & Gillham, R.W. 1985. Self-sealing of earthen liquid manure storage ponds: I. A case study. Journal of Environmental Quality 14, 533-538.
MINITAB 2000. Minitab™ Statistical software. Release 13 for Windows®, USA. ISBN 0-925636-44-4.
Misselbrook, T.H., Laws, J.A. & Pain, B.F. 1996. Surface application and shallow injection of cattle slurry on grassland: nitrogen losses, herbage yields and nitrogen recoveries. Grass and Forage Science 51, 270-277.
Misselbrook, T. & Hansen, M.N. 2001. Field evaluation of the equilibrium concentration technique (JTI method) for measuring ammonia emission from land spread manure or fertiliser. Atmospheric Environment 35, 3761-3768.
Misselbrook, T.H., Pain, B. & Genermont, S. 2001. Ammonia losses from field applied manure – A review of the measurement techniques. In: Ammonia Losses from Field Applied Animal Manure. (Sommer, S.G., Hutchings, N.J. & Carton, O.T. eds) Plant Production, Report No. 60, Danish Institute of Agricultural Sciences, Denmark.
51
Misselbrook, T.H., Nicholson, F.A. & Chambers, B.J. 2002. Predicting ammonia loss following the application of livestock manure to land. Proceedings of the 10th International Conference RAMIRAN, May 14 - 18, 2002 in Štrbské Pleso, High Tatras, Slovak Republic.
Misselbrook, T.H., Smith K.A., Johnson, R.A. & Pain, B.F. 2002. Slurry application techniques to reduce ammonia emissions: Results of some UK field-scale experiments. Biosystems Engineering 81(3), 313-321. Doi: 10.1006/bioe.2001.0017.
Morken, J. 1992. Ammonia losses after application of slurry to grassland. The effect of application techniques and type of slurry. Norsk lantbruksforsking 6, 315-329. ISSN 0801-5333 (In Norwegian; summary in English).
Morken, J. & Sakshaug, S. 1997. New injection technique – Direct Ground Injection (DGI®). In: Proceedings of the International Symposium: ‘Ammonia and Odour Control from Animal Production Facilities’, Vol.2 (Voermans, J.A.M. & Monteny, G.J. eds) October 6-10, 1997, Vinkeloord, 585-590. The Netherlands. ISBN 90-9011059-3.
Moseley, P.J., Misselbrook, T.H., Pain, B.F., Earl, R. & Godwin, R.J. 1998. The effect of injector tine design on odour and ammonia emissions following injection of bio-solids into arable cropping. Journal of Agricultural Engineering Research 71(4), 385-394. Article No. Ag980337.
Möller, N. 1971. Methods for engineering research on soil tillage tools and development of a mobile test rig for studies of light tillage implements. Dept. of Agricultural Engineering, Report 3. Swedish University of Agricultural Sciences, Uppsala, Sweden (In Swedish).
Negi, S.C., McKyes, E., Godwin, R.J. & Ogilvie, J.R. 1978. Design and performance of a liquid manure injector. Transactions of the ASAE 21(5), 963-966, 971.
Nichols, M.L. 1931. The dynamic properties of soil. II. Soil and metal friction. Agricultural Engineering 12, 321-324.
NMKL (Nordisk Metodikkommitté för livsmedel) 1976. NMKL-metod nr 6. Nitrogen. Bestämning i livsmedel och fodermedel efter Kjeldahl, 3rd ed., Oslo, Norway.
Pahl, O., Godwin, R.J., Hann, M.J. & Waine, T.W. 2001. Cost-effective pollution control by shallow injection of pig slurry into growing crops. Journal of Agricultural Engineering Research 80(4), 381-390. Doi: 10.1006/ jaer.2001.0763.
Palmer, A.L. & Smith, P.A. 1988. The importance of specifying the soil and operating parameters in tillage research. Conference on Agricultural Engineering 1988, Hawkesbury Agricultural College, NSW, 25-29 September 1988. National Conference Publication No. 88/12. The Institution of Engineers, Australia.
Petersen, S.O., Nissen, H.H., Lund, I. & Ambus, P. 2003. Redistribution of slurry components as influenced by injection method, soil, and slurry properties. Journal of Environmental Quality 32, 2399-2409.
Phillips, V.R, Pain, B.F. & Klarenbeek, J.V. 1991. Factors influencing the odour and ammonia emissions during and after the land spreading of animal slurries. In: Odour and Ammonia Emissions from Livestock Farming. (Nielsen, V.C., Voorburg, J.H. & L´Hermite, P. eds). Proceedings of a seminar held in Silsoe, UK, 26-28 March 1990, 98-106. Elsevier Applied Science, London, UK.
52
Prins, W.H. & Snijders, P.J.M. 1987. Negative effects of animal manure on grassland due to surface spreading and injection. In: Animal Manure on Grassland and Fodder Crops. Fertilizer or Waste? (van der Meer, H.G., Unwin, R.J., van Dijk, T.A. & Ennik, G.C. eds), 119-135. The Netherlands. ISBN 90-247-3568-8.
Rahman, S. & Chen, Y. 2001. Laboratory investigation of cutting forces and soil disturbance resulting from different manure incorporation tools in a loamy sand soil. Soil & Tillage Research 58, 19-29.
Rahman, S., Chen, Y., Zhang, Q., Tessier, S. & Baidoo, S. 2001. Performance of a liquid manure injector in a soil bin and on established forages. Canadian Biosystems Engineering 43, 2.33-2.40.
RAMIRAN 2003. Glossary of terms on livestock manure management 2003. (Pain, B. & Menzi, H. eds). Recycling Agricultural, Municipal and Industrial Residues in Agriculture Network in ESCORENA, http://www.ramiran.net (accessed 16-Aug-2004).
Rammer, C., Östling, C., Lingvall, P. & Lindgren, S. 1994. Ensiling of manured crops - effects on fermentation. Grass and Forage Science, 49, 343-351.
Rammer, C. 1996a. Manure in grass silage production. Effects on silage fermentation and its hygienic quality. Doctorial thesis, Acta Universitatis Agriculturae Sueciae, Agraria 2, Swedish University of Agricultural Sciences, Uppsala. ISBN 91-576-5202-3.
Rammer, C. 1996b. Quality of grass silage infected with spores of Clostridium tyrobutyricum. Grass and Forage Science 51, 88-95.
Rees, Y.J., Pain, B.F., Phillips, V.R. & Misselbrook, T.H. 1993. The influence of surface and sub-surface application methods for pig slurry on herbage yields and nitrogen recovery. Grass and Forage Science 48, 38-44.
Rodhe, L., Salomon, E. & Rammer, C. 1996. Spreading of farmyard manure to ley with different methods. Yield and silage quality. Swedish Journal of Agricultural Research 26, 43-51.
Rodhe, L. & Karlsson, S. 2002. Ammonia emissions from broiler manure– influence of storage and spreading method. Biosystems Engineering 82(4), 455-462. Doi.1006/bioe.2002.0081.
Rodhe, L., Richert Stintzing, A. & Steineck, S. 2004. Ammonia emissions after application of human urine to a clay soil for barley growth. Nutrient Cycling in Agroecosystems 68, 191-198.
SAS Institute Inc (1994). SAS/STAT User´s Guide, Version 6, Fourth ed., Cary, NC, USA.
SCB 2002. Gödselmedel i jordbruket 2000/01. Handels- och stallgödsel till olika grödor samt hantering och lagring av stallgödsel [Fertiliser use in agriculture 2000/1], Statistics Sweden MI 30 SM 0202, Stockholm, Sweden.
SCB 2003. Utsläpp till luft av ammoniak i Sverige 2001 [Emission of ammonia to air in Sweden 2001]. Statistics Sweden MI 37 SM 0201, Stockholm, Sweden.
Schaaf, D.E., Hann, S.A. & Lindwall, C.W. 1981. Performance evalution of furrow openers cutting coulters and press wheels for seed drills. In: Crop Production with Conservation in the 80’s. ASAE publications 7-81, 76-84. ASAE, St Joseph, MI 49085.
SIS 2000. Swedish standards: SS-EN 12176-1, SS 028113-1, SS 028101-1. Swedish Standards Institute, Stockholm, Sweden.
53
Smith, K.A., Jackson, D.R., Misselbrook, T.H., Pain, B.F. & Johnson, R.A. 2000. Reduction of ammonia emission by slurry application techniques. Journal of Agricultural Engineering Research 77(3), 277-287. Doi:10.1006/jaer. 2000.0604.
Sommer S.G., Olesen J.E. & Christensen, B.T. 1991. Effects of temperature, wind speed and air humidity on ammonia volatilization from surface applied cattle slurry. Journal of Agricultural Science 117, 91-100.
Sommer, S.G. & Ersbøll, A.K. 1994. Soil tillage effects on ammonia volatilization from surface-applied or injected animal slurry. Journal of Environmental Quality 23, 493-498.
Sommer, S.G., Friis, E., Bak, A.B. & Schjørring, J.K. 1997. Ammonia emission from pig slurry applied with trail hoses or broadspread to winter wheat: Effects of crop developmental stage, microclimate, and leaf ammonia absorption. Journal of Environmental Quality 26, 1153-1160.
Sommer, S.G. & Jacobsen, O.H. 1999. Infiltration of slurry liquid and volatilization of ammonia from surface applied pig slurry as affected by soil water content. Journal of Agricultural Science 132, 297-303.
Sommer, S.G. & Hutchings N.J. 2001. Ammonia emission from field applied manure and its reduction – invited paper. European Journal of Agronomy 15, 1-15.
Sommer, S.G., Génermont, S., Cellier, P., Hutchings, N.J., Olesen, J.E. & Morvan, T. 2003. Processes controlling ammonia emission from livestock slurry in the field. European Journal of Agronomy 19, 465-486.
Sommer, S.G., Hansen, M.N. & Søgaard, H.T., 2004. Infiltration of slurry and ammonia volatilisation. Biosystems Engineering 88(3), 359-367. Doi: 10.1016/j.biosystemseng.2004.03.008.
Stafford, J.V. 1981. An application of critical state soil mechanics: The performance of rigid tines. Journal of Agricultural Engineering Research 26(5), 387-401.
Steineck, S., Gustafson, A., Richert Stintzing, A., Salomon, E., Myrbeck, Å., Albihn, A. & Sundberg, M. 2000a. Växtnäring i kretslopp. [Recirculation of plant nutrients]. SLU Kontakt 11, Swedish University of Agricultural Sciences, Uppsala, Sweden.
Steineck, S., Gustafson, G., Andersson, A., Tersmeden, M. & Bergström, J. 2000b. Plant nutrients and trace elements in livestock wastes in Sweden. Report 5111. Swedish Environmental Protection Agency, Stockholm, Sweden.
Steineck, S., Jakobsson, C., Åkerhielm, H. & Carlson, G. 2001. Environmental pressures and national environmental legislation with respect to nutrient management. Sweden (SE). In: Nutrient Management Legislation in European Countries. (De Clercq, P., Gertsis, A.C., Hofman, G., Jarvis, S.C., Neeteson, J.J. & Sinabell, F. eds), 250-265.
Svensson, L. 1993. A new dynamic chamber technique for measuring ammonia emissions from land-spread manure and fertilizers. Acta Agriculturae Scandinavica, Sect. B, Soil and Plant Science 44(1), 33-46.
Svensson, L. 1994. Ammonia volatilization following application of livestock manure to arable land. Journal of Agricultural Engineering Research 58(4), 241-260.
54
Svensson, L. & Ferm, M. 1993. Mass transfer coefficient and equilibrium concentration as key factors in a new approach to estimate ammonia emission from livestock manure. Journal of Agricultural Engineering Research 56(1), 1-11.
Swedish EPA (Environmental Protection Agency) 2002. Sweden’s fifteen environmental objectives. Publ. No 91-620-8083-0. 12 pp.
Thompson R.B., Ryden, J.C. & Lockyer, D.R. 1987. Fate of nitrogen in cattle slurry following surface application or injection to grassland. Journal of Soil Science 38(4), 689-700.
Thyselius L., Rodhe, L., Engdahl, L., Rammer, D. & Steineck, S. 1988. Spreading of cattle slurry on ley with different techniques – the utilization of nitrogen and the influence of silage quality. In: Storing, Handling and Spreading of Manure and Municipal Wastes, Proceedings of the Seminar of the 2nd Technical Section of the CIGR, JTI-Report 96:2, 20-22, Swedish Institute of Agricultural and Environmental Engineering, Uppsala, Sweden.
Tice, E.M. & Hendrick, J.G. 1992. Disc coulter operating characteristics. Transactions of the ASAE 35(1), 3-10.
UNECE (United Nations Economic Commission for Europe) 2004. Convention on Long-range Transboundary Air Pollution. The 1999 Gothenburg Protocol to Abate Acidification, Eutrophication and Ground-level Ozone. http://www.unece.org/env/lrtap/multi_h1.htm (accessed 16-Aug-2004).
van der Meer, H.G., Thompson, R.B., Snijders, P.J.M. & Geurink, J.H. 1987. Utilization of nitrogen from injected and surface-spread cattle slurry applied to grassland. In: Animal Manure on Grassland and Fodder Crops. Fertilizer or Waste? (van der Meer, H.G., Unwin, R.J., van Dijk, T.A. & Ennik, G.C. eds), 47-71. The Netherlands. ISBN 90-247-3568-8.
Vandré R. & Clemens, J. 1997. Studies on the relationship between slurry pH, volatilization processes and the influence of acidifying additives. Nutrient Cycling in Agroecosystems 47, 157-165.
Walter, A. 1993. Untersuchungen an Werkzeugen für die Direkteinbringung von Flüssigmist in Grünland. Forschungsbericht Agrartechnik des Arbeitskreises Forschung und Lehre der Max-Eyth-Gesellschaft (MEG) 237. Dissertation, Institut für Agrartechnik, Universität Hohenheim, Germany. ISSN 0931-6264.
Warner, N.L. & Godwin, R.J. 1988. An experimental investigation into factors influencing the soil injection of sewage sludge. Journal of Agricultural Engineering Research 39(4), 287-300.
Warner, N.L., Godwin, R.J. & Hann, M.J. 1991. Modifications to slurry injector tines to reduce surface disturbance and improve slot closure under dry grassland conditions. Journal of Agricultural Engineering Research 48, 195-207.
Weissbach, F. 1992. Bestimmung der Bufferkapazität [Determination of the buffer capacity]. Institutsinterne Mitteilung, 3 pp. Bundesanstalt für Landwirtschaft (FAL), Braunschweig, Germany.
Wijesuriya, S.D.E. 1990. The effect of the wedge angle on the draft force of narrow tines. Beiträge zur tropischen Landwirtschaft und Veterinärmedizin 28(4), 387-391.
Wulf, S., Maeting, M., Bergmann, S. & Clemens, J. 2001. Simultaneous measurement of NH3, N2O and CH4 to assess efficiency of trace gas emission abatement after slurry application. Phyton 41(3), 131-142. Austria.
55
Acknowledgements
I am very grateful to JTI – Swedish Institute of Agricultural and Environmental Engineering and the Department of Biometry and Engineering (formerly the Department of Agricultural Engineering) at SLU for making it possible for me to undertake my post-graduate studies. The studies were integrated in my research work at JTI with academic support from SLU, a very stimulating concept.
Naturally, there are many people who have supported me during my research. First of all I would like to thank my supervisors:
Professor Girma Gebresenbet, for believing in my research and for accepting the responsibility for being the main supervisor and contributing with his knowledge in agriculture engineering and measurements;
Statsagronom Tomas Rydberg for contributing with his knowledge in soil science, constructive ideas and long experience in soil management;
Dr. Lennart Svensson for his knowledge of ammonia emissions and friendly support and finally;
Professor Per-Anders Hansson for tying all ends together, ensuring the finalisation of my post-graduate studies.
In the everyday work, many of my colleges at JTI contributed their knowledge and assisted me in the projects. I had the privilege of working in the ‘The Dream Team of Shit Handling’! In most of the fieldwork, Marianne Tersmeden, Anders Ringmar and Jan Bergström assisted me with great knowledge, interest and capability. Göran Carlson, Stig Karlsson, Johan Malgeryd, Helena Åkerhielm, Mats Gustafsson, Jim Greatorex and Andrew Dustan also made important contributions to the present work. Johnny Ascue carried out all the ammonia analyses. To all of you, I am very thankful and appreciate your commitment to the research work and for being jolly fellows.
In building the system for force measurements, Sven Andersson (formerly SLU and JTI) made a very important contribution at a critical stage of my PhD work. In the realisation of the tubulator tine, in addition to my supervisors, Torbjörn Morén (JTI), and Ola Pettersson (JTI) were essential for identifying the final design. Without any of you, there would not have been a tubulator tine for slurry application.
The company Överum Bruk AB in Kongskilde Industries A/S and Vredo Dodewaard B.V., The Netherlands, kindly contributed parts for the tubulator and with a double disc tine, respectively. I would also thank Engineer Dick Gustafsson for help with materials and for being a laboratory companion in the measuring course.
I have received valuable collaboration and support from others. Many thanks to my co-authors Chri Rammer and Ararso Etana for good times both in the field and at the desk, writing the articles. You have been very encouraging and gave me good advice. I would like to thank Johan Arvidsson, who very timely arranged a

56
PhD course in soil mechanics, contributed to my project work with valuable inputs and showed a genuine interest for my work. I am also grateful to Håkan Jönsson, for very valuable comments at the final seminar. I have also appreciated very much the collaboration with Thomas Pauly on silage quality through the years.
I would also like to thank Birgitta Vegerfors-Persson, Gunnar Ekbohm and Lennart Norell for statistical support, Kim Gutekunst (always busy) for illustrations, Åsa Erikols and Pernilla Bäckström for library services, Andrew Dustan and Mary McAfee for linguistic improvements and Mari Engvall for help with the manuscripts. You have all made important contributions to this thesis.
I have appreciated very much the contacts and knowledge exchange with other PhD students, both at the Dep. of Biometry and Technology and the Dep. of Soil Science. My sincere thanks are also due to all my friends at JTI and in other places. One joke á day, keeps the anger away.
I would like to give my especial recognition and gratitude to the financial support from the Swedish Dairy Association (Papers I and II), the Swedish Board of Agriculture (Papers II and III), the Swedish Farmers’ Foundation for Agricultural Research (Paper IV), and from the Royal Swedish Academy of Agriculture and Forestry (Anders Elofson’s Fund), the latter for financing the time for writing the thesis. With your support, you have not only made the work possible, but also encouraged me to work in an important field of interest for you all.
Finally, I send my love and thanks to my beloved family, my husband Claes and my children Jonas and Camilla. You make everything worthwhile.