Embed Size (px)
Citation preview
An evaluation of pollutant dispersion and deposition models downwind from a traffic line (# 158)
Amir Ali Feiz*, Benjamin Loubet, Fabrice Dugay, Cécile Honoré, Brigitte Durand and Pierre Cellier
* INRA Grignon INRA GrignonEquipe Biosphère-Atmosphère (BioAtm)
UMR 1091 Environnement et Grandes Cultures (EGC)78850 Thiverval-Grignon, France
{amir.feiz, benjamin.loubet}@grignon.inra.fr
A L I M E N T A T I O N A G R I C U L T U R E
E N V I R O N N E M E N T
15th IUAPPA World Clean Air CongressVancouver, September 12-16, 2010
1
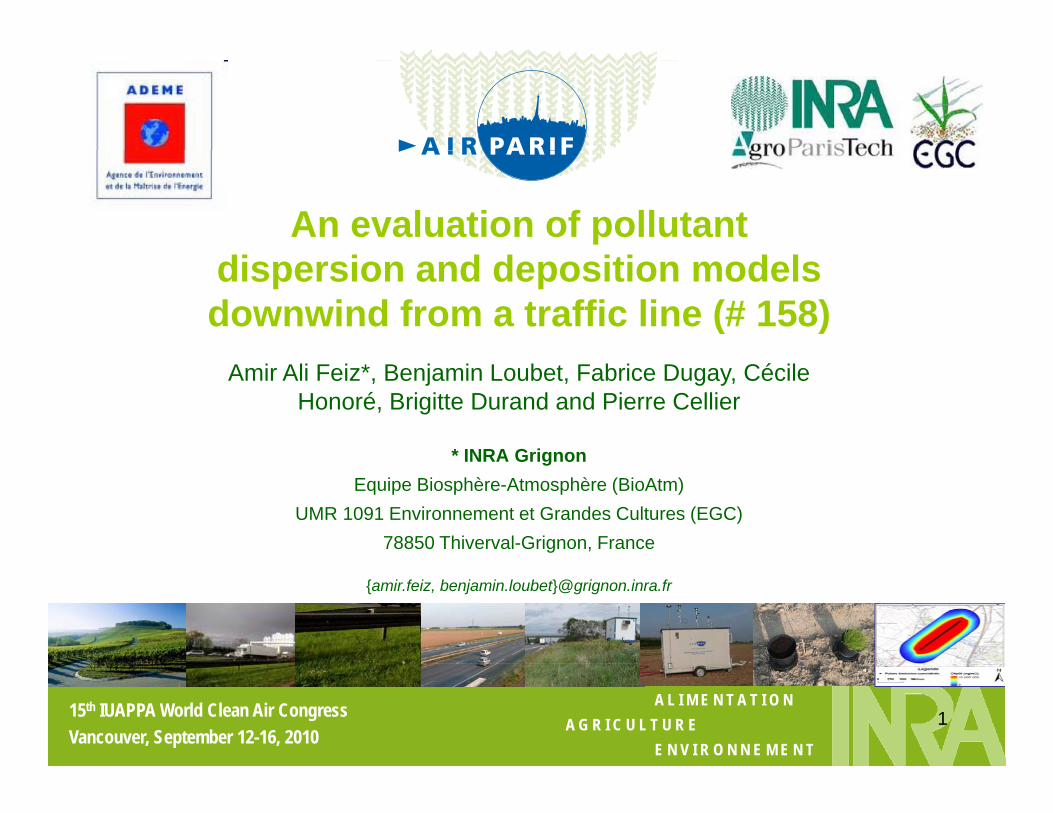
Environmental Issues: Ecological context (1) What types of emissions can be observed?
Traffic is a major source of (CITEPA, 2009):
– Nitrogen Oxides (NOx) – forms when fuels are burned at high temperatures (more than 50% is emitted nationwide)
– Particulate Matter (PM) – some of these particles are emitted in vehicle exhaust, while others are formed in the atmosphere through chemical reactions between the various pollutants found in exhaust (more than 16% of the total particulate matter emissions are related to road traffic))
• 20% PM10 (Dust), 25% PM2.5
– Heavy Metals (HM) – are emitted by traffic in smaller quantities than NOx. Copper (C ) i th i HM itt d b t ffi th 50% f C i i f t ffi(Cu) is the main HM emitted by traffic: more than 50% of Cu is coming from traffic in France. Other metals emitted in smaller quantities are, e.g. Zn, Fe, Cd, As, Pt, Pd, Rh.
A L I M E N T A T I O N A G R I C U L T U R E
E N V I R O N N E M E N T
15th IUAPPA World Clean Air CongressVancouver, September 12-16, 2010
2
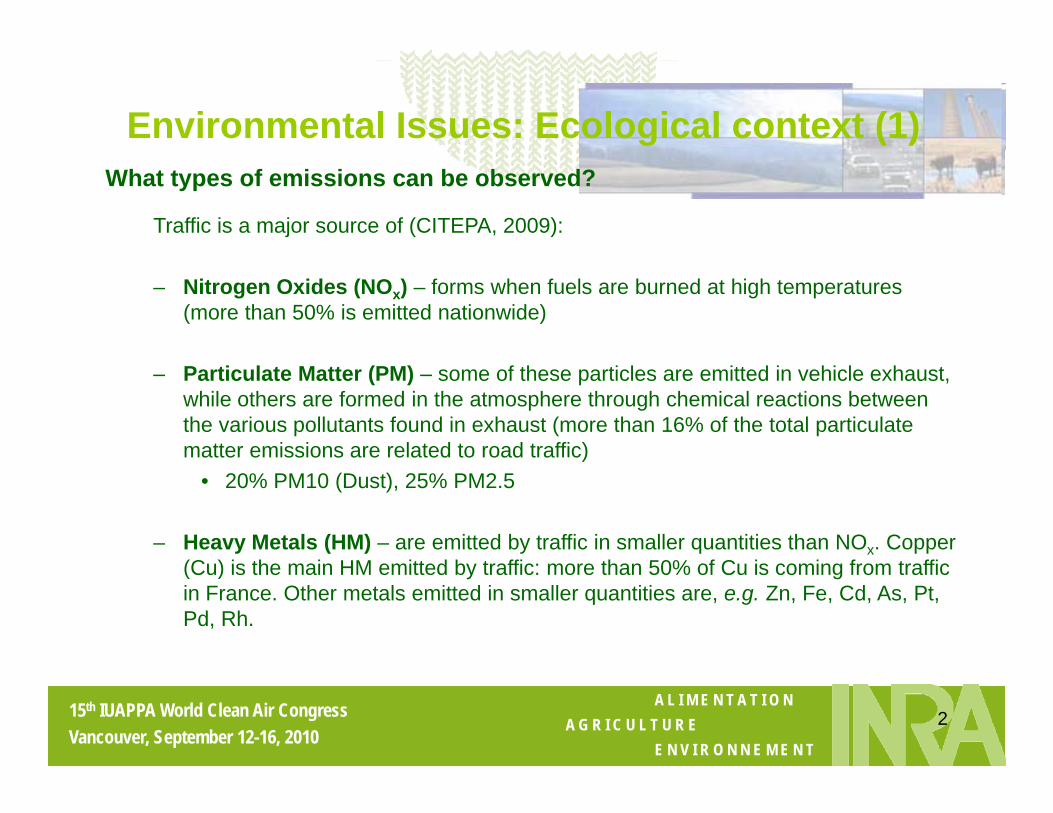
Environmental Issues: Ecological context (2) PM emission contributions?
PM emissions from traffic can be divided into three main groups:
– Direct exhaust emissions that are predominantly found in the fine fraction (PM2.5) and are documented in different emission databases (e.g. COPERT, …)
Di t i i th th h t i i f b k d– Direct emissions other than exhaust: emissions from brakes wear and clutches are emitted in roughly equal amounts in the fine and coarse (PM10-PM2.5) fraction and correlate well with the direct emissions and other vehicle emissions e.g. NOx
– Re-suspended PM emissions which arise from road abrasion, tyre wear androad dust that are found partly in the fine fraction and mostly in the coarsefraction. This PM source is often less correlated with the exhaust emission due tofraction. This PM source is often less correlated with the exhaust emission due toan influence from “external factors” such as road condition (wetness, salting,sanding, road material), use of studded tyres and climatic conditions (rain,turbulence). This PM source is also more difficult to model.
A L I M E N T A T I O N A G R I C U L T U R E
E N V I R O N N E M E N T
15th IUAPPA World Clean Air CongressVancouver, September 12-16, 2010
3
In the vicinity of most cities, and in particular near Paris, agricultural fieldsare intricated in the traffic lines This may lead to a potential increaseof pollution load onto local agricultural production
Objective
of pollution load onto local agricultural production
– to lay out a comprehensive field study in order to characterize the influence oftraffic-generated emissions on the temporal and spatial variability of air pollutantconcentrations in the near-road environmentconcentrations in the near road environment
– to evaluate the deposition of pollutants near heavy traffic lines under differentenvironmental conditions
⇒ A French national project was started in 2008 to: • evaluate the perception of farmers and consumers on this type of pollution• propose indicators of impact distances of the road pollution
A L I M E N T A T I O N A G R I C U L T U R E
E N V I R O N N E M E N T
15th IUAPPA World Clean Air CongressVancouver, September 12-16, 2010
4
… based on using dispersion models to interpret air quality measurements made close to the road
The impact distances are evaluated by comparing the results of three local dispersion
How?
The impact distances are evaluated by comparing the results of three local dispersionand deposition analytical models:
• FIDES-2D (Godson solution of the advection-diffusion equation, INRA, Loubetet al., 2001 and 2009)
• ADMS Urban (Gaussian dispersion model , CERC, 2001)• CALPUFF (Gaussian puff dispersion model, U.S. EPA, 2008)
And also by:And also by:* using the models to estimate dry deposition (dry deposition schemes of atmosphericPM are incorporated into the models)* comparing the simulations to measured concentrations and deposition rates
A L I M E N T A T I O N A G R I C U L T U R E
E N V I R O N N E M E N T
15th IUAPPA World Clean Air CongressVancouver, September 12-16, 2010
5
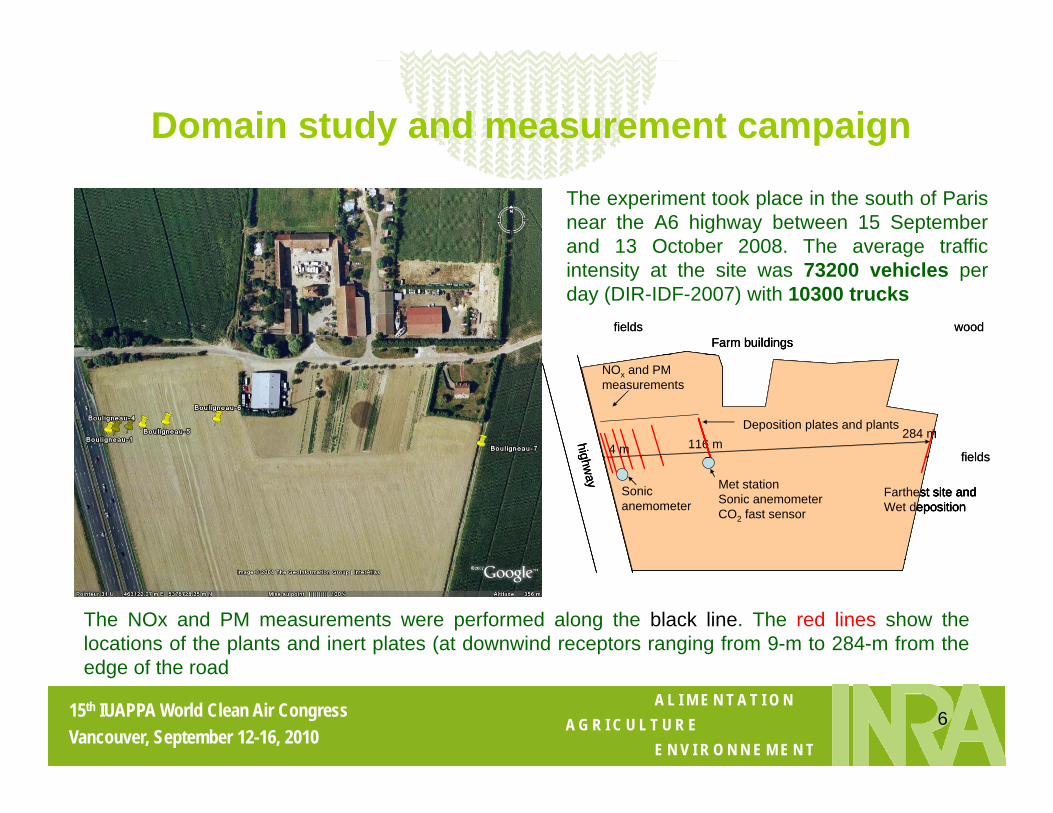
Domain study and measurement campaign
The experiment took place in the south of Parisnear the A6 highway between 15 Septemberand 13 October 2008. The average traffica d 3 Oc obe 008 e a e age a cintensity at the site was 73200 vehicles perday (DIR-IDF-2007) with 10300 trucks
Farm buildingsfields wood
Farm buildingsFarm buildingsfields wood
NOx and PMmeasurements
Deposition plates and plants
4 m 116 m284 mhig fields
NOx and PMmeasurements
Deposition plates and plants
4 m 116 m284 mhig
NOx and PMmeasurements
Deposition plates and plants
4 m 116 m284 m
NOx and PMmeasurements
Deposition plates and plants
4 m 116 m284 mhig fields
Met stationSonic anemometerCO2 fast sensor
Sonicanemometer
Farthest site andWet deposition
ghway
fields
Met stationSonic anemometerCO2 fast sensor
Sonicanemometer
Farthest site andWet deposition
ghway Met station
Sonic anemometerCO2 fast sensor
Sonicanemometer
Farthest site andWet deposition
Met stationSonic anemometerCO2 fast sensor
Sonicanemometer
Farthest site andWet deposition
ghway
fields
The NOx and PM measurements were performed along the black line. The red lines show thelocations of the plants and inert plates (at downwind receptors ranging from 9-m to 284-m from thed f th d
A L I M E N T A T I O N A G R I C U L T U R E
E N V I R O N N E M E N T
15th IUAPPA World Clean Air CongressVancouver, September 12-16, 2010
6
edge of the road
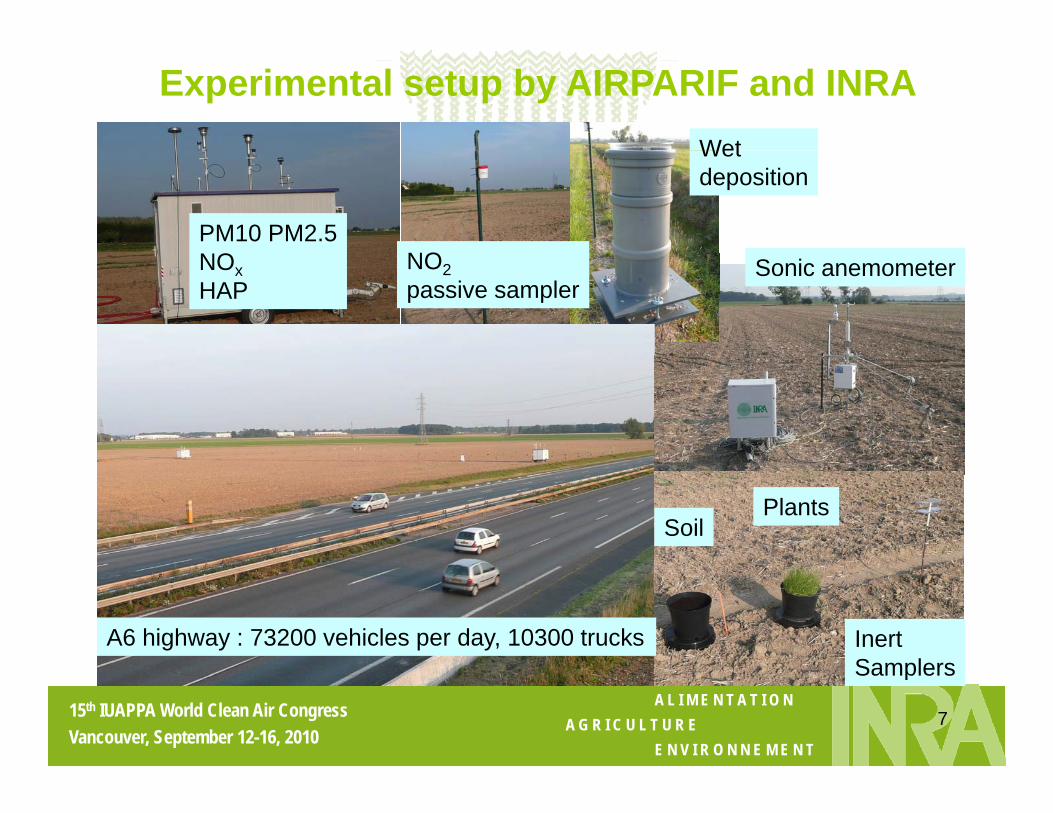
Experimental setup by AIRPARIF and INRAWetWetdeposition
NOPM10 PM2.5NO Sonic anemometerNO2
passive samplerNOxHAP
PlantsSoil
Inert Samplers
A6 highway : 73200 vehicles per day, 10300 trucks
A L I M E N T A T I O N A G R I C U L T U R E
E N V I R O N N E M E N T
15th IUAPPA World Clean Air CongressVancouver, September 12-16, 2010
7
Samplers
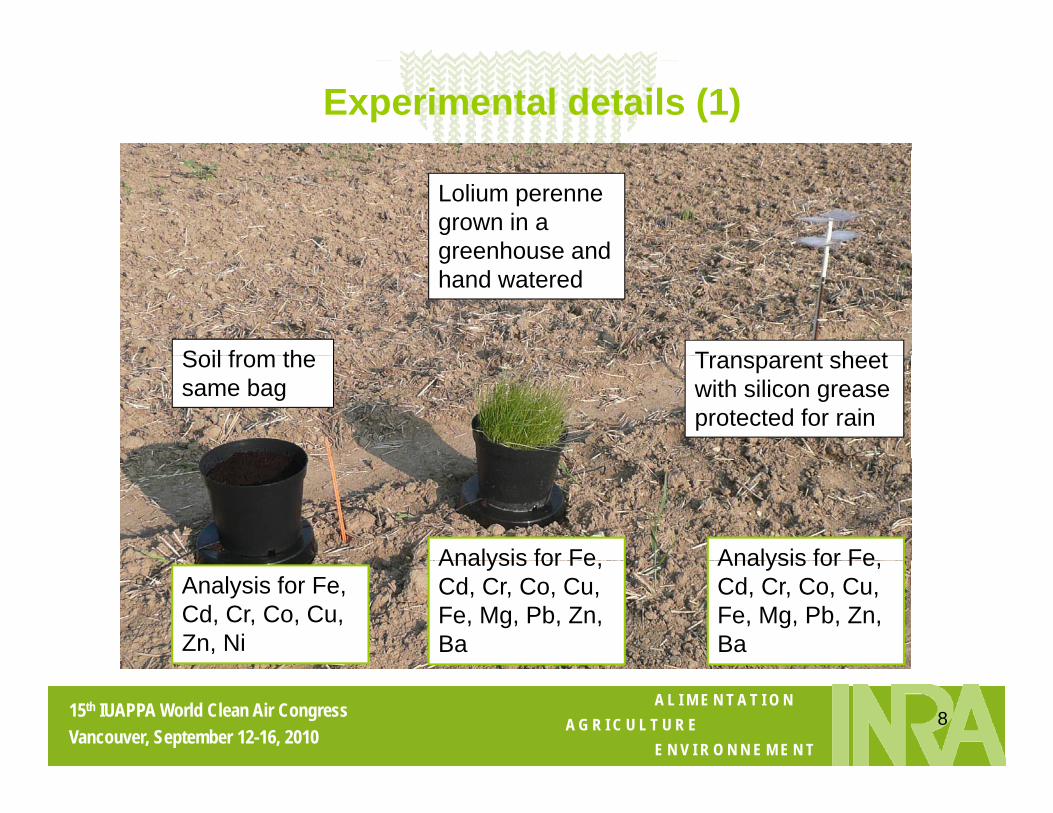
Experimental details (1)
Lolium perenne grown in a greenhouse and
Soil from the T t h t
greenhouse and hand watered
Soil from the same bag
Transparent sheet with silicon grease protected for rain
Analysis for Fe Analysis for FeAnalysis for Fe, Cd, Cr, Co, Cu, Zn, Ni
Analysis for Fe, Cd, Cr, Co, Cu, Fe, Mg, Pb, Zn, Ba
Analysis for Fe, Cd, Cr, Co, Cu, Fe, Mg, Pb, Zn, Ba
A L I M E N T A T I O N A G R I C U L T U R E
E N V I R O N N E M E N T
15th IUAPPA World Clean Air CongressVancouver, September 12-16, 2010
8
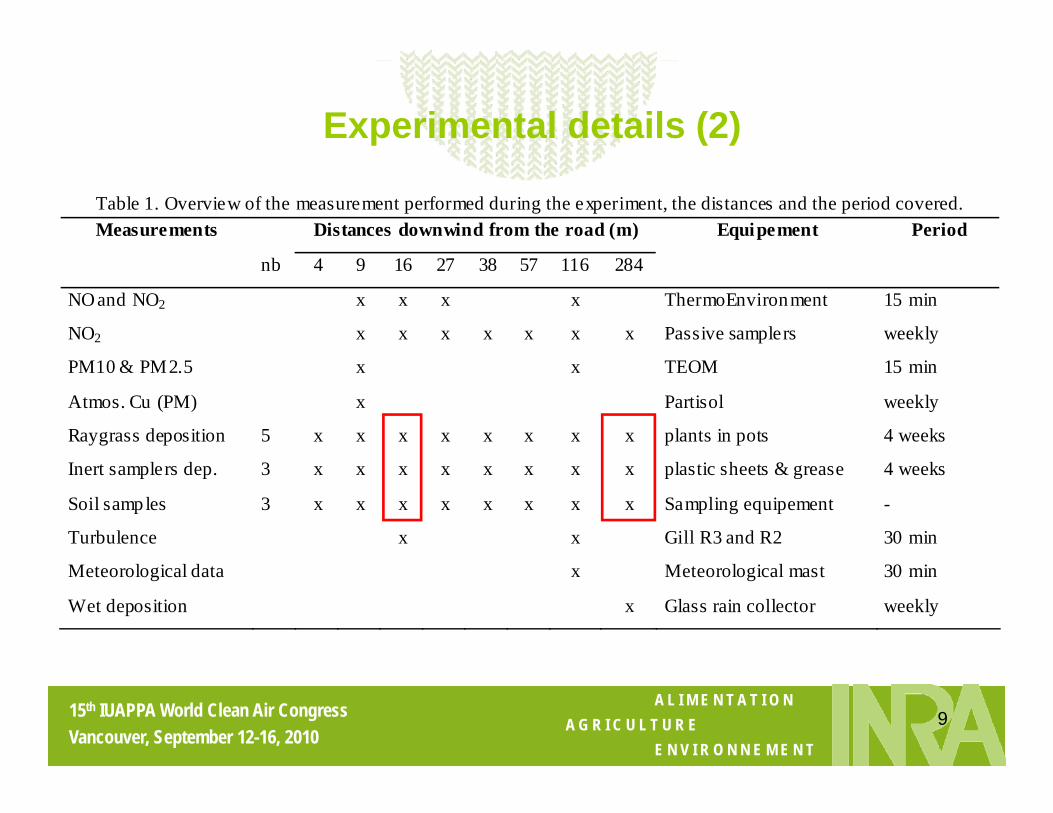
Experimental details (2)
Table 1. Overview of the measurement performed during the experiment, the distances and the period covered. Measurements Distances downwind from the road (m) Equipement Period
nb 4 9 16 27 38 57 116 284
NO and NO2 x x x x ThermoEnvironment 15 min
NO2 x x x x x x x Passive samplers weekly
PM10 & PM2.5 x x TEOM 15 min
Atmos. Cu (PM) x Partisol weekly
Raygrass deposition 5 x x x x x x x x plants in pots 4 weeks
Inert samplers dep. 3 x x x x x x x x plastic sheets & grease 4 weeks
Soil samples 3 x x x x x x x x Sampling equipement -
Turbulence x x Gill R3 and R2 30 min
Meteorological data x Meteorological mast 30 min
Wet deposition x Glass rain collector weekly
A L I M E N T A T I O N A G R I C U L T U R E
E N V I R O N N E M E N T
15th IUAPPA World Clean Air CongressVancouver, September 12-16, 2010
9
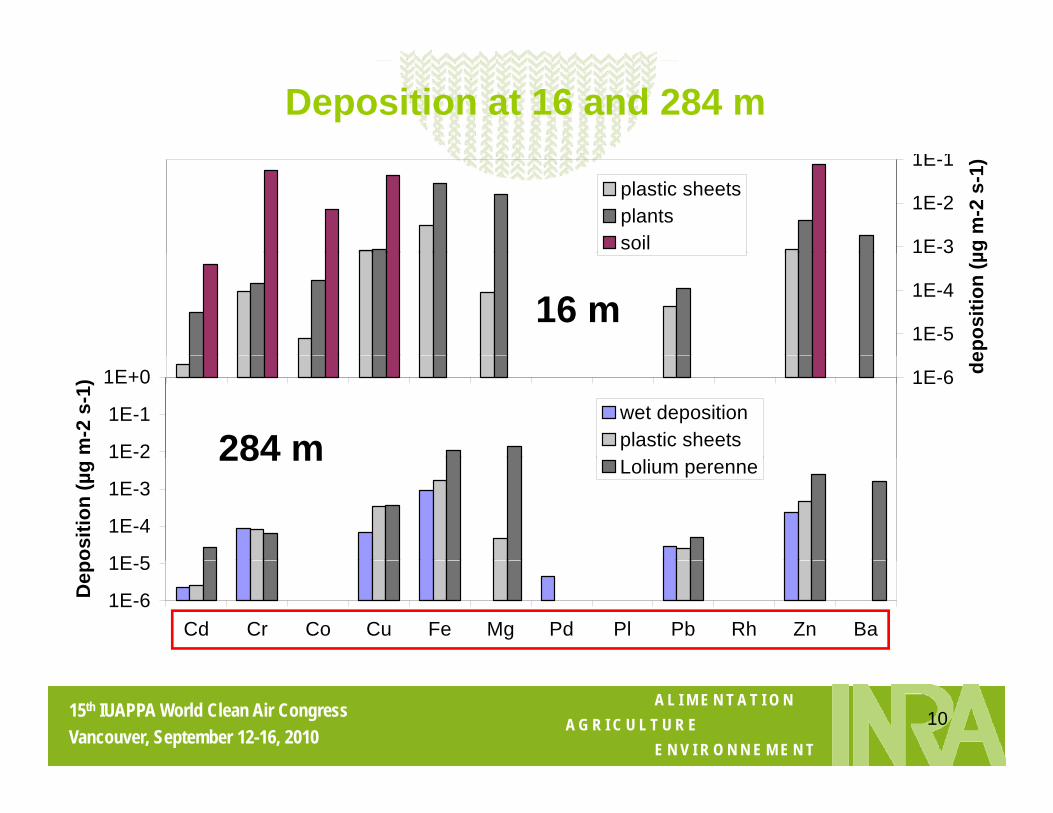
Deposition at 16 and 284 m
1E-3
1E-2
1E-1
µg m
-2 s
-1)
plastic sheetsplantssoil
1E-5
1E-4
1E 3
epos
ition
(µ
16 m1E-6 de
1E-2
1E-1
1E+0
m-2
s-1
)
wet depositionplastic sheets284 m
1E 5
1E-4
1E-3
1E 2
ositi
on (µ
g Lolium perenne284 m
1E-6
1E-5
Cd Cr Co Cu Fe Mg Pd Pl Pb Rh Zn Ba
Dep
A L I M E N T A T I O N A G R I C U L T U R E
E N V I R O N N E M E N T
15th IUAPPA World Clean Air CongressVancouver, September 12-16, 2010
10
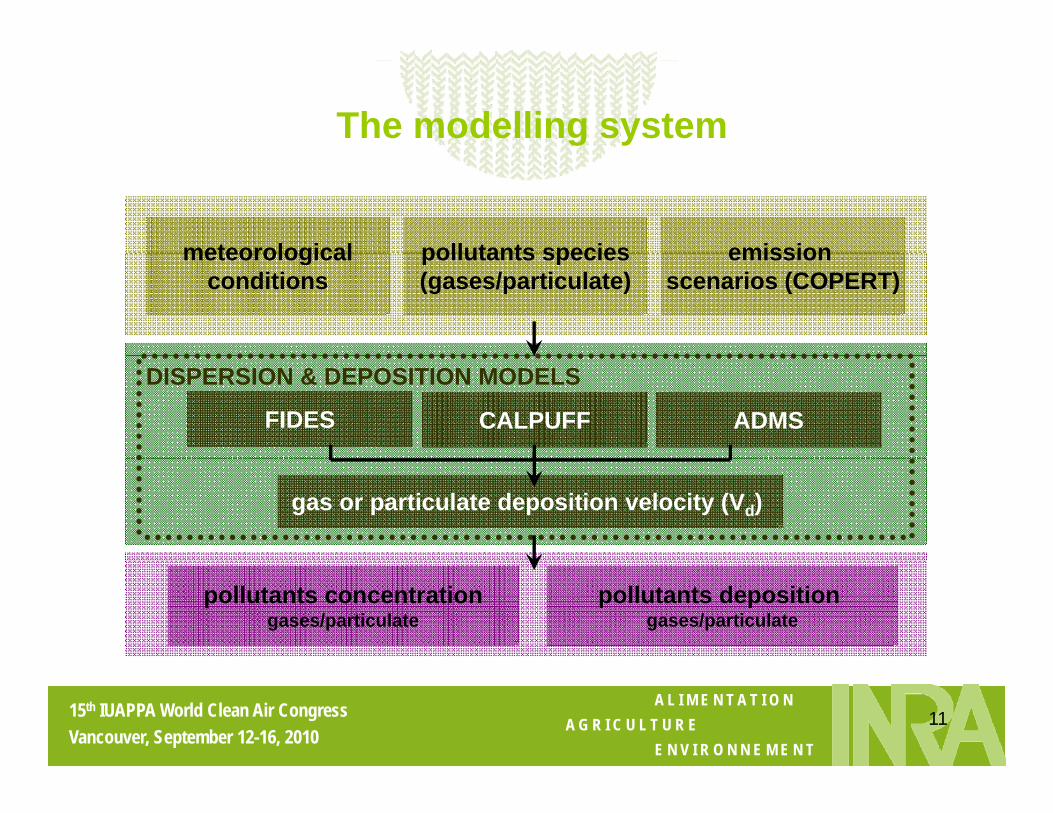
The modelling system
meteorological pollutants species emissionmeteorologicalconditions
pollutants species(gases/particulate)
emission scenarios (COPERT)
FIDES
DISPERSION & DEPOSITION MODELS
CALPUFF ADMS
gas or particulate deposition velocity (Vd)
pollutants concentrationgases/particulate
pollutants deposition gases/particulate
A L I M E N T A T I O N A G R I C U L T U R E
E N V I R O N N E M E N T
15th IUAPPA World Clean Air CongressVancouver, September 12-16, 2010
11
Modelling approach (1)
3
In the atmosphere
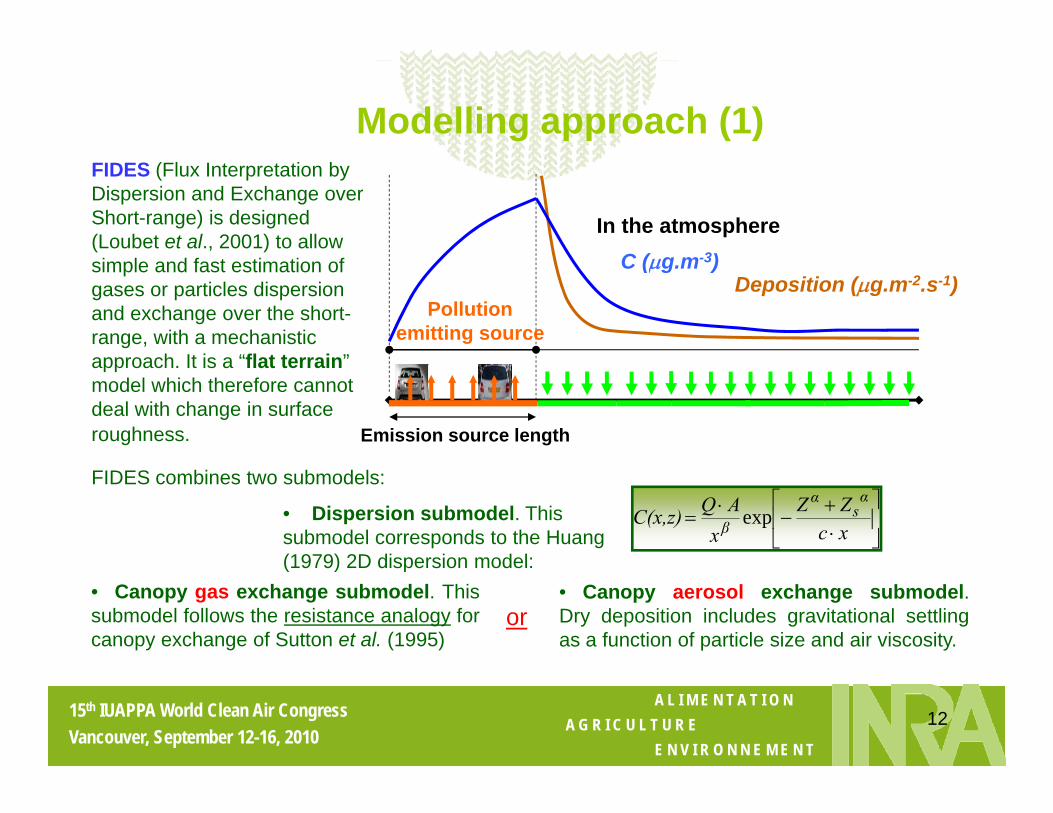
FIDES (Flux Interpretation by Dispersion and Exchange over Short-range) is designed (Loubet et al., 2001) to allow
Deposition (μg.m-2.s-1)C (μg.m-3)
Pollution emitting source
simple and fast estimation of gases or particles dispersion and exchange over the short-range, with a mechanistic
h It i “fl t t i ”
Emission source length
approach. It is a “flat terrain” model which therefore cannot deal with change in surface roughness.
FIDES combines two submodels:
• Dispersion submodel. This submodel corresponds to the Huang (1979) 2D dispersion model:
⎥⎦
⎤⎢⎣
⎡
⋅+
−⋅
=xcZZ
xAQC(x,z)
αs
α
β exp
(1979) 2D dispersion model:• Canopy gas exchange submodel. Thissubmodel follows the resistance analogy forcanopy exchange of Sutton et al. (1995)
• Canopy aerosol exchange submodel.Dry deposition includes gravitational settlingas a function of particle size and air viscosity.
or
A L I M E N T A T I O N A G R I C U L T U R E
E N V I R O N N E M E N T
15th IUAPPA World Clean Air CongressVancouver, September 12-16, 2010
12
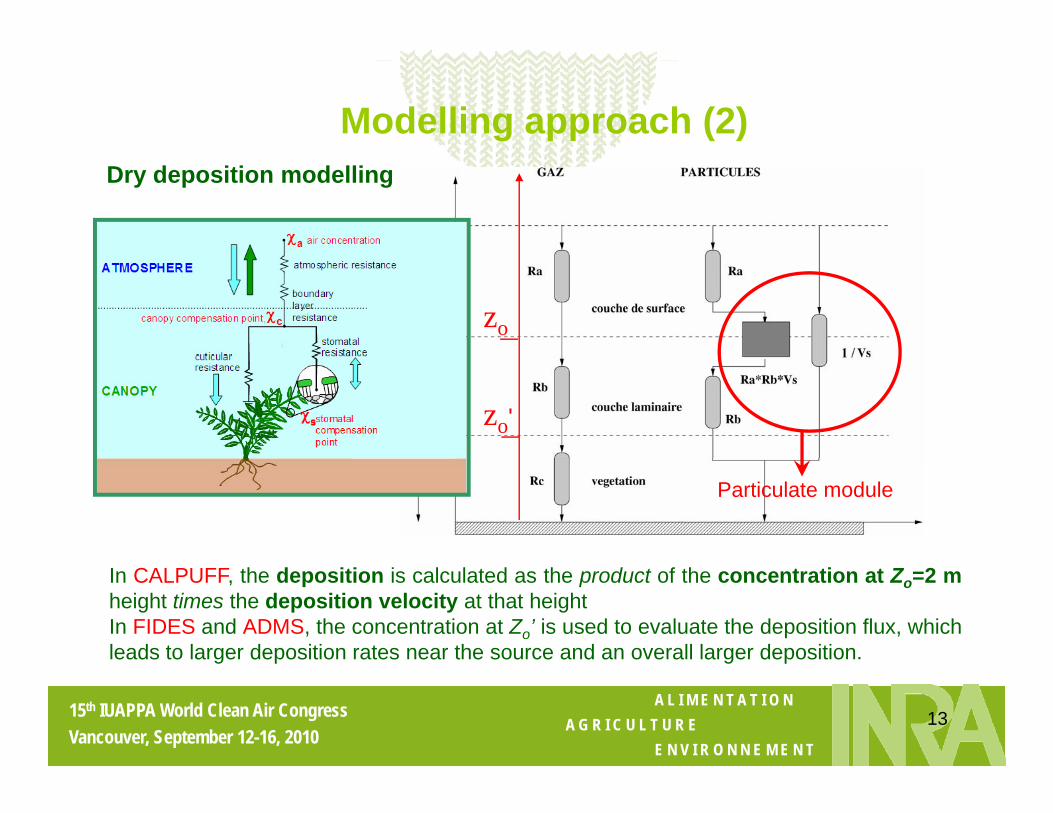
Modelling approach (2)Dry deposition modelling
zo
zo'
Particulate module
In CALPUFF, the deposition is calculated as the product of the concentration at Zo=2 mheight times the deposition velocity at that heightIn FIDES and ADMS, the concentration at Zo’ is used to evaluate the deposition flux, whichleads to larger deposition rates near the source and an overall larger deposition.
A L I M E N T A T I O N A G R I C U L T U R E
E N V I R O N N E M E N T
15th IUAPPA World Clean Air CongressVancouver, September 12-16, 2010
13
g p g p
Modelling approach (3)
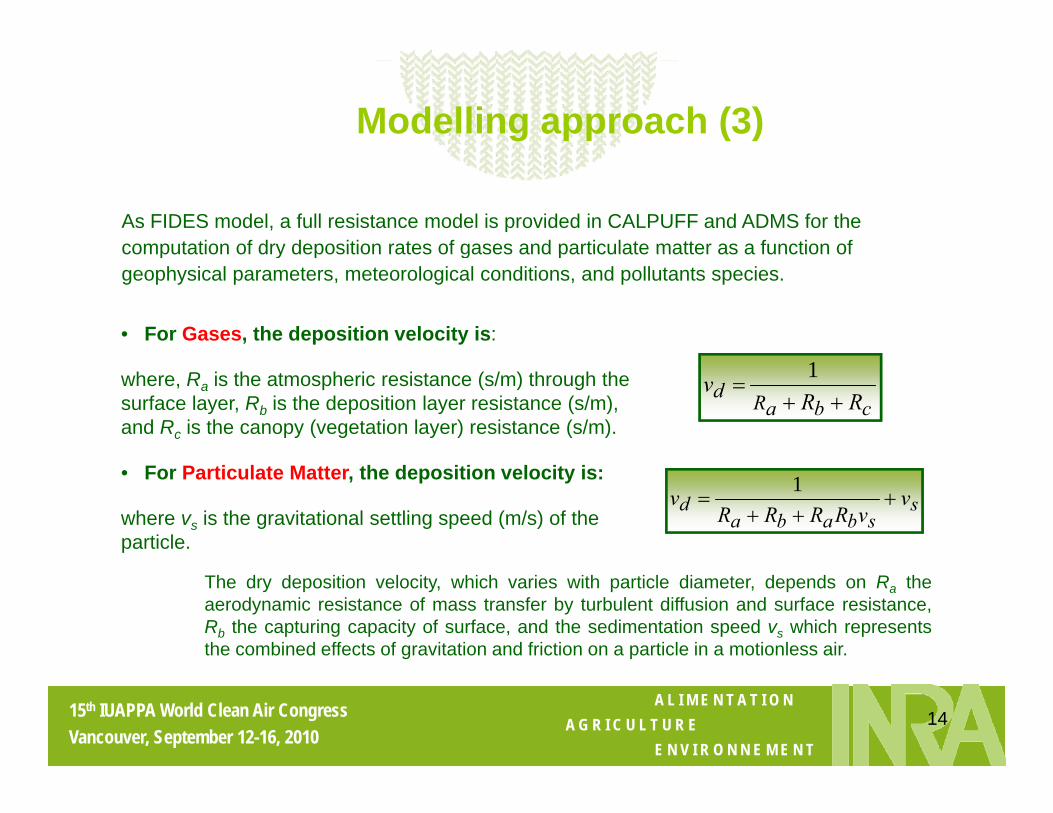
As FIDES model, a full resistance model is provided in CALPUFF and ADMS for the computation of dry deposition rates of gases and particulate matter as a function ofcomputation of dry deposition rates of gases and particulate matter as a function of geophysical parameters, meteorological conditions, and pollutants species.
• For Gases, the deposition velocity is:
where, Ra is the atmospheric resistance (s/m) through the surface layer, Rb is the deposition layer resistance (s/m), and Rc is the canopy (vegetation layer) resistance (s/m).
cbaRd RRv
++=
1
• For Particulate Matter, the deposition velocity is:
where vs is the gravitational settling speed (m/s) of the particle.
ssbaba
d vvRRRR
v +++
=1
The dry deposition velocity, which varies with particle diameter, depends on Ra theaerodynamic resistance of mass transfer by turbulent diffusion and surface resistance,Rb the capturing capacity of surface, and the sedimentation speed vs which representsthe combined effects of gravitation and friction on a particle in a motionless air.
A L I M E N T A T I O N A G R I C U L T U R E
E N V I R O N N E M E N T
15th IUAPPA World Clean Air CongressVancouver, September 12-16, 2010
14
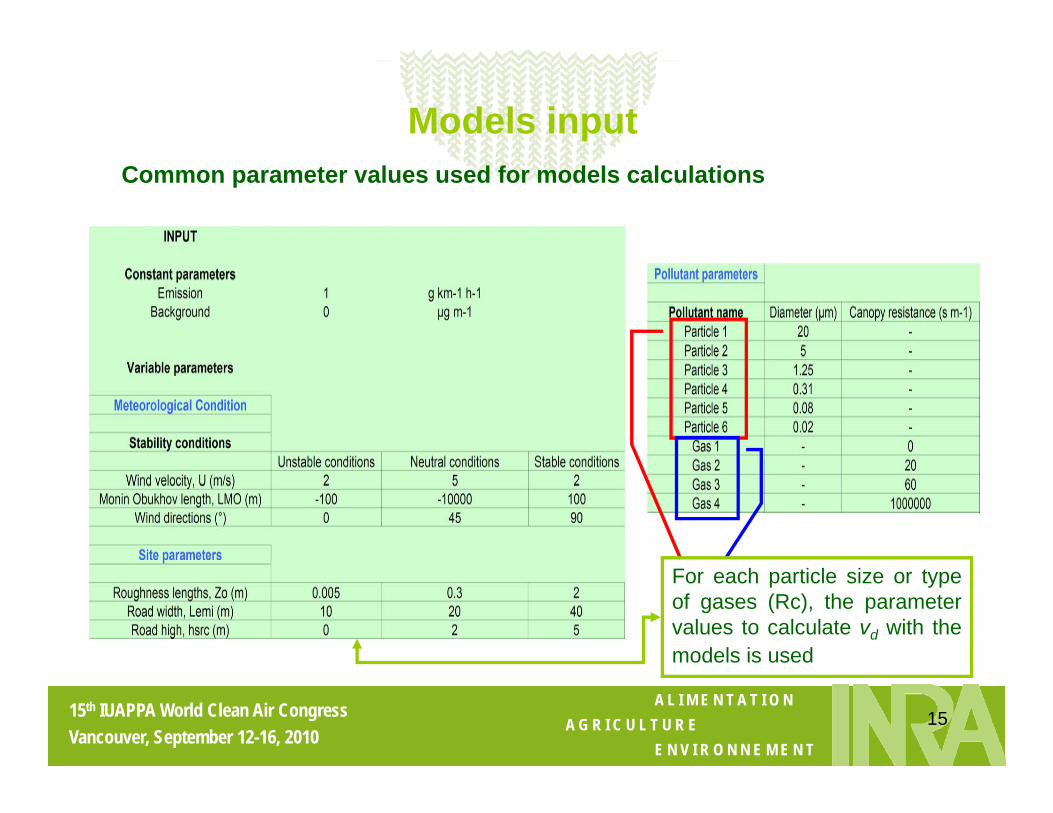
Models inputCommon parameter values used for models calculations
For each particle size or typeof gases (Rc), the parametervalues to calculate vd with themodels is used
A L I M E N T A T I O N A G R I C U L T U R E
E N V I R O N N E M E N T
15th IUAPPA World Clean Air CongressVancouver, September 12-16, 2010
15
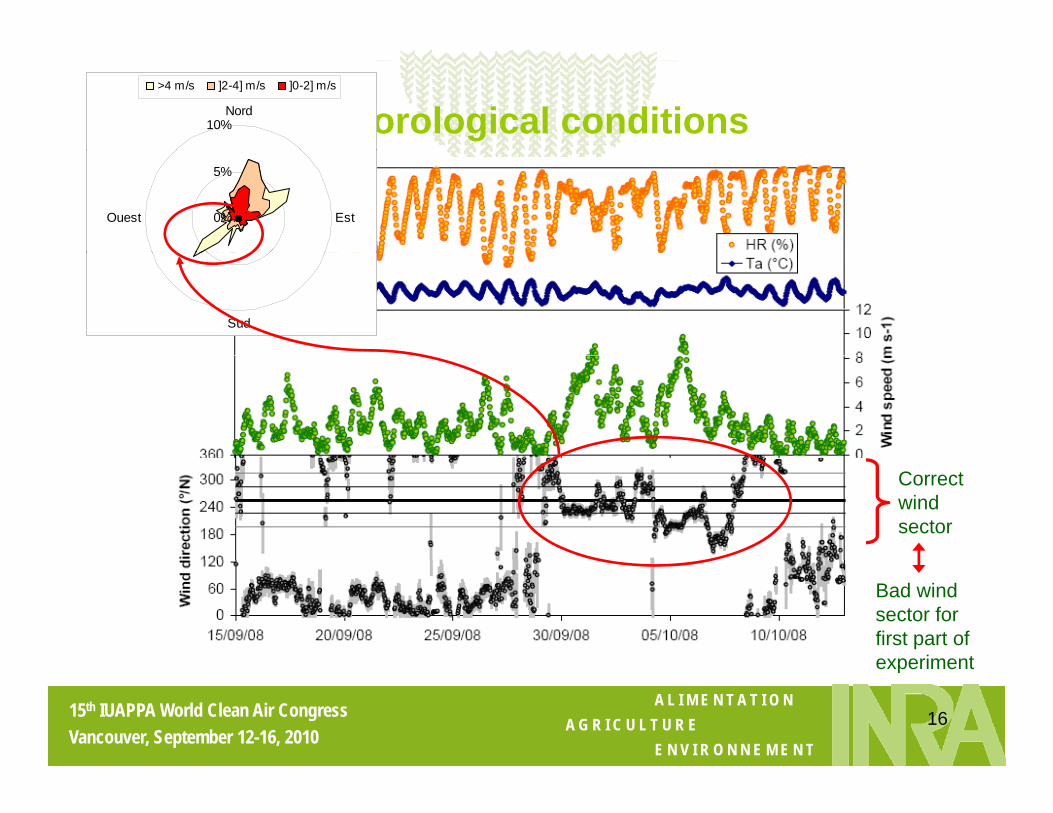
Meteorological conditions10%Nord
>4 m/s ]2-4] m/s ]0-2] m/s
0%
5%
EstOuest
Sud
Correctwindsector
Bad wind sector for first part of experiment
A L I M E N T A T I O N A G R I C U L T U R E
E N V I R O N N E M E N T
15th IUAPPA World Clean Air CongressVancouver, September 12-16, 2010
16
experiment
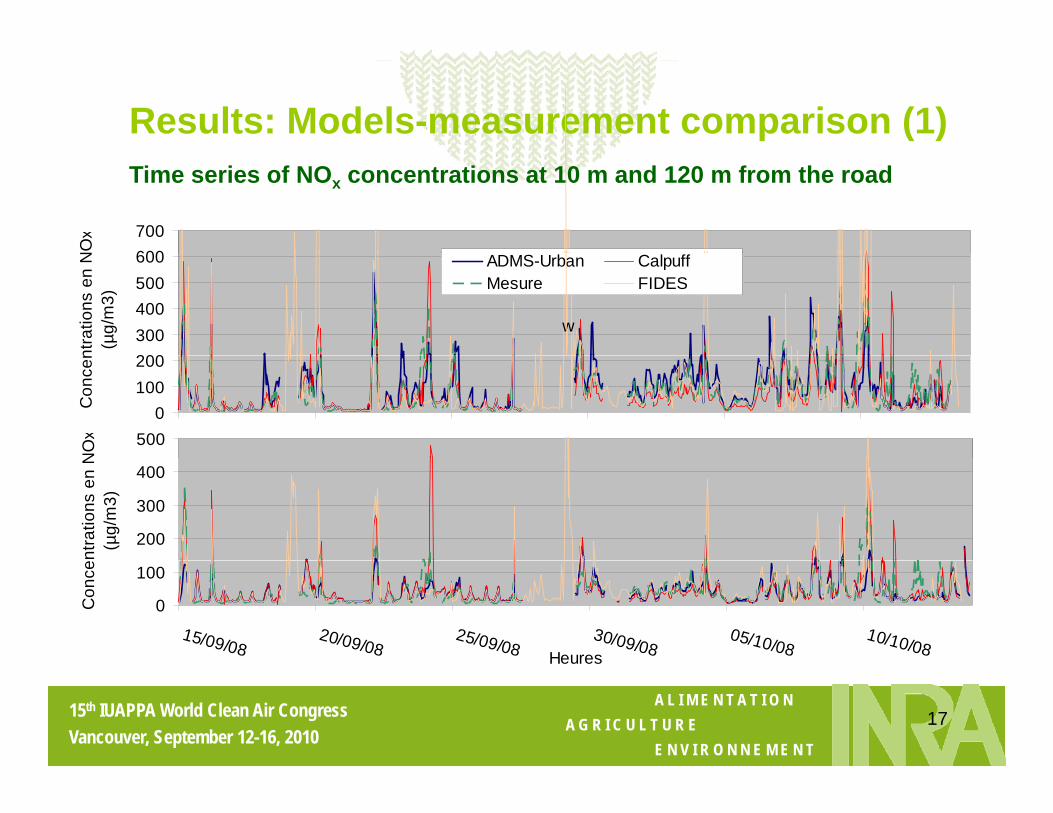
Results: Models-measurement comparison (1)
600700
NO
x
Time series of NOx concentrations at 10 m and 120 m from the road
200300400500600
ntra
tions
en
N(µ
g/m
3)
ADMS-Urban CalpuffMesure FIDES
w
0100200
Con
cen
500
NO
x
200
300
400
ntra
tions
en
N(µ
g/m
3)
0
100
15/09/0820/09/08
25/09/0830/09/08
05/10/0810/10/08Heures
Con
ce
A L I M E N T A T I O N A G R I C U L T U R E
E N V I R O N N E M E N T
15th IUAPPA World Clean Air CongressVancouver, September 12-16, 2010
17
Heures
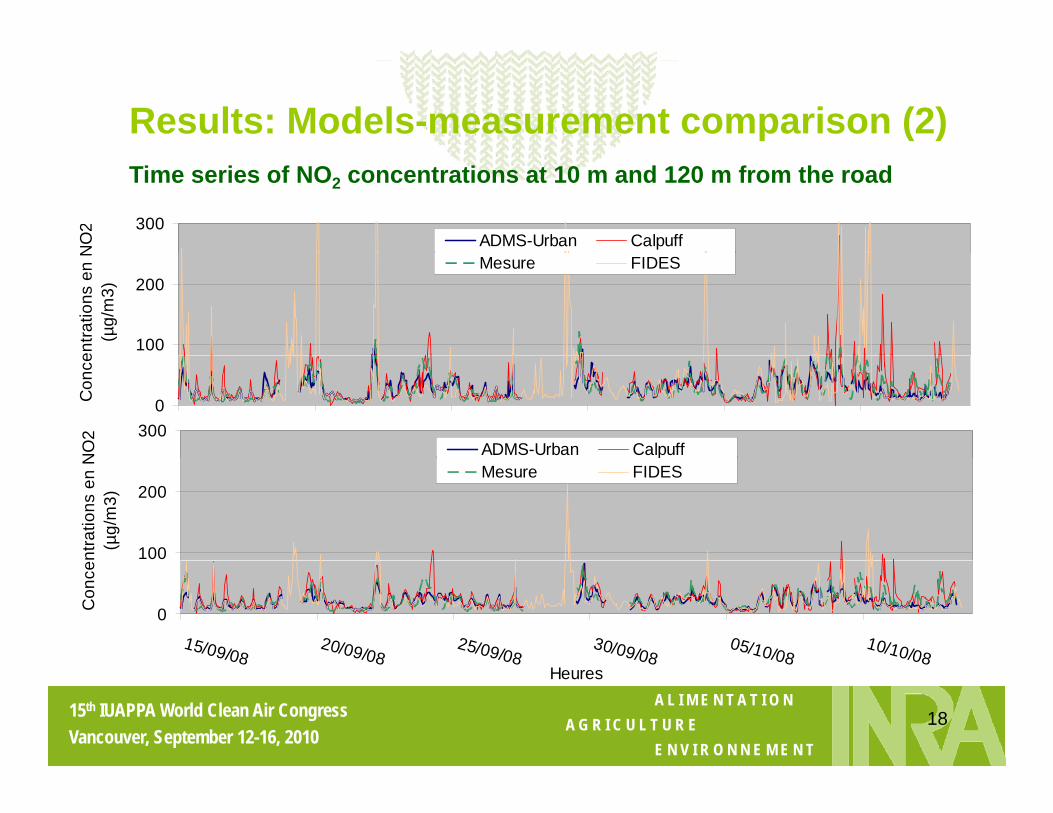
Results: Models-measurement comparison (2)Time series of NO2 concentrations at 10 m and 120 m from the road
300
NO
2
ADMS-Urban Calpuff
100
200
entra
tions
en
N(µ
g/m
3)
Mesure FIDES
0Con
ce
300
NO
2
ADMS-Urban Calpuff
100
200
ntra
tions
en
N(µ
g/m
3)
pMesure FIDES
015/09/08
20/09/0825/09/08
30/09/0805/10/08
10/10/08
Con
ce
A L I M E N T A T I O N A G R I C U L T U R E
E N V I R O N N E M E N T
15th IUAPPA World Clean Air CongressVancouver, September 12-16, 2010
18
8 8 8 8 8 8Heures
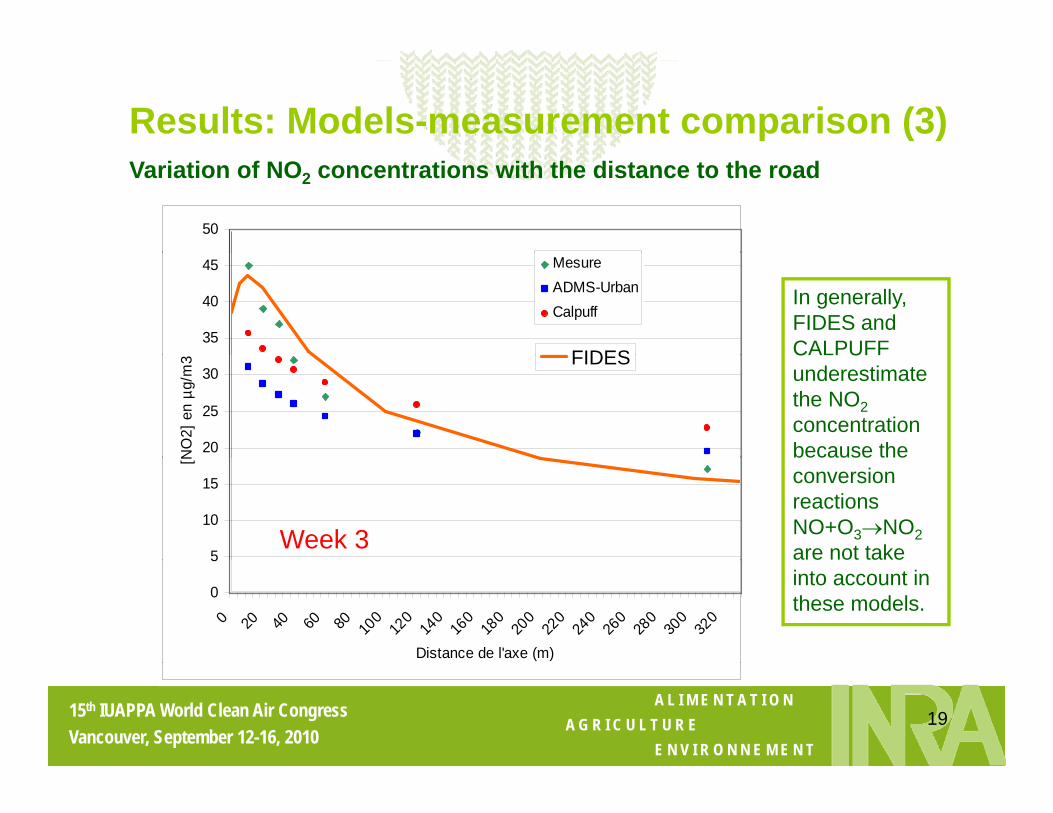
Results: Models-measurement comparison (3)Variation of NO2 concentrations with the distance to the road
50
35
40
45 MesureADMS-UrbanCalpuff
FIDES
In generally, FIDES and CALPUFF
20
25
30
NO
2] e
n µg
/m3 FIDES C U
underestimate the NO2 concentration because the
5
10
15
[N
Week 3
conversion reactions NO+O3→NO2 are not take
0
5
0 20 40 60 80 100
120
140
160
180
200
220
240
260
280
300
320
Distance de l'axe (m)
into account in these models.
A L I M E N T A T I O N A G R I C U L T U R E
E N V I R O N N E M E N T
15th IUAPPA World Clean Air CongressVancouver, September 12-16, 2010
19
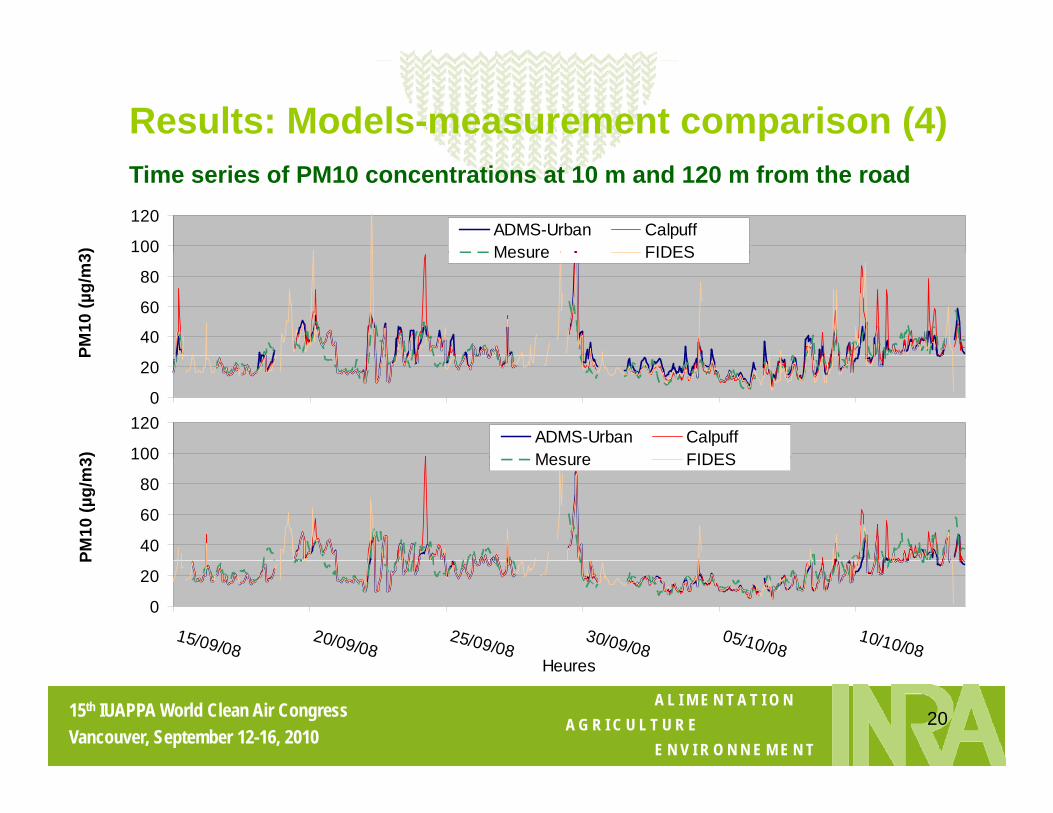
Results: Models-measurement comparison (4)
100
120
)
ADMS-Urban CalpuffMesure FIDES
Time series of PM10 concentrations at 10 m and 120 m from the road
40
60
80
PM10
(µg/
m3 Mesure FIDES
0
20
P
100
120
)
ADMS-Urban CalpuffMesure FIDES
40
60
80
100
PM10
(µg/
m3 Mesure FIDES
0
20
15/09/0820/09/08
25/09/0830/09/08
05/10/0810/10/08
Heures
P
A L I M E N T A T I O N A G R I C U L T U R E
E N V I R O N N E M E N T
15th IUAPPA World Clean Air CongressVancouver, September 12-16, 2010
20
Heures
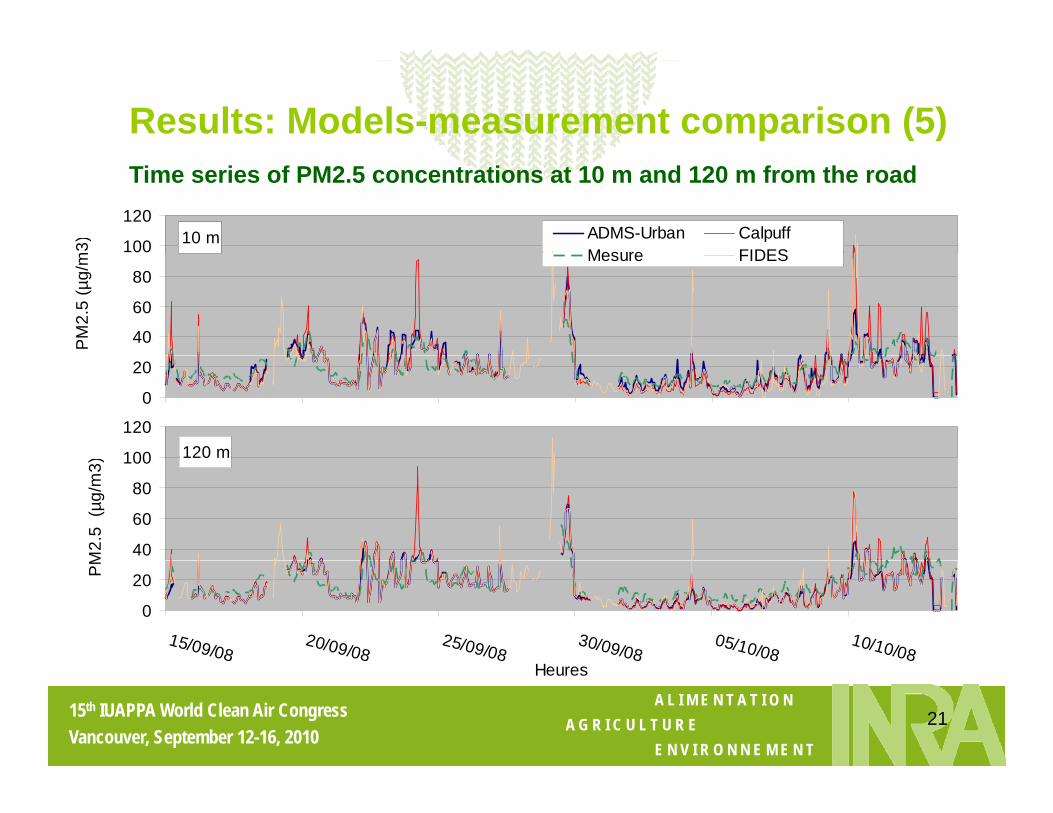
Results: Models-measurement comparison (5)Time series of PM2.5 concentrations at 10 m and 120 m from the road
10 m100
120
3)
ADMS-Urban CalpuffMesure FIDES
40
60
80
PM
2.5
(µg/
m Mesure FIDES
0
20
120 m100
1200
40
60
80
100
M2.
5 (µ
g/m
3)
0
20
15/09/0820/09/08
25/09/0830/09/08
05/10/0810/10/08
PM
A L I M E N T A T I O N A G R I C U L T U R E
E N V I R O N N E M E N T
15th IUAPPA World Clean Air CongressVancouver, September 12-16, 2010
21
Heures
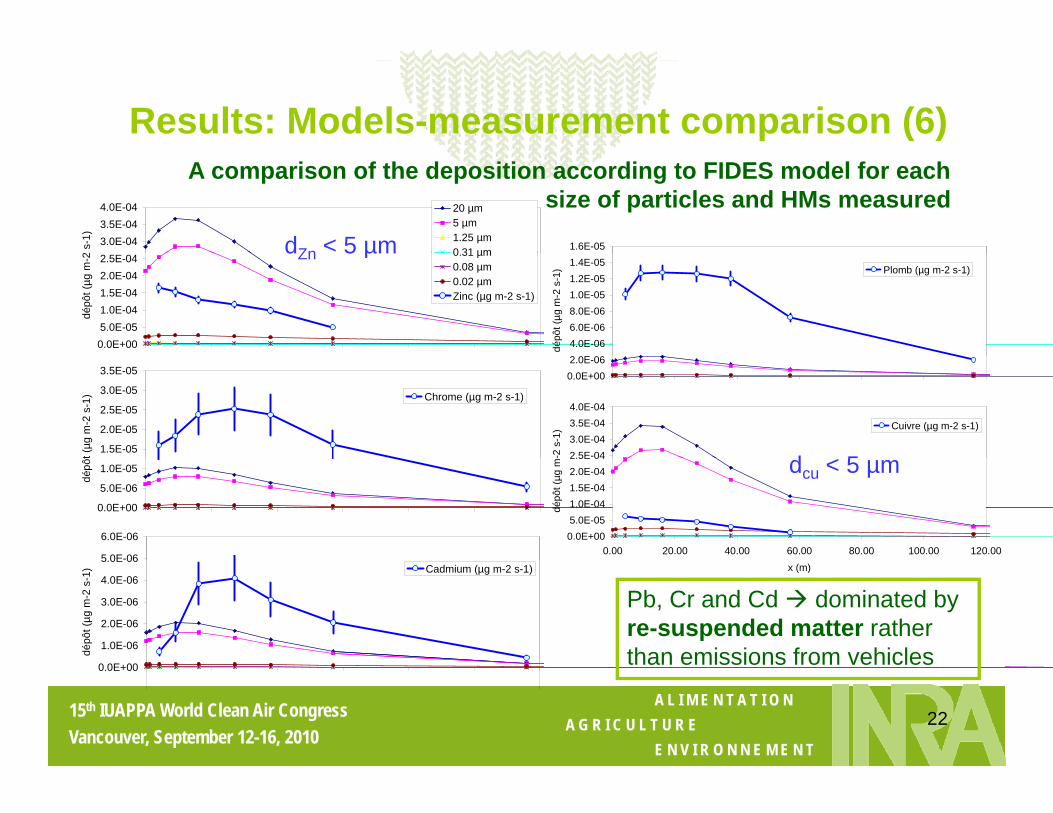
Results: Models-measurement comparison (6)A comparison of the deposition according to FIDES model for each
size of particles and HMs measured3.0E-043.5E-044.0E-04
2 s-
1)
20 µm5 µm1.25 µm0 31 µm 1.6E-05dZn < 5 µm
0.0E+005.0E-051.0E-041.5E-042.0E-042.5E-04
dépô
t (µg
m-2 0.31 µm
0.08 µm0.02 µmZinc (µg m-2 s-1)
4.0E-066.0E-068.0E-061.0E-051.2E-051.4E-05
dépô
t (µg
m-2
s-1
) Plomb (µg m-2 s-1)
dZn 5 µm
1.5E-05
2.0E-05
2.5E-05
3.0E-05
3.5E-05
t (µg
m-2
s-1
) Chrome (µg m-2 s-1)
0.0E+002.0E-06
2.5E-043.0E-043.5E-044.0E-04
-2 s
-1) Cuivre (µg m-2 s-1)
d 50.0E+00
5.0E-06
1.0E-05
dépô
t
5 0E-06
6.0E-06 0.0E+005.0E-051.0E-041.5E-042.0E-042.5E 04
0.00 20.00 40.00 60.00 80.00 100.00 120.00dé
pôt (
µg m
- dcu < 5 µm
1.0E-06
2.0E-06
3.0E-06
4.0E-06
5.0E 06
dépô
t (µg
m-2
s-1
) Cadmium (µg m-2 s-1) x (m)
Pb, Cr and Cd dominated by re-suspended matter rather than emissions from vehicles
A L I M E N T A T I O N A G R I C U L T U R E
E N V I R O N N E M E N T
15th IUAPPA World Clean Air CongressVancouver, September 12-16, 2010
22
0.0E+00 than emissions from vehicles
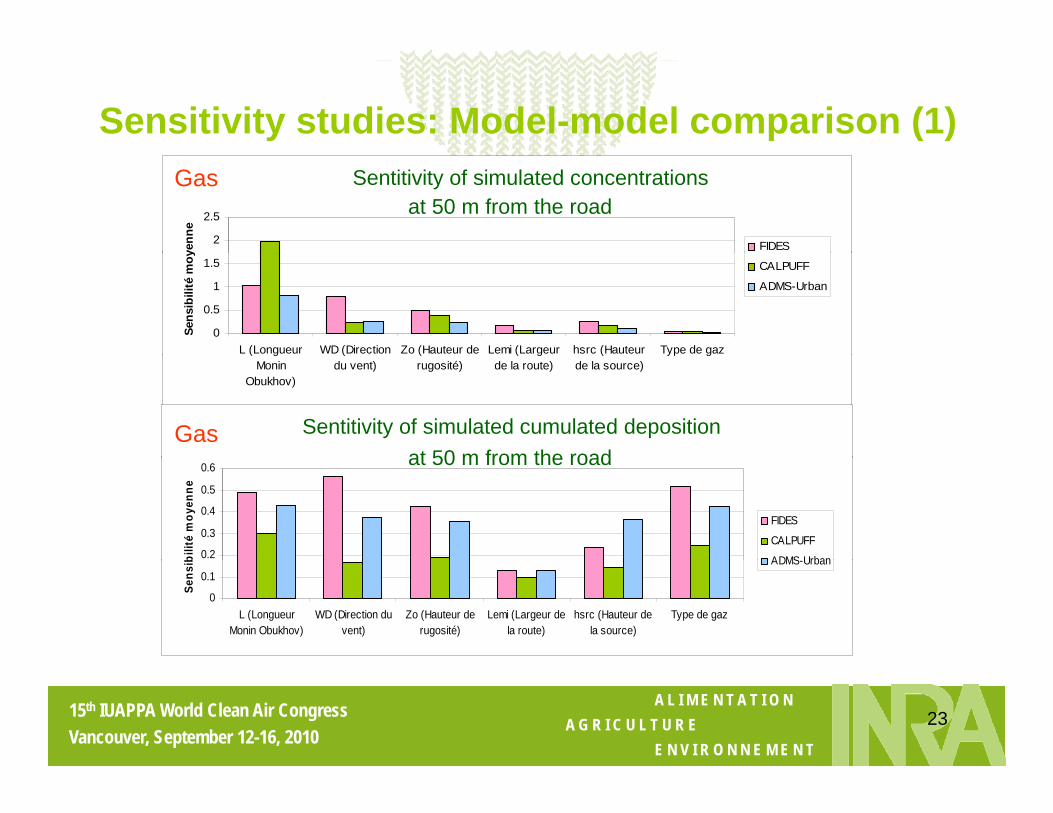
Sensitivity studies: Model-model comparison (1)Sortie C50
2
2.5
yenn
e
FIDES
Sentitivity of simulated concentrationsGasat 50 m from the road
0
0.5
1
1.5
L (Longueur WD (Direction Zo (Hauteur de Lemi (Largeur hsrc (Hauteur Type de gaz
Sens
ibili
té m
oy CALPUFF
ADMS-Urban
( gMonin
Obukhov)
(du vent)
(rugosité)
( gde la route)
(de la source)
yp g
Sortie DC50Sentitivity of simulated cumulated depositionGasat 50 m from the road
0.2
0.3
0.4
0.5
0.6
bilit
é m
oyen
ne
FIDES
CALPUFF
ADMS Urban
at 50 m from the road
0
0.1
L (LongueurMonin Obukhov)
WD (Direction duvent)
Zo (Hauteur derugosité)
Lemi (Largeur dela route)
hsrc (Hauteur dela source)
Type de gaz
Sens
ib ADMS-Urban
A L I M E N T A T I O N A G R I C U L T U R E
E N V I R O N N E M E N T
15th IUAPPA World Clean Air CongressVancouver, September 12-16, 2010
23
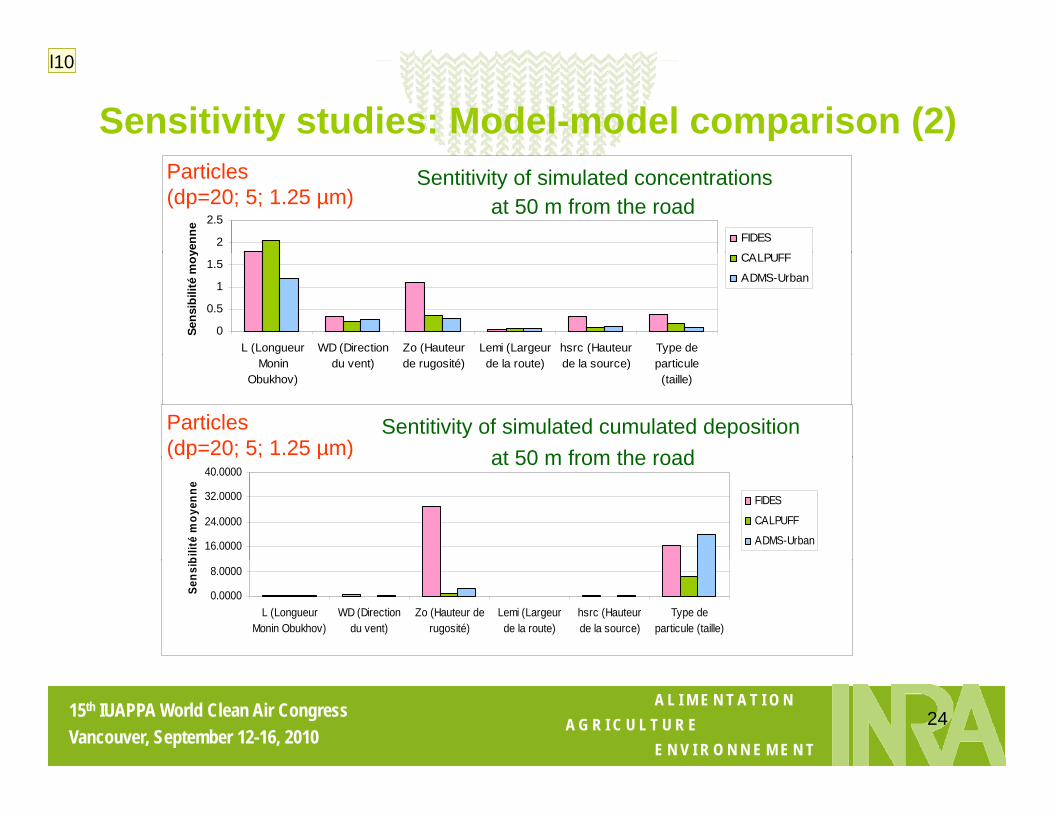
Sensitivity studies: Model-model comparison (2)Sortie C50
2
2.5
yenn
e
FIDES
Particles(dp=20; 5; 1.25 µm)
Sentitivity of simulated concentrationsat 50 m from the road
0
0.5
1
1.5
L (Longueur WD (Direction Zo (Hauteur Lemi (Largeur hsrc (Hauteur Type de
Sens
ibili
té m
oy CALPUFF
ADMS-Urban
MoninObukhov)
du vent) de rugosité) de la route) de la source) particule(taille)
Sortie DC50Particles(dp=20; 5; 1.25 µm)
Sentitivity of simulated cumulated depositionat 50 m from the road
16.0000
24.0000
32.0000
40.0000
bilit
é m
oyen
ne
FIDES
CALPUFF
ADMS-Urban
( p µ ) at 50 m from the road
0.0000
8.0000
L (LongueurMonin Obukhov)
WD (Directiondu vent)
Zo (Hauteur derugosité)
Lemi (Largeurde la route)
hsrc (Hauteurde la source)
Type departicule (taille)
Sens
ib
A L I M E N T A T I O N A G R I C U L T U R E
E N V I R O N N E M E N T
15th IUAPPA World Clean Air CongressVancouver, September 12-16, 2010
24
l10

Slide 24
l10 idem page précédenteloubet, 9/3/2010
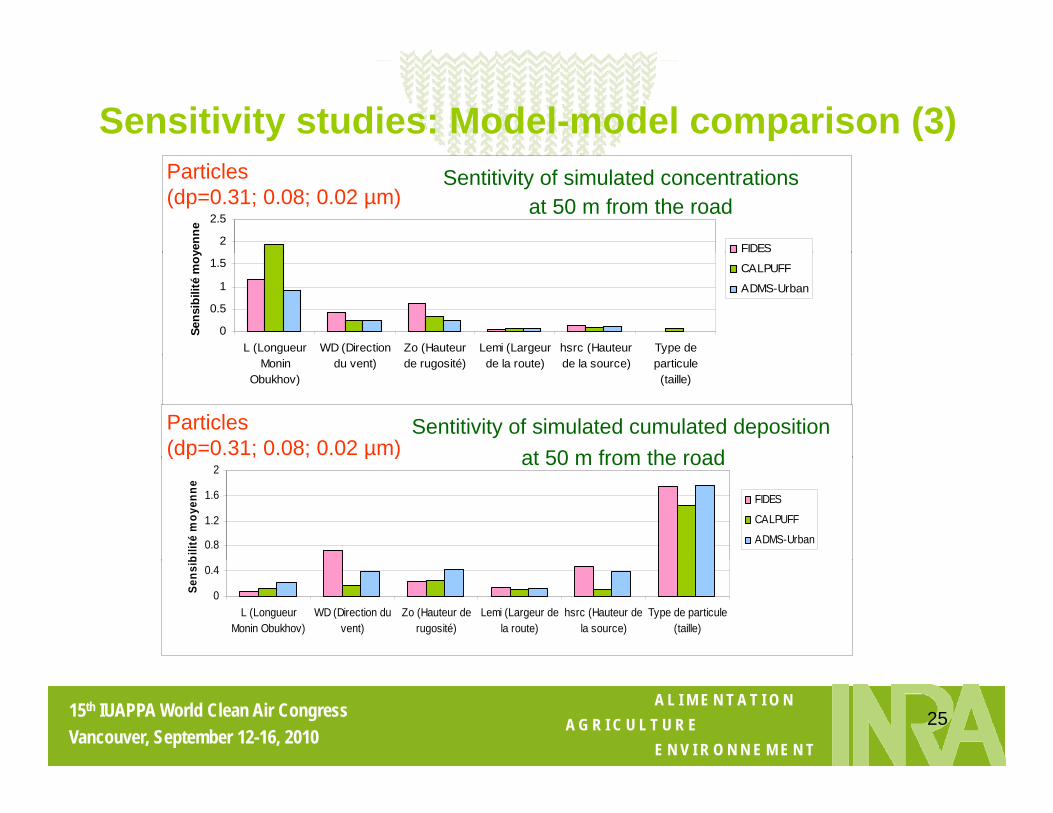
Sensitivity studies: Model-model comparison (3)Sortie C50
2
2.5
yenn
e
FIDES
Particles(dp=0.31; 0.08; 0.02 µm)
Sentitivity of simulated concentrationsat 50 m from the road
0
0.5
1
1.5
L (Longueur WD (Direction Zo (Hauteur Lemi (Largeur hsrc (Hauteur Type de
Sens
ibili
té m
oy
CALPUFF
ADMS-Urban
MoninObukhov)
du vent) de rugosité) de la route) de la source) particule(taille)
Sortie DC50Particles(dp=0.31; 0.08; 0.02 µm)
Sentitivity of simulated cumulated depositionat 50 m from the road
0.8
1.2
1.6
2
bilit
é m
oyen
ne
FIDES
CALPUFF
ADMS-Urban
( p µ ) at 50 m from the road
0
0.4
L (LongueurMonin Obukhov)
WD (Direction duvent)
Zo (Hauteur derugosité)
Lemi (Largeur dela route)
hsrc (Hauteur dela source)
Type de particule(taille)
Sens
ib
A L I M E N T A T I O N A G R I C U L T U R E
E N V I R O N N E M E N T
15th IUAPPA World Clean Air CongressVancouver, September 12-16, 2010
25
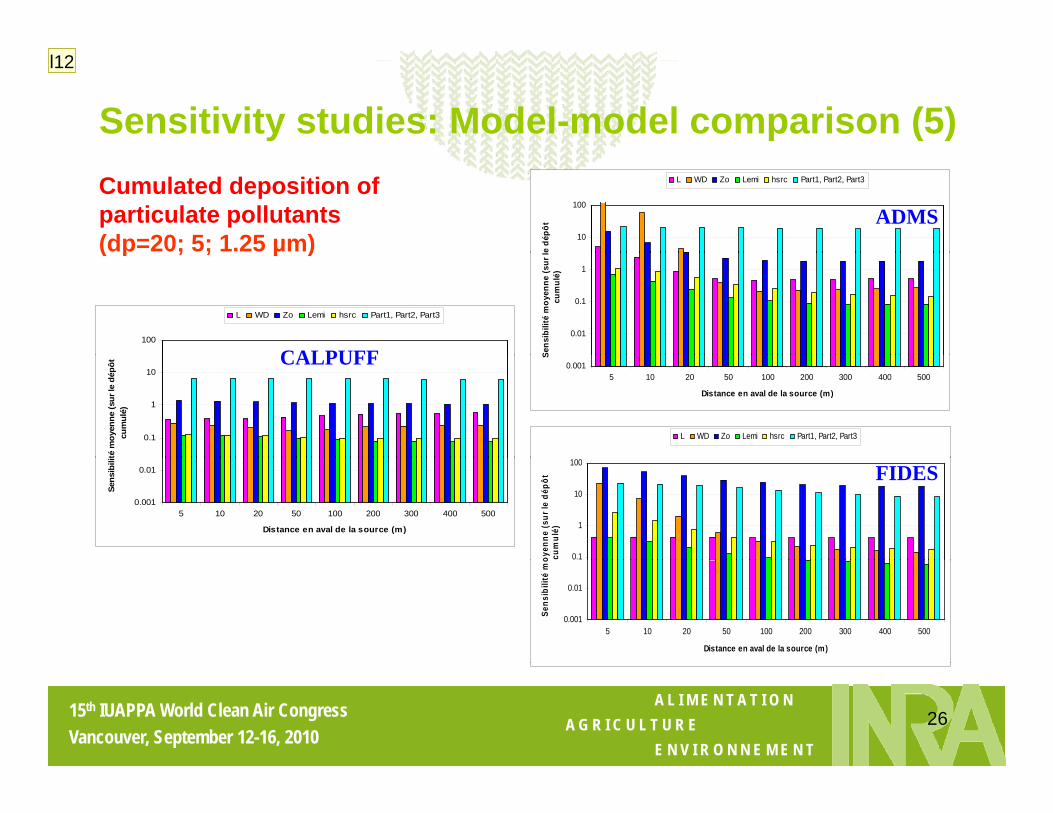
Sensitivity studies: Model-model comparison (5)
10
100
e dé
pôt
L WD Zo Lemi hsrc Part1, Part2, Part3
ADMSCumulated deposition of particulate pollutants (dp=20; 5; 1.25 µm)
100
L WD Zo Lemi hsrc Part1, Part2, Part3
0.01
0.1
1
Sens
ibili
té m
oyen
ne (s
ur l
cum
ulé)
CALPUFF
( p ; ; µ )
0.1
1
10
té m
oyen
ne (s
ur le
dép
ôt
cum
ulé)
0.0015 10 20 50 100 200 300 400 500
Distance en aval de la source (m)
S
L WD Zo Lemi hsrc Part1, Part2, Part3
CALPUFF
0.001
0.01
5 10 20 50 100 200 300 400 500
Distance en aval de la source (m)
Sens
ibili
t
0.1
1
10
100
oyen
ne (s
ur le
dép
ôt
cum
ulé)
FIDES
0.001
0.01
5 10 20 50 100 200 300 400 500
Distance en aval de la source (m)
Sens
ibili
té m
o
A L I M E N T A T I O N A G R I C U L T U R E
E N V I R O N N E M E N T
15th IUAPPA World Clean Air CongressVancouver, September 12-16, 2010
26
l12

Slide 26
l12 voir remarque précédenteloubet, 9/3/2010
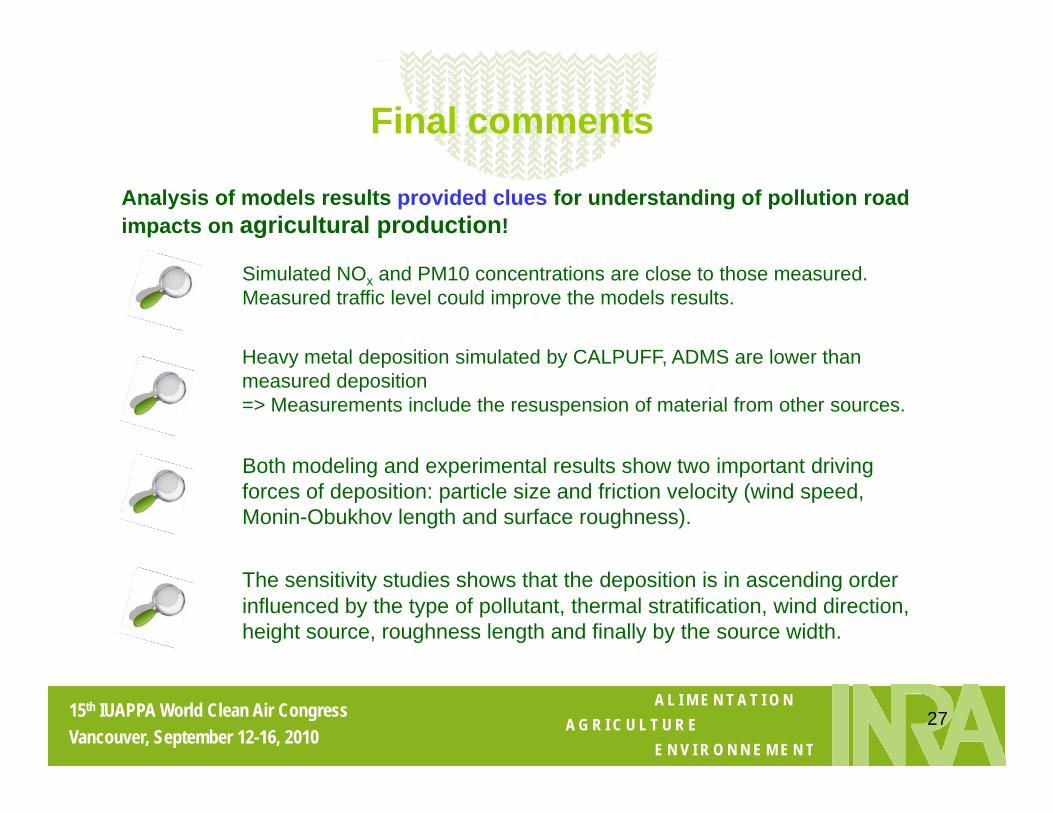
Final comments
Analysis of models results provided clues for understanding of pollution road impacts on agricultural production!
Simulated NOx and PM10 concentrations are close to those measured. Measured traffic level could improve the models results.
Heavy metal deposition simulated by CALPUFF ADMS are lower than
B h d li d i l l h i d i i
Heavy metal deposition simulated by CALPUFF, ADMS are lower than measured deposition => Measurements include the resuspension of material from other sources.
Both modeling and experimental results show two important driving forces of deposition: particle size and friction velocity (wind speed, Monin-Obukhov length and surface roughness).
The sensitivity studies shows that the deposition is in ascending orderinfluenced by the type of pollutant, thermal stratification, wind direction, height source, roughness length and finally by the source width.
A L I M E N T A T I O N A G R I C U L T U R E
E N V I R O N N E M E N T
15th IUAPPA World Clean Air CongressVancouver, September 12-16, 2010
27

Thank you for your attention!
Contact information: [email protected]
A L I M E N T A T I O N A G R I C U L T U R E
E N V I R O N N E M E N T
15th IUAPPA World Clean Air CongressVancouver, September 12-16, 2010
28