Embed Size (px)
Citation preview
AN EVALUATION OF
CATCH PROGRAMME IN
SIKKIM 2014-15
Regional Resource Centre for Northeastern States
(A Branch of NHSRC)
Ministry of Health & Family Welfare,
Government of India
Guwahati, Assam - 781022
TEAM MEMBERS
Research Team: Dr. A.C. Baishya Dr. Hitesh Deka Mr. Bhaswat Kumar Das Dr. Biraj Kanti Shome Mrs. Monmayuri Dutta Mr. Nabin N. Sharma
Field Supervisor:
Mr. Parthajit Sintey Mr. Sashi Bhusan
Acknowledgement
At the outset, I would like to express my gratitude to the Dr. Kumar Bhandari Secretary – Director General Health, Govt. of Sikkim and Dr. Ringzing Dorzee Director Health Services -1, Dr. P.M. Pradhan Mission Director NHM, Sikkim and Dr. Indralal Sharma Director Drugs & cosmetics for kind cooperation and providing valuable information’s regarding the study ‘CATCH Programme Evaluation’ by RRC-NES. I would also like to thank the all Programme Officer, NHM Sikkim and CMO of all four districts for the co-operation provided during the entire course of the evaluation process starting right from the recruitment of the Field Supervisors and Field Investigators. I appreciate all the assistance provided by the four other staffs of the CMO office involved in the study at each level of the evaluation - at the PHCs, PHSCs and villages in all over the district during the visit of the team. The sincere efforts put in by the team of Supervisors and Investigators in the difficult and unyielding terrains of the state is commendable. The data collected by them from the facility and communities is the backbone of this study. I am highly indebted to the hundreds of faceless respondents in the remotest part of all districts who gave a patient hearing to the long questionnaires and replied appropriately. And of course, all the staff at RRC-NE, who have been associated in some way or the other with the study. My sincere thanks goes to them for all the hard work each one has put in, starting right from the training of the field workers to the compilation of data, their interpretation and writing the report. CATCH programme is a unique programme in the country; this evaluation process shall provide few new inputs to strengthen community process and non communicable disease perspective in long learn. Dr A.C. Baishya Director, RRC-NE
INDEX
SL. CONTENTS Page No
Chapter I INTRODUCTION 1
1.1 Objective of the study 1
1.2 Methodology 7
Chapter II Preliminary Field Observation prior to the Household survey
9
2.1 State Consultation
10
2.2 Observations based on the concept note of the State team and the field observations and the preliminary discussion with the stakeholders at State level
12
2.3 Conclusion
14
Chapter III House Hold Survey Findings
15
3.1 About Household information:
16
3.2 Awareness about CATCH Programme 19
3.3 Health Camp:
23
3.4 Availing services at the camp:
35
3.5 Availing services at the camp by specific category of family members 44
Chapter IV Service providers view & role about CATCH programme
49
4.1 MOs view & role about CATCH programme 49
4.2 Role of ANM in CATCH programme 51
4.3 Role of ASHA in CATCH programme 52
Chapter V Stakeholder view 55
Conclusion & suggestions 57
1 | C A T C H P r o g r a m m e E v a l u a t i o n R e p o r t S i k k i m b y R R C - N E S
Chapter I
Introduction: Chief Minister’s Comprehensive Annual and Total Check up for Healthy Sikkim (CATCH) is a
flagship Programme of Government of Sikkim which aims to provide comprehensive health care
on annual and periodical basis. Though the primary focus is annual health check-up, based on
the epidemiological ethics of “No survey without Service”, attempt is also made to provide
comprehensive health care (promotive, preventive and curative). CATCH Programme envision
to work towards making Sikkim a healthy state, through community mobilization and
participation. In the long run the programme would bring social and economic gains to all the
people of Sikkim, reducing burden of diseases, improving health awareness among community
by reducing out of pocket expenditure as most important cause of indebtedness in Sikkim is
due to medical treatment which indicates that action steps taken in eleventh hour for
treatment are major cause of concern. It is felt that much needs to be done to have better
understanding on health status through CATCH Programme and to make Sikkim healthy.
Vision of CATCH Programme: To Make Sikkim a healthy State in India.
1.1 Objectives • Thorough health checkup.
• Enable one to know his/her own health status and of the community.
• Spotting of risk factors and diagnosis of diseases in their early stages.
• Provide comprehensive health care.
• Take individual & collective initiative to work towards making the area and Sikkim
healthy.
Specific Objectives 1. To work towards a long-term policy change for positive health and a long-term promotion
of synergy between sustainable overall development and health, integrated approach to
build a strong, healthy and a just society by inter and intra-sectoral coordination at
different levels.
2 | C A T C H P r o g r a m m e E v a l u a t i o n R e p o r t S i k k i m b y R R C - N E S
2. To develop healthy setting -- home, school, work place, village, towns, health institutions,
to promote Health & prevent diseases.
3. To know Health profile of all the people from Gram Panchayat Ward to state level on Yearly
/ periodical basis.
4. To address key health promotion issues and prevention of most important health problem
of the state.
5. Early detection of all disease including those that has no apparent symptoms, prevent long
term illness through early diagnosis and work towards effective management.
6. To enable the local health care provider and community to know the community diagnosis
and address the local health need of the community. Build effective coalition of all the
stakeholders, create culture of health and fitness to make healthy community and to
effectively mobilize community and stakeholders to take ownership of CATCH in their
respective areas, and making the people realize that health is in their own hands.
7. To improve the quality of health care in all health institutions by making mandatory
comprehensive total care (physical, mental, social and spiritual) by changing practices to
focus on Health Promotion and diseases Prevention in addition to curative and
rehabilitative Health care.
8. To bring down cost of health care especially Chronic Diseases in long run.
9. To make Sikkim Healthiest state in India.
10. To monitor and evaluate CATCH for appropriate implementation and future
recommendation for continued innovation and responsiveness to current and emerging
health challenges which will be the cornerstone of future success.
Strategies: Comprehensive health care is being provided through convergence of all health programs and
services from village to state level to all the citizens of Sikkim to make a health movement for
healthy Sikkim. Detailed medical history, thorough physical check-up, screening of major health
problems, laboratory investigations, counseling, Behavioral Change Communication (BCC),
treatment and graded referral system is done. Recording of information in the family folders
3 | C A T C H P r o g r a m m e E v a l u a t i o n R e p o r t S i k k i m b y R R C - N E S
and individual case sheets and data entry into CATCH software are done to develop health
card. Health card is a type of bar coded smart card of an individual which when accessed gives
detailed health profile of the individual. This enables the individuals as well as the treating
doctors to know the health status, early evaluation and appropriate and comprehensive
intervention.
The following innovative mnemonics are adopted for easy understanding of the correlation
between the risk factors and diseases, while addressing the common people:
A- No to Alcohol
B- Control Blood Pressure
C- No to Cigarette and Tobacco
D- Healthy Diet
E- Regular Exercise
F- Control Fatness
G- Control Blood Glucose
As Stated, CATCH Programme is meant to CATCH the maximum attention on Health by making
every Sikkimese to:
• CATCH VISION to make Sikkim Healthiest State in India,
• CATCH MISSION, Objectives, Strategies and Activities to make all the units and finally
Sikkim Healthy.
• CATCH the community themselves to possess vision and work towards changing the
whole community to participate fully in making their Ward and finally Sikkim, a
healthiest state in India,
• CATCH To Change Mindset of All to focus from Disease to Health,
• CATCH Risk Factors & Diseases Early in the Ward of GPU itself so that treatment can be
done in the beginning of Disease itself
• CATCH the Real Cause of Sickness and manage them.
Progress so far
• Till now 1,10,560 Health card has been issued
4 | C A T C H P r o g r a m m e E v a l u a t i o n R e p o r t S i k k i m b y R R C - N E S
• Second round of CATCH camp is started from March 2014
• Till date 750 camps has been organized and those populations who were not covered
during the first round are being covered
• Community diagnosis of the first round of CATCH is being discussed during the training
on community process with VHSNC members to make them aware of the health issue of
their area, to take action and to motivate the people having health problems for follow
up to the higher centre. This way the VHSNC members can take the ownership to make
their village healthy.
What is being done right now
• Confirmation of the diagnosis done during first round of CATCH camp
• Abnormal finding found during the screening of CATCH camp were communicated to
the Village Health Sanitation and Nutrition Committee (VHSNC) members
• Follow up of these cases during Village Health Nutrition Day (VHND)
• CATCH data were discussed during the Community process meeting and will be followed
up
Way forward
• Ensure confirmation of diagnosis , accordingly follow up and provide treatment
• To carry out regular annual health-check as an ongoing process
• To develop and strengthen a centralized database mechanism
• From patients prospective, utilization of health card as when required
• Ensure uncovered population to undergo these health check-up in the second phase
• Supportive supervision and monitoring from various level to render quality services
• Appropriate policy making based on finding of CATCH report
A. Data Management in CATCH Programme:
More than 5 lakh Population of Sikkim state were screened as per the formatted questionnaire
under the CATCH programme for basic health check up services since the first round started in
the year of 2010-11. Data is collected regarding Demographic profile, behavioural Indicator and
basic health check up services in a format designed by Sikkim State officials. Later on State
5 | C A T C H P r o g r a m m e E v a l u a t i o n R e p o r t S i k k i m b y R R C - N E S
requested NIC, Sikkim to design Software for reporting and analysis of data. For this purpose
NIC Sikkim mapped all the facility and area of Sikkim up to the level of ward or Gram-Panchyat.
Some of the salient features of data management system are following:
Data Capture:
• NIC Sikkim has developed software for reporting and analysis of Data of CATCH
Programme.
• There are total 29 Data collection centre in Sikkim state (24 PHC and 4 DH and STNM).
• Each of the data centre is provided with laptop which has pre loaded the software.
• PHC Data entry operator under NHM is responsible for the data entry under the
supervision of District Nodal Officer.
• At the camp site after check up all Data are entered in the software, which work’s
offline.
• Laboratory testing related data are entered on the last day of camp.
Data Synchronization: All data collected during camp needs to be synchronized within a time
period of 2 months.
• Data synchronization centre is District NIC office.
• Data is synchronized by connecting laptop with NIC LAN.
• As soon as data synchronized both NIC and pre loaded software in laptop will be
automatic updates with all data.
B. CATCH Programme Findings: (State report)
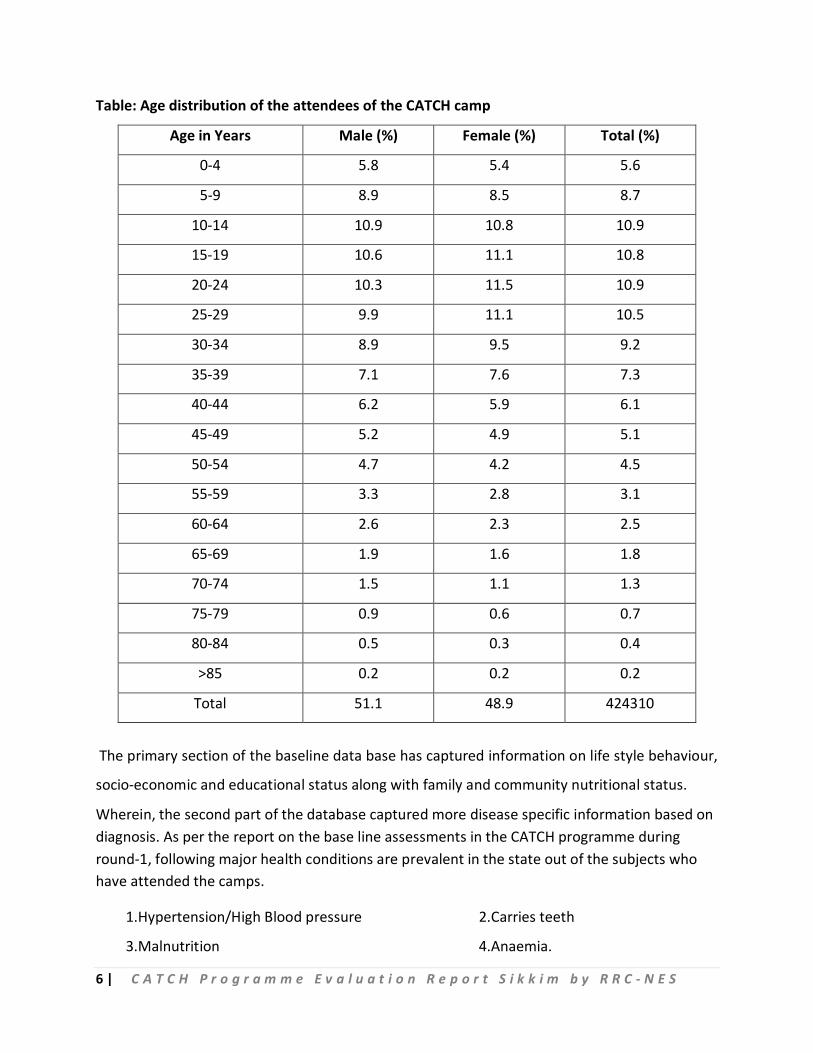
Population of Sikkim is as per census is 610577(2011) and under the CATCH programme 519968
population has been covered and out of which till date 424310 data has been entered.
6 | C A T C H P r o g r a m m e E v a l u a t i o n R e p o r t S i k k i m b y R R C - N E S
Table: Age distribution of the attendees of the CATCH camp
Age in Years Male (%) Female (%) Total (%)
0-4 5.8 5.4 5.6
5-9 8.9 8.5 8.7
10-14 10.9 10.8 10.9
15-19 10.6 11.1 10.8
20-24 10.3 11.5 10.9
25-29 9.9 11.1 10.5
30-34 8.9 9.5 9.2
35-39 7.1 7.6 7.3
40-44 6.2 5.9 6.1
45-49 5.2 4.9 5.1
50-54 4.7 4.2 4.5
55-59 3.3 2.8 3.1
60-64 2.6 2.3 2.5
65-69 1.9 1.6 1.8
70-74 1.5 1.1 1.3
75-79 0.9 0.6 0.7
80-84 0.5 0.3 0.4
>85 0.2 0.2 0.2
Total 51.1 48.9 424310
The primary section of the baseline data base has captured information on life style behaviour,
socio-economic and educational status along with family and community nutritional status.
Wherein, the second part of the database captured more disease specific information based on diagnosis. As per the report on the base line assessments in the CATCH programme during round-1, following major health conditions are prevalent in the state out of the subjects who have attended the camps.
1.Hypertension/High Blood pressure 2.Carries teeth
3.Malnutrition 4.Anaemia.
7 | C A T C H P r o g r a m m e E v a l u a t i o n R e p o r t S i k k i m b y R R C - N E S
5.Mental illness. 6.Eye problems
7.GI Diseases. 8.Backache.
9.UTI
Rationale of the study:
The CATCH prgramme has screened nearly 85% of the population and issued Smart Card. The
preliminary observation of the programme suggested that a midterm assessment is necessary
to further strengthen of the programme by removing the gaps for better utilization by the
community.
1.2 Methodology:
The study was done in two aspects, one is quantitative based on the beneficiary and other one
was qualitative interview with the stakeholders.
Quantitative :
Approximately 85 pc population of Sikkim (6 lakh) has covered under CATCH programme.
Nearly 200 sample size (population) would be sufficient for all districts where margin of error is
at 5 pc. To prepare such a large sampling frame is little bit difficult. Therefore stratified random
sampling is chosen to conduct the study. Approximately 730 (nearly 3600 population) House
hold with design effect 3.5 was surveyed in 74 villages based on PPS technique in 4 district of
Sikkim. Also the details of the screening and laboratory investigation of the family members
who attended CATCH health camp in last one year also analyzed. Approx 1174 number of family
members attended the Health camp in last one year prior to the survey. Recall period for the
service availed at the health camp was considered one year. Female above thirty years of age
was also surveyed for the screening of genealogical problem if any and any persons above thirty
years also surveyed to know the status of chronic diseases like high BP, diabetic’s etc.
8 | C A T C H P r o g r a m m e E v a l u a t i o n R e p o r t S i k k i m b y R R C - N E S
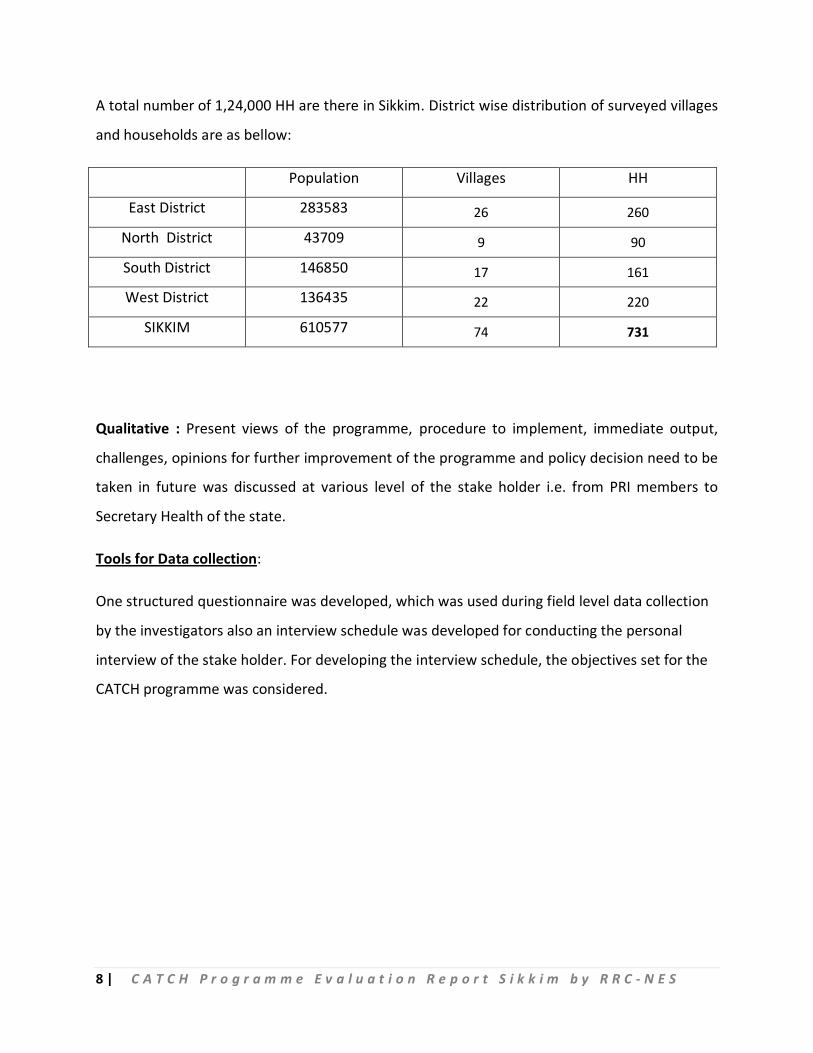
A total number of 1,24,000 HH are there in Sikkim. District wise distribution of surveyed villages
and households are as bellow:
Population Villages HH
East District 283583 26 260
North District 43709 9 90
South District 146850 17 161
West District 136435 22 220
SIKKIM 610577 74 731
Qualitative : Present views of the programme, procedure to implement, immediate output,
challenges, opinions for further improvement of the programme and policy decision need to be
taken in future was discussed at various level of the stake holder i.e. from PRI members to
Secretary Health of the state.
Tools for Data collection:
One structured questionnaire was developed, which was used during field level data collection
by the investigators also an interview schedule was developed for conducting the personal
interview of the stake holder. For developing the interview schedule, the objectives set for the
CATCH programme was considered.
9 | C A T C H P r o g r a m m e E v a l u a t i o n R e p o r t S i k k i m b y R R C - N E S
Chapter II Preliminary Field Observation prior to the Household survey
A Field visit was arranged to a camp organized in a community hall situated in the “Tibet
Road” of the Gangtok urban area. Following observations were made during the visit-
(1) Micro planning: Micro planning for arranging camp was found absent. First round of
check up took place in the year 2010-11. Second round was going at the time of visit.
Micro Planning regarding camp site, team member etc. is done based on availability.
(2) Monitoring Mechanism: For successful implementation of any programme monitoring is
an important tool. For Monitoring of programme like CATCH a high level dedicated team
is required to regular monitor the programme. This feature needs to be in built in the
CATCH Programme. A clear organ gram of the Human Resource is also missing.
(3) Planning and Policy decision based on findings: For first round data were collected data
during FY 2010-11 but till now no action has been initiated based on finding of data.
State needs to design and implement intervention based on findings.
(4) Visited health camp was held in a community hall in Tibbet Road, Urban Gangtok. The
team of service providers were comprised of 2 MO(Ayush), Counselor(MO Ayush),
Pharmacist-1(Ayush), LT-2, DEO-4, Registration conter-2, Camp Nodal officer-1(MBBS),
Jt. DHS i/c CATCH Programme. The camp was targeted to cover 1200 populace within a
period of 7 days starting on that day. Camp timing was 9-3 and till 1pm 25-30 have
attended. The beneficiary after registration used to attend the MO for health check up.
After check up s/he attends the dispenser and receives medicine. As may be advised,
the beneficiary attends the counselor and LT for investigation like grouping, Hb
estimation, blood sugar estimation etc. and the samples were sent to lab of STNM at the
end of the camp. After this, the beneficiary attends the DEOs where offline data entry is
done for the relevant health data in the relevant family/individual folder. The
beneficiary is issued a laminated “Smart Card” designed for the Catch programme. The
camp had no beneficiary listing and community mobilizers were also available at the
10 | C A T C H P r o g r a m m e E v a l u a t i o n R e p o r t S i k k i m b y R R C - N E S
time of visit. The nodal officer informed that the targeted 1200 population will be
covered in 1 week but no specific list day wise has been drafted and the duration may
be extended if needed. Logistical support in terms table and chairs, examinations table,
weight machine and height chart, side screen, pamphlet on Ayush medications,
Ayurvedic and Allopathic drugs, waste bins, color coded bags etc were available in the
camp site.
2.1 State Consultation:
A Secretarial level consultation was done on the CATCH programme implementation
and review and the following State officials participated in the consultation-
1. Secy. to Govt. of Sikkim, Dept of Health-Dr. K Bhandari.
2. Mission Director, NHM-Sikkim-Dr. P M Pradhan.
3. Principal Director, Dept. of Health-Dr. V. Singhi.
4. MS of STNM Hospital-Dr. Verma.
5. Jt DHS i/c of NCD of Sikkim-Dr. Keshree Rai
6. SIO, NIC, Sikkim-Mr. J. Sharma.
7. SPM, NHM Sikkim-Dr. N Subba.
8. SPMU officials.
Following issues were raised and discussed
a. Programme Secretariat: Though there is no laid down organ gram for the programme
secretariat in the state it was designed in such a way that the state secretariat for the
CATCH programme is headed by Jt DHS i/c of the NCD programme and the overall
mentoring is under the visionary of the Mission Director, NHM. At the district level, one
DNO who is usually a senior MO, is the responsible officer assisted by the DEO under
NHM. MO i/c of the respective PHC area is also the focal person of the camp and is
assisted by the attached Para-medical staff. GP representative and ASHA is the
delegated community mobilizers for the camp.
b. HR under CATCH programme: The existing health staff posted at the PHC under the
Govt./NHM is enrolled in the camp activities. Usually the camp site is fixed in
consultation with the GP representative and the required man-days are calculated
11 | C A T C H P r o g r a m m e E v a l u a t i o n R e p o r t S i k k i m b y R R C - N E S
based on the time required to screen all the subjects. The MO of the PHC is the focal
person for the health camps and s/he is assisted by the LT, DEO and other support staff.
On the camp day the designated team moves out to the site and the site selection is
independent of the RI/VHND plan.
c. M&E: There is no structured Monitoring mechanism for the CATCH programme. State is
under the process of identifying feasible indicators for monitoring. Evaluation is done in
terms of disease prevalence amongst the camp attendee’s from the data base with the
central NIC unit.
d. Convergence and role of PRI/GP and stakeholders: Though this is a crucial point during
the discussion no specific response was received on the same. The camp planning is
done GP ward wise and the camp site is decided by the GP as per the pre-fixed dates for
that village/ward and the community is informed and followed up by the ASHA before
the camp days. Specific ToR of the stake holders or the nodal officers has not been
developed.
e. Training and Capacity Building: Specific module for the CATCH programme has not been
developed as yet by the state. The capacity building of the staff and also the VHSNC
members is done by the DNO of the respective district and assisted by state officials.
f. IEC/BCC: Community mobilization is done by the respective GP representative and ASHA
of the concerned village in the form of IPC. CATCH specific IEC materials are not
developed.
g. Policy and administrative decisions based on the 1st Round: Till date the major health
conditions in the state of Sikkim has been mapped area wise and the same is digitalized
by the state NIC. Based on the database so developed and maintained by the NIC,
CATCH specific smart card is being issued which bears a individual identification number
and also each card is provided with a bar code and a QR code . So far, no administrative
or policy decision on health has been taken by the state govt. based on the observations
of the CATCH programme.
h. Logistical inputs. Under the CATCH programme, all the DH and PHC are strengthened
with Auto-analyzer/Semi-auto analyzer during the 1st round. All the camps are provided
12 | C A T C H P r o g r a m m e E v a l u a t i o n R e p o r t S i k k i m b y R R C - N E S
with gloucometer for estimation of plasma glucose and Blood grouping regents and
other samples are collected for the PHC/DH. Necessary reagents are provided from the
CMS through the PHC on a monthly basis. Other equipments like weighing scale, height
chart, BP instrument, examination table etc are already available in the system and are
in use. Laptops were provided to DEO for data entry.
i. Follow up services and Referral mechanism for the sick. The 1st phase of the CATCH
programme is mainly on screening of the beneficiaries to identify the health issues of
the individual and community as such. Diagnosed disease conditions are referred to the
nearest PHC/DH for further evaluation and treatment. Primary medications are usually
provided as on a camp approach for the general ailments like fever, cough, weakness,
skin problems, cough etc. Though disease conditions are detected during the camp, the
referral is not institutionalized and is on a need basis in the available ambulance.
j. OOPE: Beneficiaries coming to the CATCH camps do not have to bear the registration or
the counseling or basic diagnostics expenditure. Medications are also provided for
general ailments. Further investigation/diagnostics are available in the DH/STNM where
they are usually referred if needed. The treatment is made free for the
Sikkimese/residential population in the referral hospital as per the state health policy
independent of the CATCH programme initiatives.
2.2 Observations based on the concept note of the State team and the field observations
and the preliminary discussion with the stakeholders at State level:
1. Organizational structure/secretarial setup not available for the programme
implementation. A programme secretariat for the CATCH programme
implementation was advocated as was not well defined. Terms of reference for the
designated officials and secretariats and work areas not specifically defined.
Available work charter is expended to accommodate the CATCH camp activities on
an ad hoc basis.
13 | C A T C H P r o g r a m m e E v a l u a t i o n R e p o r t S i k k i m b y R R C - N E S
2. The 1st round of the CATCH programme was designed as an annual screening of all
the residential population of the Sikkim in a period of one year but the activities
were extended to another 2 years i.e. 2010-11, 2011-12 and 2012-13 to cover
approx 95% of the population. The 2nd round of the health screening could be
started in 2014, March after a time lapse of 2-3 years instead of annual event.
3. Principal objective of the large scale screening under the CATCH programme was to
identify the major health conditions with a focus on the NCDs. But the data base
could not capture status of Cancer, Blindness, Geriatric health issues which are
relevant in a stable population like Sikkim. Moreover, the CATCH programme
document and discussion could not elaborate on the package of services intended to
be provided to the beneficiaries although a broad term of “universal health
coverage” is being used.
4. System readiness to provide the required range of services for the screened
/diagnosed disease conditions were not available or inherent in the programme
framework. Sensitive diagnostics were used for the screening but confirmation of
the false positives not followed up with specific investigations.
5. Quantifiable Monitoring indicators for programme implementation and an M&E
mechanism are absent under the CATCH programme. Further evaluation will reveal
the community level participation, ownership and acceptance of the programme
activities.
6. Budgetary provisions and head wise expenditure is not shared by the State and
hence could not be commented.
7. NIC has been involved for the data management at no additional cost with the
available structure which limits the expansion/innovation for the data utilization
under the CATCH programme viz. web based data entry/retrieval, feedback and
validation etc.
8. Existing institutional logistical support is used for the camps which puts additional
weight on the system. Supply of the consumable and drug is part of the CMS and the
14 | C A T C H P r o g r a m m e E v a l u a t i o n R e p o r t S i k k i m b y R R C - N E S
additional disease burden based requirement is yet not reflected in the inventory
mechanism.
2.3 Conclusion:
Based on the background understanding of the CATCH programme status in the hilly
state, it will be a prematurely statement to put forth on the adoption of the same work
frame at the National context as the noble state innovation is in a nascent stage.
Moreover, to draw a scientific inference, it is proposed to undertake the 2nd phase of
the evaluation of the CATCH programme implementation exploring the following areas
of concern-
1. Field evaluation of the programme coverage and reach, planning and execution.
2. Community awareness and satisfaction in terms of the programme perspective.
3. Organizational frame and institutional capacity.
4. Service provider’s awareness and satisfaction in terms of the programme
perspective.
5. Budget and expenditure, cost utilization of the programme.
6. Logistics and inventory mechanism support, linkages of referral, convergence etc.
15 | C A T C H P r o g r a m m e E v a l u a t i o n R e p o r t S i k k i m b y R R C - N E S
Chapter III
House Hold Survey Findings It is well known that the RCH indicators in Sikkim as per external survey is quite glowing, and
also the facilities in Sikkim are well functioning. In addition to the family welfare services, the
state govt. has taken initiative to screen all peoples in Sikkim to know the prevalence of non
communicable diseases to provide right treatment to those who are unaware about their
diseases. A cross sectional survey was conducted in all 4 districts of Sikkim to know the
awareness and utilization of the benefits available under CATCH programme by the community
and how to strengthen the programme further.
A total number of 731 household with 3602 members were surveyed among 74 villages in 4
district of Sikkim. The survey was conducted also among MO, ANM and ASHA to know their
views, success, constraints and suggestions for further improvements.
In a nutshell, the CATCH programme has covered every nook & corner of the Sikkim with little a
lesser amount of in Gangtok. All people are aware about CATCH programme and avail the
services provided at the camp. The catch programme is basically providing services in screening
part, treatment of the patients under the CATCH programme is much less. It is evident from the
survey a meager portion of the patients has attended health camp organized under the CATCH
programme. A deep drawback of the programme is follow up and referral system for the
identified patients. Another, issues under the CATCH progarmme is that not a single service
provider is specifically engaged under the programme; regular service providers have used in
the health camp. Another good innovation is the issue of Health Card but only one third of the
population has received the health card. Different studies show that the ASHA has played a
major role for awareness generation among the community and the same is also reflected in the
CATCH progrmamme as most of the persons are reveal that they are aware about CATCH
programme due to ASHA. In the survey shows that, farming including agricultural worker is the
prime occupation of nearly 60 pc of the house hold which also implies the participation in the
CATCH programme by the common villagers. In addition to the screening, laboratory
16 | C A T C H P r o g r a m m e E v a l u a t i o n R e p o r t S i k k i m b y R R C - N E S
investigations also done at the camp and the beneficiaries are aware about their investigations
with the result. Although, a very less percentage of peoples need to be prescribe medicines at
the camp but most of the patients have got the prescribed medicines.
Detail of the House hold survey findings are analyzed below:
3.1 About Household information:
It is evident that the most of the beneficiaries under the CATCH programme are permanent
resident of Sikkim and has been living the villages since long time. As above mentioned the
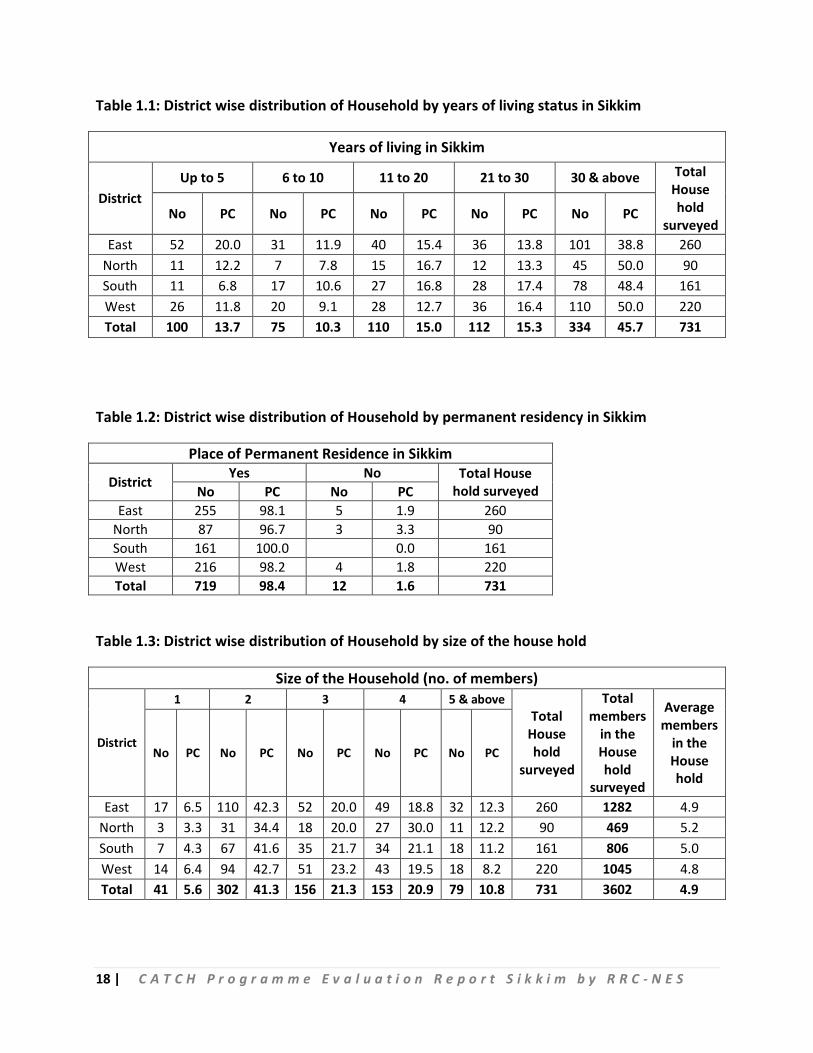
survey was conducted in 731 Households in all 4 districts and from the table 1.1 it is observed
that 45.7 pc of the households have been living in Sikkim for more than 30 years followed by
15.3 pc of the households living in the state in between 20 years to 30 years and lowest 10.3 pc
of households are living in Sikkim in between 6 to 10 years.
Table 1.2 discusses about status of households, whose place of permanent residence is in
Sikkim and from the table it is seen that out of total 731 households, 98.4 pc (719 households)
informed that their place of permanent residence is Sikkim and negligible 1.6 pc (12
households) opined that they do not belong to Sikkim. Within the districts, it is seen that in
South Sikkim, all the 100 pc households, who were surveyed were permanent resident of
Sikkim whereas the North District of Sikkim had 3.3 pc(3) households, who are not permanent
resident of Sikkim.
It is seen that out of 731 surveyed households with 3602 population covered, 41.3 pc
households have highest household size of 2 members followed by 21.3 pc households have
household size of 3 members and 1 member household size is found to be 5.6 pc. However,
average household size is found to be 4.9 with North District has highest household size of 5.2
members and West Sikkim districts has lowest with 4.8 members. (Table 1.3)
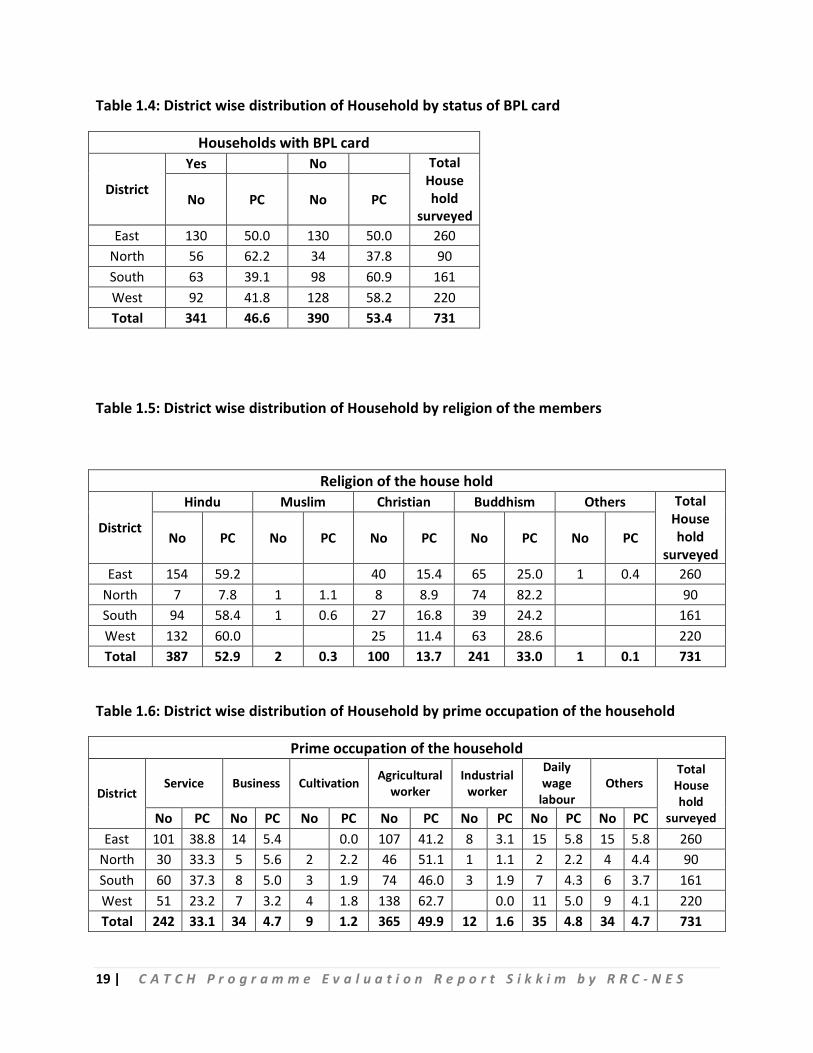
Table 1.4 shows the status of BPL households in each of the district. From the table, it is seen
that 46.6 pc (341 households) of the surveyed households have BPL card in the state. Within
the districts, highest 62.2 pc of the household surveyed in North Sikkim have BPL Card and
South Sikkim surveyed households have lowest 39.1 pc BPL card.
17 | C A T C H P r o g r a m m e E v a l u a t i o n R e p o r t S i k k i m b y R R C - N E S
The table 1.5 highlights the religion breakup of the surveyed households. From the table, it is
apparent that households belongs to Hinduism is dominating with 52.9 pc followed by
Buddhism with 33 pc and lowest Muslim households with .3 pc. Moreover, it is seen that 2
districts (East and West Sikkim) do not have any surveyed household belong to Muslim
community.
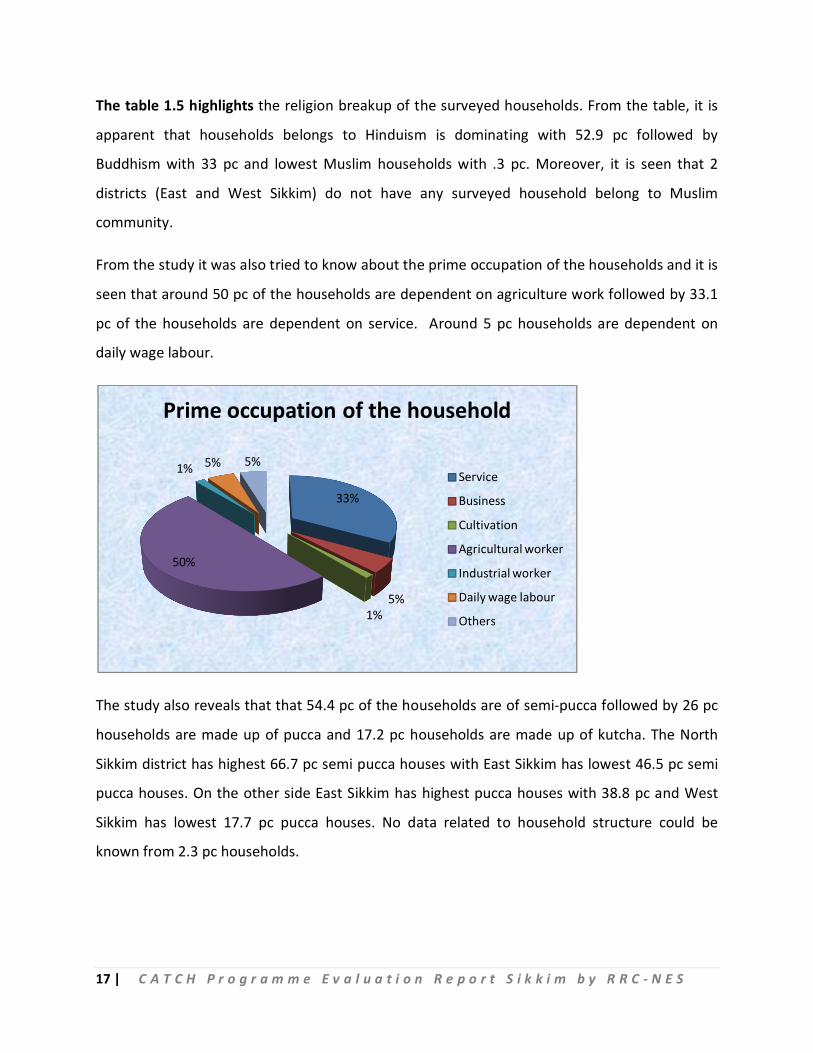
From the study it was also tried to know about the prime occupation of the households and it is
seen that around 50 pc of the households are dependent on agriculture work followed by 33.1
pc of the households are dependent on service. Around 5 pc households are dependent on
daily wage labour.
The study also reveals that that 54.4 pc of the households are of semi-pucca followed by 26 pc
households are made up of pucca and 17.2 pc households are made up of kutcha. The North
Sikkim district has highest 66.7 pc semi pucca houses with East Sikkim has lowest 46.5 pc semi
pucca houses. On the other side East Sikkim has highest pucca houses with 38.8 pc and West
Sikkim has lowest 17.7 pc pucca houses. No data related to household structure could be
known from 2.3 pc households.
33%
5%1%
50%
1% 5% 5%
Prime occupation of the household
Service
Business
Cultivation
Agricultural worker
Industrial worker
Daily wage labour
Others
18 | C A T C H P r o g r a m m e E v a l u a t i o n R e p o r t S i k k i m b y R R C - N E S
Table 1.1: District wise distribution of Household by years of living status in Sikkim
Years of living in Sikkim
District Up to 5 6 to 10 11 to 20 21 to 30 30 & above Total
House hold
surveyed No PC No PC No PC No PC No PC
East 52 20.0 31 11.9 40 15.4 36 13.8 101 38.8 260 North 11 12.2 7 7.8 15 16.7 12 13.3 45 50.0 90 South 11 6.8 17 10.6 27 16.8 28 17.4 78 48.4 161 West 26 11.8 20 9.1 28 12.7 36 16.4 110 50.0 220 Total 100 13.7 75 10.3 110 15.0 112 15.3 334 45.7 731
Table 1.2: District wise distribution of Household by permanent residency in Sikkim
Place of Permanent Residence in Sikkim
District Yes No Total House hold surveyed No PC No PC
East 255 98.1 5 1.9 260 North 87 96.7 3 3.3 90 South 161 100.0 0.0 161 West 216 98.2 4 1.8 220 Total 719 98.4 12 1.6 731
Table 1.3: District wise distribution of Household by size of the house hold
Size of the Household (no. of members)
District
1 2 3 4 5 & above Total
House hold
surveyed
Total members
in the House hold
surveyed
Average members
in the House hold
No PC No PC No PC No PC No PC
East 17 6.5 110 42.3 52 20.0 49 18.8 32 12.3 260 1282 4.9 North 3 3.3 31 34.4 18 20.0 27 30.0 11 12.2 90 469 5.2 South 7 4.3 67 41.6 35 21.7 34 21.1 18 11.2 161 806 5.0 West 14 6.4 94 42.7 51 23.2 43 19.5 18 8.2 220 1045 4.8 Total 41 5.6 302 41.3 156 21.3 153 20.9 79 10.8 731 3602 4.9
19 | C A T C H P r o g r a m m e E v a l u a t i o n R e p o r t S i k k i m b y R R C - N E S
Table 1.4: District wise distribution of Household by status of BPL card
Households with BPL card
District
Yes No Total House hold
surveyed No PC No PC
East 130 50.0 130 50.0 260 North 56 62.2 34 37.8 90 South 63 39.1 98 60.9 161 West 92 41.8 128 58.2 220 Total 341 46.6 390 53.4 731
Table 1.5: District wise distribution of Household by religion of the members
Religion of the house hold
District
Hindu Muslim Christian Buddhism Others Total House hold
surveyed No PC No PC No PC No PC No PC
East 154 59.2 40 15.4 65 25.0 1 0.4 260 North 7 7.8 1 1.1 8 8.9 74 82.2 90 South 94 58.4 1 0.6 27 16.8 39 24.2 161 West 132 60.0 25 11.4 63 28.6 220 Total 387 52.9 2 0.3 100 13.7 241 33.0 1 0.1 731
Table 1.6: District wise distribution of Household by prime occupation of the household
Prime occupation of the household
District Service Business Cultivation Agricultural
worker Industrial
worker
Daily wage
labour Others
Total House hold
surveyed No PC No PC No PC No PC No PC No PC No PC East 101 38.8 14 5.4 0.0 107 41.2 8 3.1 15 5.8 15 5.8 260
North 30 33.3 5 5.6 2 2.2 46 51.1 1 1.1 2 2.2 4 4.4 90 South 60 37.3 8 5.0 3 1.9 74 46.0 3 1.9 7 4.3 6 3.7 161 West 51 23.2 7 3.2 4 1.8 138 62.7 0.0 11 5.0 9 4.1 220 Total 242 33.1 34 4.7 9 1.2 365 49.9 12 1.6 35 4.8 34 4.7 731
20 | C A T C H P r o g r a m m e E v a l u a t i o n R e p o r t S i k k i m b y R R C - N E S
Table 1.7: District wise distribution of Household by structure of the household
Type of household structure
District
Pucca Semi Pucca Kutcha No data Total House hold
surveyed No PC No PC No PC No PC
East 101 38.8 121 46.5 33 12.7 5 1.9 260 North 20 22.2 60 66.7 9 10.0 1 1.1 90 South 30 18.6 98 60.9 29 18.0 4 2.5 161 West 39 17.7 119 54.1 55 25.0 7 3.2 220 Total 190 26.0 398 54.4 126 17.2 17 2.3 731
3.2 Awareness about CATCH Programme
From the study, it is seen that all households (99.7 pc) are aware about CATCH program, which
is praise-worthy. Further, it is observed that in North and South district all 100 pc households
have awareness about the CATCH program. West district has the lowest awareness about
CATCH program with 99.5 pc.
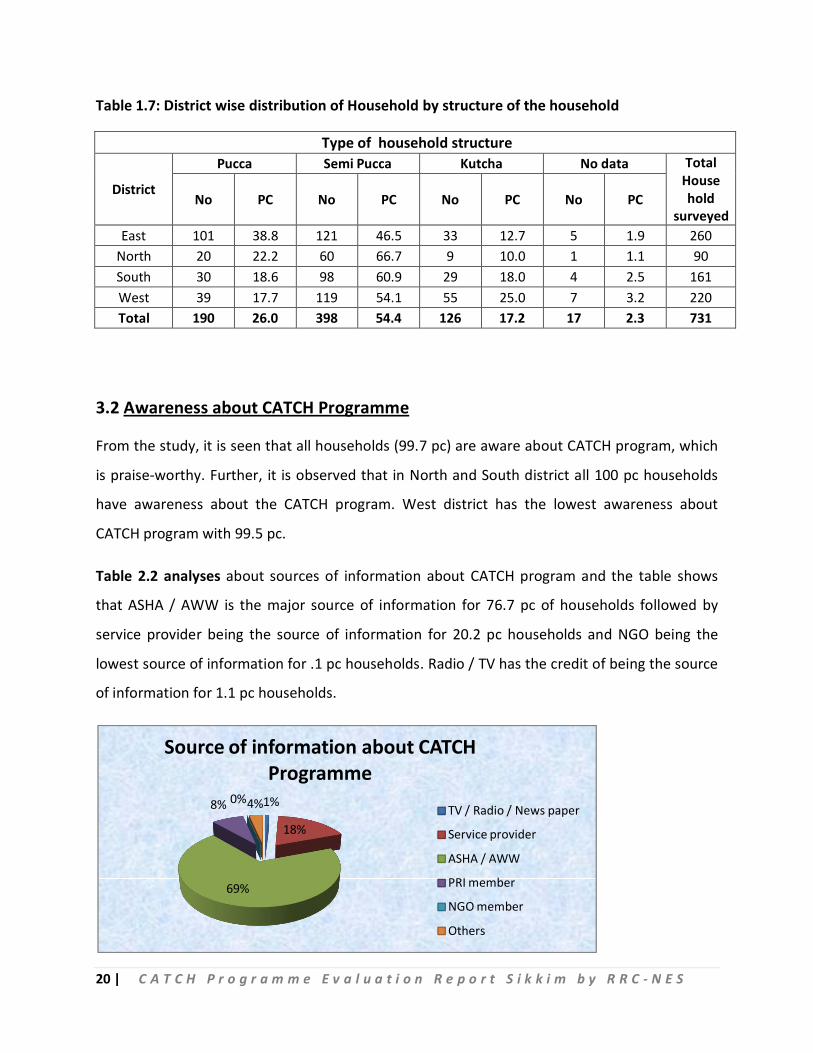
Table 2.2 analyses about sources of information about CATCH program and the table shows
that ASHA / AWW is the major source of information for 76.7 pc of households followed by
service provider being the source of information for 20.2 pc households and NGO being the
lowest source of information for .1 pc households. Radio / TV has the credit of being the source
of information for 1.1 pc households.
1%
18%
69%
8% 0%4%
Source of information about CATCH Programme
TV / Radio / News paper
Service provider
ASHA / AWW
PRI member
NGO member
Others
21 | C A T C H P r o g r a m m e E v a l u a t i o n R e p o r t S i k k i m b y R R C - N E S
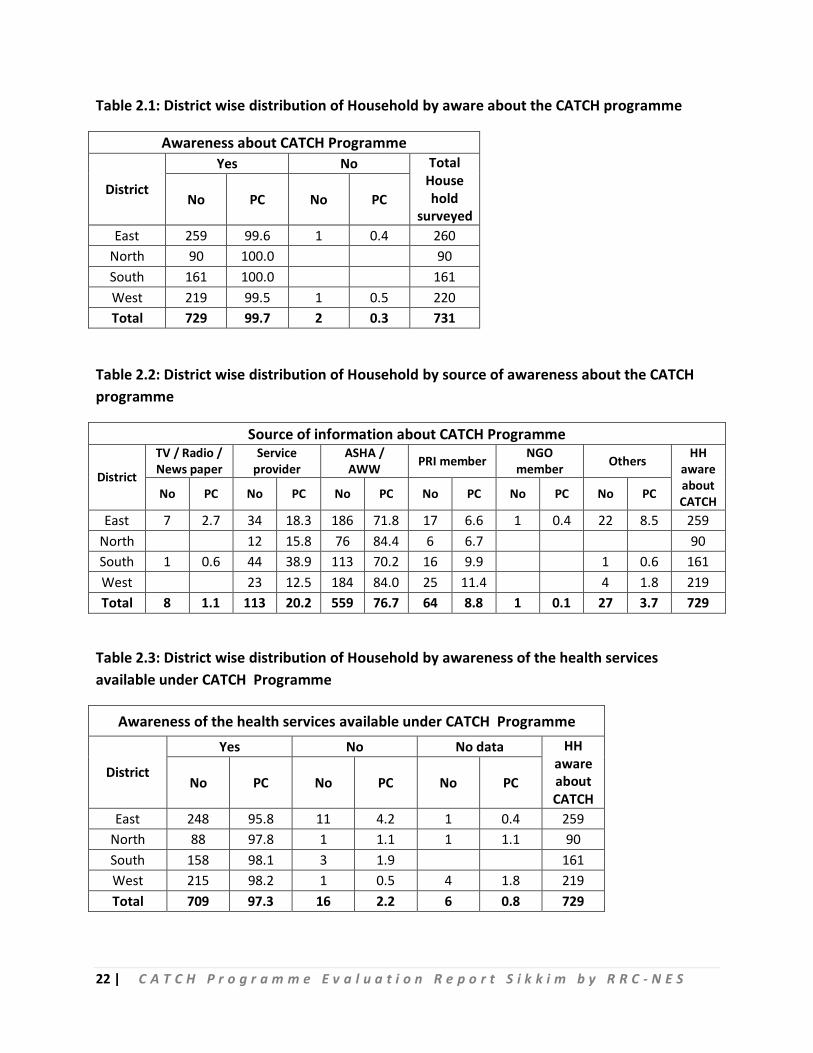
Regarding awareness about the health services available under CATCH program, the table 2.3
explains that 97.3 pc of the households have awareness about the different health services
available under CATCH programme and mere 2.2 pc households do not know about the
different health services available under CATCH program. West Sikkim has the highest
awareness with 98.2 pc and East District (being the Capital District) has the lowest awareness
about the different health services available under CATCH program.
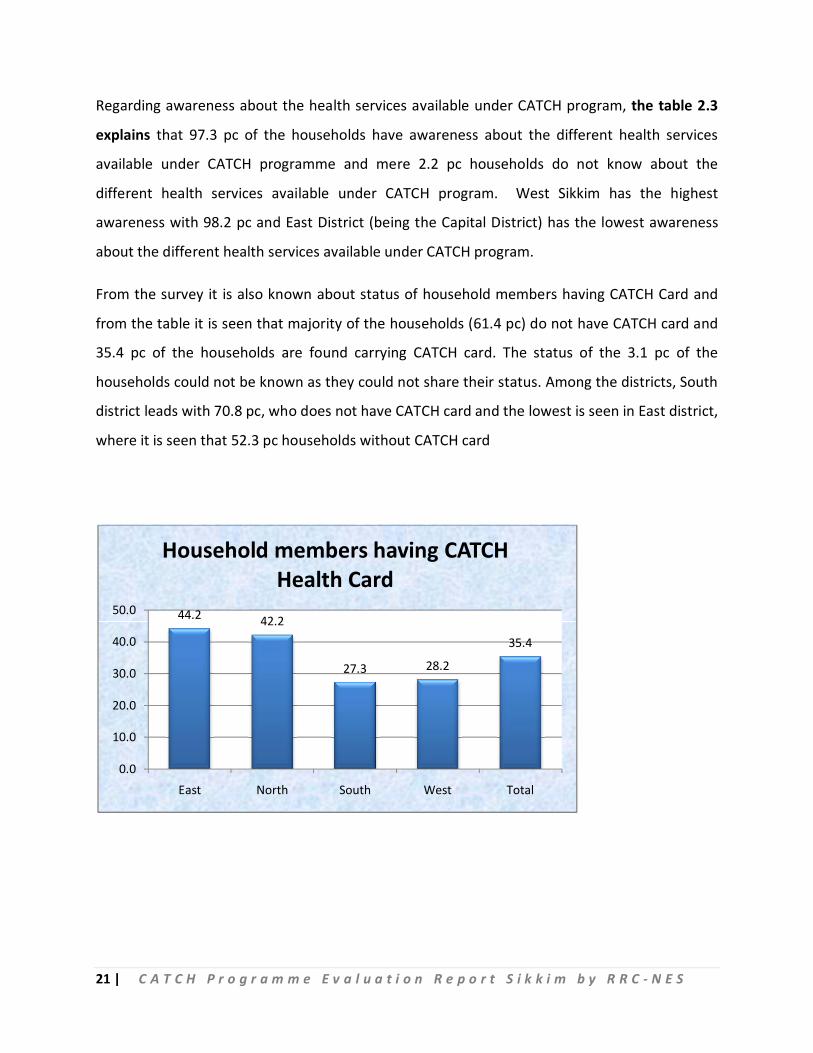
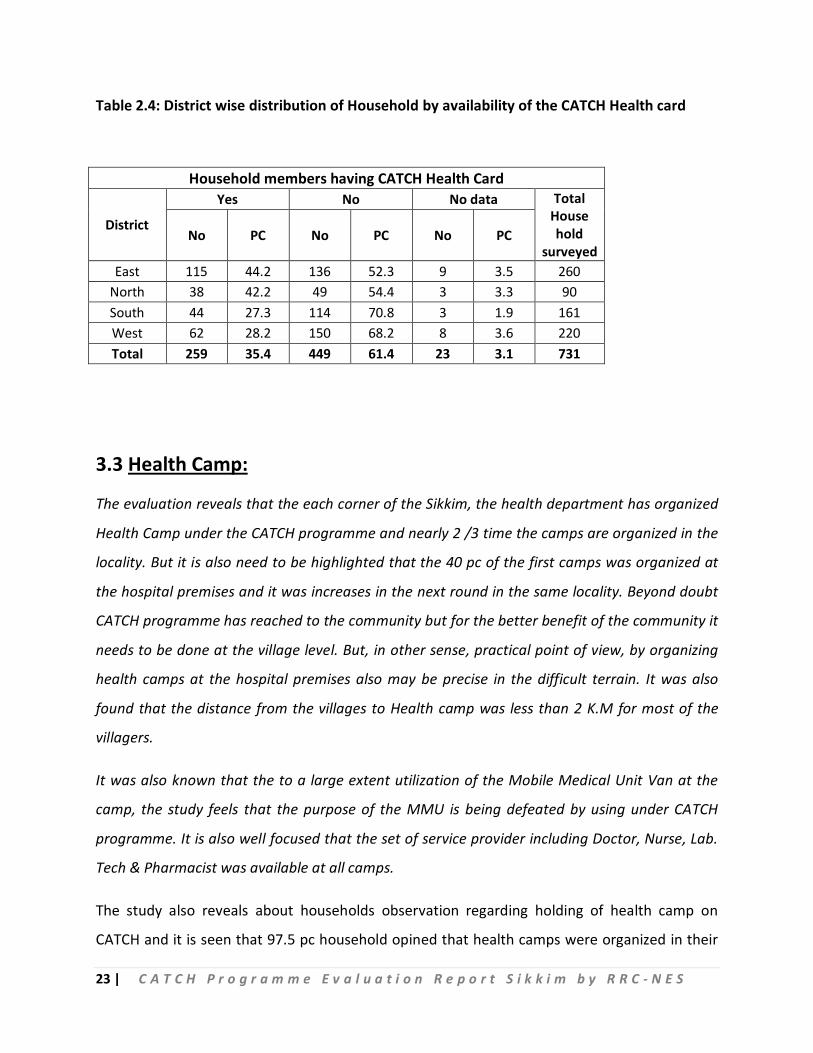
From the survey it is also known about status of household members having CATCH Card and
from the table it is seen that majority of the households (61.4 pc) do not have CATCH card and
35.4 pc of the households are found carrying CATCH card. The status of the 3.1 pc of the
households could not be known as they could not share their status. Among the districts, South
district leads with 70.8 pc, who does not have CATCH card and the lowest is seen in East district,
where it is seen that 52.3 pc households without CATCH card
44.2 42.2
27.3 28.2
35.4
0.0
10.0
20.0
30.0
40.0
50.0
East North South West Total
Household members having CATCH Health Card
22 | C A T C H P r o g r a m m e E v a l u a t i o n R e p o r t S i k k i m b y R R C - N E S
Table 2.1: District wise distribution of Household by aware about the CATCH programme
Awareness about CATCH Programme
District
Yes No Total House hold
surveyed No PC No PC
East 259 99.6 1 0.4 260 North 90 100.0 90 South 161 100.0 161 West 219 99.5 1 0.5 220 Total 729 99.7 2 0.3 731
Table 2.2: District wise distribution of Household by source of awareness about the CATCH programme
Source of information about CATCH Programme
District
TV / Radio / News paper
Service provider
ASHA / AWW PRI member NGO
member Others HH aware about CATCH No PC No PC No PC No PC No PC No PC
East 7 2.7 34 18.3 186 71.8 17 6.6 1 0.4 22 8.5 259 North 12 15.8 76 84.4 6 6.7 90 South 1 0.6 44 38.9 113 70.2 16 9.9 1 0.6 161 West 23 12.5 184 84.0 25 11.4 4 1.8 219 Total 8 1.1 113 20.2 559 76.7 64 8.8 1 0.1 27 3.7 729
Table 2.3: District wise distribution of Household by awareness of the health services available under CATCH Programme
Awareness of the health services available under CATCH Programme
District
Yes No No data HH aware about CATCH
No PC No PC No PC
East 248 95.8 11 4.2 1 0.4 259 North 88 97.8 1 1.1 1 1.1 90 South 158 98.1 3 1.9 161 West 215 98.2 1 0.5 4 1.8 219 Total 709 97.3 16 2.2 6 0.8 729
23 | C A T C H P r o g r a m m e E v a l u a t i o n R e p o r t S i k k i m b y R R C - N E S
Table 2.4: District wise distribution of Household by availability of the CATCH Health card
Household members having CATCH Health Card
District
Yes No No data Total House hold
surveyed No PC No PC No PC
East 115 44.2 136 52.3 9 3.5 260 North 38 42.2 49 54.4 3 3.3 90 South 44 27.3 114 70.8 3 1.9 161 West 62 28.2 150 68.2 8 3.6 220 Total 259 35.4 449 61.4 23 3.1 731
3.3 Health Camp:
The evaluation reveals that the each corner of the Sikkim, the health department has organized
Health Camp under the CATCH programme and nearly 2 /3 time the camps are organized in the
locality. But it is also need to be highlighted that the 40 pc of the first camps was organized at
the hospital premises and it was increases in the next round in the same locality. Beyond doubt
CATCH programme has reached to the community but for the better benefit of the community it
needs to be done at the village level. But, in other sense, practical point of view, by organizing
health camps at the hospital premises also may be precise in the difficult terrain. It was also
found that the distance from the villages to Health camp was less than 2 K.M for most of the
villagers.
It was also known that the to a large extent utilization of the Mobile Medical Unit Van at the
camp, the study feels that the purpose of the MMU is being defeated by using under CATCH
programme. It is also well focused that the set of service provider including Doctor, Nurse, Lab.
Tech & Pharmacist was available at all camps.
The study also reveals about households observation regarding holding of health camp on
CATCH and it is seen that 97.5 pc household opined that health camps were organized in their
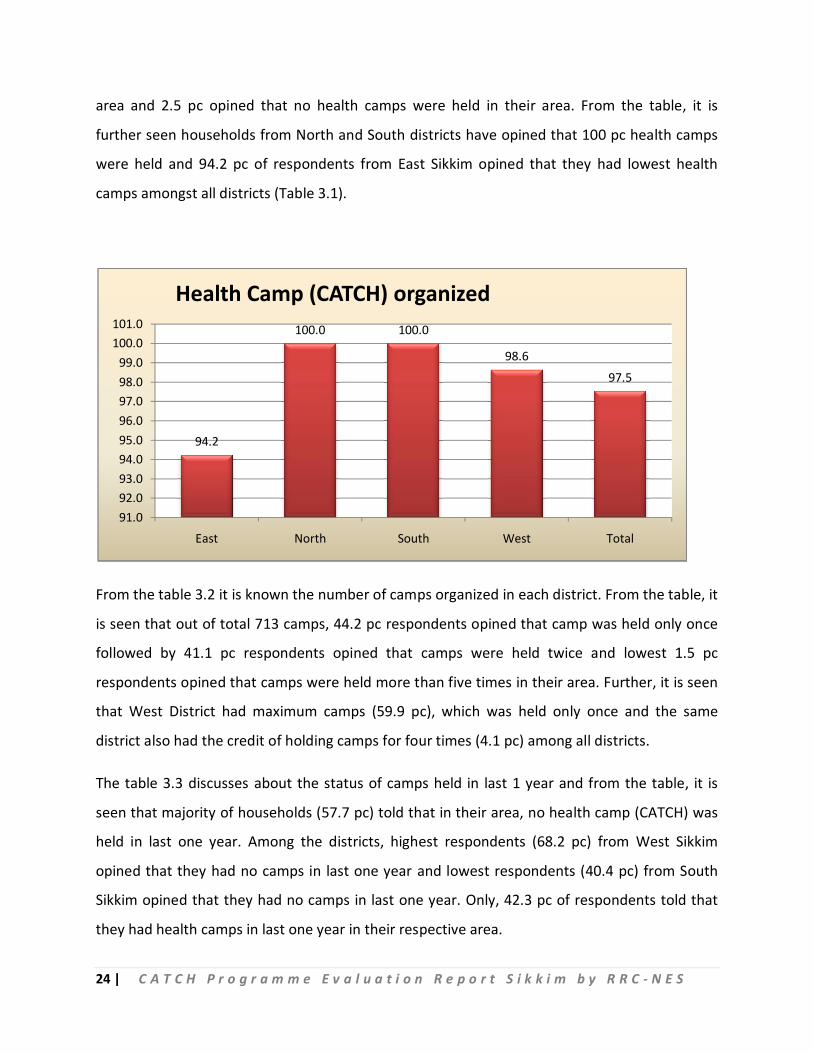
24 | C A T C H P r o g r a m m e E v a l u a t i o n R e p o r t S i k k i m b y R R C - N E S
area and 2.5 pc opined that no health camps were held in their area. From the table, it is
further seen households from North and South districts have opined that 100 pc health camps
were held and 94.2 pc of respondents from East Sikkim opined that they had lowest health
camps amongst all districts (Table 3.1).
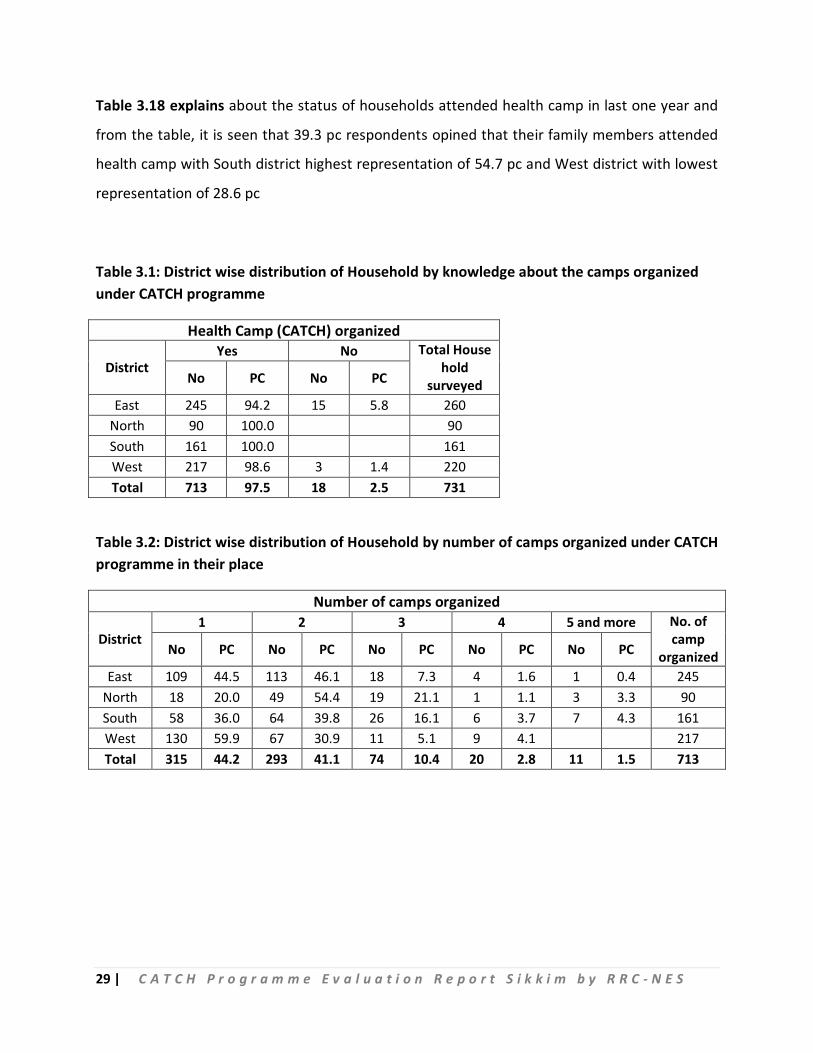
From the table 3.2 it is known the number of camps organized in each district. From the table, it
is seen that out of total 713 camps, 44.2 pc respondents opined that camp was held only once
followed by 41.1 pc respondents opined that camps were held twice and lowest 1.5 pc
respondents opined that camps were held more than five times in their area. Further, it is seen
that West District had maximum camps (59.9 pc), which was held only once and the same
district also had the credit of holding camps for four times (4.1 pc) among all districts.
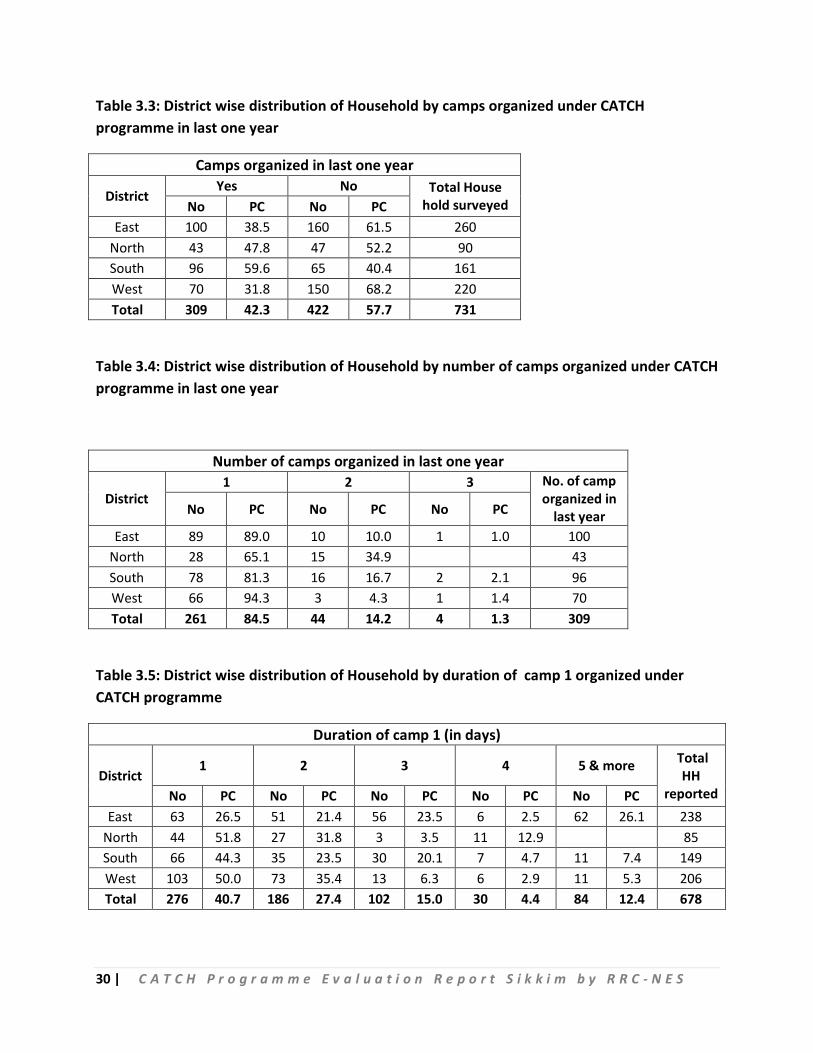
The table 3.3 discusses about the status of camps held in last 1 year and from the table, it is
seen that majority of households (57.7 pc) told that in their area, no health camp (CATCH) was
held in last one year. Among the districts, highest respondents (68.2 pc) from West Sikkim
opined that they had no camps in last one year and lowest respondents (40.4 pc) from South
Sikkim opined that they had no camps in last one year. Only, 42.3 pc of respondents told that
they had health camps in last one year in their respective area.
94.2
100.0 100.0
98.6
97.5
91.092.093.094.095.096.097.098.099.0
100.0101.0
East North South West Total
Health Camp (CATCH) organized
25 | C A T C H P r o g r a m m e E v a l u a t i o n R e p o r t S i k k i m b y R R C - N E S
The data also analyzed to know the number of camps organized in last one year in each district.
From the table, it is seen that out of total 309 health camps organized in last one year, 84.5 pc
of the total camps was held only once followed by 14.2 pc of the camps were held twice and 1.3
pc of the camps were held more than three times. Further, it is seen that West district had
maximum camps (94.3 pc), which was held only once and the South district had maximum
camps (2.1 pc), which held thrice in last one year (Table 3.4).
The table 3.5 explains about the duration of 1st camp (in days). Out of 678 respondents, 40.7 pc
expressed that the 1st camp was for 1 day, followed by 27.4 pc reported that the camp was for
2 days whereas 12.4 pc reported that it was for 5 days and more. Within districts, highest
reporting of 1st camp as 1 day event came from North district with 51.8 pc and 35.4 pc
respondents from West district opined that the event was for 2 days. 23.5 pc respondents from
East district responded that the event was for 3 days. None of the respondents from North
district reported that the event was for 5 days and more.
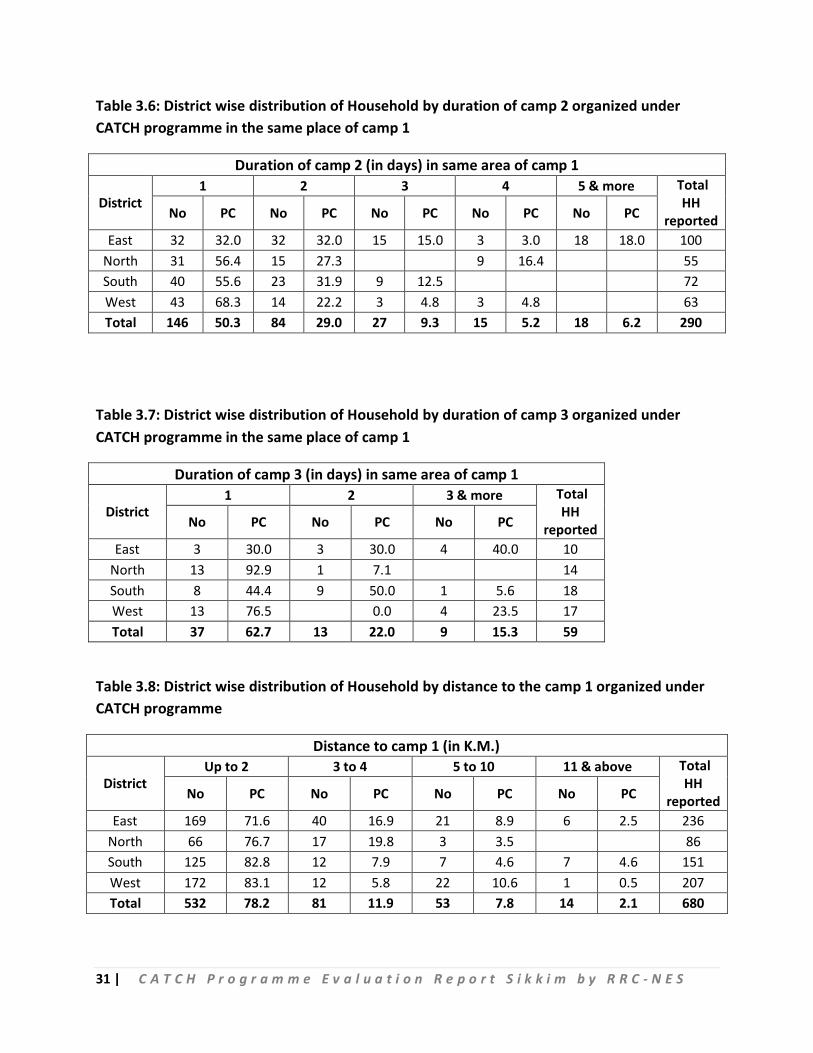
The study also describes about the duration of 2nd camp in same area of 1st camp. The table
reveals that 50.3 pc of total 290 respondents households reported that the 2nd camp was for 1
day and 29 pc of respondents have shared that the camp was for 2 days and mere 6.2 pc
respondents reported that the camp was held for 5 and more days. Among the districts, West
district responded highest with 68.3 pc that the camp was held for 1 day, East district
responded highest with 32 pc that the camp was held for 2 days but except East district
responded no other district informed that the camp was held for 5 or more than 5 days. South
district even did not respond for holding of camp for 4 days (Table 3.6).
Table 3.7 illustrates about the duration of third camp in same area of first camp. As reflected in
the table out of 59 households, who responded, 62.7 pc have reported that the 3rd camp was
held for 1 day followed by 22 pc responded that camp was held for 2 days and 15.3 pc
responded that camp was held for 3 or more days. Among the districts, North district reported
highest with 92 pc that the camp was held for 1 day, South district responded highest with 50
pc that the camp was held for 2 days and East district responded highest with 40 pc that the
camp was held for 3 and more days.
26 | C A T C H P r o g r a m m e E v a l u a t i o n R e p o r t S i k k i m b y R R C - N E S
The table 3.8 shows the distance of the health camp (CATCH) 1 held from the houses of the
respondents. From the table, it is seen that out of 680 households, who responded to this
question, 78.2 pc respondents opined that the health camps were held within 2 kms of their
house followed by 11.9 pc respondents opined that health camps were held within 3 to 4 kms
of their house and 7.8 pc respondents opined that health camps were held within 5 to 10 kms
of their house and mere 2.1 pc respondents opined that health camps were held beyond 10
kms of their house.
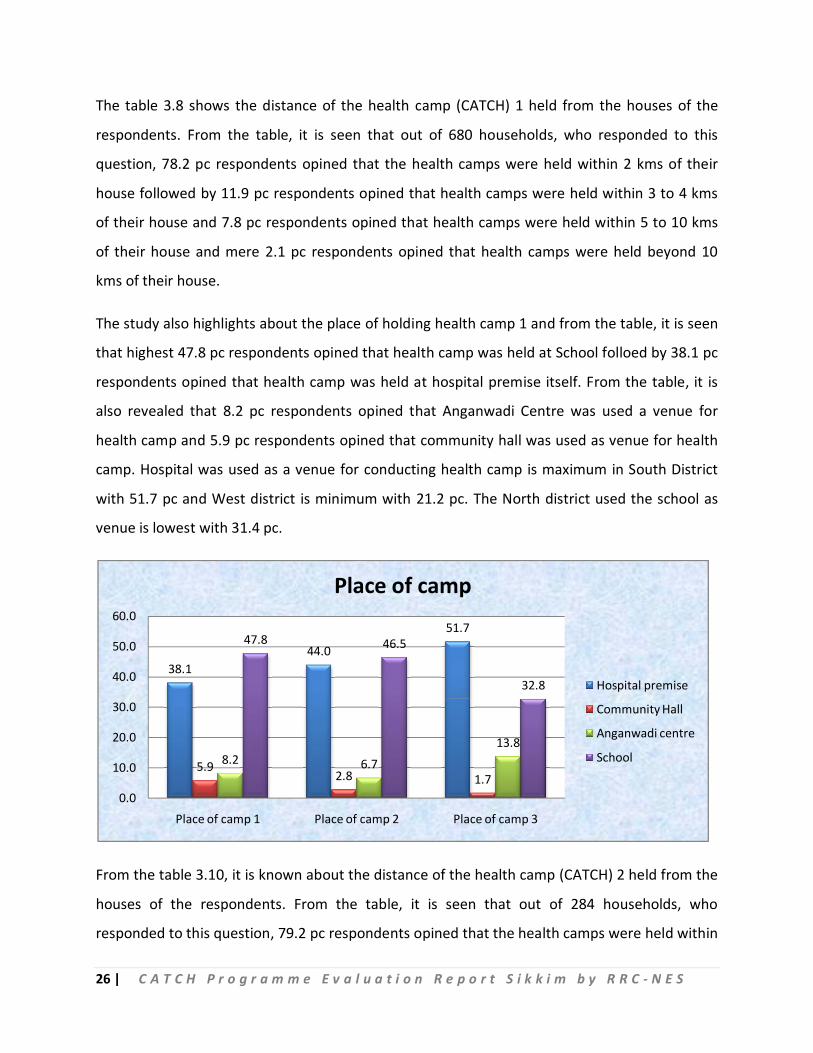
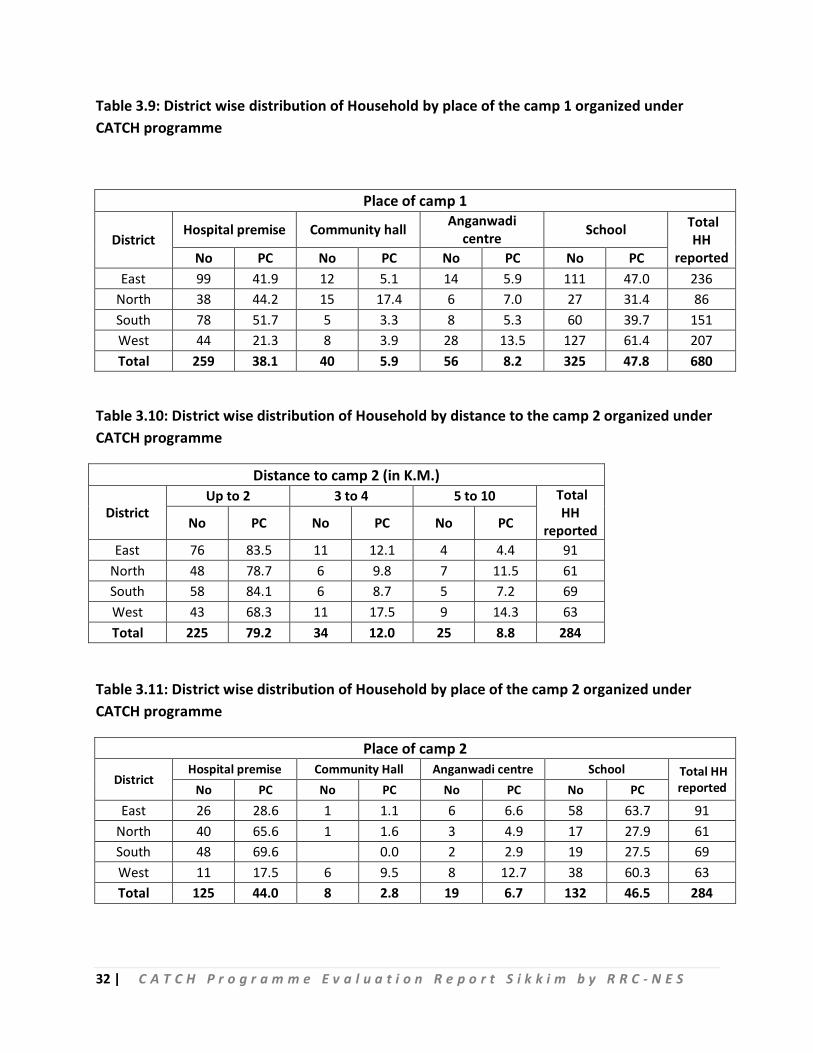
The study also highlights about the place of holding health camp 1 and from the table, it is seen
that highest 47.8 pc respondents opined that health camp was held at School folloed by 38.1 pc
respondents opined that health camp was held at hospital premise itself. From the table, it is
also revealed that 8.2 pc respondents opined that Anganwadi Centre was used a venue for
health camp and 5.9 pc respondents opined that community hall was used as venue for health
camp. Hospital was used as a venue for conducting health camp is maximum in South District
with 51.7 pc and West district is minimum with 21.2 pc. The North district used the school as
venue is lowest with 31.4 pc.
From the table 3.10, it is known about the distance of the health camp (CATCH) 2 held from the
houses of the respondents. From the table, it is seen that out of 284 households, who
responded to this question, 79.2 pc respondents opined that the health camps were held within
38.144.0
51.7
5.92.8 1.7
8.2 6.7
13.8
47.8 46.5
32.8
0.0
10.0
20.0
30.0
40.0
50.0
60.0
Place of camp 1 Place of camp 2 Place of camp 3
Place of camp
Hospital premise
Community Hall
Anganwadi centre
School
27 | C A T C H P r o g r a m m e E v a l u a t i o n R e p o r t S i k k i m b y R R C - N E S
2 kms of their house followed by 12 pc respondents opined that health camps were held within
3 to 4 kms of their house and 8.8 pc respondents opined that health camps were held within 5
to 10 kms of their house.
99.7 pc about the place of holding health camp 2 and from the table, it is apparent that highest
46.5 pc respondents opined that health camp was held at School followed by 44 pc respondents
opined that health camp was held at hospital premise itself. The table also reveals that 6.7 pc
respondents opined that Anganwadi Centre was used a venue for health camp and 2.8 pc
respondents opined that community hall was used as venue for health camp. Hospital was used
as a venue for conducting health camp is maximum in South District with 69.6 pc and West
district is minimum with 17.5 pc. The South district also used school as venue with 27.5 pc,
which is lowest.
Again the distance of the health camp (CATCH) 3 held from the houses of the respondents.
From the table, it is seen that out of 58 households, who responded to this question, 72.4 pc
respondents opined that the health camps were held within 2 kms of their house followed by
12.1 pc respondents opined that health camps were held within 3 to 4 kms of their house and
15.5 pc respondents opined that health camps were held within 5 to 10 kms of their house.
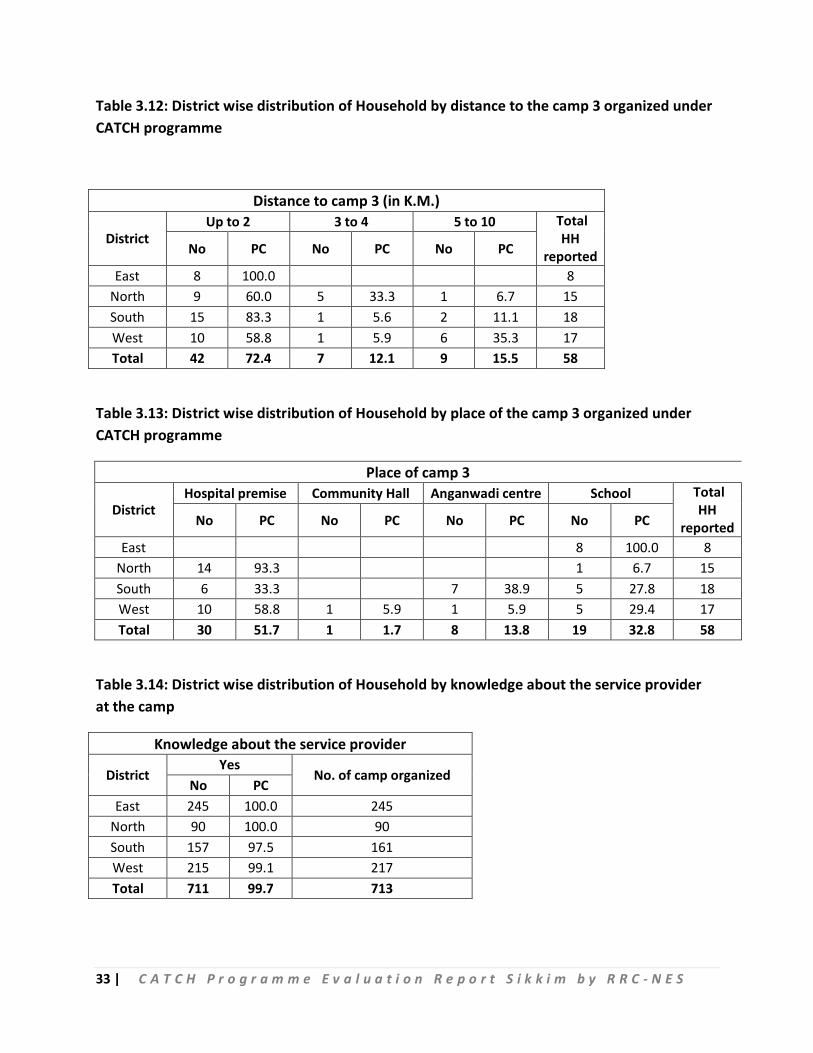
Table 3.13 speaks about the place of holding health camp 3 and from the table, it is apparent
that highest 51.7 pc respondents opined that health camp was held at hospital premise itself
followed by 32.8 pc respondents opined that health camp was held at school. The table also
shows that 13.8 pc respondents opined that Anganwadi Centre was used a venue for health
camp and 1.7 pc respondents opined that community hall was used as venue for health camp.
Hospital was used as a venue for conducting health camp is maximum in North District with
93.3 pc and South district is minimum with 33.3 pc. The East Sikkim district had all its health
camps at Schools.
From the table 3.14, it is seen that 99.7 pc of the respondents had knowledge about the service
provider, which is appreciable. Further, the table reveals that both in East and North districts,
all 100 pc respondents had knowledge about the service provider and the South district stands
lowest with 97.5 pc respondents knew about service provider.
28 | C A T C H P r o g r a m m e E v a l u a t i o n R e p o r t S i k k i m b y R R C - N E S
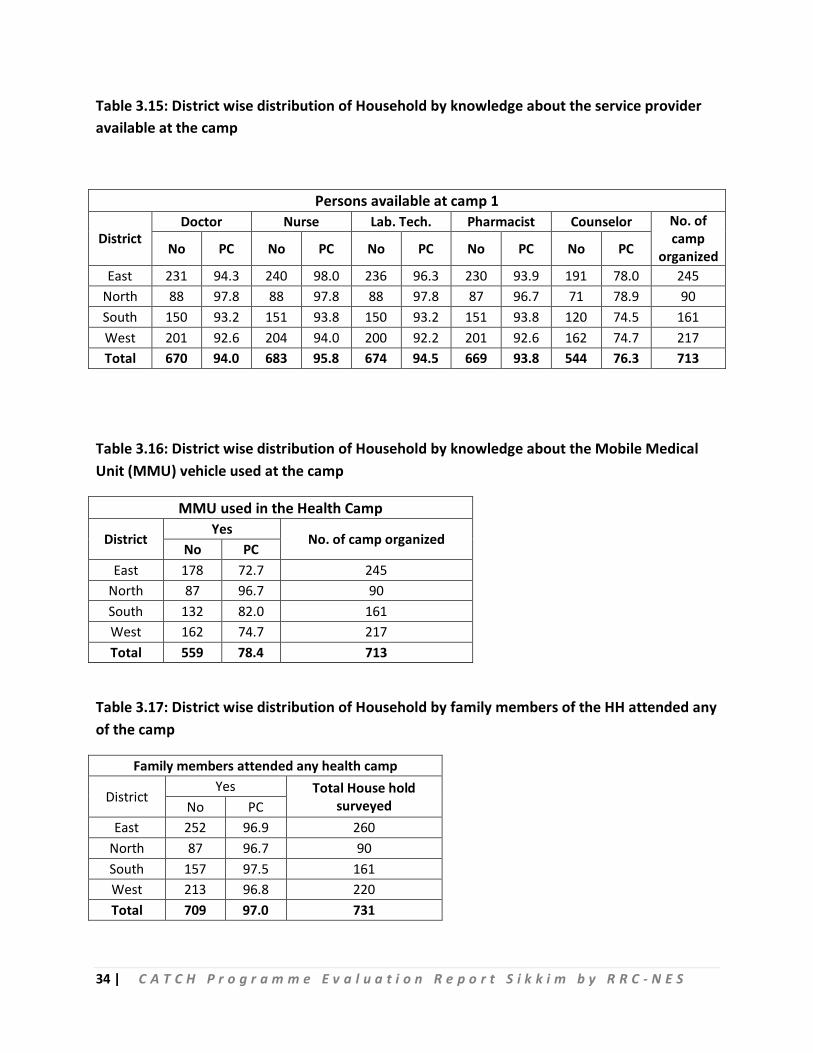
The table 3.15 speaks about availability of service providers in the health camp 1 and it is seen
from the table that presence of Nurse is heading the list with 95.8 pc followed by Lab Tech with
94.5 pc and then Doctor with 94 pc, Pharmacist with 93.8 pc and Counselor being the lowest
with 76.3 pc. Among the districts, presence of Doctor in the health camp 1 is seen highest in
North district with 97.8 pc and lowest with West district with 92.6 pc. The attendance of Nurse
in the health camp 1 is seen highest at East district with 98 pc and lowest with South district
with 93.8 pc. For Lab Tech, in the health camp 1 highest attendance is seen at North district and
lowest at West district with 92.2 pc and Counselors attendance is seen highest at North district
with 78.9 pc and lowest at South district with 74.5 pc.
The table 3.16 discusses about use of MMU in the health camp and from the table it is seen
that 78.4 pc respondents opined that MMU was used during the health camps with use of
MMU is seen highest at North district with 96.7 pc and lowest at East district with 72.7 pc.
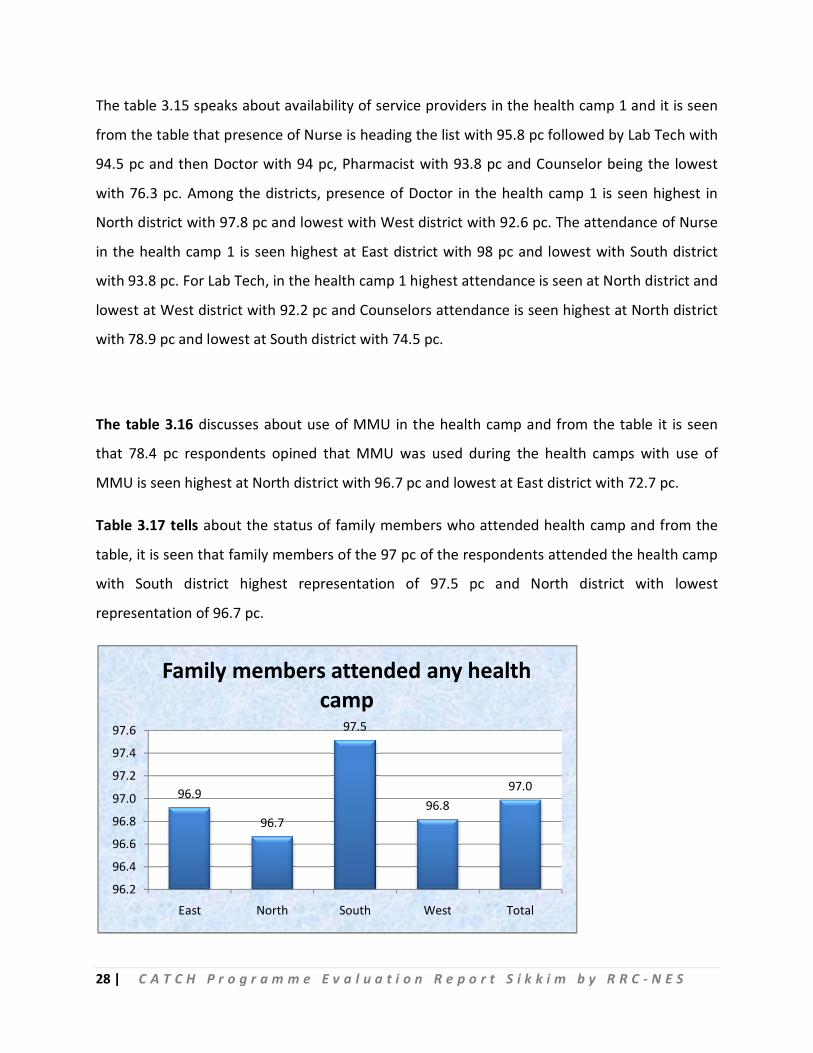
Table 3.17 tells about the status of family members who attended health camp and from the
table, it is seen that family members of the 97 pc of the respondents attended the health camp
with South district highest representation of 97.5 pc and North district with lowest
representation of 96.7 pc.
96.9
96.7
97.5
96.897.0
96.2
96.4
96.6
96.8
97.0
97.2
97.4
97.6
East North South West Total
Family members attended any health camp
29 | C A T C H P r o g r a m m e E v a l u a t i o n R e p o r t S i k k i m b y R R C - N E S
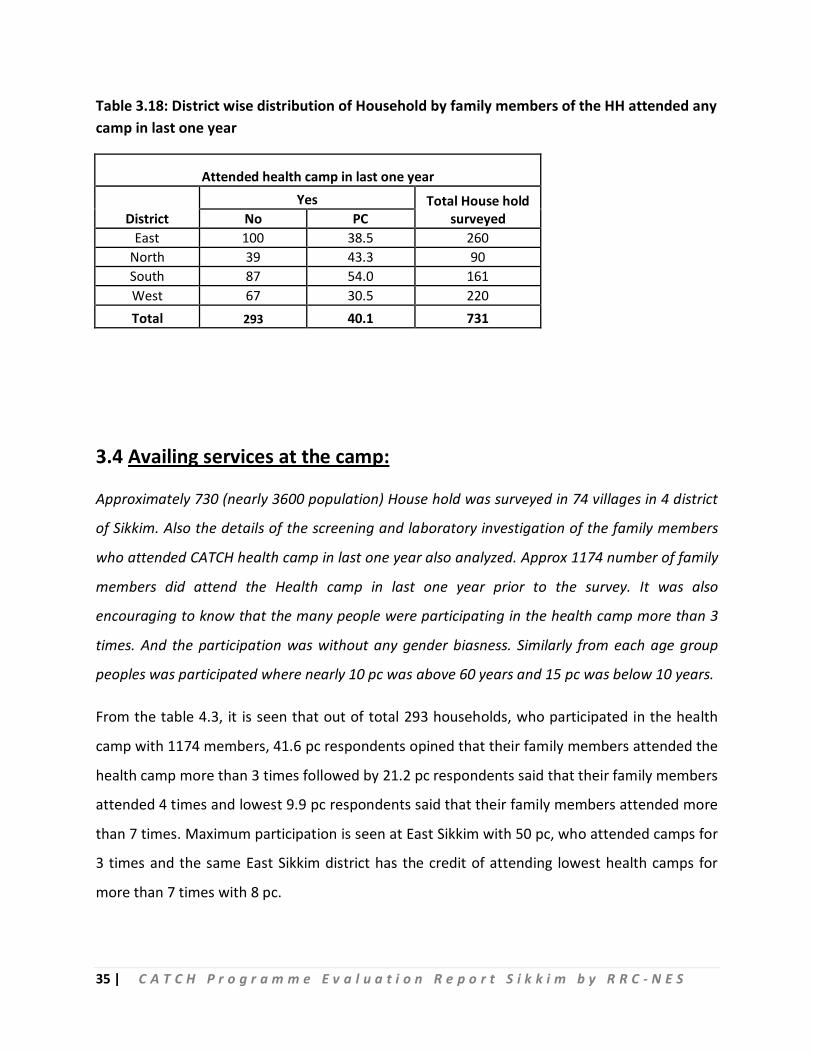
Table 3.18 explains about the status of households attended health camp in last one year and
from the table, it is seen that 39.3 pc respondents opined that their family members attended
health camp with South district highest representation of 54.7 pc and West district with lowest
representation of 28.6 pc
Table 3.1: District wise distribution of Household by knowledge about the camps organized under CATCH programme
Health Camp (CATCH) organized
District Yes No Total House
hold surveyed No PC No PC
East 245 94.2 15 5.8 260 North 90 100.0 90 South 161 100.0 161 West 217 98.6 3 1.4 220 Total 713 97.5 18 2.5 731
Table 3.2: District wise distribution of Household by number of camps organized under CATCH programme in their place
Number of camps organized
District 1 2 3 4 5 and more No. of
camp organized No PC No PC No PC No PC No PC
East 109 44.5 113 46.1 18 7.3 4 1.6 1 0.4 245 North 18 20.0 49 54.4 19 21.1 1 1.1 3 3.3 90 South 58 36.0 64 39.8 26 16.1 6 3.7 7 4.3 161 West 130 59.9 67 30.9 11 5.1 9 4.1 217 Total 315 44.2 293 41.1 74 10.4 20 2.8 11 1.5 713
30 | C A T C H P r o g r a m m e E v a l u a t i o n R e p o r t S i k k i m b y R R C - N E S
Table 3.3: District wise distribution of Household by camps organized under CATCH programme in last one year
Camps organized in last one year
District Yes No Total House
hold surveyed No PC No PC East 100 38.5 160 61.5 260
North 43 47.8 47 52.2 90 South 96 59.6 65 40.4 161 West 70 31.8 150 68.2 220 Total 309 42.3 422 57.7 731
Table 3.4: District wise distribution of Household by number of camps organized under CATCH programme in last one year
Number of camps organized in last one year
District 1 2 3 No. of camp
organized in last year No PC No PC No PC
East 89 89.0 10 10.0 1 1.0 100 North 28 65.1 15 34.9 43 South 78 81.3 16 16.7 2 2.1 96 West 66 94.3 3 4.3 1 1.4 70 Total 261 84.5 44 14.2 4 1.3 309
Table 3.5: District wise distribution of Household by duration of camp 1 organized under CATCH programme
Duration of camp 1 (in days)
District 1 2 3 4 5 & more Total
HH reported No PC No PC No PC No PC No PC
East 63 26.5 51 21.4 56 23.5 6 2.5 62 26.1 238 North 44 51.8 27 31.8 3 3.5 11 12.9 85 South 66 44.3 35 23.5 30 20.1 7 4.7 11 7.4 149 West 103 50.0 73 35.4 13 6.3 6 2.9 11 5.3 206 Total 276 40.7 186 27.4 102 15.0 30 4.4 84 12.4 678
31 | C A T C H P r o g r a m m e E v a l u a t i o n R e p o r t S i k k i m b y R R C - N E S
Table 3.6: District wise distribution of Household by duration of camp 2 organized under CATCH programme in the same place of camp 1
Duration of camp 2 (in days) in same area of camp 1
District 1 2 3 4 5 & more Total
HH reported No PC No PC No PC No PC No PC
East 32 32.0 32 32.0 15 15.0 3 3.0 18 18.0 100 North 31 56.4 15 27.3 9 16.4 55 South 40 55.6 23 31.9 9 12.5 72 West 43 68.3 14 22.2 3 4.8 3 4.8 63 Total 146 50.3 84 29.0 27 9.3 15 5.2 18 6.2 290
Table 3.7: District wise distribution of Household by duration of camp 3 organized under CATCH programme in the same place of camp 1
Duration of camp 3 (in days) in same area of camp 1
District 1 2 3 & more Total
HH reported No PC No PC No PC
East 3 30.0 3 30.0 4 40.0 10 North 13 92.9 1 7.1 14 South 8 44.4 9 50.0 1 5.6 18 West 13 76.5 0.0 4 23.5 17 Total 37 62.7 13 22.0 9 15.3 59
Table 3.8: District wise distribution of Household by distance to the camp 1 organized under CATCH programme
Distance to camp 1 (in K.M.)
District Up to 2 3 to 4 5 to 10 11 & above Total
HH reported No PC No PC No PC No PC
East 169 71.6 40 16.9 21 8.9 6 2.5 236 North 66 76.7 17 19.8 3 3.5 86 South 125 82.8 12 7.9 7 4.6 7 4.6 151 West 172 83.1 12 5.8 22 10.6 1 0.5 207 Total 532 78.2 81 11.9 53 7.8 14 2.1 680
32 | C A T C H P r o g r a m m e E v a l u a t i o n R e p o r t S i k k i m b y R R C - N E S
Table 3.9: District wise distribution of Household by place of the camp 1 organized under CATCH programme
Place of camp 1
District Hospital premise Community hall Anganwadi
centre School Total HH
reported No PC No PC No PC No PC East 99 41.9 12 5.1 14 5.9 111 47.0 236
North 38 44.2 15 17.4 6 7.0 27 31.4 86 South 78 51.7 5 3.3 8 5.3 60 39.7 151 West 44 21.3 8 3.9 28 13.5 127 61.4 207 Total 259 38.1 40 5.9 56 8.2 325 47.8 680
Table 3.10: District wise distribution of Household by distance to the camp 2 organized under CATCH programme
Distance to camp 2 (in K.M.)
District Up to 2 3 to 4 5 to 10 Total
HH reported No PC No PC No PC
East 76 83.5 11 12.1 4 4.4 91 North 48 78.7 6 9.8 7 11.5 61 South 58 84.1 6 8.7 5 7.2 69 West 43 68.3 11 17.5 9 14.3 63 Total 225 79.2 34 12.0 25 8.8 284
Table 3.11: District wise distribution of Household by place of the camp 2 organized under CATCH programme
Place of camp 2
District Hospital premise Community Hall Anganwadi centre School Total HH
reported No PC No PC No PC No PC East 26 28.6 1 1.1 6 6.6 58 63.7 91
North 40 65.6 1 1.6 3 4.9 17 27.9 61 South 48 69.6 0.0 2 2.9 19 27.5 69 West 11 17.5 6 9.5 8 12.7 38 60.3 63 Total 125 44.0 8 2.8 19 6.7 132 46.5 284
33 | C A T C H P r o g r a m m e E v a l u a t i o n R e p o r t S i k k i m b y R R C - N E S
Table 3.12: District wise distribution of Household by distance to the camp 3 organized under CATCH programme
Distance to camp 3 (in K.M.)
District Up to 2 3 to 4 5 to 10 Total
HH reported No PC No PC No PC
East 8 100.0 8 North 9 60.0 5 33.3 1 6.7 15 South 15 83.3 1 5.6 2 11.1 18 West 10 58.8 1 5.9 6 35.3 17 Total 42 72.4 7 12.1 9 15.5 58
Table 3.13: District wise distribution of Household by place of the camp 3 organized under CATCH programme
Place of camp 3
District Hospital premise Community Hall Anganwadi centre School Total
HH reported No PC No PC No PC No PC
East 8 100.0 8 North 14 93.3 1 6.7 15 South 6 33.3 7 38.9 5 27.8 18 West 10 58.8 1 5.9 1 5.9 5 29.4 17 Total 30 51.7 1 1.7 8 13.8 19 32.8 58
Table 3.14: District wise distribution of Household by knowledge about the service provider at the camp
Knowledge about the service provider
District Yes
No. of camp organized No PC
East 245 100.0 245 North 90 100.0 90 South 157 97.5 161 West 215 99.1 217 Total 711 99.7 713
34 | C A T C H P r o g r a m m e E v a l u a t i o n R e p o r t S i k k i m b y R R C - N E S
Table 3.15: District wise distribution of Household by knowledge about the service provider available at the camp
Persons available at camp 1
District Doctor Nurse Lab. Tech. Pharmacist Counselor No. of
camp organized No PC No PC No PC No PC No PC
East 231 94.3 240 98.0 236 96.3 230 93.9 191 78.0 245 North 88 97.8 88 97.8 88 97.8 87 96.7 71 78.9 90 South 150 93.2 151 93.8 150 93.2 151 93.8 120 74.5 161 West 201 92.6 204 94.0 200 92.2 201 92.6 162 74.7 217 Total 670 94.0 683 95.8 674 94.5 669 93.8 544 76.3 713
Table 3.16: District wise distribution of Household by knowledge about the Mobile Medical Unit (MMU) vehicle used at the camp
MMU used in the Health Camp
District Yes
No. of camp organized No PC
East 178 72.7 245 North 87 96.7 90 South 132 82.0 161 West 162 74.7 217 Total 559 78.4 713
Table 3.17: District wise distribution of Household by family members of the HH attended any of the camp
Family members attended any health camp
District Yes Total House hold
surveyed No PC East 252 96.9 260
North 87 96.7 90 South 157 97.5 161 West 213 96.8 220 Total 709 97.0 731
35 | C A T C H P r o g r a m m e E v a l u a t i o n R e p o r t S i k k i m b y R R C - N E S
Table 3.18: District wise distribution of Household by family members of the HH attended any camp in last one year
Attended health camp in last one year
District Yes Total House hold
surveyed No PC East 100 38.5 260
North 39 43.3 90 South 87 54.0 161 West 67 30.5 220 Total 293 40.1 731
3.4 Availing services at the camp:
Approximately 730 (nearly 3600 population) House hold was surveyed in 74 villages in 4 district
of Sikkim. Also the details of the screening and laboratory investigation of the family members
who attended CATCH health camp in last one year also analyzed. Approx 1174 number of family
members did attend the Health camp in last one year prior to the survey. It was also
encouraging to know that the many people were participating in the health camp more than 3
times. And the participation was without any gender biasness. Similarly from each age group
peoples was participated where nearly 10 pc was above 60 years and 15 pc was below 10 years.
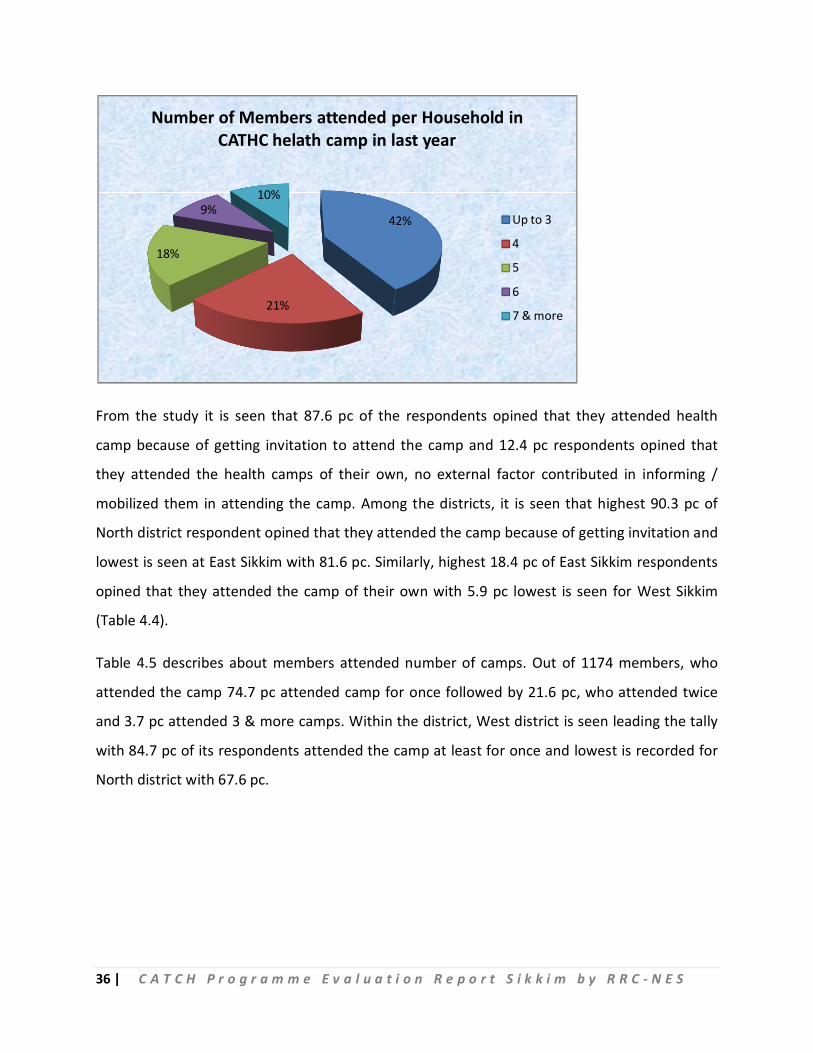
From the table 4.3, it is seen that out of total 293 households, who participated in the health
camp with 1174 members, 41.6 pc respondents opined that their family members attended the
health camp more than 3 times followed by 21.2 pc respondents said that their family members
attended 4 times and lowest 9.9 pc respondents said that their family members attended more
than 7 times. Maximum participation is seen at East Sikkim with 50 pc, who attended camps for
3 times and the same East Sikkim district has the credit of attending lowest health camps for
more than 7 times with 8 pc.
36 | C A T C H P r o g r a m m e E v a l u a t i o n R e p o r t S i k k i m b y R R C - N E S
From the study it is seen that 87.6 pc of the respondents opined that they attended health
camp because of getting invitation to attend the camp and 12.4 pc respondents opined that
they attended the health camps of their own, no external factor contributed in informing /
mobilized them in attending the camp. Among the districts, it is seen that highest 90.3 pc of
North district respondent opined that they attended the camp because of getting invitation and
lowest is seen at East Sikkim with 81.6 pc. Similarly, highest 18.4 pc of East Sikkim respondents
opined that they attended the camp of their own with 5.9 pc lowest is seen for West Sikkim
(Table 4.4).
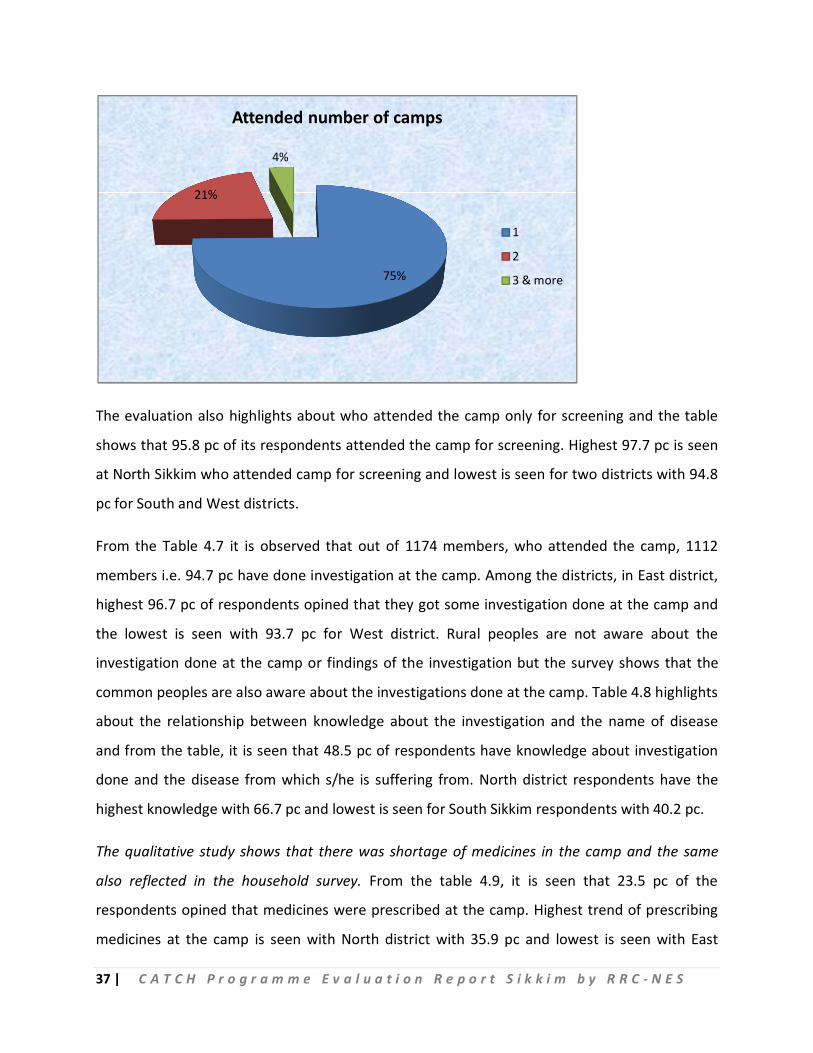
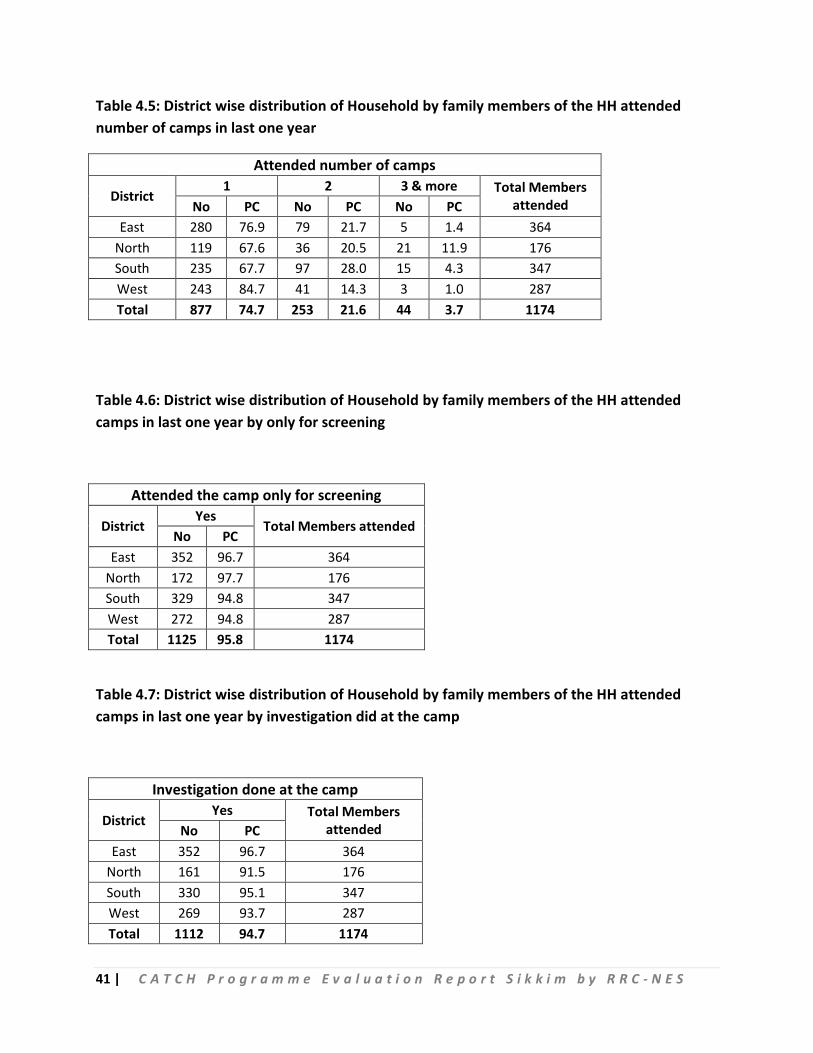
Table 4.5 describes about members attended number of camps. Out of 1174 members, who
attended the camp 74.7 pc attended camp for once followed by 21.6 pc, who attended twice
and 3.7 pc attended 3 & more camps. Within the district, West district is seen leading the tally
with 84.7 pc of its respondents attended the camp at least for once and lowest is recorded for
North district with 67.6 pc.
42%
21%
18%
9%10%
Number of Members attended per Household in CATHC helath camp in last year
Up to 3
4
5
6
7 & more
37 | C A T C H P r o g r a m m e E v a l u a t i o n R e p o r t S i k k i m b y R R C - N E S
The evaluation also highlights about who attended the camp only for screening and the table
shows that 95.8 pc of its respondents attended the camp for screening. Highest 97.7 pc is seen
at North Sikkim who attended camp for screening and lowest is seen for two districts with 94.8
pc for South and West districts.
From the Table 4.7 it is observed that out of 1174 members, who attended the camp, 1112
members i.e. 94.7 pc have done investigation at the camp. Among the districts, in East district,
highest 96.7 pc of respondents opined that they got some investigation done at the camp and
the lowest is seen with 93.7 pc for West district. Rural peoples are not aware about the
investigation done at the camp or findings of the investigation but the survey shows that the
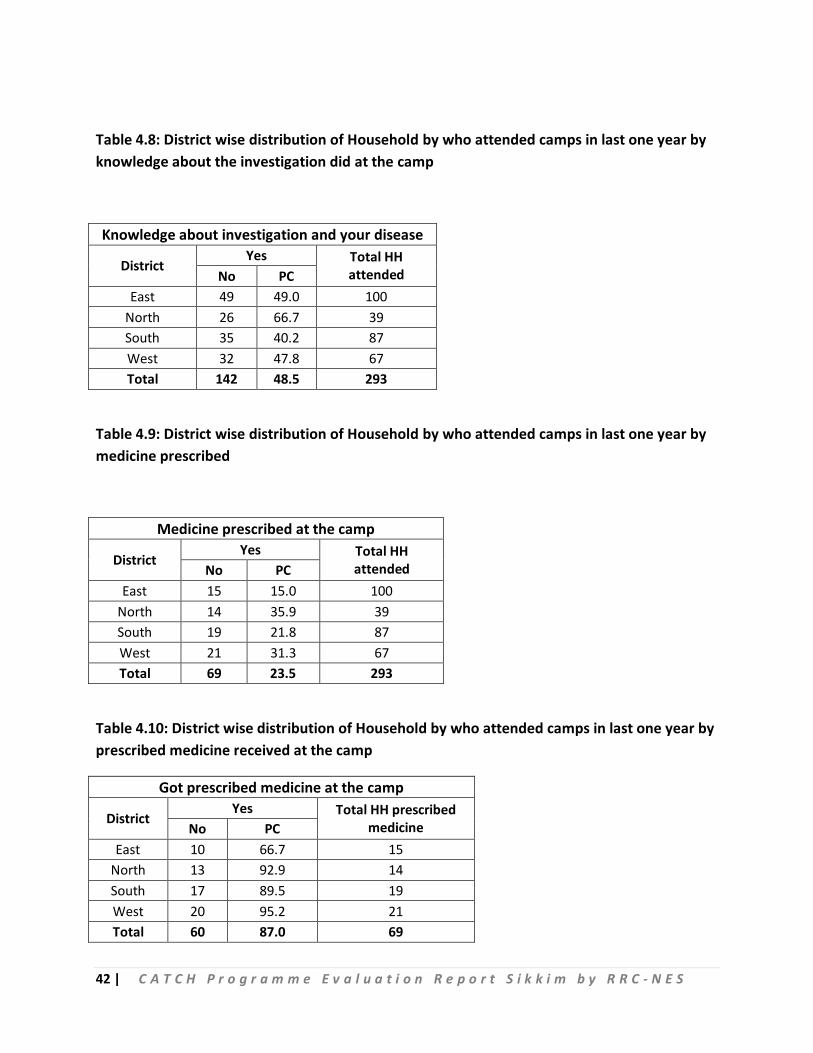
common peoples are also aware about the investigations done at the camp. Table 4.8 highlights
about the relationship between knowledge about the investigation and the name of disease
and from the table, it is seen that 48.5 pc of respondents have knowledge about investigation
done and the disease from which s/he is suffering from. North district respondents have the
highest knowledge with 66.7 pc and lowest is seen for South Sikkim respondents with 40.2 pc.
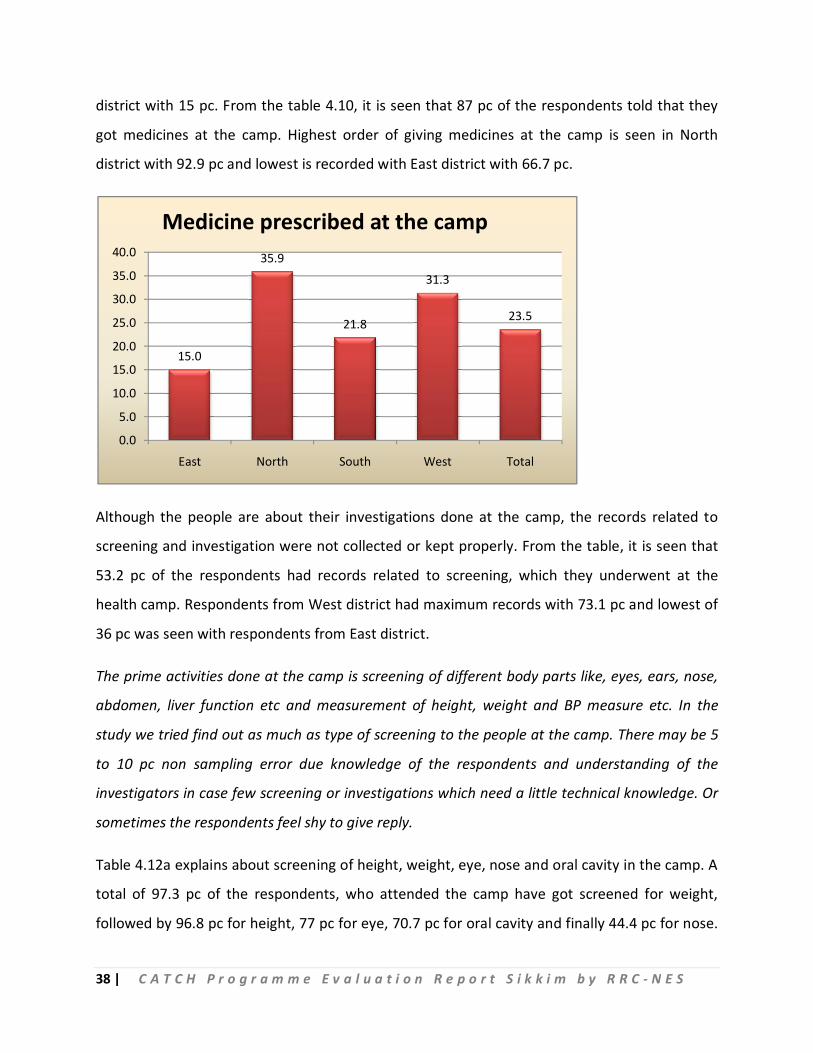
The qualitative study shows that there was shortage of medicines in the camp and the same
also reflected in the household survey. From the table 4.9, it is seen that 23.5 pc of the
respondents opined that medicines were prescribed at the camp. Highest trend of prescribing
medicines at the camp is seen with North district with 35.9 pc and lowest is seen with East
75%
21%
4%
Attended number of camps
1
2
3 & more
38 | C A T C H P r o g r a m m e E v a l u a t i o n R e p o r t S i k k i m b y R R C - N E S
district with 15 pc. From the table 4.10, it is seen that 87 pc of the respondents told that they
got medicines at the camp. Highest order of giving medicines at the camp is seen in North
district with 92.9 pc and lowest is recorded with East district with 66.7 pc.
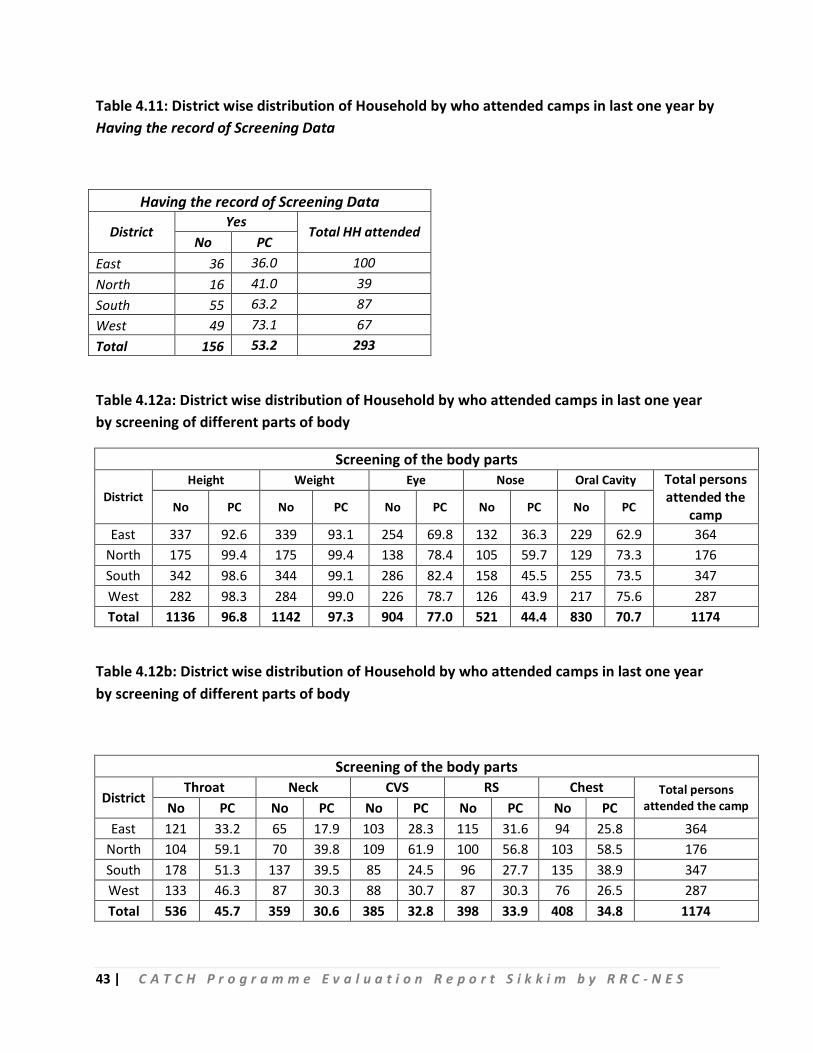
Although the people are about their investigations done at the camp, the records related to
screening and investigation were not collected or kept properly. From the table, it is seen that
53.2 pc of the respondents had records related to screening, which they underwent at the
health camp. Respondents from West district had maximum records with 73.1 pc and lowest of
36 pc was seen with respondents from East district.
The prime activities done at the camp is screening of different body parts like, eyes, ears, nose,
abdomen, liver function etc and measurement of height, weight and BP measure etc. In the
study we tried find out as much as type of screening to the people at the camp. There may be 5
to 10 pc non sampling error due knowledge of the respondents and understanding of the
investigators in case few screening or investigations which need a little technical knowledge. Or
sometimes the respondents feel shy to give reply.
Table 4.12a explains about screening of height, weight, eye, nose and oral cavity in the camp. A
total of 97.3 pc of the respondents, who attended the camp have got screened for weight,
followed by 96.8 pc for height, 77 pc for eye, 70.7 pc for oral cavity and finally 44.4 pc for nose.
15.0
35.9
21.8
31.3
23.5
0.0
5.0
10.0
15.0
20.0
25.0
30.0
35.0
40.0
East North South West Total
Medicine prescribed at the camp
39 | C A T C H P r o g r a m m e E v a l u a t i o n R e p o r t S i k k i m b y R R C - N E S
Highest numbers of eye checkup is seen in South Sikkim and oral cavity check up is seen for
West Sikkim with 75.6 pc.
Screening of different body parts – Throat, Neck, Cardio-Vascular System, Respiratory System
and Chest also analyzed in the survey. A total of 1174 persons attended the camp for screening,
out of which 45.7 pc had throat screening followed by 34.8 pc had chest screening, 33.9 pc had
respiratory screening, 32.8 pc had Cardio-Vascular System screening and lowest 30.6 pc had
neck screening. Among all the screening, it is seen that highest 61.9 pc respondents had cardiac
screening followed by throat with 59.1 pc and chest for 58.5 pc and respiratory system for 56.8
pc and lowest neck with 39.8 pc.
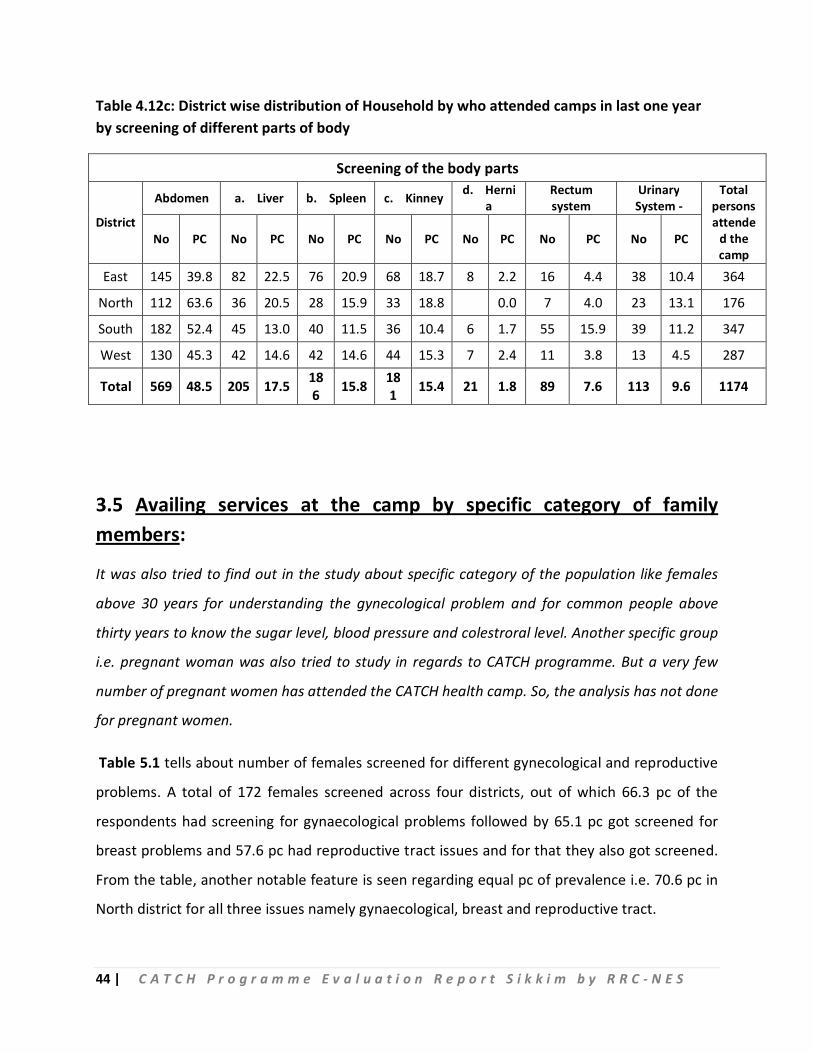
The study also tried to reveals about the status of screening of different body parts like –
Abdomen (Liver, Spleen, Kidney and Hernia), Rectum system and Urinary System. Out of 1174
total persons who attended the camp, 48.5 pc respondents had screening of abdomen followed
by examination of liver with 17.5 pc, examination of spleen with 15.8 pc, examination of kidney
with 15.4 pc, urinary system examination with 9.6 pc, examination of rectum system with 7.6 pc
and lastly examination of hernia with 1.8 pc.
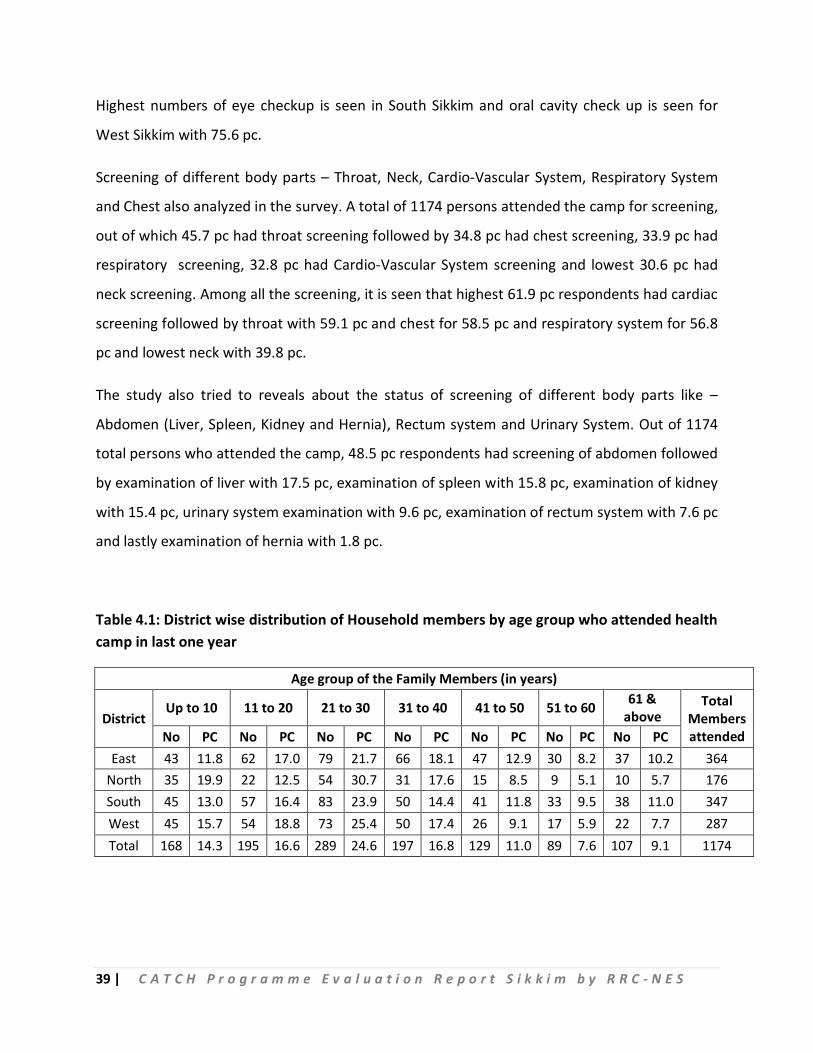
Table 4.1: District wise distribution of Household members by age group who attended health camp in last one year
Age group of the Family Members (in years)
District Up to 10 11 to 20 21 to 30 31 to 40 41 to 50 51 to 60 61 &
above Total
Members attended No PC No PC No PC No PC No PC No PC No PC
East 43 11.8 62 17.0 79 21.7 66 18.1 47 12.9 30 8.2 37 10.2 364 North 35 19.9 22 12.5 54 30.7 31 17.6 15 8.5 9 5.1 10 5.7 176 South 45 13.0 57 16.4 83 23.9 50 14.4 41 11.8 33 9.5 38 11.0 347 West 45 15.7 54 18.8 73 25.4 50 17.4 26 9.1 17 5.9 22 7.7 287 Total 168 14.3 195 16.6 289 24.6 197 16.8 129 11.0 89 7.6 107 9.1 1174
40 | C A T C H P r o g r a m m e E v a l u a t i o n R e p o r t S i k k i m b y R R C - N E S
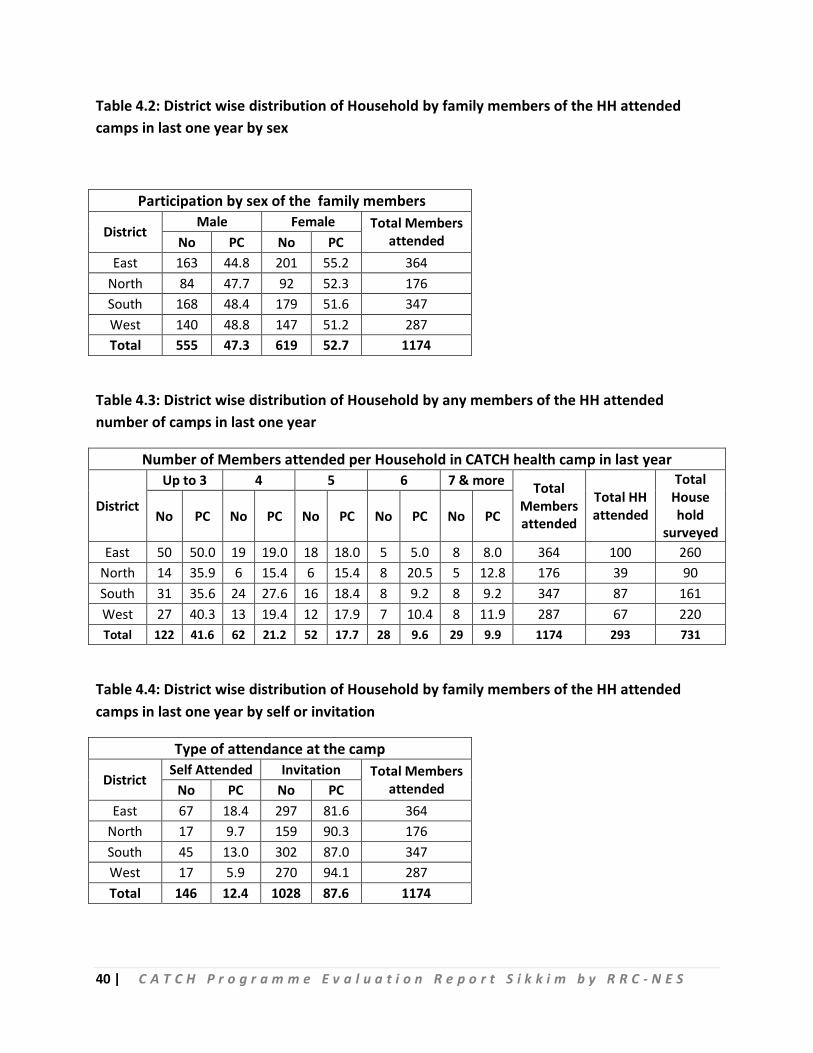
Table 4.2: District wise distribution of Household by family members of the HH attended camps in last one year by sex
Participation by sex of the family members
District Male Female Total Members
attended No PC No PC East 163 44.8 201 55.2 364
North 84 47.7 92 52.3 176 South 168 48.4 179 51.6 347 West 140 48.8 147 51.2 287 Total 555 47.3 619 52.7 1174
Table 4.3: District wise distribution of Household by any members of the HH attended number of camps in last one year
Number of Members attended per Household in CATCH health camp in last year
District
Up to 3 4 5 6 7 & more Total Members attended
Total HH attended
Total House hold
surveyed No PC No PC No PC No PC No PC
East 50 50.0 19 19.0 18 18.0 5 5.0 8 8.0 364 100 260 North 14 35.9 6 15.4 6 15.4 8 20.5 5 12.8 176 39 90 South 31 35.6 24 27.6 16 18.4 8 9.2 8 9.2 347 87 161 West 27 40.3 13 19.4 12 17.9 7 10.4 8 11.9 287 67 220 Total 122 41.6 62 21.2 52 17.7 28 9.6 29 9.9 1174 293 731
Table 4.4: District wise distribution of Household by family members of the HH attended camps in last one year by self or invitation
Type of attendance at the camp
District Self Attended Invitation Total Members
attended No PC No PC East 67 18.4 297 81.6 364
North 17 9.7 159 90.3 176 South 45 13.0 302 87.0 347 West 17 5.9 270 94.1 287 Total 146 12.4 1028 87.6 1174
41 | C A T C H P r o g r a m m e E v a l u a t i o n R e p o r t S i k k i m b y R R C - N E S
Table 4.5: District wise distribution of Household by family members of the HH attended number of camps in last one year
Attended number of camps
District 1 2 3 & more Total Members
attended No PC No PC No PC East 280 76.9 79 21.7 5 1.4 364
North 119 67.6 36 20.5 21 11.9 176 South 235 67.7 97 28.0 15 4.3 347 West 243 84.7 41 14.3 3 1.0 287 Total 877 74.7 253 21.6 44 3.7 1174
Table 4.6: District wise distribution of Household by family members of the HH attended camps in last one year by only for screening
Attended the camp only for screening
District Yes
Total Members attended No PC
East 352 96.7 364 North 172 97.7 176 South 329 94.8 347 West 272 94.8 287 Total 1125 95.8 1174
Table 4.7: District wise distribution of Household by family members of the HH attended camps in last one year by investigation did at the camp
Investigation done at the camp
District Yes Total Members
attended No PC East 352 96.7 364
North 161 91.5 176 South 330 95.1 347 West 269 93.7 287 Total 1112 94.7 1174
42 | C A T C H P r o g r a m m e E v a l u a t i o n R e p o r t S i k k i m b y R R C - N E S
Table 4.8: District wise distribution of Household by who attended camps in last one year by knowledge about the investigation did at the camp
Knowledge about investigation and your disease
District Yes Total HH
attended No PC East 49 49.0 100
North 26 66.7 39 South 35 40.2 87 West 32 47.8 67 Total 142 48.5 293
Table 4.9: District wise distribution of Household by who attended camps in last one year by medicine prescribed
Medicine prescribed at the camp
District Yes Total HH
attended No PC East 15 15.0 100
North 14 35.9 39 South 19 21.8 87 West 21 31.3 67 Total 69 23.5 293
Table 4.10: District wise distribution of Household by who attended camps in last one year by prescribed medicine received at the camp
Got prescribed medicine at the camp
District Yes Total HH prescribed
medicine No PC East 10 66.7 15
North 13 92.9 14 South 17 89.5 19 West 20 95.2 21 Total 60 87.0 69
43 | C A T C H P r o g r a m m e E v a l u a t i o n R e p o r t S i k k i m b y R R C - N E S
Table 4.11: District wise distribution of Household by who attended camps in last one year by Having the record of Screening Data
Having the record of Screening Data
District Yes
Total HH attended No PC
East 36 36.0 100 North 16 41.0 39 South 55 63.2 87 West 49 73.1 67 Total 156 53.2 293
Table 4.12a: District wise distribution of Household by who attended camps in last one year by screening of different parts of body
Screening of the body parts
District Height Weight Eye Nose Oral Cavity Total persons
attended the camp No PC No PC No PC No PC No PC
East 337 92.6 339 93.1 254 69.8 132 36.3 229 62.9 364 North 175 99.4 175 99.4 138 78.4 105 59.7 129 73.3 176 South 342 98.6 344 99.1 286 82.4 158 45.5 255 73.5 347 West 282 98.3 284 99.0 226 78.7 126 43.9 217 75.6 287 Total 1136 96.8 1142 97.3 904 77.0 521 44.4 830 70.7 1174
Table 4.12b: District wise distribution of Household by who attended camps in last one year by screening of different parts of body
Screening of the body parts
District Throat Neck CVS RS Chest Total persons
attended the camp No PC No PC No PC No PC No PC East 121 33.2 65 17.9 103 28.3 115 31.6 94 25.8 364
North 104 59.1 70 39.8 109 61.9 100 56.8 103 58.5 176 South 178 51.3 137 39.5 85 24.5 96 27.7 135 38.9 347 West 133 46.3 87 30.3 88 30.7 87 30.3 76 26.5 287 Total 536 45.7 359 30.6 385 32.8 398 33.9 408 34.8 1174
44 | C A T C H P r o g r a m m e E v a l u a t i o n R e p o r t S i k k i m b y R R C - N E S
Table 4.12c: District wise distribution of Household by who attended camps in last one year by screening of different parts of body
Screening of the body parts
District
Abdomen a. Liver b. Spleen c. Kinney d. Hernia
Rectum system
Urinary System -
Total persons attende
d the camp
No PC No PC No PC No PC No PC No PC No PC
East 145 39.8 82 22.5 76 20.9 68 18.7 8 2.2 16 4.4 38 10.4 364
North 112 63.6 36 20.5 28 15.9 33 18.8 0.0 7 4.0 23 13.1 176
South 182 52.4 45 13.0 40 11.5 36 10.4 6 1.7 55 15.9 39 11.2 347
West 130 45.3 42 14.6 42 14.6 44 15.3 7 2.4 11 3.8 13 4.5 287
Total 569 48.5 205 17.5 186 15.8 18
1 15.4 21 1.8 89 7.6 113 9.6 1174
3.5 Availing services at the camp by specific category of family members:
It was also tried to find out in the study about specific category of the population like females
above 30 years for understanding the gynecological problem and for common people above
thirty years to know the sugar level, blood pressure and colestroral level. Another specific group
i.e. pregnant woman was also tried to study in regards to CATCH programme. But a very few
number of pregnant women has attended the CATCH health camp. So, the analysis has not done
for pregnant women.
Table 5.1 tells about number of females screened for different gynecological and reproductive
problems. A total of 172 females screened across four districts, out of which 66.3 pc of the
respondents had screening for gynaecological problems followed by 65.1 pc got screened for
breast problems and 57.6 pc had reproductive tract issues and for that they also got screened.
From the table, another notable feature is seen regarding equal pc of prevalence i.e. 70.6 pc in
North district for all three issues namely gynaecological, breast and reproductive tract.
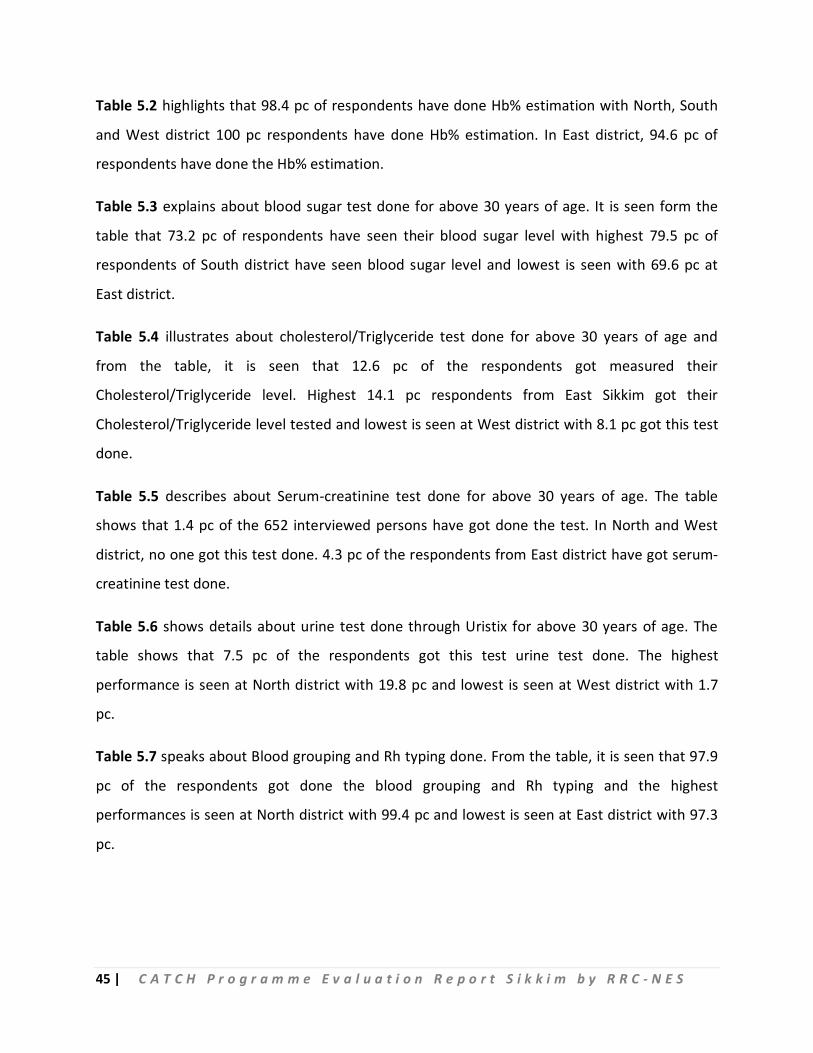
45 | C A T C H P r o g r a m m e E v a l u a t i o n R e p o r t S i k k i m b y R R C - N E S
Table 5.2 highlights that 98.4 pc of respondents have done Hb% estimation with North, South
and West district 100 pc respondents have done Hb% estimation. In East district, 94.6 pc of
respondents have done the Hb% estimation.
Table 5.3 explains about blood sugar test done for above 30 years of age. It is seen form the
table that 73.2 pc of respondents have seen their blood sugar level with highest 79.5 pc of
respondents of South district have seen blood sugar level and lowest is seen with 69.6 pc at
East district.
Table 5.4 illustrates about cholesterol/Triglyceride test done for above 30 years of age and
from the table, it is seen that 12.6 pc of the respondents got measured their
Cholesterol/Triglyceride level. Highest 14.1 pc respondents from East Sikkim got their
Cholesterol/Triglyceride level tested and lowest is seen at West district with 8.1 pc got this test
done.
Table 5.5 describes about Serum-creatinine test done for above 30 years of age. The table
shows that 1.4 pc of the 652 interviewed persons have got done the test. In North and West
district, no one got this test done. 4.3 pc of the respondents from East district have got serum-
creatinine test done.
Table 5.6 shows details about urine test done through Uristix for above 30 years of age. The
table shows that 7.5 pc of the respondents got this test urine test done. The highest
performance is seen at North district with 19.8 pc and lowest is seen at West district with 1.7
pc.
Table 5.7 speaks about Blood grouping and Rh typing done. From the table, it is seen that 97.9
pc of the respondents got done the blood grouping and Rh typing and the highest
performances is seen at North district with 99.4 pc and lowest is seen at East district with 97.3
pc.
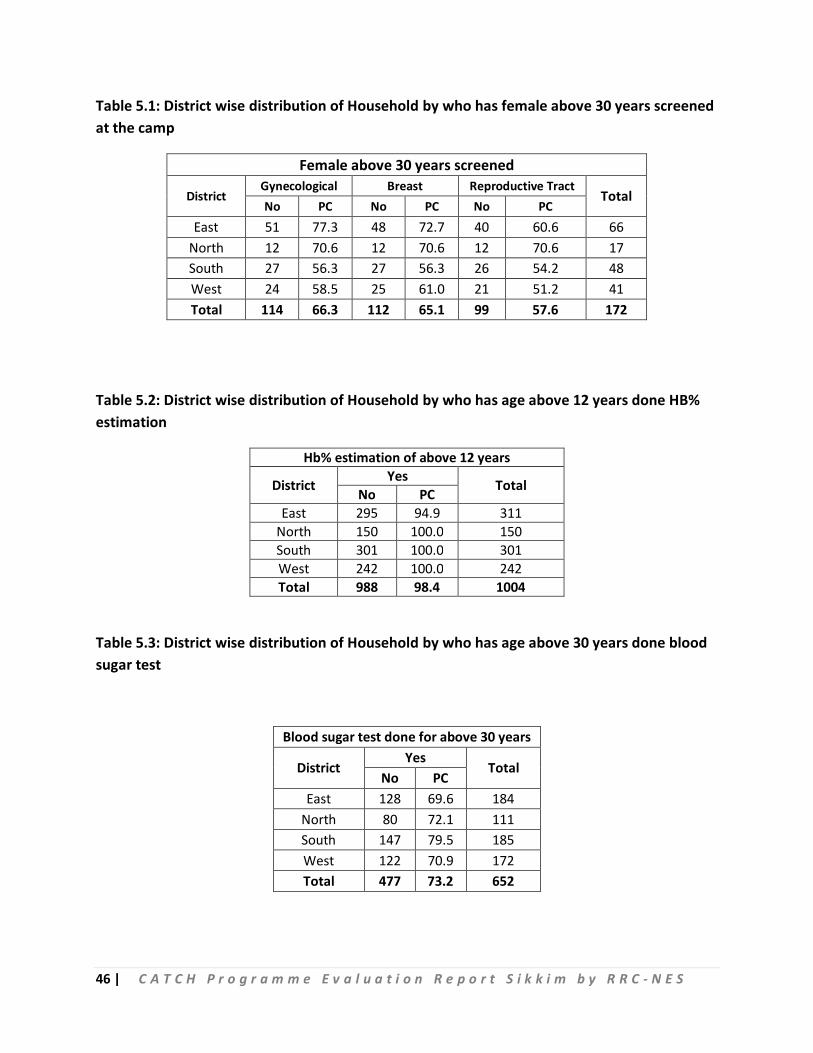
46 | C A T C H P r o g r a m m e E v a l u a t i o n R e p o r t S i k k i m b y R R C - N E S
Table 5.1: District wise distribution of Household by who has female above 30 years screened at the camp
Female above 30 years screened
District Gynecological Breast Reproductive Tract
Total No PC No PC No PC
East 51 77.3 48 72.7 40 60.6 66 North 12 70.6 12 70.6 12 70.6 17 South 27 56.3 27 56.3 26 54.2 48 West 24 58.5 25 61.0 21 51.2 41 Total 114 66.3 112 65.1 99 57.6 172
Table 5.2: District wise distribution of Household by who has age above 12 years done HB% estimation
Hb% estimation of above 12 years
District Yes Total No PC East 295 94.9 311
North 150 100.0 150 South 301 100.0 301 West 242 100.0 242 Total 988 98.4 1004
Table 5.3: District wise distribution of Household by who has age above 30 years done blood sugar test
Blood sugar test done for above 30 years
District Yes
Total No PC
East 128 69.6 184 North 80 72.1 111 South 147 79.5 185 West 122 70.9 172 Total 477 73.2 652
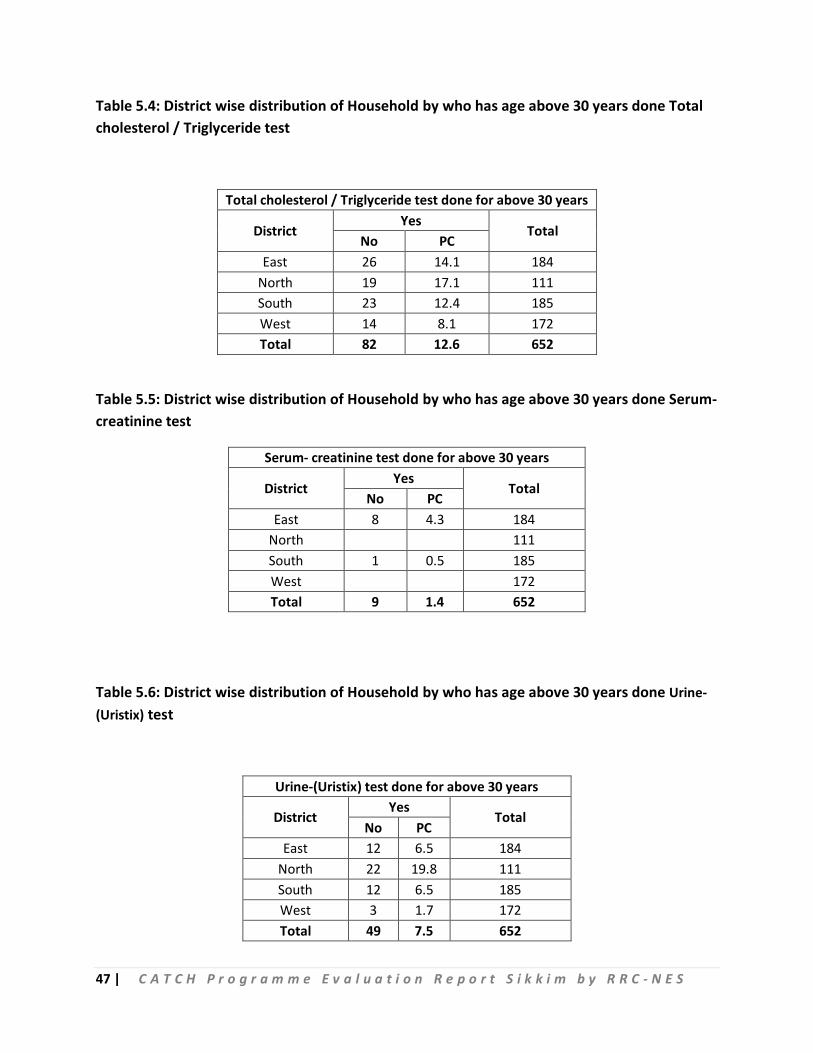
47 | C A T C H P r o g r a m m e E v a l u a t i o n R e p o r t S i k k i m b y R R C - N E S
Table 5.4: District wise distribution of Household by who has age above 30 years done Total cholesterol / Triglyceride test
Total cholesterol / Triglyceride test done for above 30 years
District Yes
Total No PC
East 26 14.1 184 North 19 17.1 111 South 23 12.4 185 West 14 8.1 172 Total 82 12.6 652
Table 5.5: District wise distribution of Household by who has age above 30 years done Serum- creatinine test
Serum- creatinine test done for above 30 years
District Yes
Total No PC
East 8 4.3 184 North 111 South 1 0.5 185 West 172 Total 9 1.4 652
Table 5.6: District wise distribution of Household by who has age above 30 years done Urine-(Uristix) test
Urine-(Uristix) test done for above 30 years
District Yes
Total No PC
East 12 6.5 184 North 22 19.8 111 South 12 6.5 185 West 3 1.7 172 Total 49 7.5 652
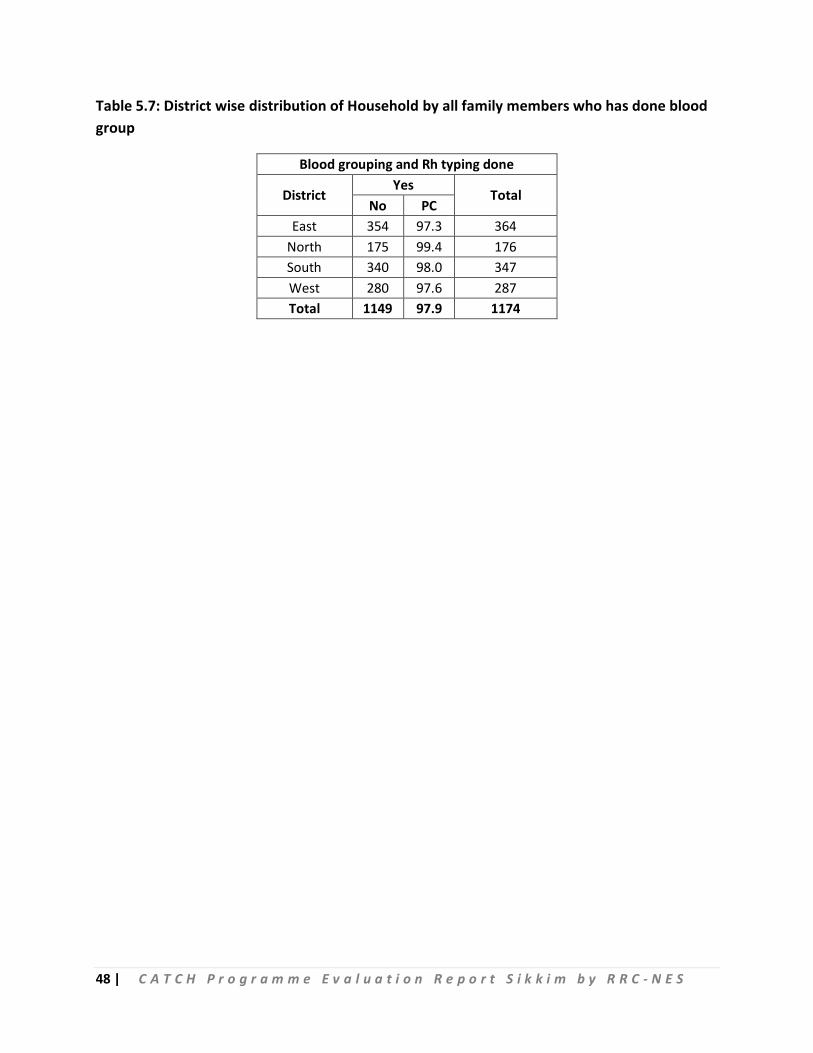
48 | C A T C H P r o g r a m m e E v a l u a t i o n R e p o r t S i k k i m b y R R C - N E S
Table 5.7: District wise distribution of Household by all family members who has done blood group
Blood grouping and Rh typing done
District Yes
Total No PC
East 354 97.3 364 North 175 99.4 176 South 340 98.0 347 West 280 97.6 287 Total 1149 97.9 1174
49 | C A T C H P r o g r a m m e E v a l u a t i o n R e p o r t S i k k i m b y R R C - N E S
Chapter IV
Service providers view & role about CATCH programme
4.1 MOs view & role about CATCH programme
The study also tried to find out the few points from MOs in regards planning to implement the CATCH programme. It was discussed with 21 MOs of all four districts.
From the discussions with the MO, it was found that the role of MO was differ from place to place; some where they are working as only administrator or implementer and somewhere administrator, planner and implementer also. It was also found that the micro plan to organize a health camp was available at all facilities. The site of the camp was selected by all the members of the team including ASHA and PRI members.
It was quite interesting to know that the number of camps attended by the MOs were in the range of 5 to 100. Out of 21 MOs approx 10 MOs attended more than 50 camps.
A family folder is kept for each family and also the data entered at the software by DEO against the health card.
Service provider at the camps are from regular service holder of the facility, so the staffs of the facility in general divide in teams and one team serves at the facility and the other at the camp.
Most common diseases were found – diabetics, Hypertension, dental carries, depression, diarrhea, refractive error and anemia etc.
Common lab test like Grouping, Hb estimation, RBS were done at the all camps where in few camps (organized at the facility) Lipid profile, CBC, LFI, LFT were also done. VIA test was also available in the most of the camps.
In most of the places there were not have the diagnostic facilities and in that case they referred to the higher facilities if the patients required any investigations.
Medicines & consumables were supplied to the camp but it is not sufficient in most of the camps. In few camps the shortage was nearly 60 to 70 pc for diabetics, hypertensive and gastritis cases.
Regarding financial obligation, MO itself or with BPM holds the budget. The amount required to hold the camp has reached before the camps organized in most of the places.
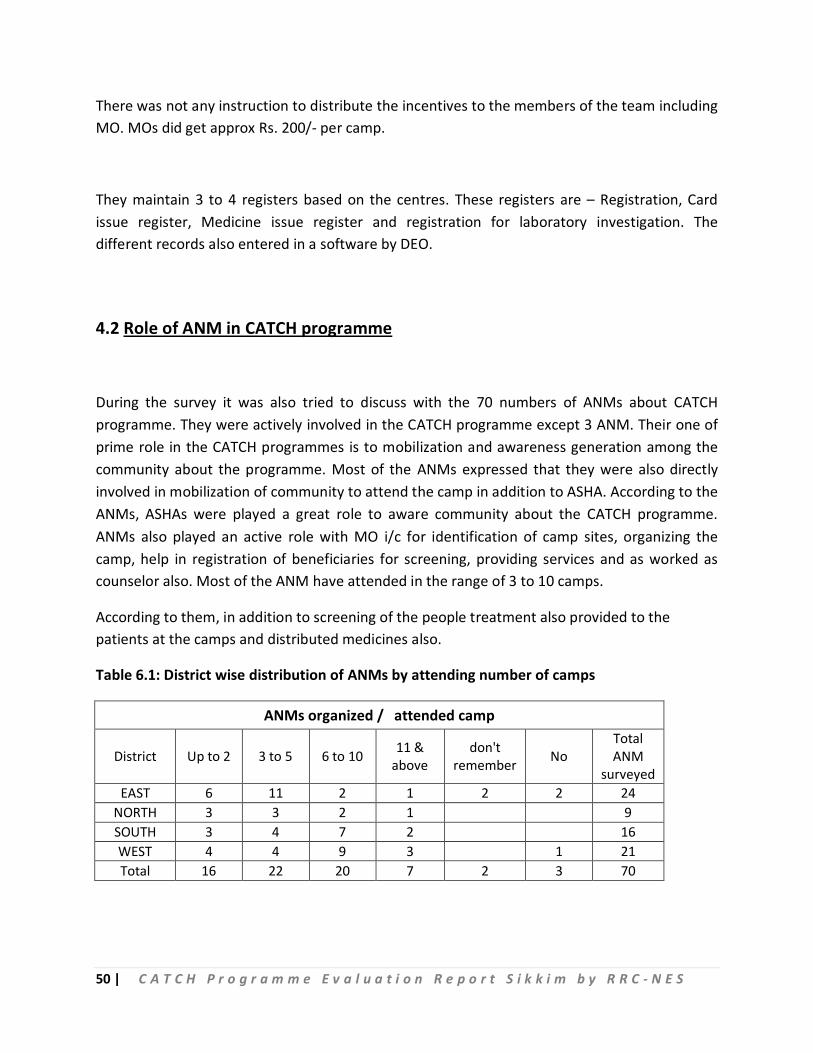
50 | C A T C H P r o g r a m m e E v a l u a t i o n R e p o r t S i k k i m b y R R C - N E S
There was not any instruction to distribute the incentives to the members of the team including MO. MOs did get approx Rs. 200/- per camp.
They maintain 3 to 4 registers based on the centres. These registers are – Registration, Card issue register, Medicine issue register and registration for laboratory investigation. The different records also entered in a software by DEO.
4.2 Role of ANM in CATCH programme
During the survey it was also tried to discuss with the 70 numbers of ANMs about CATCH programme. They were actively involved in the CATCH programme except 3 ANM. Their one of prime role in the CATCH programmes is to mobilization and awareness generation among the community about the programme. Most of the ANMs expressed that they were also directly involved in mobilization of community to attend the camp in addition to ASHA. According to the ANMs, ASHAs were played a great role to aware community about the CATCH programme. ANMs also played an active role with MO i/c for identification of camp sites, organizing the camp, help in registration of beneficiaries for screening, providing services and as worked as counselor also. Most of the ANM have attended in the range of 3 to 10 camps.
According to them, in addition to screening of the people treatment also provided to the patients at the camps and distributed medicines also.
Table 6.1: District wise distribution of ANMs by attending number of camps
ANMs organized / attended camp
District Up to 2 3 to 5 6 to 10 11 & above
don't remember No
Total ANM
surveyed EAST 6 11 2 1 2 2 24
NORTH 3 3 2 1 9 SOUTH 3 4 7 2 16 WEST 4 4 9 3 1 21 Total 16 22 20 7 2 3 70
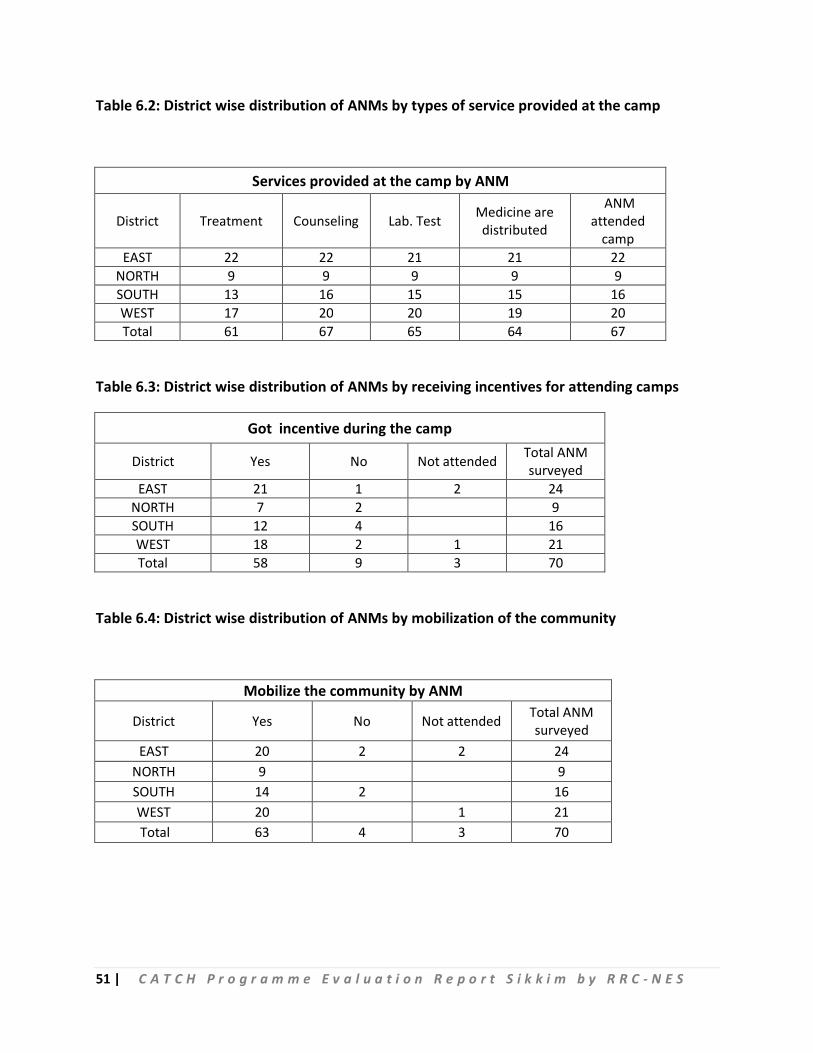
51 | C A T C H P r o g r a m m e E v a l u a t i o n R e p o r t S i k k i m b y R R C - N E S
Table 6.2: District wise distribution of ANMs by types of service provided at the camp
Services provided at the camp by ANM
District Treatment Counseling Lab. Test Medicine are distributed
ANM attended
camp EAST 22 22 21 21 22
NORTH 9 9 9 9 9 SOUTH 13 16 15 15 16 WEST 17 20 20 19 20 Total 61 67 65 64 67
Table 6.3: District wise distribution of ANMs by receiving incentives for attending camps
Got incentive during the camp
District Yes No Not attended Total ANM surveyed
EAST 21 1 2 24 NORTH 7 2 9 SOUTH 12 4 16 WEST 18 2 1 21 Total 58 9 3 70
Table 6.4: District wise distribution of ANMs by mobilization of the community
Mobilize the community by ANM
District Yes No Not attended Total ANM surveyed
EAST 20 2 2 24 NORTH 9 9 SOUTH 14 2 16 WEST 20 1 21 Total 63 4 3 70
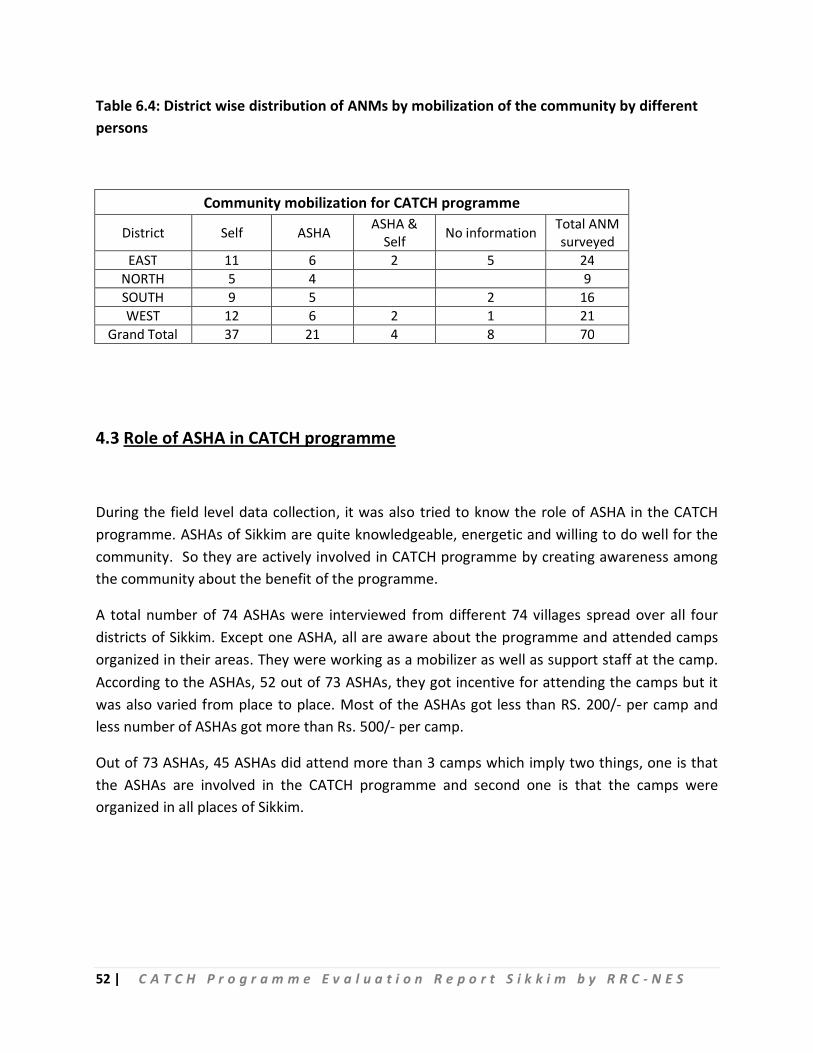
52 | C A T C H P r o g r a m m e E v a l u a t i o n R e p o r t S i k k i m b y R R C - N E S
Table 6.4: District wise distribution of ANMs by mobilization of the community by different persons
Community mobilization for CATCH programme
District Self ASHA ASHA & Self No information Total ANM
surveyed EAST 11 6 2 5 24
NORTH 5 4 9 SOUTH 9 5 2 16 WEST 12 6 2 1 21
Grand Total 37 21 4 8 70
4.3 Role of ASHA in CATCH programme
During the field level data collection, it was also tried to know the role of ASHA in the CATCH programme. ASHAs of Sikkim are quite knowledgeable, energetic and willing to do well for the community. So they are actively involved in CATCH programme by creating awareness among the community about the benefit of the programme.
A total number of 74 ASHAs were interviewed from different 74 villages spread over all four districts of Sikkim. Except one ASHA, all are aware about the programme and attended camps organized in their areas. They were working as a mobilizer as well as support staff at the camp. According to the ASHAs, 52 out of 73 ASHAs, they got incentive for attending the camps but it was also varied from place to place. Most of the ASHAs got less than RS. 200/- per camp and less number of ASHAs got more than Rs. 500/- per camp.
Out of 73 ASHAs, 45 ASHAs did attend more than 3 camps which imply two things, one is that the ASHAs are involved in the CATCH programme and second one is that the camps were organized in all places of Sikkim.
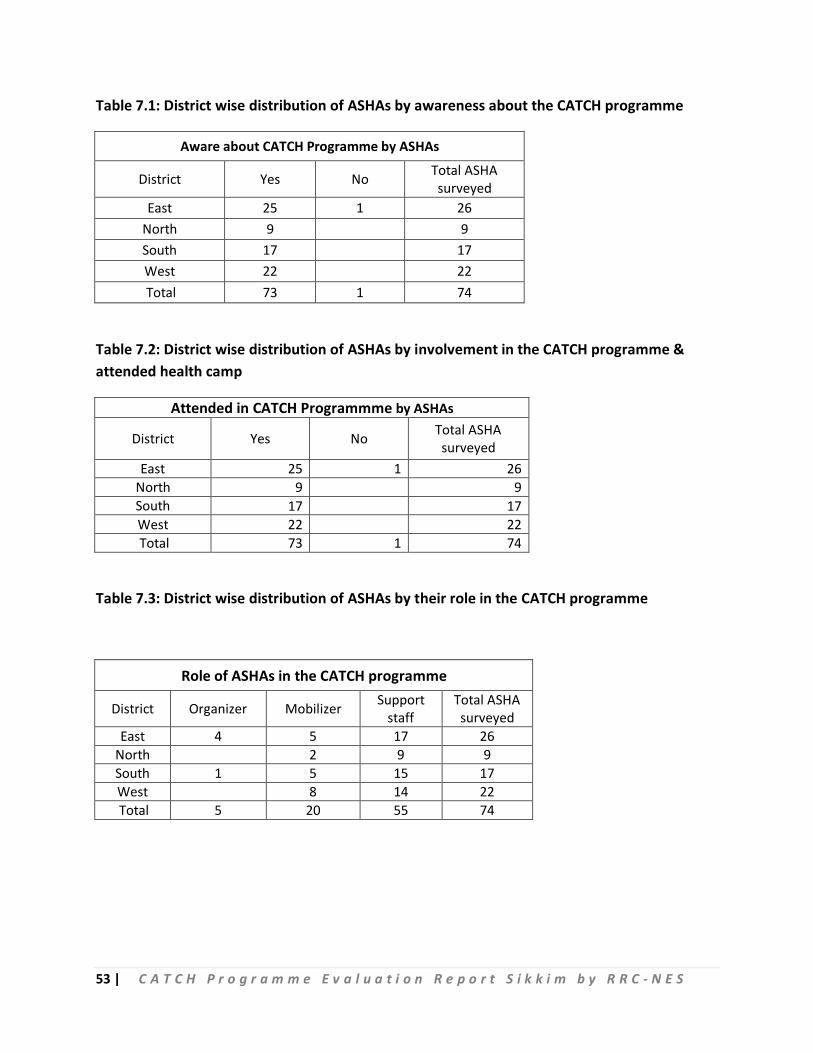
53 | C A T C H P r o g r a m m e E v a l u a t i o n R e p o r t S i k k i m b y R R C - N E S
Table 7.1: District wise distribution of ASHAs by awareness about the CATCH programme
Aware about CATCH Programme by ASHAs
District Yes No Total ASHA surveyed
East 25 1 26 North 9 9 South 17 17 West 22 22 Total 73 1 74
Table 7.2: District wise distribution of ASHAs by involvement in the CATCH programme & attended health camp
Attended in CATCH Programmme by ASHAs
District Yes No Total ASHA surveyed
East 25 1 26 North 9 9 South 17 17 West 22 22 Total 73 1 74
Table 7.3: District wise distribution of ASHAs by their role in the CATCH programme
Role of ASHAs in the CATCH programme
District Organizer Mobilizer Support staff
Total ASHA surveyed
East 4 5 17 26 North 2 9 9 South 1 5 15 17 West 8 14 22 Total 5 20 55 74
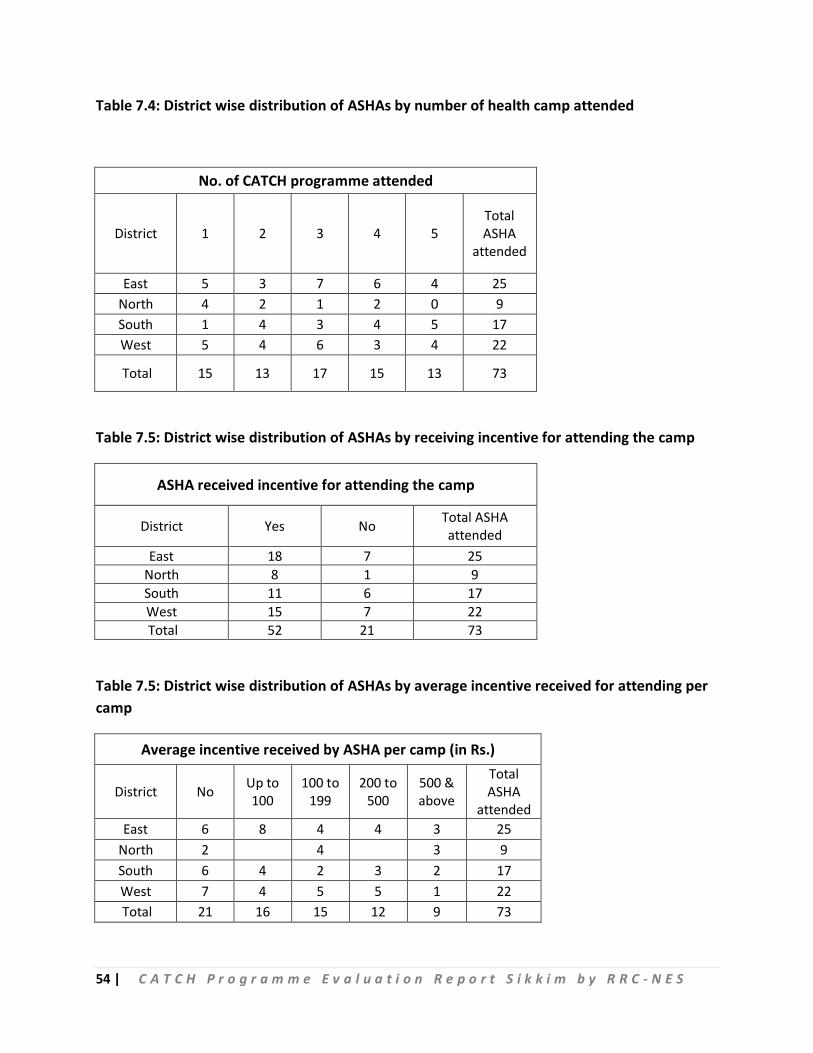
54 | C A T C H P r o g r a m m e E v a l u a t i o n R e p o r t S i k k i m b y R R C - N E S
Table 7.4: District wise distribution of ASHAs by number of health camp attended
No. of CATCH programme attended
District 1 2 3 4 5 Total ASHA
attended
East 5 3 7 6 4 25 North 4 2 1 2 0 9 South 1 4 3 4 5 17 West 5 4 6 3 4 22
Total 15 13 17 15 13 73
Table 7.5: District wise distribution of ASHAs by receiving incentive for attending the camp
ASHA received incentive for attending the camp
District Yes No Total ASHA attended
East 18 7 25 North 8 1 9 South 11 6 17 West 15 7 22 Total 52 21 73
Table 7.5: District wise distribution of ASHAs by average incentive received for attending per camp
Average incentive received by ASHA per camp (in Rs.)
District No Up to 100
100 to 199
200 to 500
500 & above
Total ASHA
attended East 6 8 4 4 3 25
North 2 4 3 9 South 6 4 2 3 2 17 West 7 4 5 5 1 22 Total 21 16 15 12 9 73
55 | C A T C H P r o g r a m m e E v a l u a t i o n R e p o r t S i k k i m b y R R C - N E S
Chapter V Stakeholder view:
A Secretarial level consultation was done on the CATCH programme implementation,
constraints, strategies to improve the programme, technical support needed from
external agencies and also financial support from Govt. of India etc. Other officers view
was also taken during the consultation. These are in a nutshell as below:
1. Secretary of Health & Family Welfare, Govt. of Sikkim:
One of the main constraints in the CATCH programme is shortage of Doctors; the
doctors have to spare for the CATCH programme from the regular duty at the
hospital. Second constraint is absence of follow up mechanism for the identified
patient and referral system. One of the major problems to run the programme is
maintenance of equipment and purchase of new equipment. Another constraint is to
distribute the Smart Health Card as well as updating of the card in next visit at the
facility.
Minimize the HR gap and purchase of new equipment e.g. Auto analyzer is one of the
key strategies in coming days to provide extensive service with diagnostic facilities to
the people. Also area specific intervention would be taken for cancer patients
specifically Oral / Breast cancer through mobile cancer detection team. Using
Mammography in all four districts of Sikkim is to early identification of Breast cancer.
The technical support need to the state in terms of developing data analysis tool for
programme review and is used for proper planning to better outcome. Logical frame
work needs to be developed to follow up of the identified patients.
Also state budget is not sufficient to implement the objectives of the CATCH
programme.
56 | C A T C H P r o g r a m m e E v a l u a t i o n R e p o r t S i k k i m b y R R C - N E S
2. Director of Health services, Govt. of Sikkim:
Views on constraints of the implementation of CATCH programme are almost same
for all stake holder but strategies are found little bit different from officers to
officers, so we tried to more focus on highlighting different strategies for future of
the programmeby different officers.
One of the key strategies is to build p referral system which is missing at present.
Another strategy is to develop follow up and feedback system to the patients after
screening and diagnostic test completed at the camp. Develop linkage between TB
patients and support mechanism under CATCH programme is another one future
plan of action. But to develop the effective linkange between TB patient in the
CATCH programme, the state needs technical support from outside technical
agencies.
To scale up the programme, 95 % people will be covered in all four districts including
urban areas. And the budget required till date to run the programme approximately
1 Cr per year but is not sufficient, so the state need help from the govt. of India to
scale up the programme.
3. Mission director, NHM, Govt of Sikkim :
In addition to the above mentioned point, screening should be more community
approach, if need house to house screening needs to be done.
4. Procurement Expert:
With a maximum ceiling of Rs. 10 lakh, medicines & consumables for the CATCH programme has procured approx value of Rs 5 to 7 Lakh per year through Central Health Store Organization (CHSO). The drugs & consumables are supplied through Central Medical Store (CMS), it supplies from CMS to District and from District to PHC. Programme officer i/c monitors the supply of drugs and consumables where district needs to be submit indent. District Nodal officers also monitor the availability of the drugs. It is also felt that the purchased drugs and consumables are not sufficient at the camps, more budget require to mitigate the shortage of drugs & consumables.
57 | C A T C H P r o g r a m m e E v a l u a t i o n R e p o r t S i k k i m b y R R C - N E S
Conclusion:
1. The CATCH programme has covered every nook & corner of the Sikkim with lesser coverage in Gangtok. All people are aware about CATCH programme and avail the services provided at the camp.
2. Nearly 40 pc of the first camps was organized at the hospital premises. More number of
camps organizing at the village level may be convenient to community and it will
increase the participation of community.
3. Mobile Medical Unit Van utilized at the Health Camp. Widely using MMU vehicle under
CATCH progrrame may loss the purpose of set up of MMU.
4. The existing health staff posted at the PHC is enrolled in the camp activities. The MO of
the PHC is the focal person for the health camps and s/he is assisted by the LT, DEO and
other support staff.
5. Beneficiaries coming to the CATCH camps do not have to bear the registration or the
counseling or basic diagnostics expenditure. Medications are also provided for general
ailments.
Suggestions:
1. There is no structured Monitoring mechanism for the CATCH programme. State is under
the process of identifying feasible indicators for monitoring.
2. Community mobilization is done by the respective GP representative and ASHA of the
concerned village in the form of IPC. ASHAs have played a great role in the awareness
generation and mobilization of the community.
3. Health Card needs to be issued to all beneficiaries & patients and also timely updating of
the card during referred and follow up cases.
4. Payment mechanism of ASHAs for mobilizing the community and attending the camps
are differ from camp to camp and it needs to be uniform or case based.
5. Few dedicated staff need to be deployed for CATCH progrrame and they can provide
services at different camps. It may helps on functioning of PHCs without any hinder.
58 | C A T C H P r o g r a m m e E v a l u a t i o n R e p o r t S i k k i m b y R R C - N E S
6. State / Central budget need to be increased to provide all care to the community by
health care service, diagnostics, medicines and referred for the better treatment of
this noble initiative taken by the State Government.
7. The 1st phase of the CATCH programme is mainly on screening of the beneficiaries to
identify the health issues of the individual and community as such. Referral and follow
up mechanism need to be developed urgently for the identified cases. Proper
treatment will benefit the community in large extent in addition to screening.
xxxxxxxxxxxxxxxxxxxxxxxxxxxxxxxxxxx--------xxxxxxxxxxxxxxxxxxxxxxxxxxxxxxxxxxxxxx