Embed Size (px)
Citation preview

4 Int. J. Technology Management, Vol. 70, No. 1, 2016
Copyright © 2016 Inderscience Enterprises Ltd.
An evaluation and enhancement approach of the carbon footprints-based environmentally sustainable service competitiveness for coffee shops
Tzu-An Chiang* Department of Business Administration, National Taipei College of Business, 321 Jinan Road, Section 1, Taipei, 100, Taiwan E-mail: [email protected] *Corresponding author
Shen-Tsu Wang Department of Commerce Automation and Management, National Pingtung Institute of Commerce, 51 Min Sheng E. Road, Pingtung, 900, Taiwan E-mail:[email protected]
Abstract: This paper develops an evaluation and enhancement approach of the carbon footprints (CFs) based environmentally sustainable service competitiveness for coffees shops. Firstly, the proposed approach uses the service blueprint to analyse the service process of coffee shops and the working times of the required direct facilities and the supporting facilities to estimate the amounts of greenhouse gas (GHG) emissions. By using data envelopment analysis, the holistic performance evaluation model of environmentally sustainable service operation for coffee shops is created to find the non-benchmark environmentally sustainable service coffee shops. To improve environmentally sustainable service performance of the non-benchmark coffee shops, this paper evaluates the environmentally sustainable performance evaluation models of the meal-ordering and cooking areas and dining areas. Finally, this research gives an in depth analysis to comprehend the decreasing amount of the CF of each facility in the non-benchmark environmentally sustainable service areas.
Keywords: carbon footprints; CFs; evaluation and enhancement approach; environmentally sustainable service competitiveness; service blueprint; data envelopment analysis; coffee shops.
Reference to this paper should be made as follows: Chiang, T-A. and Wang, S-T. (2016) ‘An evaluation and enhancement approach of the carbon footprints-based environmentally sustainable service competitiveness for coffee shops’, Int. J. Technology Management, Vol. 70, No. 1, pp.4–24.
Biographical notes: Tzu-An Chiang is an Associate Professor in the Department of Business Administration at National Taipei College of Business, Taiwan. He received his Doctoral degree in the Industrial Engineering and

An evaluation and enhancement approach 5
Engineering Management from National Tsing Hua University in Taiwan. His research focuses on new product development and management, supply chain management, environmental impact assessment and data mining.
Shen-Tsu Wang received his MS from the Department of Industrial Engineering and Management, National Yunlin University of Science and Technology, Taiwan in 2002. He received his PhD from the Department of Industrial Engineering and Engineering Management, National Tsing Hua University, Taiwan in 2008. He is currently an Assistant Professor at the Department of Commerce Automation and Management, National Pingtung Institute of Commerce, Taiwan. His areas of interest include decision analysis and supply chain management.
1 Introduction
In recent years, numerous human activities have caused environmental degradation and severe climate change. Therefore, many countries begin to promote the concept of green consumption and specific policies to fix human over-consumption and poor manufacturing efficiency, as well as to reduce the usage of nature resources and environmental damage. Since the eco-service issue has attracted worldwide attention, how to improve environmentally sustainable service in many countries has become a hot spotlight. Therefore, some studies have discussed and studied environmentally sustainable service performance evaluation. From a customer satisfaction perspective, Olaru et al. (2010) employed a questionnaire-based method on small and medium-sized enterprises (SMEs) in Romania to understand the status of the environmentally sustainable performance evaluation. The study showed that 43% of SMEs monitored the impact of processes on environment. Wang et al. (2011) used quality function development (QFD) method to evaluate new service performance to understand whether the new service process meets the customer requirements. Zhokhova (2013) took the price, quality, safety and ecology of service as the evaluation indices of eco-tourism service competitiveness. The customers gave the score of each evaluation index and then the weights of the indices were used to obtain the performance of the final eco-tourism service competitiveness. Sellitto et al. (2011) utilised the analytic hierarchy process (AHP) to synthesise the six experts’ opinions to assess environmentally sustainable service performance for the transportation and warehousing service. Teng et al. (2012) performed the semi-structured interviews to identify and prioritise the energy conservation and carbon reduction (ECCR) indicators for the hotel industry in Taiwan. The hotel operators can improve their environmental performance competitiveness by initiating ECCR practices based on the proposed ECCR indicators. Oreja-Rodríguez and Armas-Cruz (2012) applied the Rasch model to analyse the questionnaires of interviewing the hotel’s environmental managers to evaluate the environmentally sustainable service performance of the Western Canary Islands’ hotel sector. Because the above works are based on experts’ subjective judgment or customers’ feelings, the different experts or customers may produce different environmentally sustainable service performance. To solve the above-mentioned problem, some studies directly use the quantitative environmental impact values to assess the environmental sustainable service competitiveness. Watanabe et al. (2012) utilised the integration definition for function

6 T-A. Chiang and S-T. Wang
modelling (IDEF 0) to describe the service process and then to evaluate the environmental load for each service activity. Because the emission of CO2 is accelerating to significantly increase the atmospheric concentration of CO2 to cause global warming, carbon footprints (CFs) have become an important index of environmentally sustainable service competitiveness. Hertwich and Peters (2009) studied the carbon emissions of 73 countries and 14 regions. They found that the service industry in these countries has the higher CFs. Such a phenomenon also occurs in Taiwan. Until 2011, the carbon emission of the service industry had risen to 13.6%. Because the service industry produces a great influence on the greenhouse effect, how to effectively reduce the CF of the service industry has become a crucial issue. Hu et al. (2012) investigated the carbon emissions of self-service laundries and took CFs as the evaluation index of environmentally sustainable service performance. They found that the environmentally sustainable service performance of self-service laundries is better than that of the traditional laundry practice. Liqin (2011) also used the CFs to evaluate environmentally sustainable service performance of the high-star hotels. That study showed the highest CF for the hotels is 5.56 times as the lowest CF and then gave the subjective improvement suggestions. Martínez and Silveira (2012) employed the data envelopment analysis (DEA) to analyse energy use, energy efficiency and CO2 emissions in Swedish service industry to assess the energy efficiency-based sustainable service performance for 19 sub-service sectors. That research’s result showed that Swedish services industries had increased energy consumption and CO2 emissions in the period 1993–2008. However, this model is appropriate for the sector-level sustainable service performance evaluation. Hui and Wong (2010) investigated the energy consumption of the hotels in Hong Kong and set three grades for energy consumption to evaluate environmentally sustainable service performance and gave the practical guidelines to reduce the carbon emissions for guest rooms of the business hotels. In that work, the proposed evaluation model directly transfers the energy consumption per unit area to the energy efficient rating. Hence, the hotel managers cannot obtain an accurate environmentally sustainable service performance values. In addition, that model cannot is utilised to analyse which service facility can be improved to reduce the CFs. At the same time, that model cannot consider the output variables, for example, the order number. However, the order number is an important factor to affect the amount of the carbon emission. Moreover, that model cannot simultaneously compare several hotels to assess the relative environmentally sustainable service competitiveness.
Through the above literature review, we can understand that few studies focus on environmentally sustainable service performance assessment for coffee shops. However, the coffee shop managers need a scientific analytical method to analyse the carbon emissions and objectively assess the environmentally sustainable service performance and provide the managers with concrete improvement suggestions to boost the environmentally sustainable service competitiveness. Therefore, this study proposed an evaluation and enhancement approach of the CF-based environmentally sustainable service competitiveness. First, a service blueprint is employed to analyse the service process, in order to understand the use of facilities required for each activity and the carbon emissions generated by each facility. Afterwards, using a holistic evaluation model of environmentally sustainable service operations, this study identified the non-benchmark environmentally sustainable service coffee shops. In order to help enterprises identify the reasons for poor performance, this study develops the environmentally sustainable performance evaluation models of the meal-ordering and

An evaluation and enhancement approach 7
cooking areas and the dining areas to evaluate the environmentally sustainable performance of the two service areas. In addition, through the profound analysis, this research acquires that the quantity of the CF of each facility in the different service areas should be reduced. These objective and specific improvement directions and suggestions can help coffee shop managers understand how to strengthen the performance of the non-benchmark environmentally sustainable service coffee shops so as to significantly promote eco-service competitiveness of these coffee shops.
The remainder of this paper is organised as follows: Section 2 is the literature review. Section 3 elaborates on the evaluation and enhancement approach of the CFs-based environmentally sustainable service competitiveness for coffees shops. Section 4 discusses a case study on coffee shops. Finally, Section 5 offers the conclusion remarks.
2 Literature review
In this section, the literature review is divided into three parts, including the service blueprint, the application of DEA (data envelopment analysis) in service performance evaluation, and the environmentally sustainable service, as explained below.
2.1 Service blueprint
In recent years, there have been a number of applications relating to the service blueprint. Berkley (1996) proposed a random service procedure to extend the representation and analysis method of the service blueprint. This method analysed the economic benefits and operational results of the service blueprint. Holdford and Kennedy (1999) applies the service blueprint to help drug store managers to identify and correct problems of the service process and provide drug store employees with service planning and feedback opportunities. That article verified that the design of the service blueprint of the drug store is a valuable tool. Chuang (2007) combined the service blueprint and the failure mode and effects analysis (FMEA) to help service designers with the design of faultless service systems. The method can identify potential fault points for the front stage and back stage operations and then the necessary actions are taken to ensure the performance of the process design of the services. In recent years, the concept of the product-service system (PSS) has received increasing attention. Geum and Park (2011) suggested that the service blueprint should represent the entire product life cycle from the perspective of customer service management, as well as the relationship between product and service. In addition, they used the service blueprint to help managers and researchers promote the benefits of the integration of products and services. Eichentopf et al. (2011) used the service blueprint to build a holistic process image to show that the customer side is equally important for the overall success of value creation. Zehrer (2009) explored the relationship between service experience and service design among SMEs in the tourism industry. That article employed the service blueprint to undertake service design in a holistic manner that is embedded in the organisational culture of the service provider for achieving long-term competitiveness.
The abovementioned research shows that the service blueprint is a systematic service process planning and design tool. Therefore, this research uses the service blueprint to analyse the service process of coffee shops and comprehend the carbon emissions of the

8 T-A. Chiang and S-T. Wang
direct facilities and support facilities for achieving the environmentally sustainable service of a coffee shop.
2.2 Application of DEA in service performance evaluation
In recent years, the application of DEA in service performance evaluation mainly involves the medical industry and the hotel industry. Yang (2008) applied DEA in the analysis of the operational efficiency of service institutions for the elderly people and found that the output could be added by about 8.2% for better operational efficiency. Moreover, the operational efficiency of the medical institutions is significantly correlated to the assessment achievement. Gao et al. (2009) applied a modified DEA model to analyse the medical service efficiency of 31 provinces and municipalities in China in 2006, and discussed the causes of the low efficiency of some provinces. Based on the condition of unchanged inputs in that case, the ideal output values in 2007 are inferred. Finally, according to the analysis of the ideal output and actual values, a number of suggestive alternatives were proposed for decision makers. Wu and Hung (2009) developed an integrated evaluation method with 54 amusement parks in Taiwan as the research subjects. They used the five evaluation indicators, i.e., the land area, the number of employees, the total assets, the total expenditures and total income to evaluate the performance of amusement parks by applying the DEA method. The research’s results show that the operational efficiency of different types of amusement parks had significant differences, and that the efficiency of amusement parks with natural landscapes would be better.
This study investigates coffee shops, which have the service-related characteristics that are similar to those of hotels. In recent years, there have been a number of applications relating to the service performance evaluation of the hotel industry. Hwang and Chang (2003) used DEA and Malmquist productivity index to evaluate the management performance in 1998 and the efficiency changes from 1994 to 1998 of 45 international tourism hotels in Taiwan. According to the management efficiency change, the hotel industry was divided into six groups, and the business operational strategies of each group were developed, respectively. Chiang et al. (2004) used DEA to evaluate the operational performance of international tourism hotels in Taipei. The input variables included the number of guest rooms, number of employees, operating expenses, the total number of floors, and the floor area of the food and beverage (F&B) department. The output variables included room revenue, F&B revenue and other revenue. The research results showed that not all the chain or franchised international tourism hotels are more efficient than Taiwan-funded international tourism hotels in the Taipei area. Yang and Lu (2006) studied 56 international tourism hotels in Taiwan in 2002 using the DEA method to evaluate management performance and measure the input congestion degree of inefficient international tourism hotels. It was found that about 40% of the international tourism hotels had not made full use of their employees or the floor area of the F&B department. Chain international tourism hotels that can make efficient use of other related facilities can easily become the benchmark of the industry. Hsu (2011) used DEA to analyse the relative efficiency of the input and output of 11 international tourism hotels in the Kaohsiung-Pingtung area of Taiwan in 2010 and discussed the directions and content of the improvements for inefficient hotels. By using slack variable analysis, the inefficient input item was the number of rooms, and thus the operators of the hotel managers should improve this performance index.

An evaluation and enhancement approach 9
The hotel industry has similar characteristics as the coffee shop industry. In addition, the previous papers show DEA is a very appropriate method to evaluate the performance of the service industry. However, little research focuses on the evaluation of eco-service performance of coffee shops. Hence, this paper employs DEA to develop the performance evaluation model of environmentally sustainable service operation.
2.3 CF for the service industry and eco-service
In the small and open economic system of Singapore, Schulz (2009) calculated the direct CF emissions and trade-related indirect CF emissions. He found that direct emissions account for only 20% of the upstream emissions (domestic emissions plus the indirect emissions of imported commodities). According to Muthu et al. (2011), CFs are used to measure the impact of human activities on the globe, especially, the impact on the environment. It involves climatic change, the total amount of greenhouse gas (GHG) emissions, and carbon dioxide emissions. The literature argues that the efforts to reduce CFs are very important. The research results suggested that consumer concepts and behaviours as well as the policies are the key to the reduction of CFs. Yi (2011) pointed out that low-carbon service is the definite trends for the hotel industry. According to this survey for high class hotels in Jinan, the major direct sources of carbon emissions during the operational process of F&B include air-conditioning and lighting, which accounted for 99%. As for the six hotels with the most power consumption for F&B services, the carbon emissions of the hotel with the highest power consumption were 25 times that of the hotel with the lowest power consumption. Filimonau et al. (2011) discussed the potential LCA for the evaluation of tourism accommodation facilities and to propose some suggestions on how to further enhance the performance of energy and thereby reduce CF. According to the review of literature, we can understand that sustainable business operations have been the goal of each enterprise, especially in the highly competitive F&B service industry. At the same time, in recent years, consumers have gradually developed the green consumption concept. The F&B industry should adopt the measures of green management and consumption. However, few scholars propose the performance evaluation and improvement methods of the green service of coffee chain stores. Therefore, this study focuses on the coffee shops to propose the evaluation and enhancement approach of the carbon-footprints-based environmentally sustainable service competitiveness to reduce environmental impacts and to boost the green market competitiveness.
To sum up, unlike previous relevant studies (Hwang, 2007; Hsu, 2011; Geum and Park, 2011; Yi, 2011; Filimonau et al., 2011), this study uses the service blueprint to represent the entire service process, while dividing the services into the front-stage operations and back-stage operations. In order to effectively estimate the CF, this paper divides the service facilities into direct facilities and supporting facilities. This study also applies DEA to develop the evaluation and improvement approach of environmentally sustainable service performance for coffee shops. The proposed CF-based performance evaluation and decision making process can significantly improve the environmentally sustainable service competitiveness for coffee shops.

10 T-A. Chiang and S-T. Wang
Figure 1 Architecture of the evaluation and enhancement approach of the CF-based environmentally sustainable service competitiveness (see online version for colours)
3 Evaluation and enhancement approach of the CF-based environmentally sustainable service competitiveness for coffee shops
This paper presents an evaluation and enhancement approach of the CF-based environmentally sustainable service competitiveness. Figure 1 shows the architecture of the proposed approach which can be divided into three parts, i.e., the CF estimation of
An evaluation and enhancement approach 11
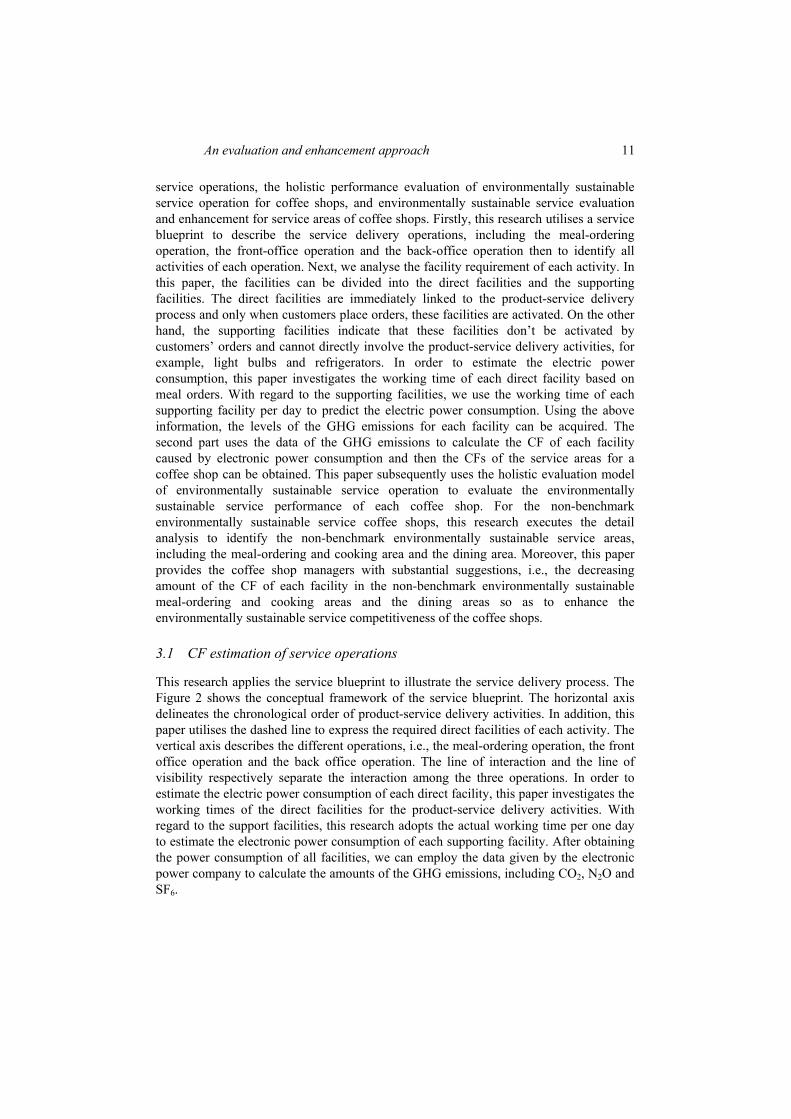
service operations, the holistic performance evaluation of environmentally sustainable service operation for coffee shops, and environmentally sustainable service evaluation and enhancement for service areas of coffee shops. Firstly, this research utilises a service blueprint to describe the service delivery operations, including the meal-ordering operation, the front-office operation and the back-office operation then to identify all activities of each operation. Next, we analyse the facility requirement of each activity. In this paper, the facilities can be divided into the direct facilities and the supporting facilities. The direct facilities are immediately linked to the product-service delivery process and only when customers place orders, these facilities are activated. On the other hand, the supporting facilities indicate that these facilities don’t be activated by customers’ orders and cannot directly involve the product-service delivery activities, for example, light bulbs and refrigerators. In order to estimate the electric power consumption, this paper investigates the working time of each direct facility based on meal orders. With regard to the supporting facilities, we use the working time of each supporting facility per day to predict the electric power consumption. Using the above information, the levels of the GHG emissions for each facility can be acquired. The second part uses the data of the GHG emissions to calculate the CF of each facility caused by electronic power consumption and then the CFs of the service areas for a coffee shop can be obtained. This paper subsequently uses the holistic evaluation model of environmentally sustainable service operation to evaluate the environmentally sustainable service performance of each coffee shop. For the non-benchmark environmentally sustainable service coffee shops, this research executes the detail analysis to identify the non-benchmark environmentally sustainable service areas, including the meal-ordering and cooking area and the dining area. Moreover, this paper provides the coffee shop managers with substantial suggestions, i.e., the decreasing amount of the CF of each facility in the non-benchmark environmentally sustainable meal-ordering and cooking areas and the dining areas so as to enhance the environmentally sustainable service competitiveness of the coffee shops.
3.1 CF estimation of service operations
This research applies the service blueprint to illustrate the service delivery process. The Figure 2 shows the conceptual framework of the service blueprint. The horizontal axis delineates the chronological order of product-service delivery activities. In addition, this paper utilises the dashed line to express the required direct facilities of each activity. The vertical axis describes the different operations, i.e., the meal-ordering operation, the front office operation and the back office operation. The line of interaction and the line of visibility respectively separate the interaction among the three operations. In order to estimate the electric power consumption of each direct facility, this paper investigates the working times of the direct facilities for the product-service delivery activities. With regard to the support facilities, this research adopts the actual working time per one day to estimate the electronic power consumption of each supporting facility. After obtaining the power consumption of all facilities, we can employ the data given by the electronic power company to calculate the amounts of the GHG emissions, including CO2, N2O and SF6.
12 T-A. Chiang and S-T. Wang
Figure 2 The conceptual framework of the service blueprint (see online version for colours)
3.2 Holistic performance evaluation of environmentally sustainable service operation for coffee shops
Owing to the different global warming effects of the GHGs, this research uses the global-warming potential (GWP) values to convert each GHG into comparable CO2 equivalent (CO2-e) so as to obtain the CFs emitted by each facility. The GWP values of N2O and SF6 are 298 and 22800 respectively. In order to evaluate the performance of environmentally sustainable service operation, this paper applies an input-oriented BCC-DEA approach (Banker et al., 1984) to develop the holistic evaluation model of environmentally sustainable service operation for coffee shops as shown in equations (1)–(8). The input variables of the holistic evaluation model of environmentally sustainable service operation are the quantities of CO2-e emitted by the meal-ordering and cooking area and the dining area of these coffee shops. The output variables are the sales quantities of the products.
Equation (1) is employed to obtain the holistic performance value of the environmentally sustainable service operation for a coffee shop. If ht is less than 1, it expresses that the coffee shop t is a non-benchmark environmentally sustainable service coffee shop. Because equation (1) is a minimum objective function, equations (2) and (3) can find the minimum θt to understand the feasibility of reducing the CO2-e emissions for the meal-ordering and cooking area and the dining area without reducing the sales quantities of the products [as shown in equation (4)]. Equation (5) explains that the sum of the weights of decision-making units (i.e., coffee shops) must be equal to 1. To obtain the total quantities of CO2-e emitted by the two areas of the coffee shop n, equations (6) and (7) are respectively utilised to calculate the total quantities of CO2-e emitted by the meal-ordering and cooking area and the dining area of the coffee shop. All variables in this model must be more than or equal to zero and θt is less than or equal to 1 as shown in equation (8).
⎟⎟⎠
⎞⎜⎜⎝
⎛++−= ∑
=
C
ccttttt sostdstmhMin
1, εθ (1)

An evaluation and enhancement approach 13
0 ..1
=+−∑=
ttt
N
nnn stmtmetmets θλ (2)
01
=+−∑=
ttt
N
nnn stdtdetde θλ (3)
( ) ( ) csotoiotoio ctctct
N
ncncnn ∀=−+−+∑
=
0,,,1
,,λ (4)
11
=∑=
R
rnλ (5)
⎟⎟
⎠
⎞
⎜⎜
⎝
⎛+
⎟⎟
⎠
⎞
⎜⎜
⎝
⎛= ∑∑∑∑∑
= == = =
G
g kk
gnk
A
a
F
f kk
fankn wpmsewpmdetme
1
3
1
,
1 1
3
1
,, (6)
⎟⎟
⎠
⎞
⎜⎜
⎝
⎛= ∑∑
= =
G
g kk
gnkn wpdsetde
1
3
1
, (7)
10;0,,, , ≤≤≥ tncttt sostdstm θλ (8)
where
ht is the performance value of the environmentally sustainable service operation for the coffee shop t
θt is the rough performance value of the environmentally sustainable service operation for the coffee shop t
tmen is the total quantity of CO2-e emitted by the meal-ordering and cooking area of the coffee shop n
tden is the total quantity of CO2-e emitted by the dining area of the coffee shop n
wpk is the global warming potential of the GHG k
stmt is the slack variable of the CO2-e emitted by the meal-ordering and cooking area of the coffee shop t
stdt is the slack variable of the CO2-e emitted by the dining area of the coffee shop t
ton,c is the take-out quantity of the product c in the coffee shop n
ion,c is the dine-in quantity of the product c in the coffee shop n
sot,c is the slack variable for the quantity of the product c for the shop t
λn is the weight of the coffee shop n fan
kmde ,, is the quantity of the GHG k emitted by the direct facility f for the activity a of the meal-ordering and cooking area of the coffee shop n

14 T-A. Chiang and S-T. Wang
gnkmse , is the quantity of the GHG k emitted by the supporting facility g of the
meal-ordering and cooking area of the coffee shop n gn
kdse , is the quantity of the GHG k emitted by the supporting facility g of the dining area for the coffee shop n
Δtmet is the decreasing amounts of CO2-e for the meal-ordering and cooking area of the coffee shop t
Δtdet is the decreasing amounts of CO2-e for the dining area of the coffee shop t.
3.3 Environmentally sustainable performance evaluation and enhancement for service areas of coffee shops
To discern the reasons of the poor environmentally sustainable performance for non-benchmark coffee shops and provide these coffee shop managers with the authentic and tangible improvement suggestions to enhance the performance of environmentally sustainable service operation, this paper divides a coffee shop into the two service areas, i.e., the meal-ordering and cooking area as well as the dining area. Next, this paper develops the environmentally sustainable performance evaluation models of the meal-ordering and cooking areas and the dining areas respectively as shown equations (9)–(14) and (15)–(19) to assess their performance and find the non-benchmark environmentally sustainable service areas.
The input variables of the environmentally sustainable performance evaluation model of the meal-ordering and cooking area are the quantities of CO2-e produced by the direct facilities and the supporting facilities at the meal-ordering and cooking areas. At the same time, the output variables of this model are the take-out and dine-in order quantities of the products. Equation (9) calculates the environmentally sustainable service performance value of the meal-ordering and cooking area for the coffee shop t. Because the environmentally sustainable performance evaluation model of the meal-ordering and cooking area is an input-oriented model, equations (10) and (11) calculates the shortening percentage of the quantities of the CO2-e emitted by the direct facilities and the supporting facilities of the meal-ordering and cooking area of the coffee shop t comparing with the benchmark DMUs. At the same time, the take-out and dine-in order quantities are unchanged as shown in equation (12). Equation (13) displays the sum of the weights of the meal-ordering and cooking areas for the coffee shops must be equal to 1. All variables of DEA must be more than or equal to zero. In addition, αt is less than or equal to 1 as shown in equation (14).
Owing to the dining area provides service with the dine-in customers, the output variables of the environmentally sustainable performance evaluation model of the dining area are the dine-in order quantities of the products. In addition, the facilities of dining areas belong to supporting facilities. Supporting facilities are not activated by customers’ orders such as air conditioners and light bulbs. The working time of a supporting facility is based on the practical condition. For example, the working time of a refrigerator is 24 hours one day; the working time of the light bulbs is business hours. Hence, the input variables of the environmentally sustainable performance evaluation model of the dining area are the quantities of CO2-e produced during the working times of the supporting facilities. To evaluate the environmentally sustainable service performance of a dining

An evaluation and enhancement approach 15
area, Equation 15 is utilised to calculate the environmentally sustainable service performance value of the dining area for the coffee shop t. The performance value must satisfy 0 ≤ dt ≤ 1. By using the minimum objective function, i.e., equation (15), equation (16) can find the minimum βt to analyse the feasibility of reducing the CO2-e emissions for the dining area without reducing the dine-in quantities of the products [as shown in equation (17)]. Similarly, the sum of the weights of the dining areas for the coffee shops is equal to one. All variables are more than or equal to zero.
⎟⎟
⎠
⎞
⎜⎜
⎝
⎛++−= ∑∑∑
===
C
cct
G
g
tg
F
f
tftt sosmismdmMin
1,
11
εα (9)
fsmdwpmdewpmdets tf
A
a kk
fatkt
N
n
A
a kk
fankn ∀=+⎟
⎟⎠
⎞⎜⎜⎝
⎛−⎟
⎟⎠
⎞⎜⎜⎝
⎛∑∑∑ ∑∑= == = =
,0 ..1
3
1
,,
1 1
3
1
,, αμ (10)
gsmiwpmsewpmse tg
kk
gtkt
N
n kk
gnkn ∀=+⎟
⎟⎠
⎞⎜⎜⎝
⎛−⎟
⎟⎠
⎞⎜⎜⎝
⎛∑∑ ∑== =
,03
1
,
1
3
1
, αμ (11)
( ) ( ) csotoiotoio ctctct
N
ncncnn ∀=−+−+∑
=
0,,,1
,,μ (12)
11
=∑=
n
nnμ (13)
10;0,,, , ≤≤≥ tncttg
tf sosmssmd αμ (14)
where
mt is the environmentally sustainable service performance value of the meal-ordering and cooking area for the coffee shop t
αt is the rough environmentally sustainable service performance value of the meal-ordering and cooking area for the coffee shop t
μn is the weight of the meal-ordering and cooking area for the coffee shop n tfsmd is the slack variable of the CO2-e emitted by the direct facility f of the
meal-ordering and cooking area of the coffee shop t tgsmi is the slack variable of the CO2-e emitted by the supporting facility g of the
meal-ordering and cooking area of the coffee shop t.
⎟⎟
⎠
⎞
⎜⎜
⎝
⎛+−= ∑∑
==
C
cct
G
g
tgtt siosdsdMin
1,
1
εβ (15)
gsdswpdsewpdsets tg
kk
gtkt
N
n kk
gnkn ∀=+⎟
⎟⎠
⎞⎜⎜⎝
⎛−⎟
⎟⎠
⎞⎜⎜⎝
⎛∑∑ ∑== =
,0 ..3
1
,
1
3
1
, βν (16)

16 T-A. Chiang and S-T. Wang
( ) ( ) csioioio ctct
N
ncnn ∀=−−∑
=
0,,1
,ν (17)
11
=∑=
N
nnν (18)
10;0,, , ≤≤≥ trctki siosds βλ (19)
where
dt is the environmentally sustainable service performance value of the dining area for the coffee shop t
βt is the rough environmentally sustainable service performance value of the dining area for the coffee shop t
vn is the weight of the dining area for the coffee shop n tgsds is the slack variable of the CO2-e emitted by the supporting facility g of the
dining area for the coffee shop t.
To assist coffee shop managers to probe the detail causes of poor environmentally sustainable service, this research discovers the hot spots of improving the CFs by profoundly analysing the feasibility of reducing the carbon emission for each facility of the non-benchmark environmentally sustainable service areas at the coffee shops. For the non-benchmark meal-ordering and cooking area, this research utilises equations (20) and (21) to get the maximum reduced amounts of CFs for the direct facilities and the supporting facilities. With regarding to the non-benchmark dining areas, this paper applies equation (22) to acquire the maximum decreased quantities of the CFs for the supporting facilities. Through above information, the coffee shop managers can comprehend which facilities need to be replaced to improve the carbon emissions. At the same time, equations (9)–(14) and (15)–(19) can be used to obtain the benchmark environmentally sustainable service areas for the meal-ordering and cooking areas and the dining areas. Therefore, the electric power consumption of these low-carbon facilities for the benchmark environmentally service areas can be gained. The precious and valuable information can help coffee shop managers propose constructive improvement planning for enhancing the environmentally sustainable service competitiveness.
( ) fsmdwpmdemde tf
A
a kk
fatktt ∀+⎟
⎟⎠
⎞⎜⎜⎝
⎛−=Δ ∑∑
= =1
3
1
,,1 α (20)
( ) gsmswpmsemse tg
kk
gtktt ∀+⎟
⎟⎠
⎞⎜⎜⎝
⎛−=Δ ∑
=
3
1
,1 α (21)
Δmdet is the decreasing amounts of CO2-e for the direct facility f of the meal-ordering and cooking area for the coffee shop t
Δmset is the decreasing amounts of CO2-e for the supporting facility g of the meal-ordering and cooking area for the coffee shop t.

An evaluation and enhancement approach 17
( ) gsdswpdsedse tg
kk
gtktt ∀+⎟
⎟⎠
⎞⎜⎜⎝
⎛−=Δ ∑
=
3
1
,1 β (22)
Δdset is the decreasing amounts of CO2-e for the supporting facility g of the dining area for the coffee shop t.
4 Case study
This study selects 15 coffee shops in Taiwan as an example to explain and demonstrate the significant effectiveness of the proposed approach. In this research, the LINGO 13.0 software is employed to solve the proposed mathematical programming models. Before assessing the performance of environmentally sustainable service operation for coffee shops, the related meetings of collecting case data were held. Firstly, this research interviewed the coffee shop managers to understand the service delivery process and the working times of the required direct facilities of each activity in the delivery process. The second meeting collected the working times and quantities of the supporting facilities at the meal-ordering and cooking area and the dining area. Besides, the electrical power consumption of each facility per unit time was gathered. The third meeting asked the coffee shop managers the take-out and dine-in quantities of the products in the coffee shops. Through using the above data, this research can calculate the carbon emission of each facility to analyse the performance of environmentally sustainable service operation for coffee shops and further point out the reasons of the poor environmentally sustainable service performance for the non-benchmark coffee shops.
Because these coffee shops belong to the same coffee shop chain, these coffee shops have a same service operation procedure. At the same time, there is no back-office operation in the coffee shop chain. In addition, this research focuses on the main products at these coffee shops, i.e., coffee beverages. Figure 3 shows the service blueprint of these coffee shops. Firstly, the customers enter a coffee shop and then order coffee beverages by using the point of sale (POS) system. Although these coffee shops provide various types of coffee beverages, they can be categorised into the two main classifications, i.e., Americanos and espressos. With regard to espressos, a series of the diverse coffee beverages are made by adding different materials to espressos. This kind of coffee beverages uses the espresso machines. Based on the automatic levels, there are three kinds of the espresso machines, i.e., automatic espresso machines, semi-automatic espresso machines and manual espresso machines. Because only automatic espresso machines include the grinding function, semi-automatic espresso machines and manual espresso machines need to use the coffee grinders before making coffee. Based on the common compared standard, the electric power consumption of coffee grinders need to be added to electric power consumption of semi-automatic espresso machines and manual espresso machines, respectively. At the same time, each coffee shop only has one type of espresso machines. Moreover, Americanos are made by using the Americano machines. These coffee shops only have one type of Americanos. After receiving the coffee beverages, some customers drink coffee in the coffee shops and others take out coffee. Hence, customer orders contain the dine-in orders and the take-out orders. The dine-in customers use the supporting facilities at the dining area of a coffee shop. Because these coffee shops are established at the different times, the electric power

18 T-A. Chiang and S-T. Wang
consumption of most supporting facilities in these coffee shops is some differences. The POS systems at these coffee shops, however, are all the same electric power consumption. Therefore, this research does not incorporate the POS systems in the holistic performance evaluation of environmentally sustainable service operation for the coffee shops. Appendix Table 1 shows the electric power consumption of the direct facilities and the supporting facilities per hour.
Figure 3 The service blueprint of the coffee shops (see online version for colours)
Table 1 CFs of the direct facilities and the supporting facilities (unit: gram)
No.
Meal-ordering and cooking area Dining area Direct facility Supporting facility Supporting facility
Espresso machine
Americano machine Light bulb Air
conditioner Light bulb Air conditioner
1 2,755 92 873 3,243 1,642 6,486 2 3,361 68 2,184 6,559 3,397 13,118 3 2,554 68 1,310 5,588 1,423 16,765 4 2,701 73 987 6,559 2,184 19,677 5 2,741 81 445 3,243 768 9,729 6 3,082 108 1,205 3,243 1,965 9,729 7 2,392 77 1,310 5,588 3,931 16,765 8 2,999 92 2,426 5,588 6,066 16,765 9 3,116 85 2,669 3,243 4,853 9,729 10 2,919 97 1,205 5,588 2,515 16,765 11 3,357 85 526 3,243 930 12,972 12 3,396 102 1,310 3,243 2,297 12,972 13 2,770 77 1,423 5,588 3,389 22,354 14 2,835 90 445 5,588 1,132 22,354
Due to the different sizes of one cup of coffee, this study uses the working time of a direct facility for making one millilitre of coffee and the total millilitre of selling the coffee beverages within one month to estimate the total working time of a direct facility. In regard to the supporting facilities, the working times of light bulbs and air conditioners

An evaluation and enhancement approach 19
are the total business hours during a month. By using the above data, we can calculate the total electrical power consumption and the total CF of each facility for each coffee shop as shown in Table 1. Table 2 displays the take-out and the dine-in quantities of each coffee beverage for every coffee shop. Table 2 Take-out and dine-in quantities of each coffee beverage for every coffee shop (unit:
millilitre)
No. Americanos Espressos
Take-out Dine-in Take-out Dine-in 1 3,850 2,100 14,700 7,950
2 3,850 1,750 14,400 6,150
3 4,200 1,400 15,750 5,250
4 4,900 1,050 18,750 4,650
5 2,100 3,150 8,250 12,450
6 3,150 3,850 12,000 14,700
7 3,150 3,150 12,150 12,150
No. Americanos Espressos
Take-out Dine-in Take-out Dine-in
8 3,150 2,800 12,450 10,200 9 4,200 2,800 16,200 10,800 10 3,150 3,150 12,000 12,000 11 3,150 3,850 12,450 15,150 12 2,800 3,850 10,200 15,450 13 2,100 4,200 8,400 15,600 14 2,100 5,250 8,700 20,100
This paper employs equations (1)–(8) to obtain the holistic performance values of the environmentally sustainable service operation for these coffee shops as shown in Table 3. Because the coffee shops no. 2, 3, 4, 7, 8, 9, 10, 12 and 13 belong the non-benchmark environmentally sustainable service coffee shops, the coffee shop managers hope to understand the reasons of poor environmentally sustainable service operation. Equations (9)–(14) and (15)–(19) can be therefore used to profoundly analyse the environmentally sustainable service performance of the meal-ordering and cooking areas and the dining areas (as shown in Table 4) to understand which service areas must be improved. From Table 4, we can find that the environmentally sustainable service performance values of the meal-ordering and cooking areas of the coffee shops no. 2, 3, 4, 7, 9 and 12 are equal to 1. Hence, these coffee shop managers can quickly understand that the CFs of the dining area causes the poor holistic performance of environmentally sustainable service operation. Subsequently, to discover the hot spots of improving carbon emissions, equation (22) is utilised to analyse the amount that the CF of each supporting facility at the dining areas should be decreased as shown in Table 5. Using the above analytical results, these coffee shop managers can fully comprehend that the energy consumption of the inefficient air conditioners produces a lot of carbon emissions. Therefore, it is a key point that adopts the energy-saving air conditioners to significantly enhance the holistic

20 T-A. Chiang and S-T. Wang
performance values of the environmentally sustainable service operation for these coffee shops. Secondarily, the light bulbs at the dining areas of the coffee shops no. 2, 4 and 7 use the halogen light bulbs. Therefore, these light bulbs should be replaced with LED (light-emitting diode) light bulbs. Comparing with the benchmark environmentally sustainable coffee shops, the dining areas of the coffee shops no. 3, 9 and 12 should reduce the number of the light bulbs at the dining area to become an LED light bulb per 1.32 square meters. Table 3 Holistic performance values of the environmentally sustainable service operation for
these coffee shops
No. 1 2 3 4 5 6 7
Performance 1 0.556 0.699 0.658 1 1 0.740 No. 8 9 10 11 12 13 14 Performance 0.611 0.852 0.707 1 0.878 0.703 1
Table 4 Environmentally sustainable service performance values of the meal-ordering and cooking area and the dining area of the non-benchmark environmentally sustainable service coffee shops (unit: gram)
No. Meal-ordering and cooking area Dining area No. Meal-ordering
and cooking area Dining area
2 1.000 0.494 9 1.000 0.807 3 1.000 0.570 10 0.875 0.538 4 1.000 0.452 12 1.000 0.885 7 1.000 0.507 13 0.995 0.576 8 0.848 0.464
Table 5 Decreased amounts of CO2-e of each facility for the dining areas of the non-benchmark environmentally sustainable service coffee shops (unit: gram)
No. Light bulb Air conditioner No. Light bulb Air conditioner
2 1,718 6,635 9 938 1,876 3 612 7,214 10 1,162 7,747 4 1,197 10,784 12 264 1,490 7 1,937 8,262 13 1,436 9,470 8 3,252 8,985
Table 4 shows that the meal-ordering and cooking areas and the dining areas of the coffee shops no. 8, 10 and 13 must be improved to enhance the performance of the environmentally sustainable service operations. This research employs equations (20)–(21) to acquire the decreasing amounts of CO2-e of each facility at the meal-ordering and cooking areas as shown in Table 6. Tables 5 and 6 show there is much room for improvement in the carbon emissions of the air conditioners at the dining areas and the meal-ordering and cooking areas of the coffee shops no. 8 and 10. Hence, these coffee shop managers should adopt the inverter air conditioners to reduce the carbon emissions. Moreover, the espresso machines at the coffee shops no. 8 and 10 should be changed into the automatic espresso machines to reduce the CFs. In addition, the dining

An evaluation and enhancement approach 21
areas of the coffee shops no. 8, 10 and 13 should use the LED light bulbs to reduce the carbon emissions. At the same time, this research suggests that the meal-ordering and cooking areas of the coffee shops no. 8 and 10 should reduced the density of the light bulbs. Table 6 Decreasing amounts of CO2-e of each facility for the meal-ordering and cooking areas
of the non-benchmark environmentally sustainable service coffee shops (unit: gram)
No. Direct facility Supporting facility
Espresso machine Americano machine Light bulb Air conditioner 8 455 14 369 848 10 364 14 150 697 13 13 0 7 26
By using the proposed methodology, the coffee shop managers can get a lot of insights about environmentally sustainable service competitiveness of each coffee shop and find the hot spots of the reducing CFs. Finally, this paper provides the coffee shop managers of the non-benchmark environmentally sustainable service operation with the clear directions and substantial suggestions to significantly boost the environmentally sustainable service competitiveness.
5 Conclusions
Given the rapid blooming growth of the service section in the developing and developed countries, a lot of business activities of the service-sector firms lead to an abundance of electrical consumption. In addition, the main source of CO2 emissions is electricity use which accounts for 32%. The service-sector companies should take substantial actions to curb or even decrease the electricity consumption. To deal with the crucial challenge, this paper develops the evaluation and enhancement approach of the CFs-based environmentally sustainable service competitiveness for coffee shops. The presented approach uses the service blueprint to clearly describe the service operation process and accurately estimate the electricity consumption and the CFs of the direct facilities and the supporting facilities used in the activities of the service operation process. Moreover, this paper creates the holistic performance evaluation model of environmentally sustainable service operation for coffee shops to find non-benchmark environmentally sustainable service coffee shops. In order to identify the reason of the poor environmentally sustainable service performance, this paper employs the environmentally sustainable performance evaluation models of the meal-ordering and cooking area and the dining area to profoundly analyse the environmentally sustainable performance of the service areas and then calculate the decreasing CO2-e amount of each facility for achieving the environmentally sustainable service aim. These scientific analytical results can let non-benchmark coffee shop managers know how to enhance the environmentally sustainable service competitiveness through providing the concrete improvement suggestions. Finally, this paper takes the coffee shops in Taiwan as an example to elaborate on and certify the significant efficacy of the proposed approach.

22 T-A. Chiang and S-T. Wang
Acknowledgements
This research received partial financial supports from the National Science Council under Contract No. NSC 102-2622-H-141-002-CC3.
References Banker, R.D., Charnes, A. and Cooper, W.W. (1984) ‘Some models for estimating technical and
scale inefficiencies in data envelopment analysis’, Management Science, Vol.30, No. 9, pp.1078–1092.
Berkley, B.J. (1996) ‘Analyzing service blueprints using phase distributions’, European Journal of Operational Research, Vol. 88, No. 1, pp.152–164.
Chiang, W.E., Tsai, M.H. and Wang, S.M. (2004) ‘A DEA evaluation of Taipei hotels’, Annals of Tourism Research, Vol. 31, No. 3, pp.712–715.
Chuang, P.T. (2007) ‘Combining service blueprint and FMEA for service design’, The Service Industries Journal, Vol. 27, No. 2, pp.91–104.
Eichentopf, T., Kleinaltenkamp, M. and Stiphout, J. (2011) ‘Modelling customer process activities in interactive value creation’, Journal of Service Management, Vol. 22, No. 5, pp.650–663.
Filimonau, V., Dickinson, J., Robbins, D. and Huijbregts, M.A.J. (2011) ‘Reviewing the carbon footprint analysis of hotels: life cycle energy analysis (LCEA) as a holistic method for carbon impact appraisal of tourist accommodation’, Journal of Cleaner Production, Vol. 19, Nos. 17–18, pp.1917–1930.
Gao, Y., Shen, Z. and Zeng, J. (2009) ‘An analysis on the efficiency of Chinese regional medical services: based on chance constrained DEA model’, Management Science & Statistical Decision, Vol. 6, No. 3, pp.14–23.
Geum, Y. and Park, Y. (2011) ‘Designing the sustainable product-service integration: a product-service blueprint approach’, Journal of Cleaner Production, Vol. 19, No. 14, pp.1601–1614.
Hertwich, E.G. and Peters, G.P. (2009) ‘Carbon footprint of nations: a global, trade-linked analysis’, Environmental Science and Technology, Vol.43, No. 16, pp.6414–6420.
Holdford, D.A. and Kennedy, D.T. (1999) ‘The service blueprint as a tool for designing innovative pharmaceutical services’, Journal of the American Pharmaceutical Association, Vol. 39, No. 4, pp.545–552.
Hsu, M.S. (2011) ‘Relative efficiency evaluation of international tourist hotels in Kaohsiung and Pingtung areas: an application of DEA efficiency analysis’, Journal of Taiwan Hospitality and Tourism, Vol. 8, pp.13–34.
Hu, A.H., Lin, R-W., Huang, C-Y. and Wu, C-L. (2011) ‘Carbon reduction assessment of a product service system: a case study of washing machines’, Proceedings of EcoDesign: 7th International Symposium on Environmentally Conscious Design and Inverse Manufacturing, Springer.
Hui, S.C.M. and Wong, M.K.F. (2010) ‘Benchmarking the energy performance of hotel buildings in Hong Kong’, Proceedings of the Liaoning (Dalian) – Hong Kong Joint Symposium, China, pp.56–69.
Hwang, S.N. (2007) ‘An application of data envelopment analysis to measure the managerial performance of electronics industry in Taiwan’, International Journal of Technology Management, Vol. 40, Nos. 1–3, pp.215–228.
Hwang, S.N. and Chang, T.Y. (2003) ‘Using data envelopment analysis to measurehotel managerial efficiency change in Taiwan’, Tourism Management, Vol. 24, No. 4, pp.357–369.
Liqin, Y. (2011) ‘The analysis on carbon footprint of catering products in high-star hotels during operation: based on investigation conducted in parts of high-star hotels in Ji'nan’, Energy Procedia, Vol. 5, pp.890–894.

An evaluation and enhancement approach 23
Martínez, C.I.P. and Silveira, S. (2012) ‘Analysis of energy use and CO2 emission in service industries: evidence from Sweden’, Renewable and Sustainable Energy Reviews, Vol. 16, No. 7, pp.5285–5294.
Muthu, S.S., Li, Y., Hu, J.Y. and Mok, P.Y. (2011) ‘Carbon footprint of shopping (grocery) bags in China, Hong Kong and India’, Atmospheric Environment, Vol. 45, No. 2, pp.469–475.
Olaru, M., Dinu, V., Stoleriu, G., Şandru, D. and Dincă, V. (2010) ‘Responsible commercial activity of SMEs and specific values of sustainable development in terms of the European excellence model’, Amfiteatru Economic, Vol. XII, No. 27, pp.10–26.
Oreja-Rodríguez, J.R. and Armas-Cruz, Y. (2012) ‘Environmental performance in the hotel sector: the case of the Western Canary Islands’, Journal of Cleaner Production, Vol. 29–30, pp.64–72.
Schulz, N.B. (2009) ‘Delving into the carbon footprints of Singapore-comparing direct and indirect greenhouse gas emissions of a small and open economic system’, Energy Policy, Vol. 38, No. 9, pp.4848–4855.
Sellitto, M.A., Borchardt, M., Pereira, G.M. and Paulo, L. (2011) ‘Environmental performance assessment in transportation and warehousing operations by means of categorical indicators and multicriteria preference’, Chemical Engineering Transactions, Vol. 25, pp.291–296.
Teng, C.C., Horng, J.S., Hu, M.L., Chien, L.H. and Shen, Y.C. (2012) ‘Developing energy conservation and carbon reduction indicators for the hotel industry in Taiwan’, International Journal of Hospitality Management, Vol. 31, No. 1, pp.199–208.
Wang, P.P., Ming, X.G., Li, D., Kong, F.B., Wang, L. and Wu, Z.Y. (2011) ‘Modular development of product service systems’, Concurrent Engineering: Research and Application, Vol. 19., No. 1, pp.85–96.
Watanabe, K., Mikoshiba, S., Tateyama, T. and Shimomura, Y. (2012) ‘Service process simulation for integrated service evaluation’, Journal of Intelligent Manufacturing, Vol. 23, No.4, pp.1379–1388.
Wu, S.N. and Hung, S.Y. (2009) ‘Evaluation of amusement parks’ development efficiency based on data envelopment analysis’, Journal of Planning, Vol. 35, No. 1, pp.1–12.
Yang, C. and Lu, W.M. (2006) ‘Performance benchmarking for Taiwan’s international tourist hotels’, Information, Vol. 44, No. 3, pp.229–245.
Yang, C.C. (2008) ‘The analysis on operating efficiency of nursing homes-application of environmental variable-adjusted DEA’, The Journal of Health Science, Vol. 10, No. 3, pp.185–196.
Yi, L. (2011) ‘The analysis on carbon footprint of catering products in high-star hotels during operation: based on investigation conducted in parts of high-star hotels in Ji’nan’, Energy Procedia, Vol. 5, pp.890–894.
Zehrer, A. (2009) ‘Service experience and service design: concepts and application in tourism SMEs’, Managing Service Quality, Vol. 19, No. 3, pp.332–349.
Zhokhova, V.V. (2013) ‘Model of competitiveness of eco-tourism product (by the example of tourism organizations in Primorsky Krai)’, Middle-East Journal of Scientific Research, Vol. 14, No. 12, pp.1581–1585.

24 T-A. Chiang and S-T. Wang
Appendix
Table 1 Electric power consumption of the direct facilities and supporting facilities (unit: kWh)
No.
Meal-ordering and cooking area Dining area
Direct facility Supporting facility Supporting facility
Espresso machine
Americano machine Light bulb Air
conditioner Light bulb Air conditioner
1 5,800 1,200 108 401 203 802 2 7,800 950 270 811 420 1,622 3 5,800 950 162 691 176 2,073 4 6,800 950 122 811 270 2,433 5 7,800 1,200 55 401 95 1,203 6 6,800 1,200 149 401 243 1,203 7 5,800 950 162 691 486 2,073 8 7,800 1,200 300 691 750 2,073 9 6,800 950 330 401 600 1,203 10 5,800 1,200 149 691 311 2,073 11 5,800 950 65 401 115 1,604 12 7,800 1,200 162 401 284 1,604 13 6,800 950 176 691 419 2,764 14 5,800 950 55 691 140 2,764