Embed Size (px)
Citation preview

Vol-3 Issue-5 2017 IJARIIE-ISSN(O)-2395-4396
6565 www.ijariie.com 303
An Empirical Study on Long Term Performance of Equity
Linked Savings Schemes in Mutual Funds K.Alamelu, Ph.D Research Scholar,
Dr.G.Indhumathi, Assistant Professor,
Department of Commerce, Mother Teresa Women‟s University, Kodaikanal
Abstract In this paper, an attempt has been made to evaluate the performance of thirty two growth oriented open
ended equity linked savings schemes of tax saving mutual funds in India. Performance has been analyzed on the
basis of monthly returns compared to Indian stock market Benchmark, S&P CNX nifty. For this purpose, Risk-
adjusted performance measures suggested by Sharpe, Treynor and Jenson have been used. Last five years Net Asset
Value of tax saving schemes from 2012-13to 2016-17 has been employed. All the schemes follow the same pattern in
its return and moves along with the Stock market index and S&P CNX nifty. The average return of all the schemes is
higher and average risk is lower than the Benchmark S&P CNX nifty.
Keywords: Performance Measures, Equity Linked Savings Scheme, Risk Adjusted Returns.
Meaning of ELSS:
ELSS is a dedicated mutual fund scheme that allows investors to save tax. An ELSS fund manager invests
in a diversified portfolio, predominantly consisting of equity and equity related instruments that carry high risk and
have potential to deliver the high returns.
Introduction
Majority tax payers like to save their money without paying tax. To escape from paying tax they have to
invest required amount in to tax shielded avenue. Along with tax exemption they expect returns out of it. Tax saving
mutual fund is one of the avenue which provides market related return with tax exemption. Investors can avail tax
exemption of Rs.1,50,000 u/s.80C by investing into tax saving mutual funds.
Mutual fund industry is emerged in 1964 in India and developed enormously. It is general idea that is
through diversified portfolio mutual funds could give better returns with low risk than the market risk and the
volatility of the mutual fund market is less than the stock market. An investor, who is invested into stock market
need to monitor the market on regular basis, whereas, those who invested into mutual fund no need to watch the
market movement for reducing the loss. The Fund manager of every Asset Management Company takes care of the
investors‟ money. They diversify the investors‟ money into various sectors like Oil, Bank, Automobile, Information
technology, Agriculture, etc., the returns from this diversified portfolio distributed to all the investor. Hence mutual
fund provides nominal return with lower risk.
India has thirty two open ended Equity Linked Savings plan called Tax saving mutual funds. This study
evaluates the performance of tax saving mutual funds for the past five years from 2012-13 to 2016-17. This study
utilized the Benchmark Index S&P CNX nifty to compare mutual fund performance.
The rest of the paper is organized as summarizing the related literature on mutual fund performance,
presenting data and methodology, results of the tax saving mutual funds performance analyses and final section
discusses the conclusion of this paper.
Review of literature William f. Sharpe (1966)
1, made an attempt to measure and predict the performance of mutual funds by a simple
measure like average return and risk and identified that good performance of funds is associated with low expense
ratio.
Eugene f. Fama and kenneth r. French (1992)2, identified five common risk factors in the returns on stock and
1 William Sharpe, F.” Mutual Fund Performance”, The Journal of Business, Vol. 39, No.1,
pp.119-138, 1966 2 Eugene Fama, F. and Kenneth French, R. “Common Risk Factors in the Returns on Stocks and
Bonds”, Journal of financial Economics, Vol. 33, pp. 3-56, 1992

Vol-3 Issue-5 2017 IJARIIE-ISSN(O)-2395-4396
6565 www.ijariie.com 304
bonds. There are three stock market factors such as overall market factor, factors related to firm,size and book-to-
market equity. There are two bond-market factors, related to maturity and default risks. Stock returns are linked to
both stock-market factors and bond market returns.
Sitkin and pablo(1992)3, defined risk perception as risk assessment in uncertainty and it depends on the familiarity
with organizational and management system. The authors also developed a model of determinants of risk behaviour
and identified personal risk preferences and past experiences are the important risk factors and social influence also
affects the individual‟s perception.
John n. Sorros (2003)4, evaluated the risk and return of 16 equity mutual funds operating in the greek financial
market over the period of 1995-1999. The study revealed that all sixteen mutual funds showed lower total risk, and
risk-return coefficient than the general index of the athens stock exchange (ase) and there was a variation in return in
all sixteen mutual funds.
Svetlana (2010)5, made a this study to test the efficient market hypothesis for different market capitalization and
investment styles of mutual funds. The results of the study for the entire period of 1994-2007 indicated that small
cap funds have provided the highest risk-adjusted return for the entire period whereas growth funds have exhibited
lower returns. The author found that the mutual funds market is not always efficient, which makes it possible for an
investor or a mutual fund manger to earn excess return on a risk- adjusted basis.
Niamey (2011)6, compared the return of eight different us equity funds with the NSE composite index for the
period of 2000-2007 and found that both the returns are relatively moving together. The article also criticized that
investors need to be aware of problems and issues of mutual funds and have to reconsider other investment
alternatives for better returns.
Vienna (2013)7, examined whether mutual funds could actually impart more value than the stock market and protect
the interest of the investors during the downturn. It was found that during the sharp downturn the schemes
not only gave negative returns but also underperformed the index.
Shefali Jain (2015)8, evaluated the performance of 16 equity- linked schemes using risk and return and compared
their performance with its benchmark S&P CNX nifty. It has been found in the article that majority of the investors
were aware of mutual funds, its risk and return proportion.
Data
Thirty two Indian based Equity Linked Savings schemes have been collected for the purpose of study. Daily
returns of these funds are obtained from the first financial year 2012-13 till 2016-2017
Daily returns of all the schemes are collected from Association of Mutual fund in India (AMFI)
The techniques used in this study for the Risk-free rate of return with the average yield (3.5 per cent) based on
Bank Deposit savings schemes returns.
Methodology This study estimates risk-return profiles for tax saving mutual funds that have been varied from five-year period to
one-year period. Daily returns are used for computing annual returns and measures of return and risk. Mean
returns are calculated by averaging the monthly returns over the relevant time period.
NAV return is the change in the net asset value of mutual fund over a given time period.
Total risk measures by the Standard Deviation of returns. Systematic (market) risk is estimated by beta. Risk
premium related to the total risk is measures by Sharpe index. Fund‟s performance in relation to the market
performance is measured by Treynor index. Jensen‟s alpha is used to compare the actual or realized return of the
3 Sitkin, S.B. and Pablo, Reconceptualizing the Determinants of Risk Behaviour, Academy of
Management Review 17, No. 1, pp. 9-39, 1992 4 John Sorros, N. “Return and Risk Analysis : A case study of Equity Mutual Funds Operating in
the Greek Financial Market”, Managerial Finance, Vol. 29, No 9, pp. 21-28, 2003 5 Svetlana, “Testing Market Efficiency for Different Market Capitalization Funds”, American
Journal of Business, Vol. 23, Issue. 2, pp.17-27, 2010 6 Niamey “Equity Mutual Funds Versus Market Performance: Illusion or Reality?”, The
Business Review, Vol. 11, No. 1, pp.71-75, 2011 7 Viena “Mutual fund schemes in India – Can they Protect the Interest of the Retail Investors?”,
Journal of Business Management, Vol. 1, No. 1-2, pp. 81-98, 2013 8 Shefali Jain, “Investment Performance of Equity-Linked Saving Schemes- An Empirical
Study”, India Journal of Finance, pp. 15- 22, 2015

Vol-3 Issue-5 2017 IJARIIE-ISSN(O)-2395-4396
6565 www.ijariie.com 305
portfolio with the predicted or calculated return. The market benchmark used here is S&P and CNX nifty.
The standard deviation is a measure of variability which is used as the standard measure of the total risk of
individual assets and the residual risk of portfolios of assets. This can be calculated by using the formula
σ = standard deviation
Xi = each data value
µ = mean value of data
N = sample size
The models developed on the assumptions of „The Capital Asset Pricing Model‟ and tested by Treynor (1965),
Sharpe (1966), Jensen (1968) and Fama‟s Decomposition of Returns was used to evaluate the performance of
selected growth schemes.
Sharpe Index (St) measures the risk premium of the portfolio with reference to the total amount of risk. The index
St measures the slope of the line emanating from risk-free rate outward the portfolio. The larger the St, the better the
portfolio has performed. St is the reward to variability of the scheme‟s total risk and is a summary measure of
scheme‟s performance adjusted for risk.
Treynor Index (Tt) sums up the risk and return of a portfolio in a single number. The index measures the slope of
the line emanating outward from the risk-free rate to the portfolio under consideration. Treynor index is a reward to
volatility of the portfolio. The characteristic line relates the market return to a specific portfolio return without any
direct adjustmentfor risk. This line can be fitted through a least square regression involving a single market
portfolio. To use Treynor‟s measure first the CRL of portfolios are fixed by estimating the following equation:
Jensen constructed a measure of absolute performance on a risk-adjusted basis while Sharpe and Treynor models
provided measures for ranking the relative performance of various portfolios on a risk-adjusted basis. Equilibrium
average return on a portfolio is the benchmark. Equilibrium average return is the return of the market portfolio for a
given systematic risk calculated with the following formula:
EARp = Rf + (Rm - Rf) Bp
EARp is the equilibrium return of the portfolio „p‟ indicating superior / inferior performance of the portfolio‟s alpha
( ). Jensen‟s Alpha is the intercept of the CRL. If alpha is positive, the portfolio has performed better and if it is
negative, scheme performance is not up to the Benchmark.
In a well-diversified portfolio, the average value of alpha of all stocks turns out to be zero.
Table 1 Annualized monthly average return of tax saving mutual funds
S.no
Schemes
Annualized average returns (in %)
2012-13
2013-14
2014-
15
2015-
16
2016-
17
1. SBI Magnum tax gain scheme 1993 1.96 1.96 -3.40 4.96 -0.29
2. Canara Robeco equity tax saver 0.34 0.75 -2.53 5.91 0.47
3. Hdfc taxsaver -0.20 1.96 -2.87 5.81 0.53
4. LIC mf tax plan -0.75 1.79 -3.40 4.00 0.64
5. Sahara tax gain -0.40 2.93 -2.63 4.98 0.37
6. Franklin India tax shield -0.87 2.53 -2.52 4.80 0.66
7. ICICI Prudential tax plan -0.45 1.68 -3.07 6.39 0.41
8. UTI- ELSS-growth -1.06 2.52 -3.19 4.13 0.09
9. Escorts tax plan 2.39 2.66 -5.57 4.12 -0.28

Vol-3 Issue-5 2017 IJARIIE-ISSN(O)-2395-4396
6565 www.ijariie.com 306
10. Hdfc long term advantage fund -0.20 1.60 -3.16 5.31 0.92
11. ING tax savings fund 0.01 0.65 -4.42 5.48 0.66
12. Sundaram tax saver -1.30 2.84 -2.83 4.27 -0.10
13. Reliance tax saver (ELSS) fund -0.33 1.08 -2.48 4.55 0.69
14. L&T tax saver fund -0.32 0.94 -4.30 6.08 -0.03
15. Kotak tax saver-scheme 0.72 1.85 -3.85 4.77 0.03
16. Bnp paribas tax advantage plan -0.75 3.28 -4.97 4.00 -0.07
17. Fidelity tax advantage fund 0.33 2.30 -2.40 4.89 0.91
18. DWS tax saving fund Na 3.10 -3.44 4.15 -0.49
19. Birla sun life tax plan Na 1.72 -3.24 4.59 0.21
20. HSBC tax saver equity fund Na 1.83 -2.33 4.65 -0.10
21. Religare tax plan Na 2.12 -3.23 5.35 0.29
22. DSP black rock tax saver fund Na 3.20 -3.14 5.23 0.17
23. Taurus tax shield Na 4.52 -2.40 5.03 0.33
24. Birla sun life relief 96 Na Na -3.63 5.47 -0.32
25. JM tax gain fund - Na Na -6.38 4.08 -0.81
26. Bharti axa tax advantage fund-eco plan Na Na Na 5.98 -0.81
27. Bharti axa tax advantage fund-regular plan Na Na Na 5.95 -0.81
28. IDFC tax advantage (ELSS) fund Na Na Na 4.28 0.16
29. Quantum tax saving fund Na Na Na 4.72 0.81
30. JP Morgan India tax advantage fund Na Na Na 3.90 0.65
31. Edelweiss ELSS fund Na Na Na 3.65 0.27
32. Axis tax saver fund Na Na Na Na 1.56
Bench mark
S&P CNX nifty 0.054 0.13 -0.15 0.24 0.045
Source: Historical NAV report -Association of mutual funds in India (AMFI)
INTERPRETATION: 1
From Table 1, it is evident that all the schemes performed well during the financial year 2013-15. Five
schemes has performed well and produced more than two per cent monthly average return. 11 schemes performed
moderately, produced more than one per cent monthly average return. 16 schemes underperformed and produced
lesser than one per cent monthly average return. ICICI prudential tax plan performed well and produced
maximum of 6.39 per cent of average monthly return during the period 2015-16. Average monthly return of all
the schemes during the year 2009-10 is higher than the risk free market return (3.5 per cent). All the schemes
underperformed, produced negative return during the year.

6565 www.ijariie.com 307
2012-13 and it is higher than the stock market indices of S&P CNX nifty ( -0.15 per cent), the performance decline
in 2012-13 is due to the global economic crises. All the schemes performed better during the year 2013-14 than
2012-13.
Table 2 : Standard Deviation of Tax Saving mutual funds
S.no
Schemes
Standard deviation
2012-13
2013-14
2014-
15
2015-
16
2016-
17
1. SBI Magnum tax gain scheme 1993 6.24 6.52 10.81 8.74 4.69
2. Canara Robeco equity tax saver 6.67 9.90 11.78 9.25 1.55
3. Hdfc taxsaver 6.93 7.74 10.97 7.71 1.77
4. LIC mf tax plan 7.55 8.59 10.92 9.09 0.83
5. Sahara tax gain 5.72 8.19 9.90 9.12 1.21
6. Franklin India tax shield 5.56 7.62 10.22 6.60 2.20
7. ICICI Prudential tax plan 7.71 7.98 12.45 7.53 1.38
8. UTI- ELSS-growth 6.48 7.62 9.59 7.37 0.30
9. Escorts tax plan 5.33 8.73 8.09 8.74 0.91
10. Hdfc long term advantage fund 5.45 6.55 10.30 7.50 4.74
11. ING tax savings fund 7.91 8.09 13.18 9.45 4.73
12. Sundaram tax saver 7.43 8.92 8.64 9.55 5.00
13. Reliance tax saver (ELSS) fund 7.04 8.60 8.97 7.26 5.25
14. L&T tax saver fund 6.23 7.36 13.46 9.70 5.13
15. Kotak tax saver-scheme 7.60 7.89 11.20 9.31 4.84
16. Bnp paribas tax advantage plan 8.52 9.83 10.33 7.02 5.26
17. Fidelity tax advantage fund 5.99 7.33 9.92 6.97 4.53
18. DWS tax saving fund Na 9.44 11.21 6.89 5.12
19. Birla sun life tax plan Na 8.33 10.38 8.70 4.42
20. HSBC tax saver equity fund Na 8.33 8.63 7.66 5.16
21. Religare tax plan Na 6.36 10.44 7.22 4.43
22. DSP black rock tax saver fund Na 9.72 10.22 7.64 4.77
23. Taurus tax shield Na 6.85 11.88 11.05 4.98
24. Birla sun life relief 96 Na Na 12.58 9.93 1.05
25. JM tax gain fund - Na Na 14.25 8.38 4.87
6565 www.ijariie.com 308
26. Bharti axa tax advantage fund-eco plan Na Na Na 11.53 5.47
27. Bharti axa tax advantage fund-regular plan Na Na Na 11.57 5.47
28. IDFC tax advantage (ELSS) fund Na Na Na 7.10 5.03
29. Quantum tax saving fund Na Na Na 6.63 4.45
30. JP Morgan India tax advantage fund Na Na Na 7.29 4.74
31. Edelweiss ELSS fund Na Na Na 7.75 4.65
32. Axis tax saver fund Na Na Na Na 3.59
Bench mark
S&p cnx nifty 6.641 8.759 12.09 9.267 5.539
Source: Historical NAV report -Association of mutual funds in India (AMFI)
INTERPRETATION: TABLE 2 Table 2 Results revealed Standard Deviation of all selected tax saving mutual funds. It shows that all the schemes
had highest volatility during the period 2014-15. The scheme with lowest standard deviation is Escorts Tax Plan
with the standard deviation value of 8.09 in the year of 2014 - 15.
The average market risk of all schemes is lower during the period 2016-17. It can be noted that many mutual funds
volatility is higher than Stock Market Volatility. Generally it is said that mutual funds are risk diversified but it is
proofed that market risk of mutual funds are goes along with the stock market index even some mutual funds
volatility is higher than the stock market. Other than mutual fund features like diversification of fund, fund
managed By AMC, no entry and exit charges, etc.,
all mutual funds are determined as risk less instrument for the retail investors.
Sharpe ratio measures the total risk of the funds on the basis of return per unit of total risk. While a high and
positive Sharpe ratio shows a superior risk-adjusted performance of a fund, a low and negative Sharpe ratio is an
indication of unfavorable performance.
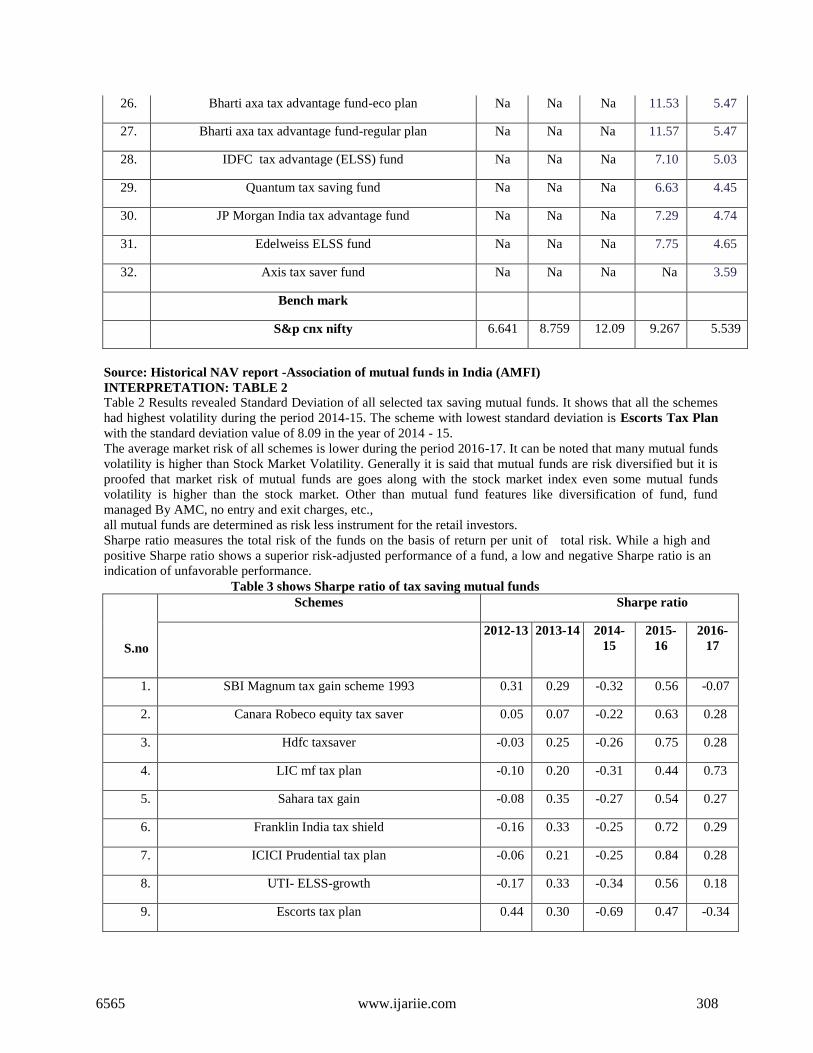
Table 3 shows Sharpe ratio of tax saving mutual funds
S.no
Schemes Sharpe ratio
2012-13
2013-14
2014-
15
2015-
16
2016-
17
1. SBI Magnum tax gain scheme 1993 0.31 0.29 -0.32 0.56 -0.07
2. Canara Robeco equity tax saver 0.05 0.07 -0.22 0.63 0.28
3. Hdfc taxsaver -0.03 0.25 -0.26 0.75 0.28
4. LIC mf tax plan -0.10 0.20 -0.31 0.44 0.73
5. Sahara tax gain -0.08 0.35 -0.27 0.54 0.27
6. Franklin India tax shield -0.16 0.33 -0.25 0.72 0.29
7. ICICI Prudential tax plan -0.06 0.21 -0.25 0.84 0.28
8. UTI- ELSS-growth -0.17 0.33 -0.34 0.56 0.18
9. Escorts tax plan 0.44 0.30 -0.69 0.47 -0.34
6565 www.ijariie.com 309
10. Hdfc long term advantage fund -0.04 0.24 -0.31 0.70 0.19
11. ING tax savings fund 0.00 0.08 -0.34 0.58 0.13
12. Sundaram tax saver -0.05 0.31 -0.33 0.44 0.21
13. Reliance tax saver (ELSS) fund -0.02 0.12 -0.28 0.62 0.12
14. L&T tax saver fund -0.01 0.12 -0.32 0.62 -0.01
15. Kotak tax saver-scheme 0.03 0.23 -0.35 0.51 0.00
16. Bnp paribas tax advantage plan -0.03 0.33 -0.48 0.57 -0.02
17. Fidelity tax advantage fund 0.01 0.31 -0.25 0.70 0.19
18. DWS tax saving fund Na 0.32 -0.31 0.60 -0.10
19. Birla sun life tax plan Na 0.20 -0.32 0.52 0.04
20. HSBC tax saver equity fund Na 0.22 -0.27 0.60 -0.03
21. Religare tax plan Na 0.33 -0.31 0.74 0.06
22. DSP black rock tax saver fund Na 0.33 -0.31 0.68 0.03
23. Taurus tax shield Na 0.66 -0.20 0.45 0.06
24. Birla sun life relief 96 Na Na -0.29 0.55 -0.33
25. JM tax gain fund - Na Na -0.45 0.48 -0.17
26. Bharti axa tax advantage fund-eco plan Na Na Na 0.52 -0.16
27. Bharti axa tax advantage fund-regular plan Na Na Na 0.51 -0.16
28. IDFC tax advantage (ELSS) fund Na Na Na 0.60 0.02
29. Quantum tax saving fund Na Na Na 0.71 0.17
30. JP Morgan India tax advantage fund Na Na Na 0.53 0.13
31. Edelweiss ELSS fund Na Na Na 0.47 0.05
32. Axis tax saver fund Na Na Na Na 0.42
Bench mark
S&p cnx nifty 0.01 0.05 -0.07 0.11 0.01
Source: Historical NAV report -Association of mutual funds in India (AMFI)
INTERPRETATION: TABLE 3
Table 3 results revealed Sharpe ratio of selected equity linked savings schemes of mutual funds. It is generally
assumed that people will prefer for 'more return' and 'less risk'. Risk in the context of the Sharpe ratio is return
volatility. An investor would rank portfolios by their Sharpe ratios. Portfolios with higher sharp and lower
volatilities are preferred than portfolios with lower Sharpe and higher volatilities.
Table 3 reveals that no fund has given positive Sharpe value during the period 2014-15. The highest Sharpe
measure obtained (0.84) is by ICICI prudential tax plan during 2015-16, the lowest Sharpe measure obtained (-
0.69) is by escorts tax plan during 2014-15. In comparison, the Sharpe measure of benchmark S&P CNX nifty is

6565 www.ijariie.com 310
lower than all schemes during the period of study.
Table 4 Treynor ratio of tax saving mutual funds
S.n
o
Schemes
Treynor ratio
2012-13
2013-14
2014-15
2015-16
2016-17
1. SBI Magnum tax gain scheme 1993 1.92 2.75 -3.46 5.45 -0.43
2. Canara Robeco equity tax saver 0.29 0.76 -2.40 6.06 0.75
3. Hdfc taxsaver -0.21 2.32 -2.93 7.19 0.77
4. LIC mf tax plan -0.66 1.95 -3.44 4.18 0.78
5. Sahara tax gain -0.48 3.28 -2.92 5.20 0.51
6. Franklin India tax shield -1.06 2.96 -2.70 6.99 0.85
7. ICICI Prudential tax plan -0.47 2.12 -2.83 8.12 0.53
8. UTI- ELSS-growth -1.04 3.02 -3.64 5.35 0.07
9. Escorts tax plan 4.03 2.95 -7.76 4.87 -0.42
10. Hdfc long term advantage fund -0.29 2.32 -3.43 6.75 1.20
11. ING tax savings fund -0.02 0.83 -3.69 5.53 0.85
12. Sundaram tax saver -2.14 2.88 -3.81 4.25 -0.18
13. Reliance tax saver (ELSS) fund -0.35 1.24 -3.15 6.22 0.83
14. L&T tax saver fund -0.39 1.18 -3.50 6.09 -0.08
15. Kotak tax saver-scheme 0.61 2.24 -3.75 4.88 -0.01
16. Bnp paribas tax advantage plan -0.60 1.85 -13.20 5.47 -0.13
17. Fidelity tax advantage fund 0.31 2.89 -2.64 6.76 1.24
18. Dws tax saving fund Na 2.94 -3.33 5.75 -0.70
19. Birla sun life tax plan Na 2.01 -3.39 5.01 0.25
20. HSBC tax saver equity fund Na 2.05 -2.94 5.86 -0.16
21. Religare tax plan Na 3.40 -3.39 7.04 0.39
22. DSP black rock tax saver fund Na 3.33 -3.35 6.48 0.19
23. Taurus tax shield Na 4.64 -2.29 4.43 0.42

6565 www.ijariie.com 311
Source: Historical NAV report -Association of mutual funds in India (AMFI)
INTERPRETATION: TABLE 4
Treynor is a measurement of the returns earned in excess of that which could have been earned on an
investment that has no diversifiable risk per each unit of market risk assumed. Table 4 shows Treynor
measure of equity linked tax saving fund.. From analysis it is noted that
All the schemes are performed well than the stock market index S&P CNX nifty during the entire period of
study.
Alpha is a risk-adjusted measure return on an investment. It is the return in excess of the compensation for
the risk borne. The alpha measure shows the level of risk associated with the return. If alpha(αi ) < 0, the
investment has earned too little for its risk (or, was too risky for the return),
if alpha(αi ) = 0, the investment has earned a return adequate for the risk taken and if alpha(αi ) > 0, the
investment has a return in excess of the reward for the assumed risk. Alpha ratio is the difference between the
average realized return of a portfolio manager with private information and the expected return of the passive
strategy based upon public information only with equal systematic risk. Taurus tax shield-growth option and
fidelity tax advantage fund- growth option does better during the period of study.
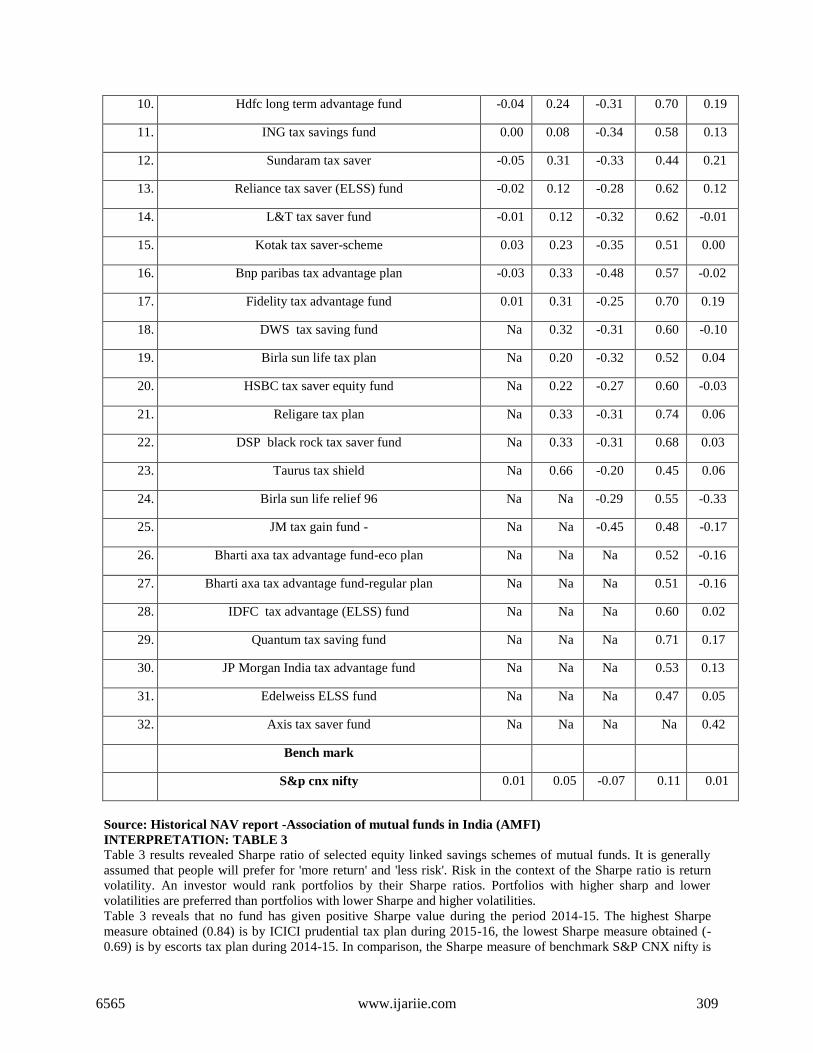
Table 5 Jensen ratio of tax saving mutual funds
S.no
Schemes
Jensen Ratio
2012-13
2013-14
2014-15
2015-16
2016-17
1. SBI Magnum tax gain scheme 1993 1.90 1.86 -3.25 4.74 -0.33
2. Canara Robeco equity tax saver 0.28 0.63 -2.37 5.67 0.43
3. Hdfc taxsaver -0.26 1.85 -2.72 5.61 0.49
4. LIC mf tax plan -0.81 1.68 -3.25 4.74 -0.33
24. Birla sun life relief 96 Na Na -3.21 5.21 -0.44
25. JM tax gain fund - Na Na -5.12 4.93 -1.15
26. Bharti axa tax advantage fund-eco plan Na Na Na 5.10 -1.04
27. Bharti axa tax advantage fund-regular plan Na Na Na 5.05 -1.04
28. IDFC tax advantage (ELSS) fund Na Na Na 5.95 0.17
29. Quantum tax saving fund Na Na Na 6.98 1.13
30. JP Morgan India tax advantage fund Na Na Na 5.65 0.81
31. Edelweiss ELSS fund Na Na Na 4.50 0.35
32. Axis tax saver fund Na Na Na Na -7.43
Bench mark
S&p cnx nifty 0.02 0.09 -0.186 0.20
53
0.01
6565 www.ijariie.com 312
5. Sahara tax gain -0.45 2.82 -2.50 4.75 0.32
6. Franklin India tax shield -0.92 2.42 -2.38 4.63 0.62
7. ICICI Prudential tax plan -0.51 1.58 -2.90 6.19 0.37
8. UTI- ELSS-growth -1.11 2.41 -3.06 3.94 0.05
9. Escorts tax plan 2.34 2.55 -5.47 3.91 -0.32
10. Hdfc long term advantage fund -0.26 1.50 -3.02 5.12 0.88
11. ING tax savings fund -0.05 0.55 -4.23 5.25 0.62
12. Sundaram tax saver -1.35 2.72 -2.73 4.10 -0.15
13. Reliance tax saver (ELSS) fund -0.38 0.97 -2.37 4.30 0.64
14. L&T tax saver fund -0.37 0.84 -4.11 5.86 -0.07
15. Kotak tax saver-scheme 0.66 1.74 -3.69 4.51 -0.02
16. Bnp paribas tax advantage plan -0.81 1.82 -3.92 3.70 -0.12
17. Fidelity tax advantage fund 0.28 2.19 -2.27 4.66 0.86
18. Dws tax saving fund Na 2.97 -3.28 4.08 -0.53
19. Birla sun life tax plan Na 1.61 -3.10 4.37 0.17
20. HSBC tax saver equity fund Na 1.71 -2.21 4.46 -0.14
21. Religare tax plan Na 2.03 -3.09 5.16 0.25
22. DSP black rock tax saver fund Na 3.07 -3.00 5.03 0.13
23. Taurus tax shield Na 4.40 -2.24 4.77 0.28
24. Birla sun life relief 96 Na Na -3.45 5.22 -0.36
25. JM tax gain fund - Na Na -6.18 3.88 -0.85
26. Bharti axa tax advantage fund-eco plan Na Na Na 5.71 -0.86
27. Bharti axa tax advantage fund-regular plan Na Na Na 5.68 -0.86
28. IDFC tax advantage (ELSS) fund Na Na Na 4.10 0.12
29. Quantum tax saving fund Na Na Na 4.55 0.76
30. JP Morgan India tax advantage fund Na Na Na 3.72 0.61
31. Edelweiss ELSS fund Na Na Na 3.45 0.23
32. Axis tax saver fund Na Na Na Na 1.53
Bench mark (S&P CNX Nifty) 0.01 0.10 0.18 0.25 0.01
INTERPRETATION: TABLE 5

6565 www.ijariie.com 313
Table 5 shows Jensen measures of equity linked tax saving fund for the year 2012-13 till 2016-17. It is noted that
the stock market has equivalent return for the risk. Stock market alpha is zero for the entire study period. It can be
said that 2015-16 is glorious time for the investor, invariably all the mutual funds are produced better return during
this period. ICICI Prudential tax plan seems to be a good plan; it has given highest Jensen Returns measure of 6.19
with the comparison of all other tax saving mutual funds during the period of 2012-17.
There are various tools help investors to measure the performance of mutual funds; decision cannot be taken by
referring the results of one tool. It is necessary to use number of tools to evaluate the performance. NAV return
shows the actual return on the investment over a period of time. The past performance will not guarantee the future
still it is important to analyze the past data to forecast the future. The annualized monthly return of Taurus tax
shield-growth option and Fidelity tax advantage fund-growth option is good during the period of study.
Results of the study
Thirty two equity linked savings schemes annualized monthly return has been identified in Table 1 with Bench
mark S&P CNX Nifty. From table 1, it is evident that all the schemes performed well during the financial year
2015-17. Five schemes has performed well and produced more than two per cent monthly average return. 11
schemes performed moderately, produced more than one per cent monthly average return. 16 schemes
underperformed and produced lesser than one per cent monthly average return. ICICI prudential tax plan
performed well and produced maximum of 6.39 per cent of average monthly return during the period 2015-16.
Average monthly return of all the schemes during the year 2015-16 is higher than the risk free market return (3.5
per cent). All the schemes underperformed, produced negative return during the year 2014-15 and it is higher
than the stock market indices of S&P CNX Nifty ( -0.15 per cent), the performance decline in 2014-15 is due to the
global economic crises. All the schemes performed better during the year 2013-14 than 2012-13.
Standard deviation is a tool that shows the volatility of the fund. It is advisable not to invest in a fund which is
unstable. From the sample data, it is analyzed that Escorts tax plan-growth, HDFC long term advantage fund
growth option has lower volatility during the period of study than all other schemes.
Sharpe ratio measures total risk of a portfolio, it is useful measure to analyze investment area that are in similar
type. Higher Sharpe ratio shows better performance with lower market risk. Taurus tax shield-growth option and
Religare tax plan – growth plan adjusted with market return and produced better Sharpe ratio during the study
period.
Treynor ratio uses systematic risk, higher the Treynor ratio, better the performance under analysis. Taurus tax
shield-growth option and Religare tax plan – growth performed well in the study period.
Jensen ratio is the difference between the average realized return of a portfolio manager with private information
and the expected return of the passive strategy based upon public information only with equal systematic risk.
Taurus tax shield-growth option and Fidelity tax advantage fund- growth option does better during the period of
study.
Conclusion
This paper evaluated the risk-adjusted performance of tax saving mutual funds in India. Analyzing the seasonality
of funds return and benchmark return volatility in terms of the mean adjusted.
Yearly standard deviation from the daily return obtained from AMFI reports and NSE reports. Examining the fund
volatility, it is found that the highest volatility occurs in the period of 2014-15. Risk- adjusted performance is
measure by Sharpe, Treynor and Jensen. From these measures it is found that there are certain schemes which
underperform than the benchmark index that shows a strong negative risk–return relation. There are certain
schemes that outperform than the Benchmark index with Positive risk- return relation.
Investor who wants to invest into tax saving mutual funds needs to make two decisions. One is which fund to hold
and how much money to invest each. This study helps the investors to choose the suitable schemes for investment.
It can also be stated the past performance of the funds does not reflect in future. Most of the schemes performed
well in the initial period. This study analysis shows all the tax saving mutual funds is having volatility but not all
the schemes volatility is lesser than the benchmark S&P CNX nifty. Most of the schemes are given higher return
than the benchmark S&P CNX nifty.
All the schemes are p e r f o r m e d in same pattern towards market. Even though the fund movements are similar,
the degree of change is not same in all the schemes. Investors‟ interest and keen updating of the market will help
them to attain their expected return from the equity linked savings schemes of tax saving mutual
funds.
References
Eugene fama, f. And kenneth french, r. “common risk factors in the returns on stocks and bonds”, journal of
financial economics, vol. 33, pp. 3-56, 1992.

6565 www.ijariie.com 314
John sorros, n. “return and risk analysis : a case study of equity mutual funds operating in the greek financial
market”, managerial finance, vol. 29, no 9, pp. 21-28, 2003.
Sitkin, s.b. and pablo, reconceptualizing the determinants of risk behaviour, academy of
management review 17, no. 1, pp. 9- 39, 1992.
William sharpe, f.” Mutual fund performance”, the journal of business, vol. 39, no.1, pp.119-138,
1966.
Websites
www.amfiindia.com
www.nseindia.com.