Embed Size (px)
Citation preview

An Empirical Investigation into the Informativeness of Earnings
An honors thesis presented to the
Department of Accounting,
University at Albany, State University Of New York
in partial fulfillment of the requirements
for graduation with Honors in Accounting
and
graduation from The Honors College.
Joyce Tseng
Research Advisor: Uday Chandra, Ph.D.
May 2013
i
Abstract
Accounting earnings are widely used by investors, creditors and financial analysts as a measure
of operating performance in valuing firms. However, accountants trade off relevance in decision
making in favor of reliability in computing earnings. This study uses an analysis based on stock
prices to examine the effectiveness of the earnings number in measuring the operating
performance of a firm under different situations where it may be less accurate: when Research
and Development Expense, Pension Expense, Special Items, and Income from Discontinued
Operations are disproportionately large in magnitude. The results are generally consistent with
my hypotheses. The results of this study are potentially important as they may prompt users to
use a lower weight on the earnings number – and higher weights on non-earnings information –
in valuing firms when the components of earnings examined in this study are of larger magnitude.

ii
Acknowledgements
This thesis came to being through the support of many people. Professor Chandra helped me
develop the thesis question and patiently advised me throughout the 1 ½ -year period of thesis
writing. I thank him for his persistent care and efforts in making this thesis a rewarding
experience.
I have been supported by my loving family. My parents, Chi-Ming Tseng and Ying-Chi Tseng,
have encouraged me to take on the challenge of writing this thesis and have given me inspiration
to carry on when I almost have given up. My wonderful brother and sisters, Jerry Tseng, Joanne
Tseng, and Jacqueline Tseng – thanks for being who you are.
Many sincere thanks to the church family at Chinese Christian Church of Greater Albany,
especially to Philip & Blossom Woodrow, Huiping & Tracy Zhang, Sophia Hsia, and Ivan Yu.
All the encouragements, prayers, and love you have shown me in the last 5 years I will never
forget. Thank you, thank you. I pray that I can take all the blessings you have given me to bless
many more for the years to come.
Finally and the most importantly, I thank my God, Jesus Christ, for guiding my course of life. It
is by faith that I stepped into University at Albany. It is by faith I chose the major in Accounting.
It is by faith I enrolled in The Honors College. It is by faith that I pursued writing an honors
thesis. And it is by faith I held on till the end.
“I have fought the good fight, I have finished the race, I have kept the faith.” - 2Timothy 4:7
I’ve written this thesis not for personal accomplishment but for exhibiting His goodness.
“To the King of ages, immortal, invisible, the only God, be honor and glory forever and ever.
Amen.”
- 1Timothy 1:17

iii
Table of Contents
Page
Abstract…………………………………………………………………………………………….i
Acknowledgement………………………………………………………………………………...ii
1. Introduction …………………………………………………………………………………..1-2
2. Theoretical Background………………………………………………………………………...2
2.1 Efficient Market Hypothesis…………………………………………………….2-3
2.2 Relevance verses Reliability…………………………………………………........3
2.3 Recognition verses Disclosure…………………………………………………….4
2.4 Earnings Persistence……………………………………………………………4-5
3. Development of Hypothesis…………………………………………………………………….5
3.1 Internally- Developed Intangibles………………………………………………5-6
3.2 Income from Discontinued Operations………………………………………..6-7
3.3 Unusual Gains and Losses………………………………………………………7-8
3.4 Pension Expense………………………………………………………………...8-9
4. Research Design………………………………………………………………………………...9
4.1 Empirical Model……………………………………………………………….9-13
5. Results……………………………………………………………………………………..13-14
5.1 Research and Development Expense…………………………………………14-15
5.2 Income from Discontinued Operations…………………………………………..15
5.3 Unusual Gains and Losses……………………………………………………15-16
5.4 Pension Expense…………………………………………………………………16
6. Conclusion…………………………………………………………………………………16-18
7. References……………………………………………………………………………………..19
8. Tables
8.1 Table 1 – Descriptive Statistics…………………………………………………..20
8.2 Table 2 - Regression Analysis for R&D Expense……………………………….21
8.3 Table 3 – Regression Analysis for Income from Discontinued Operations……..22
8.4 Table 4 – Regression Analysis for Unusual Gains and Losses…………………..23
8.5 Table 5 – Regression Analysis for Pension Expense…………………………….24

1
1. INTRODUCTION
One of the jobs of an accountant is to generate numbers that summarize the financial
position of a company, and it is expected that the numbers on the financial statements reflect
accurate information about the company and represent the company’s financial status faithfully
(FASB 2010, OB2). Accounting, however, only reports numbers that are reliable and verifiable.
Consequently, judgments made by accountants as they prepare financial statements affect the
quality of information investors will receive to evaluate company performance. This further
implies that accounting information may have varying degrees of usefulness in valuing firms.
This study looks specifically at the usefulness of the earnings number, as it is a summary
measure of operating performance, is used widely by investors to evaluate a company, and is a
key input into estimates of future growth. The primary question posed by this paper is: What are
the situations in which the earnings number is not as effective and therefore conveys less
information to the market? The fact that financial analysts and users also obtain information
from sources other than financial statements suggests that there are parts of the earnings number
that reflect information considered not useful in valuing a firm.
This study identifies four situations in which earnings are hypothesized to be less
informative: the situations when changes in internally-developed intangibles, income from
discontinued operations, unusual gains and losses, and pension expense within earnings are
disproportionately large. The earnings number is hypothesized to be less effective in capturing
information in these situations because changes in earnings may not reflect levels of operating
performance that will persist into the future. Statistical tests done in the study affirm these
hypotheses in general. For income from discontinued operations and unusual gains and losses,
the results showed that earnings are less informative when these items change in large amount.

2
For internally-developed intangibles and pension expense, the results were in the expected
direction but not statistically significant. Discussions of possible reasons for the lack of
significance in the results can be found in the result section and concluding section of the paper.
Identifying components of earnings that make earnings less informative enables investors
to use accounting information more effectively. Such knowledge enables investors to have better
intuition about the weight they should put on earnings in valuing firms in different situations.
Moreover, the study could motivate accounting standard-setters to consider how they can
improve the usefulness of accounting information.
2. THEORETICAL BACKGROUND
This section presents some theoretical constructs on which this study is based: the
Efficient Market Hypothesis (EMH), the tradeoff between relevance and reliability, the tradeoff
between recognition and disclosure, and earnings persistence.
2.1 Efficient Market Hypothesis
The efficient market hypothesis (EMH) states that stock prices reflect all publicly
available information quickly in an unbiased manner. This implies that stock prices change due
to the flow of information into the market. In this study, the change in stock price is used as a
measure of the information flowing into the market on a firm. It is also the objective of the
earnings number to summarize information on the operating performance of a firm over a

3
specific period. Therefore, the association between earnings and stock price is used to assess the
effectiveness of earnings in capturing information that is useful in valuing a firm.
2.2 Relevance verses Reliability
Relevance and reliability are both qualitative characteristics that make accounting
information useful. For information to be relevant, it needs to have the “capacity to make a
difference in investors’, creditors’, or other users’ decisions” (FASB 2008, paragraph 73). On the
other hand, according to FASB, “[Reliable] information must be sufficiently faithful in its
representation of the underlying resource, obligation, or effect of events and sufficiently free of
error and bias to be useful to investors, creditors, and others in making decisions” (FASB 2008,
paragraph 75).
Ideally, useful accounting information has the maximum of both qualities. However,
there is sometimes a trade-off between the two when one accounting method generates more
reliable information and another provides information that is more relevant for decision-making.
This occurs commonly with internally-developed intangibles. When a company incurs a research
and development cost, the accountant chooses not to report the cost as an asset on the balance
sheet, but instead expenses all of the cost due to the uncertainty of future profits arising from the
investment. Since future profits from acquired internally-developed intangibles cannot be
objectively measured and are at best only weakly related to cost, the accountant chooses
reliability over relevance. To match revenue with expense in the situation is misleading and can
give an earnings number that is less useful.

4
2.3 Recognition verses Disclosure
Accountants have several options in presenting information about a firm. A firm may
recognize it in the financial statements. Alternatively, a firm may disclose the information in
notes to financial statements or present it in press releases and conference calls to analysts and
investors. Depending on the nature of information, accountants may choose different disclosure
media. In the context of this study, these decisions mostly impact how internally-developed
intangibles, such as research and development costs, are presented. Accountants usually
recognize a business transaction in the financial statements when its economic substance can be
reliably evaluated either based on historical cost or other means. However, if the economic
substance of a transaction cannot be evaluated, accountants will choose to present the transaction
qualitatively via disclosure notes or press releases, if material. Due to the difficulty in measuring
revenues generated from investments in research and development, accountants classify this item
as an expense and provide details in the disclosure notes.
2.4 Earnings Persistence
Earnings persistence refers to the likelihood that a firm’s current earnings level will recur
in future periods. When the market receives information of an unexpected change in earnings
and regards the earnings information as useful in evaluating the future performance of a firm, the
information has high persistence and the stock price change is large. On the other hand, in the
case of one-time events, when the change in earnings is only temporary, the information has little
persistence and the stock price change is lower (Nicholas & Wahlen, December 2004, p. 6).
Earnings persistence is relevant in this study because it explains why different components of

5
earnings may vary in their usefulness for valuing firms. Since stock price reflects the net present
value of future cash flows from an investment in the firm, changes in current earnings that have
no impact on future earnings will have no association with the stock price. The earnings number,
however, reflects information regardless of the persistence of information.
3. DEVELOPMENT OF HYPOTHESES
The earnings number consists of several dissimilar components. The following discusses
four components of earnings believed to reduce the usefulness of earnings number in valuing a
firm when their changes are large in magnitude:
1) Internally-developed intangibles
2) Income from discontinued operations
3) Unusual gains and losses
4) Pension expense
3.1 Internally- Developed Intangibles
The value of internally-developed intangible assets is difficult to measure. Investment in
R&D, like other internally-developed intangibles, is accounted as a one-time upfront cost in
accounting. The accounting treatment of R&D costs, like other internally- developed intangibles,
is controversial because the cash flows generated from them cannot be reliably estimated. The
historical costs of these items are not suitable measures of future cash flows from these
investments. As a result, accountants report investments in R&D as expenses as opposed to

6
assets on the balance sheet. This expensing of R&D investments can impact the usefulness of
earnings.
In addition, stock price and earnings reflect R&D information differently. Stock prices go
up when an increase in research and development signals high future profits. However, the
earnings number does not present this qualitative part of the information. It presents only
historical events. Accountants, in an effort to amend the deficiencies in accounting information,
provide additional information within the disclosure notes that may be potentially useful for
investors.
With above discussions regarding the treatment and observance of R&D due to its
immeasurability of profits and the nature of uncertainty, the following hypothesis is made:
H1: Earnings with large changes in R&D expense are less informative.
It is believed that earnings composed of large R&D expenses is less useful because that means
the earnings is less likely to capture the information flowing into the market about a firm as
effectively as stock price does.
3.2 Income from Discontinued Operations
Income from discontinued operations is one of the most common types of irregular items.
It occurs when two things happen: (1) a company eliminates the results of operations and cash
flows of a component from its ongoing operations, and (2) there is no significant continuing
involvement in that component after the disposal transaction. It is reported separately on the

7
income statement after continuing operations and before extraordinary items, and it is shown net
of tax effects (Kieso, Weygandt, & Warfield, 2011, pp. 169-170).
Income from discontinued operations during the current period does not impact future
earnings since it does not recur in the future; hence it has minimal impact on firm valuation
although the earnings number captures that information in its entirety. This gives the following
hypothesis:
H2: Earnings with a large change in income from discontinued operations are less informative.
3.3 Unusual Gains and Losses
Unusual gains and losses are material gains and losses that are either associated
with other than normal operations of a company or occur infrequently, but not both. They are
usually reported in a separate section above “Income from operations before income taxes” and
“Extraordinary items.” Some examples of unusual gains and losses include write-downs of
inventories, transaction gains and losses from fluctuation of foreign exchange rates, and
restructuring charges. With companies that take restructuring charges every year, for example,
prior research indicates that the market discounts the earnings of companies that report a series
of “nonrecurring” items. Such evidence supports the contention that these elements reduce the
quality of earnings (Kieso, Weygandt, & Warfield, 2011, pp. 172-173). While financial analysts
usually exclude the effects of unusual gains and losses in their forecasts of company performance
by looking only at operating income, some contend that unusual gains and losses are no longer
special, seeing that more companies are writing-off more items in recent years in large amounts
(Elliott & Hanna, 1996, p. 143). A study indicates that companies with large write-offs had more

8
negative stock price change than those without, implying that such information does matter
(Weil & Liesman, 2001).
The hypothesis for this item of interest is:
H3: Earnings with a large change in the magnitude of unusual gains and losses are less
informative.
This hypothesis was tested applying the same method used for the other three earnings’
components of interest. With the backing of prior study and conclusion, testing the same
hypothesis again with the different approach used in this study enhances the credibility of the
conclusions made about other components of interest. Furthermore, it provides a validation of
the testing methodology used in the study.
3.4 Pension Expense
Pension expense consists of several components: service cost, interest cost, return on plan
assets, amortization of prior service cost, and amortization of gains or losses (Kieso, Weygandt,
& Warfield, 2011, p. 1215). This figure is usually factored into the firm’s income statement as
part of sales, general and administration expenses (Rapoport, 2003). Accounting for pensions
requires the assistance of actuaries, who provide predictions on “mortality rates, employee
turnover, interest and earnings rates, early retirement frequency, future salaries, and other factors
necessary to operate a pension plan” (Kieso, Weygandt, & Warfield, 2011, p. 1213). With a
component of future prediction in pension expense, companies have great concern over the
uncontrollable and unexpected swings of this account. These unexpected changes in pension
9
expense can result from “(1) sudden and large changes in the fair value of assets and (2) changes
in actuarial assumptions that affect the amount of the projected benefit obligation. The
substantial gains and losses from these fluctuations could impact the financial statements in the
period of realization.” (Kieso, Weygandt, & Warfield, 2011, p. 1223).
In addition, given that changes in pension expense are not usually due to company
performance, it is likely that the market doesn’t put much weight on this information. Company
decisions made on pension such as change in its pension plan may affect pension expense greatly,
but are considered as one-time events. Earnings under such situations have little persistence.
With the stated observations, the hypothesis was made:
H4: Earnings with large changes in pension expense are less informative.
4. RESEARCH DESIGN
This section describes the empirical model, variables, and test methodology used in the
study. The tests were conducted by examining the relationship between stock prices and earnings
data. The data have come from annual financial statements as well as stock prices over the period
2009-2011 and are taken from the Standard & Poor’s Compustat file. The general hypothesis is
that the greater the change in magnitude of the specified component within earnings, the less
informative is the earnings number.
4.1 Empirical Model
To test the hypotheses, the following general regression model was used:
10
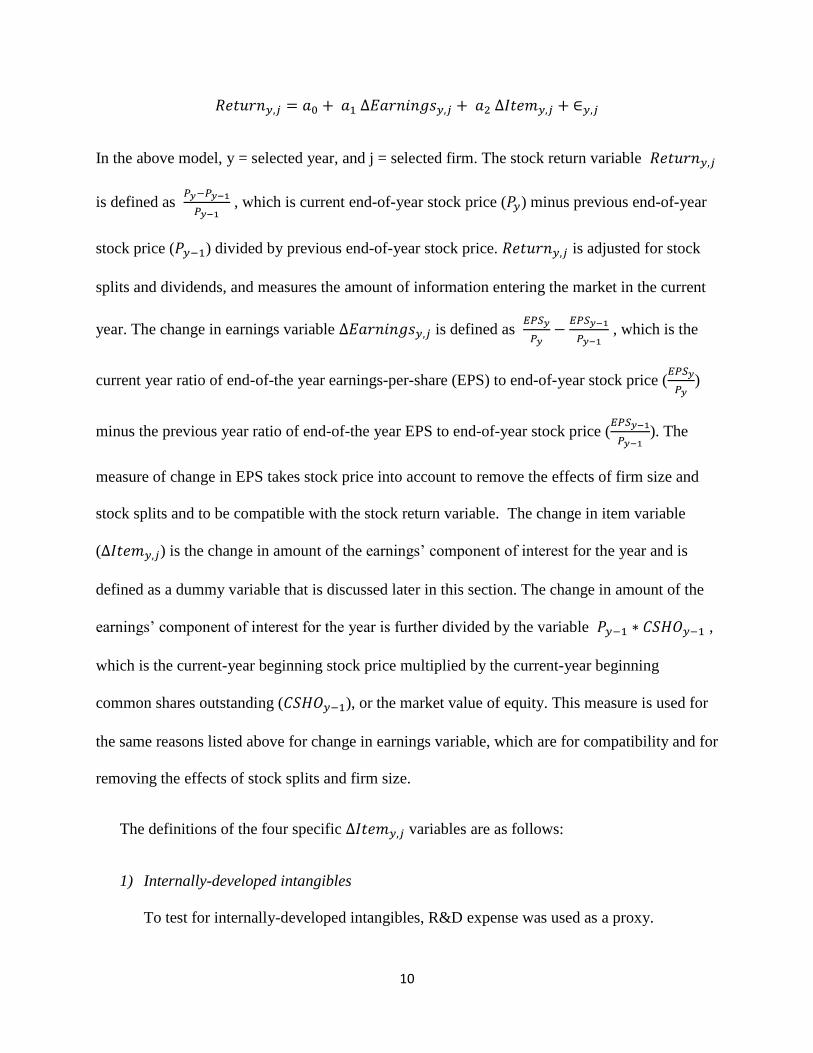
In the above model, y = selected year, and j = selected firm. The stock return variable
is defined as
, which is current end-of-year stock price ( ) minus previous end-of-year
stock price ( ) divided by previous end-of-year stock price. is adjusted for stock
splits and dividends, and measures the amount of information entering the market in the current
year. The change in earnings variable is defined as
, which is the
current year ratio of end-of-the year earnings-per-share (EPS) to end-of-year stock price (
)
minus the previous year ratio of end-of-the year EPS to end-of-year stock price (
). The
measure of change in EPS takes stock price into account to remove the effects of firm size and
stock splits and to be compatible with the stock return variable. The change in item variable
( ) is the change in amount of the earnings’ component of interest for the year and is
defined as a dummy variable that is discussed later in this section. The change in amount of the
earnings’ component of interest for the year is further divided by the variable ,
which is the current-year beginning stock price multiplied by the current-year beginning
common shares outstanding ( ), or the market value of equity. This measure is used for
the same reasons listed above for change in earnings variable, which are for compatibility and for
removing the effects of stock splits and firm size.
The definitions of the four specific variables are as follows:
1) Internally-developed intangibles
To test for internally-developed intangibles, R&D expense was used as a proxy.
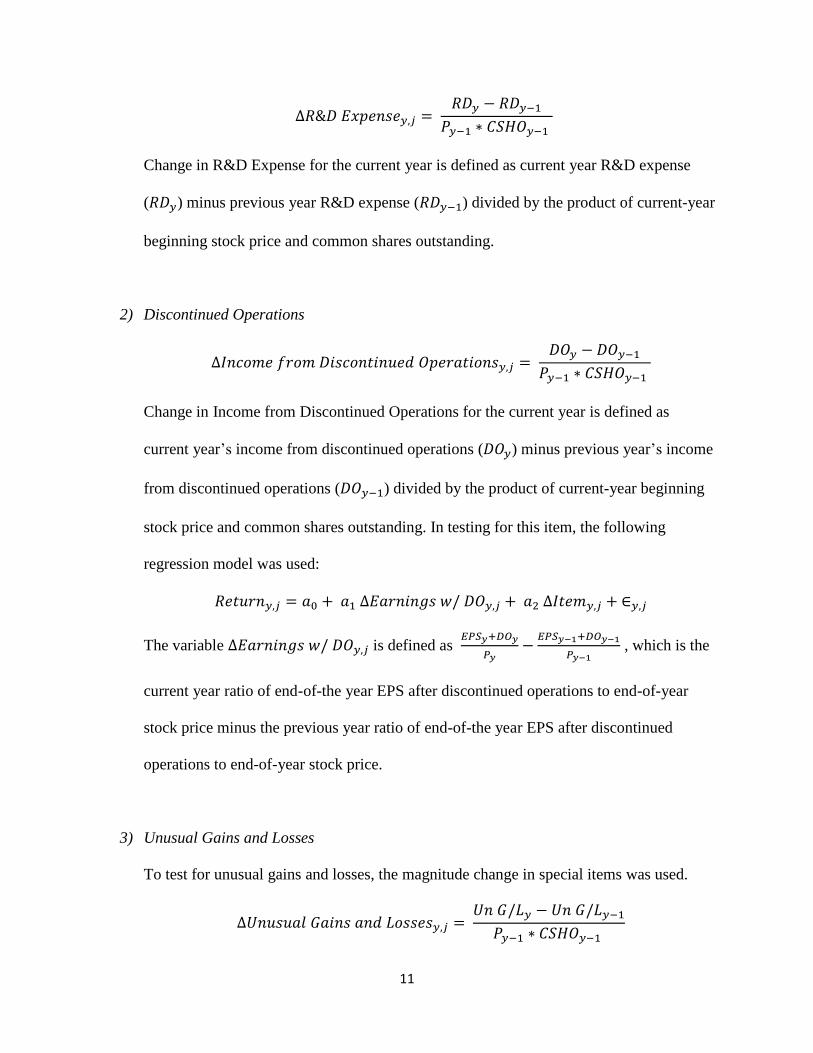
11
Change in R&D Expense for the current year is defined as current year R&D expense
( ) minus previous year R&D expense ( ) divided by the product of current-year
beginning stock price and common shares outstanding.
2) Discontinued Operations
Change in Income from Discontinued Operations for the current year is defined as
current year’s income from discontinued operations ( ) minus previous year’s income
from discontinued operations ( ) divided by the product of current-year beginning
stock price and common shares outstanding. In testing for this item, the following
regression model was used:
The variable is defined as
, which is the
current year ratio of end-of-the year EPS after discontinued operations to end-of-year
stock price minus the previous year ratio of end-of-the year EPS after discontinued
operations to end-of-year stock price.
3) Unusual Gains and Losses
To test for unusual gains and losses, the magnitude change in special items was used.

12
Change in Unusual Gains and Losses for the current year is defined as current year
unusual gains and losses ( ) minus previous year unusual gains and losses
( ) divided by the product of current-year beginning stock price and common
shares outstanding.
4) Pension Expense
Change in Pension Expense for the current year is defined as current year pension
expense ( ) minus previous year pension expense ( ) divided by the product of
current-year beginning stock price and common shares outstanding.
In addition to the four variables, dummy variables are created to reflect the
change in earnings according to the degree of magnitude change of these earnings components.
A dummy variable is used to replace each tested variable in the original regression
model. For each analysis of selected earnings’ component in the selected year, 400
“data points” that have the largest magnitude change are identified. 200 are the largest positive
magnitude change, and the other 200 are the largest negative magnitude change. The dummy
variable is used in conjunction with the change in earnings variable to test how the magnitude
change in the earnings’ components affect the correlation between the change in price and
change in earnings.
With the dummy variable replacement, the new regression model became:

13
As seen in the model, the variable is multiplied to the variable to test the
effect it has on the change in earnings. In the model, a1 measures the association between stock
returns and change in earnings and a2 measures the incremental association between stock
returns and the change in earnings due to the large magnitude change of the designated earnings’
component. Dummy = 1for the 400 selected data points with the largest magnitude change, and
Dummy = 0 for the rest of the data points. The coefficient a2 is expected to be negative, since a
large magnitude change of the selected earnings component is expected to reduce correlation
between the earnings number and stock price change.
The hypotheses are:
The goal is to reject Ho, the null hypothesis that earnings capture information more
effectively with greater magnitude change in the selected earnings’ components, at a 95%
confidence level. The regression analyses are done using the data analysis package embedded in
Microsoft Office Excel 2007 and are done individually for each earnings components of interest
in each selected year(s).
5. RESULTS
Table 1 shows the descriptive statistics of the variables used in the regression analyses.
Since the data for the Return and ∆EPS variables are not normally distributed and are by nature
negative-skewed, a truncation was done to the Return and ∆EPS data by the top and bottom 1%
to remove outliers. With the truncation, the standard deviations for the Return, ∆EPS, and ∆EPS
14
w/ DO data are 0.7854, 0.4631, and 2.1054, respectively. The truncation significantly brings
down the standard errors for these variables and makes the results less susceptible to the
influence of a small number of extreme observations. As a result, the regression analyses of the
change in item variables were conducted with the Return, ∆EPS, and ∆EPS w/ DO data after the
truncation. The data used is from the years 2009-2011. It is interesting to note that in year 2010
the market had a positive mean return and change in earnings of 0.1319 and 0.0074, respectively.
However, in year 2011, the market had a negative mean return and change in earnings of -0.0997
and 0.0042 that reflected the financial crisis started in year 2009. With the two-year data, one
year situated in a positive market situation and another in a negative market situation, the results
are more generalizable. In the following, the results of the four components of interest are
presented.
5.1 Research and Development Expense
The results for Research and Development Expense are found in Table 2. For both the
individual years (Panels B and C) and the two-year (Panel A) regressions, results show that the
coefficients (a2) on ∆R&D Dummy*∆EPS are negative. The results imply that the positive
coefficient (a1) of Returns and ∆EPS can be reduced by a2, and this is interpreted as a decrease in
effectiveness of ∆EPS. The hypothesis (H1) is earnings with large changes in R&D expense are
less informative, or less effective in capturing information. The results come out as expected
with regard to sign but are not statistically significant, as can be seen from the p-value.
During the test, unexpected data relationships were observed between the change in
earnings and change in R&D expense. There are many data points where there was an increase in
R&D expense and an increase in earnings. There are also data in which there was a decrease in

15
R&D expense and a decrease in earnings. Generally, the expectation is that the change in R&D
expense has a negative correlation with change in earnings. The unexpected, however, can be
explained by firms’ tendency to invest more in R&D when they post more earnings – since more
earnings mean more cash available – and invest less in R&D when they post lower earnings. If
such is the case, the results are not unexpected. The observations further imply there might be
other factors affecting R&D expense that are not considered in the regression model.
5.2 Income from Discontinued Operations
In Table 3, the results are consistent with the hypothesis. Hypothesis (H2) states that
earnings with a large change in income from discontinued operations are less informative. As
expected, coefficient a2 is negative with both the single-year and two-year data. This shows that
with a large change in income from discontinued operations, earnings decrease their
effectiveness in capturing information. The EPS measure used in this context is EPS after
income from discontinued operations. The results are very significant and support H2.
5.3 Unusual Gains and Losses
Prior research has reported evidence that “non-recurring” items reduce the quality of
earnings. This prior finding was tested with the methodology used in the paper and the results are
seen in Table 4. The results are statistically significant and not only support the hypothesis, but
also confirm the validity of the methodology used in this study. The hypothesis (H3) is earnings

16
with a large change in the magnitude of unusual gains and losses are less informative. To test this
hypothesis, change in amount of special items was used.
5.4 Pension Expense
Lastly, the results for pension expense are seen in Table 5. For the single year regressions,
year 2010’s result doesn’t come out statistically significant, but year 2011’s result does. The
combined two-year analysis gives a result that is marginally significant at p<.10. A possible
explanation for the lack of significance in the results can be that changes in pension liability are
shielded by accounting rules. When there is a large change in pension benefit obligation (PBO),
accounting rules require accountants to apply a technique that initially books the fluctuated
amount of pension to other comprehensive income. As a result, substantial gains and losses are
not reflected in earnings immediately, but only gradually, using a smoothing technique. The
accounting rules are set in place for the purpose of avoiding big earnings changes in reaction to
large changes in pension liability. A lack of statistical significance in the results shows the
effectiveness of the smoothing technique, since the data of changes in pension expense used in
the regressions are those after the application of smoothing. The regression analyses, therefore,
are not able to fully reflect the results of diminish effectiveness in earnings due to the sudden and
large changes in pension liabilities.
6. CONCLUSION
The purpose of this paper is to identify some situations in which the earnings number is
less useful in valuing firms. The study specifically looked at situations when changes in

17
internally-developed intangibles, income from discontinued operations, unusual gains and losses,
and pension expense within earnings are of large magnitude. The regression analyses are
conducted using the data analysis package embedded on Microsoft Office Excel 2007. The
results are generally consistent with the hypotheses, though some are statistically significant and
some are not. Regression analyses for income from discontinued operations and unusual gains
and losses gave significant results, but regression analyses for internally-developed intangibles
and pension expense did not. The insignificant results of internally-developed intangibles can be
explained by the limitation of tests; there were only limited variables considered in the empirical
model. The insignificant results of pension expense can be explained by the accounting rules
required to reduce the effects of sudden substantial changes in pension liabilities.
There were many limitations to this study. The biggest limitation is the time-constraint.
This study was constrained to a time limit and was done in a year. The tests were done on
Microsoft Office Excel 2007, and the tool itself has limitations, such as the allowed amount of
data input and restricted availability of statistical methods. Also, the dataset only covers two
years, which is a very small sample to generalize a finding. If there was more time, more
variables could be identified and factored into the regression to investigate the reasons behind the
insignificant results of internally-developed intangibles and pension expense, and perhaps
develop new insights. More time would also allow using a bigger dataset and more powerful
tools for analyses.
There are further study opportunities. Many questions remained unanswered, such as:
What is the threshold of the identified situations that will start to trigger the decrease in earnings’
effectiveness? What are some possible solutions to solve the problem of decrease in earnings’

18
informativeness? Answers to these questions can impact how professionals generate information
and how users perceive accounting information.

19
7. References
Ball, R., & Brown, P. (1968). An Empirical Evaluation of Accounting Income Numbers. Journal
of Accounting Research, 159-178.
Elliott, J. A., & Hanna, J. D. (1996). Repeated Accounting Write-Offs and the Information
Content of Earnings. Journal of Accounting Research, 135-155.
Financial Accounting Standards Board. (2008). Statement of Financial Accounting Concepts
No.5.
Financial Accounting Standards Board. (2010). Statement of Financial Accounting Concepts
No.8.
Kieso, D. E., Weygandt, J. J., & Warfield, T. D. (2011). Intermediate Accounting. Hoboken, NJ:
John Wiley & Sons, Inc.
Nicholas, D. C., & Wahlen, J. M. (December 2004). How Do Earnings Numbers Relate to Stock
Returns? A Review of Classic Accounting Research with Updated Evidence. ACCOUNTING
HORIZONS, 263–286.
Rapoport, M. (2003, February 25). How Corporate Pension Plans Affect Earnings: a Primer.
Retrieved from The Wall Street Journal:
http://online.wsj.com/article/SB104618396426021800.html
Weil, J., & Liesman, S. (2001, December 31). Stock Gurus Disregard Most Big Write-Offs, But
They Often Hold Vital Clues to Outlook. Retrieved from The Wall Street Journal:
http://online.wsj.com/article/SB1009751659819982640.html

20
8. TABLES
TABLE 1
Descriptive Statistics
- N Mean Std. Dev. 25% Median 75%
Return 10905 1.4150 43.6198 -0.2386 0.0117 0.2837
∆EPS 10905 0.7612 288.1623 -0.0300 0.0053 0.0518
∆EPS w/ DO 10905 -2.1024 359.0574 -0.0486 0.0057 0.0754
∆R&D 5435 -0.0123 0.8193 -0.0002 0.0002 0.0062
∆DO 10904 0.0023 0.0038 0.0000 0.0000 0.0000
∆Un G/L 10742 -9.7025 1625.7807 -0.0055 0.0000 0.0059
∆PE 8074 -0.0459 0.0323 -0.0003 0.0001 0.0008
N is the number of observations without the missing values. The financial variables are
computed over the period 2009-2011. The variables are computed on the per-year basis. The data
are then combined to achieve the two-year result. Return is the percentage change in stock price
(COMPUSTAT item PRCC_F). ∆EPS is the change in ratio of earnings-per-share
(COMPUSTAT item EPSPX) to the stock price. ∆EPS w/ DO is the change in ratio of earnings-
per-share plus the income from discontinued operations (COMPUSTAT item DO) to the stock
price. ∆R&D is change in research and development expense (COMPUSTAT item XRD)
divided by the product of beginning share price and common shares outstanding (COMPUSTAT
item CSHO) of the previous year. ∆DO is change in income from discontinued operations
divided by the product of beginning share price and common shares outstanding of previous year.
∆Un G/L is change in special items (COMPUSTAT item SPI) divided by the product of
beginning share price and common shares outstanding. ∆PE is change in pension expense
(COMPUSTAT item XPR) divided by the product of beginning share price and common shares
outstanding.

21
TABLE 2
Regression Analysis for R&D Expense
Panel A: Year 2010&2011
Intercept ∆EPS ∆R&D Dummy*∆EPS Adj. R2
Coefficient 0.137*** 0.505*** -0.053 0.0529
(t-statistic) (13.04) (13.00) (-0.95)
Panel B: Year 2010
Intercept ∆EPS ∆R&D Dummy*∆EPS Adj. R2
Coefficient 0.305*** 0.497*** -0.033 0.0415
(t-statistic) (16.88) (7.84) (-0.38)
Panel C: Year 2011
Intercept ∆EPS ∆R&D Dummy*∆EPS Adj. R2
Coefficient -0.038*** 0.354*** -0.071 0.0438
(t-statistic) (-3.78) (9.00) (-1.22)
* significant at p<.1 (two-tailed)
** significant at p<.05 (two-tailed)
*** significant at p<.001 (two-tailed)

22
TABLE 3
Regression Analysis for Income from Discontinued Operations
Panel A: Year 2010&2011
Intercept ∆EPS w/ DO ∆DO Dummy*∆EPS w/ DO Adj. R2
Coefficient 0.137*** 0.101*** -0.080*** 0.0225
(t-statistic) (16.55) (14.87) (-9.96)
Panel B: Year 2010
Intercept ∆EPS w/ DO ∆DO Dummy*∆EPS w/ DO Adj. R2
Coefficient 0.300*** 0.143*** -0.118*** 0.0319
(t-statistic) (21.57) (12.77) (-9.09)
Panel C: Year 2011
Intercept ∆EPS w/ DO ∆DO Dummy*∆EPS w/ DO Adj. R2
Coefficient -0.034*** 0.040*** -0.032*** 0.0225
(t-statistic) (-4.09) (5.83) (-3.78)
* significant at p<.1 (two-tailed)
** significant at p<.05 (two-tailed)
*** significant at p<.001 (two-tailed)

23
TABLE 4
Regression Analysis for Unusual Gains and Losses
Panel A: Year 2010&2011
Intercept ∆EPS ∆Un G/L Dummy*∆EPS Adj. R2
Coefficient 0.132*** 0.400*** -0.140*** 0.0381
(t-statistic) (16.40) (16.98) (-4.20)
Panel B: Year 2010
Intercept ∆EPS ∆Un G/L Dummy*∆EPS Adj. R2
Coefficient 0.283*** 0.456*** -0.193*** 0.0349
(t-statistic) (20.71) (11.70) (-3.66)
Panel C: Year 2011
Intercept ∆EPS ∆Un G/L Dummy*∆EPS Adj. R2
Coefficient -0.027*** 0.252*** -0.078** 0.0274
(t-statistic) (-3.35) (10.36) (-2.14)
* significant at p<.1 (two-tailed)
** significant at p<.05 (two-tailed)
*** significant at p<.001 (two-tailed)

24
TABLE 5
Regression Analysis for Pension Expense
Panel A: Year 2010&2011
Intercept ∆EPS ∆PE Dummy*∆EPS Adj. R2
Coefficient 0.106*** 0.366*** -0.062* 0.0456
(t-statistic) (16.30) (16.37) (-1.67)
Panel B: Year 2010
Intercept ∆EPS ∆PE Dummy*∆EPS Adj. R2
Coefficient 0.243*** 0.366*** -0.036 0.0392
(t-statistic) (22.43) (10.28) (-0.66)
Panel C: Year 2011
Intercept ∆EPS ∆PE Dummy*∆EPS Adj. R2
Coefficient -0.038*** 0.256*** -0.113** 0.0330
(t-statistic) (-5.79) (10.83) (-2.70)
* significant at p<.1 (two-tailed)
** significant at p<.05 (two-tailed)
*** significant at p<.001 (two-tailed)


![Fuzzy Logic, Informativeness and Bayesian Decision-Making ... · arXiv:math/0610876v1 [math.GM] 28 Oct 2006 Fuzzy Logic, Informativeness and Bayesian Decision-Making Problems Peter](https://img.pdfslide.us/doc/110x75/5e3d445f624afc47794ef204/fuzzy-logic-informativeness-and-bayesian-decision-making-arxivmath0610876v1.jpg)