Embed Size (px)
Citation preview
Full Terms & Conditions of access and use can be found athttps://www.tandfonline.com/action/journalInformation?journalCode=rero20
Economic Research-Ekonomska Istraživanja
ISSN: 1331-677X (Print) 1848-9664 (Online) Journal homepage: https://www.tandfonline.com/loi/rero20
Accounting quality and stock priceinformativeness: a cross-country study
Adriana Tiron-Tudor & Andra Maria Achim (Nasca)
To cite this article: Adriana Tiron-Tudor & Andra Maria Achim (Nasca) (2019) Accountingquality and stock price informativeness: a cross-country study, Economic Research-EkonomskaIstraživanja, 32:1, 2481-2499, DOI: 10.1080/1331677X.2019.1650655
To link to this article: https://doi.org/10.1080/1331677X.2019.1650655
© 2019 The Author(s). Published by InformaUK Limited, trading as Taylor & FrancisGroup
Published online: 18 Aug 2019.
Submit your article to this journal
Article views: 303
View related articles
View Crossmark data
Accounting quality and stock price informativeness: across-country study
Adriana Tiron-Tudor and Andra Maria Achim (Nasca)
The Faculty of Economics and Business Administration, Accounting and Audit Department, Babes-Bolyai University, Cluj-Napoca, Romania
ABSTRACTThis study investigates how accounting quality impacts theincorporation of firm-specific information into stock prices. Usingdata from 18 developed countries that apply IFRS, during theperiod 2004–2015, we find strong evidence that supports thehypothesis that accounting quality determines stock price inform-ativeness. The results yield important policy implications becausestock prices are a valuable source of information for many users,especially for the management of the listed companies. The studyreveals accounting quality’s direct influence over the stock priceinformativeness, in the way that along with the improvement ofaccounting quality also increases the amount of firm-specificinformation embedded into stock prices.
ARTICLE HISTORYReceived 31 March 2018Accepted 22 October 2018
KEYWORDSAccounting quality; IFRS;financial reporting; stockprice informativeness;synchronicity; idiosyn-cratic volatility
JEL CLASSIFICATIONSM41; G14; G15
1. Introduction and motivation
The Global Financial Crisis and various corporate scandals (Enron, WorldCom,Tyco) underline the relevance of international accounting and financial reportingstandards (IFRS), which help to prevent frauds and to avoid management mistakes(Uyar, Gungormus, & Kuzey, 2017). Moreover, transparency is one of the core princi-ples of good corporate governance, promoting the report of material facts in realtime to the stakeholders and by this contributing to more confidence in the manage-ment. Concerning the financial aspects of a business, transparency can be maintainedusing IFRS (WEF, GCR 2014–2015). That is why we choose to include in our sampleonly countries that report accordingly to IFRS. Also, companies adopting IFRS haveless earnings management, more timely loss recognition and more value relevance ofearnings, all of which can be interpreted as evidence of higher accounting quality.Barth, Landsman, and Lang (2008) and Ball (2006) argue that a key benefit of IFRSto investors is a better-quality accounting. In line with these facts, our paper
CONTACT Adriana Tiron-Tudor [email protected]� 2019 The Author(s). Published by Informa UK Limited, trading as Taylor & Francis Group.This is an Open Access article distributed under the terms of the Creative Commons Attribution License (http://creativecommons.org/licenses/by/4.0/), which permits unrestricted use, distribution, and reproduction in any medium, provided the original work isproperly cited.
ECONOMIC RESEARCH-EKONOMSKA ISTRA�ZIVANJA2019, VOL. 32, NO. 1, 2481–2499https://doi.org/10.1080/1331677X.2019.1650655
examines the role that accounting quality has on the type of information that incor-porates into stock prices across a sample of developed markets.
The final product of accounting is represented by the financial reports, and forthis reason, the accounting quality is considered in this paper interchangeablewith financial reporting quality. The non-existence of a generally accepted defin-ition or measurement method for financial reporting quality encourages research-ers to study, propose and validate in different contexts a variety of indicators.
We use four indicators of financial reporting quality which are found in TheGlobal Competitiveness Report (GCR) 2014–2015: the strength of auditing and report-ing standards; the strength of investor protection; the efficacy of corporate boardsand the protection of minority shareholders’ interests. Recently, papers such asBoolaky (2012), Boolaky and Cooper (2015) and Nurunnabi (2017) have used theseindicators. The GCR 2014–2015 issued by the World Economic Forum provides acomparative qualitative picture of the economic and business environments of 144individual countries. The report measures a great variety of indicators grouped in 12pillars which form the Global Competitiveness Index (GCI). The survey questions areassessed on a 7-point Likert scale, where 1 is the lowest possible and 7 the highestpossible. Moreover, these four variables compound the aggregate indicator namedAccountability which was also used as a proxy for accounting quality.
Information about fundamentals of a firm is capitalised into stock prices in twoways: through a general revaluation of stock values following the release of publicinformation and through the trading activity of risk arbitrageurs who gather and pos-sess private information (Durnev, Morck, Yeung, & Zarowin, 2003). Research showsthat financial markets impact the real economy through the information that real-decision makers learn from stock prices and use it to guide their decisions andactions (Bond, Edmans, & Goldstein, 2012). The real-decision makers in case of com-panies are the management teams. Managers can learn from market prices becauseeven if they are the most informed agents about a specific firm, they can still misssome information which could be in possession of outsiders. That is why, stock priceinformativeness is of high interest for the management. In our study, we have usedthe most popular measures of stock price informativeness: stock price synchronicityand idiosyncratic volatility. The reason for using both measures is that stock pricesynchronicity and idiosyncratic volatility are not equivalent in measuring the incorp-oration of firm-specific information into the stock prices. As Li, Rajgopal, andVenkatachalam (2014) demonstrate, these measures may lead to contradictory infer-ences, especially if there is a correlation between the systematic risk and the variableof interest (e.g., earning quality or governance quality). Therefore, stock price syn-chronicity and idiosyncratic volatility should not be viewed as interchange-able measures.
Our findings exhibit a negative connection between accounting quality and stockprice synchronicity. Also, our results show that accounting quality is positively corre-lated to idiosyncratic volatility. These are consistent with Morck, Yeung, and Yu (2000)and Cheong and Zurbruegg (2016). Morck et al. (2000) show that among developedstock markets, higher firm-specific returns variation is associated with stronger publicinvestor property rights and accounting standards are negatively correlated with
2482 A. TIRON-TUDOR AND A. M. ACHIM (NASCA)
synchronicity. Cheong and Zurbruegg (2016) find that less firm-level informationreaches the market if the enforcement of the accounting standards is weak.
This study contributes to the literature by using a set of markets that have adoptedthe same disclosure rules and it highlights the importance of the compliance andenforcement of regime. Also, our paper fills the gap regarding the connectionbetween accounting quality and stock price informativeness in the case of IFRSadopters in the recent years.
The remainder of the paper is organised as follows. Section 2 offers a view of thecurrent state of the literature regarding the analysed subject. Section 3 describes thedata and the methodology of research. The results are provided in Section 4 andSection 5 contains concluding remarks and observations on possible future research.
2. Literature review
2.1. Country-level determinants of accounting quality
Recent empirical work shows that country-level accounting quality is relevant to usersof financial information. The increased trend in the globalisation of business andfinancial markets demands higher-quality financial information produced understrong auditing and reporting standards (Boolaky, Krishnamurti, & Hogue, 2013).Several studies have examined the impact of firm-level factors upon the quality ofaccounting information. Anyway, the research in this field states that country-levelfactors are much more significant in explaining cross-country variations in earningsquality (Davis-Friday, 2010).
Chen, Tang, Jiang, and Lin (2010) examine the relationship between accountingquality and International Financial Reporting Standards (IFRS) in Europe and suggestthat accounting standards play a role in improving the quality of reporting. The IFRSstandards are a set of high-quality accounting standards which aim to improve thefinancial reporting quality for the adopters and enhance the quality of public disclos-ure. They are expected to give significant benefits to the capital market, which inturn, to allow more firm-specific information to incorporate into stock prices. If regu-lations are weak, firms may choose not to disclose information or to manipulate it(Boolaky, Krishnamurti, & Hogue, 2013). More than 140 countries currently permitor require IFRS. Since the announcement of IFRS adoption, national accounting dif-ferences have decreased, and the present international accounting setting provides anopportunity to examine why there are differences in earnings quality (Houqe, vanZijl, Dunstan, & Karim, 2012).
Research suggests that the IFRS standards improve the comparability of firmsacross markets, increase the efficiency of capital allocation (Armstrong, Barth,Jagolinzer, & Riedl, 2010; Covrig, Defond, & Hung, 2007), provide greater disclosureand enhance transparency (Barth et al., 2008; Daske, Hail, Leuz, & Verdi, 2008).Boolaky et al. (2013) view the strength of auditing and reporting standards as an inte-gral component of institutional transparency that is relevant for businesses, investorsand governments. Good accounting and audit regulations improve transparencythrough better disclosure of information and easier cross-firm comparisons.
ECONOMIC RESEARCH-EKONOMSKA ISTRA�ZIVANJA 2483

Investors typically obtain certain rights or powers that are protected by theenforcement of regulations and laws. For example, disclosure and accounting rulesprovide investors with the information they need to exercise their rights (La Porta,Lopez-de-Silanes, Shleifer, & Vishny, 2000). Houqe et al. (2012) notice that stronginvestor protection, strong legal enforcement and a common law legal system are fun-damental determinants of high-quality financial statement numbers. There is anexhaustive research that sustains these ideas (Ball, Kothari, & Robin, 2000; Ball,Robin, & Wu, 2003; Daske, Hail, Leuz, & Verdi, 2008; Francis & Wang, 2008; LaPorta, Lopez-de-Silanes, Shleifer, & Vishny, 1997, 1998, La Porta et al., 2000; Leuz,Nanda, & Wysocki, 2003).
Investor protection encourages the development of financial markets. La Portaet al. (1997) argue that countries that protect shareholders have more valuable stockmarkets, larger numbers of listed securities per capita, and a higher rate of initialpublic offering (IPO) activity than do have the unprotective countries.
Greater financial disclosure, higher-quality earnings, and greater information dissem-ination are associated with more informative stock prices. Additional tests indicate thaton average stock price informativeness is greater in countries with strong investor pro-tection (Haw, Hu, Lee, & Wu, 2012). Durnev et al. (2003) believe that more inform-ative stock prices lead to efficient allocation of capital because they reflect greater firm-specific information and capture more closely the firm’s fundamental value.
Regarding the relationship between investor protection and accounting quality,Houqe et al. (2012) demonstrate that earnings quality increases for mandatory IFRSadoption when a country’s investor protection regime provides stronger protection.Improvement of accounting quality depends on at least two factors: high-qualityaccounting standards and a country’s overall investor protection (Soderstrom & Sun,2007). Leuz, Nanda, and Wysocki (2003) examine the relationship between investorprotection and earnings management across 31 countries and they found that stronginvestor protection at the country level reduces earnings management practices andthus leads to higher accounting quality. There is research (Bhattacharya, Daouk, &Welker, 2003; Bushman, Piotroski, & Smith, 2004) which states that in countries withstrong investor protection regimes there are greater financial transparency and lessearnings management, these countries having higher accounting quality. Ball et al.(2003) argue that adopting high-quality accounting standards is a necessary conditionfor acquiring high-quality information, without being a sufficient one without aproper country-level investor protection.
The importance of corporate boards has been viewed as a key element in monitor-ing the actions of management and serving the interests of shareholders (Doirye,2012). The level of board effectiveness and efficacy in scrutinising managers dependon the size and composition of the board. Doirye (2012) considers that corporateboards are more effective when outsiders dominate. Cheng and Courtenay (2006)suggest that board efficacy increases the level of voluntary disclosure.
Protection of minority shareholders’ interests measures the strength of minorityshareholders protections against misuse of corporate assets by directors for their per-sonal gain, as well as shareholders rights, governance safeguards and corporate trans-parency requirements that reduce the risk of abuse. Investor protection matter for the
2484 A. TIRON-TUDOR AND A. M. ACHIM (NASCA)

ability of companies to raise the capital needed to grow, innovate, diversify and com-pete. Economies that have dynamic capital markets tend to effectively protect invest-ors. In these economies, investors receive the financial information they can trust,they participate in major decisions of the companies, and directors are accountablefor their managerial decisions (Dahya, Dimitrov, & McConnell, 2008).
2.2. Stock price informativeness and accounting data
Price efficiency is defined as the extent to which market prices are informative aboutthe value of traded assets. Stock price informativeness shows the amount of informa-tion about future earnings that is capitalised into the price (Durnev et al., 2003). Apopular measure to distinguish between the amount of firm-specific and market-wideinformation that is impounded into stock prices can be found in the paper of Roll(1988), who uses the R2 from a market model regression as an indicator of stockreturn synchronicity. A low R2 indicates that more firm-specific information isimpounded into the stock price and thus the stock price is more informative (Todea& Buglea, 2017). The higher the R2, the greater the stock is synchronous with generalmarket movements (Cheong & Zurbruegg, 2016). Stock returns reflect new market-level and firm-level specific information. Roll (1988) makes clear that the extent towhich stocks move together depends on the relative amounts of firm-level and mar-ket-level information capitalised into stock prices.
Following the methodology elaborated by Roll (1988), Morck et al. (2000) find thatstock prices move together more in poor economies than in the richer ones and thataccounting standards are negatively correlated with synchronicity. They state that, ifaccounting data is more useful, then more firm-specific information is available to allinvestors. Consequently, we might observe more firm-specific price variation in coun-tries with better accounting standards.
Further on, Durnev et al. (2003) find that greater firm-specific stock return variationis associated with more informative stock prices, where stock price informativeness isdefined as how much information stock prices contain about future earnings. Usingstock returns from 40 stock markets from 1990 to 2001, Jin and Myers (2006) showthat the lack of transparency increases R2 by shifting firm-specific risk to managers.They consider that imperfect protection of investors does not affect synchronicity if thefirm is entirely transparent, some degree of opaqueness being desirable. Others, likeCheong and Zurbruegg (2016) analyse the role that audit quality has on the type ofinformation analysts impound into stock prices across a sample of developed andemerging markets. They examine the amount of firm-specific information versus mar-ket-wide information that incorporates into stock prices using stock return synchron-icity. They conclude that irrespective of the disclosure regime in place, less firm-levelinformation reaches the market if the enforcement of the accounting standards is weak.
2.3. The real effects of the financial markets
Some researchers consider that one of the most important topics in financial econom-ics is whether financial markets affect the real economy (Bond et al., 2012). They
ECONOMIC RESEARCH-EKONOMSKA ISTRA�ZIVANJA 2485

design their research starting from a few questions: ‘Is the stock-market just a side-show or does it affect real economic activity? How can one explain the attentiondevoted to secondary financial markets? Why do managers constantly track the per-formance of their firms’ stocks? Why does the press so frequently report the develop-ments in the stock-markets?’ They consider that treating secondary market prices as aside-show is a mistake because real-decision makers learn new information fromthese prices and use it to guide their real decisions. Also, Hayek (1945) argued thatprices are a useful source of information. Prices aggregate various pieces of informa-tion which real-decision makers use in taking actions.
Moreover, decision makers can pay a lot of attention to market prices even if theydo not learn from these when they are party to contracts that are contingent on stockprices. Another possibility, preferred by proponents of behavioural finance, is thatsecondary-market prices have a real effect on economic activity because real-decisionmakers irrationally follow the price and use it as an anchor (Bond et al., 2012).
According to Fama and Miller (1972), an efficient market ‘has a very desirable fea-ture. In particular, at any point in time market prices of securities provide accurate sig-nals for resource allocation; that is, firms can make production-investment decisions’.Bond et al. (2012) consider that this idea is quite natural, because if prices are effi-cient and aggregate information from various sources, then decision makers in thereal sector, who are likely to be only partially informed, will wish to learn from thesemarket prices.
3. Data and research methodology
3.1. Accounting quality
Following the paper aim, to capture the way through which accounting quality influ-ences the incorporation of firm-specific information into the stock prices, the studyassesses the accounting quality by using the below four individual indicators anaggregate indicator Accountability which is the equally weighted average of all thefour variables stated previously. All these variables are extracted from The GlobalCompetitiveness Report 2014–2015.
1. The strength of auditing and reporting standards (SARS) is computed using a surveythat asks the leading business executives from 144 countries the following question:‘In your country, how strong are financial auditing and reporting standards?’ Theanswer is based on a Likert scale, with one implying a negative answer to the ques-tion, and seven a very positive one. SARS is a measure of financial reporting qual-ity and auditing strength based on the perception of the business executives fromthe selected countries. Also, SARS is a proxy for institutional transparency which isexpected to have a major bearing on the quality of financial information producedby companies in each country (WEF, GCR 2009–2010).
2. The strength of investor protection variable is a combination of the Extent ofdisclosure index (transparency of transactions), the Extent of director liabilityindex (liability for self-dealing), and the Ease of shareholder suit index (share-holders’ ability to sue officers and directors for misconduct).
2486 A. TIRON-TUDOR AND A. M. ACHIM (NASCA)

3. The efficacy of corporate boards is based on the answers provided by businessexecutives to the following question: ‘In your country, how would you character-ise corporate governance by investors and boards of directors?’ The answer isbased on a Likert scale, with one implying management has little accountabilityto investors and boards, and seven implying management is highly accountableto investors and boards.
4. Protection of minority shareholders’ interests is computed starting from the ques-tions: ‘In your country, to what extent are the interests of minority shareholdersprotected by the legal system?’ The answer is also based on a Likert scale, withone suggesting that these are not at all protected, and seven implyingfull protection.
We expect a positive relationship between all these indicators of accounting qualityand stock price informativeness. The stronger are the auditing and reporting stand-ards, the investor protection, the efficacy of corporate boards and the protection ofminority shareholders’ rights, the more firm-specific information incorporates intothe stock prices. The descriptive statistics of the accounting quality variables for eachcountry from the sample are displayed in Table 1.
3.2. Stock price informativeness
We assess stock price informativeness through the use of two alternative measures:stock price synchronicity (Wj) and idiosyncratic volatility (logðr2
l;jÞ).We follow Morck et al. (2000) and we estimate annually the two-factor inter-
national model:
ri;j;t ¼ ai;j þ b1;irL;j;t þ b2;irW;t þ li;j;t (1)
where ri;j;t is the weekly return of stock i of country j in week t of a year, rL;j;t is theweekly market return of country j in week t; and rW;t is the world global marketreturn in week t: To analyse the relationship between the indicators of accountingquality and firm-specific information in our sample we use the coefficient of deter-mination R2 which is a measure of stock price synchronicity. According to Morcket al. (2000), a lower value of R2 indicates that more firm-specific information isimpounded into the stock price and, this way, the stock price is more informative.
Given the cross-country nature of this analysis, we use an equally weighted averageof the coefficients of determination of the individual stocks in the country j and applya logistic transformation to these variables:
Wj ¼ logR2j
1� R2j
!(2)
Morck et al. (2000) show that Wj can be decomposed into market-wide variationðlogðr2
M;jÞÞ and firm-specific variation (logðr2l;jÞ):
ECONOMIC RESEARCH-EKONOMSKA ISTRA�ZIVANJA 2487
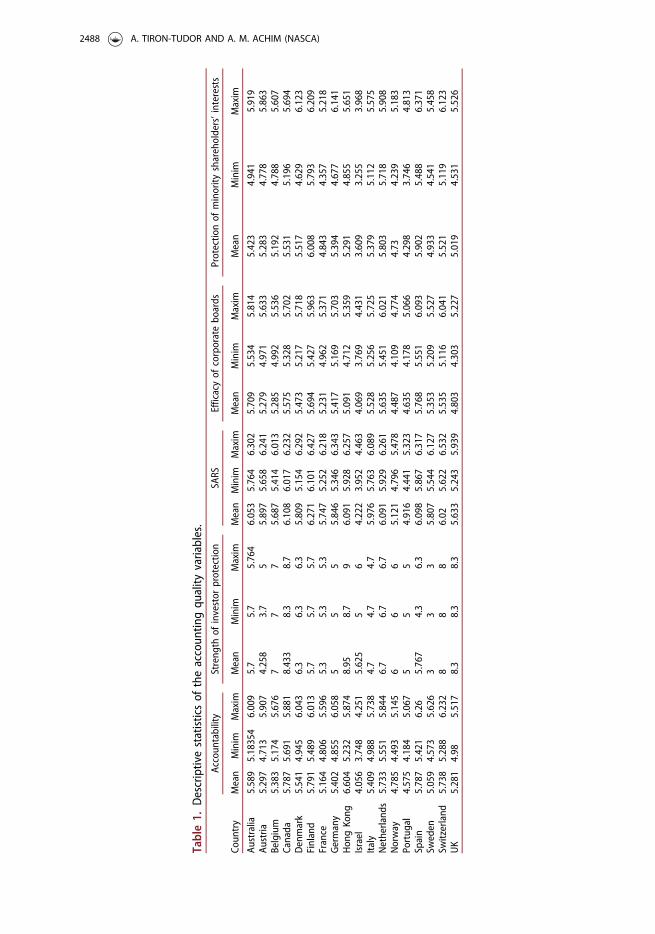
Table1.
Descriptivestatisticsof
theaccoun
tingqu
ality
variables.
Coun
try
Accoun
tability
Streng
thof
investor
protectio
nSA
RSEfficacyof
corporatebo
ards
Protectio
nof
minority
shareholders’interests
Mean
Minim
Maxim
Mean
Minim
Maxim
Mean
Minim
Maxim
Mean
Minim
Maxim
Mean
Minim
Maxim
Australia
5.589
5.18354
6.009
5.7
5.7
5.764
6.053
5.764
6.302
5.709
5.534
5.814
5.423
4.941
5.919
Austria
5.297
4.713
5.907
4.258
3.7
55.897
5.658
6.241
5.279
4.971
5.633
5.283
4.778
5.863
Belgium
5.383
5.174
5.676
77
75.687
5.414
6.013
5.285
4.992
5.536
5.192
4.788
5.607
Canada
5.787
5.691
5.881
8.433
8.3
8.7
6.108
6.017
6.232
5.575
5.328
5.702
5.531
5.196
5.694
Denmark
5.541
4.945
6.043
6.3
6.3
6.3
5.809
5.154
6.292
5.473
5.217
5.718
5.517
4.629
6.123
Finland
5.791
5.489
6.013
5.7
5.7
5.7
6.271
6.101
6.427
5.694
5.427
5.963
6.008
5.793
6.209
France
5.164
4.806
5.596
5.3
5.3
5.3
5.747
5.252
6.218
5.231
4.962
5.371
4.843
4.357
5.218
Germany
5.402
4.855
6.058
55
55.846
5.346
6.343
5.417
5.169
5.703
5.394
4.677
6.141
Hon
gKong
6.604
5.232
5.874
8.95
8.7
96.091
5.928
6.257
5.091
4.712
5.359
5.291
4.855
5.651
Israel
4.056
3.748
4.251
5.625
56
4.222
3.952
4.463
4.069
3.769
4.431
3.609
3.255
3.968
Italy
5.409
4.988
5.738
4.7
4.7
4.7
5.976
5.763
6.089
5.528
5.256
5.725
5.379
5.112
5.575
Netherland
s5.733
5.551
5.844
6.7
6.7
6.7
6.091
5.929
6.261
5.635
5.451
6.021
5.803
5.718
5.908
Norway
4.785
4.493
5.145
66
65.121
4.796
5.478
4.487
4.109
4.774
4.73
4.239
5.183
Portug
al4.575
4.184
5.067
55
54.916
4.441
5.323
4.635
4.178
5.066
4.298
3.746
4.813
Spain
5.787
5.421
6.26
5.767
4.3
6.3
6.098
5.867
6.317
5.768
5.551
6.093
5.902
5.488
6.371
Sweden
5.059
4.573
5.626
33
35.807
5.544
6.127
5.353
5.209
5.527
4.933
4.541
5.458
Switzerland
5.738
5.288
6.232
88
86.02
5.622
6.532
5.535
5.116
6.041
5.521
5.119
6.123
UK
5.281
4.98
5.517
8.3
8.3
8.3
5.633
5.243
5.939
4.803
4.303
5.227
5.019
4.531
5.526
2488 A. TIRON-TUDOR AND A. M. ACHIM (NASCA)

Wj ¼ logr2M;j
r2l;j
!¼ log r2M;j
� �� log r2l;j
� �(3)
The variable logðr2l;jÞ is the logarithm of the average explained sum of squares
from Eq. (1). A higher value of logðr2l;jÞ indicates that more firm-specific information
is incorporated into the stock price.
3.3. Data and control variables
This study is conducted on a balanced panel of 18 developed countries during the periodJanuary 2004 – December 2015. We follow the approach of Cheong and Zurbruegg(2016) and include in the sample only countries that at the date of the analysis haveadopted International Financial Reporting Standards. The reason for selecting only coun-tries that apply IFRS is to ensure that the accounting standards regime is, as much aspossible, the same across our sample, so that any differences in reporting quality wouldbe a result of institutional features of the market, independent of the disclosure standards.Moreover, to maintain the results unaltered by large cross-section differences, werestricted the sample to developed markets only due to their low synchronicity comparedto emerging markets and low firm-specific and market-wide variations.
The sample includes only constituents of the stock market indexes that were continu-ously traded during the period of the study, because as Kelly (2014) states, even in the caseof these markets, low-R2 stocks are small, young and covered by few analysts. Weekly equityprices for each local stock market index and for the world global market index are denomi-nated in dollars and are extracted from Thomson Reuters Eikon Database. The world globalmarket index is represented by the MSCI World Index, which is a broad global equity indexthat represents large and mid-cap equity performance of 23 developed market countries. Itdescribes the performance of the world’s stock market and does not offer exposure toemerging markets. The summary statistics of our sample are displayed in Table 2.
Table 2. Summary statistics of the sample. The R2 and r2l;j are averages of annual measures ofsynchronicity and idiosyncratic volatility.No. Country Stock index Number of stocks R2 r2l;j1 Australia ASX50 41 0.314 0.001162 Austria ATX 18 0.398 0.001493 Belgium BEL20 15 0.387 0.000934 Canada TSX60 57 0.299 0.001385 Denmark OMXC20 16 0.335 0.001336 Finland OMXH25 21 0.448 0.001197 France CAC40 33 0.484 0.000888 Germany DAX 27 0.471 0.001059 Hong Kong HIS 44 0.412 0.0013710 Israel TA35 26 0.311 0.0013811 Italy FTSE MIB 30 0.460 0.0013612 Netherlands AEX 19 0.449 0.0009513 Norway OBX 21 0.367 0.0025314 Portugal PSI20 15 0.335 0.0012215 Spain IBEX35 23 0.525 0.0009016 Sweden OMXS30 28 0.467 0.0009917 Switzerland SMI 20 0.485 0.0008218 UK FTSE100 82 0.361 0.00125
ECONOMIC RESEARCH-EKONOMSKA ISTRA�ZIVANJA 2489

Prior research (Fernandes & Ferreira, 2009; Jin & Myers, 2006; Morck et al.,2000) suggest that countries’ characteristics have an influence on stock return syn-chronicity and the incorporation of information into stock prices. To control forthese factors and also for robustness purposes, we include in our paper eightcountry-level control variables: diversity; government effectiveness and control ofcorruption; GDP per capita; GDP growth volatility; number of stocks; countrysize; industry Herfindahl index and firm Herfindahl index. Most of the variablesare extracted from the World Bank Database and Thomson Reuters EikonDatabase, except the Herfindahl indexes, which are determined based on all thestocks listed on the sample markets.
a. Diversity is constructed following Jin and Myers (2006). This variable representsthe standard deviation of analysts’ forecasts of the firm’s earnings in the follow-ing year, normalised by the mean forecast and divided by the square root of thenumber of analysts following that firm. A high level of Diversity implies greateropaqueness:
Diversity ¼ rs=lsffiffiffiffiN
p
b. Government effectiveness and control of corruption (Gov_Corr) is an aggregateindicator, computed by using the data provided in The Worldwide GovernanceIndicators (WGI) project. Government effectiveness reflects perceptions of thequality of public services; the quality of the civil service and the degree of itsindependence from political pressures; the quality of policy formulation andimplementation; and the credibility of the government’s commitment to suchpolicies. Control of corruption captures perceptions of the extent to which publicpower is exercised for private gain, including both petty cash and grand forms ofcorruption, as well as “capture” of the state by elites and private interests (Kraay,Kaufmann, & Mastruzzi, 2010).
c. GDP per capita. Stock prices in economies with high per capita GDP move in arelatively unsynchronised manner, while stock prices in low per capita GDPeconomies tend to move up or down together. GDP per capita is a measure ofeconomic development, and by using it, we control for differences between coun-tries in their economic welfare.
d. GDP growth volatility. The variance of per capita GDP serves to control formacroeconomic instability.
e. The number of stocks. In a market with few securities, each security is a moreimportant part of the market index. Thus, higher synchronicity could simplyreflect fewer traded stocks. To control for these effects, we use the logarithm ofthe number of listed stocks from each market.
f. Country size. Country size could matter in at least two ways. First, economicactivity in a small country could be geographically localised, so that the nearbyevents might have market-wide effects that would not be as evident in a largercountry. Second, Bernstein and Weinstein (2002) observe the economic special-isation predicted by standard international trade theory across geographical units
2490 A. TIRON-TUDOR AND A. M. ACHIM (NASCA)

of similar size, but not across countries. This finding implies that larger stateshave factor endowments that exhibit less uniformity, which, in turn, suggests thatthe stocks in large countries might move more independently than those in smallcountries. Consequently, we use the logarithm of geographical size, in square kil-ometres, for each country, to capture any relation between country size and syn-chronicity in stock returns.
g. Industry Herfindahl Index and h) Firm Herfindahl Index. Economic specialisationmight appear in the economies where listed firms are concentrated in a fewindustries. In consequence, these firms could have highly correlated fundamentalsand highly synchronous stock prices. Undiversified economies should, therefore,exhibit higher stock price synchronicity than the diversified ones. Alternatively,some economies may be dominated by a few very large firms. If most other listedfirms are suppliers or customers of these dominant companies, a high degree ofstock price synchronicity could arise. Problems that would be firm-specific in alarger economy can potentially impact the entire economy.
To control for these economic specialisation effects, we construct an industryHerfindahl index and a firm Herfindahl index for each country form the sample. Wedefine the industry Herfindahl index of country j as below:
Hj ¼X
kh2k;j;
where hk,j is the combined value of the sales of all country j firms in industry k as apercentage of those of all country j firms.
The firm Herfindahl index of country j is defined as below:
HJ ¼X
i^h2i2j ;
where hi,j is the sales of firm i as a percentage of the total sales of all country j firms.High values of the industry and firm Herfindahl indexes imply respectively, a lack
of industry diversity and the dominance of a few large firms. Roll (1988) finds thathigh industry or high firm concentration, as captured by Herfindahl indexes, partlyexplains the high volatility of some stock market indices.
4. Results and discussion
The OLS estimation results for several regressions in which the endogenous variableis stock price synchronicity (Wj) are presented in Table 3.
In model (1) the coefficient of investor protection variable is negative and signifi-cant at the 1% level. This result suggests that stock price synchronicity is lower wheninvestors are better protected. In other words, stock prices contain more firm-specificinformation when investor protection is higher. Model (2) presents a negative coeffi-cient of the strength of auditing and reporting standards variable which is significantat the 1% level. This implies that stock price synchronicity is lower when the strengthof auditing and reporting standards is higher. Consequently, auditing and financial
ECONOMIC RESEARCH-EKONOMSKA ISTRA�ZIVANJA 2491
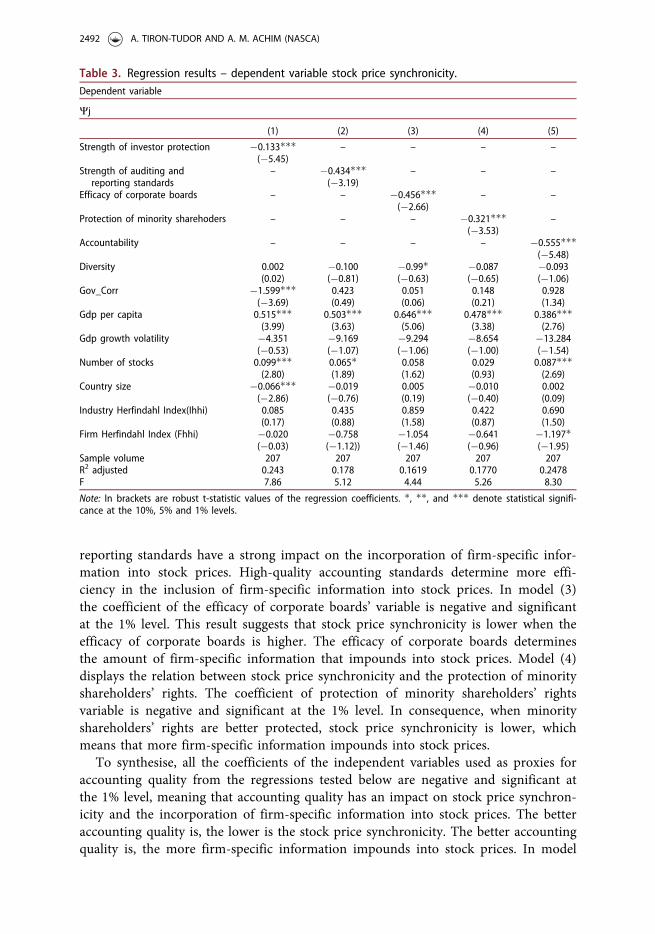
reporting standards have a strong impact on the incorporation of firm-specific infor-mation into stock prices. High-quality accounting standards determine more effi-ciency in the inclusion of firm-specific information into stock prices. In model (3)the coefficient of the efficacy of corporate boards’ variable is negative and significantat the 1% level. This result suggests that stock price synchronicity is lower when theefficacy of corporate boards is higher. The efficacy of corporate boards determinesthe amount of firm-specific information that impounds into stock prices. Model (4)displays the relation between stock price synchronicity and the protection of minorityshareholders’ rights. The coefficient of protection of minority shareholders’ rightsvariable is negative and significant at the 1% level. In consequence, when minorityshareholders’ rights are better protected, stock price synchronicity is lower, whichmeans that more firm-specific information impounds into stock prices.
To synthesise, all the coefficients of the independent variables used as proxies foraccounting quality from the regressions tested below are negative and significant atthe 1% level, meaning that accounting quality has an impact on stock price synchron-icity and the incorporation of firm-specific information into stock prices. The betteraccounting quality is, the lower is the stock price synchronicity. The better accountingquality is, the more firm-specific information impounds into stock prices. In model
Table 3. Regression results – dependent variable stock price synchronicity.Dependent variable
Wj
(1) (2) (3) (4) (5)
Strength of investor protection �0.133���(�5.45)
– – – –
Strength of auditing andreporting standards
– �0.434���(�3.19)
– – –
Efficacy of corporate boards – – �0.456���(�2.66)
– –
Protection of minority sharehoders – – – �0.321���(�3.53)
–
Accountability – – – – �0.555���(�5.48)
Diversity 0.002(0.02)
�0.100(�0.81)
�0.99�(�0.63)
�0.087(�0.65)
�0.093(�1.06)
Gov_Corr �1.599���(�3.69)
0.423(0.49)
0.051(0.06)
0.148(0.21)
0.928(1.34)
Gdp per capita 0.515���(3.99)
0.503���(3.63)
0.646���(5.06)
0.478���(3.38)
0.386���(2.76)
Gdp growth volatility �4.351(�0.53)
�9.169(�1.07)
�9.294(�1.06)
�8.654(�1.00)
�13.284(�1.54)
Number of stocks 0.099���(2.80)
0.065�(1.89)
0.058(1.62)
0.029(0.93)
0.087���(2.69)
Country size �0.066���(�2.86)
�0.019(�0.76)
0.005(0.19)
�0.010(�0.40)
0.002(0.09)
Industry Herfindahl Index(Ihhi) 0.085(0.17)
0.435(0.88)
0.859(1.58)
0.422(0.87)
0.690(1.50)
Firm Herfindahl Index (Fhhi) �0.020(�0.03)
�0.758(�1.12))
�1.054(�1.46)
�0.641(�0.96)
�1.197�(�1.95)
Sample volume 207 207 207 207 207R2 adjusted 0.243 0.178 0.1619 0.1770 0.2478F 7.86 5.12 4.44 5.26 8.30
Note: In brackets are robust t-statistic values of the regression coefficients. �, ��, and ��� denote statistical signifi-cance at the 10%, 5% and 1% levels.
2492 A. TIRON-TUDOR AND A. M. ACHIM (NASCA)
(5) the coefficient of Accountability is negative and significant at the 1% level.Accountability is the aggregate indicator of financial reporting quality and impoundsthe former variables tested before. The result suggests that stock price synchronicityis lower when accounting quality is higher. In other words, accounting quality deter-mines the incorporation of firm-specific information into stock prices, in the waythat along with the improvement of accounting quality also increases the amount offirm-specific information embedded into stock prices.
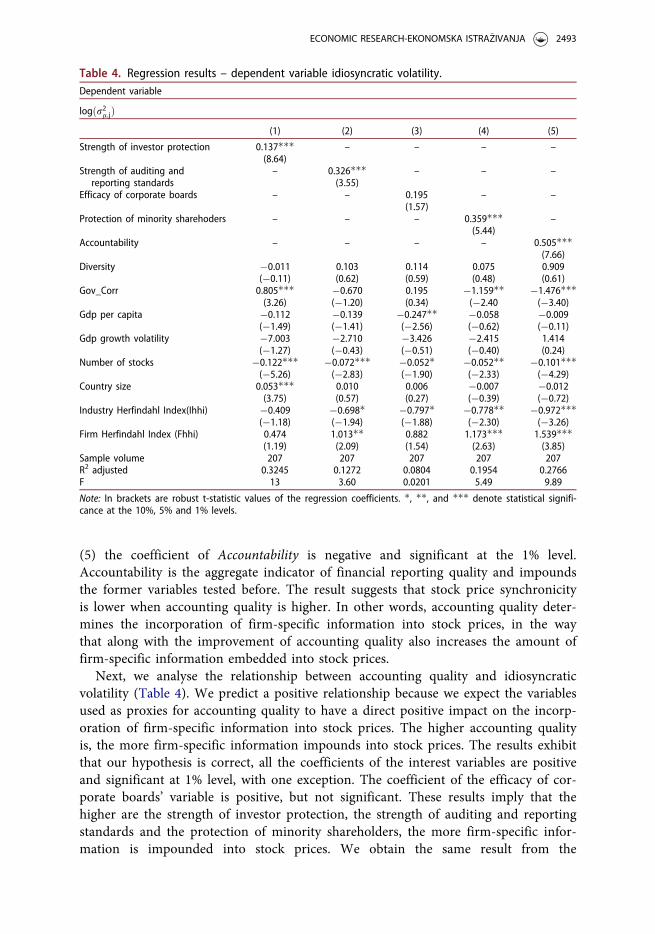
Next, we analyse the relationship between accounting quality and idiosyncraticvolatility (Table 4). We predict a positive relationship because we expect the variablesused as proxies for accounting quality to have a direct positive impact on the incorp-oration of firm-specific information into stock prices. The higher accounting qualityis, the more firm-specific information impounds into stock prices. The results exhibitthat our hypothesis is correct, all the coefficients of the interest variables are positiveand significant at 1% level, with one exception. The coefficient of the efficacy of cor-porate boards’ variable is positive, but not significant. These results imply that thehigher are the strength of investor protection, the strength of auditing and reportingstandards and the protection of minority shareholders, the more firm-specific infor-mation is impounded into stock prices. We obtain the same result from the
Table 4. Regression results – dependent variable idiosyncratic volatility.Dependent variable
logðr2l;jÞ(1) (2) (3) (4) (5)
Strength of investor protection 0.137���(8.64)
– – – –
Strength of auditing andreporting standards
– 0.326���(3.55)
– – –
Efficacy of corporate boards – – 0.195(1.57)
– –
Protection of minority sharehoders – – – 0.359���(5.44)
–
Accountability – – – – 0.505���(7.66)
Diversity �0.011(�0.11)
0.103(0.62)
0.114(0.59)
0.075(0.48)
0.909(0.61)
Gov_Corr 0.805���(3.26)
�0.670(�1.20)
0.195(0.34)
�1.159��(�2.40
�1.476���(�3.40)
Gdp per capita �0.112(�1.49)
�0.139(�1.41)
�0.247��(�2.56)
�0.058(�0.62)
�0.009(�0.11)
Gdp growth volatility �7.003(�1.27)
�2.710(�0.43)
�3.426(�0.51)
�2.415(�0.40)
1.414(0.24)
Number of stocks �0.122���(�5.26)
�0.072���(�2.83)
�0.052�(�1.90)
�0.052��(�2.33)
�0.101���(�4.29)
Country size 0.053���(3.75)
0.010(0.57)
0.006(0.27)
�0.007(�0.39)
�0.012(�0.72)
Industry Herfindahl Index(Ihhi) �0.409(�1.18)
�0.698�(�1.94)
�0.797�(�1.88)
�0.778��(�2.30)
�0.972���(�3.26)
Firm Herfindahl Index (Fhhi) 0.474(1.19)
1.013��(2.09)
0.882(1.54)
1.173���(2.63)
1.539���(3.85)
Sample volume 207 207 207 207 207R2 adjusted 0.3245 0.1272 0.0804 0.1954 0.2766F 13 3.60 0.0201 5.49 9.89
Note: In brackets are robust t-statistic values of the regression coefficients. �, ��, and ��� denote statistical signifi-cance at the 10%, 5% and 1% levels.
ECONOMIC RESEARCH-EKONOMSKA ISTRA�ZIVANJA 2493

regression containing the aggregate indicator Accountability. The coefficient of theAccountability variable from the model is positive and significant at 1% level. Thissuggests that when accounting quality is at high standards, stock prices contain morefirm-specific information.
The exogenous variable of interest (the strength of investor protection; the strength ofauditing and reporting standards; the efficacy of corporate boards; protection of minorityshareholders’ interests; accountability) does not vary in time, unless in very few cases.That is why its inclusion in the model is equivalent to the introduction of fixed effects incross-section. This is the principal argument for using OLS in order to obtainthe estimators.
Regarding the endogenous variable, we notice there is a pattern that repeats overtime during the Global Crisis, synchronicity and idiosyncratic volatility are muchgreater during this period. For this reason, we additionally estimate the model con-taining the dummy variable for the Global Crisis of 2007-2008. According toWooldridge (2012, Chapter 15), for models estimated with OLS, we should often
Table 5. Regression results of the models containing the dummy variable for the GlobalEconomic Crisis – dependent variable synchronicity.Dependent variable
Wj
(1) (2) (3) (4) (5)
Strength of investor protection �0.134���(�5.57)
– – – –
Strength of auditing andreporting standards
– �0.531���(�3.70)
– – –
Efficacy of corporate boards – – �0.582���(�3.34)
– –
Protection of minority sharehoders – – – �0.465���(�4.66)
–
Accountability – – – – �0.716���(�6.65)
Diversity �0.057(�0.38)
�0.188(�1.08)
�0.180(�0.82)
�0.190(�0.99)
�0.223�(�1.81)
Gov_Corr �1.608���(�3.69)
0.894(1.00)
0.534(0.67)
0.980(1.30)
1.682��(2.35)
Gdp per capita 0.490���(3.79)
0.431���(3.10)
0.607���(4.74)
0.350��(2.45)
0.251�(1.81)
Gdp growth volatility 2.600(0.30)
1.317(0.15)
0.579(0.06)
4.952(0.56)
1.243(0.14)
Number of stocks 0.097���(2.77)
0.073��(2.16)
0.066�(1.89)
0.031(1.07)
0.102���(3.36)
Country size �0.074���(�3.26)
�0.027(�1.13)
0.005(0.18)
�0.014(�0.59)
�0.005(�0.22)
Industry Herfindahl Index(Ihhi) 0.031(0.06)
0.409(0.84)
0.968�(1.78)
0.422(0.90)
0.715(1.62)
Firm Herfindahl Index (Fhhi) 0.060(0.10)
�0.807(�1.20)
�1.232�(�1.71)
�0.776(�1.19)
�1.364��(�2.32)
Dummy Crisis0708 0.179���(2.56)
0.284���(3.75)
0.273���(3.54)
0.373���(4.63)
0.424���(5.43)
Sample volume 207 207 207 207 207R2 adjusted 0.2567 0.2093 0.1899 0.2244 0.3116F 8.44 5.75 5.25 6.38 9.60
Note: In brackets are robust t-statistic values of the regression coefficients. �, ��, and ��� denote statistical signifi-cance at the 10%, 5% and 1% levels.
2494 A. TIRON-TUDOR AND A. M. ACHIM (NASCA)

include time period dummy variables to allow for aggregate time effects. Thesedummy variables are exogenous and they act as their own instruments. Tables 5and 6 display the results of this model, depending on the endogenous variable. Theseestimations also check the robustness of our core findings.
The coefficients of all the variables of interest are significant at 1% level, with oneexception. The coefficient of the efficacy of corporate boards is not significant in rela-tion to idiosyncratic volatility. In Table 5 the dependent variable is stock price syn-chronicity. In this case, all the models tested exhibit negative coefficients of thevariables used as proxies for accounting quality. Consequently, our initial results aresustained as we find a negative relation between accounting quality and stock pricesynchronicity. Moreover, we notice that the dummy variable has positive coefficientssignificant at 1% level. Therefore, we can state that the Global Economic Crisis had astrong impact upon stock price synchronicity. The stock prices move together moreduring the Global Crisis, the firm-specific information being impounded into stockprices slower.
Table 6. Regression results of the models containing the dummy variable for the GlobalEconomic Crisis – dependent variable idiosyncratic volatility.Dependent variable
logðr2l;jÞ(1) (2) (3) (4) (5)
Strength of investor protection 0.136���(8.66)
– – – –
Strength of auditing andreporting standards
– 0.290���(3.12)
– – –
Efficacy of corporate boards – – 0.127(1.00)
– –
Protection of minority sharehoders – – – 0.353���(4.78)
–
Accountability – – – – 0.510���(6.99)
Diversity �0.064(�0.65)
0.070(0.45)
0.070(0.41)
0.071(0.45)
0.094(0.63)
Gov_Corr 0.797���(3.19)
�0.495(�0.88)
0.455(0.79)
�1.129��(�2.17)
�1.499���(�3.29)
Gdp per capita �0.134�(�1.79)
�0.166(�1.64)
�0.268���(�2.75)
�0.063(�0.64)
�0.005(�0.06)
Gdp growth volatility �0.865(�0.14)
1.187(0.16)
1.876(0.25)
�1.918(�0.28)
0.972(0.15)
Number of stocks �0.124���(�5.47)
�0.069���(�2.74)
�0.047�(�1.75)
�0.052��(�2.32)
�0.101���(�4.18)
Country size 0.046���(3.24)
0.007(0.39)
0.005(0.27)
�0.006(�0.39)
�0.011(�0.70)
Industry Herfindahl Index(Ihhi) �0.456(�1.36)
�0.708��(�2.00)
�0.738�(�1.76)
�0.778��(�2.30)
�0.973���(�3.25)
Firm Herfindahl Index (Fhhi) 0.546(1.42)
0.994��(2.08)
0.786(1.39)
1.168��(2.60)
1.544���(3.82)
Dummy Crisis0708 0.158���(3.10)
0.105�(1.67)
0.146��(2.24)
0.013(0.21)
�0.012(�0.20)
Sample volume 207 207 207 207 207R2 adjusted 0.3461 0.1362 0.0975 0.1956 0.2767F 12.65 3.68 2.70 5.14 8.94
Note: In brackets are robust t-statistic values of the regression coefficients. �, ��, and ��� denote statistical signifi-cance at the 10%, 5% and 1% levels.
ECONOMIC RESEARCH-EKONOMSKA ISTRA�ZIVANJA 2495

Table 6 contains the results of the models in which idiosyncratic volatility is theendogenous variable. In these cases, all the coefficients of the variables of interest arepositive. The coefficients of all the variables of interest are significant at 1% level,with one exception: the coefficient of the efficacy of corporate boards, which is notsignificant. These results suggest that there is a direct positive relationship betweenaccounting quality and idiosyncratic volatility even under the effects of the GlobalCrisis. When accounting quality is at high levels, the degree of firm-specific informa-tion impounded into stock prices is greater. As for the dummy variable for theGlobal Crisis, the results are mixed. The coefficients of the dummy variable appear tobe significant only in the first three models, at different levels of significance. Whentesting the relationship between idiosyncratic volatility and Accountability, the coeffi-cient of the dummy variable is not significant, meaning that, in this case, the GlobalCrisis does not impact the incorporation of firm-specific information intostock prices.
5. Conclusions
This paper extends the empirical literature on financial reporting quality by exploring itsrelationship to stock-price informativeness. Our proxies for financial accounting qualityare the strength of auditing and reporting standards; the strength of investor protection;the efficacy of corporate boards; and the protection of minority shareholders’ interests.We also use Accountability as an aggregate indicator of accounting quality. We use stockprice synchronicity and idiosyncratic volatility as proxies for stock price informativeness.
Using data from 18 developed national stock markets, our results show robust evi-dence supporting the hypothesis that financial reporting quality influences the co-movements of the shares listed on the capital market and the incorporation of firm-specific information into stock prices. The higher is the accounting quality, the morefirm-specific information can be found in the stock prices. The higher is the account-ing quality, the lower is stock price synchronicity.
The existence and direction of causality between financial reporting quality andstock price informativeness have implications for several users of financial informa-tion, as policy setters and the management of the companies. The policy setters maylearn from the effects of the accounting quality on the stock market and thus makeefforts for applying and maintaining International Financial Reporting Standards andInternational Auditing Standards, as these standards assure a certain level of reportingquality in a country. The real effects of financial markets determine the managementto pay great attention to the movements from the capital markets and to learn fromthe stock prices. The new information they obtain from stock prices can be used intheir decision-making process and could guide their actions.
The fact that financial markets have a real effect through the transmission of infor-mation does not imply that real-decision makers are less informed that traders, butonly that they do not have perfect information about every decision-relevant factor.This information can be in possession of outsiders. Thus, real-decision makers, suchas the management teams, may be the most informed agents in the economy about
2496 A. TIRON-TUDOR AND A. M. ACHIM (NASCA)

the firm, but there are still aspects about which they can learn from the outsiders(Bond et al., 2012).
We have included in our sample only developed countries, but the tested relation-ships are obviously an empirical question also on the emerging markets. We leavethis aspect for future research.
ORCID
Adriana Tiron-Tudor http://orcid.org/0000-0001-5530-5635
References
Armstrong, C. S., Barth, M. E., Jagolinzer, A. D., & Riedl, E. J. (2010). Market reaction to theadoption of IFRS in Europe. The Accounting Review, 85(1), 31–61. doi:10.2308/accr.2010.85.1.31
Ball, R. (2006). International financial reporting standards (IFRS): Pros and cons for investors.Accounting and Business Research, 36(sup1), 5–27. doi:10.1080/00014788.2006.9730040
Ball, R., Kothari, S. P., & Robin, A. (2000). The effect of institutional factors on properties ofaccounting earnings. Journal of Accounting and Economics, 29(1), 1–51. doi:10.1016/S0165-4101(00)00012-4
Ball, R., Robin, A., & Wu, J. S. (2003). Incentives versus standards: Properties of accountingincome in four East Asian countries. Journal of Accounting and Economics, 36(1–3),235–270. doi:10.1016/j.jacceco.2003.10.003
Barth, M. E., Landsman, W. R., & Lang, M. H. (2008). International accounting standards andaccounting quality. Journal of Accounting Research, 46(3), 432–467. doi:10.1111/j.1475-679X.2008.00287.x
Bernstein, J. R., & Weinstein, D. E. (2002). Do endowments predict the location of produc-tion? Evidence from national and international data. Journal of International Economics,56(1), 55–76.
Bhattacharya, U., Daouk, H., & Welker, M. (2003). The world price of earnings opacity. TheAccounting Review, 78(3), 641–678. doi:10.2308/accr.2003.78.3.641
Bond, P., Edmans, A., & Goldstein, I. (2012). The real effects of financial markets. AnnualReview of Financial Economics, 4(1), 339–360. doi:10.1146/annurev-financial-110311-101826
Boolaky, P. K. (2012). Auditing and reporting in Europe: An analysis using country-level data.Managerial Auditing Journal, 27(1), 41–65.
Boolaky, P. K., & Cooper, B. J. (2015). Comparing the strength of auditing and reportingstandards and investigating their predictors in Europe and Asia. Australian AccountingReview, 25(3), 292–308. doi:10.1111/auar.12058
Boolaky, P., Krishnamurti, C., & Hogue, A. (2013). Determinants of the strength of auditingand reporting standards: A cross-country study. Australasian Accounting, Business andFinance Journal, 7(4), 17–36. doi:10.14453/aabfj.v7i4.3
Bushman, R. M., Piotroski, J. D., & Smith, A. J. (2004). What determine corporate transpar-ency? Journal of Accounting Research, 42(2), 207–252. doi:10.1111/j.1475-679X.2004.00136.x
Chen, H., Tang, Q., Jiang, Y., & Lin, Z. (2010). The role of international financial reportingstandards in accounting quality: Evidence from the European Union. Journal ofInternational Financial Management & Accounting, 21, 220–278. doi:10.1111/j.1467-646X.2010.01041.x
Cheng, E. C. M., & Courtenay, S. M. (2006). Board composition, regulatory regime and volun-tary disclosure. The International Journal of Accounting, 41(3), 262–289. doi:10.1016/j.intacc.2006.07.001
ECONOMIC RESEARCH-EKONOMSKA ISTRA�ZIVANJA 2497
Cheong, C. S., & Zurbruegg, R. (2016). Analyst forecasts and stock price informativeness:Some international evidence on the role of audit quality. Journal of ContemporaryAccounting & Economics, 12(3), 257–273. doi:10.1016/j.jcae.2016.09.002
Covrig, V. M., Defond, M. L., & Hung, M. (2007). Home bias, foreign mutual fund holdings,and the voluntary adoption of international accounting standards. Journal of AccountingResearch, 45(1), 41–70. doi:10.1111/j.1475-679X.2007.00226.x
Dahya, J., Dimitrov, O., & McConnell, J. (2008). Dominant shareholders, corporate boards,and corporate value: A cross-country analysis. Journal of Financial Economics, 87(1),73–100. doi:10.1016/j.jfineco.2006.10.005
Daske, H., Hail, L., Leuz, C., & Verdi, R. S. (2008). Mandatory IFRS reporting around theworld: Early evidence on the economic consequences. Journal of Accounting Research, 46(5),1085–1142. doi:10.1111/j.1475-679X.2008.00306.x
Davis-Friday, P. Y. (2010). Discussion of ‘financial reporting quality in international settings:A comparative study of the U.S.A, Japan, Thailand, France and Germany. The InternationalJournal of Accounting, 45(1), 35–38. doi:10.1016/j.intacc.2010.01.002
Doryie, E. J. (2012). Corporate governance and stock price synchronicity (PhD thesis).University of Leeds, Leeds, West Yorkshire, England.
Durnev, A., Morck, R., Yeung, B., & Zarowin, P. (2003). Does greater firm-specific return vari-ation mean more or less informed stock pricing? Journal of Accounting Research, 41(5),797–836. doi:10.1046/j.1475-679X.2003.00124.x
Fama, E., & Miller, M. (1972). The theory of finance. New York: Dryden Press.Fernandes, N., & Ferreira, M. A. (2009). Insider trading laws and stock price informativeness.
Review of Financial Studies, 22(5), 1845–1887. doi:10.1093/rfs/hhn066Francis, J. R., & Wang, D. (2008). The joint effect of investor protection and big 4 audits on
earnings quality around the world. Contemporary Accounting Research, 25(1), 157–191. doi:10.1506/car.25.1.6
Haw, I., Hu, B., Lee, J., & Wu, W. (2012). The investor protection and price informativenessabout future earnings: International evidence. Review of Accounting Studies, 17(2), 389–419.doi:10.1007/s11142-012-9181-z
Hayek, F. (1945). The use of knowledge in society. American Economic Review, 35(4), 519–530.Houqe, M. N., van Zijl, T., Dunstan, K., & Karim, A. K. M. (2012). The effect of IFRS adop-
tion and investor protection on earnings quality around the world. The InternationalJournal of Accounting, 47(3), 333–355. doi:10.1016/j.intacc.2012.07.003
Jin, L., & Myers, S. C. (2006). R2 around the world: New theory and new tests. Journal ofFinancial Economics, 79(2), 257–292. doi:10.1016/j.jfineco.2004.11.003
Kelly, P. J. (2014). Information efficiency and firm-specific return variation. Quarterly Journalof Finance, 04(04), 1450018. doi:10.1142/S2010139214500189
Kraay, A., Kaufmann, D., & Mastruzzi, M. (2010). The worldwide governance indicators:Methodology and analytical issues. (Policy Research Working Paper No. WPS 5430). WorldBank.
La Porta, R., Lopez-de-Silanes, F., Shleifer, A., & Vishny, R. W. (2000). Agency problems anddividend policies around the World. The Journal of Finance, 55(1), 1–33. doi:10.1111/0022-1082.00199
La Porta, R., Lopez-de-Silanes, F., Shleifer, A., & Vishny, R. W. (1998). Law and finance.Journal of Political Economy, 16(6), 1113–1155. doi:10.1086/250042
La Porta, R., Lopez-de-Silanes, F., Shleifer, A., & Vishny, R. W. (1997). Legal determinants ofexternal finance. The Journal of Finance, 52(3), 1131–1150. doi:10.1111/j.1540-6261.1997.tb02727.x
Leuz, C., Nanda, D., & Wysocki, P. D. (2003). Earnings management and investor protection:An international comparison. Journal of Financial Economics, 69(3), 505–527. doi:10.1016/S0304-405X(03)00121-1
Li, B., Rajgopal, S., & Venkatachalam, M. (2014). R2 and Idiosyncratic Risk Are NotInterchangeable. The Accounting Review, 89(6), 2261–2295. doi:10.2308/accr-50826
2498 A. TIRON-TUDOR AND A. M. ACHIM (NASCA)

Morck, R., Yeung, B., & Yu, W. (2000). The information content of stock markets: Why doemerging markets have synchronous stock price movements? Journal of FinancialEconomics, 58(1-2), 215–260. doi:10.1016/S0304-405X(00)00071-4
Nurunnabi, M. (2017). Does cultural value affect board efficacy? Insights on international cor-porate governance. International Journal of Law and Management, 59(6), 1257–1268. doi:10.1108/IJLMA-09-2016-0081
Roll, R. (1988). R2. The Journal of Finance, 43, 541–566. doi:10.1111/j.1540-6261.1988.tb04591.x
Soderstrom, N. S., & Sun, K. J. (2007). IFRS adoption and accounting quality: A review.European Accounting Review, 16(4), 675–702. doi:10.1080/09638180701706732
Todea, A., & Buglea, A. M. (2017). Individualism and stock price reaction to market-wideinformation. Economics Letters, 160, 4–6. doi:10.1016/j.econlet.2017.07.028
Uyar, A., Gungormus, A. H., & Kuzey, C. (2017). Impact of the accounting information systemon corporate governance: Evidence from Turkish non-listed companies. AustralasianAccounting, Business and Finance Journal, 11(1), 9–27. doi:10.14453/aabfj.v11i1.3
Wooldridge, J. M. (2012). Introductory econometrics. A modern approach (5th ed.). USA:South-Western CENGAGE Learning.
ECONOMIC RESEARCH-EKONOMSKA ISTRA�ZIVANJA 2499