Embed Size (px)
Citation preview

An Empirical Analysis of Market Segmentation on U.S.
Equities Markets
© Copyright 2013,
10.3.13
An Empirical Analysis of Market
Segmentation on U.S. Equities Markets
F rank Hatheway
The NASDAQ OMX Group, Inc .
Amy Kwan
The Univers i ty o f New South Wales
Capi ta l Markets Cooperat ive Research Center
Hui Zheng*
The Univers i ty o f Sydney
Capi ta l Markets Cooperat ive Research Center

An Empirical Analysis of Market Segmentation on U.S.
Equities Markets
We thank NASDAQ OMX for providing the data for this research. The
data employed in this research are equivalent to the TAQ data publicly
available through databases such as WRDS. The views expressed herein
are not intended to represent the views of NASDAQ OMX, its employees,
or directors. The authors are solely responsible for the content, which is
provided for informational and educational purposes only. Nothing
contained herein should be construed as investment advice, either on
behalf of a particular security or an overall investment strategy.
DISCLAIMER
2

An Empirical Analysis of Market Segmentation on U.S.
Equities Markets
PREAMBLE
How do you tell whether any particular practice, regulation, or structural
change is beneficial to the market?
For example, the consensus is that in recent years,
•Competition among exchanges has increased,
• “Dark” market share has increased,
•High frequency trading has increased, and
•The bid ask spread has decreased.
Yet evaluating which of these trends, if any, is responsible for the decline in
spreads, or even whether declining spreads mean that overall trading
costs for all stocks are lower, remains a matter of faith as much as science.
Trading remains a complex multi-dimensional strategic interaction where
identifying causality, or even correlation, is extremely challenging.
3

An Empirical Analysis of Market Segmentation on U.S.
Equities Markets
PREAMBLE: NON-EXCHANGE TRADING GROWTH
OTC-share of trading has increased
in the last five years, from 15% of
total trading to over 35%.
Since September 2012, OTC levels
have exceeded 35% on 64 (out of
140) days.
Number of Securities: The number
of securities with >40% “OTC” share
has more than doubled in the past
year to over 49% of total stocks.
Number of Securities with over 40% OTC Market Share
Source: CTA, UTP. Direct Edge and BATS ECN trading
volumes removed from OTC/TRF totals.
4

An Empirical Analysis of Market Segmentation on U.S.
Equities Markets
Sample: 116 stocks listed on NYSE and NASDAQ
Sample period: Jan – March 2011
After controlling for market information asymmetry, we find
that trading in dark markets :
WHAT WE FIND
IN A NUTSHELL
5
Increases transaction costs;
A 10% increase in dark market share will lead to 4.4% increase in transaction costs market wide.
This is equivalent to $23 billion per year on the US markets
Reduces market price efficiency
The execution of large orders on dark markets does not
harm market quality

An Empirical Analysis of Market Segmentation on U.S.
Equities Markets
By design, the U.S. equity markets are now a rich
ecosystem of trading platforms with different participants,
polices, and practices.
WHAT ARE WE TALKING ABOUT?
FRAGMENTATION,
SEGMENTATION, AND
TRANSPARENCY
6
The platforms making up this ecosystem are becoming
increasingly tailored toward different segments of market
participants.
Choice is a good thing.
Look at how a market ecosystem characterized by choice
deals with the core problems of asymmetric information
and adverse selection.

An Empirical Analysis of Market Segmentation on U.S.
Equities Markets
HOW TO DEAL WITH
ASYMMETRIC
INFORMATION AND
ADVERSE SELECTION?
WHAT’S OLD IS NEW
7
Assume we divide the world in two, exchange markets
(exchanges) and dark pool venues (dark pools).
Exchange markets display prices, are open to all
participants, and offer standardized rules and practices
including a standardized tick.
Dark pool venues do not display prices, restrict access, and offer more flexibility in
rules and practices including relief from the standardized tick.
We think about the exchange model dealing with asymmetric information and
adverse selection by setting the width and depth of the spread but historical
practice included many other methods such as “the look”, “fading the quote”, and
“pre-positioning” among others.
We don’t know everything dark pool venues do to deal with asymmetric information
and adverse selection but we do know about payment-for-order-flow, counterparty
screening and toxicity ratings, IOIs, and other practices which are designed to
address these problems.

An Empirical Analysis of Market Segmentation on U.S.
Equities Markets
One selling point of dark trading is that an order should at
least try for a dark match knowing that any execution price
will have to be at least as good as is shown on lit markets.
WHAT IS THE ISSUE WITH SEGMENTATION?
WHAT’S THE HARM?
8
The prices of the lit markets are set by market makers’ quotes and investors’ orders.
Investors often price orders based on the market so market makers drive prices.
Quotes are based on the average profitability of a trade.
The orders which initially do better in the dark are those least costly to trade against, this
changes the average profitability of quotes. This drives a cycle of deteriorating lit
benchmark prices creating more incentives to try and do better by trading dark.
Obviously, lit trades will do worse. The research question is whether orders trading
dark also do worse because they are priced based on the lit markets’ prices.
Market making also moves to dark trading, as evidenced by the fact many dark venues
have a traded spread.

An Empirical Analysis of Market Segmentation on U.S.
Equities Markets
• Adverse Relationship
• CFA Institute (2012)*
• Zhu (2012)*
• Weaver (2011)
• Degryse, de Jong, and van Kervel (2011)
• Easley, Kiefer, and O’Hara (1996)
• Neutral Relationship
• Larrymore and Murphy (2009)
• Chung, Chuwonganant, and McCormick (2006)*
• Favorable Relationship
• O’Hara and Ye (2011)*
• Buti, Rindi, and Werner (2010a, 2010b)
• Gresse (2006)
LITERATURE SKETCH
NOT THE END OF THE STORY. NO CONSENSUS ON
SEGMENTATION AND MARKET QUALITY
9
* Indicates NASDAQ OMX provided data
An Empirical Analysis of Market Segmentation on U.S.
Equities Markets
TAQ equivalent Trade and Quote Data
1. Stratified sample of 116 Securities, 57 NASDAQ and 59 NYSE
1. HFT sample stocks less four stocks which were delisted by end of sample period.
2. Sample period 1/3/11 to 3/31/11
3. Data is from the Tape Plans and is scrubbed as follows:
1. Quotes with one sided quotes and with spreads lt 0.00 or gt $2.00 deleted
2. Only regular way trades 9:30:30 to 16:00:00
3. Winsorize trades outside the NBBO to be at the same side of the NBBO
4. Trade and quote matching
1. Exchange venues contemporaneous match
2. Dark pool venues trades matched with quotes 40ms prior.
3. Lee & Ready for buy/sell initiation
DATA SUMMARY
OUR CORE DATA IS FROM THE PUBLIC DOMAIN
10

An Empirical Analysis of Market Segmentation on U.S.
Equities Markets
DATA SUMMARY STATS
11

An Empirical Analysis of Market Segmentation on U.S.
Equities Markets
• Effective spreads
• Price Improvement
• Adverse Selection
• Realized Spread
• Hasbrouck Information Shares
DATA ANALYSIS
DOES THIS STRATIFIED SAMPLE LOOK LIKE WHAT WE’D
EXPECT FROM A LARGER SAMPLE?
12

An Empirical Analysis of Market Segmentation on U.S.
Equities Markets
RESULTS: EFFECTIVE SPREADS
½ SPREAD CONVENTION
13
Dark access fee assumed = 0
0
2
4
6
8
Small*** Medium*** Large***Effe
ctiv
e sp
read
(bp
s)
Quoted spread tercile
Effective Spreads w/ access fees
Light
Dark
*** significant at 0.1%
0
2
4
6
8
Small*** Medium*** Large*Effe
ctiv
e S
prea
d (b
ps)
Quoted spread tercile
Effective Spreads w/o Access Fees
Light
Dark
𝐸𝑓𝑓𝑒𝑐𝑡𝑖𝑣𝑒 𝑠𝑝𝑟𝑒𝑎𝑑𝑡 = 𝑞𝑡
𝑝𝑡 − 𝑚𝑡
𝑚𝑡+
𝑓𝑒𝑒
𝑚𝑡
*** significant at 0.1%
* significant at 5%
An Empirical Analysis of Market Segmentation on U.S.
Equities Markets
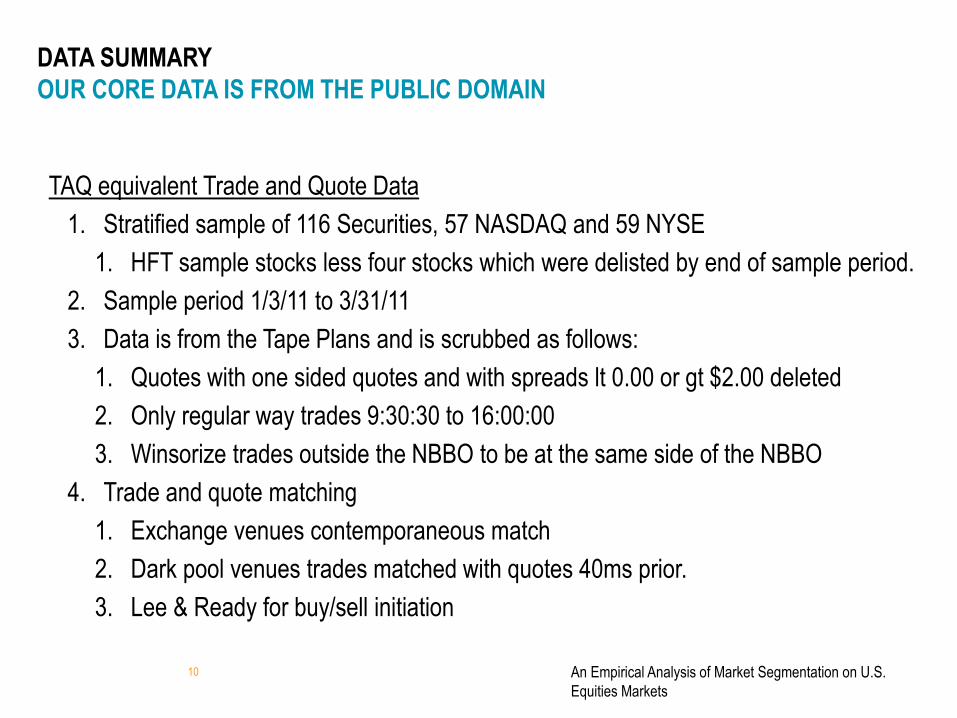
RESULTS: PRICE IMPROVEMENT DISTRIBUTION
Level
Price
improvement
(cents)
Lit Dark
Mean Median
Mean Median
Panel A: Full sample
1 0 83.61 86.32
50.48 49.58
2 0 < x ≤ 0.10 0.00 0.00
11.73 11.45
3 0.10 < x ≤ 0.20 0.00 0.00
2.68 2.29
4 0.20 < x ≤ 0.30 0.00 0.00
2.83 2.78
5 0.30 < x ≤ 0.40 0.00 0.00
1.18 1.00
6 0.40 < x < 0.50 0.00 0.00
0.51 0.37
7 0.5 1.66 1.43
12.38 11.65
8 0.50 < x < 0.60 0.00 0.00
0.13 0.08
9 0.60 ≤ x < 0.70 0.00 0.00
0.36 0.27
10 0.70 ≤ x < 0.80 0.00 0.00
0.45 0.46
11 0.80 ≤ x < 0.90 0.00 0.00
0.45 0.39
12 0.90 ≤ x < 1.00 0.00 0.00
0.16 0.12
13 1.00 ≤ x 14.73 12.14
16.64 17.49
14

An Empirical Analysis of Market Segmentation on U.S.
Equities Markets
RESULTS: ADVERSE SELECTION
0
2
4
6
8
Small Medium Large
Adv
erse
sel
ectio
n (b
ps)
Quoted spread tercile
Adverse Selection – 30 seconds
Lit
Dark
0
2
4
6
8
Small Medium LargeAdv
erse
sel
ectio
n (b
ps)
Quoted spread tercile
Adverse Selection – 5 minutes
Lit
Dark
All differences significant at 0.1%
𝐴𝑑𝑣𝑒𝑟𝑠𝑒 𝑠𝑒𝑙𝑒𝑐𝑡𝑖𝑜𝑛𝑡 = 𝑞𝑡
𝑚𝑡+30 − 𝑚𝑡
𝑚𝑡
All differences significant at 0.1%
15

An Empirical Analysis of Market Segmentation on U.S.
Equities Markets
RESULTS: REALIZED SPREADS AFTER REBATE
½ SPREAD CONVENTION
-1
1
3
5
7
Small Medium Large
Rea
lized
Spr
eads
(bp
s)
Quoted spread tercile
Realized Spreads – 30 seconds
Lit
Dark
-1
1
3
5
7
Small Medium LargeRea
lized
Spr
eads
(bp
s)
Quoted spread tercile
Realized Spreads – 5 minutes
Lit
Dark
All differences significant at 0.1%
Dark rebate assumed = 0
𝑅𝑒𝑎𝑙𝑖𝑧𝑒𝑑 𝑠𝑝𝑟𝑒𝑎𝑑𝑡 = 𝑞𝑡
𝑝𝑡 − 𝑚𝑡+30
𝑚𝑡 +
𝑟𝑒𝑏𝑎𝑡𝑒
𝑚𝑡
All differences significant at 0.1%
16

An Empirical Analysis of Market Segmentation on U.S.
Equities Markets
RESULTS: LAST SALE INFORMATION CONTRIBUTION TO MARKET PRICE
HASBROUCK (1995) 1 MINUTE SAMPLING INTERVAL
0%
10%
20%
30%
40%
50%
60%
70%
80%
90%
Large Medium Small
Info
rmat
ion
Sha
re
Stock Size tercile
∆p2,t = α2 + Σβ1,t−s∆P1,t−s + Σβ2,t−s∆P2,t−s + b2 P1,t−1 − P2,t−1 + ∆ε2,t
∆p1,t = α1 + Σβ1,t−s∆P1,t−s + Σβ2,t−s∆P2,t−s + b1 P1,t−1 − P2,t−1 + ∆ε1,t
17
All differences significant at 0.1%

An Empirical Analysis of Market Segmentation on U.S.
Equities Markets 18
Transaction Costs
Price Level
Trade Size
Total Trading
Activity
Market
Capitalization
Dark Trading
Quoted Spreads
Trading Risk
Confidential
THE 116 STOCK SAMPLE BEHAVES AS EXPECTED
NOW MODEL THE TRADING DECISION AND THE EFFECTIVE SPREAD
An Empirical Analysis of Market Segmentation on U.S.
Equities Markets
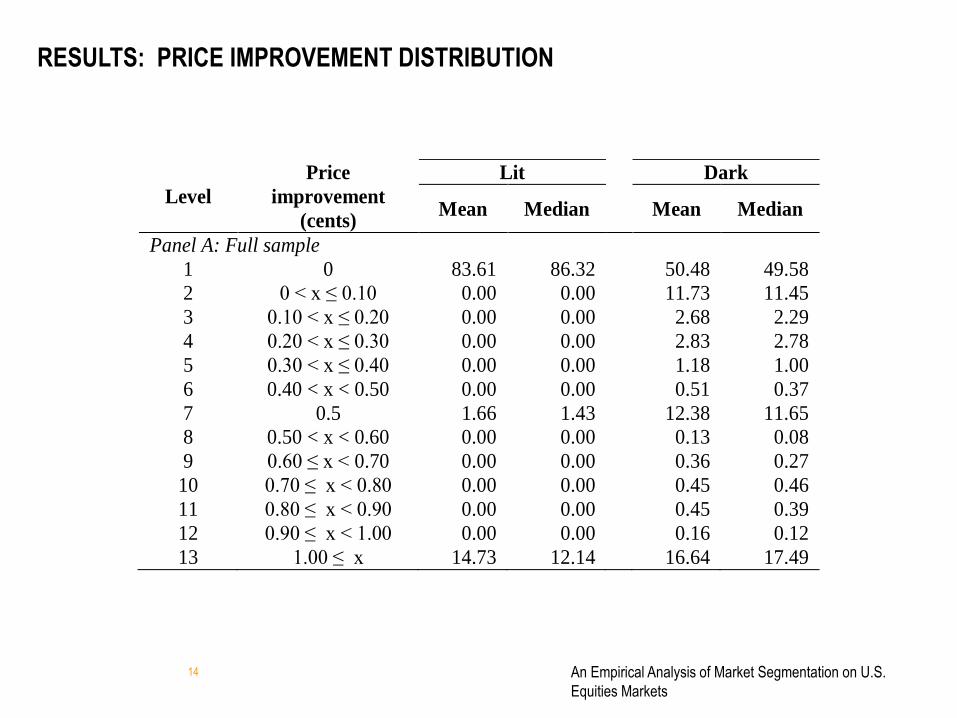
Stage 1: 𝐷𝑎𝑟𝑘_𝑃𝑜𝑜𝑙_𝑣𝑎𝑙𝑢𝑒_𝑟𝑎𝑡𝑖𝑜 = 𝜙(𝑍𝑖𝑡𝛾 + 𝜇𝑖𝑡)
Stage 2: 𝐸𝑓𝑓𝑠𝑝𝑟𝑒𝑎𝑑𝑖𝑡= 𝐷𝑎𝑟𝑘_𝑃𝑜𝑜𝑙_𝑣𝑎𝑙𝑢𝑒_𝑟𝑎𝑡𝑖𝑜𝑖𝑡𝛽1 + 𝑋𝑖𝑡𝛽2 + 𝜃𝜆 𝑖𝑡 + 𝜀𝑖𝑡
where 𝜙(·) is the standard normal cumulative distribution function.
Controls following existing literature:
Mcapi is the market capitalization measured at the beginning of the sample period
Priceit is daily the value weighted average trade price
Trade_size_ratioit is calculated as the ratio of the average trade size on day t and the
average trade size for the whole sample period for each sample stock.
Total_valueit is the daily dollar turnover.
For the second stage regression, Xit includes Priceit, Trade_size_ratioit and Total_valueit.
Except for dark pool_value_ratioit and Trade_size_ratioit, all variables are log transformed.
FORMAL MODEL
HECKMAN TWO STAGE MODEL TO ADDRESS SELECTION BIAS
FOLLOWING BESSEMBINDER (2003) AND O’HARA AND YE (2011)
19

An Empirical Analysis of Market Segmentation on U.S.
Equities Markets
WHAT’S MISSING FROM THE PRIOR MODELS
SPREADS AND & DARK TRADING BOTH RELATED TO TRADING RISK
20
22
24
26
28
30
32
34
2.0 2.2 2.4 2.6 2.8 3.0 3.2 3.4 3.6
Dar
k va
lue
ratio
(%
)
Adverse selection 30s (bp)
3.0
3.2
3.4
3.6
3.8
4.0
4.2
2.0 2.2 2.4 2.6 2.8 3.0 3.2 3.4 3.6
Effe
ctiv
e sp
read
(bp
)
Adverse selection 30s (bp)
20

An Empirical Analysis of Market Segmentation on U.S.
Equities Markets
SPREADS AND THE LOCUS OF TRADES
IMPORTANCE OF CONTROLLING FOR THE STATE OF MARKET
21
For the same stock, the location of a trade seems to be related to the state of the spread prior to the trade. Simply put, is liquidity cheap or expensive, both for today overall and right now?
To address this we both
1) partition all trades in a stock into terciles depending on the state of the quoted spread on the day of the trade (shown below), and
2) control for the price impact of a trade having occurred (not shown).
0%
5%
10%
15%
20%
25%
30%
35%
Small Cap Medium Cap Large Cap
dar
k p
oo
l Mar
ket
Sh
are
(%)
Market Cap Category
Dark Pool Market Share Comparison
Quoted spreads - Small
Quoted spreads - Medium
Quoted spreads - Large

An Empirical Analysis of Market Segmentation on U.S.
Equities Markets
The dependent variable is dark pool_value_ratio, which is calculated as the proportion of total trading value on
dark pool venues.
Stage 1: 𝐷𝑎𝑟𝑘_𝑃𝑜𝑜𝑙_𝑣𝑎𝑙𝑢𝑒_𝑟𝑎𝑡𝑖𝑜𝑖𝑡 = 𝜙(𝑍𝑖𝑡𝛾 + 𝜇𝑖𝑡)
Stage 2: 𝐸𝑓𝑓𝑠𝑝𝑟𝑒𝑎𝑑𝑖𝑡= 𝐷𝑎𝑟𝑘_𝑃𝑜𝑜𝑙_𝑣𝑎𝑙𝑢𝑒_𝑟𝑎𝑡𝑖𝑜𝑖𝑡𝛽1 + 𝑋𝑖𝑡𝛽2 + 𝜃𝜆 𝑖𝑡 + 𝜀𝑖𝑡
where 𝜙(·) is the standard normal cumulative distribution function.
Controls to address state of information in the market:
Adverse_Selection_Short _Termit is 30 second adverse selection costs, all trades, on each trading day for each
stock.
Adverse_Selection_Long_Termit is 5 minute adverse selection costs, all trades, on each trading day for each
stock.
Spread_Mediumit and Spread_Largeit represent dummy variables for the two largest quoted spread terciles.
With these two controls we seek to capture the information state of the market on the day of the trade (Adverse
Selection) and the information state of the market at the time of the trade (Spread)
We also control for “blocks”, the largest 1% of the trades for each stock during the sample period.
FORMALLY: ADD INFORMATIONAL CONTROLS
MODEL SHORT TERM AND LONG TERM FACTORS
22

An Empirical Analysis of Market Segmentation on U.S.
Equities Markets
Model 1 Model 3
Coefficient StdErr Coefficient StdErr
Dark-Pool_value_ratio
2.4982 0.6775 ***
Dark-Pool_block_ratio
-1.3426 0.1896 ***
Lambda
0.5034 0.6225
Adverse selection
Short-term -438.1893 30.1819 ***
0.6036 0.0652 ***
Long-term 45.1772 22.0857 *
0.1165 0.0284 ***
SpreadMedium
0.1315 0.0396 ***
SpreadLarge
0.3363 0.0554 ***
Price -0.1809 0.0049 ***
-0.4646 0.1765 **
Trade_size_ratio 9107.7994 293.3323 ***
5.3891 0.8203 ***
Total_value 0.1033 0.0023 ***
-0.0658 0.0239 **
Mcap -0.1622 0.0054 ***
Intercept 0.2277 0.0611 ***
3.5207 1.2992 **
Adj-R 0.3326 0.8307
TABLE 5: DARK TRADING AND EFFECTIVE SPREADS
CONTROLLING FOR THE INFORMATIONAL ENVIRONMENT AND BLOCKS
23
Results for dark pool trading flip. Controlling for the information state matters.

An Empirical Analysis of Market Segmentation on U.S.
Equities Markets
Model 1 Model 3
Coefficient StdErr Coefficient StdErr
Dark_value_ratio
2.0316 1.0389 **
Dark_block_ratio
-1.2808 0.3004 ***
Lambda
2.3372 1.2206 **
Stock Volatility
Short-term (30 sec.) -282.4878 35.1770 ***
0.2949 0.0450 ***
Long-term (5 min) -21.1596 11.7585 *
0.0227 0.0125 **
SpreadMedium
0.0815 0.0534 *
SpreadLarge
0.1827 0.0943 **
Price -0.1753 0.0048 ***
-1.0058 0.2496 ***
Trade_size_ratio 7541.7890 265.0794 ***
9.6678 1.7764 ***
Total_value 0.1180 0.0024 ***
-0.0573 0.0432 *
Mcap -0.1955 0.0058 ***
Intercept 0.5615 0.0669 ***
2.6620 2.5605
Adj-R2 0.336 0.7466
TABLE 5: DARK TRADING AND EFFECTIVE SPREADS
CONTROLLING FOR THE INFORMATIONAL ENVIRONMENT AND BLOCKS
24
Results for replacing signed Adverse Selection term with unsigned volatility.
An Empirical Analysis of Market Segmentation on U.S.
Equities Markets
Is a higher level of dark pool trading associated with higher average costs on exchange
venues or all venues?
In other words, does price improvement on dark pools increase enough to offset wider
spreads?
Or, do spreads widen on both markets as the exchange quotes sets prices for both and
price improvement does not adjust correspondingly to an increase in exchange spreads?
DISAGGREGATING THE EFFECTS ON EXCHANGE AND DARK POOL MARKETS
LINK THE PROFESSIONAL AND INVESTOR MARKETS
25

An Empirical Analysis of Market Segmentation on U.S.
Equities Markets
TABLE 6: SOURCE OF HIGHER AVERAGE COSTS
AGGREGATE EFFECT ON DARK POOL TRADE STATISTICALLY INSIGNIFICANT
26
Lit Dark
Coefficient StdErr Coefficient StdErr
Dark-
Pool_value_ratio 3.1633 0.5571 ***
0.7337 0.8746
Dark-
Pool_block_ratio -1.2121 0.1848 ***
-1.2997 0.2547 ***
Lambda 0.1145 0.5731
1.1610 0.7612
Adverse
selection
Short-term 0.5855 0.0632 ***
0.6905 0.1093 ***
Long-term 0.1204 0.0294 ***
0.1064 0.0322 ***
SpreadMedium 0.1153 0.0294 ***
0.1791 0.0582 **
SpreadLarge 0.3067 0.0508 ***
0.4674 0.0822 ***
Price -0.4906 0.1809 **
-0.2659 0.2128
Trade_size_ratio 4.7170 1.0125 ***
6.9859 1.1347 ***
Total_value -0.0770 0.0269 **
-0.0710 0.0350 *
Intercept 4.3845 1.3051 ***
2.2908 1.7308
Adj-R 0.8586 0.7042

An Empirical Analysis of Market Segmentation on U.S.
Equities Markets
TABLE 7: ROLE OF MARKET CAP
FOR LARGE AND MID-CAP STOCKS EFFECT ON DARK POOL MARKET
IS STATISTICALLY SIGNIFICANT. SMALL CAPS ARE INDETERMINATE
27
Model 3: Dependent Variable = Effective Spread
Lit Dark
Coefficient StdErr Coefficient StdErr
Panel A: Large stocks
Dark-Pool_value_ratio
1.8917 0.3108 ***
1.5967 0.3666 ***
Dark-Pool _block_ratio
-0.7358 0.1586 ***
-0.5979 0.2008 **
Panel B: Medium stocks
Dark-Pool _value_ratio 2.5121 0.5166 *** 1.7025 0.6700 **
Dark-Pool _block_ratio -0.7672 0.1523 *** -0.9108 0.2496 ***
Panel C: Small stocks
Dark-Pool _value_ratio 1.5878 0.6340 ** -2.5489 1.5425
Dark-Pool _block_ratio -0.9218 0.2899 ** -0.7089 0.4774

An Empirical Analysis of Market Segmentation on U.S.
Equities Markets
Use the Variance Ratio test for Price Efficiency, measure as absolute value of deviation
from 1.
Follow O’Hara and Ye (2011) and calculate the variance ratio as:
Where sshort and slong are variances of returns measured over short and long intervals,
respectively and n is the ratio of the intervals.
For each stock and trading day, we calculate the variance of midpoint returns at 60-
second, 600-second, 900-second and 1800-second intervals. The variance ratio is then
calculated over four frequencies: 60/600, 60/1800, 300/900 and 300/1800.
We also perform the same analysis without absolute values.
The mean variance rations are between 1.26 and 1.56 depending on the intervals
measured.
OTHER MARKET QUALITY MEASURES
PRICE EFFICIENCY
28

An Empirical Analysis of Market Segmentation on U.S.
Equities Markets
TABLE 8: PRICE EFFICIENCY
PRICE LESS EFFICIENT WITH MORE DARK POOL VOLUME
60/600 60/1800
Coefficient Stderr Coefficient Stderr
Dark_value_ratio 0.2348 0.0980 ** 0.4232 0.1987 *
Dark_block_ratio -0.1207 0.0509 ** -0.1811 0.1207
Adverse selection
Short-term 363.33 99.578 *** 794.41 269.44 **
Long-term -487.07 53.149 *** -1095.32 161.51 ***
SpreadMedium 0.0048 0.0138 -0.0056 0.0298
SpreadLarge 0.0268 0.0155 * 0.0518 0.0334
Trade_size_ratio 6986 1238 *** 12814 2553 ***
Total_value -0.0102 0.0026 *** -0.0175 0.0051 ***
Intercept 0.6796 0.0938 *** 1.2450 0.1973 ***
Adj-R 0.0723 0.0480
29

An Empirical Analysis of Market Segmentation on U.S.
Equities Markets
We show that an increase in dark trading is associated with an increase in trading costs. However, the effect can be bi-directional.
A major objective is to isolate the cause and effect relationship between dark trading and trading costs.
One solution is to find another variable, called an Instrumental Variable (IV) related to dark trading but not trading costs.
We suggest the following variable:
This is a valid IV, because
• It affects the level of dark trading, and
• It is not related to market average transaction costs.
ROBUSTNESS TESTS
ENDOGENEITY AND BI-DIRECTIONAL CAUSALITY
30
IV
Dark Trading Transaction Costs
An Empirical Analysis of Market Segmentation on U.S.
Equities Markets
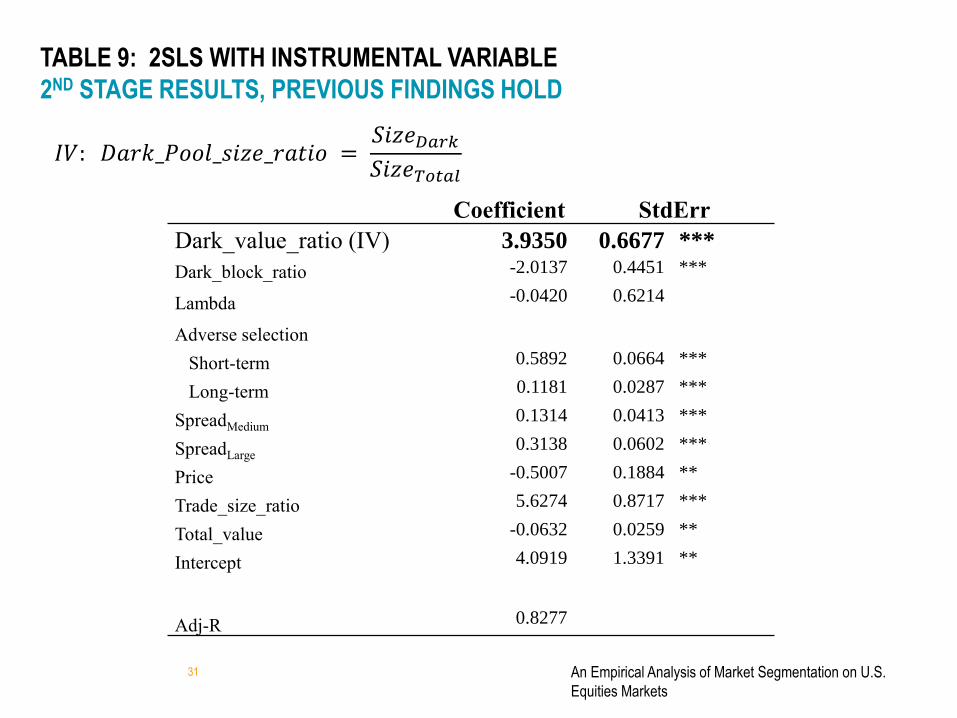
TABLE 9: 2SLS WITH INSTRUMENTAL VARIABLE
2ND STAGE RESULTS, PREVIOUS FINDINGS HOLD
Coefficient StdErr
Dark_value_ratio (IV) 3.9350 0.6677 ***
Dark_block_ratio -2.0137 0.4451 ***
Lambda -0.0420 0.6214
Adverse selection
Short-term 0.5892 0.0664 ***
Long-term 0.1181 0.0287 ***
SpreadMedium 0.1314 0.0413 ***
SpreadLarge 0.3138 0.0602 ***
Price -0.5007 0.1884 **
Trade_size_ratio 5.6274 0.8717 ***
Total_value -0.0632 0.0259 **
Intercept 4.0919 1.3391 **
Adj-R 0.8277
31
𝐼𝑉: 𝐷𝑎𝑟𝑘_𝑃𝑜𝑜𝑙_𝑠𝑖𝑧𝑒_𝑟𝑎𝑡𝑖𝑜 = 𝑆𝑖𝑧𝑒𝐷𝑎𝑟𝑘
𝑆𝑖𝑧𝑒𝑇𝑜𝑡𝑎𝑙

An Empirical Analysis of Market Segmentation on U.S.
Equities Markets
The extent of dark pool trading and transactions costs could be co-dependent on the level
of high frequency trading (HFT) in the market.
We can only identify HFT on NASDAQ, not on other markets.
But, using the information available from NASDAQ we can ask whether the inclusion of
the level of HFT activity affects our results.
Controls to address level of HFT in the market:
Transactions of the 21 most active HFT firms on the NASDAQ market are identified.
HFTMake (HFTTake) is the ratio of the value of transactions in which an HFT provides
(takes) liquidity and the total trading value on NASDAQ.
HFTAll is the ratio of, the sum of the value of transactions in which an HFT provides the
liquidity and the value of transactions in which an HFT takes the liquidity, to the total
trading value on NASDAQ.
ROBUSTNESS TESTS
HIGH FREQUENCY TRADING
32

An Empirical Analysis of Market Segmentation on U.S.
Equities Markets
TABLE 10: ROBUSTNESS TEST
ADD HFT TO THE RHS OF THE MODEL IN TABLE 5
33
Model 1 Model 2 Model 3
Coefficient StdErr Coefficient StdErr Coefficient StdErr
HFTdAll
-2.2746 0.5912 ***
HFTdMake
-0.1601 0.6654
HFTdTake
-1.7635 0.3753 ***
Dark-Pool_value_ratio 0.8070 0.4955 *
0.7723 0.4584 **
0.7585 0.4635 *
Dark-Pool_block_ratio -1.8207 0.3872 ***
-2.0315 0.3955 ***
-1.9884 0.3792 ***
Lambda -5.2877 2.8103 **
-3.7453 2.8802 *
-3.8483 2.8627 *
Adverse selection
Short-term 0.9477 0.1838 ***
0.8773 0.1880 ***
0.8844 0.1866 ***
Long-term 0.0471 0.0233 **
0.0375 0.0234 *
0.0342 0.0235 *
SpreadMedium 0.2040 0.0419 ***
0.2485 0.0432 ***
0.2558 0.0419 ***
SpreadLarge 0.4741 0.0696 ***
0.5533 0.0742 ***
0.5747 0.0732 ***
Price 0.3928 0.5023
0.1848 0.5196
0.3228 0.5545
Trade_size_ratio 1.4756 0.4744 ***
1.6476 0.4665 ***
1.5887 0.4612 ***
Total_value -0.1796 0.0430 ***
-0.1296 0.0445 ***
-0.1528 0.0495 ***
Intercept 8.4987 1.6204 ***
7.4915 1.6005 ***
7.8264 1.6093 ***
Adj-R 0.75
0.76
0.77
Including HFT impacts significance but not the overall result.
An Empirical Analysis of Market Segmentation on U.S.
Equities Markets
• SIFMA/GFMA approach: Eliminate exchanges and allow competition between dealer
systems. Concept is similar to NASDAQ circa 1990.
• Australian approach: Make dark markets operate like exchanges in most major
respects including eliminating segmentation.
• Our suggestions (similar to Canadian Trade-At Rule):
– Extend the Order-Protection (Trade Through) Rule so that all displayed liquidity at
the best bid/offer must be satisfied before dark liquidity can trade at that price.
– A common trade increment (tick) for both exchanges and OTC.
• Another approach: Do nothing or “start over” w.r.t. market structure.
• Finally, it must be said that the open, electronic limit order book may be a flawed
model for trading by heterogeneous participants and consequently is inconsistent
with the exchange model which should, in principle, cater to all types of participants.
CONCLUSION
WHAT ARE OUR OPTIONS FOR DARK TRADING?
34