Embed Size (px)
Citation preview

E S T U D I O S D E E C O N O M Í A A P L I C A D A V O L . 24-2, 2006. P Á G S . 677-698
An Empirical Estimation of the U.S. Intra-Industry Trade with Spain
EKANAYAKE, E.M. PH.D. (*), VEERAMACHENENI, BALA, PH. D.(**), AND MOSLARES, CARLOS, PH. D. (***)(*) School of Business. Bethune-Cookman College. 640 Dr. Mary McLeod Bethune Blvd.Daytona Beach, FL 32114-3099. (**) Department of History Economics and Politics. State University of New York at Farmingdale. 2350 Broadhallow Road. Farmingdale, NY, 11735-1021. (***) Facultat d´Economia IQS. Universitat Ramon Llull. Barcelona, Spain. E-mail: (***) [email protected]
ABSTRACTThe trade between the United States and Spain is increasingly characterized by intra-industry
trade. This paper aims to explain the extent of vertical and horizontal intra-industry trade ( ) in United State’s foreign trade with Spain. Trade patterns are identifi ed by breaking up total trade into three trade types: one-way trade (i.e. inter-industry trade), two-way trade (i.e. intra-industry trade)in horizontally differentiated products, and two-way trade in vertically differentiated products. This study uses detailed trade data at the 10-digit Harmonized System (HS) industry level and covers a longer and more recent period, 1990 through 2004. One of the main fi ndings is that the observed increase in intra-industry trade between the United States and Spain is almost entirely due to two-way trade in vertical differentiation. Another important fi nding is that the share of vertical intra-industry trade has increased signifi cantly during this period.Keywords: Intra-Industry Trade, Vertical and Horizontal Intra-Industry Trade.
Una estimación empírica del comercio intra-industrial entre EE.UU. y España
RESUMENLos fl ujos comerciales entre España y los EEUU están caracterizados por un creciente componente
intra-industrial. Este artículo pretende explicar el comercio intra-industrial tanto vertical como horizontal entre los EEUU y España. Para dicho análisis se han descompuesto los fl ujos comerciales en los tres tipos: el comercio Inter.-industrial, el comercio intra-industrial con diferenciación horizontal y con diferencia-ción vertical. Los datos utilizados se basan en el Sistema Armonizado con diez dígitos para el período 1990-2004. Los resultados demuestran que el comercio intra-industrial se explica principalmente por la diferenciación vertical de los productos y que dichos fl ujos se han incrementado de forma signifi cativa durante ese período.Palabras clave: Comercio intra-industrial, comercio intra-industrial vertical y horizontal.
Artículo recibido en octubre de 2005 y aceptado para su publicación en mayo de 2006.Artículo disponible en versión lectrónica en la página www.revista-eea.net, ref.: -24203.
ISSN 1697-5731 (online) – ISSN 1133-3197 (print)
JEL classifi cation: F14

678 Ekanayake, E.M. Ph.D., Veeramacheneni, Bala, Ph. D., and Moslares, Carlos, Ph. D.
Estudios de Economía Aplicada, 2006: 677-698 • Vol. 24-2
1. INTRODUCTION
Since the introduction of the concept of intra-industry trade ( IIT ) in the 1960s, a large number of theoretical and empirical studies have been conducted to investigate the determinants of this trade. Intra-industry trade is defi ned as the simultaneous export and import of commodities of the same industry group. As Greenway and Milner (1986) and Greenway and Torstensson (1997) point out, the theoretical and empirical interest in IIT has continued ever since the evidence on rapidly increasing IIT was identifi ed nearly four decades ago. Interest in IIT arose mainly because the traditional theory of comparative costs, dealing with homogenous products, is incapable of explaining the simultaneous exports and imports to a country of the same statistical category. Intra-industry trade describes trade in similar, but slightly differentiated products based on imperfect competition, or trade in close substitutes demanded by consumers in different countries who may have distinct tastes or preferences.
Studies on intra-industry trade tend to focus on a variety of topics including the measurement of the extent of IIT , development of theoretical models of IIT , and estimation of econometric models to test the theory of IIT with data on a given country or a group of countries. Empirical studies of IIT have varied widely in terms of their hypotheses and selection of explanatory variables, their method of measurement of IIT , the countries or group of countries considered and the time periods covered. The majority of empirical studies have tried to explain the IIT of developed countries due to availability of detailed trade data for these countries. In identifying the determinants of IIT some studies have focused on country-specifi c determinants while others have focused on industry-specifi c determinants, with a few studies focusing on both types of determinants. Some recent studies have also attempted to estimate the extent of horizontal and verti-cal intra-industry trade and identify their determinants. Despite the diversity of approaches, some consistent results and common features regarding the types of factors infl uencing IIT have emerged. Studies of bilateral trading arrangements have found that similarity in industrial structure, demand patterns, and size of countries are important country-specifi c factors while the characteristics of pro-duct differentiation and scale economies are important industry-specifi c factors. Multilateral studies have found that the size of countries and their average level of income are positively related to IIT .
The main objective of this paper is to explain the extent of vertical and horizon-tal intra-industry trade in United State’s foreign trade with Spain. Trade patterns are identifi ed by breaking up total trade into three trade types: one-way (i.e. inter-industry) trade, two-way (i.e. intra-industry) trade in horizontally differentiated products, and two-way trade in vertically differentiated products. Unlike the other

679AN EMPIRICAL ESTIMATION OF THE U.S. INTRA-INDUSTRY TRADE WITH SPAIN.
Estudios de Economía Aplicada, 2006: 677-698 • Vol. 24-2
studies on intra-industry trade, this study uses detailed trade data at the 10-digit Harmonized System (HS) industry level and covers a longer and more recent pe-riod, 1990-2004.
The remainder of the paper is organized as follows: Section II provides a brief discussion of general performance of international trade of the U.S. with Spain during the past two and a half decades. Alternative measures of intra-industry trade are dis-cussed in Section III. Section IV presents a discussion of the estimated IIT indices. Section V summarizes the main fi ndings.
2. GENERAL PERFORMANCE OF U.S. TRADE WITH SPAIN
In this section, we describe the extent, nature and dynamics of trade between the United States and Spain. Spain continued to one of the top trading partners of the United States during the past few decades. In 2004, Spain was the sixth largest trading partner of the United States, accounting for about 3.9 percent of total mer-chandise trade of the United States. In fact outside EU, USA is the biggest trading partner to Spain. The United States’ total trade (exports + imports) with Spain in-creased signifi cantly from $43.8 billion in 1990 to $76.6 billion in 2004, an annual average increase of about 4.6 percent. However, the shares of total trade, exports, and imports of Spain dropped marginally between 1990 and 2004. For instance, total trade share dropped from 4.9 percent in 1990 to 3.9 percent in 2004. Corres-ponding share of exports dropped from 6.0 percent to 4.7 percent while import share dropped from 4.1 percent to 3.4 percent during this period. Although the share of Spain in United State’s international trade is relatively smaller (3.9 percent of total U.S. trade in 2004), total trade (exports + imports) grew at an annual average rate of 4.6 percent during 1990-2004. During the same period U.S. exports to Spain grew at an annual rate of 3.3 percent while U.S. imports from Spain grew at annual average rate of 6.1 percent.
Of the total trade of $76.6 billion in 2004, nearly 19.1 percent was accoun-ted for by machinery (HS 84) industry. Other major trading products include passenger vehicles (HS 87) with trade share of 9.9 percent, pharmaceutical products (HS 30) with trade share of 8.2 percent, electrical machinery (HS 85) with trade share of 7.9 percent, and mineral fuel and oil (HS 27) with trade share of 7.4 percent. The top 10 export and import products in 1990 and 2004 are presented in Table 1. Machinery continued to be the major product exported and imported during this period. Top five export products also remained the same even though the rank of them changed. However, there are some changes in the major import products.

680 Ekanayake, E.M. Ph.D., Veeramacheneni, Bala, Ph. D., and Moslares, Carlos, Ph. D.
Estudios de Economía Aplicada, 2006: 677-698 • Vol. 24-2
3. MEASUREMENT OF INTRA-INDUSTRY TRADE
3.1. Measures of Intra-Industry Trade
The most widely used measure of intra-industry trade is the Grubel-Lloyd (G-L) index. While several alternative measures of IIT have been proposed in the litera-ture, perhaps the most widely adopted has been some variant of the G-L index. It is considered to be the most appropriate measure for documenting an industry’s trade pattern in a single period of time. The G-L index measures the share of IIT of industry i for a given country j as
)(
1ijij
ijij
ij MX
MXIIT
+
−−= (1)
Table 1. United States Total Trade with Spain(Value is in Millions of US Dollars and Share is in Percent
ijij
ij
ij
ij
(a) Top 10 Export Products
Product Value Share Product Value ShareAircraft, Spacecraft 1,065.5 20.5 Machinery 1,273.1 19.2Machinery 773.7 14.9 Aircraft, Spacecraft 636.8 9.6Electrical Machinery 335.3 6.4 Electrical Machinery 493.2 7.4Misc Grain, Seed, Fruit 323.5 6.2 Optical and Medical Instruments 490.8 7.4Mineral Fuel, Oil Etc 320.3 6.2 Pharmaceutical Products 467.3 7.0Optical and Medical Instruments 285.3 5.5 Passenger Vehicles 309.4 4.7Cereals 251.6 4.8 Edible Fruit and Nuts 260.5 3.9Tobacco 191.3 3.7 Misc Grain, Seed, Fruit 235.2 3.5Special Other 121.8 2.3 Wood 215.1 3.2Food Waste; Animal Feed 116.8 2.2 Mineral Fuel, Oil Etc 209.3 3.2
(b) Top 10 Import Products
Product Value Share Product Value ShareMineral Fuel, Oil Etc 478.4 14.5 Machinery 807.8 10.8Footwear 365.4 11.0 Organic Chemicals 463.2 6.2Preserved Food 215.4 6.5 Mineral Fuel, Oil Etc 461.8 6.2Passenger Vehicles 189.1 5.7 Pharmaceutical Products 435.6 5.8Machinery 181.7 5.5 Special Other 354.5 4.7Iron and Steel 147.5 4.5 Passenger Vehicles 338.8 4.5Rubber 140.1 4.2 Electrical Machinery 336.9 4.5Special Other 127.1 3.8 Preserved Food 311.1 4.2Electrical Machinery 113.3 3.4 Ceramic Products 281.9 3.8Aircraft, Spacecraft 111.5 3.4 Iron and Steel 278.8 3.7
Source: World Trade Atlas database.
1990 2004
1990 2004

681AN EMPIRICAL ESTIMATION OF THE U.S. INTRA-INDUSTRY TRADE WITH SPAIN.
Estudios de Economía Aplicada, 2006: 677-698 • Vol. 24-2
where ijX and ijM are home country’s exports of industry i to country j and home country’s imports of industry i from country j , respectively. Thus, ijIIT index in (1) measures the intensity or proportion of intra-industry trade in industry i with country j . If all trade in industry i is intra-industry trade, i.e., ijX = ijM , then ijIIT = 1.
Similarly, if all trade in industry i is inter-industry trade, i.e., either ijX = 0 or ijM = 0, then ijIIT = 0. Thus, the index of intra-industry trade takes values from 0 to 1 as the extent of intra-industry trade increases, i.e., 0 ≤ ijIIT ≤ 1.
The IIT index in (1) can be modifi ed to measure the intra-industry trade in all products with country j as a weighted measure of the ijIIT ’s and can be written as
⎥⎥⎥⎥
⎦
⎤
⎢⎢⎢⎢
⎣
⎡
+
+=
⎥⎥⎦
⎤
⎢⎢⎣
⎡
+
−−=
∑∑
=
=n
iijij
ijijn
iij
ijij
ijij
ijj
MX
MXwwhere
MX
MXwIIT
1
1 )(
)(
)(1
i.e.,
∑
∑∑
=
==
+
−−+= n
iijij
n
iijij
n
iijij
j
MX
MXMXIIT
1
11
)(
)(
(2)
where n is the number of industries at a chosen level of aggregation.
The jIIT index in (2), as Grubel and Lloyd (1975) pointed out, is a downward-biased measure of IIT in the presence of an imbalance in a country’s commodity trade. The greater the imbalance, the greater the share of net trade and the smaller the share of IIT . Aquino (1978), and Balassa (1986), among others, have suggested adjusted measures to correct this defi ciency. Grubel and Lloyd (1975) proposed to adjust the index by incorporating overall trade imbalance into (2) as follows:
∑∑∑
∑∑
===
==
−−+
−−+=
n
iij
n
iij
n
iijij
n
iijij
n
iijij
aj
MXMX
MXMXIIT
111
11
)(
)( (3)
where ajIIT is the adjusted IIT index. Since this adjusted measure of IIT index
incorporates the total trade imbalance, it is measured with respect to total balanced trade. Even with this adjustment, one problem associated with this measure is the aggregation bias, i.e., aggregating trade data by sector will yield an apparent increase in IIT .
ij ij
ij
ij ij ij
ij ij
ij
ij
ij
ijij ij
ij ijij
ij ij
ij ij
ijij
ij
ij
ij
ij
ij ij
ij ij
ij
ij
ij
ij

682 Ekanayake, E.M. Ph.D., Veeramacheneni, Bala, Ph. D., and Moslares, Carlos, Ph. D.
Estudios de Economía Aplicada, 2006: 677-698 • Vol. 24-2
2. MEASURING VERTICAL AND HORIZONTAL INTRA-INDUSTRY TRADE
The literature on intra-industry trade increasingly emphasizes the importance of differentiating between horizontal and vertical intra-industry trade. Horizontal intra-industry trade ( HIIT ) is generally defi ned as the exchange of commodities diffe-rentiated by different attributes excluding quality, while vertical intra-industry trade (VIIT ) is the exchange of commodities characterized by different qualities. This is why the presence of one or the other has different implications for the trading partners. Horizontal intra-industry trade ( HIIT ) is considered to be of greater relevance to trade among developed countries with high and similar per capita incomes while VIIT is considered to be particularly relevant to trade among unequal trading partners with different income levels. Recent empirical studies, however, show that even among developed countries vertical IIT are predominant as compared to horizontal IIT (see for example, Greenway et al. (1994) and Athurupane et al. (1999)).
In the evaluation of trade fl ows, quality analysis is undertaken mainly with the use of unit value indices which measure the average price of a bundle of items from the same general product grouping. The rationale for using unit value as an indicator of quality is that, assuming perfect information, a variety sold at a higher price must be of higher quality than a variety sold more cheaply. According to Stiglitz (1987), prices will refl ect quality even with imperfect information.
In disentangling total IIT into horizontal IIT ( HIIT ) and vertical IIT (VIIT ), we use unit value information at the 10-digit HS industry level as follows:
jjj VIITHIITIIT += (4)
where jHIIT is given by (2) for those products ( i ) in industry j where unit values of imports ( m
ijUV ) and exports ( xijUV ) for a particular dispersion factor (α )
satisfy the condition,
αα +≤≤− 11m
ij
xij
UV
UV
and jVIIT is given by (2) for those products ( i ) in industry j where,
α−< 1m
ij
xij
UV
UV or α+> 1
mij
xij
UV
UV
where α = 0.15 or 0.20 or 0.25.
UVij UVij
UVUV
ij
ij
UVij
UVij
UVij
UVij
683AN EMPIRICAL ESTIMATION OF THE U.S. INTRA-INDUSTRY TRADE WITH SPAIN.
Estudios de Economía Aplicada, 2006: 677-698 • Vol. 24-2
Figure 1. Share of HIIT and VIIT in U.S.-Spain Intra-Industry Trade
3. DATA
This study is based on detailed trade data desegregated at 10-digit Harmonized System (HS) industries, covering the period from 1990 to 2004. The trade data was obtained from the Global Trade Information Services (GTIS)’s World Trade Atlas Database that uses primary data provided by the U.S. Department of Commerce’s Foreign Trade Division. Additional information on trade was taken from the Interna-tional Monetary Fund’s, Direction of Trade Statistics Yearbook and U.S. Department of Commerce’s International Trade Administration. The data on other relevant variables were taken from the International Monetary Fund’s, International Financial Statistics Yearbook 2004 and the World Bank, World Development Report 2004.
4. ESTIMATION OF INTRA-INDUSTRY TRADE INDICES
In this section, we describe the extent of intra-industry trade between the United States and Spain. A specifi c problem measuring IIT is the level of desegregation. The scope of IIT and its main components heavily depend on the level of disaggre-gating. We have estimated the shares of intra-industry trade in United States total trade of detailed products for years 1990-2004, at the 10-digit level of the Harmoni-
0
2
4
6
8
10
12
14
16
18
20
1990 1991 1992 1993 1994 1995 1996 1997 1998 1999 2000 2001 2002 2003 2004
Per
cent
HIIT Share VIIT Share IIT Share (No Unit Value)
Note: These shares are based on a dispersion factor (α ) of 15 percent.

684 Ekanayake, E.M. Ph.D., Veeramacheneni, Bala, Ph. D., and Moslares, Carlos, Ph. D.
Estudios de Economía Aplicada, 2006: 677-698 • Vol. 24-2
zed System (HS). In 1990, U.S. – Spain trade activities took place in 10,348 10-digit level industries, of which nearly 26.8 percent of industries (or 3,261 industries) had some intra-industry trade. By 2004, trade activities increased to some 13,966 10-digit level industries, of which nearly 24.7 percent of industries (or 3,453 industries) had some intra-industry trade. The data used in this study is not limited to manufactured products as is common in most other studies of IIT . Table 2 shows the weighted average of the Grubel-Lloyd IIT indices computed using (2) and (3) for the years 1990 to 2004. Three points are worth noting. First, the IIT index in United States’ trade with Spain remained relatively constant during the period 1990-2004, although it increased somewhat between 1990 and 1996. Second, the adjusted IIT index is relatively higher than the unadjusted IIT index. Third, the share of IIT in U.S. – Spain trade decreased from 48.5 percent in 1990 to 40.2 percent in 2004 while the share of inter-industry trade increased from 51.5 percent to 59.8 percent.
Table 2. The Development of U.S. - Spain Intra-Industry Trade, 1990-2004
Adjusted Intra-Industry Inter-IndustryYear Grubel-Lloyd IIT Index Grubel-Lloyd IIT Index Trade Share (%) Trade Share (%)1990 0.3404 0.4056 21.4 78.61991 0.3193 0.4073 23.8 76.21992 0.3297 0.3892 23.3 76.71993 0.3289 0.4400 23.7 76.31994 0.3443 0.3851 21.4 78.61995 0.3456 0.3805 19.9 80.11996 0.3356 0.3686 25.7 74.31997 0.3358 0.3852 25.2 74.81998 0.3509 0.4073 22.6 77.41999 0.3507 0.3601 24.6 75.42000 0.3527 0.3739 23.7 76.32001 0.3627 0.3707 25.7 74.32002 0.3538 0.4888 25.4 74.62003 0.3686 0.5161 28.0 72.02004 0.3646 0.5169 28.9 71.1
Source: Author´s calculations.

685AN EMPIRICAL ESTIMATION OF THE U.S. INTRA-INDUSTRY TRADE WITH SPAIN.
Estudios de Economía Aplicada, 2006: 677-698 • Vol. 24-2
Table 3. Distribution of IIT Indices in United States´ Trade with Spain
The trend in aggregate IIT indices presented in Table 2 is further analyzed by breaking down the IIT indices for each industry by (1) for the same time period. Table 3 shows the distribution of IIT indices by four major intervals. It shows both the number of products and the share of products in each category. The results pre-sented in Table 3 are consistent with results presented in Table 2. There is no major change in the structure of IIT in U.S. – Spain trade during this period; the shares of each of the four ranges of IIT remained relatively constant, although number of products with IIT indices above 0.75 increased from 583 in 1990 to 613 in 2004.
Year 0.00 < GL < 0.25 0.25 < GL < 0.50 0.50 < GL < 0.75 0.75 < GL < 1.00 Total1990 549 233 162 161 1,1051991 586 194 188 129 1,0971992 575 227 174 143 1,1191993 571 222 165 145 1,1031994 531 252 185 141 1,1091995 553 239 205 155 1,1521996 676 286 198 190 1,3501997 701 316 188 195 1,4001998 705 298 234 220 1,4571999 727 327 221 237 1,5122000 765 304 245 248 1,5622001 713 352 293 223 1,5812002 776 336 266 238 1,6162003 780 324 282 276 1,6622004 749 357 314 242 1,662
Year 0.00 < GL < 0.25 0.25 < GL < 0.50 0.50 < GL < 0.75 0.75 < GL < 1.00 Total1990 49.7 21.1 14.7 14.6 100.01991 53.4 17.7 17.1 11.8 100.01992 51.4 20.3 15.5 12.8 100.01993 51.8 20.1 15.0 13.1 100.01994 47.9 22.7 16.7 12.7 100.01995 48.0 20.7 17.8 13.5 100.01996 50.1 21.2 14.7 14.1 100.01997 50.1 22.6 13.4 13.9 100.01998 48.4 20.5 16.1 15.1 100.01999 48.1 21.6 14.6 15.7 100.02000 49.0 19.5 15.7 15.9 100.02001 45.1 22.3 18.5 14.1 100.02002 48.0 20.8 16.5 14.7 100.02003 46.9 19.5 17.0 16.6 100.02004 45.1 21.5 18.9 14.6 100.0
Number of Products
Share of Products (%)
Source: Author´s calculations.

686 Ekanayake, E.M. Ph.D., Veeramacheneni, Bala, Ph. D., and Moslares, Carlos, Ph. D.
Estudios de Economía Aplicada, 2006: 677-698 • Vol. 24-2
However, the number of products with only inter-industry trade (products with only exports and no imports or products with only imports and no exports) increased from 8,887 in 1990 to 10,513 in 2004.
Table 4. Changes in Intra-Industry Trade by Major Industry, 1990-2004
HS Industry 1990 2004 1990 2004 1990 200401-05 Live Animals; Animal Products 0.5 1.1 0.2530 0.3076 26.0 5.506-14 Vegetable Products 8.0 5.2 0.2392 0.3127 5.3 30.5
15 Animal or Vegetable Fats and Oils 0.6 0.9 0.0000 0.0157 0.0 78.416-24 Prepared Foodstuffs; Beverages; Tobacco 9.0 7.5 0.2823 0.3191 2.0 20.925-27 Mineral Products 10.0 5.3 0.0872 0.4017 6.9 20.428-38 Products of the Chemical or Allied Industries 5.4 14.0 0.3333 0.3818 14.4 44.4
39-40 Plastics and Articles thereof; Rubber and Articles thereof 2.6 3.3 0.3777 0.3104 50.2 46.4
41-43 Raw Hides and Skins, Leather, Furskins and Articles Thereof 0.8 0.7 0.3434 0.3001 23.5 18.5
44-46Wood and Articles of Wood; Wood Charcoal; Cork and Articles of Cork; Manufacturers of Straw 1.5 2.6 0.1986 0.3008 6.8 13.1
47-49Pulp of Wood or of Other Fibrous Cellulosic Material; Waste and Scrap of Paper or Paperboard; Paper and Paperboard and Articles Thereof 2.8 2.3 0.3503 0.2433 23.4 33.2
50-63 Textile and Textile Articles 2.4 1.7 0.2661 0.3765 7.6 10.9
64-67 Footwear, Headgear, Umbrellas, Walking Sticks, etc. 4.4 1.6 0.3275 0.5581 0.6 2.1
68-70 Articles of Stone, Plaster, Cement, etc; Ceramic Products; Glass and Glassware 2.3 4.1 0.3461 0.4484 28.9 18.0
71 Natural Or Cultured Pearls, Precious or Semi-Precious Stones, Precious Metals, etc. 0.5 0.6 0.7189 0.4319 2.0 7.8
72-83 Base Metals and Articles of Base Metal 5.2 5.3 0.3895 0.3950 13.8 15.8
84-85 Machinery and Mechanical Appliances; Electrical Equipment; etc. 16.3 20.2 0.3391 0.3650 41.7 37.6
86-89 Vehicles, Aircraft, Vessels and Associated Transport Equipment 17.9 10.8 0.3994 0.3208 29.3 11.3
90-92Optical, Photographic, Cinematographic, Measuring, Checking, Precision, Medical or Surgical Instruments and Apparatus; Clocks and Watches; Musical Instruments; 3.6 4.4 0.2208 0.2731 46.6 54.8
93 Arms and Ammunition; Parts and Accessories Thereof 0.6 0.5 0.3336 0.1421 27.5 67.6
94-96 Miscellaneous Manufactured Articles 1.6 1.8 0.3946 0.4667 20.6 30.897 Works of Art, Collectors' Pieces and Antiques 0.9 2.0 0.6897 0.4272 97.3 95.2
98-99 Special Classification Provisions 3.0 4.1 0.0000 0.0000 0.0 0.0
Note: Total trade share indicates the share of each industry's total trade (exports+imports) as percentage of total U.S. - Spain trade. G-L IIT index is the Grubel-Lloyd intra-industry trade index for each industry group weighted by shares in total bilateral trade. IIT share denotes the share of intra-industry trade in a given industry's total trade.
Source: Authors' calculations.
Total Trade Share (%) G-L IIT Index IIT Share (%)

687AN EMPIRICAL ESTIMATION OF THE U.S. INTRA-INDUSTRY TRADE WITH SPAIN.
Estudios de Economía Aplicada, 2006: 677-698 • Vol. 24-2
The trend in aggregate IIT indices can further be analyzed by computing the share of IIT and IIT indices for each industry for the same time period. This is done fi rst by looking at aggregated industry level and then at desegregated industry level. The intra-industry trade indices at the most aggregated level, i.e., at the 1-digit HS level, are presented in Table 4. These indices were computed taking the weighted average of IIT indices at the 10-digit HS level industries. The U.S. – Spain intra-industry trade is mainly concentrated in manufacturing products accounting for more than 80 percent of total trade. Of these major product groups, machinery and mechanical appliances (HS 84-85) recorded the highest IIT index. This sector accounts for about 30 percent of U.S. – Spain total merchandise trade while nearly a half of its total trade is intra-industry trade in nature. Pulp of wood or of other fi brous cellulosic material (HS 47-49) recorded the second highest IIT index. This group, however, accounted for only about 2 percent of Unites States’ total trade in 2004. The product groups that recorded relatively high IIT indices in 2004 include arms and ammunition (HS 93), products of the chemical or allied industries (HS 28-38), works of art, collectors’ pieces and antiques (HS 97), and plastics and rubber and articles thereof (HS 39-40). Of the major product groups shown in Table 4, products of the chemical or allied industries (HS 28-38) ranks number one in terms of increased IIT share between 1990 and 2004; its share increased from 42.9 percent to 66.1 percent, an increase of 23.3 percentage points. On the other hand, vehicles, aircraft, vessels and associated transport equipment sector experienced the greatest drop of IIT share during this period: its share decreased from 76.5 percent to 13.1 percent, a decrease of 63.4 per-centage points. The IIT share of animals or vegetable fats and oils product (HS 15) also decreased from 49.3 percent in 1990 to 15.0 percent in 2004, a decrease of 34.3 percentage points. Of the 22 product groups presented in Table 4, only eight groups experienced increasing IIT shares during this period. It is also important to note that arms and ammunition (HS 93) recorded the highest share of IIT .

688 Ekanayake, E.M. Ph.D., Veeramacheneni, Bala, Ph. D., and Moslares, Carlos, Ph. D.
Estudios de Economía Aplicada, 2006: 677-698 • Vol. 24-2
Table 5. Top 25 Industries with Highest Intra-Industry Trade Share, 1990-2004
(Ranked by IIT Share in Industry Total)
Table 5 presents IIT indices at the 2-digit HS level industries for 1990 and 2004. Due to the limitation of space only the top 25 industries are presented in the table (there are 99 2-digit HS industries). These indices were also computed taking the weighted average of IIT indices at the 10-digit HS level industries. The industries are ranked according to the share of a given industry’s intra-industry trade to the industry’s total trade. All 25 industries presented have an IIT share exceeding 50 percent but majority of them accounted for less than 1 percent in total industry trade. For instance, almost all trade in zinc and articles thereof (HS 79) industry is intra-industry trade, and its IIT share increased from 36.1 percent in 1990 to 97.9 percent in 2004. However, this industry accounts for about 0.01 percent of total trade between the United States and Spain. The pharmaceutical products (HS 30) industry also shows a tremendous increase in its IIT
HS Industry 1990 2004 1990 2004 1990 2004 1990 2004 14 Other Vegetable 0.01 0.00 0.03 0.01 0.0207 0.2201 62.0 97.4 97 Art and Antiques 0.94 1.99 4.26 6.56 0.6897 0.4272 97.3 95.2 86 Railway; Trf Sign Eq 0.02 0.55 0.03 1.56 0.7350 0.2418 32.5 81.8 15 Fats and Oils 0.63 0.92 0.00 2.50 0.0000 0.0157 0.0 78.4 96 Miscellaneous Manufactures 0.19 0.23 0.45 0.61 0.4842 0.4249 51.6 76.7 93 Arms and Ammunition 0.64 0.55 0.83 1.29 0.3336 0.1421 27.5 67.6 66 Umbrella, Wlk-Sticks, Etc 0.00 0.00 0.00 0.00 0.8571 0.7429 40.7 67.5 49 Book and Newspapr; Manuscripts 0.74 0.59 2.21 1.36 0.4141 0.2825 63.8 66.3 32 Tanning, Dye, Paint, Putty 0.36 0.43 0.28 0.96 0.3127 0.3686 16.9 65.6 30 Pharmaceutical Products 0.86 6.40 1.31 14.51 0.3275 0.3455 32.6 65.6 35 Albumins; Mod Strch; Glue 0.03 0.07 0.02 0.15 0.0340 0.2508 16.2 65.0 79 Zinc and Articles Thereof 0.44 0.00 0.00 0.00 0.0000 0.7411 0.0 64.5 83 Misc Art of Base Metal 0.40 0.39 1.44 0.85 0.2153 0.3889 76.8 62.0 08 Edible Fruit and Nuts 0.64 2.46 0.80 5.27 0.3283 0.0225 26.9 62.0 34 Soap, Wax, Et; Dental Prep 0.07 0.18 0.11 0.36 0.4675 0.4022 31.7 57.1 90 Optical and Medical Instruments 3.60 4.26 8.01 8.33 0.2478 0.2617 47.7 56.5 39 Plastic 0.68 1.93 1.12 3.68 0.3807 0.3834 35.2 55.2 85 Electrical Machinery 5.27 5.88 12.63 9.41 0.3390 0.3500 51.4 46.3 41 Hides and Skins 0.32 0.16 0.40 0.24 0.3225 0.1785 26.8 44.4 25 Salt; Sulfur; Earth, Stone 0.64 0.29 0.36 0.42 0.0482 0.3357 12.0 41.4 95 Toys and Sports Equipment 0.54 0.54 0.68 0.75 0.3335 0.5224 27.0 40.2 33 Perfumery, Cosmetic, Etc 0.56 1.17 0.50 1.54 0.3534 0.5109 19.0 38.1 89 Ships and Boats 0.76 0.64 0.54 0.80 0.0744 0.3407 15.2 36.4 68 Stone, Plastr, Cement, Etc 0.88 1.75 2.66 2.20 0.2504 0.3979 65.0 36.3 40 Rubber 1.91 1.40 4.95 1.67 0.3747 0.2373 55.6 34.4
Notes: 1. Total industry trade (exports+imports) as a percentage of total U.S. trade with Spain. 2. Intra-industry trade in a specific industry as a percentage of total intra-industry trade. 3. Total intra-industry trade in a specific industry as a percentage of total trade in the industry.
Source: Authors' calculations.
Industry Trade Share (%) ¹
Industry Intra-Trade Share (%) ²
Grubel-Lloyd IIT Index
IIT Share in Total Industry Trade ³

689AN EMPIRICAL ESTIMATION OF THE U.S. INTRA-INDUSTRY TRADE WITH SPAIN.
Estudios de Economía Aplicada, 2006: 677-698 • Vol. 24-2
share during this period, increasing from 63.0 percent in 1990 to 94.6 percent in 2004. Of the 25 industries shown in the table, intra-industry trade share of sixteen industries and IIT index of thirteen industries increased during this period.
Table 6. Top 25 Industries with Highest Trade Share, 1990-2004
(Ranked by IIT Share in Industry Total)
Table 6 presents IIT indices at the 2-digit HS level industries for 1990 and 2004, ranking the industries according to the share of a given industry’s total trade to the total trade between the industry’s total trade. Of all 25 industries presented, majority of them accounted for less than 5 percent in total industry trade. The machinery (HS 84) industry accounts for about a fi fth of total trade between the two countries. Nearly 42.4 percent of its total trade is intra-industry trade; its IIT share marginally increased from 41.9 percent in 1990 to 42.4 percent in 2004. Of the 25 industries shown in the table, total trade share of fi fteen of the industries increased during this period.
HS Industry 1990 2004 1990 2004 1990 2004 1990 2004 84 Machinery 11.22 14.74 19.44 17.43 0.3392 0.3800 37.2 34.2 30 Pharmaceutical Products 0.86 6.40 1.31 14.51 0.3275 0.3455 32.6 65.6 85 Electrical Machinery 5.27 5.88 12.63 9.41 0.3390 0.3500 51.4 46.3 88 Aircraft, Spacecraft 13.82 5.17 19.99 0.12 0.4864 0.4294 31.0 0.7 27 Mineral Fuel, Oil Etc 9.38 4.75 2.90 3.41 0.1263 0.4677 6.6 20.8 29 Organic Chemicals 2.14 4.71 0.71 3.85 0.3826 0.3176 7.1 23.7 87 Vehicles, Not Railway 3.54 4.59 4.25 1.79 0.3017 0.2712 25.7 11.3 90 Optical and Medical Instruments 3.60 4.26 8.01 8.33 0.2478 0.2617 47.7 56.5 98 Special Other 2.92 3.74 0.00 0.00 0.0000 0.0000 0.0 0.0 44 Wood 1.41 2.55 0.47 1.18 0.2880 0.2807 7.1 13.4 08 Edible Fruit and Nuts 0.64 2.46 0.80 5.27 0.3283 0.0225 26.9 62.0 20 Preserved Food 2.58 2.36 0.01 0.28 0.2714 0.3393 0.1 3.5 72 Iron and Steel 2.24 2.28 0.50 0.78 0.2375 0.1937 4.8 9.9 69 Ceramic Products 1.23 2.02 0.37 0.12 0.4198 0.4626 6.5 1.7 97 Art and Antiques 0.94 1.99 4.26 6.56 0.6897 0.4272 97.3 95.2 39 Plastic 0.68 1.93 1.12 3.68 0.3807 0.3834 35.2 55.2 68 Stone, Plastr, Cement, Etc 0.88 1.75 2.66 2.20 0.2504 0.3979 65.0 36.3 22 Beverages 1.12 1.75 0.01 0.14 0.5925 0.1100 0.1 2.3 12 Misc Grain, Seed, Fruit 3.82 1.69 0.01 0.24 0.1605 0.2338 0.1 4.0 73 Iron/Steel Products 1.28 1.67 0.61 0.62 0.3699 0.5232 10.3 10.8 64 Footwear 4.44 1.61 0.11 0.11 0.2192 0.2786 0.5 2.0 40 Rubber 1.91 1.40 4.95 1.67 0.3747 0.2373 55.6 34.4 48 Paper, Paperboard 0.73 1.19 0.64 0.97 0.3838 0.3566 18.8 23.6 33 Perfumery, Cosmetic, Etc 0.56 1.17 0.50 1.54 0.3534 0.5109 19.0 38.1 94 Furniture and Bedding 0.86 1.02 0.40 0.54 0.3662 0.4527 10.0 15.3
Notes: 1. Total industry trade (exports+imports) as a percentage of total U.S. trade with Spain. 2. Intra-industry trade in a specific industry as a percentage of total intra-industry trade. 3. Total intra-industry trade in a specific industry as a percentage of total trade in the industry.
Source: Authors' calculations.
Industry Trade Share (%) ¹
Industry Intra-Trade Share (%) ²
Grubel-Lloyd IIT Index
IIT Share in Total Industry Trade ³
690 Ekanayake, E.M. Ph.D., Veeramacheneni, Bala, Ph. D., and Moslares, Carlos, Ph. D.
Estudios de Economía Aplicada, 2006: 677-698 • Vol. 24-2
Table 7. Top 25 Industries with Highest Trade Share, 1990-2004
(Ranked by IIT Share in Industry Total)
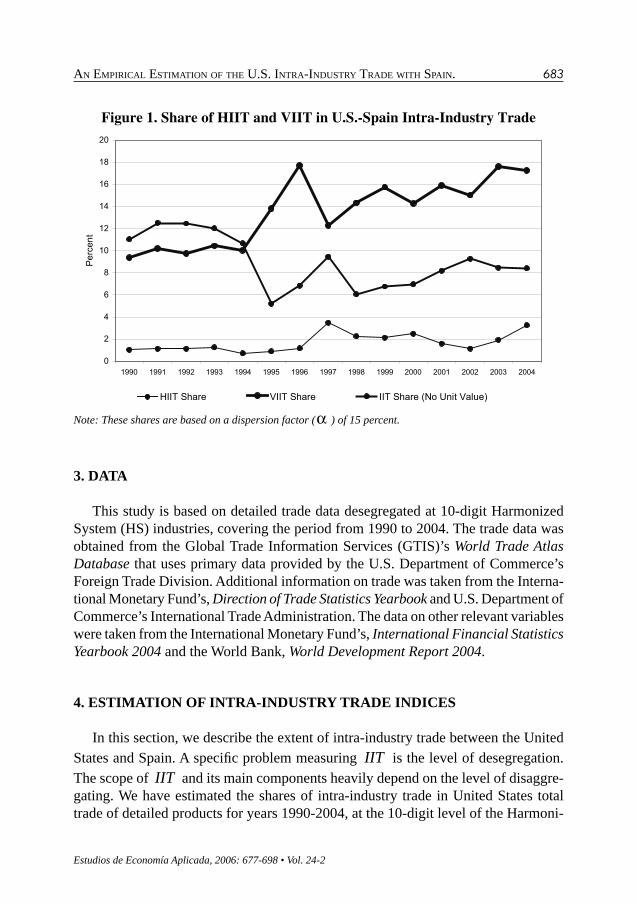
Table 7 presents IIT indices at the 2-digit HS level industries for 1990 and 2004, ranking the industries according to the share of a given industry’s intra-industry trade to the total intra-industry trade. For example, the machinery (HS 84) industry accounts for about a fi fth of total intra-industry trade between the two countries. The pharmaceutical products (HS 30) industry also accounts for nearly a fi fth of total intra-industry trade. These two industries together with electrical machinery (HS 85) industry accounted for more than a half of intra-industry trade in 2004. Of all 25 industries presented in Table 7, majority of them accounted for less than 5 percent in total intra-industry trade. Further, total intra-industry trade share of sixteen of the industries increased during this period. Intra-industry share of aircraft and spacecraft (HS 88) industry dropped signifi cantly from 23.3 percent in 1990 to 1.8 percent in 2004.
HS Industry 1990 2004 1990 2004 1990 2004 1990 2004 84 Machinery 11.22 14.74 19.44 17.43 0.3392 0.3800 37.2 34.2 30 Pharmaceutical Products 0.86 6.40 1.31 14.51 0.3275 0.3455 32.6 65.6 85 Electrical Machinery 5.27 5.88 12.63 9.41 0.3390 0.3500 51.4 46.3 90 Optical and Medical Instruments 3.60 4.26 8.01 8.33 0.2478 0.2617 47.7 56.5 97 Art and Antiques 0.94 1.99 4.26 6.56 0.6897 0.4272 97.3 95.2 08 Edible Fruit and Nuts 0.64 2.46 0.80 5.27 0.3283 0.0225 26.9 62.0 29 Organic Chemicals 2.14 4.71 0.71 3.85 0.3826 0.3176 7.1 23.7 39 Plastic 0.68 1.93 1.12 3.68 0.3807 0.3834 35.2 55.2 27 Mineral Fuel, Oil Etc 9.38 4.75 2.90 3.41 0.1263 0.4677 6.6 20.8 15 Fats and Oils 0.63 0.92 0.00 2.50 0.0000 0.0157 0.0 78.4 68 Stone, Plastr, Cement, Etc 0.88 1.75 2.66 2.20 0.2504 0.3979 65.0 36.3 87 Vehicles, Not Railway 3.54 4.59 4.25 1.79 0.3017 0.2712 25.7 11.3 40 Rubber 1.91 1.40 4.95 1.67 0.3747 0.2373 55.6 34.4 86 Railway; Traffic Sign Eq 0.02 0.55 0.03 1.56 0.7350 0.2418 32.5 81.8 33 Perfumery, Cosmetic, Etc 0.56 1.17 0.50 1.54 0.3534 0.5109 19.0 38.1 49 Book and Newspapr; Manuscripts 0.74 0.59 2.21 1.36 0.4141 0.2825 63.8 66.3 93 Arms and Ammunition 0.64 0.55 0.83 1.29 0.3336 0.1421 27.5 67.6 44 Wood 1.41 2.55 0.47 1.18 0.2880 0.2807 7.1 13.4 48 Paper, Paperboard 0.73 1.19 0.64 0.97 0.3838 0.3566 18.8 23.6 32 Tanning, Dye, Paint, Putty 0.36 0.43 0.28 0.96 0.3127 0.3686 16.9 65.6 83 Misc Art of Base Metal 0.40 0.39 1.44 0.85 0.2153 0.3889 76.8 62.0 89 Ships and Boats 0.76 0.64 0.54 0.80 0.0744 0.3407 15.2 36.4 72 Iron and Steel 2.24 2.28 0.50 0.78 0.2375 0.1937 4.8 9.9 95 Toys and Sports Equipment 0.54 0.54 0.68 0.75 0.3335 0.5224 27.0 40.2 73 Iron and Steel Products 1.28 1.67 0.61 0.62 0.3699 0.5232 10.3 10.8
Notes: 1. Total industry trade (exports+imports) as a percentage of total U.S. trade with Spain. 2. Intra-industry trade in a specific industry as a percentage of total intra-industry trade. 3. Total intra-industry trade in a specific industry as a percentage of total trade in the industry.
Source: Authors' calculations.
IIT Share in Total Industry Trade ³
Industry Trade Share (%) ¹
Industry Intra-Trade Share (%) ²
Grubel-Lloyd IIT Index

691AN EMPIRICAL ESTIMATION OF THE U.S. INTRA-INDUSTRY TRADE WITH SPAIN.
Estudios de Economía Aplicada, 2006: 677-698 • Vol. 24-2
Figure 2 shows the changes in IIT indices at 2-digit HS level industries between 1990 and 2004. The fi gure is drawn measuring Grubel-Lloyd IIT index for the two years in the form of a scatter diagram, with horizontal axis showing 1990 values and vertical axis showing corresponding 2004 values. A point that lies above (below) the diagonal represents an increase (a decrease) in the IIT index between 1990 and 2004. The vertical distance between the diagonal and any point above (below) represents the absolute increase (decrease) in the IIT index over the period. Although Tables 1 and 2 suggest that there is no major change in the structure of IIT over the period, the scatter diagram displays a somewhat different picture. Many products with a high IIT index in 1990 maintained a high IIT index in 2004. Some products with high IIT index in 1990 moved into low IIT index range in 2004. Likewise, some products with low IIT index in 1990 moved into high IIT index range in 2004. Of the ninety eight 2-digit HS level industries shown in Figure 2, fi fty one industries experienced an increased IIT index between 1990 and 2004. These gross movements counter each other, such that there is little change in the net frequency distribution.
Figure 2. Changes in Intra-Industry Trade index by Industry
Key: HS 51: Animal Hair and Yarn, Fabrc HS 67: Artificial Flowers, FeathersHS 62: Woven Apparel HS 78: LeadHS 66: Umbrella, Wlk-Sticks, Etc HS 81: Other Base Metals, Etc.
0.00
0.10
0.20
0.30
0.40
0.50
0.60
0.70
0.80
0.90
0.00 0.10 0.20 0.30 0.40 0.50 0.60 0.70 0.80 0.90 1.00
IIT (1990)
IIT (2
004)
HS67
HS66
HS81
HS78
HS51
HS62

692 Ekanayake, E.M. Ph.D., Veeramacheneni, Bala, Ph. D., and Moslares, Carlos, Ph. D.
Estudios de Economía Aplicada, 2006: 677-698 • Vol. 24-2
Table 8. Share on Vertical and Horizontal Trade, 1990-2004 (%)
(a) Horizontal and Vertical Intra-Industry Trade Share Including Products with No Unit Value
Year = 0.15 = 0.20 = 0.25 = 0.15 = 0.20 = 0.25 = 0.15 = 0.20 = 0.251990 1.0 1.2 1.9 9.4 9.1 8.5 11.0 11.0 11.01991 1.1 1.5 2.2 10.2 9.7 9.1 12.5 12.5 12.51992 1.1 1.2 1.3 9.7 9.6 9.5 12.4 12.4 12.41993 1.2 1.4 1.7 10.4 10.2 10.0 12.0 12.0 12.01994 0.7 1.0 1.4 10.0 9.7 9.3 10.6 10.6 10.61995 0.9 1.5 1.7 13.8 13.2 13.0 5.2 5.2 5.21996 1.2 1.5 2.9 17.7 17.3 15.9 6.8 6.8 6.81997 3.5 4.0 4.3 12.3 11.8 11.4 9.5 9.5 9.51998 2.2 2.6 3.1 14.3 14.0 13.5 6.1 6.1 6.11999 2.1 2.4 2.7 15.7 15.5 15.1 6.8 6.8 6.82000 2.5 3.0 3.5 14.3 13.7 13.2 7.0 7.0 7.02001 1.6 2.1 2.8 15.9 15.4 14.7 8.2 8.2 8.22002 1.1 1.6 2.0 15.0 14.6 14.2 9.3 9.3 9.32003 1.9 3.1 3.5 17.6 16.4 16.0 8.5 8.5 8.52004 3.3 4.4 5.1 17.3 16.1 15.5 8.4 8.4 8.4
(b) Horizontal and Vertical Intra-Industry Trade Share Excluding Products with No Unit Value
Year = 0.15 = 0.20 = 0.25 = 0.15 = 0.20 = 0.251990 9.9 12.0 17.9 90.1 88.0 82.11991 9.8 13.7 19.6 90.2 86.3 80.41992 10.2 11.1 11.8 89.8 88.9 88.21993 10.6 12.4 14.4 89.4 87.6 85.61994 6.6 9.3 13.0 93.4 90.7 87.01995 6.0 10.2 11.5 94.0 89.8 88.51996 6.1 8.0 15.5 93.9 92.0 84.51997 22.1 25.3 27.5 77.9 74.7 72.51998 13.5 15.5 18.6 86.5 84.5 81.41999 11.9 13.4 15.3 88.1 86.6 84.72000 14.8 17.9 20.9 85.2 82.1 79.12001 9.1 12.2 15.9 90.9 87.8 84.12002 7.0 9.6 12.3 93.0 90.4 87.72003 9.8 16.0 17.9 90.2 84.0 82.12004 15.9 21.3 24.7 84.1 78.7 75.3
Source: Authors' calculations.
VIIT ShareHIIT Share
HIIT Share VIIT Share IIT Share (No Unit Value)

693AN EMPIRICAL ESTIMATION OF THE U.S. INTRA-INDUSTRY TRADE WITH SPAIN.
Estudios de Economía Aplicada, 2006: 677-698 • Vol. 24-2
Having discussed the general trends in IIT , let us now discuss the extent of hori-zontal and vertical IIT in U.S. – Spain trade. The shares of horizontal IIT ( HIIT ) and vertical IIT (VIIT ) for the period 1990-2004 are presented in Table 8. Three dispersion factors (α = 15 percent, α = 20 percent, and α = 25 percent) were used to calculate these shares. While most other studies use only one dispersion factor, we used three dispersion factors to check the accuracy of estimates. In the process of calculating these shares, we faced a major obstacle; the unit prices of a large number of products with IIT were not available. Nearly 30 percent of products with IIT in 1990 did not have unit prices. However, this share dropped to 20 percent in 2004. As a result, the actual share of HIIT or VIIT cannot be calculated for these industries. Despite this limitation, our fi rst fi nding is that IIT is overwhelmingly vertical (see Figure 3). It should be noted here that the actual share of vertical IIT may have been underestimated.
Given the level of development and the similarity of per capita incomes of the two trading partners, we would have expected to fi nd most of IIT to be horizontal in nature. However, more than two-third of total intra-industry trade is vertical. This fi nding is not surprising; it is consistent with fi ndings of some recent studies. For example, Greenway et al. (1994) found that vertical IIT are dominant in Spain’s bilateral trade, accounting for almost 80 percent or more of the total number of 5-digit SITC products with every developed country. Further, Fontagne and Freudenburg (2002) also found that vertical IIT are dominant in Spain’s bilateral trade. It is in-teresting to note that regardless of the level of dispersion factor (α = 15 percent, α = 20 percent, and α = 25 percent), vertical IIT are dominant. Vertical IIT has also increased signifi cantly during this period, with vertical IIT share increasing from 63.1 percent in 1990 to 70.5 percent in 2004.
Finally, Table 9 presents results on the breakdown of IIT between horizontal IIT and vertical IIT by major industry groups in 2004. These results confi rm that the vertical IIT are dominant in the United States’ bilateral trade with Spain. Horizontal IIT was dominant only in one industry, namely, mineral products industry, out of a total of 22 industries.

694 Ekanayake, E.M. Ph.D., Veeramacheneni, Bala, Ph. D., and Moslares, Carlos, Ph. D.
Estudios de Economía Aplicada, 2006: 677-698 • Vol. 24-2
Figure 3. Changes in Intra-Industry Trade Share by Industry
Key: HS 14: Other Vegetable HS 86: Railway; Traffic Sign EqHS 19: Baking Related HS 96: Miscellaneous ManufacturesHS 83: Misc Art of Base Metal HS 97: Art and Antiques
-
10
20
30
40
50
60
70
80
90
100
- 10 20 30 40 50 60 70 80 90 100
IIT Share (1990)
IIT S
hare
(200
4)
HS97HS14
HS83
HS86
HS96
HS19

695AN EMPIRICAL ESTIMATION OF THE U.S. INTRA-INDUSTRY TRADE WITH SPAIN.
Estudios de Economía Aplicada, 2006: 677-698 • Vol. 24-2
Table 9. Components of Intra-Industry Trade by Major Industry, 2004
G-LHS Industry IIT Index Total HIIT Share VIIT Share IIT (NUV) Share
01-05 Live Animals; Animal Products 0.3076 5.48 1.62 3.86 0.0006-14 Vegetable Products 0.3127 30.53 24.99 5.55 0.00
15 Animal or Vegetable Fats and Oils 0.0157 78.40 7.47 70.93 0.0016-24 Prepared Foodstuffs; Beverages; Tobacco 0.3191 2.81 1.62 1.19 0.0025-27 Mineral Products 0.4017 20.41 0.12 20.29 0.00
28-38 Products of the Chemical or Allied Industries 0.3818 44.38 11.81 30.46 2.11
39-40 Plastics and Articles thereof; Rubber and Articles thereof 0.3104 46.42 16.08 24.24 6.09
41-43 Raw Hides and Skins, Leather, Furskins and Articles Thereof 0.3001 18.49 6.72 4.32 7.46
44-46Wood and Articles of Wood; Wood Charcoal; Cork and Articles of Cork; Manufacturers of Straw 0.3008 13.13 0.49 12.23 0.41
47-49Pulp of Wood or of Other Fibrous Cellulosic Material; Waste and Scrap of Paper or Paperboard; Paper and Paperboard and Articles Thereof 0.2433 33.20 7.86 25.34 0.00
50-63 Textile and Textile Articles 0.3765 10.92 4.68 6.24 0.00
64-67 Footwear, Headgear, Umbrellas, Walking Sticks, etc. 0.5581 2.08 0.00 2.06 0.02
68-70 Articles of Stone, Plaster, Cement, etc; Ceramic Products; Glass and Glassware 0.4484 17.95 0.10 2.03 15.82
71 Natural Or Cultured Pearls, Precious or Semi-Precious Stones, Precious Metals, etc. 0.4319 7.80 1.21 2.32 4.27
72-83 Base Metals and Articles of Base Metal 0.3950 15.78 2.32 12.73 0.80
84-85 Machinery and Mechanical Appliances; Electrical Equipment; etc. 0.3650 37.65 2.62 26.03 9.00
86-89 Vehicles, Aircraft, Vessels and Associated Transport Equipment 0.3208 11.30 0.42 6.55 4.33
90-92Optical, Photographic, Cinematographic, Measuring, Checking, Precision, Medical or Surgical Instruments and Apparatus; Clocks and Watches; Musical Instruments; 0.2731 54.76 0.53 6.10 48.13
93 Arms and Ammunition; Parts and Accessories Thereof 0.1421 67.60 40.74 8.33 18.54
94-96 Miscellaneous Manufactured Articles 0.4667 30.76 0.38 11.61 18.7797 Works of Art, Collectors' Pieces and Antiques 0.4272 95.25 0.00 0.03 95.22
98-99 Special Classification Provisions 0.0000 0.00 0.00 0.00 0.00Total All Industries 0.3646 28.93 5.04 15.80 8.09
Note: G-L IIT index is the Grubel-Lloyd intra-industry trade index for each industry group weighted by shares in total bilateral trade. IIT share denotes the share of intra-industry trade in a given industry's total trade.
These shares are based on a dispersion factor ( ) of 20 percent.
Source: Authors' calculations.
IIT Share (%)
696 Ekanayake, E.M. Ph.D., Veeramacheneni, Bala, Ph. D., and Moslares, Carlos, Ph. D.
Estudios de Economía Aplicada, 2006: 677-698 • Vol. 24-2
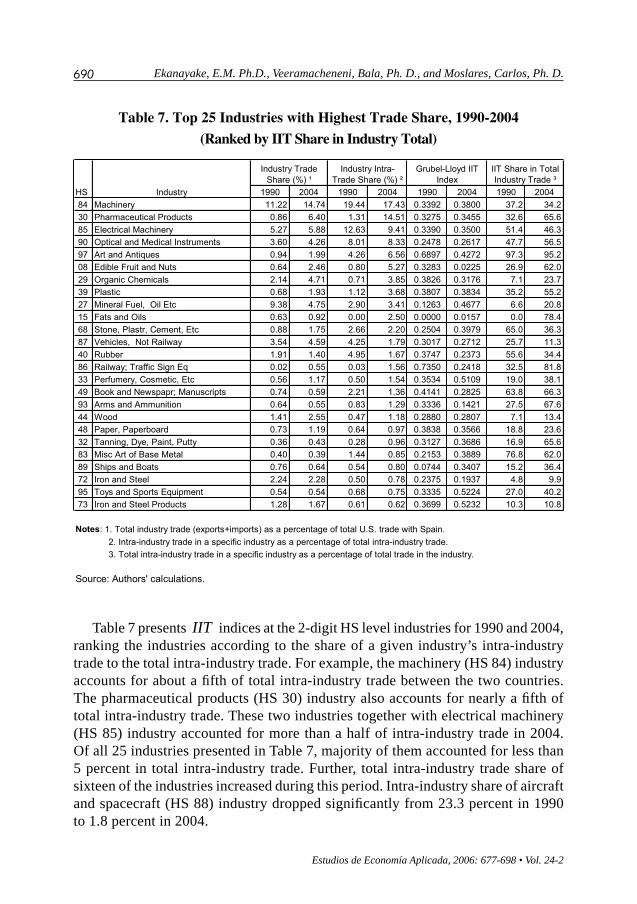
5. SUMMARY AND CONCLUSIONS
This study analyzes the development of intra-industry and inter-industry trade bet-ween the United States and Spain during the period 1990 to 2004. The main objective of this paper is to explain the extent of vertical and horizontal intra-industry trade in United State’s foreign trade with Spain. For this purpose, trade patterns are identifi ed by breaking up total trade into three trade types: one-way trade (i.e. inter-industry trade), two-way trade (i.e. intra-industry trade) in horizontally differentiated products, and two-way trade in vertically differentiated products. Unlike the other studies on intra-industry trade, this study uses detailed trade data at the 10-digit Harmonized System (HS) industry level and covers a longer and more recent period, 1990 through 2004. The Grubel-Lloyd intra-industry trade index is used to calculate the intensity of these two types of intra-industry trade.
One of the main fi ndings is that the observed increase in intra-industry trade between the U.S. and Spain is almost entirely due to two-way trade in vertical diffe-rentiation: thus, the 1990-2004 period is characterized by an increasing specialization of two countries along ranges of qualities within products, suggesting a ‘qualitative’ division of labor. This may also be due to the product differentiation, labor intensity of production, and economies of scale.
Another important fi nding is that the share of vertical intra-industry trade has in-creased signifi cantly during this period. Although it was diffi cult to accurately measure the actual share of vertical intra-industry trade due to the unavailability of unit prices of exports or imports for some industries, it can be observed that the share of vertical intra-industry trade is increasing.
The results also suggest that bilateral trade fl ows between the United States and Spain has become more intense indicating trading relations are strengthening.
Since the main objective of the paper was to measure the extent of vertical and horizontal intra-industry trade in United State’s foreign trade with Spain, no attempt has been made to identify any industry-specifi c determinants of vertical and hori-zontal trade. Identifi cation of these determinants could be a possible extension of this study.

697AN EMPIRICAL ESTIMATION OF THE U.S. INTRA-INDUSTRY TRADE WITH SPAIN.
Estudios de Economía Aplicada, 2006: 677-698 • Vol. 24-2
6. REFERENCES
AQUINO, A. (1978), “Intra-Industry Trade and Inter-Industry Specialization as Concurrent
Sources of International Trade in Manufactures”, Weltwirtschaftliches Archiv, 114(2),
275-296.
ATURUPANE, C., S. DJANKOW and B. HOEKMAN (1999), “Determinants of Intra-Industry Trade
Between East and West Europe”, Weltwirtschaftliches Archiv, 135(1), 60-81.
BALASSA, B. (1979), “Intra-Industry Trade and the Integration of Developing Countries in the
World Economy”, in H. Glersch, ed., On the Economics of Intra-Industry Trade, Tübingen:
J.C.B. Mohr, 245-270.
BALASSA, B. (1986), “Intra-Industry Specialization: A Cross-Country Analysis”, European Eco-
nomic Review, 30(1), 27-42.
BALASSA, B. and L. BAUWENS (1987), “Intra-Industry Specialization in a Multi-Country and Multi-
Industry Framework”, The Economic Journal, 97, 923-939.
BERGSTRAND, J.H. (1983), “Measurement and Determinants of Intra-Industry International Tra-
de”, in P.K.M. Thakaran, ed., Intra-Industry Trade: Empirical and Methodological Aspects,
Amsterdam: Elsevier, 201-253.
CAVES, R.E. (1981), “Intra-Industry Trade and Market Structure in the Industrial Countries”, Oxford
Economic Papers, 33, 203-223.
FLAM, H. and E. HELPMAN (1998), “Vertical Product Differentiation and North-South Trade”,
American Economic Review, 76(5), 810-822.
FONTAGNE, L. and M. FREUDEBERG (2002), “Long-Term Trends in Intra-Industry Trade”, in
Lloyd, P.J. and H.H. Lee (eds.) Frontiers of Research on Intra-Industry Trade (New York:
Palgrave Macmillan), 131-158.
GONZÁLEZ, J.G. and A. VELEZ (1993), “An Empirical Estimation of the Level of Intra-Industry
Trade between Mexico and the United States”, in K. Fatemi, ed., North American Free Trade
Agreement: Opportunities and Challenges, London: Macmillan, 161-172.
GONZALEZ, J.G. and A. VELEZ (1995), “Intra-Industry Trade Between the United States and
the Major Latin American Countries: Measurement and Implications for Free Trade in the
Americas”, The International Trade Journal, 9(4), 519-536.
GREENWAY, D. and C. MILNER (1986), The Economics of Intra-Industry Trade, Oxford: Basil and
Blackwell.
GREENWAY, D. and C. MILNER (1994), “Country-Specific Factors and the Pattern of Horizontal and
Vertical Intra-Industry Trade in the SPAIN”, Weltwertschaftliches Archiv, 130(1), 77-100.
GREENWAY, D. and J. TORSTENSSON (1997), “Back to the Future: Taking Stock on Intra-Industry
Trade”, Weltwertschaftliches Archiv, 133(2), 249-269.

698 Ekanayake, E.M. Ph.D., Veeramacheneni, Bala, Ph. D., and Moslares, Carlos, Ph. D.
Estudios de Economía Aplicada, 2006: 677-698 • Vol. 24-2
GRUBEL, H. and P. LLOYD (1975), Intra-Industry Trade: The Theory and Measurement of Interna-
tional Trade in Differentiated Products, New York: John Wiley and Sons.
GULLSTRAND, J. (2002), “Does the Measurement of Intra-Industry Trade Matter?”, Weltwerts-
chaftliches Archiv, 138(2), 317-340.
HART, T. and B. McDONALD (1992), “Intra-Industry Trade Indexes for Canada, Mexico, and the
United States 1962-87”, Agricultural and Trade Analysis Division, Economic Research
Service, U.S. Department of Agriculture, Staff Report No. AGES 9206, February.
HAVRYLYSHYN, O. and E. CIVAN (1983), “Intra-Industry Trade and the Stage of Development”,
in P.K.M. Thakaran, ed., Intra-Industry Trade: Empirical and Methodological Aspects, Ams-
terdam: Elsevier, 111-140.
HAVRYLYSHYN, O. and P. KUZNEL (1997), “Intra-Industry Trade of Arab Countries: An Indicator
of Potential Competitiveness”, IMF Working Papers, WP/97/47.
HELPMAN, E. (1981), “International Trade in the Presence of Product Differenciation, Economies
of Scale and Monopolistic Competition: a Chamberlin-Heckscher-Ohlin Approach”, Journal
of International Trade, 11, 305-340.
HELPMAN, E. and P. KRUGMAN (1985), Market Structure and Foreign Trade: Increasing Returns, Im-
perfect Competition, and the International Economy, Cambridge, Massachusetts: MIT Press.
HU, X. and Y. MA (1999), “International Intra-Industry of China”, Weltwirtschaftliches Archiv, 135(1),
82-101.
LANCASTER, K. (1980), “Intra-Industry Trade Under Perfect Monopolistic Competition”, Journal
of International Economics, 10, 151-175.
LEE, H. and Y. LEE (1993), “Intra-Industry Trade in Manufactures: The Case of Korea”, Weltwirts-
chaftliches Archiv, 129(1), 159-169.
LINDER, S.B. (1961), An Essay on Trade and Transformation, New York: John Wiley and Sons.
LOERTSCHER, R. and F. WOLTER (1980), “Determinants of Intra-Industry Trade Among Countries
and Across Industries”, Weltwirtschaftliches Archiv, 116(1), 280-293.
MANRIQUE, G. (1987), “Intra-Industry Trade Between Developed and Developing Countries: The
United States and the NICs”, Journal of Developing Areas, 21(4), 481-493.
NILSSON, L. (1999), “Two-Way Trade between Unequal Partners: The EU and the Developing
Countries”, Weltwirtschaftliches Archiv, 135(1), 102-127.
STIGLITZ, J.E. (1987), “The Causes and Consequences of the Dependence of Quality of Price”,
Journal of Economic Literature, 25, 1-48.
STONE, J.A. and H. LEE (1995), “Determinants of Intra-Industry Trade: A Longitudinal and Cross-
Country Analysis”, Weltwirtschaftliches Archiv, 131(1), 67-83.