Embed Size (px)
Citation preview

SHRP-ID/UFR-91-512
An Electrochemical Method for Detecting Ongoing Corrosion
of Steel in a Concrete Structure with CP Applied'
rhrp Strategic Highway Research Program National Research Council
IIIPIIODUCID IV, KIa U.I, Dopetl/Mnt III c.""". ...
IMIII .... TeeMlllllnt.rmlt/." ...... , .. • ",,..n.kI, V'r,''',. 11111


REPORT DOCUMENTATION PAGE Form Approved
OMB No. 0704-0188 J
~--------------------------------------------------~~--------------~------Public reoonlng burd~n Tor tnls, cOllenLon of Inforr."'.ation '; e'Sotlmated to average I hour cer ~~~por.\e. Including the time for reviewing Im,uucticns, ')earcnlng er:l50tlng data ;curc~. ~ ga'thenng and malntc~lInlng the data needed, and (emotellng an~ revle ....... lng the collection of Information. Send comments regarding this ~urden e-\'T.lmate or an, other aspeCT. of l!"ll'S. ~ coUe(tlon of information. Inducing suggestion} for re-duclng th.'Ii buraen. to Wa,h,nglon rleadquan.<ero; SenJices. Directorate for Information Operat,lom, and Reports. 1215 ~eHer'j.cr, ! Da'w-u,-Io., ....... c. ,,;M_L..,n"'--t\ .I ......... ~ ........ _ut\_'_'un 1..t'I JI"J2, and to the Office 01 Management ar,d Budget. Paperworl( Reduction PrOject (0704-0 1 BB), Wa~nlngton. DC 20503. _"
~l"12. REPORT OATE , 3. REPORT TYPE AND DATES COVERED
~~ ___ P_B~9~2=-~1~8_8_1_1_9 __ ~~;\ __ A~~p~r_i_l~1_9_9_1 ____ -L ____ f_i_n_a_l __ r_e~~~o~r~t~~~~~ ________ 1 4. TiTlE AND SUBTITLE 5. FUNDING NUMBERSl
An Electrochemical Bethod for Detecting Ongoing Corrosion of Steel in a Concrete Structure with CP Appl ied
6. AUTHOR(S)
N.G. Thompson, K.B. Lawson
7. PERFORMING ORGANIZA liON NAME(S) AND ADDRESS(ES)
Cortest Columbus, Inc., Columbus, OH
9. SPONSORING I MONITORING AGENCY NAME(S) AND ADDRESS(ES)
Strategic Highway Research Program ~uite 400 B18 Connecticut Avenue N.W. ~ashington, D.C. 20006
11. SUPPLEMENTARY NOTES
12a. DISTRIBUTION I AVAILABILITY STATEMENT
Available to the general public through NTIS and through ~he Transportation Research Board, National Research Founcil, 2101 Constitution Avenue N.W., Washington, D.C. ~0418
ID-OOS
8. PERFORMING ORGANIZATION REPORT NUMBER
None
10. SPONSORING I MONITORING AGENCY REPORT NUMBER
sr-IPP / I D/ UFR - 91/512
12b. DISTRIBUTION CODE
None
13. ABSTRACT (Maximum 200 words), " l ~'J!:p. . II :
An examination ofVthe feasibility of using alternating current 'im:pedan~ ce spectroscopy (ACIS) as a monitoring tool forrthe detection ofl 1 corrosion on cathodically protected reinforced steel in concret% Bot~ relatively small concrete blocks with a single reinforcement steel 1 specimen, and large concrete slabs containing two mats of reinforc- !.i
ment steel were constructed for the?evaluation 6£ the ACIS technique .. Although the feasibility of the technique was demonstrated for the concrete blocks containing a single reinforcement steel specimen, difficulties in interpretation of the data were created by t~e large macrocell couples that were ±n the large-scale §l~b tests. ~ -
" couples, Nyq~ist plot, polarization resistance, potential decay measurement, Randles plot, rebar, reference electrode, Warburg impedance spectrum, impedance spectroscopy.
j , " j
1
14. SUBJECT TERMS ACIS, AC impedance spectroscopy, bridge 15. NUMBER OF PAGES ;
s1 I decks, cathodic protection, CP, concrete, corrosion, free-corrosion potential data, macrocell corrosion
NSN 7540-01-280·5500
~16~.-P~R~IC~E-C~O~D~E~--------l
Star,daro Form 298 (Rev 2-89) ~r~~c:rIO'2'a 0'1 ,:,,'JSI S~CI l39·1S 29'O-:J2
I


SHRP-IDjUFR-91-512
An Electrochemical Method for Detecting Ongoing Corrosion
of Steel in a Concrete Structure with CP Applied
rhrp
. N.G. Thompson K.M. Lawson
Cortest Columbus, Inc. Columbus, Ohio
Strategic Highway Research Program National Research Council
Washington, D.C. 1991
SHRP-ID /UFR-91-512 Project Managers: John Broomfield and Ataur Bacchus Production Editor: Sarah K Fox
April 1991
key words: AC impedance spectroscopy (ACIS) bridge decks cathodic protection (CP) cathodically protected reinforcing steel concrete corrosion free-corrosion potential data macro-cell corrosion couples Nyquist Plot polarization resistance (PR) potential decay measurement Randles Plot rebar reference electrode Warburg Impedance Spectrum
Strategic Highway Research Program 2101 Constitution Avenue, N.W. Washington, D.C. 20418
(202) 334-3774
The pUblication of this report does not necessarily indicate approval or endorsement of the findings, opinions, conclusions, or recommendations either inferred or specifically expressed herein by the National Academy of Sciences, the United States Government, or the American Association of State Highway and Transportation Officials or its member states.
,I
If

Acknowledgments
The research described herein was supported by the Strategic Highway Research Program (SHRP). SHRP is a unit of the National Research Council that was authorized by section 128 of the Surface Transportation and Uniform Relocation Assistance Act of 1987.
iii


Contents
ABSTRACT .•...•......•.•.•....•..........•.•.•.•......•...•...•...•.•. 1
EXECUTIVE SUMMARy..................................................... 2
INTRODUCTION. • . • . . • . • . • . . . • . . . . . . • . . . • . . • . . . . . . . • . . • . . . . . . . • . . . . . • . • . • 4
EXPERIMENTAL PROCEDURES............................................... 6
Task 1 - Laboratory Experiments With Single Reinforcing Steel Specimens .••...•.•.•.•...•......•............. 6
Task 2 - Large Concrete Slab Exposures........................... 12
ANALYSIS OF ACIS DATA................................................. 15
RESULTS. . • . • . . . . • . . . . • . . . . . • . . . . • . • . . . . . . . . • . • . . . • . . . . . . • . . • • . • . . . . . . . 18
'~ask 1 - Laboratory Experiments With Single Reinforcing Steel Specimens ••.•.•.•..••..•.........•..•••...•.•.. 18
Free Corrosion Conditions .•...•.•...•.•....•.•.•.......•...• 18
Cathodically Polarized Conditions .•.•.•......•...•.•.....•.. 29
Task 2 - Large Concrete Slab Exposures .....•...•................. 33
DISCUSSION AND CONCLUSIONS.......................................... .. 45
REFERENCES. • . . . . . . . . . • . . . . • . . . • • . • . • . • • • . . • . • . . . . • . • . . . . . . . . . • . . . . . . .. 47
I Preceding page blank I
y
Figures
Figure 1. Schematic Diagram Of Experimental Set-up .•.•.•.••.•.•..•... 7
Figure 2. Experimental Setup For The 4" x 4" x 9" Re bar Spec imens ••.......................•.•.•...•..•.•..•.. 11
Figure 3. Schematic Diagrams Of Concrete Slabs Detailing Location Of Isolated Rebar Sections ..........•............. 13
Figure 4. Schematics Of The Equivalent Electrical Circuits For The Models Used In This Study .•......•...•.•..•....•..• 16
Figure 5. Nyquist Plot Of A Single Charge Transfer Impedance Spectrum ..........•...•...•.•...........•..•..... 17
Figure 6. Nyquist Plot Of A Warburg Impedance Spectrum ....•.•..•.•..• 17
Figure 7. Free-Corrosion Potential Data For Specimens la And Ib (No Chlorides) •.•.............•...•.•....•.•..•.. 19
Figure 8. Free-Corrosion Poteitial Data For Specimens 2a And 2b (6 lbs/yd CI-) ..•...•...............•.•.•.....•. 19
Figure 9. Free-Corrosion Potential Data For Specimens 3a, 3b, 13, 14, And 15 (15 Ibs/yd3 CI-) .•......•.........•. 20
Figure 10. Free-Corrosion Potential iata For Specimens 4a, 4b, And 12 (45 lbs/yd CI-) •.......•..•.....•......••.. 20
Figure 11. Free-Corrosion Potential Data For Specimen 16 3 ("Set 45" Repair/Patch Material With 15 lbs/yd CI-) ...... . 21
vi

Figure 12. Free-Corrosion Potential Data For Specimen 18 ("Rapid Road Ripa~r", Repair Patch Material With 15 Ibs/yd CI)....................................... 21
Figure 13. ACIS Spectra For Specimen Ib After 162 Days Exposure Of Carbon Steel Rebar In The Standard Concrete With No Chlorides Added........................... 23
Figure 14. ACIS Spectra For Specimen 14 After 12, 42, And 153 Days Exposure Of Carbon Steel Rebar In The Standard Concrete With 15 lbs/yd CI- Added................ 25
Figure 15. ACIS Spectra For Specimen 4a After 13 And 41 Days Exposure Of Carbon Steel R~bar In The Standard Concrete With 45 lbs/yd CI Added......................... 27
Figure 16. Randles PI~t Of ACIS Spectra From Specimen 4a (45 lbs/yd CI, Freely Corroding) After 34 Days Exposure. . . . . . . . . . . . . . . . . . . . . . . . . . . . . . . . . . . . . . . . . . . . . . . . . . . 28
Figure 17. ACIS Spectra For Specimen 5 After 93 Days Exposure Of Carbon Steel Rebar In The Standard Concrete With 15 Ibs/yd3 CI- Added And Polarized 50mV to -O.500V, SCE.... 31
Figure 18. ACIS Spectra For Specimen 17 After 81 Days Exposure Of Carbon Steel Rebar I~ "Set 45" Repair/Patch Material With 15 lbs/yd CI- Added And Polarized 200mV to -0.650V, SCE............................ ........... 32
Figure 19. ACIS Spectra For Specimen 13 After Cathodically Polarizing 200mV To -0.650V, SCE........................... 34
Figure 20. Potential Distribution Of Test Slab No. 1 With Sandblasted Rebar Under Freely Corroding Conditions........ 35
Figure 21. Potential Distribution Of Test Slab No.2 With Sandblasted Rebar Under Freely Corroding Conditions........ 35
Figure 22. Potential Distribution Of Test Slab No. 4 With Sandblasted Rebar Under Freely Corroding Conditions........ 36
Figure 23. Potential Distribution Of Test Slab No. 3 With Mill Scaled Rebar Under Freely Corroding Conditions........ 36
vii

Figure 24. ACIS Spectra For Slab No. 1 After 66 Days EXPoJure~ Measurements Made Using Guard Ring In 0 lbs/yd Cl Added Quadrant ............................................ .
Figure 25. ACIS Spectra For Slab No. 1 After 66 Days Expos~re._ Measurements Made Using Guard Ring In 45 lbs/yd Cl Added Quadrant ............................................ .
Figure 26. ACIS Spectra For Slab No. 1 After 66 Days Exposure. Measurements Made 0i Di!connected Isolated Rebar Section In 0 lbs/yd Cl Added Quadrant ................... .
Figure 27. ACIS Spectra For Slab No.1 After 66 Days Exposure. Measurements Made On Disconnected Isolated Rebar
/ 3-Section In 45 lbs yd Cl Added Quadrant .................. .
Figure 28. ACIS Spectra For Slab No. 1 After Being Polarized For 28 Days.
3 M~asurements Made With Guard Ring In
The 0 lbs/yd Cl Added Quadrant .......................... .
Figure 29. ACIS Spectra For Slab No. 1 After Being Polarized For 28 Days. Measurements Made With Guard Ring In
/ 3 -The 45 lbs yd Cl Added Quadrant ......................... .
viii
38
39
40
41
42
43

Tables
Table 1. Task 1 - Test Matrix........................................ 8
Table 2. Summary Of Results From Task 1 - Single Reinforcing Steel Specimens During Freely-Corroding Conditions.......... 22
Table 3. Summary Of Results Of Tests Performed To Evaluate The Effect Of DiffJreny CP Levels On Specimens Prepared With 15 lbs/yd CI Added................................... 30
ix


Abstract
In this study the feasibility of using AC impedance spectroscopy (ACIS) as a monitoring tool for detecting corrosion on cathodically protected reinforcing steel in concrete was examined. Both relatively small concrete blocks with a single reinforcing steel specimen, and large concrete slabs containing two mats of reinforcing steel were constructed for the purpose of evaluating the ACIS technique.
Although the feasibility of the technique was demonstrated for the concrete blocks containing a single reinforcing steel specimen, difficulties in interpretation of the data were created by the large macro-cell couples that were present in the large-scale slab tests.
There are no methods available to directly detect corrosion or to measure the amount of corrosion on cathodically protected reinforcing steel in concrete structures. The present technology for corrosion measurement prior to energizing a CP system consists of measuring a potential of the reinforcing steel with respect to a Cu/CuS04 reference electrode, and inferring from that potential whether corrosion has initiated. On cathodically protected structures, the effectiveness of the system is generally related to one or more criteria that require the measurement of potentials with respect to a reference electrode. Based on the potential measurement of a potential decay measurement, the corrosion activity is inferred.
1

Executive Summary
The overall objective of this research project was to establish the feasibility of an AC impedance spectroscopy (ACIS) method to detect ongoing corrosion on a cathodically protected reinforced concrete structure. The ultimate goal was to establish a simple technique to evaluate the effectiveness of a CP system without complicated criteria or measurement techniques.
The scope of the research was limited to laboratory investigations on relatively small concrete blocks with a single reinforcing steel specimen, and concrete slabs containing two reinforcement steel mats, which better simulated bridge deck conditions.
There are no methods available to directly detect corrosion or to measure the amount of corrosion on cathodically protected reinforcing steel in concrete structures. The present technology for corrosion measurement" prior to energizing a CP system consists of measuring a potential of the reinforcing steel with respect to a Cu/CuSO. reference electrode, and inferring from that potential whether corrosion has initiated. On cathodically protected structures, the effectiveness of the system is generally related to one or more criteria that require the measurement of potentials with respect to a reference electrode. Based on the potential measurement of a potential decay measurement, the corrosion activity is inferred.
The work plan was divided into two tasks: Task 1 - Laboratory Experiments with Single Reinforcing Steel Specimens, and Task 2 - Large Concrete Slab Exposures. The purpose of Task 1 was to evaluate the ACIS method for detecting corrosion for a number of varying test conditions on simple, well-controlled test specimens that permitted evaluations of the levels of corrosion obtained during the exposures. The purpose of Task 2 was to better simulate field conditions for evaluating the ACIS method of detecting corrosion in actual field applications.
Variables examined in the Task 1 research included the level of cathodic protection (CP) applied, the relative time until CP was applied, chloride concentration, and type of concrete. The Task 1 results indicated that for single reinforcing steel specimens, significant changes in the impedance spectra occur upon going from a corroding
2

condition to either a condition where corrosion is extremely low (passive condition) or where corrosion is mitigated by adequate levels of cathodic protection. Visual examination of the reinforcing steel samples following exposure in Task 1 confirmed that the basic premise of predicting corrosion behavior based on the ACIS spectra is feasible for small, single lengths of reinforcing steel.
Task 2 research involved the more realistic conditions of larger, multiple reinforcing steel mats in a concrete slab containing differential chloride concentrations. Potential mapping of the surface of the slabs was performed to establish corroding areas. The potential mapping indicated the presence of significant macro-cell corrosion couples. It was determined that the presence of the macro-cell corrosion couples complicated the interpretation of the ACIS spectra. Some differences in the ACIS spectra were identified depending on whether the steel was corroding, passive, or cathodically protected. However, there were much more subtle differences, and of a different nature than the original premise of this program.
The data obtained during this program indicated another very important aspect of measuring or monitoring corrosion rates under freely corroding conditions. It has been discussed within the corrosion community that polarization resistance techniques are appropriate for mapping the corrosion rate of a concrete structure. However, the polarization resistance technique cannot differentiate between anodic and cathodic activity; it only measures the total electrochemical activity, or current. This study indicates that careful interpretation of polarization resistance measurements are required. In the vicinity of macro-cell corrosion couples, polarization resistance provides an overestimate of the corrosion rate of the noncorroding areas. The authors believe that a combination of potential and polarization resistance mapping can provide an accurate description of the corrosion conditions of a bridge deck, when properly interpreted.
3

Introduction
This program was an initial study to establish the feasibility of an ACIS method to detect ongoing corrosion on a cathodically protected structure. Because the ACIS method has the ability to detect ongoing corrosion without interruption of the cathodic protection (CP) system, it would permit the effectiveness of the CP system to be determined. Also, the ACIS method is a more direct means of establishing ongoing corrosion than the presently used polarization decay or potential measurement, from which the corrosion activity can only be inferred.
The ACIS method involves measuring the impedance of the reinforcing steel-concrete interface as the basis of the monitoring method. The impedance measurement is made as a function of frequency. ACIS is a nondestructive technique that employs a small amplitude AC signal applied between the reinforcing steel and a counter electrode, and produces data from which the electrochemical reaction mechanisms can be determined. From the impedance spectrum, the polarization resistance of the reinforcing steel interface can also be determined. For conditions without cathodic polarization and in the absence of macro-cell corrosion (i.e. active anodic and cathodic sites separated by distances greater than the area which the reference cell is sensing) the polarization resistance (PR) value can be related to the corrosion rate of the steel through the Stern-Geary relationship. In the presence of cathodic protection, the PR is no longer related to the corrosion rate; and, in fact, under certain circumstances it can be related to the amount of cathodic current being applied to the steel specimen. Therefore, the value of the PR cannot be utilized to establish corrosion rate of the reinforcing steel when CP is applied.
The basic premise of this work was based on the fact that significant changes in the ACIS spectrum ocyur upon application of cathodic protection. Previous work by the authors() has indicated the following: (1) when corrosion is occurring, the ACIS spectrum is dominated by a Warburg type behavior; (2) in a system undergoing no corrosion and without CP applied, the
4

ACIS spectrum is represented by a single time constant response with a large PR value (low corrosion rate); and (3) in a system with adequate cathodic protection applied and little or no corrosion occurring, the ACIS spectrum reveals a single time constant response. However, in this last case, the PR value is affected by the magnitude of the applied CP current and may vary from small to large. For this reason, the magnitude of the PR value alone cannot be used to differentiate corroding versus non-corroding conditions with CP applied. However, the mechanism defined by the ACIS spectrum can differentiate corroding from non-corroding conditions based on the above hypothesis. For steel that is corroding, the corrosion rate is governed by the rate of diffusion of oxygen to the steel, and the ACIS spectrum is dominated by a Warburg impedance. A Warburg impedance accounts for mass transfer I imitations due to diffus ional processes. When these diffus ional effects control the electrochemical react ion rate, the impedance of the reaction is called a Warburg impedance.
The scope of the research was limited to laboratory investigations on relatively small concrete blocks with a single reinforcing steel specimen and concrete slabs containing two reinforcing steel mats which better simulated bridge deck conditions. This phase of the research was divided into two tasks: Task 1 Laboratory Experiments With Single Reinforcing Steel Specimens, and Task 2 - Large Concrete Slab Exposures.
5

Experimental Procedures
Task 1 - Laboratory Experiments With Single Reinforcing Steel Specimens
The purposes of Task 1 were to evaluate the ACIS method for detecting corrosion for a number of varying tests conditions and to permit careful evaluations of the levels of corrosion obtained during the exposures. The variables examined were:
(1) CP level,
(2) relative time until CP is applied,
(3) chloride (Cl-) concentration, and
(4) type of concrete.
The measurements made during the tests were ACIS spectrum, on- and offpotentials, and the applied current from the CP system. The experimental equipment used in this study consisted of a Princeton Applied Research Hodel 273 potentiostat in conjunction with a Solartron Hodel 1250 Frequency Response Analyzer interfaced to an Apple lIe computer for data acquisition, storage and plotting. The experimental setup is shown schematically in Figure 1. The typical spectra measured included frequencies ranging from 5000 Hz to 0.01 Hz, at an AC amplitude of 10 millivolts. The data were analyzed for one complete cycle at each frequency. In special circumstances, frequencies down to 0.001 Hz were investigated.
The test matrix of experiments to be performed in Task 1 is shown in Table 1. The matrix was designed to incorporate the broad range of Cl- levels and polarization levels as well as allowing for time for corrosion to initiate. The majority of the tests in the matrix utilized a typical highway
6

REFERENCE ELECTRODE
~.
"
DISK DRIVES
TEST CELL WORKING
ELECTRODE (Sample)
U
,. PRINCETON APPLIED
RESEARCH
MODEL 273 POTENTIOSTAT
, V , I
SOLARTRON
MODEL 1250 FREQUENCY RESPONSE
ANALYZER
APPLE lie
COMPUTER
, EPSON PRINTER
COUNTER
ELECTRODE
j~ ~
, H P PLOTTER
Figure 1. Schematic Diagram Of Experimental Set-up.
7

Table 1. Task 1 - Test Matrix.
Table lao CP Applied Immediately.
Polarization Yith Respect To E cor' Chloride (Specimen Number)
Concrete Concentration (lbs/yd3) Freely
Corroding -50mV -lOOmV -20amV -30amv
Standard 0 No. 1 - - No. 9 -Standard 6 No. 2 - - No. 10 -Standard 15 No. 3 No. 5 No. 6 No. 7 No. B
Standard 45 No. 4 - - No. 11 -Set 45 15 No. 16 - - No. 17 -Rapid Road 15 No. 18 - - No. 19 -Repair
Table lb. Corrosion Allowed To Initiate.
Cl-Specimen Concentration, Polarization
Concrete No. lbs/yd3 Level, mV
Standard 12 45 200
Standard 13 15 200
Standard 14 15 50·
Standard 15 15 300
8

concrete mix currently being used in other SHRP funded research (C-102). (2) Also, two repair/patch materials currently being used by The Ohio Department of Transportation (ODOT) were also included. In addition to the 19 tests described in Table I, duplicates (designated a & b) of the freely corroding specimens (specimens 1-4) were performed for the purpose of providing additional baseline data. As seen in Table I, these 23 specimens included tests which were to remain in the freely corroding condition (FC) during the entire test, specimens that would freely corrode for some initial exposure then undergo cathodic protection, and specimens which would be cathodically protected within a couple of days of being cast.
Individual specimens consisted of 0.375 inch diameter steel reinforcement bars embedded in rectangular concrete blocks. The reinforcing steel was sand blasted to a white metal finish, stamped with identification number, degreased, and weighed to the nearest 0.0001 gram. One end of the bar was masked off using a duplex shrink tubing to eliminate any end effects. The shrink tubing which was used has an inner layer that melts and adheres to the reinforcing bar and an outer layer that shrinks, thereby masking the desired specimen area. The interface where the bar leaves the concrete was also masked off with the same shrink tubing to eliminate any differential aeration effects which could occur at the atmosphere/concrete interface. The rebar was then degreased and placed into a specimen mold. The mold was constructed of fiber board and had internal dimensions of 4" x 4" x 9". No mold releasing agent was required.
The concrete mix is basically defined as Ohio Department Of Transportation Type C Concrete with the following composition:
• 612 lbs/yd3 Columbia Type 1 Cement,
• 1310 lbs/Yd3 Frank Road Sand,
• 1662 lbs/yd3 Aggregate (Columbus Limestone {157),
• 306 lbs/yd3 Water, and
• 6% Air.
When required, Cl was added to this mix by dissolving the appropriate amount of reagent grade sodium chloride (NaCl) into the mix water prior to mixing the concrete.
A review of recent literature was performed to examine the application of ACIS to corrosion of reinforcing steel in concrete, and to examine, in general, articles pertaining to corrosion of reinforcing steel in concrete. The literature review helped establish the details of the work plan for Task
9

1. In a paper by Carl Locke,(3) corrosion rates were examined as a function of Cl- content for (1) adding the CI- when the concrete was mixed and (2) permitting diffusion of Cl- into an otherwise CI- free concrete. Locke showed that for Cl- diffused into the concrete a lower percentage of Cl- provided a higher corrosion rate than for similar concentrations for Cl- mixed into the concrete. It was shown, however, that mixing the CI- into the concrete could provide significant corrosion. Based on this study and others, the following CI- co~centrations were selected for use in this study: 0, 6, 15, and 45 lbs/yd . The highest concentration of Cl- is an extremely high value, but was selected for this study because of the desire to have a high rate of corrosion in a relatively short time period.
The repair/patch materials used in this phase of the work were chosen based on: (1) common use by the Ohio Department of Transportation, (2) significant differences from regular mix, and (3) availability. The materials chosen were: (1) "Set 45", a non-Portland cementitious material manufactured by Set Products, Inc.; and (2) "Rapid Road Repair", a Portland cement with calcium sulfate and glass fibers manufactured by Quick Crete Companies. These materials were prepared as per manufacturer I s instructions. When required, Cladditions were again made by dissolving NaCI into the mix water.
The concrete was thoroughly mixed in a motor-driven concrete mixer and poured into the molds. After curing in the molds for two to three days, the concrete specimens were removed from their molds. Ponds were constructed on the top surface of the specimens by attaching Lucite panels to the concrete with silicon sealant. The ponds allowed for periodic wet-dry cycles.
Anodes required for polarization were attached to either side of the specimen by embedding a primary anode wire into a conductive grout (Anode Crete by Harco) applied to both sides of each specimen. When required, a permanent reference electrode was prepared by placing a standard calomel reference electrode into a small polyethylene bottle attached to the top of the specimen with silicon sealant and filled with water. With this arrangement, the specimens could be continuously potentiostatically polarized during the wet-dry cycles.
Figure·2 shows the experimental set up for the 4" x 4" x 9" concrete/ rebar specimens being tested in Task 1.
10

/POLYETHYLENE BOTTLE FOR ~_--'""- /' REFERENCE ELECTRODE
CONCRETE SAMPLE
PRIMARY ANODE WIRE
Figure 2. Experimental Setup For The 4" x 4" x 9" Rebar Specimens.
11

Task 2 - Large Concrete Slab Exposures
The purpose of Task 2 was to better simulate field conditions for evaluating the ACIS method of detecting corrosion. The test slabs consisted of 44" x 44" x 5" concrete slabs with two mats of reinforcing steel bar. The specific test conditions were selected based on the results of the laboratory exposures in Task 1. Conditions examined were specifically designed to simulate the complicated field conditions of differential Cl- distribution which produce signif icant variations in the potential mapping of a bridge deck.
The larger exposure slabs which were designed for Task 2 portion of the research are shown schematically in Figure 3. The concrete slab had two mats of reinforcing steel including four isolated rebar sections per slab. To create the isolated rebar sections, a section of reinforcing steel 6" in length was removed from the standard length of the bar, weighed, and instrumented. The rebar section was placed back in line with the reinforcing steel bar using PTFE spacers and shrink tubing to hold the section in place. Electrical connection between the rebar section and the remaining reinforcing steel was then made on the outside of the slab and, for all practical purposes, the length of rebar was electrically continuous. The isolated rebar section permitted careful weight-loss measurements to be made and permitted ACIS spectra to be obtained from a section of reinforcing steel of known area. Data from the rebar section was compared to data collected on the larger area of reinforcing steel mats.
The anode system consisted of strips of anode grout with a primary anode wire down the center of each strip. Potential mapping of the surface was performed by overlaying a 4" grid pattern over the slab. The concrete mix itself corresponded to standard concrete previously described for the smaller concrete specimens. The concrete for the test slabs was poured in four quadrants, each with a different Cl- level. The purpose of casting the concrete in four quadrants with different Cl- levels was to produce differential cell corrosion couples which simulate the corrosion due to spacial distribution of Cl- on an actual bridge deck. The far right quadrant had no Cl-, the far left quadrant had 15 IbS/Yd3 of Cl-, the near right quadrant had 6 Ibs/yd3 of Cl-, and near left quadrant had 45 lbs/yd3 of Cl-. Pouring was performed such that a minimum time interval was permitted for curing of one quadrant prior to pouring the next. This pr~vented cold joints between quadrants while allowing only a minimal amount of mixing at the joints.
12

Ground Flat • Tapped 10 AWG Wire
~1'-----------6·------------~
A
Figure 3. Schematic Diagrams Of Concrete Slabs Detailing Location Of Isolated Rebar Sections.
13

Test Slabs 1, 2, and 4 were identical and were initially permitted to freely corrode. In these three tests slabs, the rebar was sand-blasted to a near white finish, as was done for the single rebar specimens in Task 1. In Slab 3, the rebar specimens were in an "as received" condition, I.e. mill scaled finish.
14

Analysis Of ACIS Data
Two simple equivalent electrical circuits were used to simulate the metal/solution electrochemical interface. These two circuits are shown in Figure 4. The first equivalent circuit, Figure 4a, models a metal/solution interface which would exhibit a single time constant, charge transfer response. In this model R represents the solution resistance, R represents the charge transfer resistaSnce (polarization resistance), and Cd re~resents the capacitance of the interface (double layer capacitance). The second model, Figure 4b, includes the Warburg impedance, Z , which represents the impedance of a diffusion controlled process. W
Impedance data can be presented by both Nyquist and Bode plots. Nyquist plots are complex plane plots of the real and imaginary components of the impedance. A Nyquist plot for the case of a single charge transfer model (Figure 4a), appears as a semicircle with the high frequency intersection of the x-axis equal to R , and the low frequency intersection of the x-axis equal to R + R. The Warb~rg impedance creates a deviation from the single timecons~ant ~emicircular behavior at the low end of the frequency spectrum, and is represented by a linear portion of the curve with a slope of 1. Warburg impedances can also be resolved in Bode plots by a constant phase angle shift of 45 degrees. Figures 5 and 6 illustrate Nyquist plots of a single charge transfer impedance spectrum and a Warburg impedance spectrum, respectively.
15
--:~ .. " .. -:...,

Electrolyte
Rs
Rp
Double Layer
I Substrate
R • S
Uncompensated Resistance (electrolyte resistance between Luggin probe and outside of double layer)
R • Polarization Resistance p (resistance to electron transfer
across interface)
C • Double Layer Capacitance (capacitance due to positive and negative charge separation across interface)
(a) Charge Transfer Control/Time Constant Hodel.
Double Layer
• I Substra,e
W • Warburg Impedance (impedance representing a diffusion controlled reaction)
(b) Diffusional Control/Warburg Impedance Hodel.
Figure 4. Schematics Of The Equivalent Electrical Circuits For The Hodels Used In This Study.
16

z'
Figure 5. Nyquist Plot Of A Single Charge Transfer Impedance Spectrum.
z·
z'
Figure 6. Nyquist Plot Of A War burg Impedance Spectrum.
17
Results
Task 1 - Laboratory Experiments With Single Reinforcing Steel Specimens
Free-Corrosion Conditions
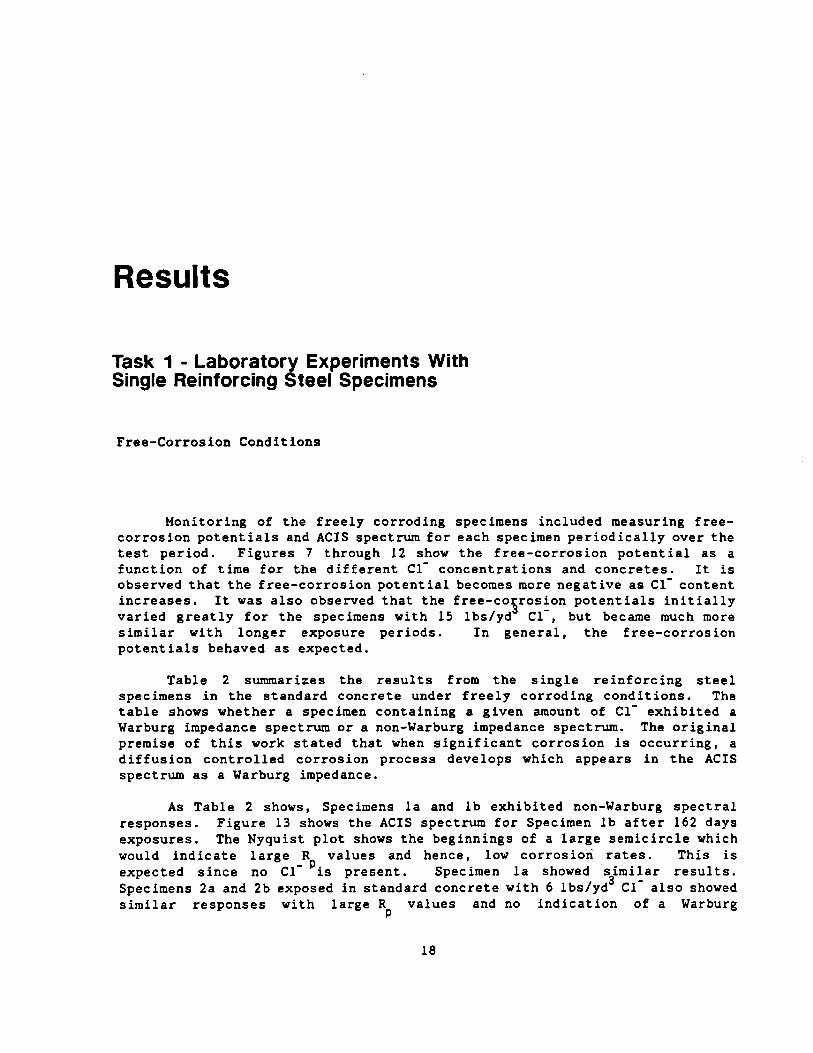
Monitoring of the freely corroding specimens included measuring freecorrosion potentials and ACIS spectrum for each specimen periodically over the test period. Figures 7 through 12 show the free-corrosion potential as a function of time for the different Cl- concentrations and concretes. It is observed that the free-corrosion potential becomes more negative as Cl- content increases. It was also observed that the free-co~ros~on potentials initially varied greatly for the specimens with 15 Ibs/yd Cl, but became much more similar with longer exposure periods. In general, the free-corrosion potentials behaved as expected.
Table 2 summarizes the results from the single reinforcing steel specimens in the standard concrete under freely corroding conditions. The table shows whether a specimen containing a given amount of Cl- exhibited a Warburg impedance spectrum or a non-Warburg impedance spectrum. The original premise of this work stated that when significant corrosion is occurring, a diffusion controlled corrosion process develops which appears in the ACIS spectrum as a Warburg impedance.
As Table 2 shows, Specimens la and Ib exhibited non-Warburg spectral responses. Figure 13 shows the ACIS spectrum for Specimen 1b after 162 days exposures. The Nyquist plot shows the beginnings of a large semicircle which would indicate large R values and hence, low corrosiori rates. This is expected since no Cl- Pis present. Specimen la showed similar results. Specimens 2a and 2b exposed in standard concrete with 6 lbs/yd3 Cl- also showed similar responses with large R values and no indication of a Warburg
P
18
~
~ u ~
• > ~
= = c u ~
0.000 ~----------~----------------------------------~
-0. 120
-0.240
-0.360
-0.460
-0.6000~------1-0·0-0------2-0·0-0------3-0~0-0------4-0~0-0-------SO~0-0-------6~000 EXPOSURE TIME (HOURS>
Figure 7. Free-Corrosion Potential Data For Specimens la And lb (No Chlorides).
0.000 ~------------------------------------------------~
-O.BOOO~------~------~--------~------~------~--------J 1000 2000 3000 4000 5000 BOOO
EXPOSURE TIME (HOURS)
Figure 8. Free-Corrosion Poteftial Data For Specimens 2a And 2b (6 lbs/yd Cl-).
19

... III u 1/1
• > ~ a: a: Q u III
a:
0.000 r-------------------------------------------------------------------------------------------------~
-0. 120
-0.240
-0.3S0
·38 ·3A
-0.480
-0.SOOO~------~1~0~0~0------~2~0~0~0---------3~0~OO----------4-0·0-0---------50~OO----------S-JOOO
Figure 9.
EXPOSURE T I ME (HOURS)
Free-Corrosion Potential Data For Specimens 3a, 3b, 13, 14, And 15 (15 lbs/yd3 Cl-).
0.000 r---------------------------------------------------------------------------------------------~
-0.120
l§ -0.360 u III
-0.480
-0. 600 0L----------1-0~0--0---------2--0..L.0~0---------3-0..l.0-0---------4-000..l.----------s-0 ... 0-0----------e0.J00 EXPOSURE T I ME <HOURS)
Figure 10. Free-Corrosion Potential iata For Specimens 4a, 4b, And 12 (45 lbs/yd Cl-).
20

0.000 r-----------------------------------------------~
-0.120
... .., u -0.240 ~ VI
• :.
~ a: a: -0.3eo c u ..,
~ -O.6000~------~1~00~O------~2=O~O~0---------3~O~0=O---~----4000~----------50~0~0----------6~OOO EXPOSURE TIME (HOURS)
Figure 11. Free-Corrosion Potential Data For Specimen 16 ("Set 45" Repair/Patch Haterial With 15 lbs/yd3 Cl-).
0.000 ~----------------------------------------------~
-0.120
... .., u -0.240 11'1
• >
~
a: 0: -0.360 c u III
-0.480
-0.6000L----------I-O~O~O---------2~O~O=O---------~30~O=O----------40~O~0~------~5~OOO~------~6~O-OO EXPOSURE TIME (HOURS)
Figure 12. Free-Corrosion Potential Data For Specimen 18 ("Rapid Road Repair", Repair Patch Haterial With 15 lbs/yd3 Cl-).
21

Table 2. Summary Of Results From Task 1 - Single Reinforcing Steel Specimens During Freely-Corroding Conditions.
Specimen Nos. Chloride Observed Spectra
Concentraiion (lbs/yd ) Warburg Non-Warburg
0 la, Ib
6 2a, 2b
• •• IS 3a, 3b, 13, 14, IS. 16 • 18
4S 4a, 4b, 12
• Set 45 - Repair/Fatch Material .. Rapid Road Repair - Repair/Fatch Material
22

A
3
2: e N
2
~
-2
2500
2250
2000
l750
l500
l250
Z JOOO %: 9
750 1.:1 < z 500 .. N
250
0
-250
-500
-750
-lOOO
-J250 0
-J
500
AS
............... . ....... 0° .... ................ .. 0 ...
. .., -AS
Bode Plots
-90
0 2 5
LOG W (RADISEC)
~ 110" •• ,
Nyquist Plot
JOOO l500 2000 2500 3000 3500 AOOO A500 5000
Z' REAL (OHM>
Figure 13. ACIS Spectra For Specimen Ib After 162 Days Exposure Of Carbon Steel Rebar In The Standard Concrete With No Chlorides Added.
Chlorides Added.
23
G III e III
G z < 11/ UI < %: II.

impedance. Based on the premise of this project, no corrosion was expected on these specimens. This was confirmed upon termination of the experiments and retriva1 of the reinforcing steel specimens.
ipec!mens 3a, 3b, 13, 14, and 15 had rebars in standard concrete with 15 1bs/yd C1 added. These specimens showed significant differences from the previous specimens with 0 and 6 1bs/yd3 C1- added. Figure 14 shows the ACtS spectrum for Specimen 14 after 12, 42, and 153 days exposure. The most obvious difference when compared to Figure 13 was significantly lower impedance values indicating a much smaller R and much larger corrosion rate. The relative magnitudes of the impedances m~asured were not as important as the differences in the shape of the curves. It is the change from charge transfer resistance behavior (non-Warburg, semicircular Nyquist plots) to Warburg behavior (linear, slope of 1 Nyquist plots) that indicates active corrosion based on our premise.
It may be recalled that for freely corroding conditions, the PR (low frequency impedance) is inversely proportional to corrosion rate; but for cathodically protected conditions, the magnitude of the PR is not necessarily proportional to the corrosion rate. In the latter case, the PR is more likely to be inversely proportional to the cathodic current applied. Therefore, for cathodically protected conditions, a low PR indicates a high cathodic protection current and, thereby, low corrosion. For this reason, trying to identify differences between an ACIS spectrum, which represents a corroding condition versus one which represents a noncorroding condition is critical. The two primary indications presently being used for determining the presence of corrosion (Warburg impedance) are: (1) a slope of 1 in the Nyquist plot and (2) a phase angle of 45° in the Bode plot or a phase angle that goes down to some value between 0 and 45° and remains there as opposed to decreasing back toward 0 in a symmetric fashion.
For Specimens 3a, 3b, 13, 14 and IS, it was seen that at least the early portions of the Nyquist plot corresponded relatively well to a slope of 1. However, it was also observed that all specimens had some curvature in the Nyquist plot at very low frequencies which would indicate a finite diffusion layer boundary thickness. This behavior, however, makes it more difficult to distinguish between Warburg type behavior and a compressed semicircle with activation controlled reactions. A further indication of the Warburg impedance was seen in each of the Bode plots of the phase angle versus frequency. In each case, the phase angle did not go below 45° and either went down toward 45° and leveled off or was highly skewed toward the lower frequencies. Therefore, based on our premise, it is predicted that corrosion is occurring (presence of Warburg impedance) on specimens with 15 1bs/yd3 C1-added.
24

3
2
-2
500
4S0
400
350
300
250
;: 200 :t: C ...
ISO U < ::z: 100
;.., 50
0
-50
-100
-ISO
-200
-250 0
Figure 14,
-I
.. ",
'~'\"'!""':!:!':~t~~~:~=' . , ... ~ . : . ~
.. .... . '"" ......... ........ - .. _ .2 D8YO . ---·-...::.. .... --=-~7=--:·=--.--=~.=:=
1S3 D.,.. -12 D.,.
Bode Plots
0 2 3 4
LOG '1/ (RAO/SEC)
(J .. __ I
·12 D8Y.
. 153 D.,..
• • U D8Y.
Nyquist Plots
45
0
-45
-90 5
100 200 300 4CO 500 600 700 BOO 1100 1000
Z' REAL (OHM)
ACIS Spectra For Specimen 14 After 12, 42, And 153 Days Exposure Of Cafbon Steel Rebar In the Standard Concrete With 15 Ibs/yd Cl- Added.
25
G w 9 w oJ u z < w UI < :t: a..

Spe~im~ns 4a, 4b and 12 had reinforcing steel in standard concrete with 45 lbs/yd Cl added. Figure 15 shows the ACIS spectrum for Specimen 4a after 13 and 41 days exposure. The shape of the Nyquist plots were similar to those previously described as having a Warburg impedance, and thereby it is predicted that they are also undergoing corrosion.
Another useful tool in evaluating whether a Warburg impedance is a pronounced component of the measured spectrum is a Randles Plot of the real component of impedance (3') versus one over the square root of the frequency in radians per second (w- 12). In a purely diffusional controlled process, both the real and -t~aginary components of the impedance are equal and 1 inear functions in w . Therefof5' linearity of the Randles plot can be used as a test for d\ffu~ion control. 4 Figure 16 shows a Randles plot for Specimen 4a (45 lbs/yd Cl, freely corroding). These data show both linearity in the Randles plot and the slope of 1 in the Nyquist plot, thereby confirming the presence of a Warburg impedance in this system. Randles plots for other specimens were produced and each one indicated linearity.
Specimens 16 and 18 were the two repair patch materials examined: "Set 45" and "Rapid Road Repair", respectively. Both contained 15 lbs/yd3 cC. Very low impedance values indicated high corrosion rates for both materials. In the Nyquist plots, relatively good agreement to slopes of 1 were observed and the phase angles were continuing to increase at the lowest frequency measured. As for the 15 and 45 lbs/yd3 Cl- conditions in the standard concrete, corrosion of the reinforcing steel was predicted based on these data.
Summarizing the ACIS spectrum for freely corroding conditions, very little difference was observed for the 0 and 6 lbs/yd3 Cl- conditions. For both of these conditions, a single time constant beravior was obsrrved and passive conditions were predicted. For the 15 lbs/yd and 45 lbs/yd CI-, the corrosion rates appear to be much higher as indicated by very low impedances at the low frequencies. Furthermore, as exposure time increased, the Nyquist plots and Bode plots of phase angle became similar to those expected for a Warburg impedance dominating the reaction scheme, thereby implying corrosion was occurring.
At the end of the exposure period, the reinforcing steel was removed from the concrete and examined for corrosion. Visual examination of the reinforcing steel confirmed that little or no corrosion had occurred on the exposed portions in concrete containing 0 Ibs/yd3 CI- or 6 lbs/yd3 CI-. Reinforcing steel exposed to concrete containing 15 Ibs/yd3 CI- showed significant localized corrosion at several areas over' the steel. The reinforcing steel exposed in concrete containing 45 lbs/Yd3 CI- exhibited much more severe corrosion over a greater area than did the steel exposed to 15 Ibs/yd3 CI- containing concrete.
26

,. z: J: e
2 N
U C ..J
SOD
450
400
350
300
250
x 200 J: 9
ISO u '< :z: 100
N 50
0
-50
-100
-ISO
-200
-250
• _ •••• 'I t ' ~ , • - ~ • !' • :,' , , ~ ! : : : ~ : .:., a,
a • : --'1 D."t8 •• '13 D..,. .. ,.. .. ..... ..
... n D.y. ... --- -- - - - --+
1:1 DaYI
Bode Plots
-2 -I 0 2 3 " LOC .., (RAD/SEC
~ ItO,..·,
1? DI,",
,,'.1 Day"
Nyquist Plots
0 100 200 300 400 SOD aDo 700 900 gOO
r REAL. (OHM)
Figure 15. ACIS Spectra For Spec~en 4a After 13 And 41 Days Exposure Of Carbon Steel Rebar In The Standard Concrete With 4S 1bs/yd Cl- Added.
27
45
0 ,. U w 9 w ..J U Z '<
W III < l:
-45 '"
-90
5
1000

300
250
,,-... 200 '" E .r. 0 150 ......... N
100
50
a 0
Figure 16.
1
LINEAR CORRELATION COEFFICIENT = .9991
234
w -1/2 (s 1/2 rad- 1/ 2)
5 6
3 Randles Plot Of ACIS Spectra From Specimen 4a (45 Ibs/yd CIt Freely Corroding) After 34 Days Exposure.
28

Examination of the reinforcing steel removed from the two repair/patch materials also confirmed the predictions of corrosion based on their ACIS spectra. The reinforcing steel in both freely corroding conditions (Specimens 16 and 18) showed severe corrosion which correlates with the extremely low R values seen in their ACIS spectra and the presence of a Warburg impedance. P
Cathodically Polarized Conditions
A series of tests were performed to evaluate the effects of different levels of CP applied within 48 hours after casting of the concrete specimens. Four specimens were prepared with 15 Ibs/yd3 Cl- content (Specimens 5 through 8). These specimens were polarized based on the free-corrosion potential with cathodic overvoltages of 50, 100, 200, and 300mV, respectively, which were measured utilizing interruption techniques to correct for IR-drop. The results from these exposures are summarized in Table 3. Figure 17 shows a representative spectra from Specimen 5 after 93 days exposure polarized 50mV. Each ACIS spectrum for the specimens listed above indicated slopes greater than 1 in the Nyquist plots and phase angles greater than 45 degrees at low frequency. This would indicate that all of these specimens show adequate CP and that corrosion has been mitigated based on our premise. Prior to completion of the testing, power supply failures damaged both Specimens 6 and 8 by anodically polarizing them for a period of time. This unfortunately caused significant corrosion on the reinforcing steel so visual observation of the extent of corrosion was impossible. However, Specimens 5 and 7 were removed from the concrete and were visually examined for indications of active corrosion. Spec imen 5, which was polarized only 50mV, showed very light surface rust over much of the reinforcing steel. This corrosion was either too light to cause the diffusional Warburg impedance or occurred prior to the application of the CPo Specimen 7 showed two very small areas of attack which again could have occurred prior to the application of the CP or were possibly due to shielding caused by contact from large pieces of aggregate which prevented adequate CPo
Table 3 also summarizes the results from the two repair/patch specimens which were polarized within 48 hours after casting. Figure 18 shows a representative spectrum from Specimen 17 after 81 days exposure polarized 200mV to -O.650V, SCE. Both specimens had Nyquist plots exhibiting a slope of 1 indicating Warburg type behavior. From this behavior, corrosion of these specimens was predicted. Visual examination of Specimen 17 showed general
29

•
••
Table 3. Summary Of Results Of Tests Perfo~ed To Evaluate The Effect Of Different CP Levels On Specimens Prepared With 15 lbs/yd3 Cl- Added.
Specimen Nos. Observed Spectra
Polarization Level Warburg Non-Warburg
50mV 5
lOOmV 6
• .. 200mV 17 • 19 7
300mV 8
Set 45 - Repair/Patch Material
Rapid Road Repair - Repair/Patch Material
30

3 .. ....... ........ oo ........ 0 .. ' G .' . 11/ 9 III
~ Z < ,.. III ! UI
g < ... x 2 -"" L
N
9 .-Bode Plots
-90 -2 -J 0 2 3 • 5
LOC It (RADISEO
JOOO
900
800
700
800
500
~ .00 ~ elope. I
300 ~ < z 200 ... . JOO N
0
-100
-200
-300
-400 Nyquist Plot
-sao 0 200 "'00 800 800 1000 1200 HOD J800 1800 2000
Z' REAL. COHM>
Figure 17. ACIS Spectra For Specimen S After 93 Days Exposure 9f Carbon Steel Rebar In The Standard Concrete With 15 lbs/yd C1- Added And Polarized SOmV to -O.SOOV, SCE.
31

3
~ N 2
9
50
"5
"0
35
30
25
! 20
15
~ z: 10 ... . N
S
o
-S
-JO
-JS
-20
-25
" '
-2 -l
o JO 20
•• .1_ •• - •••••• , "
" ' .. - ...
o 2
LOG W (RAC/SEC)
3D "0 50
2' REAL (OHM)
BO
...... " 0 " ,
-"5
Bode Plots
-90 3 "
Nyquist Plot
70 BO 90 JOO
Figure lB. ACIS Spectra For Specimen 17 After B1 Days Exposure Of Carboy Steel Rebar In ·Set 45" Repair/Patch Hateria1 With 15 lbs/yd C1- Added And Polarized 200mV to -O.650V, SCE.
32
G III
9 III oJ U Z < I1J I.G < 1: IL

attack over 70% of the exposed surface. after test ing also confirmed the ACIS occurred over 80% of the exposed surface.
Visual examination of Specimen 19 resul ts as moderate corros ion had
The third phase of the Task 1 research examined the effect of allowing corrosion to initiate on the reinforcing steel prior to application of the CPo This would simulate conditions observed when CP is applied to a structure as a remedial measure to mitigate corrosion that is already occurring. Specimens 13 and 14 were cast with 15 Ibs/yd3 Cl- and allowed to freely corrode for several months. After the appearance of a Warburg behavior (Figure 14), the specimens were polarized to the levels indicated in Table 1. Figure 19 shows the ACIS spectrum for Specimen 13 after application of enough CP to shift the free-corrosion potential 200mV. At this level of polarization, the impedance spectrum has reverted to a multiple time constant response with no indication of a Warburg impedance, therefore, based on our premise, the corrosion has been mitigated by the application of CPo
Task 2 - Large Concrete Slab Exposures
Task 2 research involved the more realistic conditions of larger, multiple reinforcing steel mats in a concrete slab containing differential Clconcentrations. Potential maps of the surface of the slabs were performed to establish corroding areas based on potential criteria. Figures 20 through 23 show the potential distributions for the four test slabs under freely corroding conditions. The figures indicate that the free-corrosion potentials in the areas containing no Cl- are on the order of -0.250 to -0.300V versus Cu/CuS04. However, the free-corrosion potentials of the isolated rebar sections in these regions are only -0.050V versus Cu/CuS04. This indicates that this quadrant is receiving a cathodic current which is shifting the free-corrosion potential to more negative values. In examining the freecorrosion potentials for the high Cl- quadrant, the potentials were approximately -0.600 to -0.650V versus Cu/CuS04. This alone would indicate active corrosion based on the free-corrosion potentials observed on the single rebar specimens. However, examination of the isolated rebar sections in these areas show even more negative potential of approximately -0. 700V versus Cu/CuS04. The fact that the isolated rebar section has a more negative freecorrosion potential indicates that this quadrant is anodically polarized and supplying current to the areas in the slab with a more positive potential. Therefore, it is clear that significant macro-cell couples exist between reinforcing steel exposed to different Cl- content concrete.
33

i ::t 9 CI < %
;...
3 0 . . . .. ...... ..................................
2 -45
Bode Plots
-so -2 -I o 2 4 5
LOC '. (RAO/SEC)
::00
450
0100
3::0
300
2:0 ~ Slope = 1
200
1:0
100
50
0
-so -100
-ISO
-200 Nyquist Plots
-250 0 100 200 300 400 SOO 600 700 BOO 900 ICCO
Z' REAL (O"n",
Figure 19. ACIS Spectra For Specimen 13 After Cathodically Polarizing 200mV To -O.650V, SCE.
34
... CI UI C ... UI oJ CI Z < UI U'I < l: Q.

15 Ib/ydJ No Clo
45 Ib/yd J I Ib/ydJ
Figure 20o Potential Distribution Of Test Slab No. 1 With ~andblasted Rebar Under Freely Corroding Conditions.
15 Ib/ydJ No Clo
45 Ib/ydJ 6 Ib/ydJ
Figure 21. Potential Distribution Of Test Slab No.2 With Sandblasted Rebar Under Freely Corroding Conditions.
35

15 Ib/yd~
45 Ib/yd J
Figure 22.
151b/ydJ
45 Ib/ydJ
Figure 23.
No Clo
I Ib/ydJ
Potential Distribution Of Test Slab No. 4 With Sandblasted Rebar Under Freely Corroding Conditions.
No Clo
6 Ib/ydJ
Potential Distribution Of Test Slab No. 3 With Mill Scaled Rebar Under Freely Corroding Conditions.
36

- / 3 The ACIS spectra for the 0 CI and 45 lbs yd quadrants of one of the slabs are shown in Figures 24 and 25. In the quadrant containing no CI(Figure 24) a non-Warburg response with a large Rp value similar to that shown in Figure 14 was expected. However, a multiple time constant type response is observed wit~ a :elatively low polarization resistance indicated. Examining the 45 lbs/yd CI quadrant (Figure 25), the impedance values are less than was observed for the no CI- condition (Figure 24), but the shape of the curves are similar. Based on the data for the single reinforcing steel specimens, several observations of the concrete slabs were unexpected. The magnitude of differences between PR values for no CI- and 45 Ibs/yd3 CI- conditions were expected to be a factor of 10 to 100 instead of a factor of 4. Also, very little difference in the shape of the ACIS spectrum is observed between the different CI- content conditions in a slab where macro-cell corrosion is occurring.
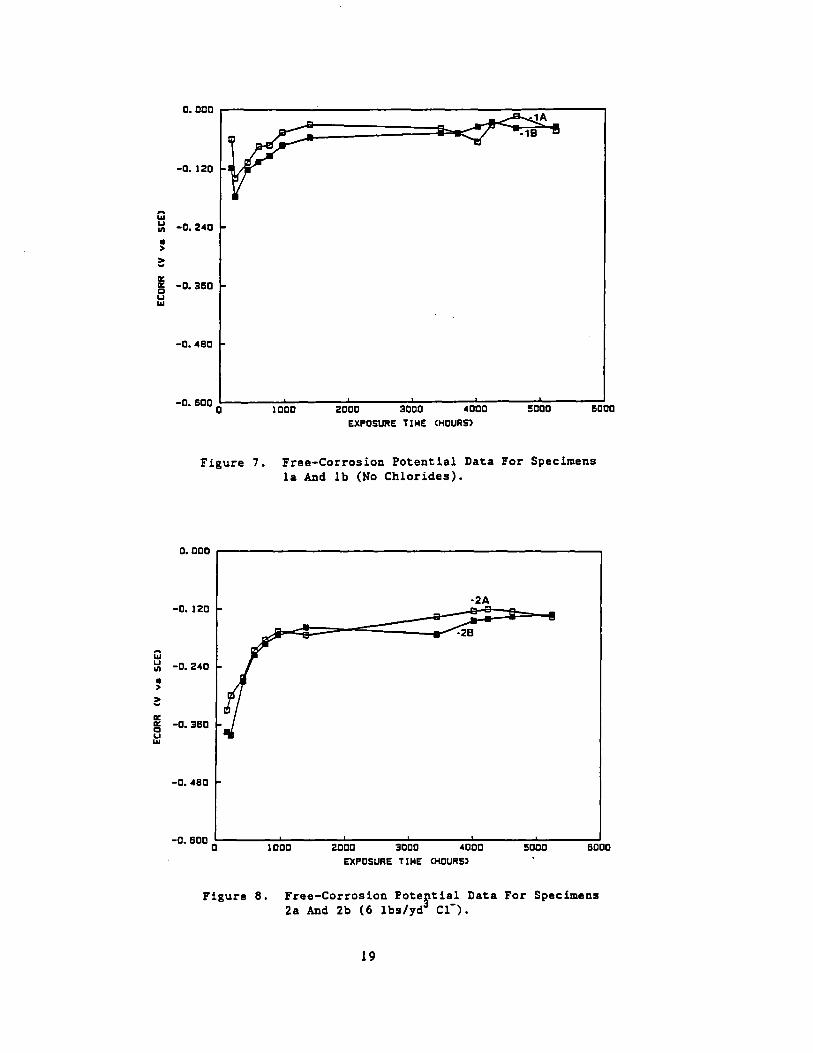
The isolated rebar sections were disconnected from the rest of the reinforcing steel mat and permitted to remain isolated for approximately 16 hours. At this time, the ACIS spectra for the isolated rebar sections for the no CI- and 45 Ibs/yd3 CI- conditions were measured. These spectra are shown in Figures 26 and 27. The ACIS spectrum for the isolated rebar section in the no CI- condition (Figure 26) reveals much different behavior than observed in Figure 24 for the same position with the specimen connected in line to the remaining reinforcing steel mat. The Nyquist plot in Figure 26 shows two-time constants with the impedance at low frequencies tending toward ever increasing values similar to the spectrum shown for the no CI- condition with the single reinforcing bars in Task 1.
Figure 27 (high CI-, isolated rebar section) shows a Nyquist plot with a similar shape to that shown in Figure 25 (high CI-, continuous reinforcing steel). The impedances are somewhat greater for the isolated rebar section shown in Figure 27 which is most likely due to a lower corrosion rate for the isolated rebar section since the corrosion is not being driven to higher values (lower impedances) by a macro-cell couple as in the case for a continuous reinforcing steel mat (Figure 25).
One test slab was cathodically polarized 200mV more negative than the most negative free-corrosion potential. The ACIS spectra were monitored periodically over the 60-day ex~osu=e and Figures 28 and 29 show the ACIS spectra from the 0 and 45 lbs/yd CI quadrants at the end of this exposure. The Nyquist plots show non-Warburg impedance spectra with compressed semicircles, with Figure 29 possibly exhibiting a two time constant reaction scheme.
37

....
~ N
U Q .J
3
2
150
135
120
105
90
75
~ 60
45 I!I < :E 30
;.., l5
o -15
-30
-45
-60
-75
.. ' . •••
-2 -1
,
, o 30 60
o
90
2
LOC W (RAO/SECJ
I
,
.......... ....... '0
120 150
Z' REAL (OHIOO
45
0
-45
Bode Plots
-90
5
' ......
Nyquist Plot I I I
lao 210 240 270 300
Figure 24. ACIS Spectra For Slab No. 1 After 66 Days Exp0rure: Measurements Hade Using Guard Ring In 0 lbs/yd Cl Added Quadrant.
38
G us 9 us .J I!I Z < III UI < l: IL

£ :r 9 N
U C oJ
:E :r 9 U < ~
N
3 I I 4S
0 ............. ... 2 r
-4S -
Bode Plots I -90
-2 -I o 2 3 5
LOC w (RAO/SEC
ISO
13S
120
IDS
SO
7S
60
4S
30
IS '0,0
0 t----,.J: ........ ~".
-IS
-30
-4S
-60 Nyquist Plot
-7S 0 30 60 eo 120 ISO 190 210 240 270 300
Z' REAL (OHM)
Figure 25. ACIS Spectra For Slab No. 1 After 66 Days Expos~re. Heasurements Hade Using Guard Ring In 45 lbs/yd ClAdded Quadrant.
39
,.. u III 9 III oJ u Z < III UI < :r a..

3
2 N
I.!I C ..J
250
225
200
175
150
125
Z 100 J: 9
75 I.!I < % 50 -;... 25
0
-25
-50
-75
-100
-125
-2
0 50
.+-
-1
100
.....
LOC 1/ (RAO/SEc)
, ... ----'''
150 200 250
2' REAL CCHM)
o
Bode Plots
-90 5
~slop. = 1
Nyquist Plot
300 350 400 500
Figure 26. ACIS Spectra For Slab No. 1 After 66 Days Exposure. Heasurement~ Hade On Disconnected Isolated Rebar Section In 0 lbs/yd Cl- Added Quadrant.
40
G w 9
.... :II:
§ N
1.:1 C ..J
Z l: C .., 1.:1 < :II: -N
3
0
2
-45
Bode Plots
-90 -2 5
LOG II (RAO/SEC)
250
225
200
175
150
125 slope = 1
100
75
50
25 .' ." ~ .... ,
0 ... .,.
-25
-50
-75
-100 Nyquist Plot
-125 0 50 100 350 200 250 300 350 400 450 500
Z' REAL (OHM)
Figure 27. ACIS Spectra For Slab No.1 After 66 Days Exposure. Measurements Hade On Disconnected Isolated Rebar Section In 45 Ibs/Yd3 Cl- Added Quadrant.
41
G III 9 III ..J 1.:1 Z < III UI < l: a..

3
2 N
g ..J
50
45
40
35
3D
25
i 20 :I: 9 15 1.:1 < 10 z -
5 N
0
-5
-10
-15
-20
-25
-2
0
.... .......
------------------------------Bode Plots
-1
LOG Ii (RAO/SEC)
:::J slope = 1
Nyquist Plots
10 20 3D 50 60 70 80 90
Z' REAL (OHIoI)
5
45
o ,.. U III
9 III
~ < III ID < I:
-45 II.
-90
100
Figure 2B. ACIS Spectra For Slab No. 1 After Being Polarized For 2B DJYs. Measurements Hade With Guard Ring In The o Ibs/yd Cl- Added Quadrant.
42

3
0 ... U III C
~ ... 11/ ... oJ
2 u Z N <
U III C UI oJ < ::z:
-45 Q..
----- ./
Bode Plots
-90
-2 -1 0 5
LOG W (RAO/SEC)
SO
45
40
35
30 ~ slope = 1
25
% J:
20 C ... 15 u < 10 :z:
5 N
0
-5
-10
-15
-20 Nyquist Plots
-25 0 10 20 30 40 50 BO 70 eo 90 100
Z· REAL (OHM)
Figure 29. ACIS Spectra For Slab No. I After Being Polarized For 28 Dars, Heasurements Hade Vith Guard Ring In The 45 lbs/yd Cl- Added Quadrant.
43

The primary difference in the Nyquist plot between the freely corroding and the cathodically polarized conditions is that, for the cathodically polarized conditions, the imaginary component of impedance goes to zero within the frequency examined. Therefore, the application of CP has produced an observable change in the impedance spectra, but the change was much more difficult to characterize for the large slab specimens than it was for the single rebar specimens.
44

Discussion And Conclusions
The Task 1 results, as well as previous work, indicated that for single reinforcing steel specimens, significant changes in the impedance spectra occur upon going from a corroding condition to either a condition where corrosion is extremely low (passive conditions) or where corrosion is mitigated by cathodic protection. For the conditions examined, the corrosion process for the single reinforcing steel specimens was characterized by a diffusion controlled reaction sequence and the Nyquist plot was dominated by a Warburg impedance. For passive conditions where the corrosion rate is extremely low, the Nyquist plot exhibited behavior that was characterized by an extremely large polarization resistance, and for the frequency range examined, only the initial portions of the semicircle of a single time constant response were observed in the Nyquist plot (imaginary portion of the impedance was continuing to increase very rapidly with decreasing frequency). Upon application of cathodic protection to high CI- conditions which exhibited the Warburg behavior in the Nyquist plot while freely corroding, the impedance spectrum exhibited a single time constant response. The visual examination of the reinforcing steel following exposure in Task 1 confirm that the basic premise of predicting corrosion behavior based on the ACIS spectrum is feasible for short, single lengths of reinforcing steel.
Upon going to the more realistic conditions of the concrete slabs with varying CI- content and two layers of reinforcing steel mats, interpretation of the ACIS data became much more difficult. It is proposed that the difficulties observed were due to the macro-cell corrosion reactions which occurred on the different areas of the reinforcing steel mats exposed to the different CI- concentrations. The primary difficulty in interpreting the ACIS data was observed in the freely corroding condition. For the freely corroding conditions, the reinforcing steel exposed to the no CI- condition exhibited a compressed semicircle, two-time constant behavior with an extremely low polarization resistance. This is primarily due to the fact that the macrocell corrosion between the no CI- condition and the high CI- conditions established relatively high rates of cathodic reactions on the steel surface
45

in the concrete containing no CI- (cathodic polarization). The primary difficulty was that for the reinforcing steel exposed to the high CIconditions, a Warburg impedance no longer dominated the reaction sequence. This is most likely due to the fact that diffusion of oxygen to the corroding area is no longer controlling the corrosion rate, but that the corrosion rate is being controlled by the macro-cell current coming from an area away from the corroding area over which the ACIS spectrum is being measured. For the reasons described above, the difference in the ACIS spectra between noncorroding and corroding conditions, in the presence of macro-cells, are much more difficult to interpret based on the ACIS spectra. The cathodic polarization of the slabs to potentials 200mV more negative than the most negative free-corrosion potential produced some changes to the ACIS spectra, but these changes are much less significant than those observed for the single reinforcing steel specimens in Task 1. Therefore, a significant program would have to be undertaken to characterize whether changes in the ACIS spectra, when macro-cell corrosion is occurring, can be used to establish when corrosion is mitigated by cathodic protection.
The data described above also indicates another very important aspect of measuring corrosion rates under freely corroding conditions. It has been discussed within the corrosion community that PR techniques are appropriate for mapping the corrosion rate of a concrete structure. The findings in this study indicate that PR values alone cannot map the corrosion rate of a structure which has a varying Cl- content and large macro-cell corrosion couples. For the macro-cell corrosion couples, the cathodically polar ized areas of the couple (I i ttle or no corrosion) can have a PR value that is comparable to the corroding areas. This is because with any macro-cell couple, the cathodic current coming from the cathodic areas is likely to be similar to the corrosion current of the anodic areas. The PR technique cannot differentiate between anodic and cathodic currents; it only measures the total electrochemical activity, or current. Therefore, the study indicates that careful interpretation of PR measurements are required, and that, in the vicinity of macro-cell couples, PR provides an overestimate of the corrosion rate of the non-corrod ing areas. However, it should be noted that, at distances far enough away from the macro-cell couples in areas of relatively constant CI- content (and constant potential), macro-cell currents may be extremely low. Therefore, in this latter case, the PR values can indicate the corrosion rate of the reinforcing steel. However, as previously mentioned, careful interpretation is required. The author believes that a combination of potential and PR mapping can provide an accurate descriptioon of the corrosion conditions of a bridge deck when properly interpreted.
46

References
(1) N. G. Thompson, Cathodically Protected Techniques", Corrosion,
K. M. Lawson, and J. A. Beav~rs, "Monitoring Concrete Structures With Electrochemical Impedance 44, 8, p. 581, 1988.
(2) See SHRP Programs: C102A "Electrochemical Chloride Removal and Protection of Concrete Bridge Components" by ELTECH Sytems Corporation, Fairport Harbor, OH, and C102B "Cathodic Protection of Concrete Bridge Components" by Battelle, Columbus, OH.
(3) C. E. Locke, "Mechanism of Corrosion of Steel in Concrete", Solving Rebar Corrosion Problems In Concrete, Seminar Proceedings, NACE, Houston, TX, p. 2-1, 1982.
(4) J. R. Macdonald, Impedance Spectroscopy, John Wiley & Sons, New York, NY, p. 290, 1987.
47


![Detecting Carbon Monoxide Poisoning Detecting Carbon ...2].pdf · Detecting Carbon Monoxide Poisoning Detecting Carbon Monoxide Poisoning. ... the patient’s SpO2 when he noticed](https://img.pdfslide.us/doc/110x75/5a78e09b7f8b9a21538eab58/detecting-carbon-monoxide-poisoning-detecting-carbon-2pdfdetecting-carbon.jpg)