Embed Size (px)
Citation preview
1
R/Rmetrics
Diethelm Würtz
ITP ETH Zürich
Meielisalp Workshop, July 8th - 12th
(c) 2007www.rmetrics.org | www.finance.ch
An Educational Environment for Teaching Financial Engineering and Computational Finance
2
--- Part I ---Financial Engineering and Computational FinanceRapid Model PrototypingS, R and Rmetrics …Rmetrics Software Environment
--- Part II ---Rmetrics Selected Topics
Explorative Data AnalysisVolatility ForecastingHedging with FuturesExtremal EventsCopulaeOption ValuationTerm Structure ModelingPortfolio OptimizationTime and Date
3
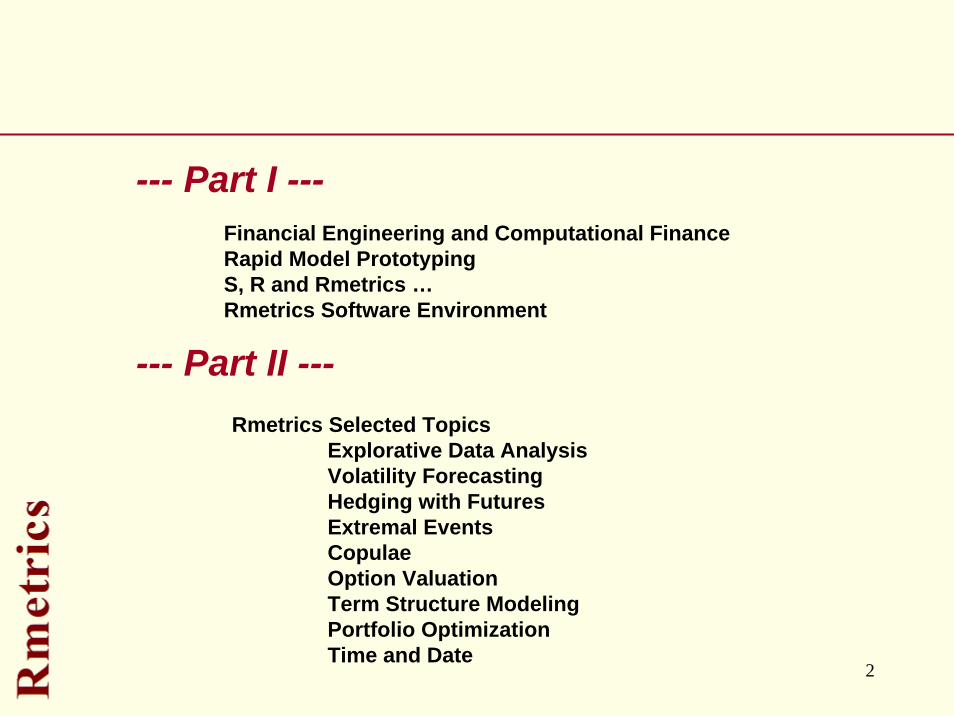
Financial Engineering & Computational Finance
FinancialEngineering
Portfolio AnalysisMarkowitz, CVaR, CDaR,
Stocks, Hedge FundsAlternative Investments
Forecasting and TradingVolatility Forecasts,
Trading, Decision Making
Pricing of DerivativesFutures, Options,
Swaps, FRAs, Bonds
Time Series ModellingARMA, GARCH,
Regression Analysis, Neural Nets
Risk ManagementExtreme Values, Copulae,
Market Risk, Credit Risk
How to model financial markets, how to valuate financial instruments and how to manage risk ?
4
Teaching and “Rapid Model Prototyping”
Initial versions of an implementation of “Models” into software are called “Model Prototypes” …
are the starting point in most financial analysis processes. Teaching and learning mean not only to explain and to understand the theoretical concepts and algorithms behind these models, but also
to demonstrate algorithmic concepts,
to try out model design concepts,
to find out more about the problem and possible solutions, and
to compare models and algorithms.
Models
Furthermore, “Rapid” Model Prototyping can be considered as a tool to see the feasibility and usefulness of the implemented model in an efficient way.
5
Pillars of a RMP Environment for Teaching
RMP Systems are build on three main pillars …
Pillar I:
An RMP must allow an interactive usageAn RMP must support powerful data types and structuresAn RMP must provide powerful mathematical and statistical functions
Pillar II:
An RMP must provide powerful plot toolsAn RMP must provide device drivers and controls
Pillar III:
An RMP must be programmable through a powerful languageThe language must offer to write user defined functionsThe language must offer OO Programming
6
RMP and “Requirement Risk”
RMP generates model prototypes which can be used to give in a very short time a concrete impression of the model’s capabilities.
RMP favors techniques which pay much attention to speed of delivery rather than performance and maintainability of an implemented model.
RMP is the best-way approach to try-out several requirements before agreeing in a final model and its implementation.
RMP supports efficiently requirements validation: Prototypes can reveal errors and omissions in the specifications.
RMP can be even used for the implementation of models where thespecification cannot be definitely developed in advance.
RMP can be considered as a risk reduction activity which reduces “Requirement Risks” …
7
Scripting Environments as Ideal RMP Systems
R, S-Plus and Matlab are well known scripting languages for scientific modeling, diagnostic analysis and testing.
A transparent interface to compiled libraries (C++, C, Java, Fortran) offers additional flexibility to scripting based RMP environments.
Additional requirements of RMP Systems include:Interactive Usage and Batch Job SubmissionAdvanced Graphical Tools, Graphics Devices, Bitmaps, Postscript, PDFAdvanced Reporting Tools, HTML Interface and XML/XLS Parser/GeneratorMS Excel Interface, DCOM InterfaceData Base Management Interfaces, Data Feed Interfaces Web Server Interface
Scripting Languages are the Basis for Software Prototyping …
8
S and R are an Ideal RMP System !
R providesan environment for interactive computing with dataan OO language based on functions and function callsboth traditional and trellis graphics, and a OpenGL rendering backendseveral graphical device drivers and controlsinterfaces for C++, C, Java and Fortran
R allows users to transition easily into programmers.
Design Goals ..
S and R are a Language and Computing Environment …
The S language was developed by John Chambers at Bell LaboratoriesS builds today the de facto standard in statistics researchR is the Open Source project implementation of SR runs on MS Windows, Linux/Unix, and also on the Mac
What is S and R it ?
9
What is R ?
Building aRapid Model Prototyping System
“R is a free software environment for statistical computing and graphics. It compiles and runs on a wide variety of UNIX platforms, Windows and MacOS.” [CRAN Server]
R fulfills the requirements for
for teaching “Computational Finance and Financial Engineering”

10
What is R/Rmetrics ?
Rmetrics is the premier open source solution for financial market analysis and the
valuation of financial instruments.
Rmetrics combines explorative data analysis and statistical modeling with
object oriented rapid prototyping.
Rmetrics creates especially for students and researchers in the third world a first class system for applications in finance.
Rmetrics can be considered as a unique platform ideally suited for RMP in financial engineering and
computational finance.
Rmetrics allows to study all the source code, so she or he can find out precisely
which variation of the algorithm or method has been implemented.
Rmetrics comes with hundreds of function build on modern and
powerful methods.Example: Exponential Brownian MotionPricing Path Dependent Options
Rmetrics is a “Rapid Model Prototyping” System for Teaching in Finance
11
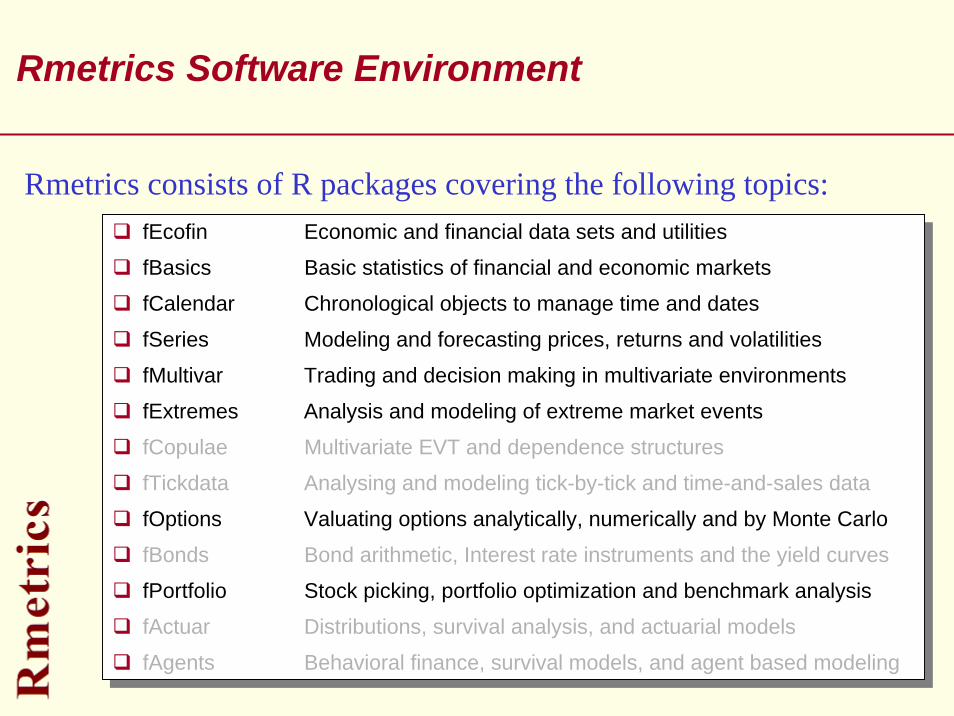
fEcofin Economic and financial data sets and utilities
fBasics Basic statistics of financial and economic markets
fCalendar Chronological objects to manage time and dates
fSeries Modeling and forecasting prices, returns and volatilities
fMultivar Trading and decision making in multivariate environments
fExtremes Analysis and modeling of extreme market events
fCopulae Multivariate EVT and dependence structures
fTickdata Analysing and modeling tick-by-tick and time-and-sales data
fOptions Valuating options analytically, numerically and by Monte Carlo
fBonds Bond arithmetic, Interest rate instruments and the yield curves
fPortfolio Stock picking, portfolio optimization and benchmark analysis
fActuar Distributions, survival analysis, and actuarial models
fAgents Behavioral finance, survival models, and agent based modeling
Rmetrics Software Environment
Rmetrics consists of R packages covering the following topics:
12
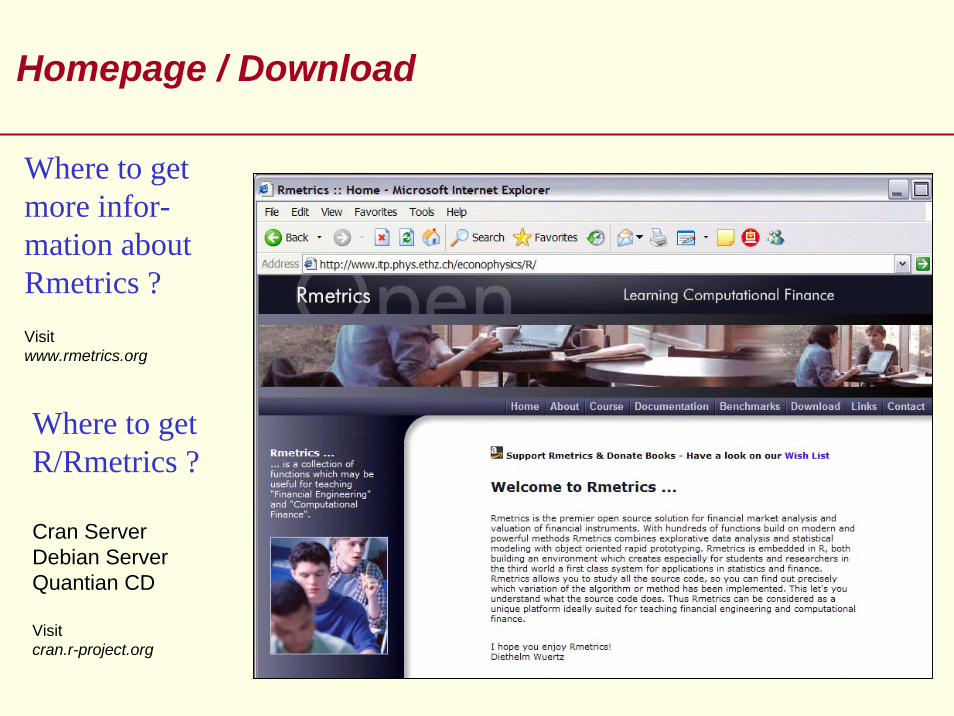
Homepage / Download
Where to get more infor-mation about Rmetrics ?Visit www.rmetrics.org
Where to get R/Rmetrics ?
Cran ServerDebian ServerQuantian CD
Visitcran.r-project.org
13
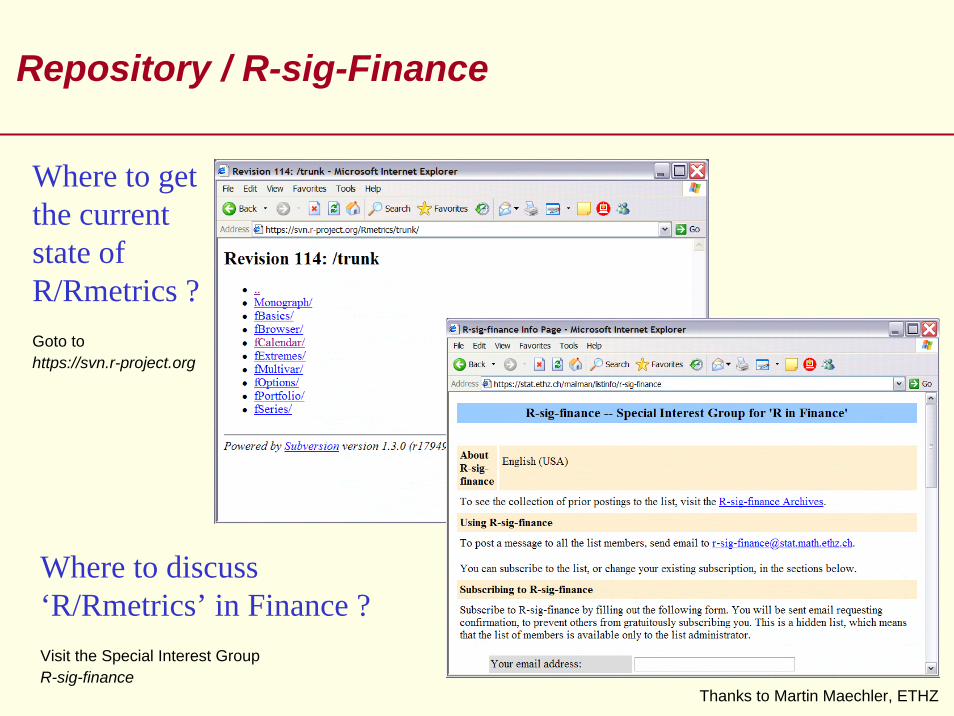
Repository / R-sig-Finance
Where to discuss ‘R/Rmetrics’ in Finance ?Visit the Special Interest GroupR-sig-finance
Where to get the current state of R/Rmetrics ?Goto to https://svn.r-project.org
Thanks to Martin Maechler, ETHZ
14
--- Part II ---
Selected Topics
• Explorative Data Analysis• Volatility Forecasting• Hedging with Futures• Extremal Events• Copulae• Option Valuation• Term Structure Modeling• Portfolio Optimization• Time and Date
The Diamonds in R/Rmetrics
15
Explorative
Data AnalysisAll Around – Wassily Kandinski
16
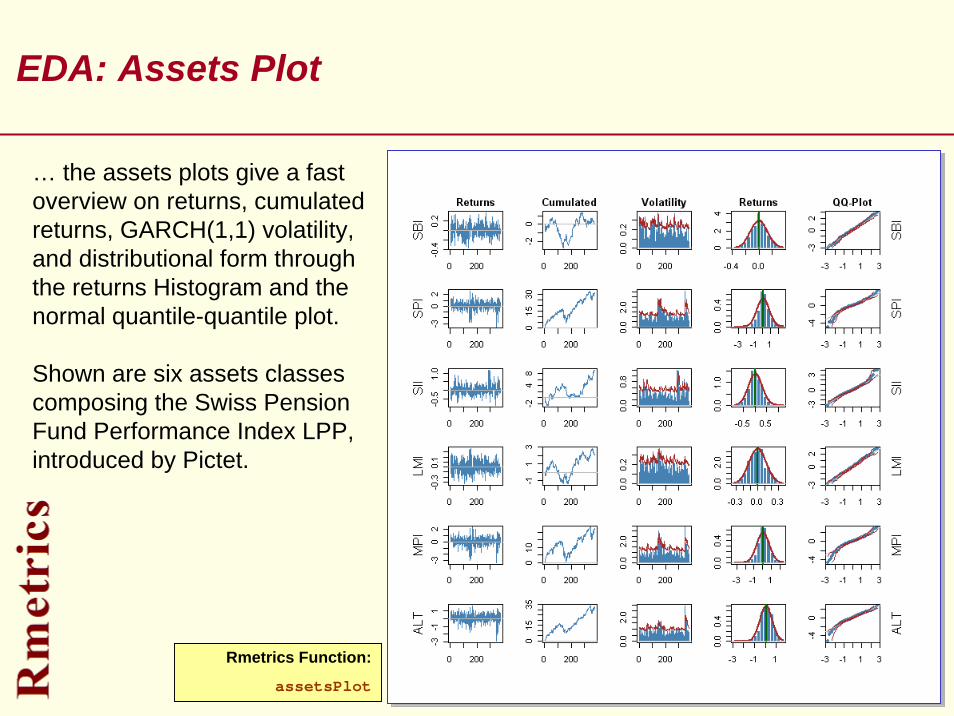
EDA: Assets Plot
… the assets plots give a fast overview on returns, cumulatedreturns, GARCH(1,1) volatility,and distributional form throughthe returns Histogram and thenormal quantile-quantile plot.
Shown are six assets classescomposing the Swiss PensionFund Performance Index LPP,introduced by Pictet.
Rmetrics Function:
assetsPlot
17
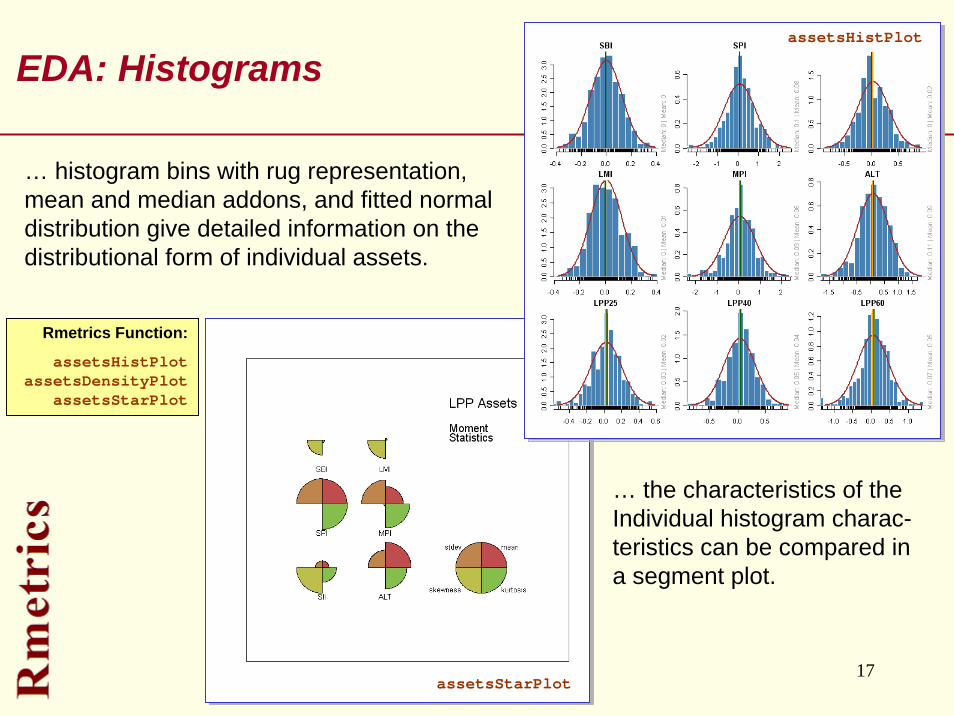
EDA: Histograms
Rmetrics Function:
assetsHistPlotassetsDensityPlot
assetsStarPlot
… histogram bins with rug representation, mean and median addons, and fitted normal distribution give detailed information on the distributional form of individual assets.
… the characteristics of theIndividual histogram charac-teristics can be compared ina segment plot.
assetsStarPlot
assetsHistPlot
18
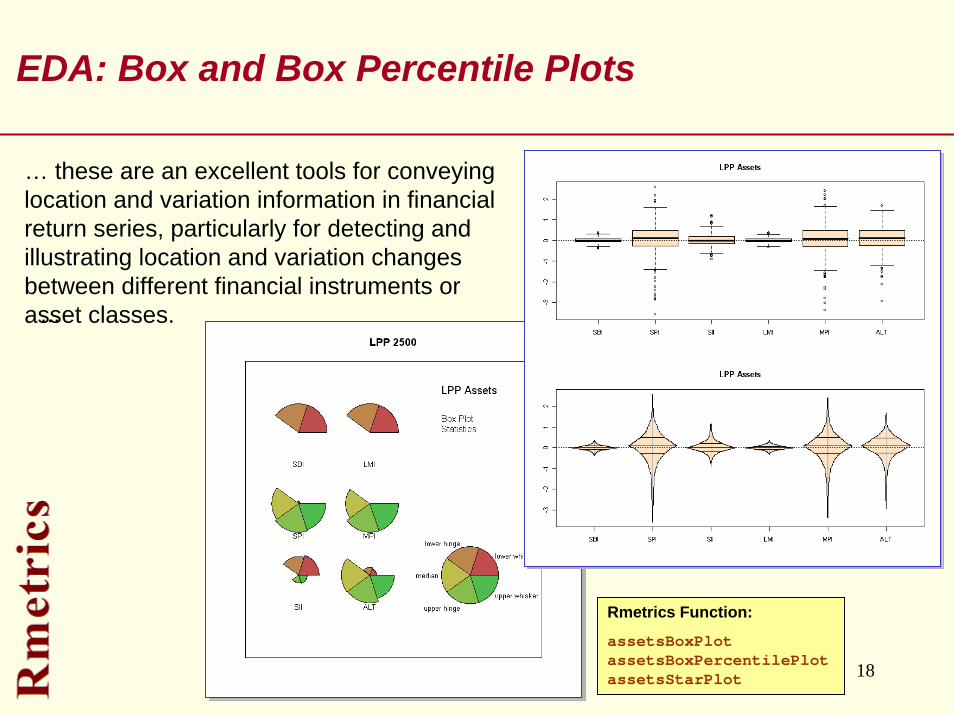
EDA: Box and Box Percentile Plots
… these are an excellent tools for conveying location and variation information in financial return series, particularly for detecting and illustrating location and variation changes between different financial instruments or asset classes. ...
Rmetrics Function:
assetsBoxPlotassetsBoxPercentilePlotassetsStarPlot
19
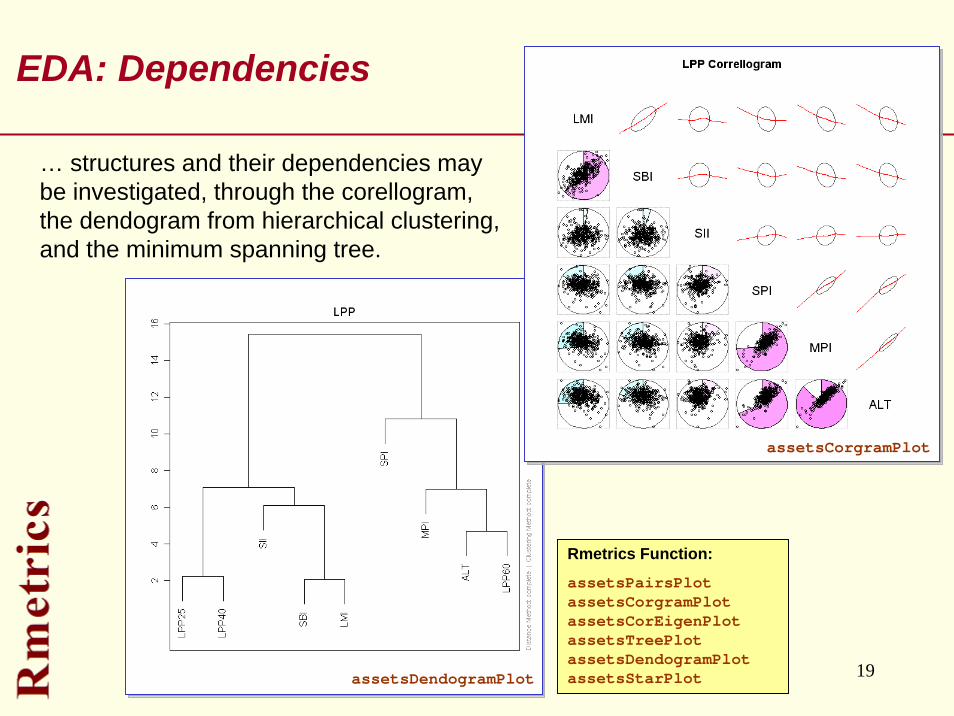
EDA: Dependencies
… structures and their dependencies maybe investigated, through the corellogram,the dendogram from hierarchical clustering,and the minimum spanning tree.
Rmetrics Function:
assetsPairsPlotassetsCorgramPlotassetsCorEigenPlotassetsTreePlotassetsDendogramPlotassetsStarPlot
assetsCorgramPlot
assetsDendogramPlot

20
Rmetrics Functions
Bivariate Binning:squareBinning
hexagonalBinning
fEcofin fBasics fPortfolio
Time Series Plots:seriesPlot
histPlotdensityPlotqqnormPlotqqnigPlot
Extremal Index:exindexPlot
exindexesPlot
fExtremes
Assets Plots:assetsPlot
assetsSeriesPlotassetsHistPlot
assetsDensityPlotassetsQQNormPlot
Tables:characterTable
symbolTablecolorTable
Time Series Plots:emdPlot
qqparetoPlotmePlot
recordsPlotmsratioPlot
sllnPlotlilPlot
xacfPlotAssets Box Plots:assetsBoxPlot
assetsBoxPerc*Plot
Assets PairsPlots:assetsPairsPlot
assetsCorgramPlotassetsCorTestPlot
Assets Multiv. Plots:assetsCorEigenPlot
assetsTreePlotassetsDendogramPlot
assetsStarsPlot
Stylized Facts:
taylorPlotlmacfPlot
logpdfPlotscalinglawPlot
Explorative Data Analysis
21
Volatility Forecasting
Beruhigt – Wassily Kandinski
22
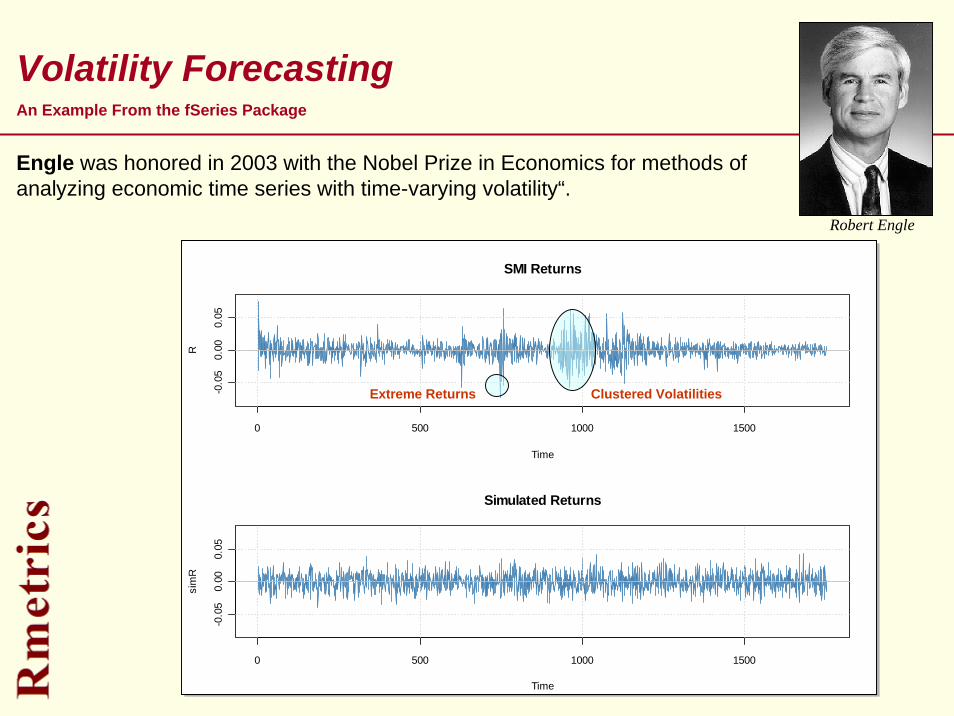
Volatility Forecasting
SMI Returns
Time
R
0 500 1000 1500
-0.0
50.
000.
05
Simulated Returns
Time
sim
R
0 500 1000 1500
-0.0
50.
000.
05
Extreme Returns Clustered Volatilities
Robert Engle
Engle was honored in 2003 with the Nobel Prize in Economics for methods of analyzing economic time series with time-varying volatility“.
An Example From the fSeries Package
23
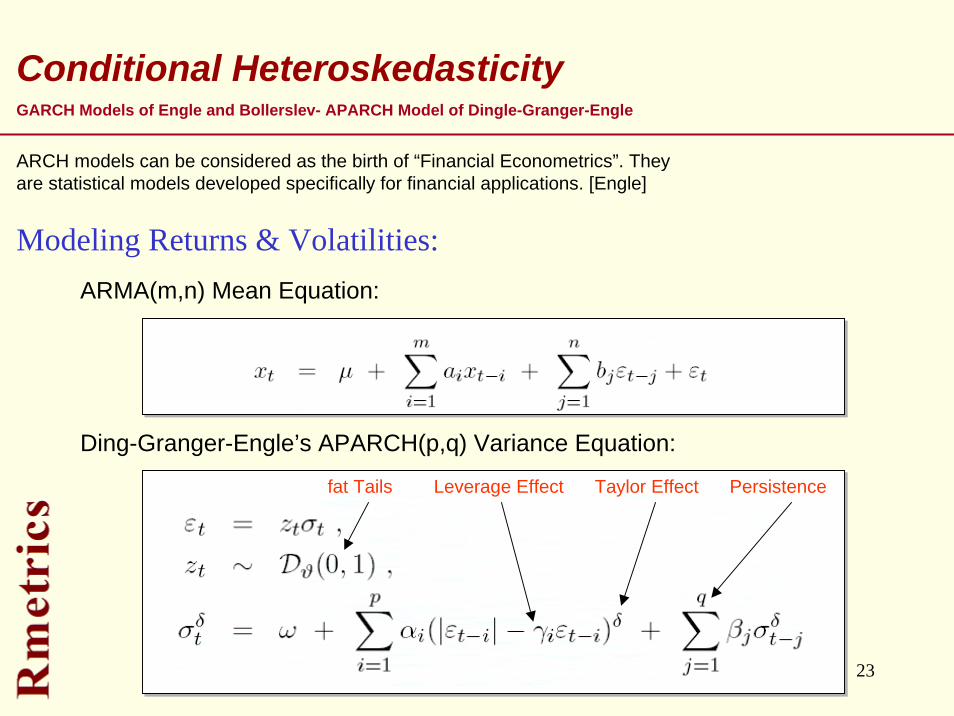
Conditional HeteroskedasticityGARCH Models of Engle and Bollerslev- APARCH Model of Dingle-Granger-Engle
ARCH models can be considered as the birth of “Financial Econometrics”. They are statistical models developed specifically for financial applications. [Engle]
Ding-Granger-Engle’s APARCH(p,q) Variance Equation:
fat Tails Leverage Effect Taylor Effect Persistence
ARMA(m,n) Mean Equation:
Modeling Returns & Volatilities:
24
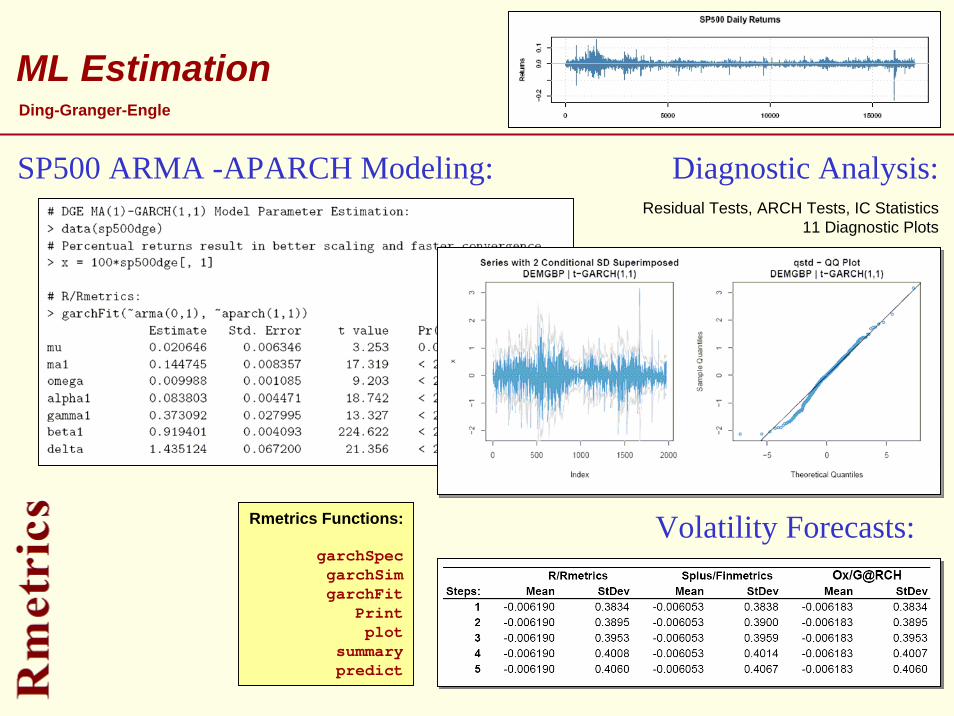
ML Estimation Ding-Granger-Engle
SP500 ARMA -APARCH Modeling:
Rmetrics Functions:
garchSpecgarchSimgarchFit
Printplot
summarypredict
Diagnostic Analysis:
Volatility Forecasts:
Residual Tests, ARCH Tests, IC Statistics11 Diagnostic Plots
25
Hedging With Futures
Mit und Gegen – Wassily Kandinski
26
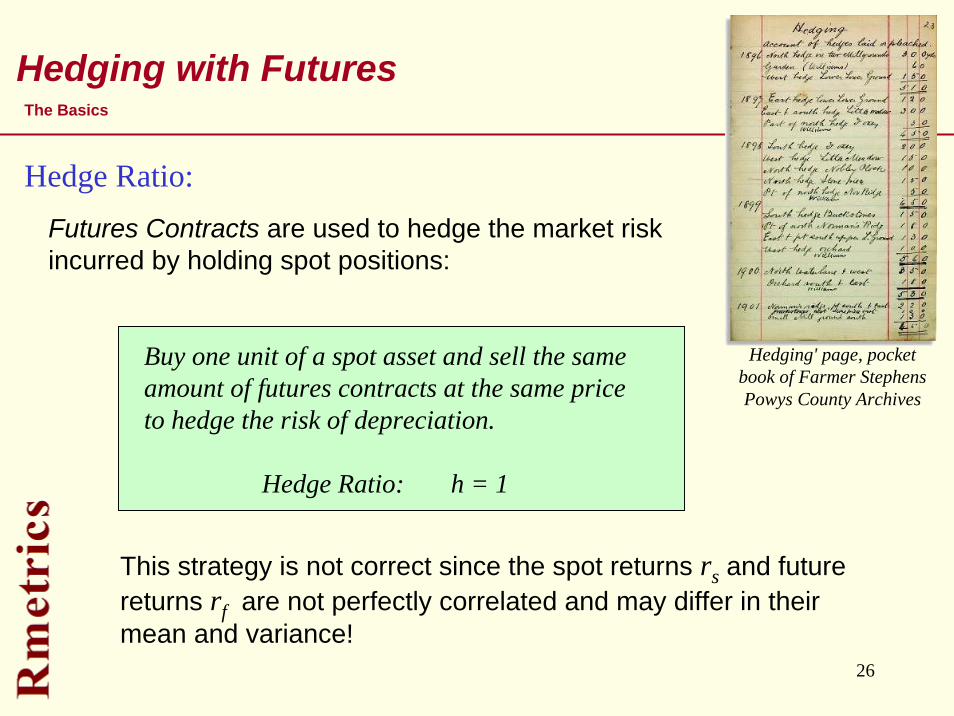
Hedging with FuturesThe Basics
Hedging' page, pocket book of Farmer Stephens Powys County Archives
Hedge Ratio:
This strategy is not correct since the spot returns rs and future returns rf are not perfectly correlated and may differ in their mean and variance!
Futures Contracts are used to hedge the market risk incurred by holding spot positions:
Buy one unit of a spot asset and sell the same amount of futures contracts at the same price to hedge the risk of depreciation.
Hedge Ratio: h = 1
27
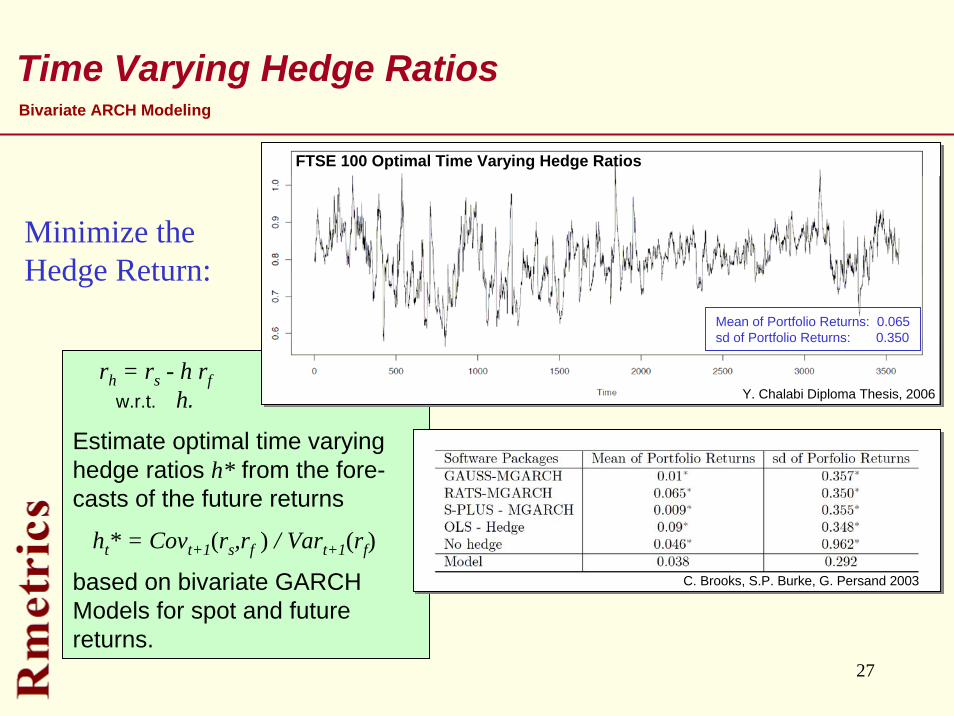
rh = rs - h rfw.r.t. h.
Estimate optimal time varying hedge ratios h* from the fore-casts of the future returns
ht* = Covt+1(rs,rf ) / Vart+1(rf)
based on bivariate GARCH Models for spot and future returns.
Time Varying Hedge RatiosBivariate ARCH Modeling
Minimize the Hedge Return:
FTSE 100 Optimal Time Varying Hedge Ratios
Y. Chalabi Diploma Thesis, 2006
C. Brooks, S.P. Burke, G. Persand 2003
Mean of Portfolio Returns: 0.065sd of Portfolio Returns: 0.350
28
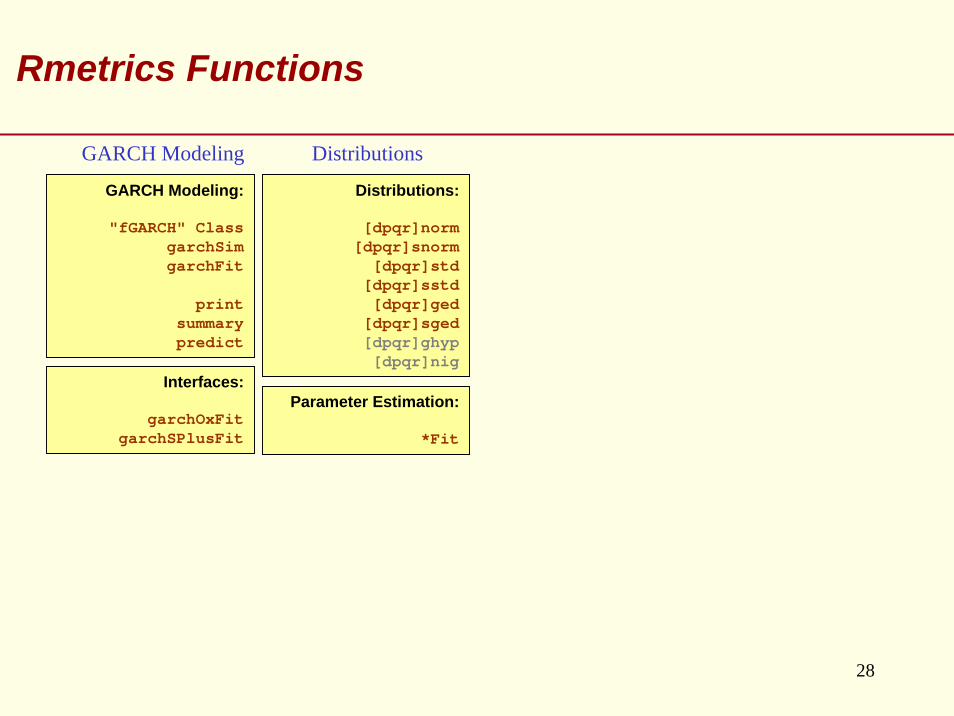
Rmetrics Functions
Interfaces:
garchOxFitgarchSPlusFit
Parameter Estimation:
*Fit
GARCH Modeling Distributions
GARCH Modeling:
"fGARCH" ClassgarchSimgarchFit
printsummarypredict
Distributions:
[dpqr]norm[dpqr]snorm
[dpqr]std[dpqr]sstd[dpqr]ged
[dpqr]sged[dpqr]ghyp[dpqr]nig
29
ExtremalEvents
Intensita – Claudia Raimondi
30
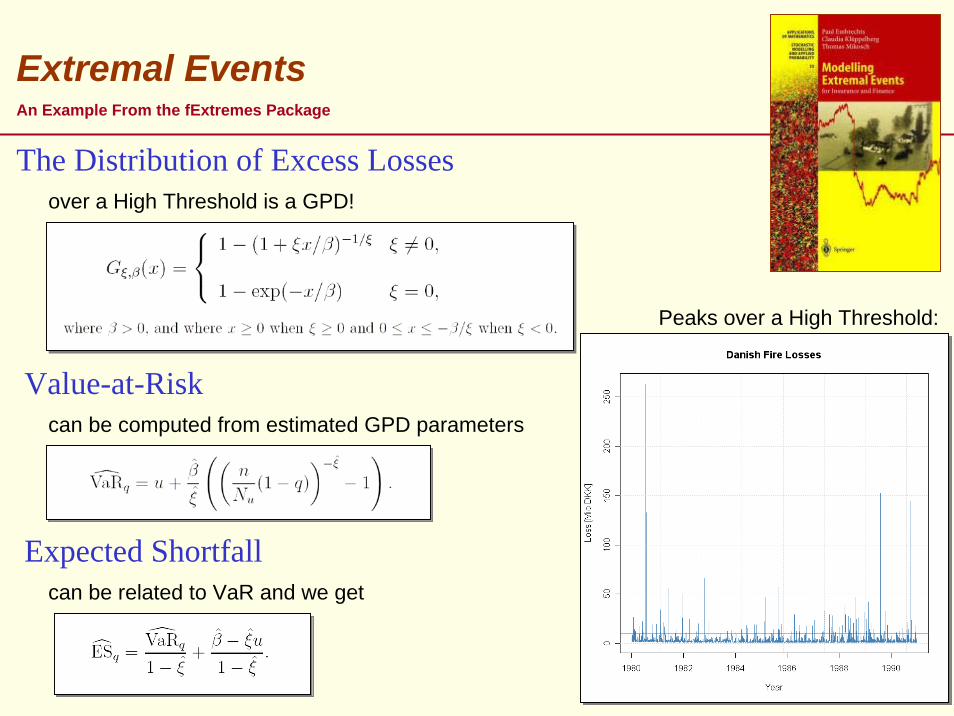
Extremal Events
The Distribution of Excess Losses
An Example From the fExtremes Package
can be computed from estimated GPD parameters
can be related to VaR and we get
Value-at-Risk
Expected Shortfall
over a High Threshold is a GPD!
Peaks over a High Threshold:

31
Insurance Risk
# GPD Parameter Estimation
> require(fExtremes)> data(danish)> fit = gpdFit(danish, threshold = 10) > fit
Call:gpdFit(x = danish, threshold = 10)
Estimation Type: gpd ml
Estimated Parameters:xi beta
0.4968062 6.9745523
# GPD Risk Measures
> gpdRiskMeasures(fit)
p quantile sfall1 0.9900 27.28488 58.210912 0.9950 40.16160 83.800913 0.9990 94.28956 191.369724 0.9995 134.71099 271.699485 0.9999 304.62448 609.36958
McNeil, Estimating the tails of loss severitydistributions using extreme value theory (1966)
Resnick, Discussion of the Danish data onlarge fire insurance losses (2000)
Danish Fire Losses:
32
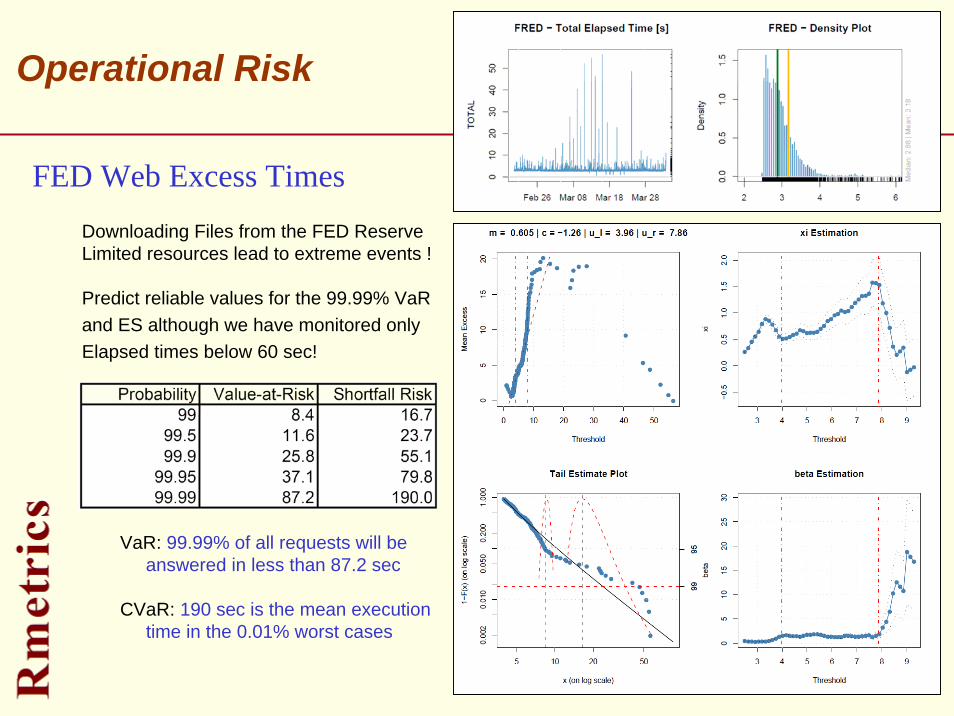
Operational Risk
VaR: 99.99% of all requests will be answered in less than 87.2 sec
CVaR: 190 sec is the mean execution time in the 0.01% worst cases
Downloading Files from the FED ReserveLimited resources lead to extreme events !
Predict reliable values for the 99.99% VaR and ES although we have monitored only Elapsed times below 60 sec!
FED Web Excess Times
33
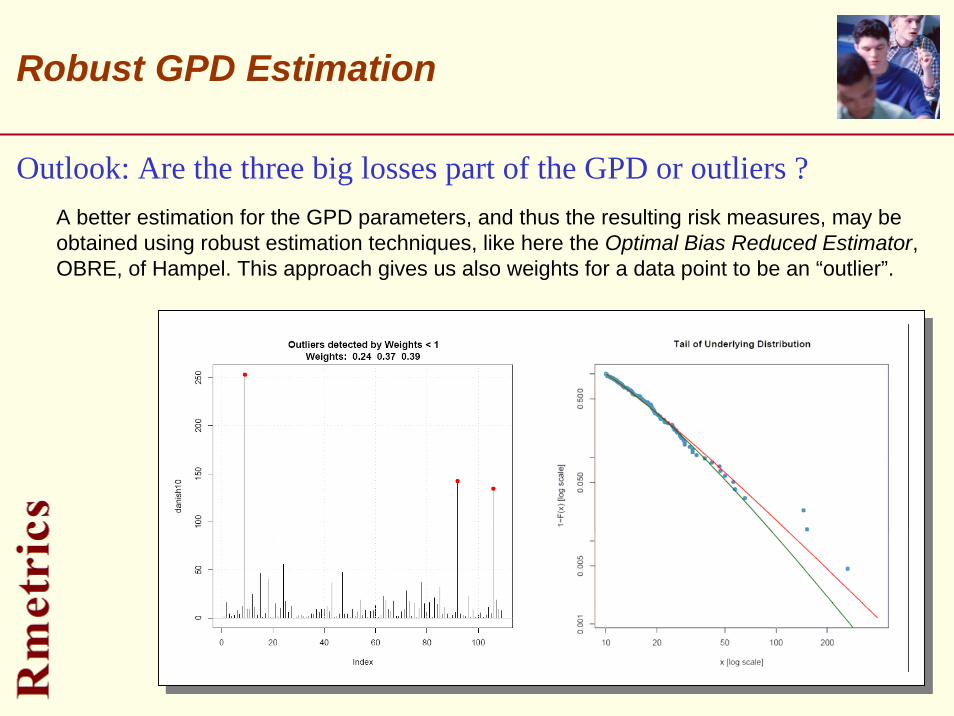
Robust GPD Estimation
Outlook: Are the three big losses part of the GPD or outliers ?A better estimation for the GPD parameters, and thus the resulting risk measures, may be obtained using robust estimation techniques, like here the Optimal Bias Reduced Estimator, OBRE, of Hampel. This approach gives us also weights for a data point to be an “outlier”.
34
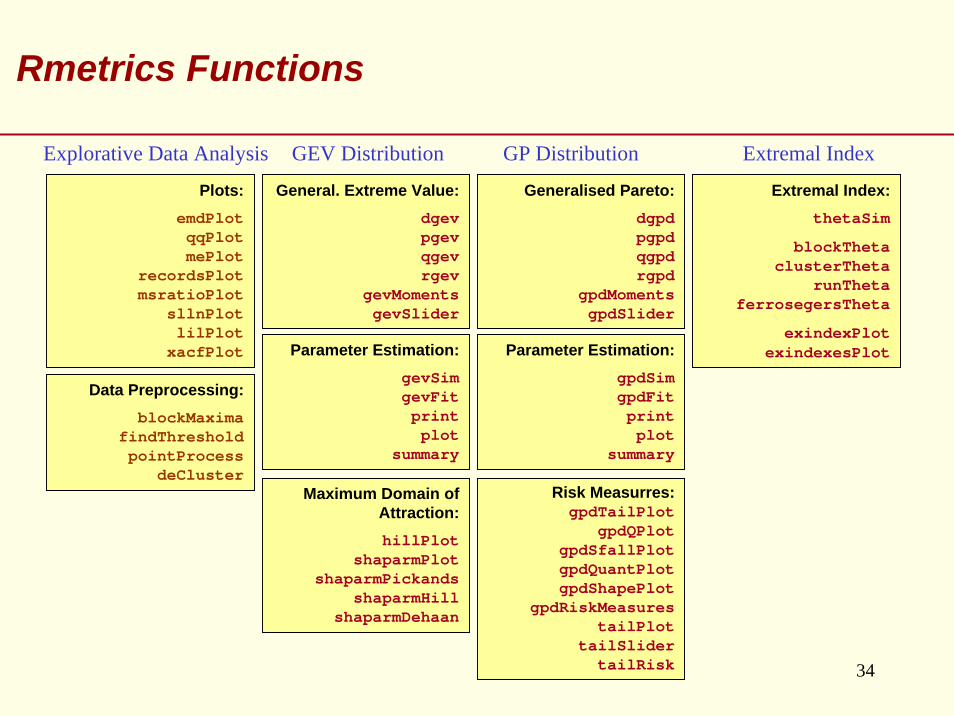
Rmetrics Functions
Data Preprocessing:blockMaxima
findThresholdpointProcess
deCluster
Explorative Data Analysis GEV Distribution Extremal Index
Plots:emdPlotqqPlotmePlot
recordsPlotmsratioPlot
sllnPlotlilPlot
xacfPlot
General. Extreme Value:dgevpgevqgevrgev
gevMomentsgevSlider
Generalised Pareto:dgpdpgpdqgpdrgpd
gpdMomentsgpdSlider
Extremal Index:thetaSim
blockThetaclusterTheta
runThetaferrosegersTheta
exindexPlotexindexesPlot
GP Distribution
Parameter Estimation:gevSimgevFitprintplot
summary
Maximum Domain of Attraction:hillPlot
shaparmPlotshaparmPickands
shaparmHillshaparmDehaan
Parameter Estimation:gpdSimgpdFitprintplot
summary
Risk Measurres:gpdTailPlot
gpdQPlotgpdSfallPlotgpdQuantPlotgpdShapePlot
gpdRiskMeasurestailPlot
tailSlidertailRisk
35
Copulae
Solar Heights – Nadja Neiler Ugo
36
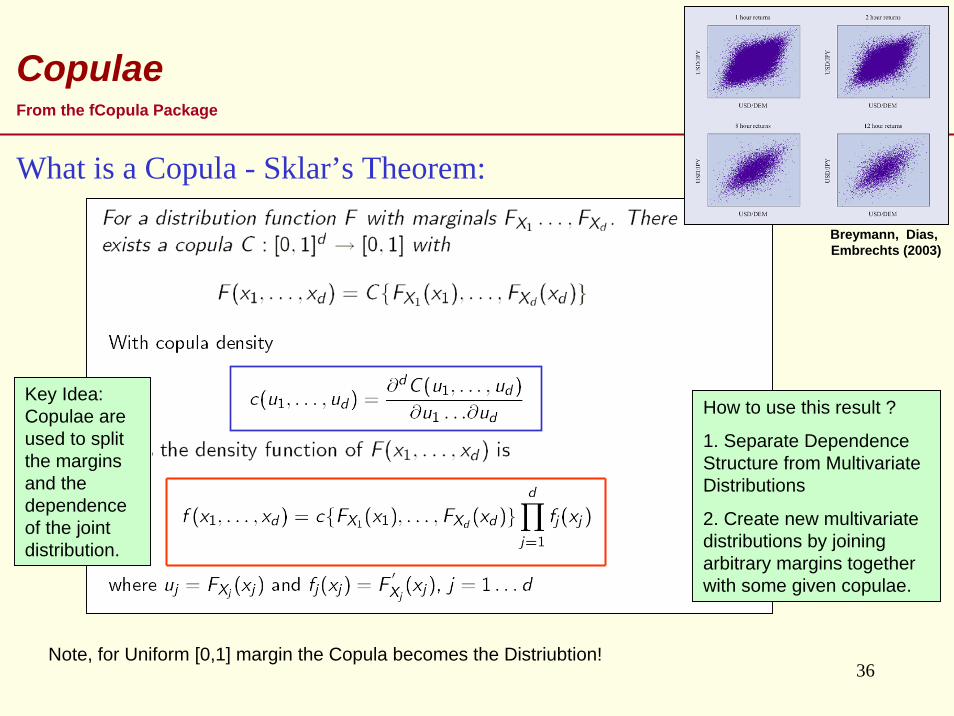
Copulae
Key Idea: Copulae are used to split the margins and thedependence of the joint distribution.
How to use this result ?
1. Separate DependenceStructure from MultivariateDistributions
2. Create new multivariate distributions by joining arbitrary margins together with some given copulae.
What is a Copula - Sklar’s Theorem:
Note, for Uniform [0,1] margin the Copula becomes the Distriubtion!
From the fCopula Package
Breymann, Dias, Embrechts (2003)

37
Applications
Finance:– Stress testing – Credit Risk Management– Risk Management Basle II– Pricing/Hedging basket
derivatives
Insurance:– Life (multi-life products)– Non-Life, multi-line covers– Risk Management,
Solvency 2– Dynamic Financial Analysis,
ALM
Density
Random Variates
Fitting
38
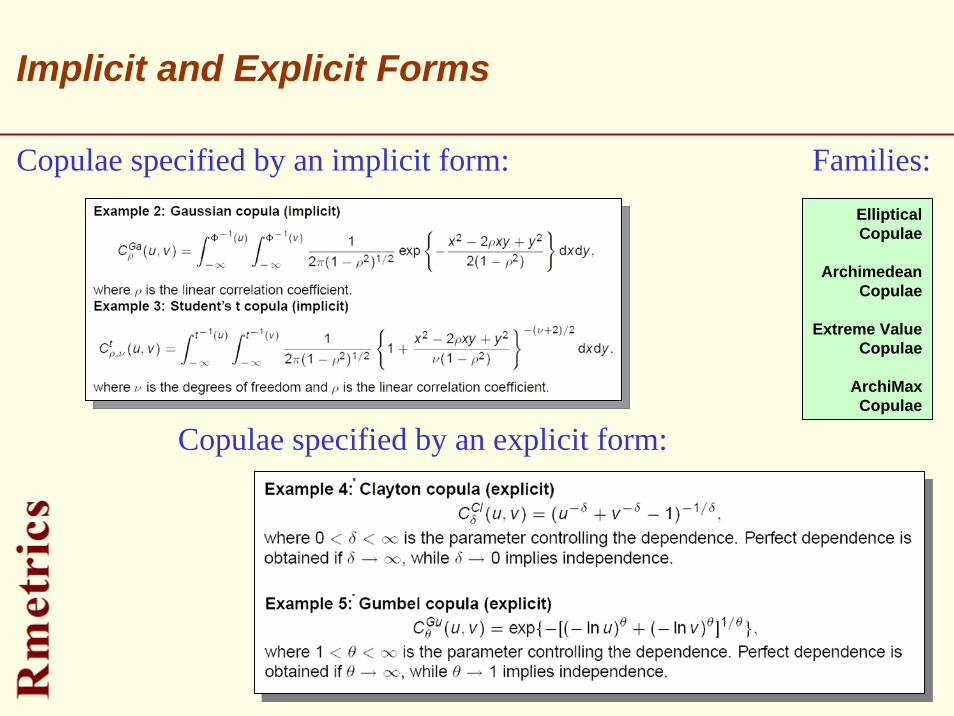
Implicit and Explicit Forms
Copulae specified by an implicit form:
Copulae specified by an explicit form:
EllipticalCopulae
ArchimedeanCopulae
Extreme ValueCopulae
ArchiMaxCopulae
Families:
39
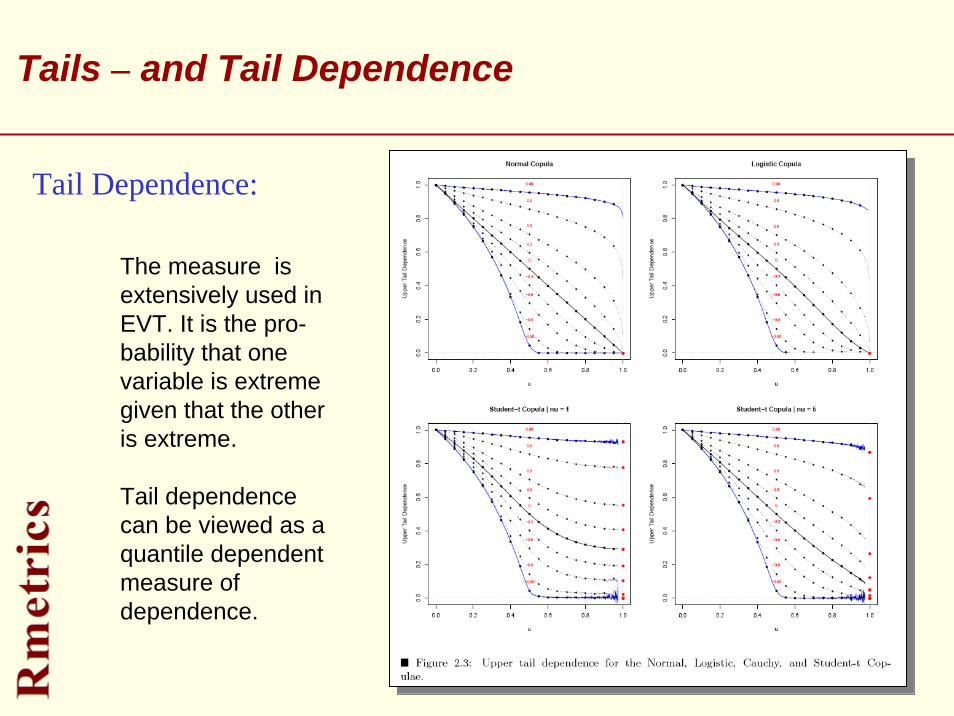
Tails – and Tail Dependence
Tail Dependence:
The measure is extensively used in EVT. It is the pro-bability that one variable is extreme given that the other is extreme.
Tail dependence can be viewed as a quantile dependent measure of dependence.
40
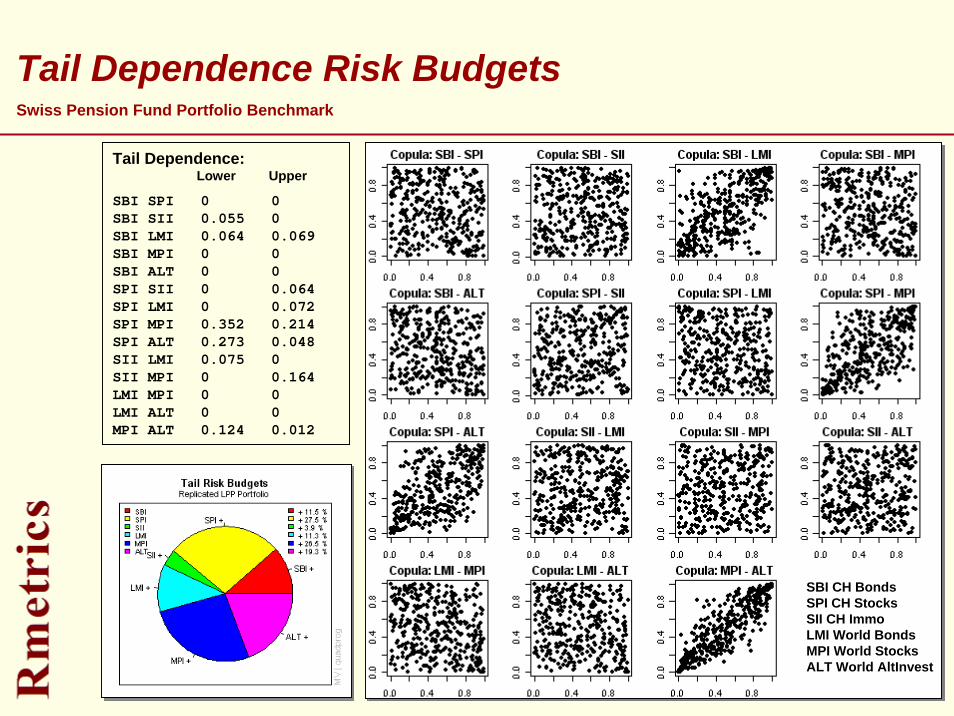
Tail Dependence Risk Budgets
Tail Dependence:Lower Upper
SBI SPI 0 0 SBI SII 0.055 0 SBI LMI 0.064 0.069 SBI MPI 0 0 SBI ALT 0 0 SPI SII 0 0.064 SPI LMI 0 0.072 SPI MPI 0.352 0.214 SPI ALT 0.273 0.048 SII LMI 0.075 0 SII MPI 0 0.164 LMI MPI 0 0 LMI ALT 0 0 MPI ALT 0.124 0.012
SBI CH BondsSPI CH StocksSII CH ImmoLMI World BondsMPI World StocksALT World AltInvest
Swiss Pension Fund Portfolio Benchmark
41
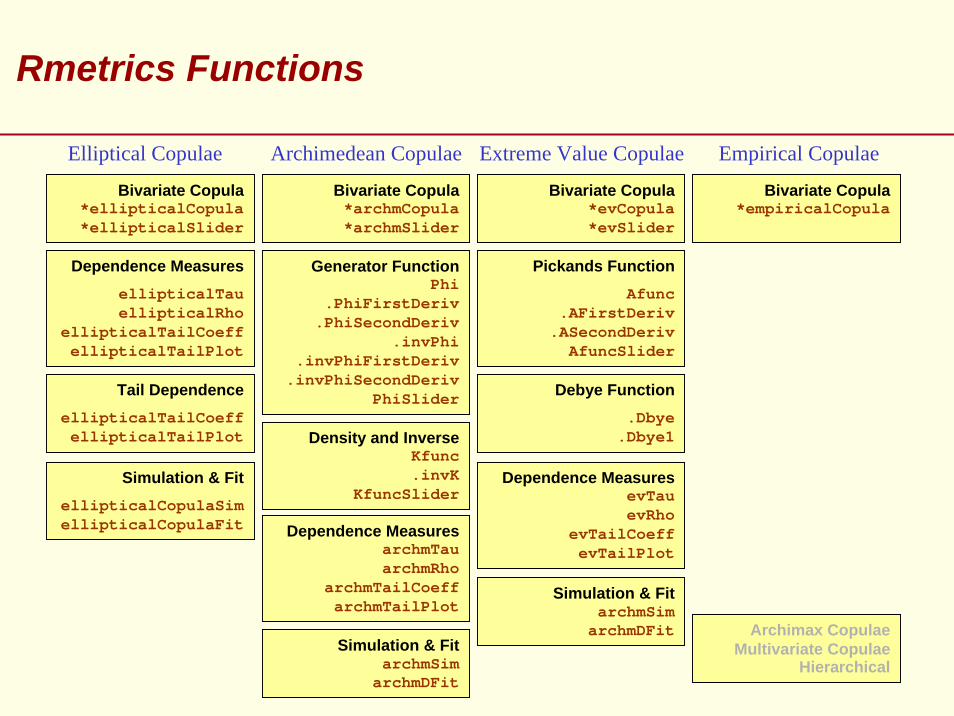
Rmetrics Functions
Dependence MeasuresellipticalTau ellipticalRho
ellipticalTailCoeffellipticalTailPlot
Simulation & FitellipticalCopulaSimellipticalCopulaFit
Tail DependenceellipticalTailCoeffellipticalTailPlot
Generator FunctionPhi
.PhiFirstDeriv.PhiSecondDeriv
.invPhi.invPhiFirstDeriv
.invPhiSecondDerivPhiSlider
Density and InverseKfunc.invK
KfuncSlider
Dependence MeasuresarchmTauarchmRho
archmTailCoeffarchmTailPlot
Elliptical Copulae Archimedean Copulae Extreme Value Copulae Empirical Copulae
Pickands FunctionAfunc
.AFirstDeriv.ASecondDeriv
AfuncSlider
Debye Function.Dbye
.Dbye1
Bivariate Copula*ellipticalCopula*ellipticalSlider
Bivariate Copula*archmCopula*archmSlider
Bivariate Copula*evCopula*evSlider
Simulation & FitarchmSim
archmDFit
Bivariate Copula*empiricalCopula
Archimax CopulaeMultivariate Copulae
Hierarchical
Simulation & FitarchmSim
archmDFit
Dependence MeasuresevTauevRho
evTailCoeffevTailPlot

42
Options
The Tree of Life – Gustav Klimt
43
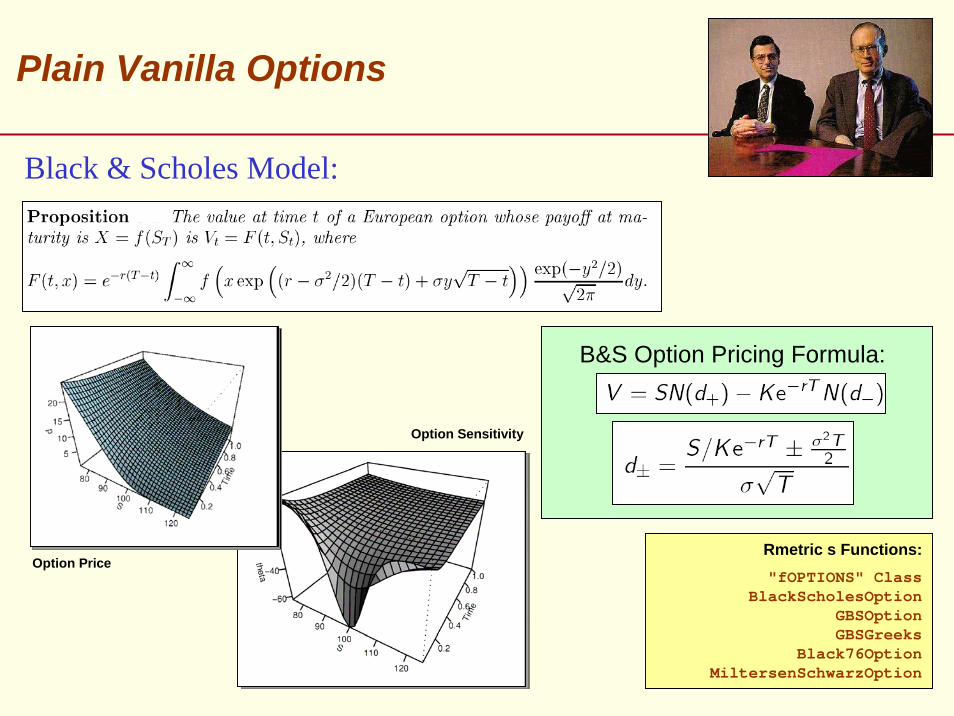
B&S Option Pricing Formula:
Black & Scholes Model:
Plain Vanilla Options
Rmetric s Functions:"fOPTIONS" Class
BlackScholesOptionGBSOptionGBSGreeks
Black76OptionMiltersenSchwarzOption
Option Price
Option Sensitivity

44
Exotic OptionsRmetrics Functions:
ExecutiveStockOptionForwardStartOption
RatchetOptionTimeSwitchOption
SimpleChooserOptionComplexChooserOption
OptionOnOption
HolderExtendibleOptionWriterExtendibleOption
TwoAssetCorrelationOptionExchangeOneForAnotherOption
ExchangeOnExchangeOptionEuropeanExchangeOption
AmericanExchangeOptionFloatingStrikeLookbackOption
FixedStrikeLookbackOptioPTFloatingStrikeLookbackOption
PTFixedStrikeLookbackOption
StandardBarrierOptionDoubleBarrierOption
PTSingleAssetBarrierOptionTwoAssetBarrierOption
PTTwoAssetBarrierOptionLookBarrierOption
DiscreteBarrierOptionSoftBarrierOption
GapOptionCashOrNothingOption
TwoAssetCashOrNothingOptionAssetOrNothingOption
SuperShareOptionBinaryBarrierOption
GeometricAverageAsianOptionTurnbullWakemanAsianApproxOption
LevyAsianApproxOptionFEInDomesticFXOptionEquityLinkedFXOption
TakeoverFXOption
Exotic Options
Rmetrics has implemented several functions to price (beside plain vanilla, options) many types of exotic options.
An Exotic Option breaks at least one of the standard contract terms of a traditional option. They can be manipulated according to the following categories:
Options with Contract VariationsPath-Dependent OptionsLimit-Dependent OptionsMulti-Factor Options
An Example From the fOptions Package
45
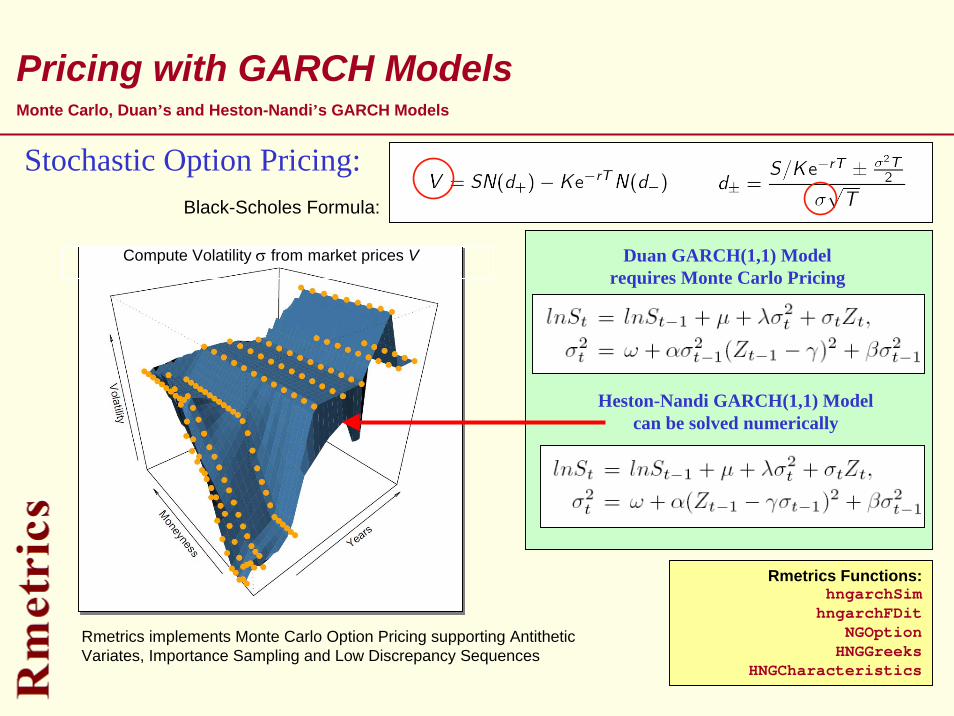
Pricing with GARCH ModelsMonte Carlo, Duan’s and Heston-Nandi’s GARCH Models
Duan GARCH(1,1) Modelrequires Monte Carlo Pricing
Heston-Nandi GARCH(1,1) Modelcan be solved numerically
Compute Volatility σ from market prices V
Stochastic Option Pricing:Black-Scholes Formula:
Rmetrics Functions:hngarchSim
hngarchFDitNGOption
HNGGreeks HNGCharacteristics
Rmetrics implements Monte Carlo Option Pricing supporting Antithetic Variates, Importance Sampling and Low Discrepancy Sequences
46
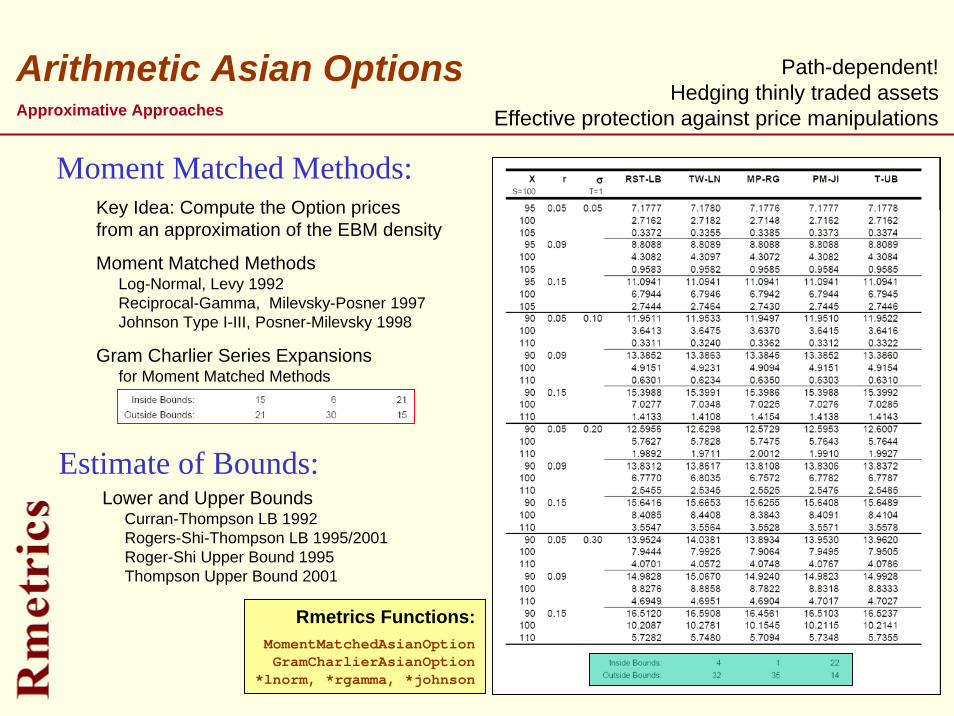
Arithmetic Asian Options
Key Idea: Compute the Option pricesfrom an approximation of the EBM density
Moment Matched MethodsLog-Normal, Levy 1992Reciprocal-Gamma, Milevsky-Posner 1997Johnson Type I-III, Posner-Milevsky 1998
Gram Charlier Series Expansionsfor Moment Matched Methods
Moment Matched Methods:
Rmetrics Functions:MomentMatchedAsianOptionGramCharlierAsianOption
*lnorm, *rgamma, *johnson
Lower and Upper BoundsCurran-Thompson LB 1992Rogers-Shi-Thompson LB 1995/2001Roger-Shi Upper Bound 1995Thompson Upper Bound 2001
Estimate of Bounds:
Approximative Approaches
Path-dependent!Hedging thinly traded assets
Effective protection against price manipulations
47
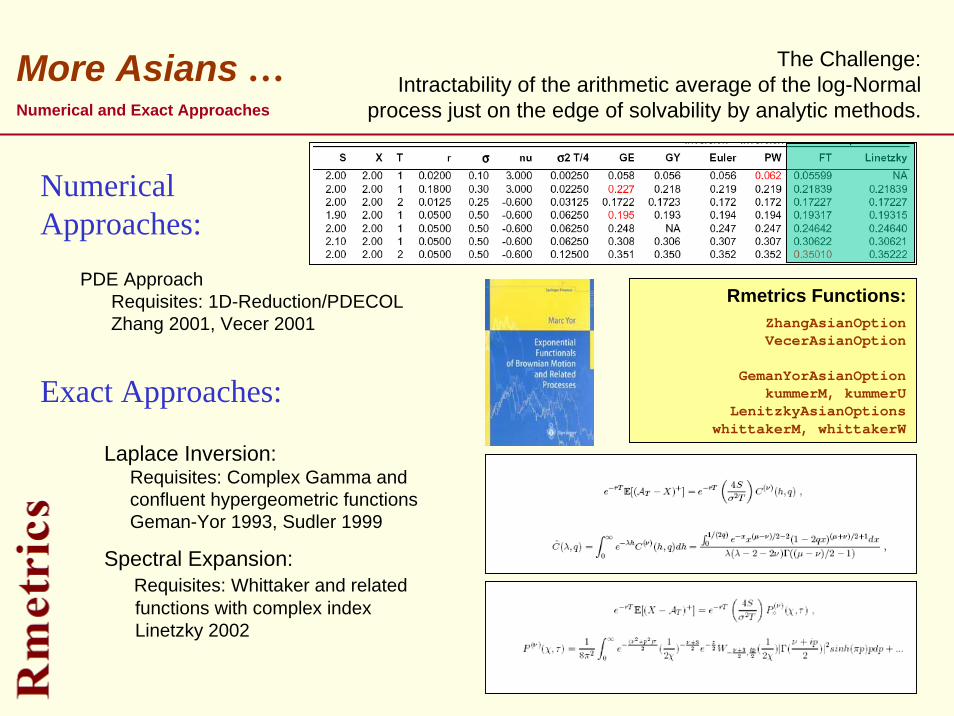
More Asians …
Laplace Inversion:Requisites: Complex Gamma andconfluent hypergeometric functionsGeman-Yor 1993, Sudler 1999
Spectral Expansion:Requisites: Whittaker and relatedfunctions with complex indexLinetzky 2002
PDE ApproachRequisites: 1D-Reduction/PDECOLZhang 2001, Vecer 2001
Numerical Approaches:
Exact Approaches:
Rmetrics Functions:ZhangAsianOptionVecerAsianOption
GemanYorAsianOptionkummerM, kummerU
LenitzkyAsianOptionswhittakerM, whittakerW
Numerical and Exact Approaches
The Challenge:Intractability of the arithmetic average of the log-Normal
process just on the edge of solvability by analytic methods.
48
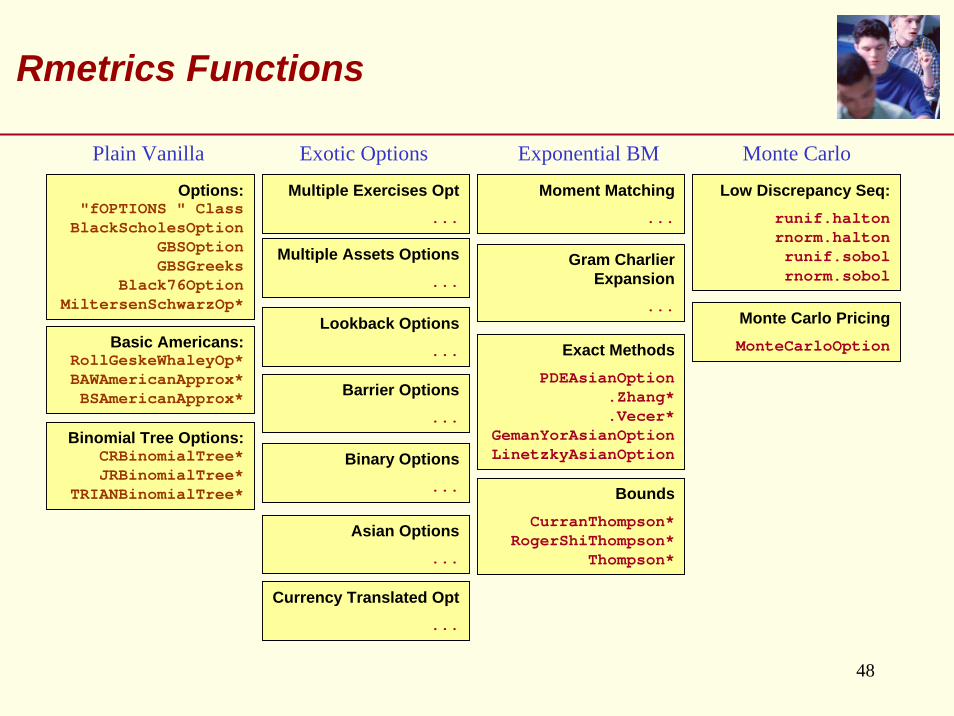
Rmetrics Functions
Basic Americans:RollGeskeWhaleyOp*BAWAmericanApprox*BSAmericanApprox*
Plain Vanilla Exotic Options Monte Carlo
Options:"fOPTIONS " Class
BlackScholesOptionGBSOptionGBSGreeks
Black76OptionMiltersenSchwarzOp*
Multiple Exercises Opt...
Moment Matching...
Low Discrepancy Seq:runif.haltonrnorm.haltonrunif.sobolrnorm.sobol
Exponential BM
Multiple Assets Options...
Binomial Tree Options: CRBinomialTree*JRBinomialTree*
TRIANBinomialTree*
Lookback Options...
Barrier Options...
Binary Options...
Asian Options...
Currency Translated Opt...
Gram CharlierExpansion
...
Exact MethodsPDEAsianOption
.Zhang*
.Vecer*GemanYorAsianOptionLinetzkyAsianOption
BoundsCurranThompson*
RogerShiThompson*Thompson*
Monte Carlo PricingMonteCarloOption
49
Term Structure Modelling
Structure Joyeuse – Wassily Kandinski
50
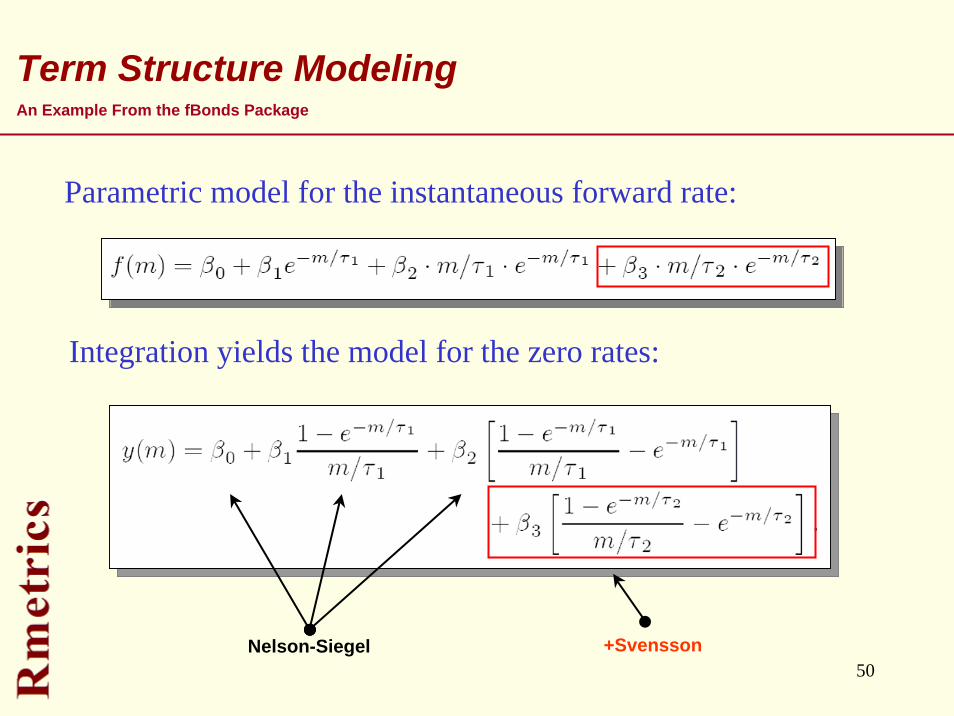
Term Structure Modeling
Parametric model for the instantaneous forward rate:
Integration yields the model for the zero rates:
Nelson-Siegel +Svensson
An Example From the fBonds Package
51
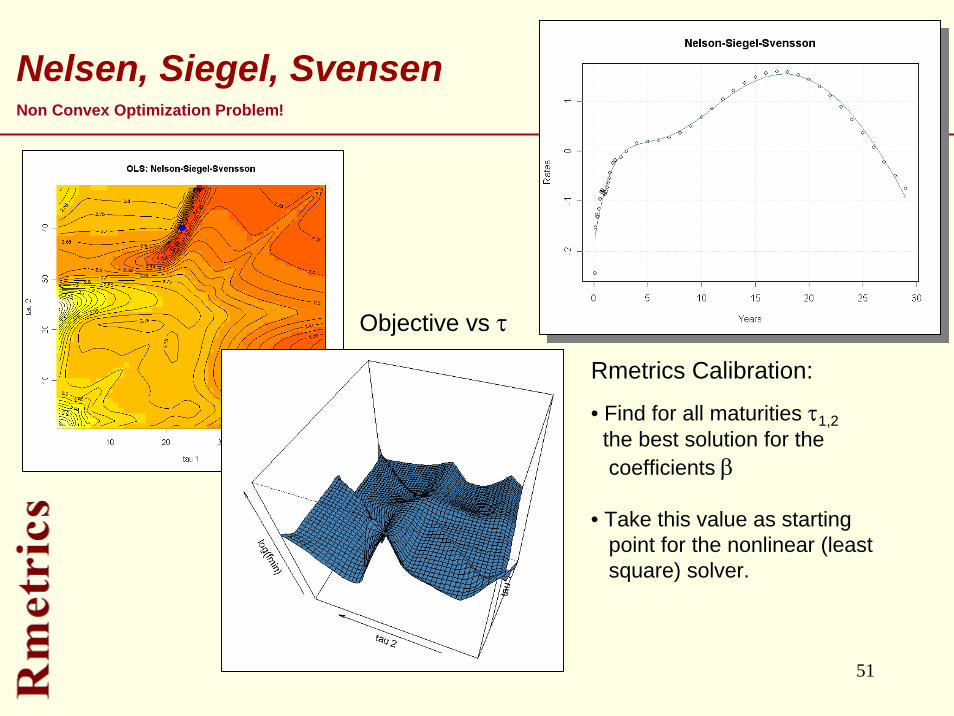
Nelsen, Siegel, Svensen
Rmetrics Calibration:
• Find for all maturities τ1,2the best solution for the coefficients β
• Take this value as starting point for the nonlinear (leastsquare) solver.
Objective vs τ
Non Convex Optimization Problem!
52
PortfolioSelection and Optimization
Circ
les
in a
Circ
le –
Was
sily
Kan
dins
ki
53
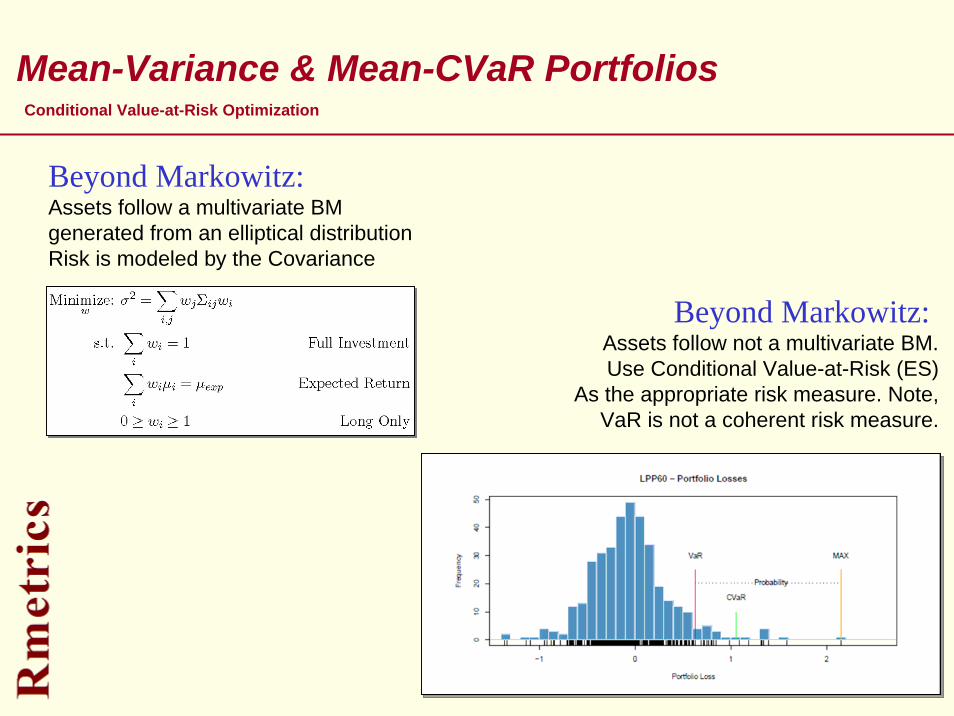
Beyond Markowitz:Assets follow not a multivariate BM.Use Conditional Value-at-Risk (ES)
As the appropriate risk measure. Note,VaR is not a coherent risk measure.
Mean-Variance & Mean-CVaR PortfoliosConditional Value-at-Risk Optimization
Beyond Markowitz:Assets follow a multivariate BMgenerated from an elliptical distributionRisk is modeled by the Covariance
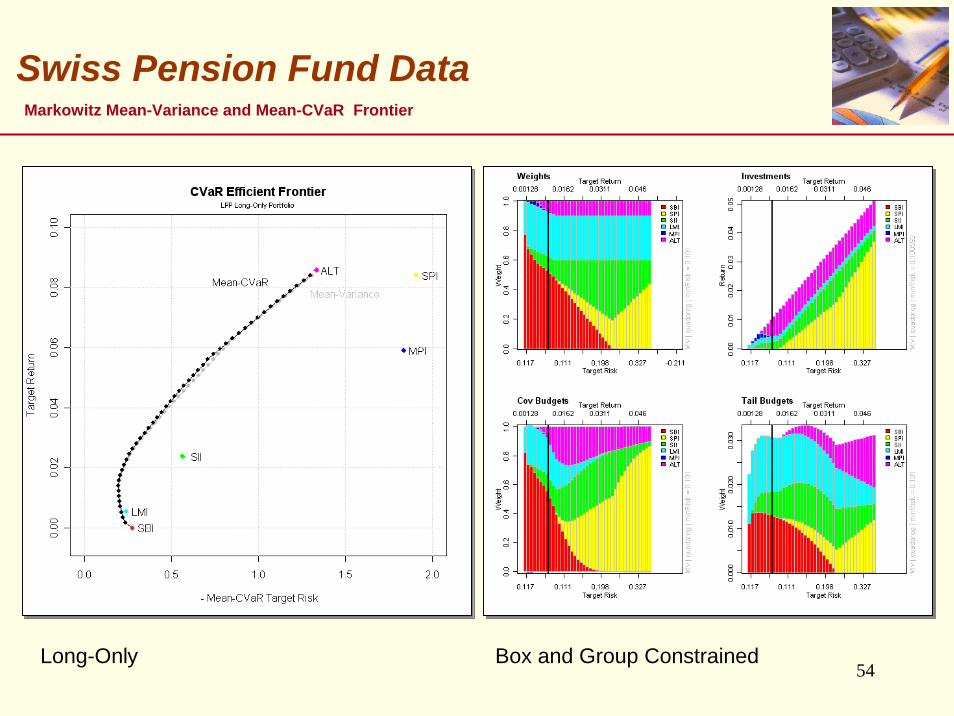
54
Swiss Pension Fund DataMarkowitz Mean-Variance and Mean-CVaR Frontier
Long-Only Box and Group Constrained
55
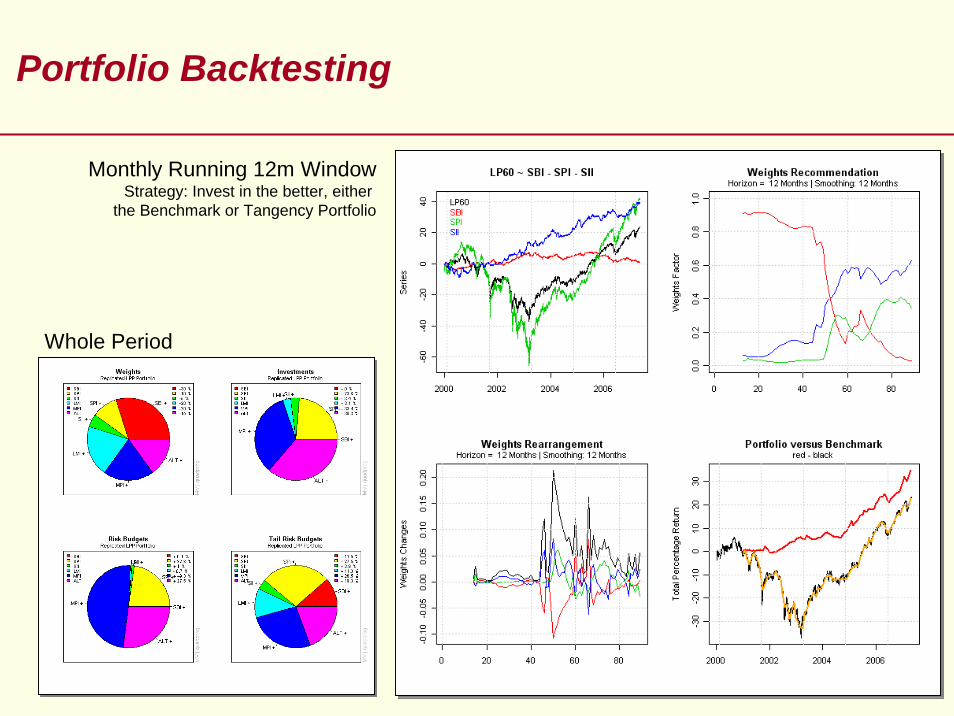
Portfolio Backtesting
Whole Period
Monthly Running 12m WindowStrategy: Invest in the better, either
the Benchmark or Tangency Portfolio
56
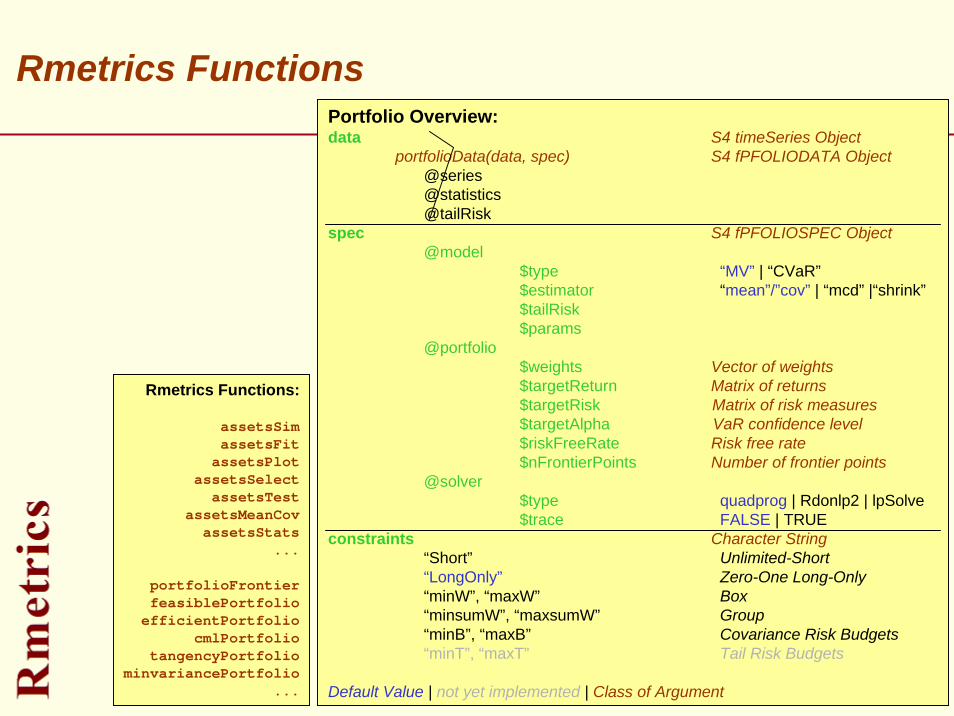
Portfolio Overview:data S4 timeSeries Object
portfolioData(data, spec) S4 fPFOLIODATA Object@series@statistics@tailRisk
spec S4 fPFOLIOSPEC Object@model
$type “MV” | “CVaR”$estimator “mean”/”cov” | “mcd” |“shrink”$tailRisk$params
@portfolio$weights Vector of weights$targetReturn Matrix of returns$targetRisk Matrix of risk measures$targetAlpha VaR confidence level$riskFreeRate Risk free rate$nFrontierPoints Number of frontier points
@solver$type quadprog | Rdonlp2 | lpSolve$trace FALSE | TRUE
constraints Character String“Short” Unlimited-Short“LongOnly” Zero-One Long-Only“minW”, “maxW” Box“minsumW”, “maxsumW” Group“minB”, “maxB” Covariance Risk Budgets“minT”, “maxT” Tail Risk Budgets
Default Value | not yet implemented | Class of Argument
Rmetrics Functions
Rmetrics Functions:
assetsSimassetsFit
assetsPlotassetsSelect
assetsTestassetsMeanCov
assetsStats...
portfolioFrontierfeasiblePortfolio
efficientPortfoliocmlPortfolio
tangencyPortfoliominvariancePortfolio
...
57
timeDatetimeSeries
Raum und Zeit – Timothy Baar

58
timeDate & time Series Class
setClass("timeDate", representation(
Data = "POSIXct",Dim = "character",format = "character", FinCenter = "character",
))
setClass("timeDate", representation(
Data = "POSIXct",Dim = "character",format = "character", FinCenter = "character",
))
“GMT” POSIXct Object Number of Date ElementsPosix Format SpecificationName of Financial Center
Class Representation:
setClass("timeSeries", representation(
Data = "matrix",positions = "character",format = "character", FinCenter = "character", units = "character",recordIDs = "data.frame", title = "character",documentation = "character"
))
setClass("timeSeries", representation(
Data = "matrix",positions = "character",format = "character", FinCenter = "character", units = "character",recordIDs = "data.frame", title = "character",documentation = "character"
))
Numeric Matrix of InstrumentsCommon Time/Date StampsPosix Date FormatName of Financial CenterNames of Financial Instruments
Optional Record IdentifiersGives a Title to the Time Series Briefly Describes the Time Series
Provides Splus Compatibility
59
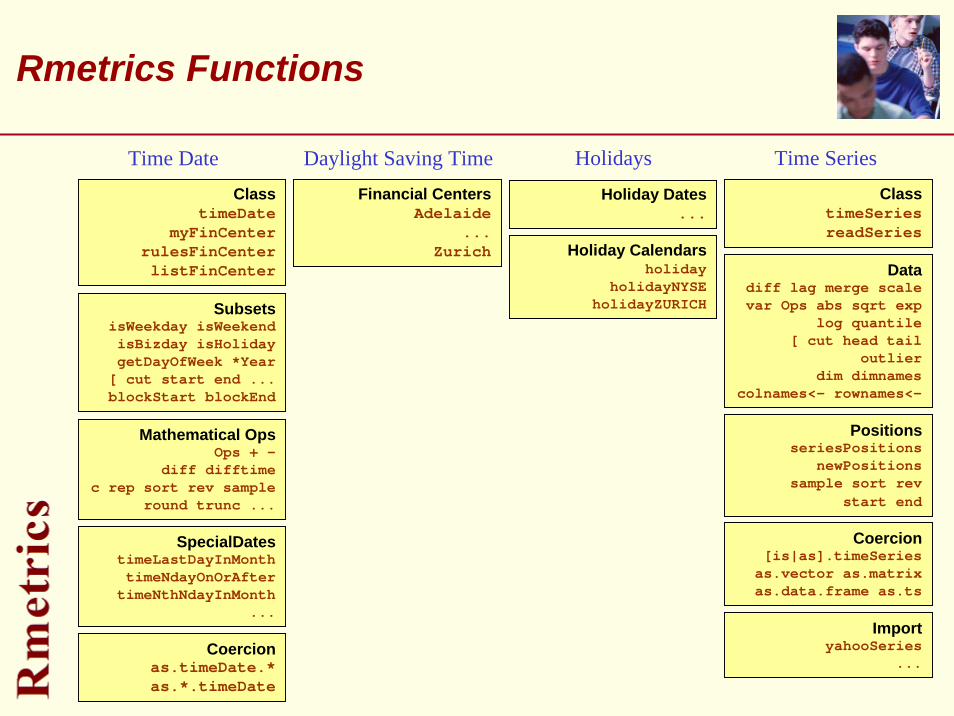
Rmetrics Functions
SubsetsisWeekday isWeekendisBizday isHoliday getDayOfWeek *Year
[ cut start end ...blockStart blockEnd
Mathematical OpsOps + -
diff difftimec rep sort rev sample
round trunc ...
SpecialDatestimeLastDayInMonth timeNdayOnOrAfter
timeNthNdayInMonth...
Daylight Saving TimeTime Date Time SeriesHolidays
Datadiff lag merge scale var Ops abs sqrt exp
log quantile[ cut head tail
outlierdim dimnames
colnames<- rownames<-
PositionsseriesPositions
newPositionssample sort rev
start end
Financial CentersAdelaide
...Zurich
ClasstimeDate
myFinCenter rulesFinCenterlistFinCenter
ClasstimeSeriesreadSeries
Coercionas.timeDate.*as.*.timeDate
Coercion [is|as].timeSeries
as.vector as.matrix as.data.frame as.ts
Holiday Dates...
ImportyahooSeries
...
Holiday Calendarsholiday
holidayNYSEholidayZURICH
60
CRAN Task ViewFinance
Raum und Zeit – Timothy Baar
61
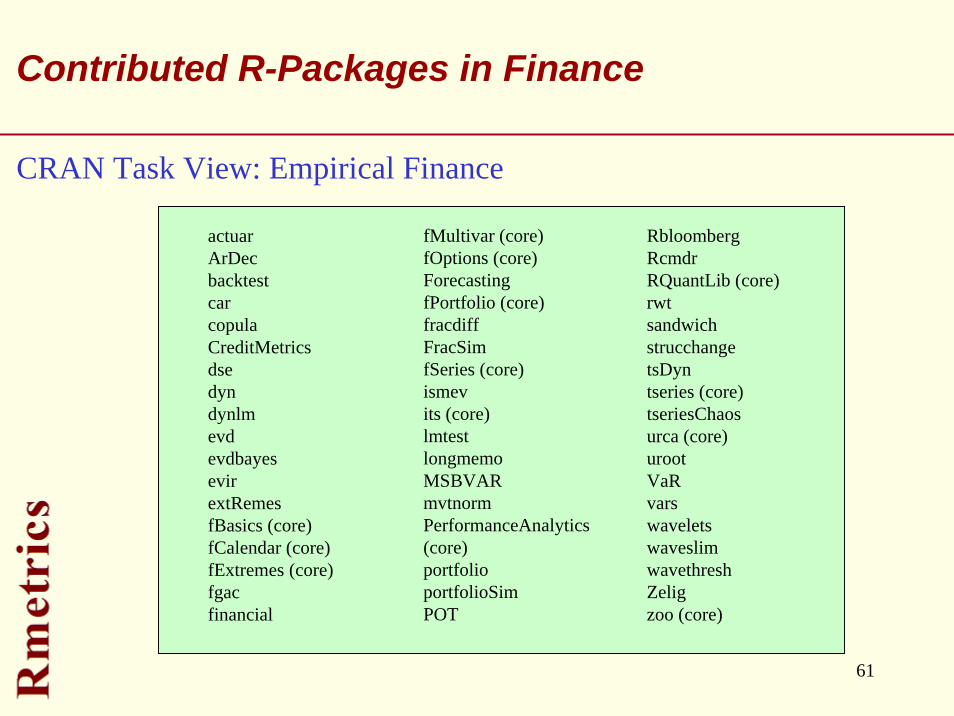
Contributed R-Packages in Finance
actuarArDecbacktestcarcopulaCreditMetricsdsedyndynlmevdevdbayesevirextRemesfBasics (core)fCalendar (core)fExtremes (core)fgacfinancial
RbloombergRcmdrRQuantLib (core)rwtsandwichstrucchangetsDyntseries (core)tseriesChaosurca (core)urootVaRvarswaveletswaveslimwavethreshZeligzoo (core)
fMultivar (core)fOptions (core)ForecastingfPortfolio (core)fracdiffFracSimfSeries (core)ismevits (core)lmtestlongmemoMSBVARmvtnormPerformanceAnalytics(core)portfolioportfolioSimPOT
CRAN Task View: Empirical Finance
62(c) 2007 Diethelm Würtz
www.itp.phys.ethz.ch | www.rmetrics.org | www.finance.ch
Thanks to CRAN and Kurt Hornik, …Thanks to R-sig-finance and Martin Mächler, …Thanks to Rmetrics on Debian and Dirk Eddelbüttel, …Thanks to all who have contributed to Rmetrics, …
Thank you for Your Attention