Embed Size (px)
Citation preview
An Effectiveness Study on Trajectory Similarity Measures
Haozhou Wang1 Han Su1 Kai Zheng1 Shazia Sadiq1 Xiaofang Zhou1
School of Information Technology and Electrical Engineering,The University of Queensland,
St. Lucia, Brisbane, QLD 4072, AustraliaEmail: 1{h.wang16, h.su1, kevinz, shazia, zxf}@uq.edu.au
Abstract
The last decade has witnessed the prevalence of sensorand GPS technologies that produce a sheer volumeof trajectory data representing the motion history ofmoving objects. Measuring similarity between tra-jectories is undoubtedly one of the most importanttasks in trajectory data management since it servesas the foundation of many advanced analyses suchas similarity search, clustering, and classification. Inthis light, tremendous efforts have been spent on thistopic, which results in a large number of trajectorysimilarity measures. Generally, each individual workintroducing a new distance measure has made spe-cific claims on the superiority of their proposal. How-ever, for most works, the experimental study was fo-cused on demonstrating the efficiency of the searchalgorithms, leaving the effectiveness aspect unverifiedempirically. In this paper, we conduct a compara-tive experimental study on the effectiveness of sixwidely used trajectory similarity measures based on areal taxi trajectory dataset. By applying a variety oftransformations we designed for each original trajec-tory, our experimental observations demonstrate theadvantages and drawbacks of these similarity mea-sures in different circumstances.
1 Introduction
Driven by major advances in sensor technology, GPS-enabled mobile devices and wireless communication,large amounts of data describing the motion historyof moving objects, known as trajectories, are cur-rently generated and managed in many of applicationdomains such as environmental information systems,meteorology, wireless technology, video tracking, orvideo motion capture (Zheng et al. n.d., Shang et al.2012, Zheng et al. 2011, Xie et al. 2009, Chen et al.2010, Zheng et al. 2010, Chen et al. 2011). Typicalexamples include collecting the GPS location histo-ries of taxicabs for safety and management purpose,tracking animals for their migration patterns, gath-ering human motion data by tracking body joints, ortracing the evolution of migrating particles in biolog-ical sciences.
The trajectory of a moving object is typically mod-elled as a time-stamped sequence of consecutive lo-
Copyright c©2013, Australian Computer Society, Inc. This pa-per appeared at the 24th Australasian Database Conference(ADC 2013), Adelaide, South Australia, January-February2013. Conferences in Research and Practice in InformationTechnology (CRPIT), Vol. 137, Hua Wang and Rui Zhang, Ed.Reproduction for academic, not-for-profit purposes permittedprovided this text is included.
cations in a multidimensional (generally two or threedimensional) space. Such type of data has offered un-precedented information to help understand the be-haviour of moving objects, and resulted in growinginterest of data analysis in such data. An importantproblem in such analysis is designing techniques foridentifying trajectories that are similar. Such tech-niques can be used by many data analysis tasks in-cluding trajectory clustering, classification, and k-nearest neighbor search, which have a broad range ofreal applications. For instance, in many sports suchas football and tennis, it is very useful for sports re-searchers to figure out the movement patterns of topplayers by finding similar trajectories of objects (play-ers, balls) motions. By analyzing similar trajectoriesof animals, it is possible to determine migration pat-terns for them. In a city traffic monitoring system,it is helpful to locate popular routes by comparingsimilarity between vehicles trajectories.
A fundamental ingredient of such trajectory anal-ysis tasks is the distance/similarity measure that caneffectively determine the similarity of trajectories.But unlike other simple data types such as ordinalvariables or geometric points where the distance def-inition is straightforward, the distance between tra-jectories needs to be carefully defined in order to re-flect the true underlying similarity. This is due tothe fact that trajectories are essentially high dimen-sional data attached with both spatial and temporalattributes, which needs to be considered for similaritymeasures. Therefore, over ten of distance/similaritymeasures have been proposed in the literature, e.g.,Euclidean distance (ED) (Jonkery et al. 1980), Dy-namic Time Warping (DTW) (Soong & Rosenberg1988), distance based on Longest Common Subse-quence (LCSS) (Kearney & Hansen 1990),Edit Dis-tance with Real Penalty (ERP) (Chen & Ng 2004),Edit Distance on Real sequence (EDR) (Chen et al.2005). Many of these works and some of their ex-tensions have been widely cited in the literature andapplied to facilitate query processing and data miningin trajectory data.
Given the multitude of competitive techniques, agood understanding the effectiveness of various sim-ilarity measures is important. Very often a newlyintroduced distance measure has claimed a particularadvantage over some others by using an exemplifiedexplanation. Also most of those works focused onevaluating the efficiency of their pruning and search-ing algorithms, while leaving the effectiveness study,i.e., how their proposed distance measures truly re-flects the similarity between trajectories under dif-ferent circumstances, inadequate or even completelyomitted. In this light, we argue that there is a strong
Proceedings of the Twenty-Fourth Australasian Database Conference (ADC 2013), Adelaide, Australia
13
need for an empirical study on the effectiveness oftrajectory similarity measures. More specifically, inthis paper we have implemented 6 widely used trajec-tory similarity measures (shown in following list), andstudy their effectiveness in different circumstances us-ing a common real world taxicab trajectory dataset.
• Euclidean Distance Measure
– Euclidean Distance
• Dynamic Time Warping based Measures
– DTW
– PDTW
• Edit Distance based Measures
– EDR
– ERP
• Longest Common Subsequence based Measures
– LCSS
In summary, we make the following contributionsin this work.
• We observe the absence and importance of anobjective effectiveness study on widely used tra-jectory similarity measures.
• In order to overcome the lack of benchmarkdataset for effectiveness test, we devise a set ofreasonable transformation functions for the orig-inal trajectory data, the variance of which is con-trolled by parameters.
• We evaluate the similarity between original andtransformed trajectories, and study how the sim-ilarity is reflected in six different distance mea-sures.
The rest of the paper is organised as follows. Sec-tion 2 presents the preliminary concepts and brieflyreview the trajectory similarity measures we areabout to examine in this work. In Section 3, we dis-cuss the trajectory dataset used in this study, thetypes of transformations applied to the trajectories,and the experimental observations regarding the ef-fectiveness of the compared similarity measures. Wefinally give our conclusion in Section 4.
2 Similarity Measures for Trajectories
Theoretically a trajectory represents the continuousmotion history of a moving object. However, dueto the limitation of location positioning devices (e.g,sensors, GPS devices), a trajectory in real world isa sequence of positions observed at discrete time in-stances. This is also the reason that most of the exist-ing works on trajectories assume the time is discreterather than continuous. Without loss of generality, wemake the same assumption in this paper. Formally, atrajectory can be defined as the follows:
DEFINITION 1 A trajectory Tr is a finite se-quence of geo-locations with timestamps, i.e., Tr =(p1, t1), (p2, t2), ..., (pn, tn) with ti < ti+1 for i =1, 2, ..., n − 1. pi is a sampling point that is observedat time ti.
Generally the location of a sampling point of a tra-jectory is represented by a coordinate in multidimen-sional space. But for the sake of simplicity, in this pa-per we focus on trajectories in two dimensional spacesince it is applicable to a wide variety of applicationscenarios. Thus, each sampling point is representedby a pair (x, y), denoting longitude and latitude re-spectively.
In the following subsections, we briefly review thetrajectory similarity measures studied in this work.Notice that this is not meant to be a complete surveyfor the respective field and is only intended to providethe readers with a necessary background for followingour experimental evaluations.
2.1 Euclidean Distance Measure
Euclidean distance, also known as L2-norm, is dis-tance measure in literature for a variety of applica-tions. Given two trajectories T1, T2, the Euclideandistance d(T1, T2) can be calculate as, d(T1, T2) =∑n
i=1d(p1,i,p2,i)
n , where d(p1,i, p2,i) is the distance onspatial space. Euclidean distance is easy to imple-ment and indexable with many access methods, andit is parameter-free. In addition, the complexity ofEuclidean distance measure is linear, which means itcan handle a large size of trajectory data set. Eu-clidean distance is proposed as a distance measurebetween time series and is one of most commonlyused similarity function since 1960s (Priestley 1980,Pfeifer & Deutsch 1980, Faloutsos et al. 1994, Keogh& Pazzani 2000). Later, Euclidean distance is alsoextended to measure the distance between trajecto-ries (Clarke 1976, Richalet et al. 1978, Jonkery et al.1980, Sanderson & Wong 1980, Takens 1980), sincetrajectories and time series have the similar represen-tations.
2.2 Dynamic Time Warping based Measures
Dynamic Time Warping(DTW) is a well-known algo-rithm for finding similar trajectory patterns betweentwo trajectories. The definition of DTW uses a re-cursive manner to search all possible point combina-tions between two trajectories for the one with min-imal distance, which can be converted to dynamicprogramming very easily. DTW allows to find a simi-lar pattern between two given trajectories, which canbe of different lengths, with or without time informa-tion. Moreover, the original DTW similarity measureis also parameter-free. For example, two trajectoriesare separately generated by a slowly moving objectand a fast moving object, DTW can still report theirsimilarity pattern. DTW was first introduced to com-pute the distance of time series (Myers et al. 1980). In1980s,(Kruskal 1983, Soong & Rosenberg 1988, Pic-ton et al. 1988, Ostendorf & Roukos 1989) introducedDTW to measure trajectory distance. For a huge dataset, DTW is time-consuming and I/O-consuming. Tospeed up DTW and reduce I/O cost, several prun-ing methods have been introduced such as FastMapmethod and lower bound method (Sakurai et al. 2005,Yi et al. 1998).
CRPIT Volume 137 - Database Technologies 2013
14
Piecewise Dynamic Time Warping(PDTW) (Keogh & Pazzani 2000) is anotherdynamic time warping based similarity trajectoryfunction, which is improved from DTW. PDTWspeeds up DTW by a large constant c, where c isdata dependent. PDTW uses two steps to calcu-late similarity trajectory pattern. The first stepcalled Piecewise Aggregate Approximation (PAA),which cuts a given trajectory into c pieces, where[pc∗(i−1)+1, pc∗(i−1)+2, · · · , pc ∗ i] is i-th piece. Forpiece i, PAA computes pi as a representitive pointand transform trajectory T into piecewise approx-imation T = [p1, p2, · · · , pN ]. Then, in the secondstep, PDTW process DTW distance to find similartrajectory patterns between transformed trajectoriesT1 and T2.
2.3 Edit Distance based Measures
Edit distance with Real Penalty (ERP) (Chen & Ng2004) is an edit distance (ED) based trajectory sim-ilarity measure. ERP uses L1-norm as the distancemeasure. Introducing L1-norm makes ERP a metricmeasure, which is a prominent advantage over DTWand LCSS, as metric measures allow for efficient prun-ing. In addition, ERP distance is defined on normal-ized trajectory data for amplitude scaling and globalspatial shifting. ERP normalize a trajectory T byshifting by its mean (µ) and scaling by its standarddeviation(σ): Norm(T ) = [p1−µσ , p2−µσ , . . . , pn−µσ ].
Edit Distance on Real sequence (EDR) (Chenet al. 2005) is another edit distance (ED) based tra-jectory similarity measure. EDR also uses a thresholdε to detect sample points matching, which is similarwith LCSS. Like ERP, EDR also uses normalized tra-jectory data, in order to be invariant to scaling andshifting. Different with ERP, for each sample pointpi in T , the position values of x, y are normalized byusing the corresponding mean (µx), (µy) and stan-dard deviation (σx), (σy), respectively: Norm(T ) =
[(p1,x−µx
σx,p1,y−µy
σy), · · · , (pn,x−µx
σx,pn,y−µy
σy)]. The
matching defined by EDR is match(pi, pj) for a pairof trajectories’ sample points, where pi ∈ T andpj ∈ T ′, T 6= T ′. match(pi, pj) is true if and onlyif |pi,x − pj,x| ≤ ε and |pi,y − pj,y| ≤ ε, where ε isthe matching threshold. If match(pi, pj) is true, thesubcost (i.e. edit distance) between pi and pj is 0,otherwise the subcost = 1.
2.4 Longest Common Subsequence basedMeasures
Some similarity measures work well based on the as-sumption how the trajectory data are clean. However,the trajectory data generated by GPS devices are notclean enough due to device’s accuracy limitation, badGPS signals, and other factors. Therefore, a similar-ity measure which is more robust for processing lowquality trajectory data attracts great research inter-est. Longest common subsequence (LCSS) is one ofmost popular measurements, which is used for stringsimilarity, (Ichiye & Karplus 1991, Robinson 1990)apply LCSS as trajectory similarity measure. For de-tecting sample points matching like string’s charac-ters matching, a threshold ε is used, if two points’distance less than ε, they are considered to match.The basic idea of LCSS is that it allows some samplepoints unmatched to match some sequences in trajec-tories. LCSS is good for processing with low qual-ity trajectory data (i.e. noisy trajectory data), which
can figure out similarity trajectories in high accuracy.However, it may lead to some inaccuracy, since it doesnot consider various unmatched sequences in trajec-tories. We illustrate this case in our experiment.
3 Effectiveness Study
In this section we present the trajectory dataset usedin this study, the types of transformations applied tothe trajectories, and the experimental observationsregarding the effectiveness of the compared similaritymeasures.
3.1 Dataset
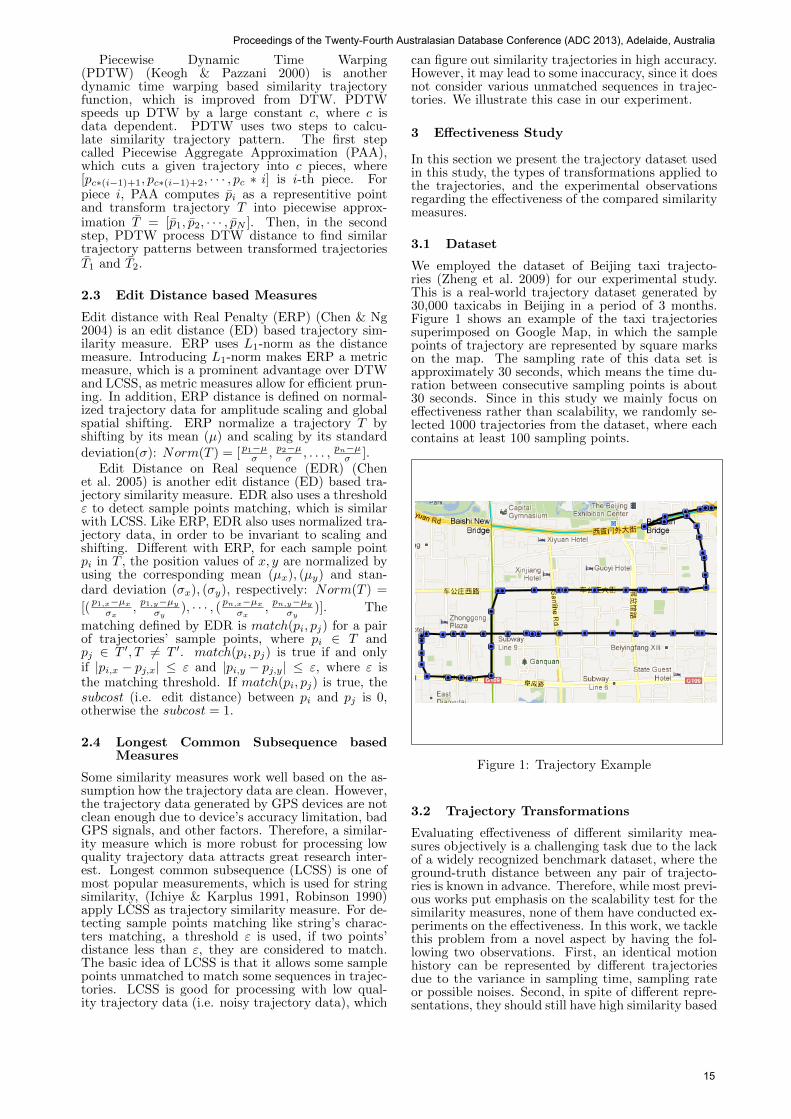
We employed the dataset of Beijing taxi trajecto-ries (Zheng et al. 2009) for our experimental study.This is a real-world trajectory dataset generated by30,000 taxicabs in Beijing in a period of 3 months.Figure 1 shows an example of the taxi trajectoriessuperimposed on Google Map, in which the samplepoints of trajectory are represented by square markson the map. The sampling rate of this data set isapproximately 30 seconds, which means the time du-ration between consecutive sampling points is about30 seconds. Since in this study we mainly focus oneffectiveness rather than scalability, we randomly se-lected 1000 trajectories from the dataset, where eachcontains at least 100 sampling points.
Figure 1: Trajectory Example
3.2 Trajectory Transformations
Evaluating effectiveness of different similarity mea-sures objectively is a challenging task due to the lackof a widely recognized benchmark dataset, where theground-truth distance between any pair of trajecto-ries is known in advance. Therefore, while most previ-ous works put emphasis on the scalability test for thesimilarity measures, none of them have conducted ex-periments on the effectiveness. In this work, we tacklethis problem from a novel aspect by having the fol-lowing two observations. First, an identical motionhistory can be represented by different trajectoriesdue to the variance in sampling time, sampling rateor possible noises. Second, in spite of different repre-sentations, they should still have high similarity based
Proceedings of the Twenty-Fourth Australasian Database Conference (ADC 2013), Adelaide, Australia
15
on any good similarity measure since they all actuallyrefer to the same motion record.
Based upon this, our evaluation procedure worksas follows. We firstly pick up a trajectory as the orig-inal trajectory. Then we perform several types oftransformations on the original trajectory in a con-trolled way (by using parameters), resulting in a setof transformed trajectories. For each transformation,we will evaluate the distance between the original andtransformed trajectories and tune the parameter tosee how their distance is affected. The rational be-hind this is that, with a reasonable similarity mea-sure, the trajectory with a lower degree of transfor-mation should have higher similarity with the originaltrajectory, and vice versa.
We devise three types of transformation functions,namely re-sampling a trajectory, shifting trajectorypoints, and adding noise. These transformations arecontrolled by two parameters, rate and distance. Theparameter rate is used to specify the percentage ofthe trajectory points that will be transformed; for in-stance, rate = 0.1 means that 10% of the trajectorypoints are to be transformed by the transformationfunction, distance = 0.0001 means that the trajec-tory points are to be shifted around 11 meters bytransformation function. The parameter distance isa threshold on how far a trajectory point might beshifted with respect to the original point. Table 1summarizes all the transformation functions and theparameters.
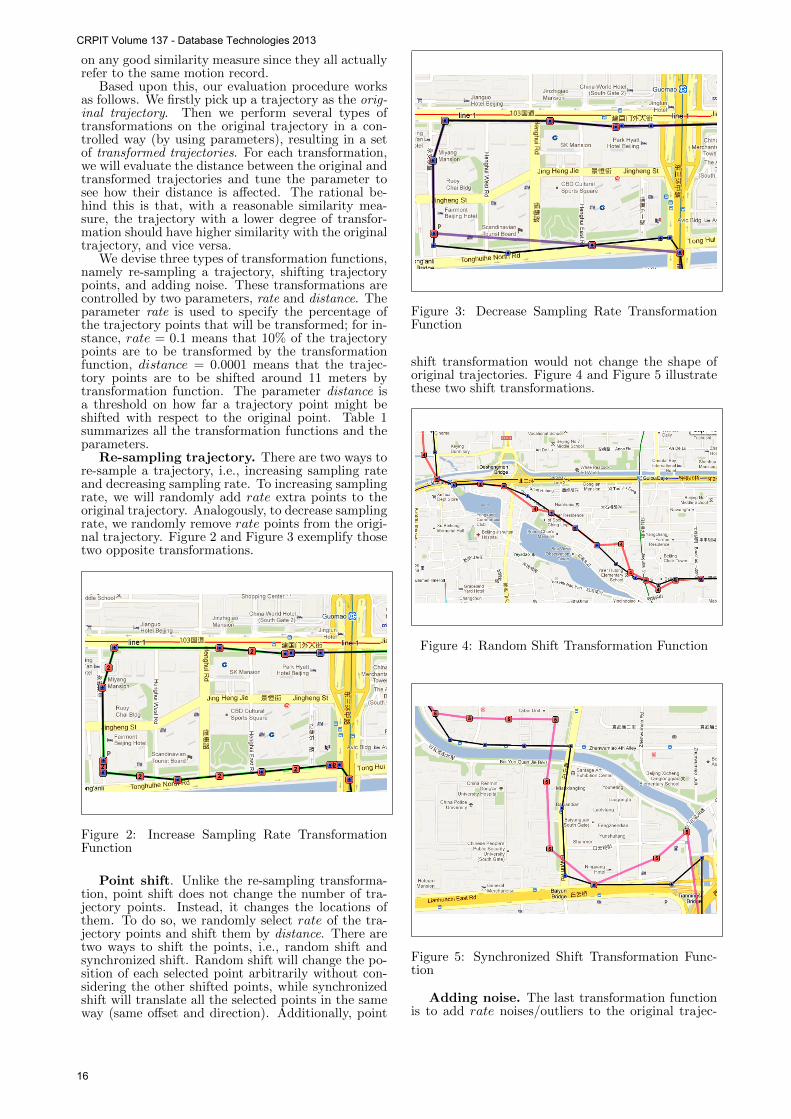
Re-sampling trajectory. There are two ways tore-sample a trajectory, i.e., increasing sampling rateand decreasing sampling rate. To increasing samplingrate, we will randomly add rate extra points to theoriginal trajectory. Analogously, to decrease samplingrate, we randomly remove rate points from the origi-nal trajectory. Figure 2 and Figure 3 exemplify thosetwo opposite transformations.
Figure 2: Increase Sampling Rate TransformationFunction
Point shift. Unlike the re-sampling transforma-tion, point shift does not change the number of tra-jectory points. Instead, it changes the locations ofthem. To do so, we randomly select rate of the tra-jectory points and shift them by distance. There aretwo ways to shift the points, i.e., random shift andsynchronized shift. Random shift will change the po-sition of each selected point arbitrarily without con-sidering the other shifted points, while synchronizedshift will translate all the selected points in the sameway (same offset and direction). Additionally, point
Figure 3: Decrease Sampling Rate TransformationFunction
shift transformation would not change the shape oforiginal trajectories. Figure 4 and Figure 5 illustratethese two shift transformations.
Figure 4: Random Shift Transformation Function
Figure 5: Synchronized Shift Transformation Func-tion
Adding noise. The last transformation functionis to add rate noises/outliers to the original trajec-
CRPIT Volume 137 - Database Technologies 2013
16
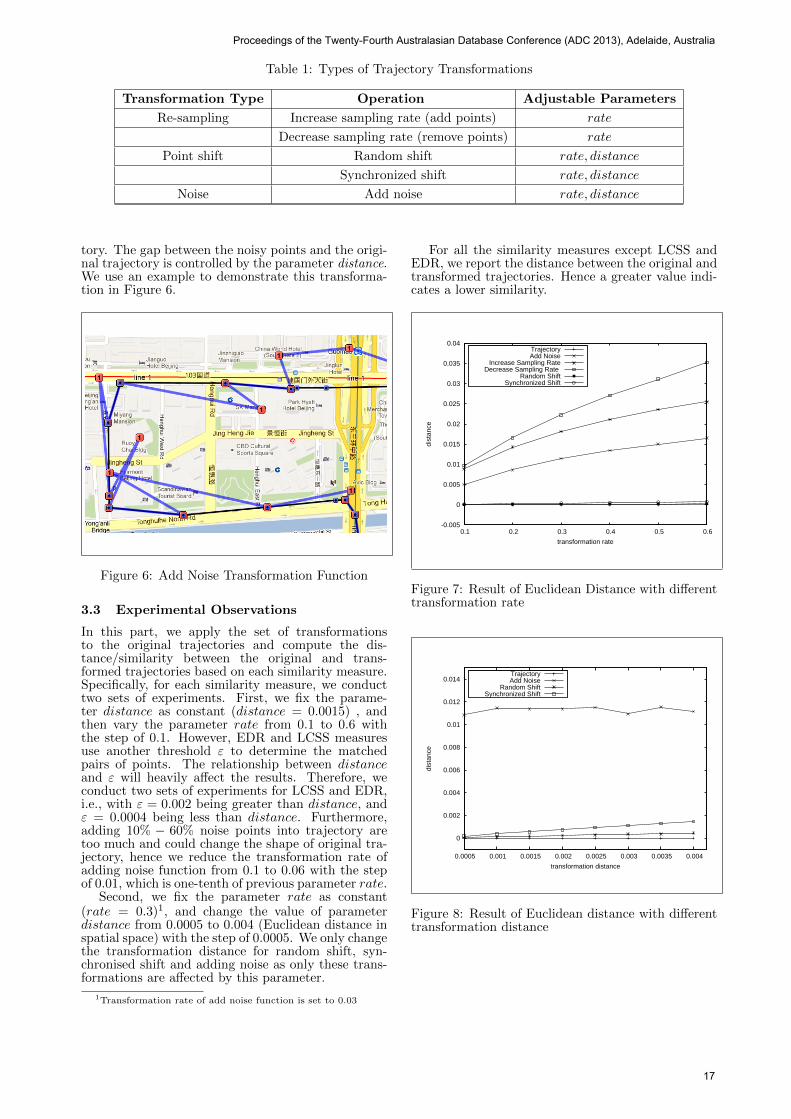
Table 1: Types of Trajectory Transformations
Transformation Type Operation Adjustable Parameters
Re-sampling Increase sampling rate (add points) rate
Decrease sampling rate (remove points) rate
Point shift Random shift rate, distance
Synchronized shift rate, distance
Noise Add noise rate, distance
tory. The gap between the noisy points and the origi-nal trajectory is controlled by the parameter distance.We use an example to demonstrate this transforma-tion in Figure 6.
Figure 6: Add Noise Transformation Function
3.3 Experimental Observations
In this part, we apply the set of transformationsto the original trajectories and compute the dis-tance/similarity between the original and trans-formed trajectories based on each similarity measure.Specifically, for each similarity measure, we conducttwo sets of experiments. First, we fix the parame-ter distance as constant (distance = 0.0015) , andthen vary the parameter rate from 0.1 to 0.6 withthe step of 0.1. However, EDR and LCSS measuresuse another threshold ε to determine the matchedpairs of points. The relationship between distanceand ε will heavily affect the results. Therefore, weconduct two sets of experiments for LCSS and EDR,i.e., with ε = 0.002 being greater than distance, andε = 0.0004 being less than distance. Furthermore,adding 10% − 60% noise points into trajectory aretoo much and could change the shape of original tra-jectory, hence we reduce the transformation rate ofadding noise function from 0.1 to 0.06 with the stepof 0.01, which is one-tenth of previous parameter rate.
Second, we fix the parameter rate as constant(rate = 0.3)1, and change the value of parameterdistance from 0.0005 to 0.004 (Euclidean distance inspatial space) with the step of 0.0005. We only changethe transformation distance for random shift, syn-chronised shift and adding noise as only these trans-formations are affected by this parameter.
1Transformation rate of add noise function is set to 0.03
For all the similarity measures except LCSS andEDR, we report the distance between the original andtransformed trajectories. Hence a greater value indi-cates a lower similarity.
-0.005
0
0.005
0.01
0.015
0.02
0.025
0.03
0.035
0.04
0.1 0.2 0.3 0.4 0.5 0.6
dist
ance
transformation rate
TrajectoryAdd Noise
Increase Sampling RateDecrease Sampling Rate
Random ShiftSynchronized Shift
Figure 7: Result of Euclidean Distance with differenttransformation rate
0
0.002
0.004
0.006
0.008
0.01
0.012
0.014
0.0005 0.001 0.0015 0.002 0.0025 0.003 0.0035 0.004
dist
ance
transformation distance
TrajectoryAdd Noise
Random ShiftSynchronized Shift
Figure 8: Result of Euclidean distance with differenttransformation distance
Proceedings of the Twenty-Fourth Australasian Database Conference (ADC 2013), Adelaide, Australia
17
Euclidean Distance Measure. The result ofEuclidean distance with varying rate is shown in Fig-ure 71 . We can see that, the distance betweenthe original and transformed trajectories with re-sampling and noise increases quickly as the transfor-mation rate rises. This implies that the Euclideandistance is sensitive to sampling rate or noise. Onthe other hand, shifting sampling points within cer-tain range has little influence on the distance.
Next, we illustrate the result of Euclidean distancewith different transformation distance in Figure 8.As expected, the distance between the original andtransformed trajectories with point shift gradually in-creases as the transformation distance increases. Butadding noises will make the transformed trajectorycompletely dissimilar with the original one, whichagain indicates that Euclidean distance is sensitiveto outliers.
0
0.02
0.04
0.06
0.08
0.1
0.12
0.14
0.16
0.18
0.1 0.2 0.3 0.4 0.5 0.6
dist
ance
transformation rate
TrajectoryAdd Noise
Increase Sampling RateDecrease Sampling Rate
Random ShiftSynchronized Shift
Figure 9: Result of DTW with different transforma-tion rate
0
0.05
0.1
0.15
0.2
0.0005 0.001 0.0015 0.002 0.0025 0.003 0.0035 0.004
dist
ance
transformation distance
TrajectoryAdd Noise
Random ShiftSynchronized Shift
Figure 10: Result of DTW with different transforma-tion distance
Dynamic Time Warping based Measures.The performance of DTW with changing rate is
1Transformation rate of add noise function is one-tenth of x-axis’s value, the follow figures use same setting for transformationrate of add noise. The y-axis distance value is defined by definitionof trajectory similarity measures
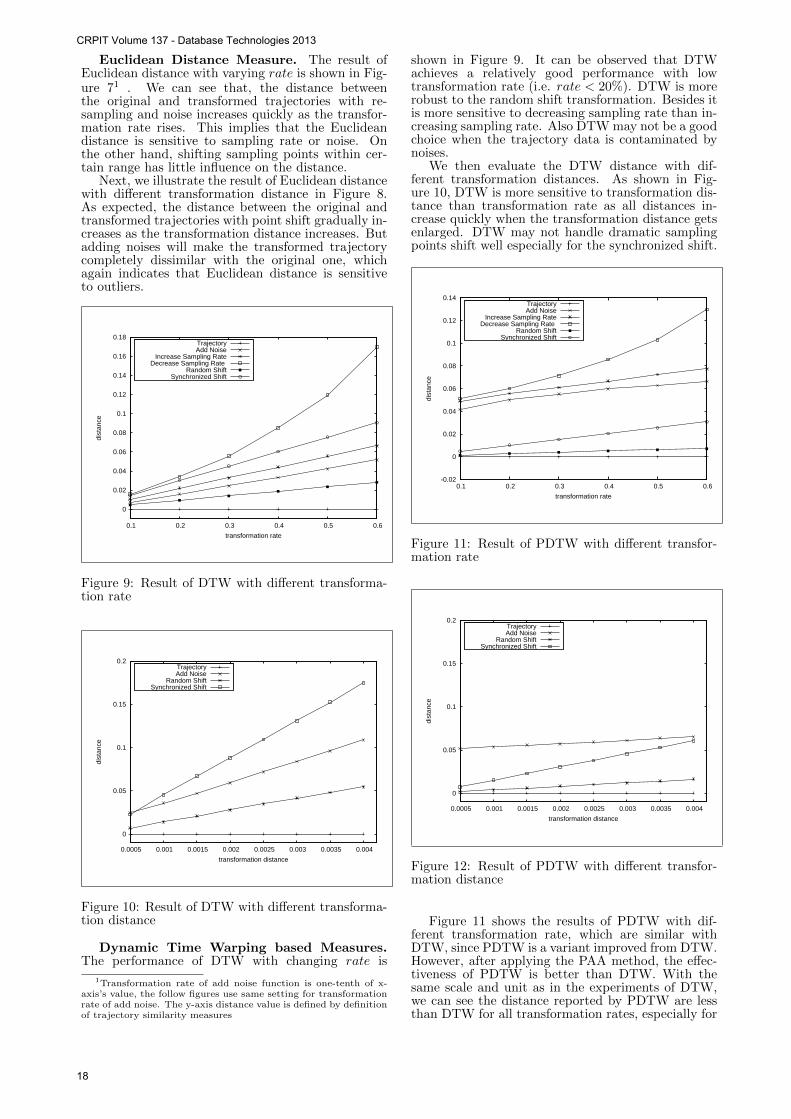
shown in Figure 9. It can be observed that DTWachieves a relatively good performance with lowtransformation rate (i.e. rate < 20%). DTW is morerobust to the random shift transformation. Besides itis more sensitive to decreasing sampling rate than in-creasing sampling rate. Also DTW may not be a goodchoice when the trajectory data is contaminated bynoises.
We then evaluate the DTW distance with dif-ferent transformation distances. As shown in Fig-ure 10, DTW is more sensitive to transformation dis-tance than transformation rate as all distances in-crease quickly when the transformation distance getsenlarged. DTW may not handle dramatic samplingpoints shift well especially for the synchronized shift.
-0.02
0
0.02
0.04
0.06
0.08
0.1
0.12
0.14
0.1 0.2 0.3 0.4 0.5 0.6
dist
ance
transformation rate
TrajectoryAdd Noise
Increase Sampling RateDecrease Sampling Rate
Random ShiftSynchronized Shift
Figure 11: Result of PDTW with different transfor-mation rate
0
0.05
0.1
0.15
0.2
0.0005 0.001 0.0015 0.002 0.0025 0.003 0.0035 0.004
dist
ance
transformation distance
TrajectoryAdd Noise
Random ShiftSynchronized Shift
Figure 12: Result of PDTW with different transfor-mation distance
Figure 11 shows the results of PDTW with dif-ferent transformation rate, which are similar withDTW, since PDTW is a variant improved from DTW.However, after applying the PAA method, the effec-tiveness of PDTW is better than DTW. With thesame scale and unit as in the experiments of DTW,we can see the distance reported by PDTW are lessthan DTW for all transformation rates, especially for
CRPIT Volume 137 - Database Technologies 2013
18
increasing sampling rate, adding noise and synchro-nized shifting function.
The performance of PDTW with different trans-formation distance is shown in Figure 12. UnlikeDTW, PDTW is not sensitive to length of distance oftransformation. As a result, PDTW may work well inmeasuring the similarity for trajectories with a largenumber of inaccurate points (i.e, point with large de-viation from its true location).
80
100
120
140
160
180
200
0.1 0.2 0.3 0.4 0.5 0.6
dist
ance
transformation rate
TrajectoryAdd Noise
Increase Sampling RateDecrease Sampling Rate
Random ShiftSynchronized Shift
Figure 13: Result of EDR with different transforma-tion rate and ε less than distance of transformation
0
50
100
150
200
0.1 0.2 0.3 0.4 0.5 0.6
dist
ance
transformation rate
TrajectoryAdd Noise
Increase Sampling RateDecrease Sampling Rate
Random ShiftSynchronized Shift
Figure 14: Result of EDR with different transforma-tion rate and ε larger than distance of transformation
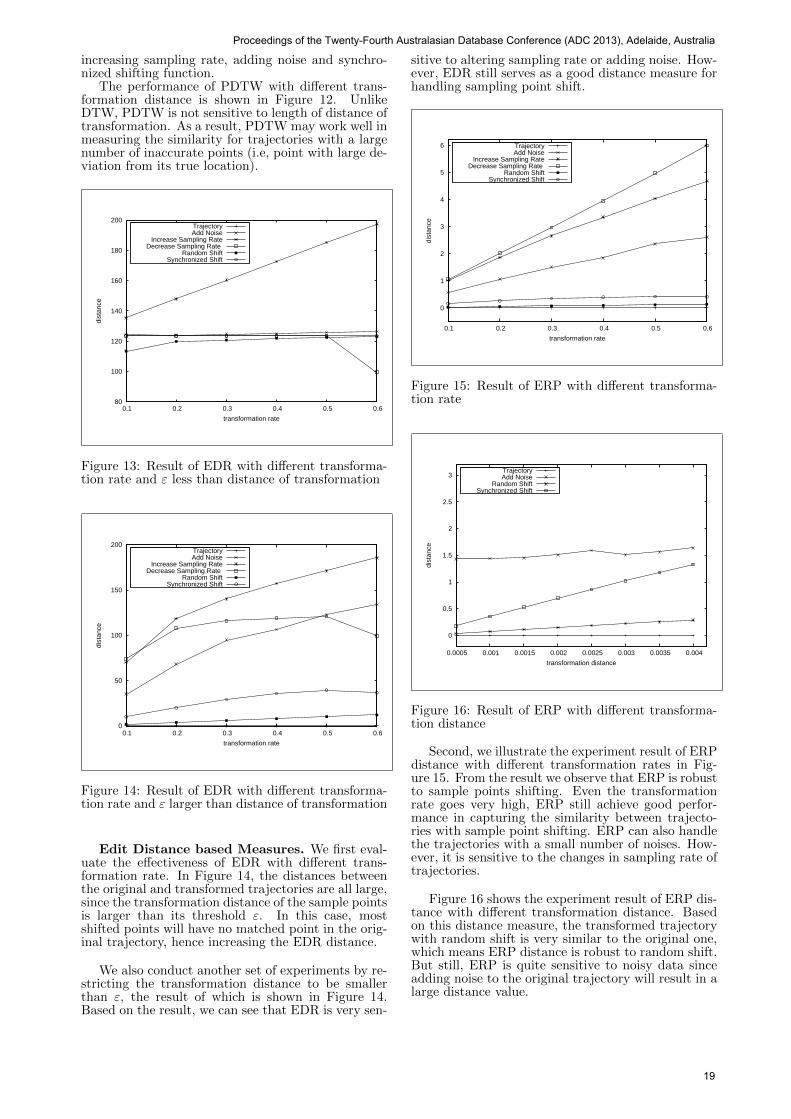
Edit Distance based Measures. We first eval-uate the effectiveness of EDR with different trans-formation rate. In Figure 14, the distances betweenthe original and transformed trajectories are all large,since the transformation distance of the sample pointsis larger than its threshold ε. In this case, mostshifted points will have no matched point in the orig-inal trajectory, hence increasing the EDR distance.
We also conduct another set of experiments by re-stricting the transformation distance to be smallerthan ε, the result of which is shown in Figure 14.Based on the result, we can see that EDR is very sen-
sitive to altering sampling rate or adding noise. How-ever, EDR still serves as a good distance measure forhandling sampling point shift.
0
1
2
3
4
5
6
0.1 0.2 0.3 0.4 0.5 0.6
dist
ance
transformation rate
TrajectoryAdd Noise
Increase Sampling RateDecrease Sampling Rate
Random ShiftSynchronized Shift
Figure 15: Result of ERP with different transforma-tion rate
0
0.5
1
1.5
2
2.5
3
0.0005 0.001 0.0015 0.002 0.0025 0.003 0.0035 0.004
dist
ance
transformation distance
TrajectoryAdd Noise
Random ShiftSynchronized Shift
Figure 16: Result of ERP with different transforma-tion distance
Second, we illustrate the experiment result of ERPdistance with different transformation rates in Fig-ure 15. From the result we observe that ERP is robustto sample points shifting. Even the transformationrate goes very high, ERP still achieve good perfor-mance in capturing the similarity between trajecto-ries with sample point shifting. ERP can also handlethe trajectories with a small number of noises. How-ever, it is sensitive to the changes in sampling rate oftrajectories.
Figure 16 shows the experiment result of ERP dis-tance with different transformation distance. Basedon this distance measure, the transformed trajectorywith random shift is very similar to the original one,which means ERP distance is robust to random shift.But still, ERP is quite sensitive to noisy data sinceadding noise to the original trajectory will result in alarge distance value.
Proceedings of the Twenty-Fourth Australasian Database Conference (ADC 2013), Adelaide, Australia
19
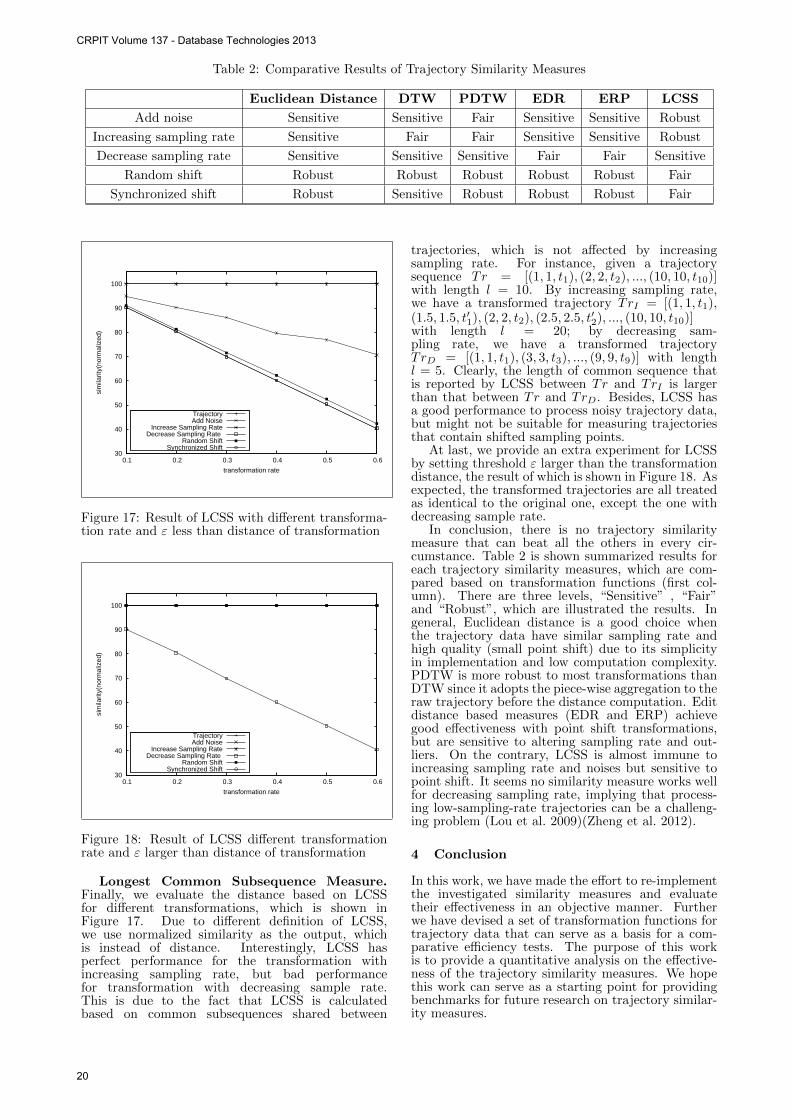
Table 2: Comparative Results of Trajectory Similarity Measures
Euclidean Distance DTW PDTW EDR ERP LCSS
Add noise Sensitive Sensitive Fair Sensitive Sensitive Robust
Increasing sampling rate Sensitive Fair Fair Sensitive Sensitive Robust
Decrease sampling rate Sensitive Sensitive Sensitive Fair Fair Sensitive
Random shift Robust Robust Robust Robust Robust Fair
Synchronized shift Robust Sensitive Robust Robust Robust Fair
30
40
50
60
70
80
90
100
0.1 0.2 0.3 0.4 0.5 0.6
sim
ilarit
y(no
rmal
ized
)
transformation rate
TrajectoryAdd Noise
Increase Sampling RateDecrease Sampling Rate
Random ShiftSynchronized Shift
Figure 17: Result of LCSS with different transforma-tion rate and ε less than distance of transformation
30
40
50
60
70
80
90
100
0.1 0.2 0.3 0.4 0.5 0.6
sim
ilarit
y(no
rmal
ized
)
transformation rate
TrajectoryAdd Noise
Increase Sampling RateDecrease Sampling Rate
Random ShiftSynchronized Shift
Figure 18: Result of LCSS different transformationrate and ε larger than distance of transformation
Longest Common Subsequence Measure.Finally, we evaluate the distance based on LCSSfor different transformations, which is shown inFigure 17. Due to different definition of LCSS,we use normalized similarity as the output, whichis instead of distance. Interestingly, LCSS hasperfect performance for the transformation withincreasing sampling rate, but bad performancefor transformation with decreasing sample rate.This is due to the fact that LCSS is calculatedbased on common subsequences shared between
trajectories, which is not affected by increasingsampling rate. For instance, given a trajectorysequence Tr = [(1, 1, t1), (2, 2, t2), ..., (10, 10, t10)]with length l = 10. By increasing sampling rate,we have a transformed trajectory TrI = [(1, 1, t1),(1.5, 1.5, t′1), (2, 2, t2), (2.5, 2.5, t′2), ..., (10, 10, t10)]with length l = 20; by decreasing sam-pling rate, we have a transformed trajectoryTrD = [(1, 1, t1), (3, 3, t3), ..., (9, 9, t9)] with lengthl = 5. Clearly, the length of common sequence thatis reported by LCSS between Tr and TrI is largerthan that between Tr and TrD. Besides, LCSS hasa good performance to process noisy trajectory data,but might not be suitable for measuring trajectoriesthat contain shifted sampling points.
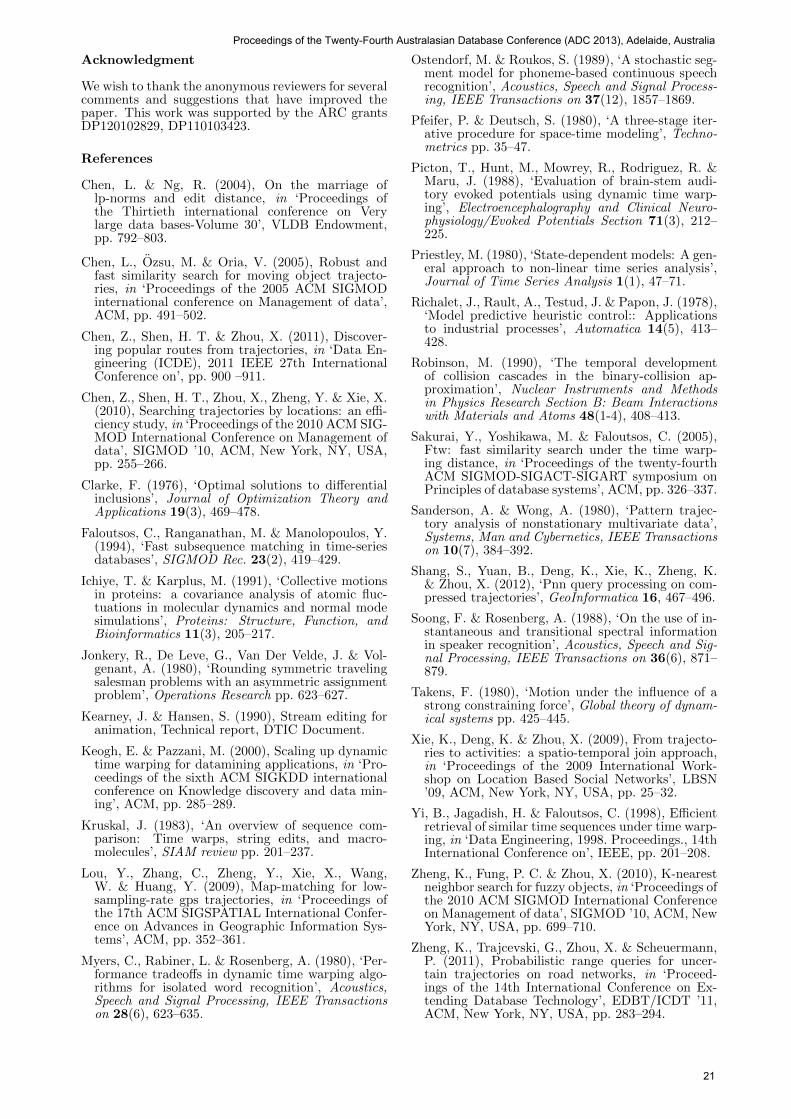
At last, we provide an extra experiment for LCSSby setting threshold ε larger than the transformationdistance, the result of which is shown in Figure 18. Asexpected, the transformed trajectories are all treatedas identical to the original one, except the one withdecreasing sample rate.
In conclusion, there is no trajectory similaritymeasure that can beat all the others in every cir-cumstance. Table 2 is shown summarized results foreach trajectory similarity measures, which are com-pared based on transformation functions (first col-umn). There are three levels, “Sensitive” , “Fair”and “Robust”, which are illustrated the results. Ingeneral, Euclidean distance is a good choice whenthe trajectory data have similar sampling rate andhigh quality (small point shift) due to its simplicityin implementation and low computation complexity.PDTW is more robust to most transformations thanDTW since it adopts the piece-wise aggregation to theraw trajectory before the distance computation. Editdistance based measures (EDR and ERP) achievegood effectiveness with point shift transformations,but are sensitive to altering sampling rate and out-liers. On the contrary, LCSS is almost immune toincreasing sampling rate and noises but sensitive topoint shift. It seems no similarity measure works wellfor decreasing sampling rate, implying that process-ing low-sampling-rate trajectories can be a challeng-ing problem (Lou et al. 2009)(Zheng et al. 2012).
4 Conclusion
In this work, we have made the effort to re-implementthe investigated similarity measures and evaluatetheir effectiveness in an objective manner. Furtherwe have devised a set of transformation functions fortrajectory data that can serve as a basis for a com-parative efficiency tests. The purpose of this workis to provide a quantitative analysis on the effective-ness of the trajectory similarity measures. We hopethis work can serve as a starting point for providingbenchmarks for future research on trajectory similar-ity measures.
CRPIT Volume 137 - Database Technologies 2013
20
Acknowledgment
We wish to thank the anonymous reviewers for severalcomments and suggestions that have improved thepaper. This work was supported by the ARC grantsDP120102829, DP110103423.
References
Chen, L. & Ng, R. (2004), On the marriage oflp-norms and edit distance, in ‘Proceedings ofthe Thirtieth international conference on Verylarge data bases-Volume 30’, VLDB Endowment,pp. 792–803.
Chen, L., Ozsu, M. & Oria, V. (2005), Robust andfast similarity search for moving object trajecto-ries, in ‘Proceedings of the 2005 ACM SIGMODinternational conference on Management of data’,ACM, pp. 491–502.
Chen, Z., Shen, H. T. & Zhou, X. (2011), Discover-ing popular routes from trajectories, in ‘Data En-gineering (ICDE), 2011 IEEE 27th InternationalConference on’, pp. 900 –911.
Chen, Z., Shen, H. T., Zhou, X., Zheng, Y. & Xie, X.(2010), Searching trajectories by locations: an effi-ciency study, in ‘Proceedings of the 2010 ACM SIG-MOD International Conference on Management ofdata’, SIGMOD ’10, ACM, New York, NY, USA,pp. 255–266.
Clarke, F. (1976), ‘Optimal solutions to differentialinclusions’, Journal of Optimization Theory andApplications 19(3), 469–478.
Faloutsos, C., Ranganathan, M. & Manolopoulos, Y.(1994), ‘Fast subsequence matching in time-seriesdatabases’, SIGMOD Rec. 23(2), 419–429.
Ichiye, T. & Karplus, M. (1991), ‘Collective motionsin proteins: a covariance analysis of atomic fluc-tuations in molecular dynamics and normal modesimulations’, Proteins: Structure, Function, andBioinformatics 11(3), 205–217.
Jonkery, R., De Leve, G., Van Der Velde, J. & Vol-genant, A. (1980), ‘Rounding symmetric travelingsalesman problems with an asymmetric assignmentproblem’, Operations Research pp. 623–627.
Kearney, J. & Hansen, S. (1990), Stream editing foranimation, Technical report, DTIC Document.
Keogh, E. & Pazzani, M. (2000), Scaling up dynamictime warping for datamining applications, in ‘Pro-ceedings of the sixth ACM SIGKDD internationalconference on Knowledge discovery and data min-ing’, ACM, pp. 285–289.
Kruskal, J. (1983), ‘An overview of sequence com-parison: Time warps, string edits, and macro-molecules’, SIAM review pp. 201–237.
Lou, Y., Zhang, C., Zheng, Y., Xie, X., Wang,W. & Huang, Y. (2009), Map-matching for low-sampling-rate gps trajectories, in ‘Proceedings ofthe 17th ACM SIGSPATIAL International Confer-ence on Advances in Geographic Information Sys-tems’, ACM, pp. 352–361.
Myers, C., Rabiner, L. & Rosenberg, A. (1980), ‘Per-formance tradeoffs in dynamic time warping algo-rithms for isolated word recognition’, Acoustics,Speech and Signal Processing, IEEE Transactionson 28(6), 623–635.
Ostendorf, M. & Roukos, S. (1989), ‘A stochastic seg-ment model for phoneme-based continuous speechrecognition’, Acoustics, Speech and Signal Process-ing, IEEE Transactions on 37(12), 1857–1869.
Pfeifer, P. & Deutsch, S. (1980), ‘A three-stage iter-ative procedure for space-time modeling’, Techno-metrics pp. 35–47.
Picton, T., Hunt, M., Mowrey, R., Rodriguez, R. &Maru, J. (1988), ‘Evaluation of brain-stem audi-tory evoked potentials using dynamic time warp-ing’, Electroencephalography and Clinical Neuro-physiology/Evoked Potentials Section 71(3), 212–225.
Priestley, M. (1980), ‘State-dependent models: A gen-eral approach to non-linear time series analysis’,Journal of Time Series Analysis 1(1), 47–71.
Richalet, J., Rault, A., Testud, J. & Papon, J. (1978),‘Model predictive heuristic control:: Applicationsto industrial processes’, Automatica 14(5), 413–428.
Robinson, M. (1990), ‘The temporal developmentof collision cascades in the binary-collision ap-proximation’, Nuclear Instruments and Methodsin Physics Research Section B: Beam Interactionswith Materials and Atoms 48(1-4), 408–413.
Sakurai, Y., Yoshikawa, M. & Faloutsos, C. (2005),Ftw: fast similarity search under the time warp-ing distance, in ‘Proceedings of the twenty-fourthACM SIGMOD-SIGACT-SIGART symposium onPrinciples of database systems’, ACM, pp. 326–337.
Sanderson, A. & Wong, A. (1980), ‘Pattern trajec-tory analysis of nonstationary multivariate data’,Systems, Man and Cybernetics, IEEE Transactionson 10(7), 384–392.
Shang, S., Yuan, B., Deng, K., Xie, K., Zheng, K.& Zhou, X. (2012), ‘Pnn query processing on com-pressed trajectories’, GeoInformatica 16, 467–496.
Soong, F. & Rosenberg, A. (1988), ‘On the use of in-stantaneous and transitional spectral informationin speaker recognition’, Acoustics, Speech and Sig-nal Processing, IEEE Transactions on 36(6), 871–879.
Takens, F. (1980), ‘Motion under the influence of astrong constraining force’, Global theory of dynam-ical systems pp. 425–445.
Xie, K., Deng, K. & Zhou, X. (2009), From trajecto-ries to activities: a spatio-temporal join approach,in ‘Proceedings of the 2009 International Work-shop on Location Based Social Networks’, LBSN’09, ACM, New York, NY, USA, pp. 25–32.
Yi, B., Jagadish, H. & Faloutsos, C. (1998), Efficientretrieval of similar time sequences under time warp-ing, in ‘Data Engineering, 1998. Proceedings., 14thInternational Conference on’, IEEE, pp. 201–208.
Zheng, K., Fung, P. C. & Zhou, X. (2010), K-nearestneighbor search for fuzzy objects, in ‘Proceedings ofthe 2010 ACM SIGMOD International Conferenceon Management of data’, SIGMOD ’10, ACM, NewYork, NY, USA, pp. 699–710.
Zheng, K., Trajcevski, G., Zhou, X. & Scheuermann,P. (2011), Probabilistic range queries for uncer-tain trajectories on road networks, in ‘Proceed-ings of the 14th International Conference on Ex-tending Database Technology’, EDBT/ICDT ’11,ACM, New York, NY, USA, pp. 283–294.
Proceedings of the Twenty-Fourth Australasian Database Conference (ADC 2013), Adelaide, Australia
21
Zheng, K., Zheng, Y., Xie, X. & Zhou, X. (2012),Reducing uncertainty of low-sampling-rate trajec-tories, in ‘Data Engineering (ICDE), 2012 IEEE28th International Conference on’, pp. 1144 –1155.
Zheng, K., Zhou, X., Fung, P. & Xie, K. (n.d.), ‘Spa-tial query processing for fuzzy objects’, The VLDBJournal pp. 1–23. 10.1007/s00778-012-0266-x.
Zheng, Y., Zhang, L., Xie, X. & Ma, W. (2009),Mining interesting locations and travel sequencesfrom gps trajectories, in ‘Proceedings of the 18thinternational conference on World wide web’, ACM,pp. 791–800.
CRPIT Volume 137 - Database Technologies 2013
22