Embed Size (px)
Citation preview

NASA TECHNICAL NOTE NASA TN D-7945
AN AUTOMATIC DATA SYSTEMFOR VIBRATION MODAL TUNINGAND EVALUATION
Robert A. Salyer, Ed J. Jung, Jr., Stacy L. Huggins,
and Barry L. Stephens
Lyndon B. Johnson Space Center
Houston, Texas 77058
NATIONAL AERONAUTICS AND SPACE ADMINISTRATION • WASHINGTON, D. C. • APRIL 1975
https://ntrs.nasa.gov/search.jsp?R=19750013271 2018-07-15T03:08:16+00:00Z

1. Report No. 2. Government Accession No.
NASA TN D-79454. Title and Subtitle
AN AUTOMATIC DATA SYSTEM FORVIBRATION MODAL TUNING AND EVALUATION
7. Author(s) Robert A. Salyer, TRW Systems Group;Ed J. Jung, Jr. , JSC; and Stacy L. Huggins andBarry L. Stephens, Northrop Services, Inc.
9. Performing Organization Name and AddressLyndon B. Johnson Space CenterHouston, Texas 77058
12. Sponsoring Agency Name and AddressNational Aeronautics and Space AdministrationWashington, D.C. 20546
3. Recipient's Catalog No.
5. Report DateApril 1975
6. Performing Organization Code
JSC-092498. Performing Organization Report No.
JSC S-43510. Work Unit No.
961-21-31-05-721 1 . Contract or Grant No.
13. Type of Report and Period Covered
Technical Note14. Sponsoring Agency Code
15. Supplementary Notes
16. AbstractA digitally based automatic modal tuning and analysis system developed to provide an operationalcapability beginning at 0. 1 hertz is described. The elements of the system, which providesunique control features, maximum operator visibility, and rapid data reduction and documenta-tion, are briefly described; and the operational flow is discussed to illustrate the full range ofcapabilities and the flexibility of application. The successful application of the system to amodal survey of the Skylab payload is described Information about the Skylab test article,coincident-quadrature analysis of modal response data, orthogonality, and damping calcula-tions is included in the appendixes. Recommendations for future application of the system arealso made.
17. Key Words (Suggested by Author(s))' Structural Vibration ' Orthogonality' Forced Vibration ' Fourier Analysis' Digital Servomechanisms ' Shakers'Harmonic Excitation' Strain Gage Accelerometers
18. Distribution Statement
STAR Subject Category: 18 (SpacecraftDesign, Testing and Performance)
19. Security dassif. (of this report) 20. Security Classif. (of this page)
Unclassified Unclassified21, No. of Pages 22. Price"
44 $3.75
* For sale by the National Technical I nf ormation Service, Springfield. Virginia 22151
CONTENTS
Section Page
SUMMARY 1
INTRODUCTION . . . . . ' 1
SYSTEM DESCRIPTION '. . .' 2
General Features- 3
Computer 3
Software Support Package 6
Excitation Control Subsystem 9
Excitation Subsystem . 10
Data Acquisition Subsystem 11
Monitoring Subsystem 11
Ancillary Support Systems 12
SYSTEM APPLICATION . 13
Supervisor Option 14
Print Option 17
Plot Option 20
Orthogonality Option 21
TEST TECHNIQUES 21
Modal Tuning and Data Acquisition 21
Co-Quad Plots 24
Modal Plots 24
Decay Curves 25
Off-Line Co-Quad Analysis 25
RECOMMENDATIONS FOR FUTURE APPLICATIONS 25
ill

Section Page
Test Article Suspension System - 25
Technical Writer's Log Input 26
Modal Survey Simulator 26
Test Procedure Display 26
CONCLUDING REMARKS 26
APPENDIX A — SKYLAB TEST ARTICLE 27
APPENDIX B — CO-QUAD ANALYSIS OF MODAL RESPONSE DATA . . . . 31
APPENDIX C —ORTHOGONALITY 34
APPENDIX D — DAMPING CALCULATIONS . 37
REFERENCE 38
BIBLIOGRAPHY 38
IV

TABLES
Table Page
I DATA STORAGE AND PRESENTATION MATRIX 4
B-I PHASE RELATIONSHIP FOR BASIC STRUCTURALCONDITIONS 32
FIGURES
Figure Page
1 Conceptual layout of AMTAS 3
2 Excitation control subsystem 5
3 System director peripherals . 5
4 Organization of software support package 6
5 Process control, sweep mode 7
6 Process control, dwell mode 7
7 The AMTAS control console 8
8 Overview of AMTAS looking toward the shaker amplifierconsole 8
9 Overview of AMTAS .looking toward the narrow-band filters ... 8
10 Modal documentation 9
11 Data acquisition subsystem 11
12 System controller CRT display 13
13 Application software logic . 14
14 The AMTAS initialization procedure CRT display 14
15 Patch correspondence table CRT display 14
16 Operation selection table CRT display 14
17 Portion of wide-band sweep co-quad plot 15

Figure Page
18 Off-line co-quad reduction: typical plots of coincident andquadrature components of total acceleration. Top: coincidentcomponent (normalized to reference force); bottom: quadrature
19
20
21
22
23
24
25
A-l
A- 2
A- 3
A- 4
B-l
B-2
B-3
D-l
component (normalized to reference force)
Modal tuning (SUPTM) format CRT display
The CRT display of modal tuning options
Portion of sequence log
Typical modal data summary
(a) Housekeeping data(b) Accelerometer response data(c) Generalized response data . . . . . . . . . . .
Typical stick plot
Effect of varying plot parameters
Sky lab orbital configuration modal decay curve
Skylab pay load in orbital configuration
Suspension of payload assembly launch configuration modalsurvey
Suspension of payload assembly orbital configuration modalsurvey . . .
Exciter arrangement for orbital configuration modal survey . . . .
Co-quad component definition .
Narrow-band co-quad spectrum
Antialiasing of input data
Modal decay curve
16
16
16
17
1819
.20
21
.21
24
27
29
29
30
31
32
33
37
VI

AN AUTOMATIC DATA SYSTEM FOR
VIBRATION MODAL TUNING AND EVALUATION
By Robert A. Salyer,* Ed J. Jung, Jr.,
Stacy L. Muggins/ and Barry L. Stephenst
Lyndon B. Johnson Space Center
SUMMARY
A state-of-the-art data system was developed to achieve the objectives of thevibration modal survey phase of the Sky lab vibroacoustic test program. Thelow-frequency requirements dictated a digital-based system capable of operationfrom 0.1 to 100 hertz.
An automatic modal tuning and analysis system was conceived and developedto meet the stringent test requirements and to achieve the objectives of the modalsurvey. The system uses digital techniques to provide positive control of testconditions, a high degree of specimen safety, rapid data acquisition and reduction,and immediate documentation of modal response characteristics. Man-computerinteractive control allows ample operational flexibility.
The system was sucessfully used to perform a modal survey of the Skylabpayload in the launch and orbital configurations. The system incorporates analyti-cal and experimental procedures to fully close the circle of modal surveyimplementation: pretest analysis, test implementation, and posttest loads analysis.Data derived during pretest analysis are an integral part of the data base availableto complement and assess the data obtained experimentally during systemapplication. The system output consists of a complete data package that may beimmediately used for loads analysis without further reduction or manipulation. Thistechnique provided the foundation for the automatic modal tuning and analysissystem design criteria and contributed significantly to the success and wide accept-ance of the system.
INTRODUCTION
The NASA Lyndon B. Johnson Space Center (JSC) Vibration and AcousticTest Facility (VATF) was built in 1964 and was equipped for performing a widerange of structural dynamic testing. Since the inception of the VATF, test operations
*TRW Systems Group, Redondo Beach, California.Northrop Services, Inc., Houston, Texas.

have involved both acoustic and mechanical excitation of complex elastic structuresinherent in manned spacecraft. In the intervening years, the facility test capa-bilities have been constantly refined to meet the diverse requirements of numerousApollo spacecraft test programs. In turn, the subsequent Skylab vibroacoustictest program, recently completed at VATF, stimulated development of a high-performance system for performing vibration modal surveys.
The computer-based automatic modal tuning and analysis system (AMTAS)is a major advance in the state of the art of such systems available within NASA.The AMTAS uses a greater complexity of digital techniques to perform excitationforce control and data acquisition, processing, and display than was previouslyavailable. These digital techniques eliminate the low-frequency processing limitsof analog instruments and provide substantial improvements in the quality of theresulting data. The system includes a large number of automated functions toexpedite test operations, to provide maximum test article safety during test opera-tions , and to eliminate excessive test article exposure and program delays byproviding rapid data acquisition and reduction capabilities.
The AMTAS -has been used on two Skylab modal surveys involving the largestand most complex spacecraft built by NASA. Data were obtained from the surveysof two configurations of the Skylab orbiting laboratory, which consists of anassembly of six modules. The Skylab test article is discussed in appendix A.These configurations, both approximately 21 meters (70 feet) high, 'embodied com-plex, unsymmetrical structural arrangements that weigh approximately54 430 kilograms (120 000 pounds). These modal surveys, which required docu-menting all modes in the range of 1 to 45 hertz, were performed despite severelimitations due to schedule time, number of shaker excitation points, and responsemeasurements available. The complexity of the Skylab structure and the urgencyof the survey results warranted development of the AMTAS , which is nearly ascomplex as the Skylab structure. Through these Skylab surveys, AMTAS conceptsand capabilities were verified, and a highly mature modal survey system consistingof sophisticated test equipment and software resulted. The purpose of this paperis to present a general overview of the hardware and software components of theAMTAS. A functional description of the system capabilities also is given.
As an aid to the reader, where necessary the original units of measure havebeen converted to the equivalent value in the Systeme International d'Unite"s (SI).The SI units are written first, and the original units are written parentheticallythereafter.
SYSTEM DESCRIPTION
The system description includes AMTAS general features, the computer,support subsystems, the excitation and excitation control subsystems, the dataacquisition subsystem, and the monitoring subsystem.
General Features
Digital techniques are used to provide a low-frequency operating bound ofvirtually zero hertz without compromise of capability. Positive excitation controlis achieved through force feedback digital control of the forcing function. Thenarrow-band filtering and coincident-quadrature (co-quad) capabilities areextended to essentially zero hertz through software for digital filtering and datareduction.
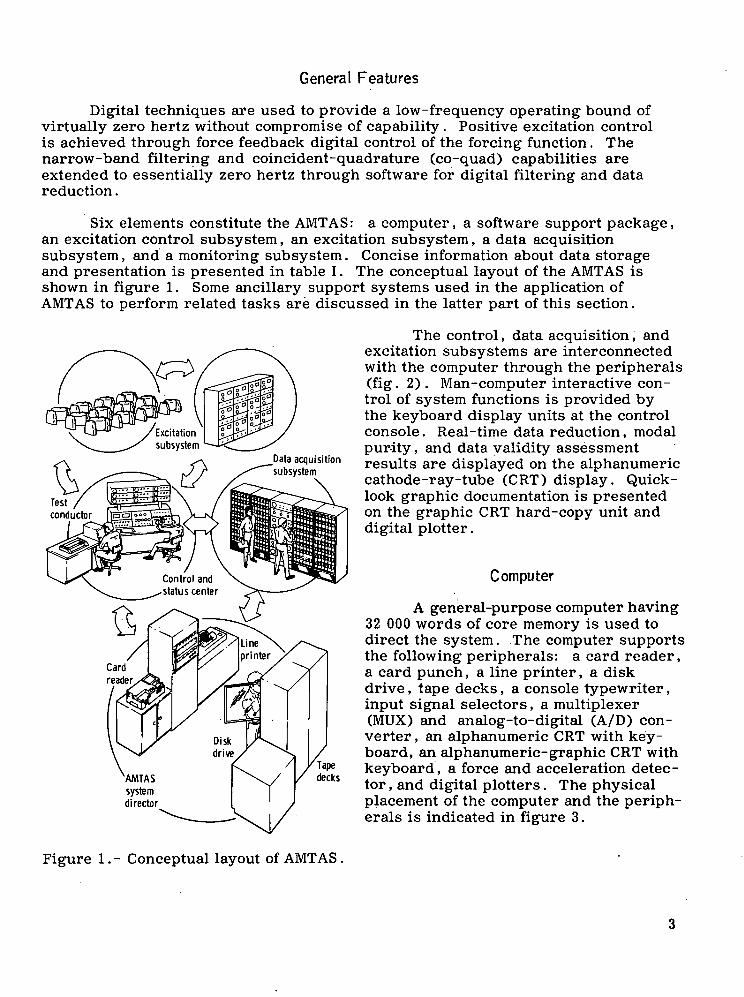
Six elements constitute the AMTAS: a computer, a software support package,an excitation control subsystem, an excitation subsystem, a data acquisitionsubsystem, and a monitoring subsystem. Concise information about data storageand presentation is presented in table I. The conceptual layout of the AMTAS isshown in figure 1. Some ancillary support systems used in the application ofAMTAS to perform related tasks are discussed in the latter part of this section.
The control, data acquisition, andexcitation subsystems are interconnectedwith the computer through the peripherals(fig. 2). Man-computer interactive con-trol of system functions is provided bythe keyboard display units at the controlconsole. Real-time data reduction, modalpurity, and data validity assessmentresults are displayed on the alphanumericcathode-ray-tube (CRT) display. Quick-look graphic documentation is presentedon the graphic CRT hard-copy unit anddigital plotter.
Computer
A general-purpose computer having32 000 words of core memory is used todirect the system. The computer supportsthe following peripherals: a card reader,a card punch, a line printer, a diskdrive, tape decks, a console typewriter,input signal selectors, a multiplexer(MUX) and analog-to-digital (A/D) con-verter , an alphanumeric CRT with key-board, an alphanumeric-graphic CRT withkeyboard, a force and acceleration detec-tor , and digital plotters. The physicalplacement of the computer and the periph-erals is indicated in figure 3.
Figure 1. - Conceptual layout of AMTAS .

xSH
Zo
H
osa.Q
<uaDSoHCO
<H<Q
303
^Q
COe Qf3 a*1 0 oc co •£<U 5 ra1 ™(4 5o E
CO
D.
-•35) cj
'Si*3
s|CO
•oCOo
.caCO
ho
oCOo
5 I
"E ° 3•oa>
C ^.2 0) a>to .5 CI JiCOQ)
(X
111
2 S 2O CJ co
.C
u
1
5 <->a,
Opera
tion
en
oo
t-
CO
in -
Z Z Z Z Z CM
< < < <: <o <z -z z z -H z
CD
C* C- C—
CD CO CO
in " ^ in ^ in
CM" Z Z CM" Z CM"
< < < < < <
Z Z Z Z Z Z
< < < < <z .z z z -< • z
s
<n Z "Z. ** "Z. "Z.
o
CD CO CO
m *^ *£ m *^ u^ca "Z, Z <M ^ OJ
*X "Z, K 'Z, "& *Z.
o o o o o o
O O) CTJ O) G) O)
CJ C l C^J CM C«J CM
M M S S Q Sco H H co S Qa. Q. a. o. a, a,D 3 a 3 3 3CO CO CO CO CO CO
< < < < <
Z Z Z Z Z
to <| < < <
^c Z Z Z Z
z z z z z
< < < < CM
Z Z Z Z in
< < < < <z z z z z
< < < <Z Z Z T Z
en
oo
I—
CO
CM in
CM" — oi Z Z
Z Z Z ^r Z
o < < <
en" « Z Z Z
" 2 C^ £ c « 'L) t"1 & •*-• cCO OS t 5 3< O Q. OH O.
CO•o ,
•3."O '
a -3. wI QJ
in t-- >.
T3 .-S* 'S3 2f §0 SP
-II?CO _^c 15CO ^Li -
1 O
X *^
•a 6aj "33 7CT.C
73 ceg o3 '£cr 3
3 to
8=85 M2-Sai:a- ,•£ en01 .
T3 CD
.3 «0 „1 w
CO
. CJ
S'cCD In CO
aj O ^
111
Individualservomechanismcontrol
Acceleration
Acceleration
Acceleration
Responseacceleration
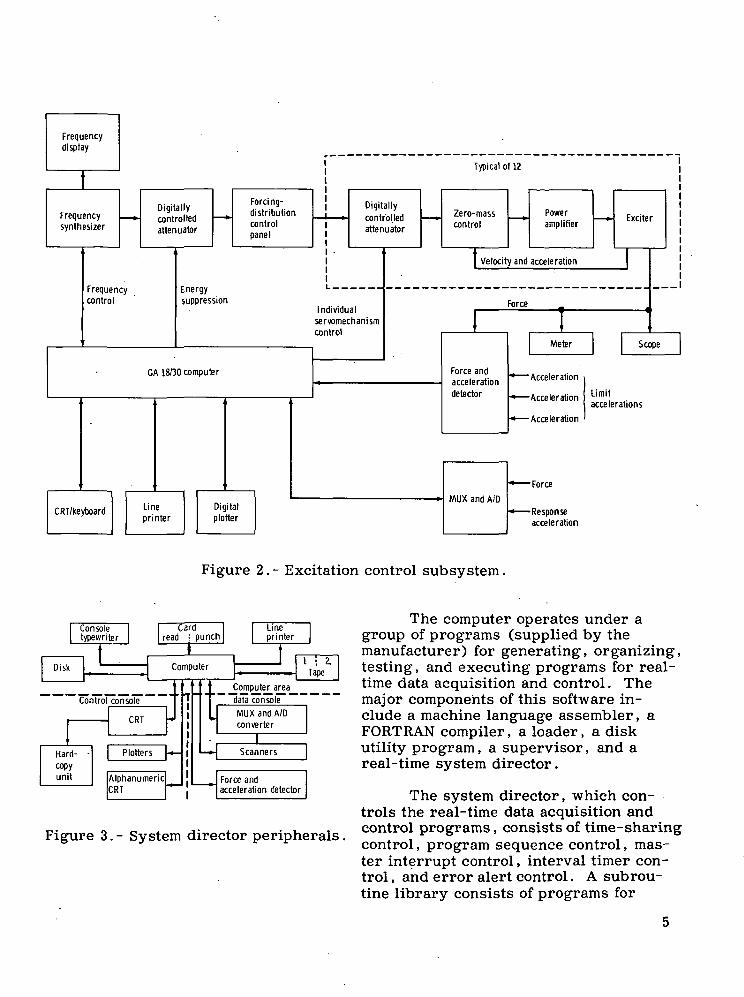
Figure 2.- Excitation control subsystem.
Figure 3.- System director peripherals,
The computer operates under agroup of programs (supplied by themanufacturer) for generating, organizing,testing, and executing programs for real-time data acquisition and control. Themajor components of this software in-clude a machine language assembler, aFORTRAN compiler, a loader, a diskutility program, a supervisor, and areal-time system director.
The system director, which con-trols the real-time data acquisition andcontrol programs, consists of time-sharingcontrol, program sequence control, mas-ter interrupt control, interval timer con-trol , and error alert control. A subrou-tine library consists of programs for

input-output conversion and for performing arithmetic, functional, selective dump,debug, and miscellaneous operations. In addition, three other categories of soft-ware are required for the system: input-output handlers for nonstandard periph-erals, application programs (real time and off line) , and test and validation routines.These three groups of software, referred to as the software support package, werewritten specifically for the AMTAS application.
Software Support Package
Five process control functions are provided by the software support package:sweep direction and linear rate, response channel selection, phase-lock control,force distribution control, and limiting of critical accelerations. Data acquisitionis inhibited when any servomechanism (servo) correction (force level or frequency)is in progress. The software support package also provides the data acquisition,data reduction, and modal documentation features of the system.
A modular structure for the software support package is dictated by severalrealities of test performance. Core memory limitations are greatly diminished bythe use of overlay and disk-resident structured coreloads that are loaded on demand.Subroutines are used to the greatest possible extent, and many are reentrant.File data must be installed early (with final corrections expected before the surveycommences) to enable performance of the system confidence test. These files (e.g.,the mass model of the structure) are sometimes corrected during the course ofthe test. These requirements are accommodated by separate data files in the soft-ware support package. The organization of the software support package is shownin figure 4.
All structure-dependent data exist in files that are easily maintained duringmodel updates and revisions. The operational program, the file creation program,and the file input program with data modules are stored and maintained separately.For a future modal test, only the file input modules need be revised to include
the structure-peculiar data; other mod-ules are independent of structure.
Individual elementsnot shownt
Subroutines
Plot Data tile creation program"tore cards not shown
Analyticalmodalresponsedata
transformequationdata
Multiplejointcoordinatedata
AMTAS programFile inputprogram
File input modules
Transformequation data
'Multiple mass-model data
Figure 4.- Organization of softwaresupport package.
The data file creation modulecreates the files required for programexecution, including the structure-dependent data. The structure-dependentdata files can be revised at any timewithout disturbing the other programs byreplacing the data deck and reloadingand executing the file input program.
Process control.- The processcontrol sequence during modal sweepsis shown in figure 5. The sweep param -eters and reference transducers areselected by keyboard entry. Frequencyincrementing is initiated by command.The individual force distribution and
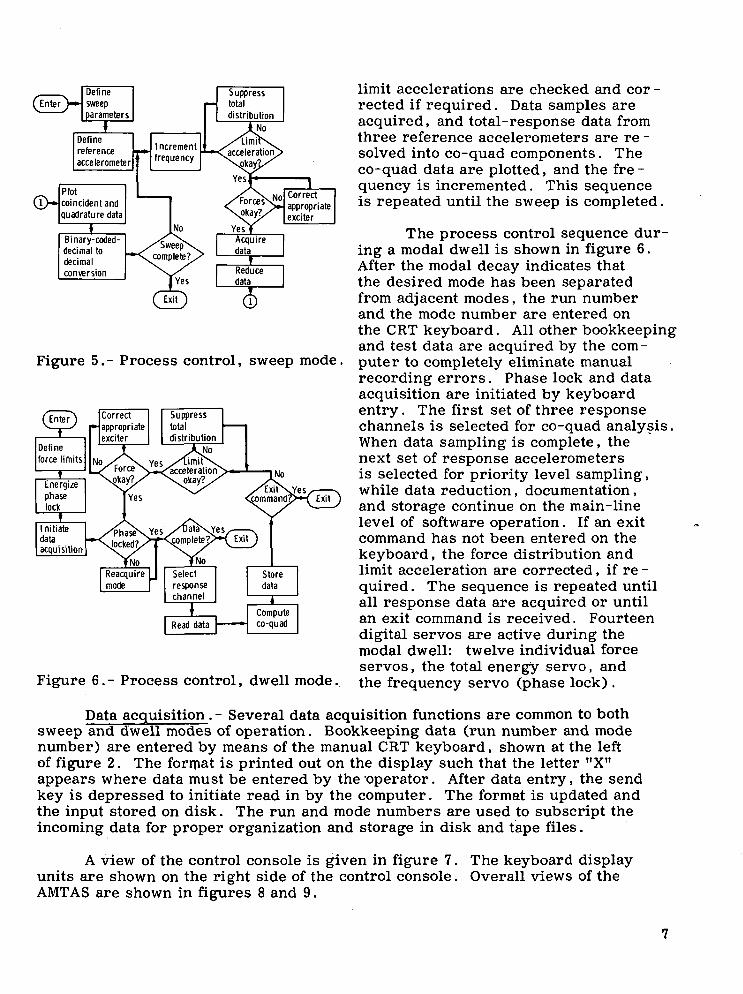
Figure 5. - Process control, sweep mode,
Figure 6.- Process control, dwell mode.
limit accelerations are checked and cor -rected if required. Data samples areacquired, and total-response data fromthree reference accelerometers are re -solved into co-quad components. Theco-quad data are plotted, and the fre -quency is incremented. This sequenceis repeated until the sweep is completed.
The process control sequence dur-ing a modal dwell is shown in figure 6.After the modal decay indicates thatthe desired mode has been separatedfrom adjacent modes, the run numberand the mode number are entered onthe CRT keyboard. All other bookkeepingand test data are acquired by the com-puter to completely eliminate manualrecording errors. Phase lock and dataacquisition are initiated by keyboardentry. The first set of three responsechannels is selected for co-quad analysis.When data sampling is complete, thenext set of response accelerometersis selected for priority level sampling,while data reduction, documentation,and storage continue on the main-linelevel of software operation. If an exitcommand has not been entered on thekeyboard, the force distribution andlimit acceleration are corrected, if re -quired. The sequence is repeated untilall response data are acquired or untilan exit command is received. Fourteendigital servos are active during themodal dwell: twelve individual forceservos, the total energy servo, andthe frequency servo (phase lock).
Data acquisition. - Several data acquisition functions are common to bothsweep and dwell modes of operation. Bookkeeping data (run number and modenumber) are entered by means of the manual CRT keyboard, shown at the leftof figure 2. The format is printed out on the display such that the letter "X"appears where data must be entered by the -operator. After data entry, the sendkey is depressed to initiate read in by the computer. The format is updated andthe input stored on disk. The run and mode numbers are used to subscript theincoming data for proper organization and storage in disk and tape files.
A view of the control console is given in figure 7.units are shown on the right side of the control console.AMTAS are shown in figures 8 and 9.
The keyboard displayOverall views of the

Figure 7.- The AMTAS control console. Figure 8. - Overview of AMTAS lookingtoward the shaker amplifier console.
Figure 9.- Overview of AMTAS lookingtoward the narrow-band filters .
The force level of each activeexciter is displayed on the alphanumericCRT. Limit acceleration status is dis-played at the bottom of the CRT at eachforce-level update time.
Response data are acquired by akeyboard-selected load cell and a set ofthree accelerometers . These transducersare fixed throughout a sweep . However,in the tuning mode, the load cell and theresponse accelerometers may be selectedor changed at any time to examineresponse characteristics of the structureas the forcing distribution and frequencyare varied to optimize a desired mode.In the dwell mode, the reference load cellis selected by keyboard entry. The dataacquisition sequence, initiated on the key-board, consists of acquiring responsedata from all accelerometers (maximumof 200) in groups of 3.
Data reduction.- The software support package provides maximum real-timevisibility and immediate posttest documentation within minutes after response datafrom all transducers are acquired. This result is achieved by maximizing thedata reduction that is performed as the data from each transducer are acquired.

The raw voltage data are converted to engineering unit data, and any direct -current component introduced by the signal-conditioning equipment is eliminated.These converted data are then processed by a Fourier analysis routine to digitallyfilter the data and to obtain the real and imaginary Fourier coefficients requiredfor co-quad component resolution. Co-quad reduction techniques are describedin appendix B. The co-quad components are derived and stored in core and mag-netic tape files. These co-quad data are normalized to input force to remove thisdependence.
After all data are acquired and reduced to co-quad components, the normal-ized quadrature data are translated to the mass-model (generalized) coordinates,and the generalized mass is computed. The generalized quadrature deflectionsare then normalized to unity generalized mass. These normalized, generalizedquadrature deflection data are used for all data documentation.
Data documentation .- Documentation (fig. 10) consists of co-quad plots,decay curves, listing of raw voltage, engineering unit and generalized coordinatedata, orthogonality matrix printout, modal plots, and a punched-card deck ofmodal response data. This documentation is available immediately after modalacquisition is completed. .
The CRT display unit affords a dy-namic , real-time status display. Param-eters included are force levels, frequency,error, and status messages. Subroutineexecution is initiated by a commandentered on the keyboard.
Data listing by the line printer isinitiated by keyboard entry. This listingis available for single modes or a total setof modes and includes status and book-keeping, raw voltage, and engineeringunit and generalized coordinate (normalmode) data. An additional keyboardentry will result in an orthogonalityprintout.
Co-quad plots Decays
Accelerometer andgeneralized coordinate data
Punched cards
Mode shape plots
Orthogonality results
Figure 10.- Modal documentation.
Modal deflections for a given modecan be produced in the form of cards bymeans of a nonprocess program in an off-line, time-share computer mode. A setof stick plots (15 maximum) documents a mode in the form of node deflections asfunctions of vehicle station.
Excitation Control Subsystem
The use of digital feedback force-control techniques avoids the need forconstant-bandwidth tracking analyzers and an analog servo unit, either of whichimposes a low-frequency limit on the system. The frequency synthesizer, controlledby the computer (fig. 2) , provides the desired frequency. The finest resolution

is 0.01 hertz. The system master gain, which controls the total forcing distribution,is manually initialized but is adjusted under direct program control to suppressthe total energy supplied to the structure if critical acceleration levels are exceeded.The signal from the ensemble of critical-location sensors, which sense the highestsignal level, is selected with a force and acceleration detector. The output of thisunit is fed to the computer to control the total energy level.
The forcing distribution is manually programed by level set and phaseselection for each individual exciter. Phase adjustment is by sense only (0° or180°) . Other phase manipulation is undesirable because normal mode motionsand damping forces act, respectively, in a 0° or 180° sense. The driving forcesare continuously variable to cancel the internal damping shears and moments andthus to preserve the steady-state natural mode. To ensure preservation of theforcing distribution and natural mode, a detected signal from each amplifier repre-senting force is monitored by the computer to allow computer adjustment of thecurrent supplied to each individual exciter. If the system total amplitude iscorrected by the computer, the individual forcing-distribution digital control outputis factored to prevent recompensation.
A separate component of the excitation control subsystem is the zero-masscontrol. This unit eliminates the effects of armature and mechanical force-inputcoupler (stinger) mass during modal decays or when a zero-drive signal is appliedto the exciter. In addition, because the armature circuit remains active duringa modal decay, the unit must compensate for back electromotive force generatedby the moving coil. A secondary effect of the control unit is to transform a voltageamplifier into an approximation of a current amplifier. A velocity transducer meas-ures the differential velocity between the exciter body and the armature. (Backelectromotive force is directly proportional to the differential velocity.) Mass can-cellation is directly proportional to the acceleration of the armature-stinger assem-bly. Therefore, use of the acceleration signal measured on the vehicle at the stingerinterface is appropriate. The signals generated by the two transducers arecorrectly phased and summed with the excitation drive signal, if present, to pro-duce a positive-feedback system. The feedback signal is summed with the drivesignal instead of switching the feedback signal into the amplifier input circuiton initiating a decay.
Excitation Subsystem
A single channel of the excitation subsystem consists of a solid-state, direct-coupled power amplifier; a field supply and control unit; a low-frequency, long-stroke exciter assembly; and a stinger. A maximum of 12 channels can be excitedsimultaneously by using a combination of 16 power amplifiers/field supplies and24 exciters. A patching network provides access from a given exciter to any poweramplifier.
The primary consideration in the design of the excitation system is to ensurethat no phase shift occurs between any of the inputs to the structure. Phaseshifts may occur electrically in the input circuitry to the power amplifiers or withinthe power amplifiers. A phase shift can also occur mechanically in the shakersupport structure or the stinger. Direct coupling is advantageous in minimizing
10

or deleting phase shifts in the input and drive circuits and is necessary forvery-low-frequency operation. Direct coupling is used in the system principallybecause of the low-frequency design criterion.
The stinger assemblies were designed to be stiff enough to transmit theforce input without the occurrence of an appreciable phase shift (less than 5°)at frequencies as high as the upper frequency limit. Nominal guidelines are tohave the first mode of the stinger, axial or bending, at a minimum frequency ofthree times the upper frequency limit of the test band.
Data Acquisition Subsystem
A diagram of the data acquisition subsystem is shown in figure 11.analog front end of the subsystem includes the following systems.
The
1. A strain gage signal-conditioning system capable of being patched intothe test laboratory junction boxes supplies power, signal amplification, calibrationcapability, and bridge balancing capability for one to four active-element straingage circuits and strain gage transducers, such as load cells.
2. A servo accelerometer signal-conditioning system capable of being patchedinto the test laboratory junction boxes supplies power, output signal balancing,and calibration for sensitive servo-type acceleration transducers.
The analog front end conditions theacceleration and force signals. Groupsof transducers are selected automaticallyby the computer as inputs to the low-passantialiasing filters. Digitized samples ofthe inputs are acquired by an MUX andA/D converter. Fourier analysis of thesedigitized data provides complex Fouriertransform coefficients for the computationof coincident and quadrature values.
Responseaccelerationsignals(200 total)
Forcesignals(12 total)
, Acceleration
Data
Monitoring SubsystemFigure 11.- Data acquisition subsystem.
The peripheral monitoring sub-system consists of a group of analogmeters, analyzers, and display units that aid tuning operations and provide continu-ous verification of system operation. The function of the monitoring subsystemis to display 12 Lissajous patterns simultaneously to aid the operator in tuning.
Twelve dual-channel dynamic analyzers act as narrow-band filters (5 hertz)to provide high-quality output signals of force and acceleration to the display units.In addition, a 90° phase shift is introduced between the two channels of the analyzerso that the Lissajous figure at resonance is a straight line rather than an ellipse.The paired outputs of the analyzers are hard wired to signal multiplexing unitsand then to bistable storage display units, which display four patterns on a single
11

unit. (Storage display units are superior to standard oscilloscopes when operatingat frequencies of less than 5 hertz.) Two options are available to the operatorsfor tuning at frequencies of less than 3 hertz, where the analyzers cannot function.Because response signals are of much higher quality at lower frequencies, themain function of the analyzers is to provide the 90° phase shift between the forceand acceleration signals. .Therefore, the raw acceleration can be used to tuneon elliptical patterns. An alternative is to use the raw velocity signal availablefrom the shaker-mounted velocity transducers. By using these transducers onlyat the very-low frequencies, the phase problems associated with shaker body motionare avoided.
Other features of the monitoring subsystem include miniature oscilloscopesfor continuous display of the raw force wave shape and analog voltmeters connectedthrough a signal selector from the analyzer outputs. The analog meters are usedto monitor force and acceleration when the central processor is not on line andto cross-check the digital data acquisition system during dwell operations bycomparing analog and digital readings.
Ancillary Support Systems
The soft-spring suspension system provides a simulated free-free environ-ment in which to excite and measure the natural elastic vibration modes of a struc-ture . A maximum of 16 units can be used to suspend the test article. Each unitcan support as much as 22 700 kilograms (50 000 pounds) while maintaining a verylow resonance frequency.
The closed-circuit television capability consists of eight video channels,including cameras and controls. The video control console permits adjusting theposition of each camera image. Patch panel and pushbutton selection capabilityare available for matching cameras and monitors. Scan conversion, split-screenspecial effects, waveform monitoring, and video signal conditioning are alsoavailable.
Analog data recording systems include the following:
1. Analog magnetic tape recorders having frequency multiplex input capa-bility are used to record data for off-line co-quad reduction.
2. Oscillograph chart recorders that include dry-development, light-sensitive papers for recording galvanometer deflections are used to acquire un-filtered accelerometer data during modal decays.
An off-line co-quad analysis capability was developed to process dataacquired from many transducers during an incremental sinusoidal sweep overa wide frequency band. The wide-band sweep is performed to define the structuralmodes. The processed data are used in conjunction with the analytical data todefine target modes and to predict optimum forcing distributions.
12

SYSTEM APPLICATION
Two keyboard CRT terminals are used for entering test parameters, ini-tiating commands to the software system, and displaying data and computations.When the computer is brought on line to support AMTAS operations, the systemcontroller format (fig. 12) is displayed on the alphanumeric CRT. Several keyfeatures are programed into the display. As shown in the controller format, the
correct page of the operating procedurethat applies to the operation in progressis displayed, the allowed options are
ENTER DATA INTO -XX- FIELDS USING FOLLOWING PROCEDURE:1- PRESS LOCAL KEY 3- PRESS HOME KEY2- ENTER DATA «- PRESS HDX KEY
5- PRESS SEND KEY
PROCEDURE SEQ: 01— WTIS CONTROLLER —
SELECTED MODULE WILL BE EXECUTED UPON ENTRY DEFINED BELOW:
-SD- EXC CONTROL AND DATA ACQ SUPVR -PL- PLOT OWKLOOK AND HDCOPY DATA-RE- REDUCE. STORE DATA FROH TAPE -OR- ORTHOGONALITY BETWEEN MODES-PR- HDCOPY PRINT OUT OF DATA -EX- EXIT TO NON-PROCESS MONITOR
defined, and instructions for enteringthese options are given to the operator.The general scheme is to present thesystem operating instructions as follows.
- . - . . . . . . 1. Alphanumeric CRT-CR- INITIATE CHECK POINT RESTART ^
(XX /)
a. Line 1 consists of messagespertaining to general system operationand required entries (to be exercised
Figure 12. - System controller CRT by AMTAS control) . Error messagesdisplay. are also displayed on this line.
b. Lines 2 to 19 are used fordefinition of allowed entries. (During
real-time operations, this area is used for display of dynamic test parameters andthe definitions are presented on the graphic CRT display.)
c. Line 20 consists of messages pertaining to vibration control (initial-izing gains, phases and level, etc.) .
2. Graphic CRT
a. The storage area is used for definition of allowed entries when thealphanumeric CRT is displaying test parameters.
b. The scratch pad area is used to enter option messages. (The alpha-numeric keyboard cannot be used when test parameters are being continuouslyupdated.)
This scheme ensures that the correct operation is performed at the proper timeso that manual functions are performed synchronously with programed operations.Operator directions and error messages (lines 1 and 20 of the alphanumeric CRT)are blinked on and off to capture the operator's attention.
The system controller provides a logic procedure (fig. 13) for selectingthe basic options for tuning and acquiring data for a mode or manipulating anddisplaying modal response data for assessing the purity and validity of a previouslyacquired mode. In the following paragraphs, the options are discussed in thenominal operational sequence.
13

Figure 13.- Application software logic.
ENTER 'C1 ON TEK KBD TO CONTINUE S/W SEQUENCE
AMTAS INITIALIZATION PROCEDURE: PROCEDURE SEQ: 01
1- PATCH LIMIT ACCELS2- NORMALIZE WEIGHTING AMPLIFIERS3- PATCH INPUTS TO SUMDETH- PATCH SCOPE AND METER PANELS5- READY DIGITAL PLOTTER6- SYNCON IN REMOTE MODE
7- SUMDET IN COMPUTER MODE8- MASTER GAIN FULL CCW9- INDIV GAINS FULL CCW10-PHASE CONTROLS TO OFF11-ZERO MASS ENABLED12-MAG. TAPES INITIALIZED
S/W HOLD-PERFORM LISTED OPERATIONS
Figure 14.- The AMTAS initializationprocedure CRT display.
Supervisor Option
The excitation control and dataacquisition supervisor option (SUPVR)is composed of the software modules forsystem initialization, modal tuning, anddata acquisition. All excitation, real-time monitoring and control, and dataacquisition are performed with thissupervisor. The remaining options ofthe controller are associated with dataanalysis, display, and assessment. Theinitialization procedure (fig. 14) is dis-played immediately after the supervisoris selected. After the initialization iscompleted, the patch correspondence table(fig. 15) is displayed. Completion ofthis table is necessary to select 24 limitaccelerometers from the 200 total-responseaccelerometers. After this table iscompleted, the supervisor options aredisplayed (fig. 16). Eight operationalpossibilities are available within thesupervisor.
1. The SUPSS option consists ofa single-shaker, wide-band sinusoidalsweep with digital data acquisition. Threeaccelerometers can be selected for gener-ating co-quad plots (fig. 17) on the dig-ital plotter during one sweep. The rawco-quad data are stored on magnetic tapeand listed on the line printer.
ENTER DATA INTO ( X X ) FIELDS USIf1- PRESS LOCAL KEY2- ENTER DATA
CH 00 LOCCH 02 LOCCH Ott LOCCH 06 LOCCH 08 LOCCH 0- LOCCH 2 LOCCH 0 LOCCH 6 LOCCH 3 LOC
XXX } G=XXX ) G=XXX ) G=XXXXXXXXXXXXXXXXXXXXX
CH 20 LOC (XXX
G=G-G=G*G=G=G-G=
+X XXE+XX+X+X+x+x+x+x+x+x+ X+x
XXE+XXXXE+XXXXE+XXXXE+XXXXE+XXXXE+XXXXE+XXXXE+XXXXE+XXXXE+XX
LIMIT ACCEL F.S. A/D
G" FOLLOWING PROCEDURE:3- PRESS HOME KEYU- PRESS HDX KEY5- PRESS SEND KEY
CH 01 LOCCH 03 LOCCH 05 LOCCH 07 LOCCH 09 LOCCH 11 LOCCH 13 LOCCH 15 LOCCH 17 LOCCH 19 LOCCH 21 LOC
COUNT=(+X.XXXE
XXX ) G=XXX ) GXXX ) GXXX } GXXX ) GXXX ) GXXX ) GXXX 1 GXXX ) GXXX ) GXXX ) G
+X XXE+XX+X+x+x+x
+x+x+x
i+x(+x
XXE+XXXXE+XXXXE+XXXXE+XXXXE+XXXXE+XXXXE+XXXXE+XXXXE+XXXXE+XX
XX / ) VOLTS
TO CONTINUE S/W SEQUENCE:1- DO NOT MOVE CURSOR2- ENTER APPROPRIATE CHARACTERS3- HOLD CTRL KEY DOWN, PRESS 'ETX 1 KEYa- PRESS SEND KEY
ENTRIES DEFINED BELOW ARE ALLOWED:SS- SWEEP SINGLE /DIGITAL DATA ACQ/AS- SWEEP SINGLE /ANALOG DATA ACQ/TS- TUNE SINGLETM- TUNE MULTIPLESM- SWEEP MULTIPLEMD- MODAL DECAYDW- MODAL DWELLRT- RETURN TO AMTAS
Figure 15.- Patch correspondence tableCRT display.
Figure 16.- Operation selection table CRTdisplay.
14

RUN 513 EXC LOG3.00 +
2.00
00 ' 1AOO • ' ^~* 16.00
18.00
-J.OO
-3.00 -IACCEL 1
Figure 17.- Portion of wide-band sweepco-quad plot.
2. The ASUPS option consists ofa single-shaker, wide-band sinusoidalsweep with analog data acquisition foroff-line co-quad reduction (not shownin fig. 13) . Typical data reduced withthe off-line software are given infigure 18.
3. The SUPTS option consists oftuning operations with a single shakerfor approximate frequency settings.
4. The SUPTM option consists oftuning operations with multiple shakers(maximum of 12). Fine tuning is accom-plished with this software module. Thealphanumeric CRT display of test param-eters , similar to those displayed for othersupervisor options, is given in figure 19.Appropriate entries for this option areshown in figure 20. The line-printerlisting of the sequence log obtained dur-ing a tune multiple (SUPTM) operationis shown as run 642 in figure 21. Thislisting is similar to sequence-log dataobtained during SUPSS , ASUPS , andSUPTS operations.
5. The SUPSM option consists of amultiple-shaker, narrow-band sinusoidalsweep to define the resonance condition.Three accelerometers can be selectedfor generating co-quad plots on thedigital plotter during one sweep. Theraw co-quad data are stored on magnetictape and listed on the line printer. Plotssimilar to those shown in figure 18 resultfrom this operation.
6. The SUPMD option consists of modal decay with signals from a maximumof 24 selected accelerometers recorded on an oscillograph. Sequence-log outputfrom this operation is shown in figure 21 (runs 643 and 644).
7. The SUPDW option consists of modal dwell operation for digital data acqui-sition in coincident and quadrature format. The system director checks the phaselock, if in use, and the force distribution status while selecting input signals andresolving the data into coincident and quadrature components. The data are storedon magnetic tape, displayed on the CRT, listed on the line printer, and transferredto cards as a backup data file. A portion of the sequence log generated duringan SUPDW operation is shown in figure 21 (run 645) .
15

• Ml
OK -4L C I
• 10 T• IOT
-4
^
1flJ
£\'
:v-\
-V
»«oO«K*l|IE
E1SEO •
N fS/
I
ESC
V
-A
IMT
***u
• V*
t IE
L TOL TO
V-
1
*
**-
«SO"
4.0O10.00
d
V-
Hi •
1
?ss
4-t\PRMM-4-
• IOO HOCEI1CO • IM.I) IECCT I N C H E M E M T l • IB Ml
TO 1.000 HiTO t.OM HZ
L | ll
4=HH— H-HT—. 1Jill 1 In
J711 m i v iT¥n
—\\4-
-p1J~l\nI yli i .
-VHfF-n-+T\ \'
i I
"nf —ii iI I Iiti —1 IIt II/ 1
'1 1 1
\ \~— lr-
i
/
•
r/V
-1
\ —m
I
4*
f K E Q U E N C V IN Hi
ure 18.- Off-line co-quad reduction:ypical plots of coincident and -quadra-are components of total acceleration .
TM OPERATION RUN (XXX ) FREQ: +X.XXXX+XX HZ. PROCEDURE SEQ: 0«SWP— ST: (+X.XXE+XX )C/Q ACCELS (XXX ) CO:+D.DD+DD (XXX ) CO;+D.DD+DD (XXX ) CO:+D.DD+DD
CH 02 LOG XXX ) SET +E.EE+EE ACTUAL + .FF FF PH•CH 03 LOG XXX ) SET +E.EE+EE ACTUAL + .FF FF PH
CH 05 LOG XXX ) SET +E.EE+EE ACTUAL + .FF FF PH .CH 06 LOG XXX ) SET E.EE+EE ACTUAL + ' .FF FF PH .CH 01 LOG XXX > SET E EE+EE ACTUAL + .FF FF PHCH 08 LOG XXX ) SET E EE+EE ACTUAL + .FF FF PHCH 09 LOG XXX ) SET E EE+EE ACTUAL + .FF FF PHCH 10 LOG XXX ) SET E EE+EE ACTUAL + .FF FF PHCH 11 LOG XXX ) SET E EE+EE ACTUAL + .FF FF PHCH 12 LOG: XXX /) SET E EE+EE ACTUAL + .FF FF PH .
ADJUST FORCING DIST AND FREQ AS REQD TO OPTIMIZE MODAL RESPONSE
Figure 19 . Modal tuning (SUPTM) formatCRT display.
TO CONTINUE S/W SEQUENCE:1- DO NOT MOVE CURSOR
3- HOLD CTRL KEY DOWN. PRESS 'ETX1 KEY«- PRESS SEND KEY
ENTRIES DEFINED BELOW ARE ALLOWED:CO- COMPUTE-CO/QUADST- STOP OPERATIONFRBSXXX -DELTA FREQ IN +/- .01 INCH. AND COMPUTE CO/QUADPR- PROCEED TO NEXT OPERATIONAFCCCBDDDBEEEBFF - NEW ACCELS AND FG
CCC- NEW ACCEL, POS 1 , FOR C/Q ANALODD- NEW ACCEL, POS 2, FOR C/Q ANALEEE- NEW ACCEL, POS 3, FOR C/Q ANALFF- NEW REF FG FOR CO/QUAD ANALD- DENOTES REQUIRED BLANK
HI- RAPID UPDATELO- NORMAL UPDATE ONLY ENTRY ALLOWED WHEN IN ' H I 1 UPDATE MODE
Top: coincident component (normal-ized to reference force); bottom:quadrature component (normalizedto reference force) .
Figure 20.- The CRT display of modaltuning options.
8. In the REDUC option, following the completion-of the SUPDW operation(assuming that no exit entry was received during the operation), the logic flowsautomatically into the reduction module to prevent loss of these data caused by aninadvertent entry. In this module, all remaining data reduction is performedwithout any operator intervention or direction required. These reduction opera-tions consist of translation of data to generalized coordinates, computation ofgeneralized mass, and normalization of generalized quadrature data to unitygeneralized mass. The reduced data are automatically stored in the correctprimary disk storage area and backup magnetic tape file area.
The "return to controller" function provides the initial display on the CRT andawaits a selection by the operator (not shown in fig. 13) .
16

175/ 3/10/ 6
175/ 3/10/33
17S/ 3/10/55
175/ 3/10/at
AMTAS COLDSTART INITIATED
AMTAS INITIALIZATION COMPLETE
MD OPERATION SELECTED
TM OPERATION COMPLETED
FREQUENCY = 16.20 HZ.
ACCEL-CO-
QUAD-RATIO-
- 31--0.197580E-03-0.113100E-030.17U236E 01
- 2--0.87i45»6E-05-0.620806E-050. 100872E 01
REF FG 6 ANALYSIS B/W 0.95
FORCING DISTRIBUTION
-117--0.16HI480E-OS0.857371E-OU
-0.191811E 00
EXEXEXEXEXEXEXEXEXEX 10EX 11EX 12
LOCLOCLOCLOCLOCLOCLOCLOCLOCLOCLOCLOC
131<4181456789101712
SETSETSETSETSET
LBS -LBS =LBS =LBS =LBS =
SET VLBS =SETSETSETSETSETSET
LBS =LBS =LBS =LBS. =LBS =LBS =
2.2.1.2.0.73.
112.0.0.1.1.
117.
171708170081250000080827
PHASE 0PHASE 0PHASE 0PHASE 0PHASE 0PHASE +PHASE -PHASE 0PHASE 0PHASE 0PHASE 0PHASE -
175/ 3/20/143
175/ J/21/1H
175/ 3/25/15
175/ 3/27/142
175/ 3/27/59
RUN 6143 MODAL DECAY INITIATED
RUN 611 MODAL EXCITATION REINSTATED
RUN 6«U MODAL DECAY INITIATED
RUN 6U5 MODAL EXCITATION REINSTATED
RUN 615 DW OPERATION STARTED MODELOC
123a56
CO-0 .8«<4E-0«-0.967E-05
0.839E-000.126E-05
-0.222E-010. 102E-014
25QUAD
-0.536E-00-0 .213E-OU-0.211IE-00-0.213E-OI4
0.640E-05O . I 4 I 4 8 E - O U
FORCE0 .7U8E 020.7I48E 020.7148E 020.7U9E 020 .7H9E 020 . 7 U 9 E 02
TOTAC0.7U9E-020.175E-020.619E-020.160E-020.173E-020.31UE-02
Figure 21.- Portion of sequence log.
Print Option
The print option entry from the controller provides for additional printingof the generalized coordinate data from the disk unit to the line printer. Any modepreviously stored on disk can be printed. Three pages excerpted from a totalprintout are presented in figures 22 (a) to 22 (c). All bookkeeping data requiredto define the frequency and forcing distribution are presented in figure 22 (a).The format used to document the response data in accelerometer coordinates isshown in figure 22 (b) . The response data in generalized coordinates are givenin figure 22 (c) .
17

MODE- 25PAGE- 1
SKYLAB MODAL SURVEY
MODE 25 RUN 645
PERIOD 0.617284E-01 SEC.
REFERENCE FORCE EXCITER 6
ORBITAL CONFIGURATION
DAY 175 HR 3 MIN 27 SEC 59
FREQUENCY 16.200 HZ.
EXCITER
1
2
3
4
5
6
7
8
9
10
11
12
LOCATION
13
14
18
4
5
6
7
8
9
10
17
12
PHASE (REL)
0
0
0
0
0
+
-
0
0
0
0_
FORCE (LBS)
2.171
2. 171
1.085
2.171
0.000
73.840
142.250
•0.000
0.000
1.085
1.085
117.275
GENERALIZED MASS 0.504447E-05
(a) Housekeeping data.
Figure 22. - Typical modal data summary.
18

IATIO
123456789101 11213141516171819202122232425262728293031323334353637383940
N ID
427-426X428-426Y789-426Z430-426X788-426Y432-426X439-602X440-602Y443-602Z442-602X793-602Y444-601X445-602X446-602Y449-602Z448-602X794-601Y450-601X468-509X467-509Y465-509Z474-509X473-509Y471-509Z480-509X479-509Y477-509Z486-509X485-509Y483-509Z492-509X491-509Y489-509Z498-509X497-509Y495-509Z770-509X771-509Y772-509Z773-509X
CO(G/LB)
-0.8447E-04-0.9672E-050.8397E-040.1269E-05
-0.2222E-040. 1025E-04
-0.6942E-Oa0.5228E-06
-0.5373E-OU0.6597E-05
-0. 19UOE-040.33U3E-OU
-0. 1098E-OU-0.2971E-050.9323E-050.7U21E-05
-0.9U56E-05-0.4292E-040.8118E-04
-Q.2HUUE-QU-0.3525E-05-0.9U03E-OU-0.9890E-OU-0.20U3E-03-0.6726E-0«-0.8163E-04-0. 1769E-030. 1968E-03
-0.9U24E-050.7245E-04
-0. 1681E-03-0.8458E-Oy-0.6427E-OU-0.7677E-OU-0. 1387E-OU0. 1 120E-030.25a6E-0<»O.Ua62E-OU
-0.11 13E-03-0.7189E-05
QUAD(G/LB)
-0.5365E-OH-0.2132E-04-0.21t3E-0«-0.2137E-040.6406E-05O.U483E-OU
-0.a221E-Ot-0.a«83E-04-O.H101E-05-0. 13UOE-040.2513E-040. 3655E-OU0.3689E-05
-0.2131E-OU0. 1953E-Ot-0.2183E-050.3739E-OU-0. 3U09E-040.5229E-04
-0. 3622E-oa0. 3702E-OU0. 1353E-040.53U2E-040:8176E-04
-0.1025E-03-0.475tE-Ot-0.8392E-040. 1122E-030. 1077E-030.7113E-OU-0. 1299E-03-0.7199E-0«-0.9301E-OU-0. 1 162E-040. 1299E-OH0.8861E-OU
-0.3152E-050.29H3E-OU-0. 7089E-0«-0. 3U1 1E-04
RATIO
0. 157UE 010. 4535E 00
-0. 3916E 01-0. 5939E-01-0. 3U69E 010.2286E 000. 16U4E 01
-0. 1166E-010. 1310E 02-0.^921E 00-0.7718E 000.9117E 00
-0.2978E 010. 1222E 000.4771E 00-0.3398E 01-0.2528E 000. 1258E 010. 1552E 010.6749E 00-0.9520E-01-0.6918E 01-0. 1851E 01-0.2498E 010.6561E 000. 1717E 010.2108E 010.1752E 01
-0.87U6E-010. 1018E 010. 1294E 010. 117«E 010.6910E 000.6605E 01
-0. 1067E 010. 126UE 01-0.8077E 010. 1516E 010. 1570E 010.2107E 00
PHASE ANGLE(DEG)
32.4265.60165.6793.39163.9277. 1231.3090.66a. 36
116.20127.66U7.55
161 .4383.0364.i)9163.60104. 1938.4632.7855.9895.43171.81151 .62158. 1856.7230.2125.3729.7094.9944.4737.6940.4055.358.60
136.8738.34172.9433.4032. 4878.09
TOTAL ACCEL(G)
0. 7494E-020. 1754E-020. 6490E-020. 1603E-020. 1732E-020. 3445E-020.6073E-020. 3351E-020.4028E-020.1116E-020.2372E-020. 3700E-020. 8658E-030. 1830E-020. 1617E-020.5776E-030.2880E-020.4092E-020.7173E-020.3246E-020.2762E-020.7061E-020.8355E-020. 1635E-010.9122E-020.7028E-020. 1457E-010.1683E-010.8034E-020.7543E-020. 1577E-010.8244E-020.8391E-020.5749E-020. 1407E-020. 1057E-010.1903E-020. 3966E-020.9792E-020.2588E-02
(b) Accelerometer response data.
Figure 22.- Continued.
19

DEC. OF QUAD ACCEL. NORM. QUADS DEC. OFFREEDOM (G/LB) OR (G(2)SEC(2)/LB-IN) FREEDOM
(G/LB-IN)1 -O.U559E-05 -0.2029E-02 U12 -0.1109E-OI4 -0.6277E-02 «23 0.2030E-OU 0.9038E-02 «3« 0.5616E-07 0.2500E-04 at5 -0.3729E-06 -0.1660E-03 «56 0.1365E-06 0.6081E-OU U67 -0.2831E-05 -0.1260E-02 «78 -0.9865E-05 -0.4392E-02 489 -0.3908E-OU -0.17KOE-01 «910 0.2671E-06 0.1189E-03 5011 -0.2955E-06 -0.1315E-03 5112 0.8567E-07 0.3811E-OU 5213 -0.1520E-OU -0.6771E-02 531« 0.6882E-05 0.3064E-02 5415 -0.1115E-OU -0.5101E-02 5516 0 .2342E-06 0.1012E-03 5617 0 . 1 K 1 5 E - 0 6 0 .63QI IE-04 5718 -0.9882E-07 -0 .««OOE-0« 5819 0.5229E-OU '0.2328E-01 5920 0.3622E-0« 0.1612E-01 6021 -0.3702E-OU -0.1648E-01 6122 0.1353E-OH 0.6025E-02 6223 -0.53«2E-0« -0.2378E-01 632« -0.8176E-01 -0.3610E-01 6«25 -0.1025E-03 -0. U564E-01 6526 -O.H73HE-OH -0.2116E-01 6627 0.8392E-01 0.3736E-01 6728 0.1122E-03 O.H999E-01 6829 0.1077E-03 O.U797E-01 6930 -0.7113E-OU -0.3167E-01 7031 -0.1299E-03 -0.5786E-01 7132 -0.7199E-04 -0.3205E-01 7233 -0.9301E-OU -O.U1K1E-01 733« -0.1162E-04 -0.517HE-02 7U35 0.1299E-OU 0.5786E-02 7536 0.8861E-01 0.39«5E-01 7637 -0.3152E-05 -0.1K03E-02 7738 0.29«3E-OK 0.1310E-01 7839 0.7089E-OU 0.3156E-01 79UO -0.3411E-04 -0.1518E-01 80
QUAD ACCEL.(G/LB) OR(G/LB-IN)
0.285UE-010. 1016E-030. 2450E-0«
-0.6191E-050. 5U36E-OU0. 1659E-04O.K181E-010.9985E-0«0.«711E-OHO.U350E-OH0. 1130E-03
1648E-05O.K782E-0'*0.«993E-Ot0.7522E-050.716UE-060.7948E-0«. U160E-06.7798E-07, 1290E-06. 1023E-OU1555E-0«
, 102KE-03.38U5E-06. V070E-05
-0. T4U6E-060.7210E-050. 1895E-050. 1J526E-OU0.27U3E-060. 1289E-05
-0. 1103E-06
NORM. QUADS(G(2)SEC(2)/LB-IN)
-0.
0.0.0.0.0.0.0.0.
-0.2593E-OU-0. 1545E-030.3529E-060. ia3lE-050.3243E-070.671UE-OU
-0.1512E-OK
0. 1270E-01O.U527E-010. 1091E-01-0.2756E-020.2H20E-010.7388E-020. 1861E-010.14«5E-010.2097E-010.1936E-010.5031E-01-0.7339E-030.2129E-01.2223E-01,33«9E-02.3323E-03, 3538E-011852E-03
, 3U72E-01.5745E-OU.«555E-02.692KE-02.U560E-01, 1712E-03.H765E-03
0,0.0.0.0.0.0.0.0.0.0.0,
-0.0.0.0.0,0.
. 3210E-02
.8037E-03
.2015E-01
. 1221E-03
.5741E-03-0.«913E-0«0.2001E-02
-0.115UE-01-0.6879E-010. 1571E-030.6371E-03
0.2989E-01-0.6733E-02
(c) Generalized response data.
Figure 22.- Concluded.
Plot Option
The plot option provides access to the plot routines. The following twooptions are available.
1. Stick plots on the digital plotter or graphic CRT generated by this routineare composed of node displacements or rotations as functions of elevation or stationnumber about three mutually perpendicular axes. The shape of the perturbedstructure is derived from the deflection data of the mass points. A typical stickplot is shown in figure 23. The columns of numbers at the bottom of each stick
20

SKYLAB ORBIT CONFIGURATION - EXPERIMENTALFREQ- 1-31 HZ- MODE 32 PLOTTED ON 174/72
STATION
Figure 23.- Typical stick plot.
Stenographic pair
X-axisview line
Focal point Focal point 0orthographic
Focal point A- Focal point Anonrotated
Orthographic view and stereographicpair of spacecraft viewed along X-axis
rotated forstereographiceffect
Rotated axis f\-Y v
Originalaxis
Note: Spacecraft viewed from point A alongline having direction cosines ofa, p, and v, which are continuouslyvariable to provide view alongany desired line. .
Nonrotated view Rotated view(to produce stereo-graphic effect)
Stereographic pair
plot consist of the node numbers, arrangedin the order of deflection. Only sixplots (three translation and three rotation)are required to describe a structure,but the capability of plotting separateparts of the structure on different plotswas developed to increase the clarityof presentation.
2 . The routine for orthographicand stereographic plots on the digitalplotter generates three orthographicand two stereographic views of the struc-ture . Plotting parameters are manuallyentered on the keyboard to enable viewingof the structure at any angle and atany focal point. The utility providedby parameter selection is shown in fig-ure 24. The stereographic plots, whenviewed with a stereoscope, providea three-dimensional view of the structure.
Orthogonality Option
The orthogonality routine (ORTHO)provides for selecting the type of check,automatic or cross, to be made betweenanalytical or experimental modes. Inaddition, the particular set of desiredmodes for orthogonality is entered throughthe CRT keyboard. Orthogonality isdiscussed in appendix C .
TEST TECHNIQUES
Figure 24.- Effect of varying plotparameters.
The test techniques section com-prises a discussion of several techniquesused in testing with the AMTAS .
Modal Tuning and Data Acquisition
The supervisor provides the algorithms for excitation control, real-timemonitoring, and data acquisition for all modal operations. Upon selection of thesupervisor through the controller, the initialization procedure is performed, followedby keyboard entry of the limit accelerometer parameters and respective responselimits. The first operational entry is used to perform a wide-band sinusoidal sweep
21

with a selected exciter to obtain preliminary data of vehicle response to uniaxial,single-point force input. These data provide modal definition for use during tuning.Generally, most of these sweeps are performed before advancing to the othersequences. (In either the SUPSS or the ASUPS mode, two shakers can be drivensimultaneously, although only one is actively servo controlled. The second shakerimproves the quality of the excitation for better definition of bending or torsionalmodes when driving tangentially attached shakers.) In the SUPSS mode, threeaccelerometers can be selected for digital recording and concurrent co-quad plotting.Any number of accelerometers can be selected for analog tape recording in theASUPS mode for subsequent off-line data reduction. This mode of operation isadvantageous when many accelerometers are used for preliminary data analysis.The information resulting from wide-band sweeps consists of gross mode shapesor pairing with predicted analytical modes, approximate frequency of a mode,preferred shakers for a mode, and initial phase settings for shakers.
Modal tuning follows the initial wide-band sweeps and subsequent data analy-sis. The next four selection options, SUPTS, SUPTM, SUPSM, and SUPMD, areassociated with the tuning operation. Modal tuning with multiple exciters, SUPTM,is the main process of modal excitation and mode identification and separation.Tuning with a single exciter, SUPTS, is a short form of tune multiple operation.
The modal tuning and acquisition sequence is initiated by selecting a targetmode and determining the appropriate forcing distribution. A nominal force levelis manually initialized on the master (primary) exciter. This exciter is selectedby analysis of the analytical model data (plots and listings) and the experimentalco-quad data derived from the single-exciter (ASUPS and SUPSS) sinusoidal sweeps.
The operator directs the operation by keyboard entry. After manual initiali-zation of the forcing distribution, the low (LO) command returns the display updaterate to the slow mode. The high (HI) update mode is automatically activated uponentry to a software module; therefore, forcing-distribution initialization is required.Returning to the slow update mode allows most of the computer time to be devotedto acquiring and reducing data. The data identifying the response accelerometersand reference load cell are entered into the CRT format before the operation begins.These transducers can be changed by the appropriate entry at any time duringa given operation.
The modal response of the structure is optimized by varying the frequencyof excitation and the forcing distribution (phase and level of the active exciters).While increasing quadrature values are noted on the co-quad displays, the frequencyis incremented to maximize the quadrature value and to close the Lissajous pattern.The Lissajous pattern complements the co-quad displays and is useful in approachingan effective distribution. However, fine tuning is best achieved by observingsmall changes in the quadrature values because these effects cannot be detectedin the Lissajous patterns. Lissajous patterns are normally formed by pairing exciterforces and respective driving-point accelerations. However, accelerations fromother points of the structure may also be used, particularly when fine tuning themode. As more exciters are activated, the resonance frequency will tend to shiftdownward. As this shift occurs, the frequency is incremented to below resonance,then increased in fine steps to peak the quadrature values. (See the followingcomments on hysteresis.)
22
In some instances, it may be advantageous to suppress participation of aneighboring mode rather than to attempt excitation of the target mode. A decreasein the coincident values indicates suppression of the undesired mode. The quadra-ture values must not decrease appreciably during the process.
After the forcing distribution is optimized, the frequency of resonance isestablished from a lower frequency to eliminate effects of hysteresis; hysteresisoften distorts curves of response level as a function of frequency and may resultin erroneous indications of resonance conditions.
Accelerometers at key points of the structure are surveyed to assess theadequacy of tuning. Co-quad values from several primary locations are tabulatedfor reference during subsequent operations.
The four options of the tuning process automatically sequence in a logicalorder: tune single proceeds to tune multiple, then to sweep multiple, and thento modal decay. However, any desired operation can be entered directly throughthe operation selection table, as shown in figure 13.
A sweep multiple operation can be performed at any time in the tuning processas an aid in defining the resonance condition, particularly if difficulties arise inthe tune multiple operation. Performance of a narrow-band sweep can identifyany neighboring problem mode and provide insight on suppression techniques.After completion of the final tune multiple sequence, a sweep multiple operationis normally performed for data purposes. The co-quad plots from these narrow-band sinusoidal sweeps are used in posttest analysis for an index of modal separa-tion and for the calculation of damping values. Damping calculations are discussedin appendix D. One or more sweeps can be performed depending on the numberof different accelerometers to be plotted.
When the co-quad data of the tune multiple and sweep multiple operationsindicate that a mode has been properly separated and tuned, a modal decay is per-formed. Shaker excitation is removed, and the unfiltered signals from selectedaccelerometers are recorded on an oscillograph. The quality of the decay curves(fig. 25) provides another index of modal purity. If the structure decays smoothlywith the absence of beating for the tuned mode, modal purity is good. If the modalpurity is satisfactory, the sequence will be cycled automatically to the modal dwelloperation for data acquisition. If modal purity is poor, the tuning iterations canbe repeated. In tuning problem modes, it is sometimes helpful to acquire dwelldata despite the impurities and to generate plots of the existing mode. These plotsprovide the visibility to define problem areas and to assess the adequacy of theexisting exciter locations to properly excite the target mode.
The modal dwell operation begins with operator entry of bookkeeping data,mode identifier, and run number for documentation and data retrieval purposes.Excitation is reinstated, and the force servo maintains the predetermined forcingdistribution. The automatic phase-lock feature can be activated if desired. Afterstabilization of the forcing distribution and response, data are acquired on theoperator's CRT. Upon completion of data acquisition, the data are automaticallyreduced and stored on disk. (Note the position of the REDUC module in fig. 13.)
23
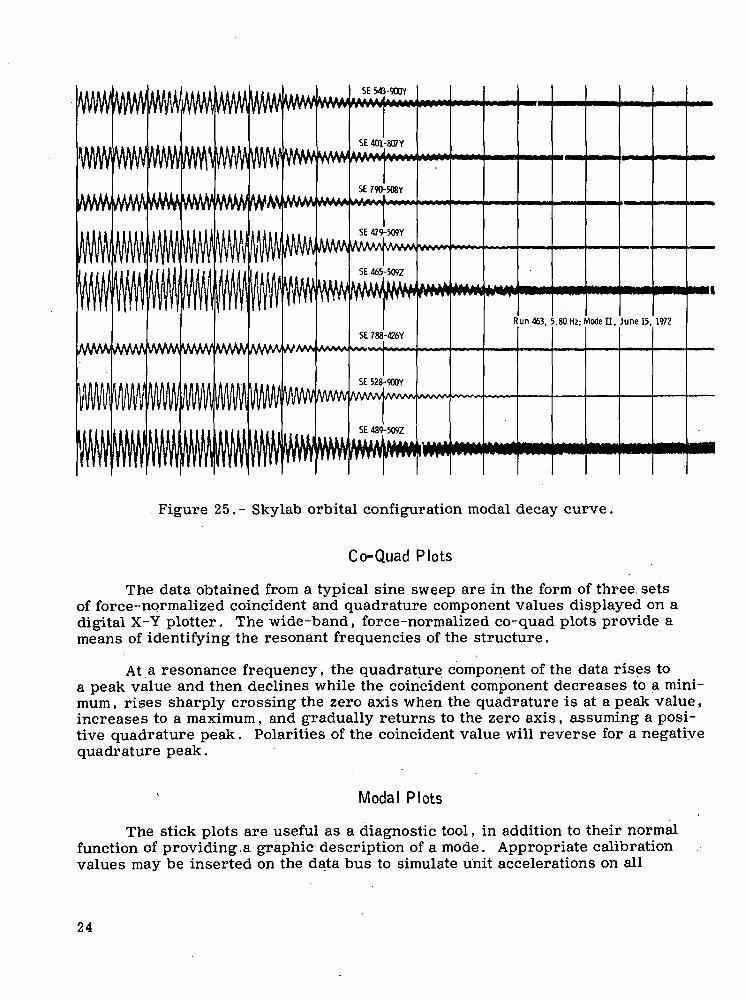
Run 463, 5.80 Hz; Mode D, June 15, 1972
Figure 25.-Skylab orbital configuration modal decay curve.
Co-Quad Plots
The data obtained from a typical sine sweep are in the form of three, setsof force-normalized coincident and quadrature component values displayed on adigital X-Y plotter. The wide-band, force-normalized co-quad plots provide ameans of identifying the resonant frequencies of the structure.
At a resonance frequency, the quadrature component of the data rises toa peak value and then declines while the coincident component decreases to a mini-mum , rises sharply crossing the zero axis when the quadrature is at a peak value,increases to a maximum, and gradually returns to the zero axis, assuming a posi-tive quadrature peak. Polarities of the coincident value will reverse for a negativequadrature peak.
Modal Plots
The stick plots are useful as a diagnostic tool, in addition to their normalfunction of providing.a graphic description of a mode. Appropriate calibrationvalues may be inserted on the data bus to simulate unit accelerations on all
24

transducers and unit forces on all load cells, and the SUPDW module may be usedto acquire these calibration data. After reduction, the plotted data must appearas rigid-body translations on the stick plots. If not, there are errors in the transla-tion equations. The trimetric (three planar views) set and stereographic pairprovide a graphic capability for assessing the adequacy of a particular forcingdistribution in exciting a given mode.
An automatic scaling feature provides maximum resolution. (The operatormay override this feature and specify a particular scale, if desired.) For compari-son purposes, however, scaling for the total set of translation plots is calculatedon the basis of all data to be plotted. Similarly, the scale for rotation is calculatedfor all plots.
A set of stick plots may be made on the alphanumeric-graphic CRT (quicklook) or the digital plotter (report-quality hard copy) . These instruments plotdegree of freedom as a function of station number; the plots are formatted to provideperturbation definition along each axis.
Decay Curves
Decay curves are used to assess the purity of a mode by noting the amountof beating present. Curves generated during a modal decay with only the targetmode excited will reflect no beating.
Off-Line Co-Quad Analysis
The off-line co-quad processing (by a central reduction laboratory) is accom-plished by digitizing and reducing the taped analog data to the desired engineeringunit output. These reduced data permit assessment of the force-servo subsystemoperation and detection of the approximate frequencies at which the response ofthe structure is significant.
RECOMMENDATIONS FOR FUTURE APPLICATIONS
During the application of AMTAS to the Skylab modal survey, several improve-ments to the system were defined. Improvements that represent significant increasesto overall capability are discussed in the following paragraphs.
Test Article Suspension System
The ancillary suspension system should become an integral part of the AMTASto permit computer control of the suspension system. Single-parameter (position)or dual-parameter (load or pressure and position) feedback can be used for positivecontrol of the test article suspension.
25

Technical Writer's Log Input
An additional CRT/keyboard display unit should be incorporated for useby the technical writer. Test comments could be composed in the local mode usingthe edit features of the unit. After the text is completed, the comments could beentered by a send command. The entire sequence log, including comments, shouldbe displayed on the line printer and stored on digital magnetic tape.
Modal Survey Simulator
Training could be facilitated if a simulator software package were developedand included as an on-line option. Data stored during the Skylab modal surveycould be used for a realistic simulation of a modal survey, including wide-bandand narrow-band sweeps, tuning operations, modal decays, and dwells. Thisapproach would eliminate the need for a structure for training purposes.
Test Procedure Display
A separate CRT (monitor only) unit should be incorporated to display thetest procedure with slaved monitor units at each test station. This arrangementwould eliminate the complexity of following the test operation, because the main-line program will automatically display the correct page of the procedure and scrollit forward as the test progresses.
CONCLUDING REMARKS
The design goals of the automatic modal tuning and analysis system — pro-viding positive control of test conditions, rapid data acquisition and reduction,immediate documentation of modal response characteristics, and a high degreeof specimen safety —were achieved. This unique system provided data in a mean-ingful form to the data evaluation team, which rapidly evaluated the data andselected specific modes from the numerous candidate modes observed. The selectedmodes were individually excited, and pertinent data were acquired. The automaticmodal tuning and analysis system described herein is capable of meeting the require-ments for a modal survey of any structure comparable in size and complexity tothe Skylab pay load. The techniques and methods employed in the system willenable expansion to meet the requirements of larger structures.
Lyndon B. Johnson Space CenterNational Aeronautics and Space Administration
Houston, Texas, January 16, 1975961-21-31-05-72
26

APPENDIX A
SKYLAB TEST ARTICLE
The automatic modal tuning and analysis system provides the capability forperforming a modal test survey of a large and complex test article having resonancefrequencies from 0.1 to 100 hertz . The Sky lab orbital assembly, shown in figure A-1,is an example of such a test article to which the system has been applied.
The Skylab assembly orbital testconfiguration consisted of the Vibrationand Acoustic Test Facility (VATF) basering, the orbital workshop (OWS) forwardskirt, the instrumentation unit (ID) , thefixed airlock shroud (FAS) , the airlockmodule (AM), the deployed Apollo tele-scope mount (ATM) , and the invertedcommand and service module (CSM) .The ATM includes engaged launch andorbital locks and four undeployed solararrays. The entire cluster was suspendedaxially by air springs. With the exceptionof the CSM, the launch test configurationhad all the same subassemblies plus thepayload shroud. The test article in eachconfiguration weighed approximately54 400 kilograms (120 000 pounds) andwas approximately 21 meters (70 feet)high.
The vehicle suspension systemsused for the Skylab launch and orbitaltest configurations were designed to pro-vide free-free support and made use ofsoft pneumatic spring units. Althoughto rigidly support the vehicle in the testfacility would have permitted analysisof the test vehicle as a cantilevered beam,the soft suspension was preferred. Someof the reasons for this preference are asfollows.
1. Before modal testing, the launchconfiguration was subjected to a high-force dynamics test of 444 800 newtons
Figure A-l.- Skylab payload in orbital (100 000 pounds) force peak. For thisconfiguration. test, isolation of the vehicle and the
27

excitation system from the facility was required for facility protection. Therefore,a soft pneumatic spring system was necessary.
2. If a rigid support had been used, boundary conditions would have beenextremely difficult to define, but definition would have been necessary to determinethe effects and contributions of the support to modal responses of the test article.
3. Regardless of the type of support used for the remainder of the vehiclestack, a vertically soft spring was required for the deployed ATM in the orbitalconfiguration. A vertical spring allowed for correct relative displacements duringmodal excitation. Failure of the ATM air spring with the remainder of the stackrigidly supported could have damaged the ATM and attaching hardware.
The two Skylab vehicle configurations in the vertical position provided asimulated free-free or unrestrained environment in which to excite and measure thenatural elastic vibration modes of the structure. Low stiffness was obtained in thevertical direction through the use of pneumatic springs consisting of multiple liftelements mounted on a plenum tank having a large adjustable volume. Low stiffnessin the lateral directions was obtained by suspending the vehicle on relatively longrods to produce pendulum motions that were essentially linear for the amplitude ofthe motions experienced during the modal test.
The two suspension systems are shown in figures A-2 (launch) and A-3(orbital). The suspension system for the launch configuration consisted of threeidentical air-spring units mechanically connected through pendulums to a ringfixture to which the lower surface of the Saturn S-IVB forward skirt was attached.These three air-spring units functioned and were operated as a single suspensionsystem. For the orbital configuration, the spacecraft modules were divided intothree subassemblies: (1) the inverted CSM; (2) the deployed ATM; and (3) asubassembly consisting of an OWS forward dome and skirt, the FAS, the AM, themultiple docking adapter (MDA) , and the deployment truss. Five air-spring unitswere used, as shown in figure A-3. In the orbital configuration, the airlock sub-assembly was suspended on the same ring fixture, pendulums, and plenums usedfor the launch configuration, but the operating pressure and natural frequency wereadjusted to match the other two systems. The ATM system was made up of oneair-spring unit attached with a single pendulum to a special ATM fitting. The CSMsystem consisted of a single air-spring unit but was attached to two fittings on theaft bulkhead of the service module using two pendulum rods. The suspensionsystems including control systems were designed to minimize static-load transfersacross the CSM/MDA interface and the ATM/deployment assembly interface to elimi-nate degrading effects on modal response data.
Safety features of the system include upper and lower mechanical stops foreach air-spring unit or vehicular subsystem and lateral clearances from facilitystructures. The most important safety feature is inherent in the soft-springsuspension. If an air spring failed, the maximum load across the vehicle interfacewould not exceed the load required to displace the remaining air springs to theirlower stops. These stops were set at 3.8 centimeters (1.5 inches) below the nominaloperating height of each subassembly, and the maximum interface loads would havebeen well below the allowable spacecraft design limits. A separate safety feature
28

of the controls is an overtravel monitor that is used to terminate excitation automati-cally when the vehicle approaches one of the mechanical stops.
Air spring no. 4
Air springno. 2
-Floor
Figure A-2.- Suspension of pay loadassembly launch configuration modalsurvey.
Floor
Figure A-3.- Suspension of payload as-sembly orbital configuration modalsurvey.
The exciter supports were soft mounted for one test and hard mounted forthe other because of the differing frequency ranges of the Skylab launch (5 to50 hertz) and orbital (0.8 to 20 hertz) test configurations. For the launch configura-tion, all horizontal exciters were pendulum mounted with soft (35 N/cm (20 lb/in.))mechanical springs in series with the support rod. The same springs were usedfor supporting the vertically oriented exciters. The exciters weighed approximately150 kilograms (330 pounds); this weight resulted in a vertical natural frequencyof 0.75 hertz.
29

For the orbital configuration, most of the exciters were hard mounted. How-ever , in a few locations, pendulum mounting was used because of poor exciter posi-tion relative to adequate support structure. The pendulum-mounted excitersrequired additional reaction mass loading to maintain adequate stroke capability atthe lower frequency limit. Additional mass of approximately 900 kilograms(2000 pounds) was attached to these exciters. The arrangement of exciters forthe orbital configuration modal survey is depicted in figure A-4.
VATF ring
Figure A-4.- Exciter arrangement for or-bital configuration modal survey.
30

APPENDIX B
CO-QUAD ANALYSIS OF MODAL RESPONSE DATA
Co-quad analysis represents a recent and important advance in modal surveytechnology. The term co-quad is used to refer to the in-phase (coincident) and out-of-phase (quadrature) components of one signal that are in phase and out of phase,respectively, with another signal. In applying the co-quad technique to.reducingmodal survey data, the acceleration response signal is resolved into coincident andquadrature components with respect to the signal representing the force applied tothe structure under test. (See fig. B-l.)
iOut-of-pha$e axis (imaginary)
2 A
In-phase axis (real)
A -total acceleration vector
F • reference force vector
C-coincident component of A withrespect to F
Q • quadrature component of A withrespect to F
if phase angle between total accelerationand reference force
Figure B-l.- Co-quad componentdefinition.
It is appropriate to examine thephase relationships that exist duringsteady-state vibration to acquire thebackground necessary to fully appre-ciate the power of co-quad analysis.W. T. Thomson (ref. 1) succinctly inter-prets these phase relationships for casesof steady-state excitation at frequenciesbelow resonance, at resonance, andabove resonance.
Force and acceleration signals areused for co-quad analysis because theyare readily available from force trans-
ducers and response accelerometers. Signals from velocity or displacement trans-ducers , or from another accelerometer, could be used as a reference for resolvingresponse accelerations into their coincident and quadrature components. However,the proper phase relationships between the reference signal and the response accel-eration must be known to interpret the results properly. The phase relationshipsfor force F, acceleration A, velocity V, and displacement D for conditions belowresonance, at resonance, and above resonance are given in table B-I. As shown intable B-I, with force as the reference signal and acceleration as the response signal,acceleration is 90° out of phase with force at resonance. Below resonance, the phaseangle <j> is between 90° and 180°; above resonance, the phase angle is between0° and 90°. As a function of frequency, the co-quad response of acceleration withrespect to force is shown in figure B-2. At resonance, the quadrature value is ata maximum and the coincident value is at a minimum. Data resulting from a slowsweep through a resonant frequency point, at a linear rate, are useful in assessingthe modal qualities in the following ways. First, such data indicate the frequencyof resonance (maximum quadrature point); second, such data give a clear pictureof any modal content at adjacent frequencies (minor quadrature peaks or otherperturbations to a smooth rise and fall of the quadrature curve); and, third, datathat may be used to calculate the percent of critical damping are containedin the coincident spectrum.
31
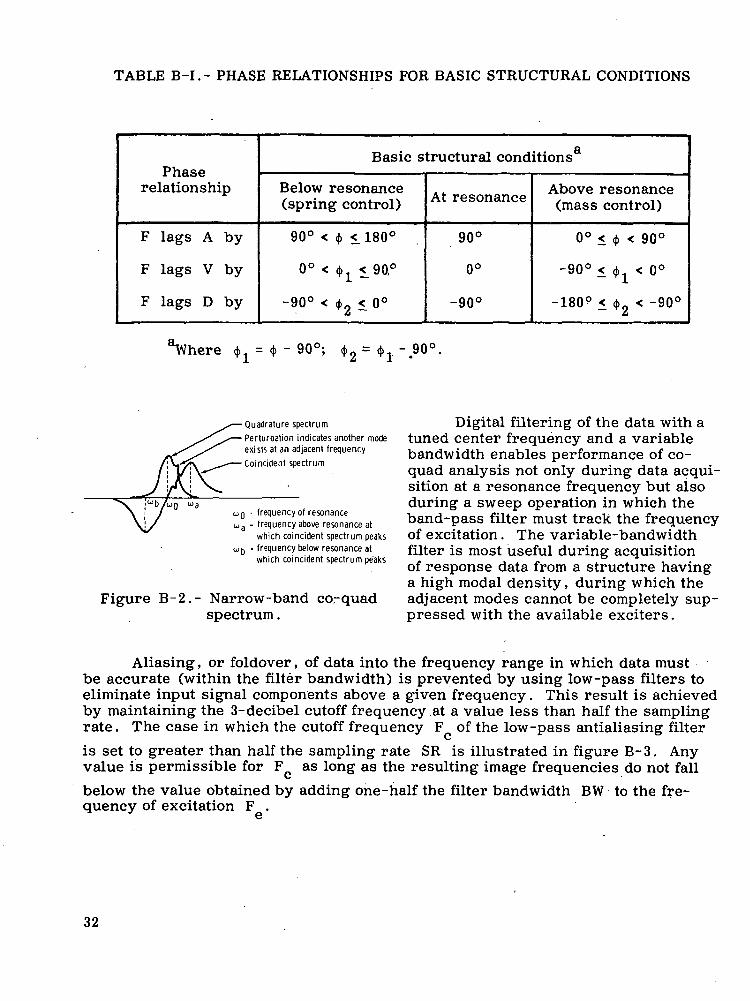
TABLE B-I.- PHASE RELATIONSHIPS FOR BASIC STRUCTURAL CONDITIONS
Phaserelationship
F lags A by
F lags V by
F lags D by
Basic structural conditions8
Below resonance(spring control)
90° < 4 < 180°
0° < $ < 90°
-90° < $2 < 0°
At resonance
90°
0°
-90°
Above resonance(mass control)
0° < (j> < 90°
-90° < <j> < 0°
-180° < <fr < -90°
'Vhere = 4 - 90°; <J> = -90
Quadrature spectrum
Perturbation indicates another modeexists at an adjacent frequency
Coincident spectrum
• frequency of resonance= frequency above resonance at
which coincident spectrum peaks• frequency below resonance at
which coincident spectrum peaks
Figure B-2.- Narrow-band co-quadspectrum.
Digital filtering of the data with atuned center frequency and a variablebandwidth enables performance of co-quad analysis not only during data acqui-sition at a resonance frequency but alsoduring a sweep operation in which theband-pass filter must track the frequencyof excitation. The variable-bandwidthfilter is most useful during acquisitionof response data from a structure havinga high modal density, during which theadjacent modes cannot be completely sup-pressed with the available exciters.
Aliasing, or foldover, of data into the frequency range in which data mustbe accurate (within the filter bandwidth) is prevented by using low-pass filters toeliminate input signal components above a given frequency. This result is achievedby maintaining the 3-decibel cutoff frequency at a value less than half the samplingrate. The case in which the cutoff frequency F of the low-pass antialiasing filter
Vx
is set to greater than half the sampling rate SR is illustrated in figure B-3. Anyvalue is permissible for F as long as the resulting image frequencies do not fall
below the value obtained by adding one-half the filter bandwidth BW to the fre-quency of excitation F .
32

The total acceleration vector is resolved into its coincident and quadraturecomponents in two steps. First, the complex Fourier transform coefficients arecomputed for both the reference and response signal. The terms used are asfollows: A- is the real coefficient for force, B. is the imaginary coefficient forforce, A is the real coefficient for acceleration, and B is the imaginary coeffi-
a 3.
cient for acceleration. The coincident and quadrature components are obtained bythe following cross-multiplication process.
Co =(Bl)
Quad = A -Bf - A.»8. I I
B
Foldover point
. BW 1I-— H• •
I Ii i i i
Fe
/ ' \ ^ — imaging area/' N *ri
t*i
\
\^\
I i0.5 SR Fc SR
Figure B-3.- Antialiasing of input data.
33

APPENDIX C
ORTHOGONALITY
The modal deflections of a measured mode are the elements of a column matrix ..This modal column of the n degree-of-freedom system in the rth mode is representedby [9 ] where each element 0. equals deflection at point i (where i = 1, n) .r i ,rThis modal column is also called the rth eigenvector and can be thought of as a vectorin n-dimensional space where each element of the column is a component of the vectorin the corresponding coordinate direction . For an n degree-of-freedom system ,there are n such eigenvectors . Each eigenvector and associated eigenvalue(resonance frequency) will satisfy the equation of motion for the system in freevibration .
The generalized mass G of the system for the rth measured mode is given by
(Ci)
where T denotes the transpose of the mass matrix [M ] . The set of eigenvectorsobtained experimentally should be orthogonal with respect to the mass (or stiffness)weighting matrix . This orthogonality relationship , with mass as the weightingmatrix between the rth and sth modes , is expressed as
T[er]T[M][es] =0 (C2)
Mass coupling between the rth and sth modes results in a value other thanzero . Therefore , the mass coupling C between the rth and sth measured modesis defined as
Cr,S ' [er]T'M' [9s] (C3)
The magnitude of mass coupling 6 between the rth and sth measuredr ,smodes can be assessed by comparison with the rth and sth generalized masses .
•*GS)34
T-The generalized mass matrix ,[G] is defined as [G] = [0 ] [M][e] wherethe lack of a subscript for the modal matrices signifies that the complete set of eigen-vectors is included. The generalized mass matrix will contain diagonal elementsrepresenting the generalized mass for each mode and off-diagonal elements repre-senting the mass coupling terms. The generalized mass matrix can be characterizedby
°r Cr,s
C Gr,s s(C5)
where G and G are the generalized masses of modes r and s , respectively ,r sand C is the coupling between modes r and s . The nondimensional magni-r » stude of mass coupling 6 can be computed by using the elements of the massr , smatrix . It is desirable to normalize the elements of each modal column to unitygeneralized mass for the particular measured mode . Normalization is possiblebecause amplitude is not a property of normal modes . Denoting the normalizedmodal column of the rth measured mode as [ $ ], each element is obtained bydividing by the root of the rth generalized mass .
(C6)
The generalized masses of each normalized mode will be unity.
The difficulty in attempting to obtain absolutely orthogonal modes (with zero-mass coupling) can be realized by noting the causes of error. The distributed massof the structure is represented by discrete mass elements to form a mass model.The transformation equations include terms to determine the displacements of thecenter of gravity and rotations about the principal axes of inertia of each mass ele-ment from components of acceleration measured at various physical locations. Theaccuracy of the determined mass coupling, or orthogonality, depends on the accu-racy of the theoretical mass model, the transformation equations, and the experi-mental data. Two modes can be orthogonal, but it is possible that these modes arenot normal to the remaining modes of a set even though they appear to meet orthog-onality conditions when considered as a pair without regard to the other normalmodes. Orthogonality is a necessary but not sufficient condition that the modeunder consideration is a normal mode of the structure.
35

In a frequency range having a high modal density, the auto-orthogonalitycheck is a convenient method of comparing analytically predicted and experimentallyderived modes. This comparison is made by using orthogonality checks betweenthe mode being investigated and all analytical modes predicted to be within the gen-eral frequency area of the mode of interest.
36

.APPENDIX D
DAMPING CALCULATIONS
The most convenient method for calculating the damping factor is to determinethe frequency points of maximum and mimimum coincident response. In figure B-2,the minimum frequency ox occurs below resonance and the maximum frequencya) occurs above resonance. The damping factor £ is a function of the ratio of
fl
these frequencies.
(Dl)
An alternate method is to use the relationship based on the logarithmic decre-ment of the decay curve given as
2 10 -| (D2)
in which the damping factor is a function of the initial amplitude Y- and the finalamplitude Y of the peaks of a decay curve, as shown in figure D-l, and n is thenumber of cycles included within the initial and final amplitude peaks.
ItfHMffli/yy\jVv\AAA/^i j •:• i j i : ; i •:. i -:• :
y\/\i/vy\/\/yV^: > \ i \ { I ••• '. i > : :
i/y\/!\/\/Vv\M^p/|y\M^
\^ j ^Figure D-l.- Modal decay curve.
37

REFERENCE
1. Thomson, William Tyrrell: Vibration Theory and Applications. Third ed.,Prentice-Hall, Inc., 1965, ch. 3, pp. 51-98.
BIBLIOGRAPHY
Salyer, R. A.: Hybrid Techniques for Modal Survey Control and Data Appraisal.The Shock and Vibration Bulletin of the 41st Shock and Vibration Symposium,Air Force Academy (Colorado Springs, Colo.), Oct. 27-29, 1970, pp. 25-42.
Salyer, R. A.: Purity Criteria for Modal Survey Data. Proceedings of the17th Annual Technical Meeting and Equipment Exposition, Institute of Environ-mental Sciences (Los Angeles, Calif.), Apr. 26-30, 1971, pp. 163-168.
38 NASA-Langley, 1975 S~435

NATIONAL AERONAUTICS AND SPACE ADMINISTRATION,
WASHINGTON. D.C. 2OS46
OFFICIAL BUSINESS
PENALTY FOR PRIVATE USE S3OO SPECIAL FOURTH-CLASS RATEBOOK
POSTAGE AND FEES PAIDNATIONAL AERONAUTICS AND
SPACE ADMINISTRATION451
POSTMASTER : If Undeliverable (Section 158Postal Manual) Do Not Return
"The aeronautical and space activities of the United States shall beconducted so as to contribute . . . to the expansion of human knowl-edge of phenomena in the atmosphere and space. The Administrationshall provide for the widest practicable and appropriate disseminationof information concerning its activities and the results thereof."
—NATIONAL AERONAUTICS AND SPACE ACT OF 1958
NASA SCIENTIFIC AND TECHNICAL PUBLICATIONSTECHNICAL REPORTS: Scientific andtechnical information considered important,complete, and a lasting contribution to existingknowledge.
TECHNICAL NOTES: Information less broadin scope but nevertheless of importance as acontribution to existing knowledge.
TECHNICAL MEMORANDUMS:Information receiving limited distributionbecause of preliminary data, security classifica-tion, or other reasons. Also includes conferenceproceedings with either limited or unlimiteddistribution.
CONTRACTOR REPORTS: Scientific andtechnical information generated under a NASAcontract or grant and considered an importantcontribution to existing knowledge.
TECHNICAL TRANSLATIONS: Informationpublished in a foreign language consideredto merit NASA distribution in English.
SPECIAL PUBLICATIONS: Informationderived from or of value to NASA activities.Publications include final reports of majorprojects, monographs, data compilations,handbooks, sourcebooks, and specialbibliographies.
TECHNOLOGY UTILIZATIONPUBLICATIONS: Information on technologyused by NASA that may be of particularinterest in commercial and other non-aerospaceapplications. Publications include Tech Briefs,Technology Utilization Reports andTechnology Surveys.
Details on the availability of these publications may be obtained from:
SCIENTIFIC AND TECHNICAL INFORMATION OFFICE
N A T I O N A L A E R O N A U T I C S A N D S P A C E A D M I N I S T R A T I O N
Washington, D.C. 20546


![REGIONAL RENEWAL APRIL 28, DS[1]eprints.qut.edu.au/7945/1/7945.pdfregional middle ground is thus emerging as a possibility. This paper explores the nature and reasons for these changed](https://img.pdfslide.us/doc/110x75/60b02fa519218535d80886f1/regional-renewal-april-28-ds1-regional-middle-ground-is-thus-emerging-as-a-possibility.jpg)