Embed Size (px)
Citation preview

Resource
Mapping of Brain Activity by Automated Volume
Analysis of Immediate Early GenesGraphical Abstract
Highlights
d We introduce ClearMap, a pipeline for automated activity
mapping in intact samples
d iDISCO+ preserves morphology and size of cleared samples
for automated registration
d We use ClearMap to study brain regions involved in parental
behavior
Renier et al., 2016, Cell 165, 1–14June 16, 2016 ª 2016 Elsevier Inc.http://dx.doi.org/10.1016/j.cell.2016.05.007
Authors
Nicolas Renier, Eliza L. Adams,
Christoph Kirst, ..., Catherine Dulac,
Pavel Osten, Marc Tessier-Lavigne
In Brief
The neural circuits in mice involved in
complex behaviors, such as parenting,
can be visualized by combining tissue
clearing with activity mapping in an
automated platform called ClearMap.
Please cite this article in press as: Renier et al., Mapping of Brain Activity by Automated Volume Analysis of Immediate Early Genes, Cell(2016), http://dx.doi.org/10.1016/j.cell.2016.05.007
Resource
Mapping of Brain Activity by AutomatedVolume Analysis of Immediate Early GenesNicolas Renier,1,7 Eliza L. Adams,1,7 Christoph Kirst,2,7 ZhuhaoWu,1,7 Ricardo Azevedo,1 Johannes Kohl,3 Anita E. Autry,3
Lolahon Kadiri,5 Kannan Umadevi Venkataraju,4,5 Yu Zhou,6 Victoria X. Wang,6 Cheuk Y. Tang,6 Olav Olsen,1
Catherine Dulac,3 Pavel Osten,4 and Marc Tessier-Lavigne1,*1Laboratory of Brain Development and Repair, The Rockefeller University, 1230 York Avenue, New York, NY 10065, USA2Center for Studies in Physics and Biology, The Rockefeller University, 1230 York Avenue, New York, NY 10065, USA3Department of Molecular and Cellular Biology, Center for Brain Science, Howard Hughes Medical Institute, Harvard University, Cambridge,
MA 02138, USA4Cold Spring Harbor Laboratories, Cold Spring Harbor, NY 11724, USA5Certerra, Cold Spring Harbor, NY 11724, USA6Department of Radiology, Mount Sinai School of Medicine, New York, NY 10029, USA7Co-first author
*Correspondence: [email protected]://dx.doi.org/10.1016/j.cell.2016.05.007
SUMMARY
Understanding how neural information is processedinphysiological andpathological stateswouldbenefitfrom precise detection, localization, and quantifi-cation of the activity of all neurons across the entirebrain, which has not, to date, been achieved inthe mammalian brain. We introduce a pipeline forhigh-speed acquisition of brain activity at cellularresolution through profiling immediate early geneexpression using immunostaining and light-sheetfluorescence imaging, followed by automated map-ping and analysis of activity by an open-source soft-ware program we term ClearMap. We validate thepipeline first by analysis of brain regions activatedin response to haloperidol. Next, we report newcortical regions downstream of whisker-evoked sen-sory processing during active exploration. Last, wecombine activity mapping with axon tracing to un-cover newbrain regionsdifferentially activatedduringparenting behavior. This pipeline is widely applicabletodifferent experimental paradigms, including animalspecies forwhich transgenic activity reporters are notreadily available.
INTRODUCTION
Neuronal activity in the brain is an ever-changing landscape.
Signals processed from the outside world and internal organs
are constantly shifting activity levels across brain regions to pro-
duce relevant responses. Significant efforts have been made in
the past decade to record large ensembles of neurons to better
understand the network dynamics underlying animal behaviors
(Keller and Ahrens, 2015), but obtaining a complete snapshot
of the activity of all neurons in the mammalian brain has yet to
be achieved. In mammals, large-scale neural activity can be re-
corded through the animal skull using electro-encephalogram
recordings or functional MRI, and single-cell recording of large
neuronal ensembles can be achieved with multi-channel silicon
probes, which provide high temporal resolution, enabling pre-
cise discrimination of neuron types by firing patterns (Berenyi
et al., 2014). Optical techniques, coupled with GCaMP calcium
probes, provide live recording of neuronal activity over larger
volumes, including activity of most neurons in zebrafish larva
brain (Ahrens et al., 2012) and several thousand neurons in the
mouse cortex (Peron et al., 2015). However, because of the
size and optical properties of the mouse brain, it is not currently
possible to image in vivo deeper than the cortex, although
deeper structures can be made accessible using fiber optics,
endoscopes (Cui et al., 2014), or by surgically removing the cor-
tex (Lovett-Barron et al., 2014), although at the expense of the
field of view.
To assess neuronal activity in regions less accessible to live
imaging, immediate early genes (IEGs) such as c-fos, whose
expression levels reflect recent changes in neuronal activity,
have often been used as proxies. The first in vivo example of
c-fos-induced expression in neurons was reported in the dorsal
horn of the spinal cord following a nociceptive stimulus (Hunt
et al., 1987). Since then, the upregulation of expression of
IEGs like c-fos, arc, egr-1, fosb, and npas4 has been used as a
surrogate for neuronal activity in most neuronal systems and in
most regions of the brain. Because they rely on translational
machinery, IEGs have low temporal resolution. Upregulation of
their expression usually lags neuronal stimulation by �30 min
and their expression can outlast the end of activity by over 4 hr
(Barnes et al., 2015), so IEGs can be considered to encode a
short-term memory trace of the activity (Denny et al., 2014).
Although highly informative (Mongeau et al., 2003), unbiased
analyses of IEGs expression in the brain are painstakingly
arduous to perform, and their low throughput limits their imple-
mentation. Serial two-photon tomography (STP) represents a
current standard for automated whole-brain histological anal-
ysis using fluorescent reporters (Ragan et al., 2012) and was
more recently used to map c-Fos expression in the mouse
brain in an automated way by imaging endogenous GFP fluores-
cence in a c-Fos-GFP reporter line to comprehensively analyze
Cell 165, 1–14, June 16, 2016 ª 2016 Elsevier Inc. 1
Please cite this article in press as: Renier et al., Mapping of Brain Activity by Automated Volume Analysis of Immediate Early Genes, Cell(2016), http://dx.doi.org/10.1016/j.cell.2016.05.007
complex social behaviors (Kim et al., 2015). However, STP to-
mography-based IEG mapping also has disadvantages. First, it
requires advanced instrumentation that is not readily available
to most laboratories. Second, there are only a few fluorescent
IEG reporter mice and these have some limitations compared
to the detection of native IEGs. For example, the Arc-GFPmouse
is a genetic knockin with only one Arc allele remaining active
(Wang et al., 2006), while the Arc-dVenus and c-Fos-GFP mice
possess transgenes with short promoters that may not exactly
replicate the intricate regulation of activity-driven induction in
all brain areas. Last, a complete recording of all c-Fos+ cells is
not possible with STP, as single 2D planes are sampled only
every 50 to 100 mm from the block, leaving undocumented
gaps between each section.
Whole-brain detection of native IEGs would allow the analysis
of IEGs for which there are no transgenic reporters and likely
improve the reliability of the detection of the arc and c-fos
gene products. In fact, whole-brain activity mapping with IEGs
without sectioning has been shown to be a powerful approach
to investigate brain regions active in freely moving zebrafish
larvae using image registration (Wee et al., 2015), but the exten-
sion of this approach to the much larger mammalian brain has
not to date been achieved.
Recently, renewed interest in tissue clearing techniques and
volume imaging has driven the development of several families
of protocols to perform histological analysis in intact samples
(Richardson and Lichtman, 2015). Those techniques are now
starting to enable the streamlined analysis of axonal projec-
tions or cell positions in intact mouse brains in a manual or
semi-automated way (Lerner et al., 2015; Menegas et al.,
2015; Schwarz et al., 2015). We reasoned that volume imaging
using light sheet fluorescence microscopy (LSFM) coupled
with tissue clearing could be a powerful alternative to STP
for imaging IEG expression in the intact brain. Imaging IEG
expression in the intact brain using the Arc-dVenus fluores-
cent reporter has been reported along the publication of the
CUBIC method and its expanded protocol (Susaki et al.,
2014, 2015).
We recently developed iDISCO, a method to immunolabel and
image large intact samples, including adult brain (Renier et al.,
2014). The ability to immunolabel many samples in parallel and
the extremely high transparency achieved makes iDISCO well-
suited to map endogenous IEG expression in all brain regions
at a higher throughput compared to STP and with greater versa-
tility, thereby complementing the use of transgenic reporters in
other whole-brain imaging methods.
To enable automated brain-wide analysis of IEGs, it was,
however, necessary to develop a new iDISCO-based pipeline
on three fronts:
d First, we improved the iDISCO protocol to reduce sample
shrinkage and better preserve brain morphology, thereby
enabling automated registration of the LSFM-imaged sam-
ple onto a reference brain atlas for automated compari-
sons; the resulting protocol is termed iDISCO+.
d Second, we optimized parameters to obtain a near
isotropic resolution of�5 mm (4.0653 4.0653 3 mm/pixel)
by horizontally scanning the light sheet over a 7 3 7 3
2 Cell 165, 1–14, June 16, 2016
6 mm region of the mouse brain in 1 hr at a cellular resolu-
tion, using an average of 20 Gb per sample.
d Third, we developed ‘‘ClearMap,’’ a computer program
based solely on open-source components and compatible
with a desktop workstation that is applied to the imaging
data to count cells in 3D, registers them onto a reference
atlas, and generates distribution maps and statistical anal-
ysis of intact mouse brains in <1 hr per sample.
The power and utility of the resulting pipeline is highlighted
here in three applications: (1) to document brain regions acti-
vated in response to an anti-psychotic drug, haloperidol; (2) to
search for brain regions differentially activated when mice
explore a new environment with or without using their whiskers;
and (3) to correlate neuronal projections with activity, illustrated
by tracing projections from the galanin-expressing neurons of
the medial pre-optic area to map activity in its target regions
during parenting behavior in the mouse.
RESULTS
Imaging and Registration of IEGs in the Mouse BrainThe original iDISCO protocol for immunolabeling and brain
clearing permits detection of immunolabeled structures
throughout the intact adult mouse brain and is compatible
with a wide variety of antibodies to diverse epitopes (Renier
et al., 2014). In particular, it is compatible with antibodies
that detect a variety of IEGs (see below). Specific signals are
detected using secondary antibodies coupled to Alexa fluoro-
phores that emit in the far-red spectrum (647 nm laser exci-
tation), to which the cleared brain is essentially transparent
(Renier et al., 2014). In the blue-green spectrum (480 nm
laser excitation), intrinsic tissue fluorescence highlights the
major structures in the brain, such as myelinated tracts, cortical
regions, and various deep nuclei (Figures 1B and S1A), thus
providing a counterstain without the need for counterstaining
(Movie S1).
Building on iDISCO, we developed ClearMap, a cell detection
and registration pipeline outlined in Figure 1A and Movie S2,
which relies on key improvements in iDISCO sample preparation
and imaging procedures, as follows.
First, we optimized imaging conditions to achieve the minimal
x,y,z pixel size of 4.063 4.063 3 mm/pixel necessary to image a
large field of view at cellular resolution while still preserving
acquisition speed and a relatively low data footprint (see Exper-
imental Procedures and Figure S1). We found that imaging at
1.63with a 23 0.5NA objective and continuous horizontal scan-
ning of the light sheet provided a resolution sufficient to image
single c-Fos positive cells within the sharp center of the lens,
which covers the length of the entire mouse forebrain in sagittal
orientation (Figure S1A). At this magnification, the optical
maximal resolution is almost isotropic at the center of the imag-
ing lens (Figures 1E and S2) so that images acquired in one plane
can be combined to give an undistorted representation in the
other orthogonal planes. The measured z resolution (thickness)
of the light sheet at the numerical aperture used (0.1) is �5 mm
at its thinnest point (LaVision Biotec’s information). To maximize
the z resolution throughout the dorso-ventral length of the brain,
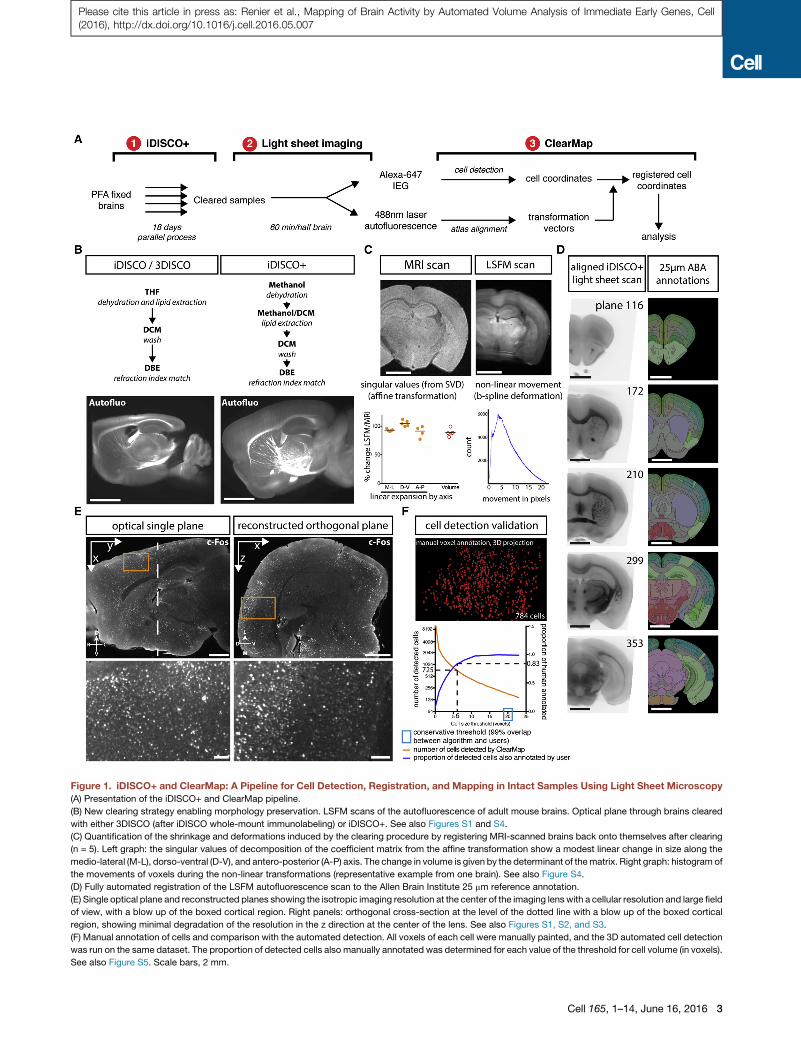
Figure 1. iDISCO+ and ClearMap: A Pipeline for Cell Detection, Registration, and Mapping in Intact Samples Using Light Sheet Microscopy
(A) Presentation of the iDISCO+ and ClearMap pipeline.
(B) New clearing strategy enabling morphology preservation. LSFM scans of the autofluorescence of adult mouse brains. Optical plane through brains cleared
with either 3DISCO (after iDISCO whole-mount immunolabeling) or iDISCO+. See also Figures S1 and S4.
(C) Quantification of the shrinkage and deformations induced by the clearing procedure by registering MRI-scanned brains back onto themselves after clearing
(n = 5). Left graph: the singular values of decomposition of the coefficient matrix from the affine transformation show a modest linear change in size along the
medio-lateral (M-L), dorso-ventral (D-V), and antero-posterior (A-P) axis. The change in volume is given by the determinant of thematrix. Right graph: histogram of
the movements of voxels during the non-linear transformations (representative example from one brain). See also Figure S4.
(D) Fully automated registration of the LSFM autofluorescence scan to the Allen Brain Institute 25 mm reference annotation.
(E) Single optical plane and reconstructed planes showing the isotropic imaging resolution at the center of the imaging lenswith a cellular resolution and large field
of view, with a blow up of the boxed cortical region. Right panels: orthogonal cross-section at the level of the dotted line with a blow up of the boxed cortical
region, showing minimal degradation of the resolution in the z direction at the center of the lens. See also Figures S1, S2, and S3.
(F) Manual annotation of cells and comparison with the automated detection. All voxels of each cell were manually painted, and the 3D automated cell detection
was run on the same dataset. The proportion of detected cells also manually annotated was determined for each value of the threshold for cell volume (in voxels).
See also Figure S5. Scale bars, 2 mm.
Cell 165, 1–14, June 16, 2016 3
Please cite this article in press as: Renier et al., Mapping of Brain Activity by Automated Volume Analysis of Immediate Early Genes, Cell(2016), http://dx.doi.org/10.1016/j.cell.2016.05.007
Please cite this article in press as: Renier et al., Mapping of Brain Activity by Automated Volume Analysis of Immediate Early Genes, Cell(2016), http://dx.doi.org/10.1016/j.cell.2016.05.007
the thinnest focal point of the light sheet was horizontally
scanned, and a composite image was created for each plane
by using a contrast projection, thus circumventing the Gaussian
shape of the beam. While the camera sensor field of view
(10.4 mm in length) and the tiling of three parallel light sheets
covers the mouse brain in sagittal orientation from the cere-
bellum to the olfactory bulb, the sharp center of the imaging
lens covers a smaller region (7.2 mm in length), which limits the
region covered by one tile to the forebrain excluding the olfactory
bulbs (Figure S3A). However, the consistency of the sharpness
and signal intensity for detected cells throughout this region
suggested that it could be possible to build a robust pipeline to
automatically analyze the distribution of IEGs within the brain
(Figures S1B and S1C).
Second, several efficient 3D image registration software pack-
ages have recently been developed. As mentioned, the intrinsic
tissue fluorescence highlightingmajor structures (Figures 1B and
S1A) offers enough detail and contrast to allow in principle for
automated registration of scans using signals harvested with
the 480 nm laser excitation. However, tissue distortion due to
shrinkage during 3DISCO (Erturk et al., 2012) clearing (when
used after the iDISCO staining) precluded automated image
registration (Menegas et al., 2015) (Figure 1B).We traced thema-
jor source of shrinkage to tetrahydrofuran used in the 3DISCO
protocol and were able to modify the protocol to dispense with
this chemical, replacing it with a combination of methanol and
dichloromethane (Figure 1B). With this novel iDISCO protocol,
which we term iDISCO+, only minor tissue deformation occurred
(see below). The clearing performance of iDISCO+ enables
imaging of c-Fos+ cells with a consistent signal throughout the
working distance of the objective, well over 6 mm deep in the
tissue (Figures S1A and S1B). There was no drop in the number
of c-Fos+ cells detected throughout the imaging depth, as the
density of c-Fos+ cells was identical on both sides of the midline
(Figure S1B). We verified that the new clearing protocol remains
compatible with all tissues and has an identical clearing perfor-
mance to that seen with iDISCO/3DISCO (Figure S4G and data
not shown).
The ClearMap pipeline includes interfaces to the Elastix open-
source software (Klein et al., 2010; Shamonin et al., 2014) to
automatically register the iDISCO+ light sheet scans, as previ-
ously developed for STP-imaged mouse brains (Kim et al.,
2015). We quantified the extent of deformation by registering
light-sheet scans of cleared half-brains to matched MRI scans
of the same samples (Figures 1C, S4A, and S4B). The optimized
affine transformation coefficients determined by Elastix indicate
a modest linear reduction in size of 7% and 9% in the medio-
lateral and rostro-caudal axis respectively and a small linear
expansion of 5% along the dorso-ventral axis (n = 5). The overall
volume shrinkage as determined by the determinant of the
transformation matrix was 11%, down from the reported 50%
shrinkage observed with the original 3DISCO clearing protocol
(Richardson and Lichtman, 2015). For whole brains, which
require a little distortion to fit in theMRI tube, we observed similar
but smaller coefficients when registering whole brains to the STP
reference atlas (5% volume difference, n = 6, Figure S4B), sug-
gesting that whole-brain morphology may be better preserved
during clearing. The average displacement after applying the
4 Cell 165, 1–14, June 16, 2016
optimized non-linear (b-spline) transformation from the sample
to the reference was 4 voxels (Figure 1C). Most of the non-linear
transformations corrected for a small expansion of the ventricu-
lar volume and adjustment of the cortical curvature. The new
clearing protocol therefore enabled image registration of the
cleared samples datasets to the STP reference (STPR) mouse
brain aligned to the Allen Brain 25 mm reference Atlas, whereas
the original clearing protocol would have required custom refer-
ence Atlases (Kim et al., 2015) (Figures 1D and S4D–S4F).
We next developed a complete suite of open-source image
processing tools within our modular ClearMap software to
detect cells in 3D and register their coordinates onto the refer-
ence atlas, which has a similar workflow to previously used anal-
ysis pipelines (Kim et al., 2015; Menegas et al., 2015) and runs
under 90 min per brain in fully automated fashion on a desktop
workstation, facilitated by our optimized 3D cell detection algo-
rithm and compact dataset. To validate the detected accuracy,
the cell detection was run on a dataset for which positive cell
voxels were manually annotated by two users. The filters and
threshold were tuned until the disagreement ratio between the
manual and automated annotation was similar to the ratio be-
tween the two users (Figures 1F and S5C; Supplemental Exper-
imental Procedures).
As iDISCO+ relies on immunostaining, it offers flexibility when
choosing the IEGs used tomap brain activity. To test the ability of
the method to detect the induction of known IEGs, we relied on
activity evoked in the barrel cortex by whisker stimulation as a
tool to validate antibodies for c-Fos, Arc, Egr-1, Phospho-S6,
and Npas4. Cortical Layer 4 neurons receiving inputs from the
large mystacial whiskers on the snout are topographically orga-
nized in the barrel cortex. Their map can be readily visualized
using intrinsic tissue fluorescence, which is preserved in the
blue-green spectrum in the iDISCO+ protocol. We trimmed all
whiskers except select rows or arcs; exposed animals for 1 hr
to an enriched environment in which the remaining whiskers
were stimulated as the animals explored; processed brains using
the iDISCO+ protocol with each of the antibodies, using second-
ary antibodies conjugated to a fluorophore that emits in the
far-red spectrum; and manually segmented cortical layers to
visualize the activity map of the barrel cortex in a virtual projec-
tion of layer 4, or as a virtual section along the remaining row
or arc (Figures 2A and 2B). The IEGs tested all showed increased
staining in the stimulated rows or arcs (B row shown in Figure 2).
Of those tested, in this system, c-Fos and Phospho-S6 showed
the highest induction in labeled cell density between stimulated
and deprived barrels (4.1 and 6, respectively, ratio of the number
of cells at the center of B2 over C2). Egr-1 had the highest base-
line activity (ratio of 1.3). Arc showed a banded pattern by
cortical layers (high expression in layers 6, 4, 3, and 2) and an in-
duction ratio of 1.7 in this paradigm (Figure 2C). Npas4 showed
modest upregulation of expression 30 min and 1 hr after stimu-
lation (2.2 and 2.1, respectively) (Figures 2A and 2B), well within
the induction window reported in vivo for the cortex (Lin et al.,
2008; Spiegel et al., 2014).
We then used ClearMap to analyze the data obtained with
whisker trimming and stimulation for all IEGs and different com-
binations of rows and arcs and were able to detect the increased
cell density in the corresponding stimulated barrels for various
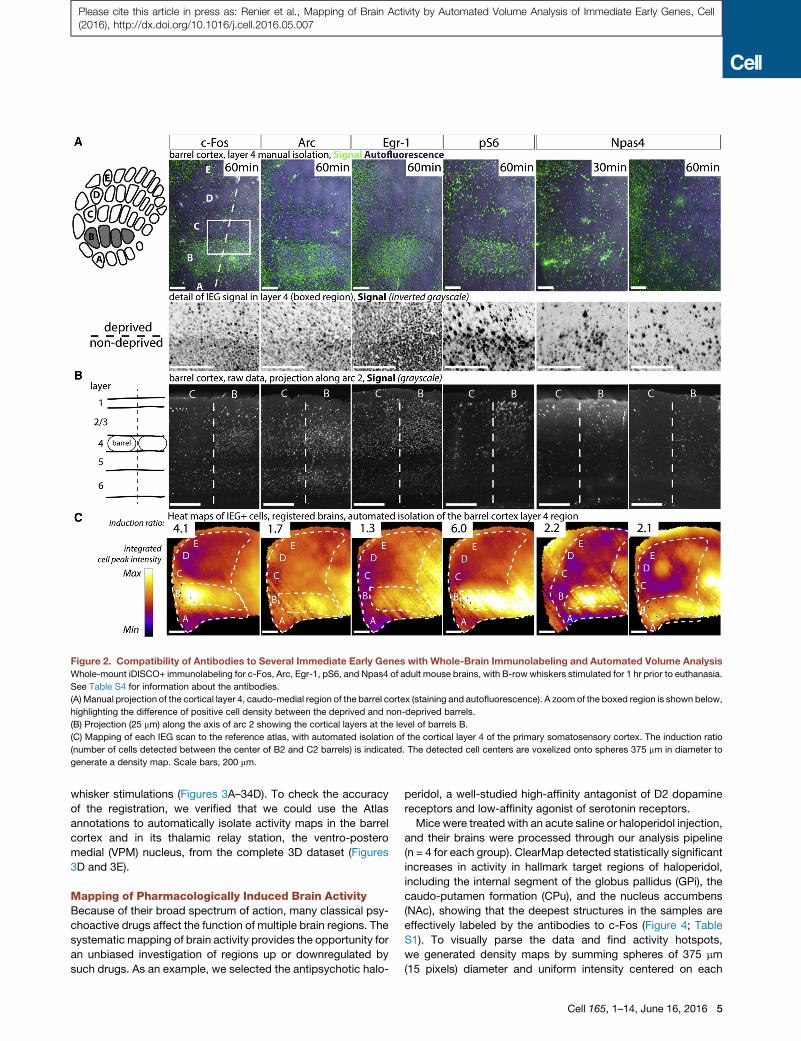
Figure 2. Compatibility of Antibodies to Several Immediate Early Genes with Whole-Brain Immunolabeling and Automated Volume Analysis
Whole-mount iDISCO+ immunolabeling for c-Fos, Arc, Egr-1, pS6, and Npas4 of adult mouse brains, with B-row whiskers stimulated for 1 hr prior to euthanasia.
See Table S4 for information about the antibodies.
(A) Manual projection of the cortical layer 4, caudo-medial region of the barrel cortex (staining and autofluorescence). A zoom of the boxed region is shown below,
highlighting the difference of positive cell density between the deprived and non-deprived barrels.
(B) Projection (25 mm) along the axis of arc 2 showing the cortical layers at the level of barrels B.
(C) Mapping of each IEG scan to the reference atlas, with automated isolation of the cortical layer 4 of the primary somatosensory cortex. The induction ratio
(number of cells detected between the center of B2 and C2 barrels) is indicated. The detected cell centers are voxelized onto spheres 375 mm in diameter to
generate a density map. Scale bars, 200 mm.
Please cite this article in press as: Renier et al., Mapping of Brain Activity by Automated Volume Analysis of Immediate Early Genes, Cell(2016), http://dx.doi.org/10.1016/j.cell.2016.05.007
whisker stimulations (Figures 3A–34D). To check the accuracy
of the registration, we verified that we could use the Atlas
annotations to automatically isolate activity maps in the barrel
cortex and in its thalamic relay station, the ventro-postero
medial (VPM) nucleus, from the complete 3D dataset (Figures
3D and 3E).
Mapping of Pharmacologically Induced Brain ActivityBecause of their broad spectrum of action, many classical psy-
choactive drugs affect the function of multiple brain regions. The
systematic mapping of brain activity provides the opportunity for
an unbiased investigation of regions up or downregulated by
such drugs. As an example, we selected the antipsychotic halo-
peridol, a well-studied high-affinity antagonist of D2 dopamine
receptors and low-affinity agonist of serotonin receptors.
Mice were treated with an acute saline or haloperidol injection,
and their brains were processed through our analysis pipeline
(n = 4 for each group). ClearMap detected statistically significant
increases in activity in hallmark target regions of haloperidol,
including the internal segment of the globus pallidus (GPi), the
caudo-putamen formation (CPu), and the nucleus accumbens
(NAc), showing that the deepest structures in the samples are
effectively labeled by the antibodies to c-Fos (Figure 4; Table
S1). To visually parse the data and find activity hotspots,
we generated density maps by summing spheres of 375 mm
(15 pixels) diameter and uniform intensity centered on each
Cell 165, 1–14, June 16, 2016 5
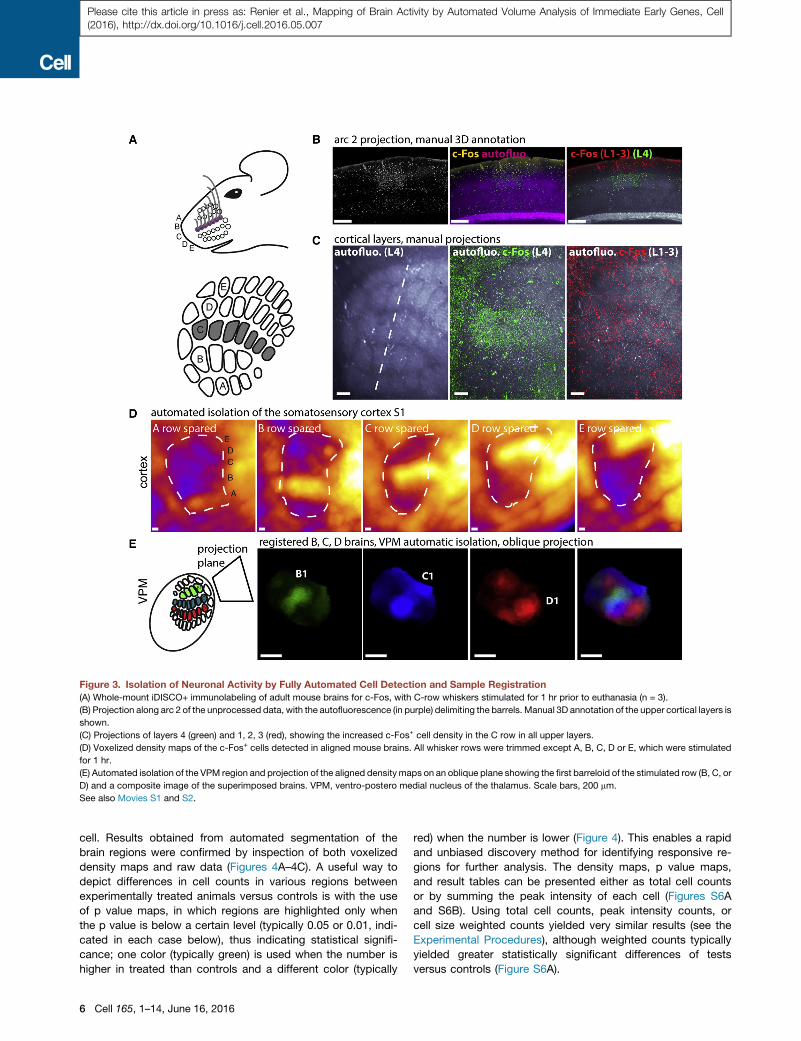
Figure 3. Isolation of Neuronal Activity by Fully Automated Cell Detection and Sample Registration
(A) Whole-mount iDISCO+ immunolabeling of adult mouse brains for c-Fos, with C-row whiskers stimulated for 1 hr prior to euthanasia (n = 3).
(B) Projection along arc 2 of the unprocessed data, with the autofluorescence (in purple) delimiting the barrels. Manual 3D annotation of the upper cortical layers is
shown.
(C) Projections of layers 4 (green) and 1, 2, 3 (red), showing the increased c-Fos+ cell density in the C row in all upper layers.
(D) Voxelized density maps of the c-Fos+ cells detected in aligned mouse brains. All whisker rows were trimmed except A, B, C, D or E, which were stimulated
for 1 hr.
(E) Automated isolation of the VPM region and projection of the aligned densitymaps on an oblique plane showing the first barreloid of the stimulated row (B, C, or
D) and a composite image of the superimposed brains. VPM, ventro-postero medial nucleus of the thalamus. Scale bars, 200 mm.
See also Movies S1 and S2.
Please cite this article in press as: Renier et al., Mapping of Brain Activity by Automated Volume Analysis of Immediate Early Genes, Cell(2016), http://dx.doi.org/10.1016/j.cell.2016.05.007
cell. Results obtained from automated segmentation of the
brain regions were confirmed by inspection of both voxelized
density maps and raw data (Figures 4A–4C). A useful way to
depict differences in cell counts in various regions between
experimentally treated animals versus controls is with the use
of p value maps, in which regions are highlighted only when
the p value is below a certain level (typically 0.05 or 0.01, indi-
cated in each case below), thus indicating statistical signifi-
cance; one color (typically green) is used when the number is
higher in treated than controls and a different color (typically
6 Cell 165, 1–14, June 16, 2016
red) when the number is lower (Figure 4). This enables a rapid
and unbiased discovery method for identifying responsive re-
gions for further analysis. The density maps, p value maps,
and result tables can be presented either as total cell counts
or by summing the peak intensity of each cell (Figures S6A
and S6B). Using total cell counts, peak intensity counts, or
cell size weighted counts yielded very similar results (see the
Experimental Procedures), although weighted counts typically
yielded greater statistically significant differences of tests
versus controls (Figure S6A).
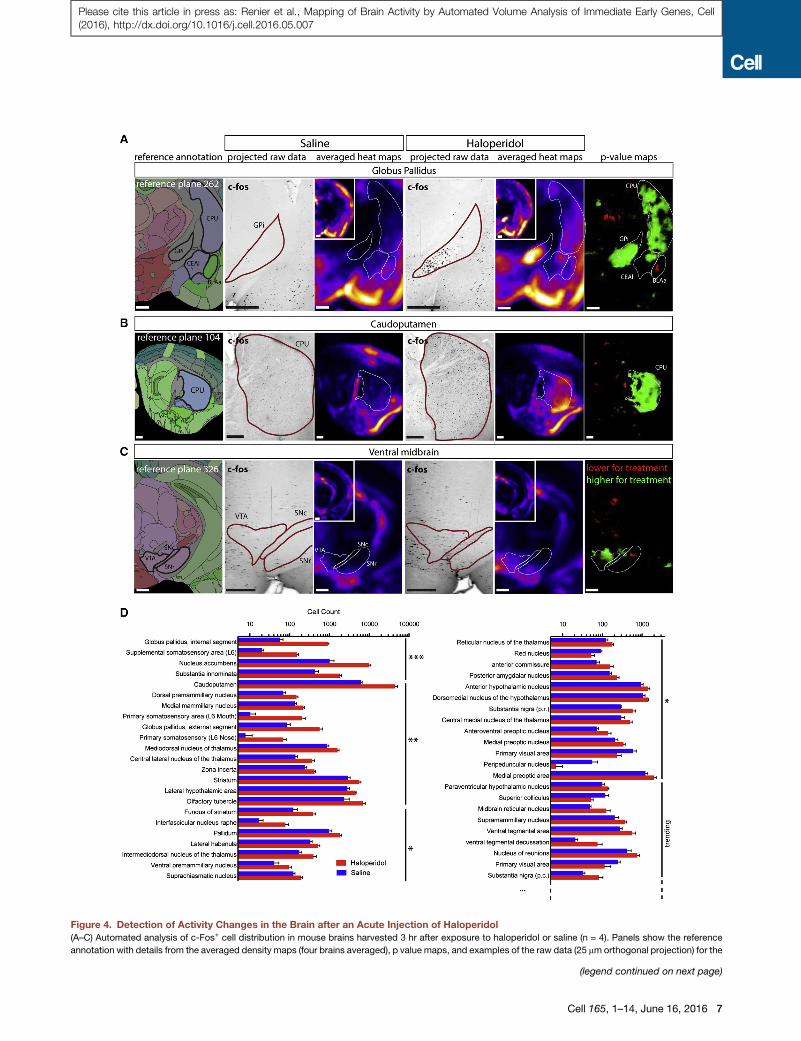
Figure 4. Detection of Activity Changes in the Brain after an Acute Injection of Haloperidol
(A–C) Automated analysis of c-Fos+ cell distribution in mouse brains harvested 3 hr after exposure to haloperidol or saline (n = 4). Panels show the reference
annotation with details from the averaged density maps (four brains averaged), p value maps, and examples of the raw data (25 mmorthogonal projection) for the
(legend continued on next page)
Cell 165, 1–14, June 16, 2016 7
Please cite this article in press as: Renier et al., Mapping of Brain Activity by Automated Volume Analysis of Immediate Early Genes, Cell(2016), http://dx.doi.org/10.1016/j.cell.2016.05.007
Please cite this article in press as: Renier et al., Mapping of Brain Activity by Automated Volume Analysis of Immediate Early Genes, Cell(2016), http://dx.doi.org/10.1016/j.cell.2016.05.007
These analysis tools again highlighted known areas of c-Fos
induction and also identified many others of interest (Figure 4;
Table S1). Interestingly, a few nuclei in Table S1, such as the
ventral tegmental area (VTA), that trended toward significance
but failed to achieve it had, in fact, a significantly higher activity
restricted to a sub-region of the nucleus (here, the lateral part
of the VTA) when manually inspected on the density map (Fig-
ures 4C and 4D); the failure to achieve significance across the
entire subregion presumably reflects a localized increase in
c-Fos activation within the larger, otherwise unchanged subre-
gion. The single cell resolution of our method thus enabled us
to detect a change in the detailed activation pattern of a nucleus.
Mapping of Cortical Activity during an Exploration TaskLive recording of whole mammalian brain activity is not possible
for behaviors involving active exploration, and IEGs can provide
a simple solution to map brain activity in freely moving mice. To
demonstrate this, we chose to look for brain regions differentially
regulated when mice explore a new environment with or without
their whiskers. Mice had all whiskers either trimmed or spared,
were transferred to an empty cage in the dark for 24 hr, after
which they were transferred to a new cage containing an en-
riched environment for 1 hr in the dark and then sacrificed.
Automated isolation of cortical regions was performed using
ClearMap, (Figure 5A) to display averaged density maps as well
as their variability shown as standard deviation (SD) maps for
both groups.While themapped values for SD are naturally higher
in active regions, they provide a visual way to assess the vari-
ability and significance of activity differences between groups
(see Figure 5C). As expected, in the shaved group, c-Fos positive
neuron density was significantly reduced in the caudo-medial re-
gion of the barrel cortex, the region of the brain that receives input
from the whiskers and also in a patch at the center of the primary
motor cortex that controlswhiskermovements (Figure 5A).More-
over, activity in the dorso-medial part of the VPM of the thalamus
(relaying whisker input from the brainstem to the cortex) was also
reduced in the shavedgroup,while other parts of theVPMandPO
nucleus (receiving inputs from other parts of the body) had higher
densities of active neurons (Figure 5B). There is a strong cross-
regulation in the cortex between different sensory modalities
(He et al., 2012), and we indeed recorded significant differences
in the primary auditory and piriform cortex between shaved and
non-shaved groups but not in the visual cortex (as expected,
since the experiment was performed in the dark) (Figure 5A).
Interestingly, we noticed a significant depression of the activity
in the anterior part of the agranular insular cortex in the shaved
animals (Figure 5C), a region not traditionally associated with
the sensory integration of whisker-evoked signals. We also
observed increased activity in shaved animals in the regions of
the somatosensory cortex associated with the nose and mouth
following regions: (A) globus pallidus, internal segment with the central amygda
ventral tegmental area and substantia nigra.
(D) Automated segmentation of the cell counts by anatomical regions sorted by p
(***p < 0.001, **p < 0.01, *p < 0.05). See also Figure S6. BLAa, basolateral amyg
nucleus; FS, fondus of the striatum; GP, globus pallidus internal or external segm
stantia nigra, pars compacta, or reticulata; VTA, ventral tegmental area. Scale ba
See also Table S1.
8 Cell 165, 1–14, June 16, 2016
(Figure 5A), which suggests that, lacking whiskers, the shaved
animals instead actively explored the enriched environment by
touching objects with those regions of their faces.
Activity Mapping with Axonal Tracing to InvestigateParental BehaviorWhile IEG maps obtained from electrical, optogenetic, or phar-
macological stimulation of specific brain nuclei can provide a
good indication that the activity detected arises from connected
regions (Bepari et al., 2012),maps derived fromnatural behaviors
cannot provide a definitive indication about the functional rela-
tionships between the active regions. Therefore, it is useful to
combine axon tracing with IEG mapping, to determine whether
regions connected by specific axonal projections show correla-
tion (or anti-correlation) in IEG expression, indicative of poten-
tially functional links.
Parental care is a critical behavior hard-wired in themammalian
brain, showing sexual dimorphism in both activity patterns and
connectivity (Dulac et al., 2014). Previous work has shown that
in laboratory mice, virgin males are aggressive toward pups
and switch to parenting behavior after mating (vom Saal, 1985;
Tachikawa et al., 2013). The activity of a group of galanin-ex-
pressing neurons located in the medial pre-optic nucleus (MPO)
in the hypothalamus has been shown to drive this behavior (Wu
et al., 2014). We examined the 3D c-Fos expression patterns in
parenting females (n = 3) and infanticidal males (n = 6), compared
to their respective controls (n = 6 for each group). The ventral side
of thebrain showedacleardichotomy in thedistributionof activity
between females and males in the hypothalamus (Figure 6A).
Females showed a higher density of activated neurons in the
anterior region of the hypothalamus, while the posterior hypotha-
lamic region was more active in males. Indeed, as previously
described (Wu et al., 2014), the density of active neurons was
lower in the MPO in virgin males and control females than in
parenting females (Figure 6B), while the opposite was observed
in theDMHandPHnuclei (Figure S7A). The number of active neu-
ronswasalsohigher in theMPOof aggressivemalescompared to
control males, although not as high as in parenting females (Fig-
ure 6B). It is possible that the active neurons of the MPO in infan-
ticidal males are a different population than the Gal+ neurons
active in parenting females. Indeed, the activity patterns in the
MPO appear complementary between parenting females and
infanticidal males (Figure 6B). The bed nucleus of the stria termi-
nalis also showed an interesting dichotomy, with more active
neurons found ventral to the anterior commissure in parenting fe-
males while the dorsal side wasmore active in infanticidal males.
To test whether we could correlate the activity ofMPOneurons
during parenting tasks to amodulation of activity in other regions
of the brain, we injected a floxed eYFP expressing virus into the
MPOof Gal::Cre virgin females and virgin males. Using iDISCO+,
la and striatum (coronal projections), (B) striatum (sagittal projection), and (C)
values. Data are represented as mean ± SEM. The top hits are presented here
dala, anterior part; CEAl, central amygdala, lateral part; CPU, caudoputamen
ent; MD, thalamic mediodorsal nucleus; NAc, nucleus accumbens; SN, sub-
rs, 500 mm.
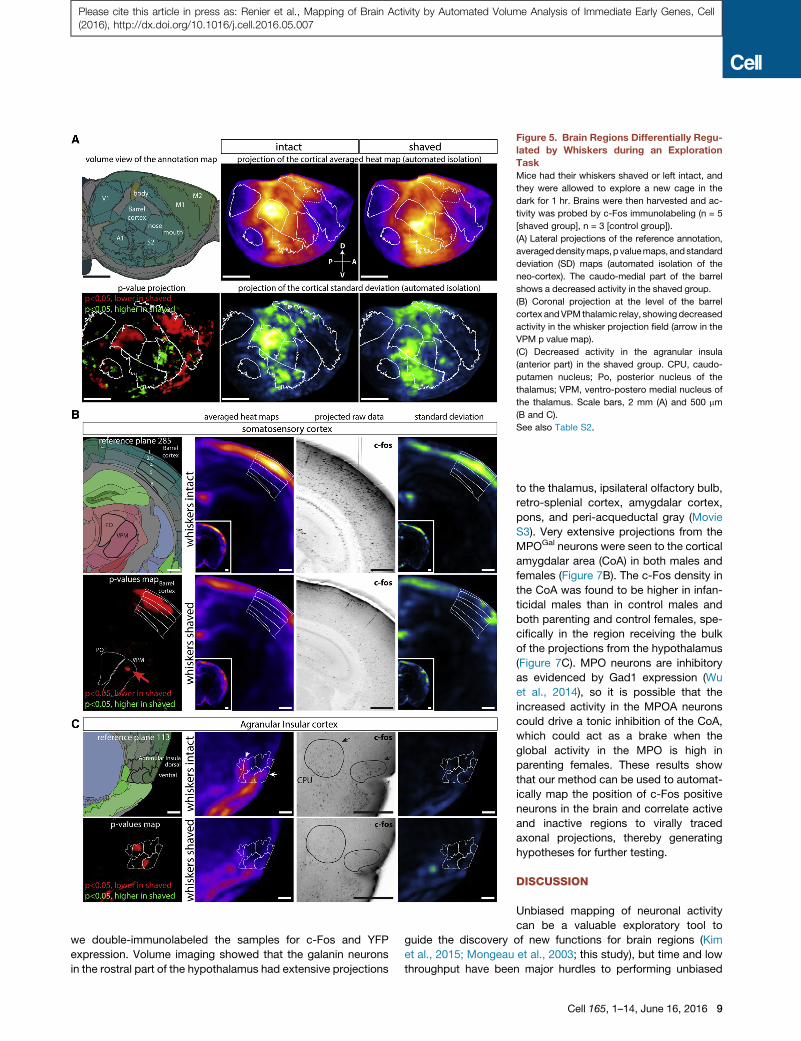
Figure 5. Brain Regions Differentially Regu-
lated by Whiskers during an Exploration
Task
Mice had their whiskers shaved or left intact, and
they were allowed to explore a new cage in the
dark for 1 hr. Brains were then harvested and ac-
tivity was probed by c-Fos immunolabeling (n = 5
[shaved group], n = 3 [control group]).
(A) Lateral projections of the reference annotation,
averageddensitymaps,p valuemaps, andstandard
deviation (SD) maps (automated isolation of the
neo-cortex). The caudo-medial part of the barrel
shows a decreased activity in the shaved group.
(B) Coronal projection at the level of the barrel
cortex andVPMthalamic relay, showingdecreased
activity in the whisker projection field (arrow in the
VPM p value map).
(C) Decreased activity in the agranular insula
(anterior part) in the shaved group. CPU, caudo-
putamen nucleus; Po, posterior nucleus of the
thalamus; VPM, ventro-postero medial nucleus of
the thalamus. Scale bars, 2 mm (A) and 500 mm
(B and C).
See also Table S2.
Please cite this article in press as: Renier et al., Mapping of Brain Activity by Automated Volume Analysis of Immediate Early Genes, Cell(2016), http://dx.doi.org/10.1016/j.cell.2016.05.007
we double-immunolabeled the samples for c-Fos and YFP
expression. Volume imaging showed that the galanin neurons
in the rostral part of the hypothalamus had extensive projections
to the thalamus, ipsilateral olfactory bulb,
retro-splenial cortex, amygdalar cortex,
pons, and peri-acqueductal gray (Movie
S3). Very extensive projections from the
MPOGal neurons were seen to the cortical
amygdalar area (CoA) in both males and
females (Figure 7B). The c-Fos density in
the CoA was found to be higher in infan-
ticidal males than in control males and
both parenting and control females, spe-
cifically in the region receiving the bulk
of the projections from the hypothalamus
(Figure 7C). MPO neurons are inhibitory
as evidenced by Gad1 expression (Wu
et al., 2014), so it is possible that the
increased activity in the MPOA neurons
could drive a tonic inhibition of the CoA,
which could act as a brake when the
global activity in the MPO is high in
parenting females. These results show
that our method can be used to automat-
ically map the position of c-Fos positive
neurons in the brain and correlate active
and inactive regions to virally traced
axonal projections, thereby generating
hypotheses for further testing.
DISCUSSION
Unbiased mapping of neuronal activity
can be a valuable exploratory tool to
guide the discovery of new functions for brain regions (Kim
et al., 2015; Mongeau et al., 2003; this study), but time and low
throughput have been major hurdles to performing unbiased
Cell 165, 1–14, June 16, 2016 9
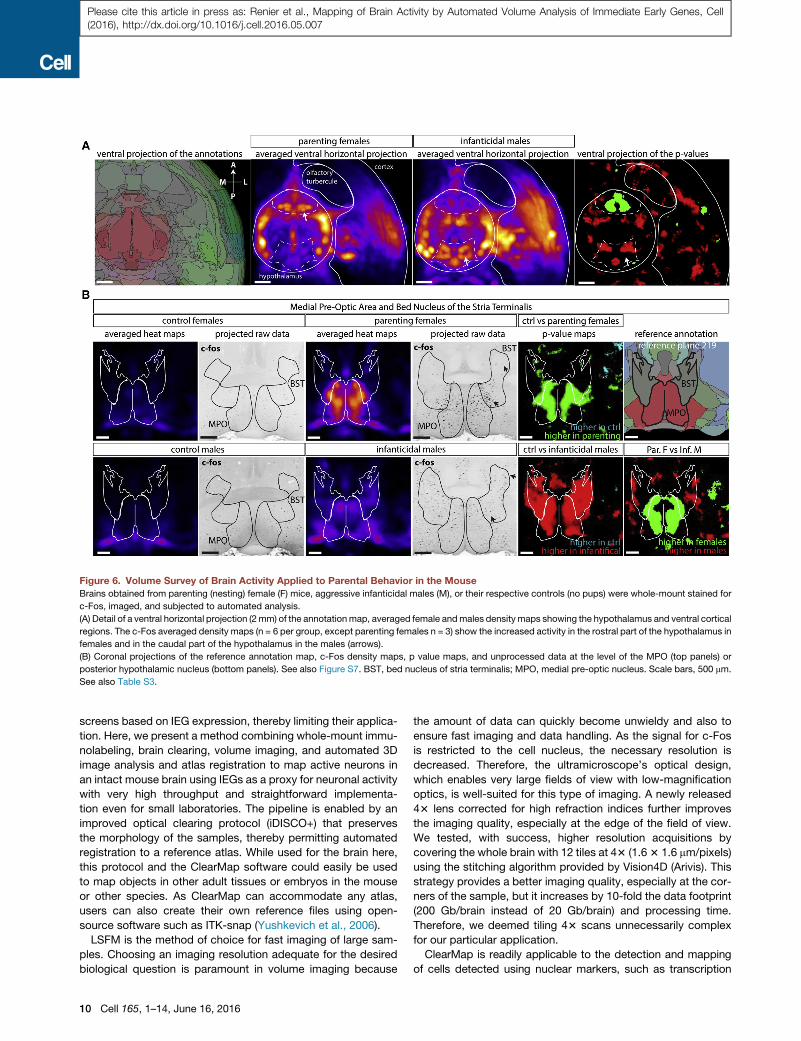
Figure 6. Volume Survey of Brain Activity Applied to Parental Behavior in the Mouse
Brains obtained from parenting (nesting) female (F) mice, aggressive infanticidal males (M), or their respective controls (no pups) were whole-mount stained for
c-Fos, imaged, and subjected to automated analysis.
(A) Detail of a ventral horizontal projection (2mm) of the annotation map, averaged female andmales density maps showing the hypothalamus and ventral cortical
regions. The c-Fos averaged density maps (n = 6 per group, except parenting females n = 3) show the increased activity in the rostral part of the hypothalamus in
females and in the caudal part of the hypothalamus in the males (arrows).
(B) Coronal projections of the reference annotation map, c-Fos density maps, p value maps, and unprocessed data at the level of the MPO (top panels) or
posterior hypothalamic nucleus (bottom panels). See also Figure S7. BST, bed nucleus of stria terminalis; MPO, medial pre-optic nucleus. Scale bars, 500 mm.
See also Table S3.
Please cite this article in press as: Renier et al., Mapping of Brain Activity by Automated Volume Analysis of Immediate Early Genes, Cell(2016), http://dx.doi.org/10.1016/j.cell.2016.05.007
screens based on IEG expression, thereby limiting their applica-
tion. Here, we present a method combining whole-mount immu-
nolabeling, brain clearing, volume imaging, and automated 3D
image analysis and atlas registration to map active neurons in
an intact mouse brain using IEGs as a proxy for neuronal activity
with very high throughput and straightforward implementa-
tion even for small laboratories. The pipeline is enabled by an
improved optical clearing protocol (iDISCO+) that preserves
the morphology of the samples, thereby permitting automated
registration to a reference atlas. While used for the brain here,
this protocol and the ClearMap software could easily be used
to map objects in other adult tissues or embryos in the mouse
or other species. As ClearMap can accommodate any atlas,
users can also create their own reference files using open-
source software such as ITK-snap (Yushkevich et al., 2006).
LSFM is the method of choice for fast imaging of large sam-
ples. Choosing an imaging resolution adequate for the desired
biological question is paramount in volume imaging because
10 Cell 165, 1–14, June 16, 2016
the amount of data can quickly become unwieldy and also to
ensure fast imaging and data handling. As the signal for c-Fos
is restricted to the cell nucleus, the necessary resolution is
decreased. Therefore, the ultramicroscope’s optical design,
which enables very large fields of view with low-magnification
optics, is well-suited for this type of imaging. A newly released
43 lens corrected for high refraction indices further improves
the imaging quality, especially at the edge of the field of view.
We tested, with success, higher resolution acquisitions by
covering the whole brain with 12 tiles at 43 (1.63 1.6 mm/pixels)
using the stitching algorithm provided by Vision4D (Arivis). This
strategy provides a better imaging quality, especially at the cor-
ners of the sample, but it increases by 10-fold the data footprint
(200 Gb/brain instead of 20 Gb/brain) and processing time.
Therefore, we deemed tiling 43 scans unnecessarily complex
for our particular application.
ClearMap is readily applicable to the detection and mapping
of cells detected using nuclear markers, such as transcription
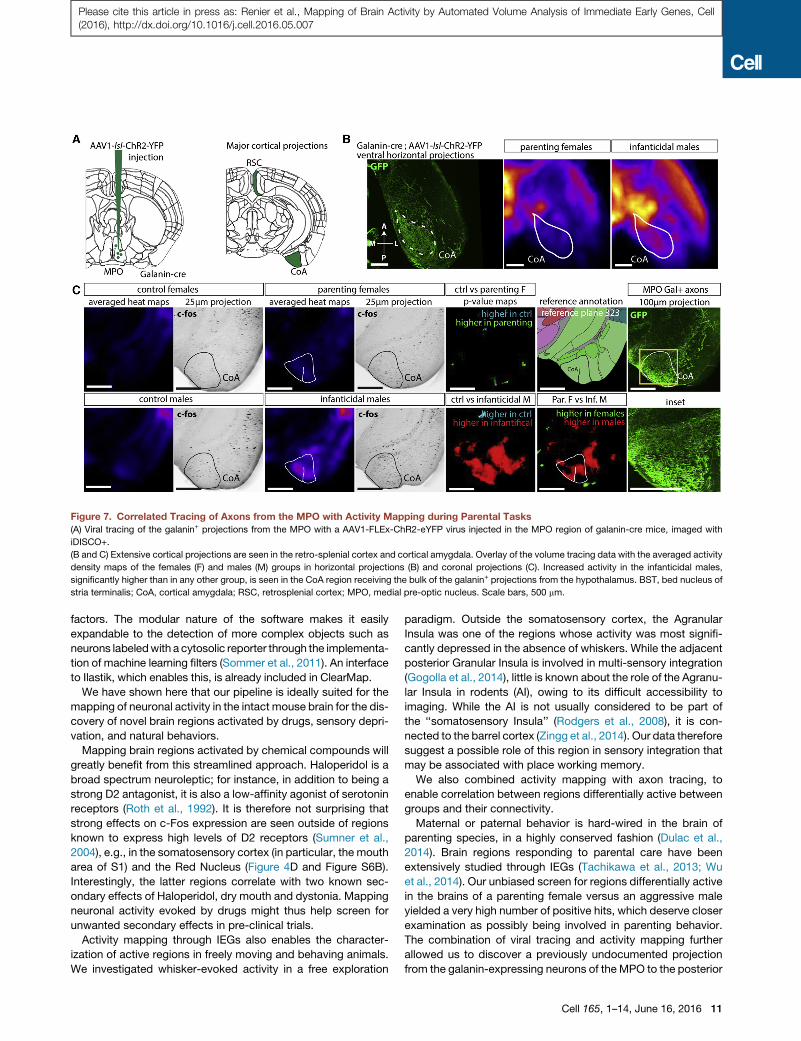
Figure 7. Correlated Tracing of Axons from the MPO with Activity Mapping during Parental Tasks
(A) Viral tracing of the galanin+ projections from the MPO with a AAV1-FLEx-ChR2-eYFP virus injected in the MPO region of galanin-cre mice, imaged with
iDISCO+.
(B and C) Extensive cortical projections are seen in the retro-splenial cortex and cortical amygdala. Overlay of the volume tracing data with the averaged activity
density maps of the females (F) and males (M) groups in horizontal projections (B) and coronal projections (C). Increased activity in the infanticidal males,
significantly higher than in any other group, is seen in the CoA region receiving the bulk of the galanin+ projections from the hypothalamus. BST, bed nucleus of
stria terminalis; CoA, cortical amygdala; RSC, retrosplenial cortex; MPO, medial pre-optic nucleus. Scale bars, 500 mm.
Please cite this article in press as: Renier et al., Mapping of Brain Activity by Automated Volume Analysis of Immediate Early Genes, Cell(2016), http://dx.doi.org/10.1016/j.cell.2016.05.007
factors. The modular nature of the software makes it easily
expandable to the detection of more complex objects such as
neurons labeledwith a cytosolic reporter through the implementa-
tion of machine learning filters (Sommer et al., 2011). An interface
to Ilastik, which enables this, is already included in ClearMap.
We have shown here that our pipeline is ideally suited for the
mapping of neuronal activity in the intact mouse brain for the dis-
covery of novel brain regions activated by drugs, sensory depri-
vation, and natural behaviors.
Mapping brain regions activated by chemical compounds will
greatly benefit from this streamlined approach. Haloperidol is a
broad spectrum neuroleptic; for instance, in addition to being a
strong D2 antagonist, it is also a low-affinity agonist of serotonin
receptors (Roth et al., 1992). It is therefore not surprising that
strong effects on c-Fos expression are seen outside of regions
known to express high levels of D2 receptors (Sumner et al.,
2004), e.g., in the somatosensory cortex (in particular, the mouth
area of S1) and the Red Nucleus (Figure 4D and Figure S6B).
Interestingly, the latter regions correlate with two known sec-
ondary effects of Haloperidol, dry mouth and dystonia. Mapping
neuronal activity evoked by drugs might thus help screen for
unwanted secondary effects in pre-clinical trials.
Activity mapping through IEGs also enables the character-
ization of active regions in freely moving and behaving animals.
We investigated whisker-evoked activity in a free exploration
paradigm. Outside the somatosensory cortex, the Agranular
Insula was one of the regions whose activity was most signifi-
cantly depressed in the absence of whiskers. While the adjacent
posterior Granular Insula is involved in multi-sensory integration
(Gogolla et al., 2014), little is known about the role of the Agranu-
lar Insula in rodents (AI), owing to its difficult accessibility to
imaging. While the AI is not usually considered to be part of
the ‘‘somatosensory Insula’’ (Rodgers et al., 2008), it is con-
nected to the barrel cortex (Zingg et al., 2014). Our data therefore
suggest a possible role of this region in sensory integration that
may be associated with place working memory.
We also combined activity mapping with axon tracing, to
enable correlation between regions differentially active between
groups and their connectivity.
Maternal or paternal behavior is hard-wired in the brain of
parenting species, in a highly conserved fashion (Dulac et al.,
2014). Brain regions responding to parental care have been
extensively studied through IEGs (Tachikawa et al., 2013; Wu
et al., 2014). Our unbiased screen for regions differentially active
in the brains of a parenting female versus an aggressive male
yielded a very high number of positive hits, which deserve closer
examination as possibly being involved in parenting behavior.
The combination of viral tracing and activity mapping further
allowed us to discover a previously undocumented projection
from the galanin-expressing neurons of the MPO to the posterior
Cell 165, 1–14, June 16, 2016 11
Please cite this article in press as: Renier et al., Mapping of Brain Activity by Automated Volume Analysis of Immediate Early Genes, Cell(2016), http://dx.doi.org/10.1016/j.cell.2016.05.007
part of the cortical amygdala. The registered c-Fos+ cell maps
showed increased activity in the males matching the projection
pattern, which led us to hypothesize a direct role of the MPO
on cortical activity. Further experiments are needed to explore
in detail the functional interactions between those regions,
e.g., by using stimulations with DREAAD receptors or via opto-
genetics to map functionally connected regions through their
induced activity.
In summary, the pipeline we describe here permits mapping
of neuronal activity throughout the brain using IEGs as proxies
in a fast and robust manner. This pipeline permits the rapid dis-
covery of similarities and differences in activity patterns between
animals, as well as the correlation of activity with connectivity,
thus dramatically facilitating the generation and testing of hy-
potheses regarding the brain-wide basis of perception, behavior,
and responses to drugs and other perturbations.
EXPERIMENTAL PROCEDURES
Animals
Animals were maintained on 12 hr:12 hr light/dark cycle with food and water
available ad libitum. All surgical and behavioral procedures in mice were
performed in compliance with NIH guidelines and protocols approved by
the IACUC of the Rockefeller University and of the Harvard University. The
Gal::Cre BAC transgenic line (STOCK Tg(Gal-cre)KI87Gsat/Mmucd, 031060-
UCD) was imported from the Mutant Mouse Regional Resource Center and
is described (Wu et al., 2014).
iDISCO+ Sample Processing
Modifications and continuous updates to the protocol can be found at http://
www.idisco.info. Adult mice were euthanized with a rising gradient of CO2 and
fixed with an intracardiac perfusion of 4% paraformaldehyde (PFA) in PBS. All
harvested samples were post-fixed overnight at 4�C in 4% PFA in PBS. Sam-
ples were processed with the iDISCO immunolabeling protocol, as detailed in
the Supplemental Experimental Procedures and in the bench protocol.
Light-Sheet Imaging
Cleared samples were imaged in sagittal orientation (right lateral side up) on a
light-sheet microscope (Ultramicroscope II, LaVision Biotec) equipped with a
sCMOS camera (Andor Neo) and a 23/0.5 objective lens (MVPLAPO 23)
equipped with a 6 mm working distance dipping cap. Version v144 of the
Imspector Microscope controller software was used. The samples were
scanned with a step-size of 3 mm using the continuous light sheet scanning
method with the included contrast blending algorithm for the 640 nm and
595 nm channels (20 acquisitions per plane), and without horizontal scanning
for the 480 nm channel.
Image Processing and Analysis
For display purposes in the figures, a gamma correction of 1.47 was applied on
the raw data obtained from the light-sheet microscope (but not on the density
maps, which are linearly scaled). Maximum projections were performed using
ImageJ (NIH, http://imagej.nih.gov/ij/). Imaris (Bitplane, http://www.bitplane.
com/imaris/imaris) was used for the manual 3D annotations in Figures 2
and 3 andMovies S1, S2, and S3. Imaris was also used to generate the orthog-
onal projections of the unprocessed data in all figures.
ClearMap Analysis
All analysis and quantifications where performed with the newly developed
open source ClearMap software as shown in the example scripts (Supple-
mental Information) and the associated documentation. The latest version of
ClearMap can be downloaded from http://www.idisco.info.
The cell detection is tailored for cell nuclei and uses a background subtrac-
tion via morphological opening, followed by a sequence of filters, morpholog-
ical operations, and a 3D peak detection.We chose a threshold of 20 voxels for
12 Cell 165, 1–14, June 16, 2016
the cell size. Thebackgroundwas removedby subtractionof themorphological
opened image with a disk shape structure element with main axis of 7 pixels of
diameter. Cells were detected from peaks and subsequent water shedding,
removing background pixels below an intensity cutoff of 700. Density maps
were generated by summing spheres of 375 mmdiameter and uniform intensity
centered on each cell. Cell densitymaps and statistics are presented in Figures
4, 5, 6, and 7. Samples were registered using the average autofluorescence
STPR brain (Kim et al., 2015) registered to the Allen Brain Institute 25 mm
map and companion annotation map (http://alleninstitute.org/).
Statistics
Cell counts or intensities of each sample in considered regions or annotated
brain areas between different groups were compared using the independent
two-sample Student’s t test assuming unequal variances. Statistical tests
were performed numerically using the SciPy statistics library (http://www.
scipy.org/). Using ClearMap as a discovery tool, p values were corrected for
multiple comparison to q values to control for false discovery rate (Benjamini
and Hochberg, 1995).
MRI Scanning
Wild-type adult littermates were transcardially perfused with 0.9% saline and
4%PFA. The brains were dissected, post-fixed, cut sagitally in half (to fit in the
MRM scanner tube without deformation), and stored in phosphate buffer (PB)
until imaging.
All MRM scans were performed on a 9.4 T Bruker vertical bore magnet.
Fomblin was used to seal the specimen to prevent dehydration and at the
same time to prevent susceptibility effects.
Haloperidol Injections
Adult (10-week-old) male littermate mice were individually housed for 5 days,
and on the day 6, they were injected intraperitoneally (i.p.) with either 1 mg/kg
haloperidol or vehicle (0.3% TWEEN-80 in 0.9% saline). The mice were eutha-
nized 3 hr after injection and transcardially perfused with 0.9% saline and 4%
PFA. The brains were dissected out, post-fixed overnight in 4% PFA at 4�C,and washed in PB until entering the iDISCO+ pipeline.
New Environment Exploration
Mice were anesthetized with a mixture of ketamine/xylazine (ketamine at
0.1 mg/g, xylazine at 0.01 mg/g), and their whiskers were trimmed or left intact
(sham operation for the intact-whiskers group). Mice were then left to recover
single-housed in an empty cage with access to food and water for 24 hr in the
dark. Mice were then transferred to a new cage containing an enriched envi-
ronment crowdedwith cardboard tubes and wire tube racks for 1 hr to explore.
Mice were then promptly anesthetized, perfused, and processed according to
the iDISCO+ protocol.
Viral Injections
Viral tracing experiments were performed in Gal::Cre mice at �8–12 weeks of
age. Mice were anesthetized with 100 mg/kg ketamine and 10 mg/kg xylazine
via i.p. injection. AAV1-EF1a-DIO-hChR2(H134R)eYFP (500 nl; UPenn Vector
Core) was injected into the right medial preoptic area. Two weeks later, mice
underwent behavioral testing.
Parental Behavior Assay
Parental behavior assays were performed in sexually naive Gal-cre females
at �8–12 weeks of age, 2 weeks after viral injection. Animals were individu-
ally housed for 1 week before testing. On testing day, animals were habitu-
ated to the testing arena for 30 min. Two C57BL/6J pups (age P1–P3) were
then introduced into the cage and placed at the farthest corners from the
resident’s nest. A timer was started at the first retrieval of a pup to the
nest. Ninety minutes after retrieval, mice were deeply anesthetized with
isoflurane and transcardially perfused with ice-cold PBS followed by 4%
PFA (in PBS).
Infanticide Behavior Assay
Infanticide behavior assays were performed in sexually naive C57BL/6J males
at �8–12 weeks of age that had not been exposed to pups. Animals were
Please cite this article in press as: Renier et al., Mapping of Brain Activity by Automated Volume Analysis of Immediate Early Genes, Cell(2016), http://dx.doi.org/10.1016/j.cell.2016.05.007
individually housed for 1 week before testing. On testing day, animals were
habituated to the testing arena for 2 hr with hydrogel and food in the cage.
Two C57BL/6J pups (age P1–P3) were then introduced into the cage and
placed at the farthest corners from the resident’s nest. The first olfactory inves-
tigationmarked the beginning of the assay, whichwas continued if the resident
attacked at least one pup. When a pup was attacked, the assay was ended
immediately, and the wounded pup was euthanized. Ninety minutes after first
olfactory investigation, infanticidal males were euthanized, perfused, and their
brains collected and post-fixed for iDISCO treatment.
SUPPLEMENTAL INFORMATION
Supplemental Information includes Supplemental Experimental Procedures,
seven figures, four tables, and three movies and can be found with this article
online at http://dx.doi.org/10.1016/j.cell.2016.05.007.
AUTHOR CONTRIBUTIONS
N.R., E.L.A., O.O., C.D., P.O., and M.T.-L. designed the study. C.K. developed
ClearMap, with help from K.U.V. E.L.A. and N.R. performed the sensory depri-
vation experiments. J.K. and A.E.A. performed the social behavior experi-
ments and viral tracing. L.K. performed the drug injection experiment and
prepared brains for MRI imaging. Y.Z., V.X.W., and C.Y.T. performed the
MRI scans. Z.W. developed the iDISCO+ protocol, and R.A. and N.R. tested
and characterized its applications. N.R. analyzed the data with help from
C.K. N.R. and M.T.-L. wrote the paper.
ACKNOWLEDGMENTS
We would like to thank Nils Brose for helpful discussions. We are also grateful
to Yingxi Lin for sharing reagents and insights. We would also like to thank
members of the M.T.-L. lab for helpful discussions. Our gratitude goes to the
Rockefeller University Bio-Imaging Resource Center, and, in particular, Pablo
Ariel, Kaye Thomas, Tao Tong, and Alison North. N.R. is supported by a Shelby
White and Leon Levy fellowship. E.L.A. is supported by a fellowship from the
Rockefeller University Women & Science Initiative. J.K. is supported by a Hu-
man Frontier Long-Term Fellowship, an EMBO Long-Term Fellowship and a
Sir Henry Wellcome Fellowship. A.E.A. is supported by the Eunice Kennedy
Shriver National Institute of Child Health and Development of the NIH under
award F32HD078040 and by a NARSAD Young Investigator award. This
work was supported by NIH grant 1R01HD082131-01A1 (to C.D.) and by the
Rockefeller University (to M.T.-L.). C.D. is an investigator of the Howard
Hughes Medical Institute.
Received: February 24, 2016
Revised: March 31, 2016
Accepted: May 1, 2016
Published: May 26, 2016
REFERENCES
Ahrens, M.B., Li, J.M., Orger, M.B., Robson, D.N., Schier, A.F., Engert, F., and
Portugues, R. (2012). Brain-wide neuronal dynamics during motor adaptation
in zebrafish. Nature 485, 471–477.
Barnes, S.J., Sammons, R.P., Jacobsen, R.I., Mackie, J., Keller, G.B., and
Keck, T. (2015). Subnetwork-specific homeostatic plasticity in mouse visual
cortex in vivo. Neuron 86, 1290–1303.
Benjamini, Y., and Hochberg, Y. (1995). Controlling the false discovery rate: a
practical and powerful approach to multiple testing. J. R. Stat. Soc. B 57,
289–300.
Bepari, A.K., Sano, H., Tamamaki, N., Nambu, A., Tanaka, K.F., and Takebaya-
shi, H. (2012). Identification of optogenetically activated striatal medium spiny
neurons by Npas4 expression. PLoS ONE 7, e52783.
Berenyi, A., Somogyvari, Z., Nagy, A.J., Roux, L., Long, J.D., Fujisawa, S.,
Stark, E., Leonardo, A., Harris, T.D., and Buzsaki, G. (2014). Large-scale,
high-density (up to 512 channels) recording of local circuits in behaving ani-
mals. J. Neurophysiol. 111, 1132–1149.
Cui, G., Jun, S.B., Jin, X., Luo, G., Pham,M.D., Lovinger, D.M., Vogel, S.S., and
Costa, R.M. (2014). Deep brain optical measurements of cell type-specific
neural activity in behaving mice. Nat. Protoc. 9, 1213–1228.
Denny, C.A., Kheirbek, M.A., Alba, E.L., Tanaka, K.F., Brachman, R.A., Laugh-
man, K.B., Tomm, N.K., Turi, G.F., Losonczy, A., and Hen, R. (2014). Hippo-
campal memory traces are differentially modulated by experience, time, and
adult neurogenesis. Neuron 83, 189–201.
Dulac, C., O’Connell, L.A., and Wu, Z. (2014). Neural control of maternal and
paternal behaviors. Science 345, 765–770.
Erturk, A., Becker, K., Jahrling, N., Mauch, C.P., Hojer, C.D., Egen, J.G., Hellal,
F., Bradke, F., Sheng,M., and Dodt, H.U. (2012). Three-dimensional imaging of
solvent-cleared organs using 3DISCO. Nat. Protoc. 7, 1983–1995.
Gogolla, N., Takesian, A.E., Feng, G., Fagiolini, M., and Hensch, T.K. (2014).
Sensory integration in mouse insular cortex reflects GABA circuit maturation.
Neuron 83, 894–905.
He, K., Petrus, E., Gammon, N., and Lee, H.-K. (2012). Distinct sensory re-
quirements for unimodal and cross-modal homeostatic synaptic plasticity.
J. Neurosci. 32, 8469–8474.
Hunt, S.P., Pini, A., and Evan, G. (1987). Induction of c-fos-like protein in spinal
cord neurons following sensory stimulation. Nature 328, 632–634.
Keller, P.J., and Ahrens, M.B. (2015). Visualizing whole-brain activity and
development at the single-cell level using light-sheet microscopy. Neuron
85, 462–483.
Kim, Y., Venkataraju, K.U., Pradhan, K., Mende, C., Taranda, J., Turaga, S.C.,
Arganda-Carreras, I., Ng, L., Hawrylycz, M.J., Rockland, K.S., et al. (2015).
Mapping social behavior-induced brain activation at cellular resolution in the
mouse. Cell Rep. 10, 292–305.
Klein, S., Staring, M., Murphy, K., Viergever, M.A., and Pluim, J.P.W. (2010).
elastix: a toolbox for intensity-based medical image registration. IEEE Trans.
Med. Imaging 29, 196–205.
Lerner, T.N., Shilyansky, C., Davidson, T.J., Evans, K.E., Beier, K.T., Za-
locusky, K.A., Crow, A.K., Malenka, R.C., Luo, L., Tomer, R., and Deisseroth,
K. (2015). Intact-brain analyses reveal distinct information carried by SNc
dopamine subcircuits. Cell 162, 635–647.
Lin, Y., Bloodgood, B.L., Hauser, J.L., Lapan, A.D., Koon, A.C., Kim, T.-K., Hu,
L.S., Malik, A.N., and Greenberg, M.E. (2008). Activity-dependent regulation of
inhibitory synapse development by Npas4. Nature 455, 1198–1204.
Lovett-Barron, M., Kaifosh, P., Kheirbek, M.A., Danielson, N., Zaremba, J.D.,
Reardon, T.R., Turi, G.F., Hen, R., Zemelman, B.V., and Losonczy, A. (2014).
Dendritic inhibition in the hippocampus supports fear learning. Science 343,
857–863.
Menegas, W., Bergan, J.F., Ogawa, S.K., Isogai, Y., Umadevi Venkataraju, K.,
Osten, P., Uchida, N., andWatabe-Uchida, M. (2015). Dopamine neurons pro-
jecting to the posterior striatum form an anatomically distinct subclass. eLife 4,
e10032.
Mongeau, R., Miller, G.A., Chiang, E., and Anderson, D.J. (2003). Neural cor-
relates of competing fear behaviors evoked by an innately aversive stimulus.
J. Neurosci. 23, 3855–3868.
Peron, S.P., Freeman, J., Iyer, V., Guo, C., and Svoboda, K. (2015). A Cellular
Resolution Map of Barrel Cortex Activity during Tactile Behavior. Neuron 86,
783–799.
Ragan, T., Kadiri, L.R., Venkataraju, K.U., Bahlmann, K., Sutin, J., Taranda, J.,
Arganda-Carreras, I., Kim, Y., Seung, H.S., and Osten, P. (2012). Serial two-
photon tomography for automated ex vivomouse brain imaging. Nat. Methods
9, 255–258.
Renier, N., Wu, Z., Simon, D.J., Yang, J., Ariel, P., and Tessier-Lavigne, M.
(2014). iDISCO: a simple, rapid method to immunolabel large tissue samples
for volume imaging. Cell 159, 896–910.
Richardson, D.S., and Lichtman, J.W. (2015). Clarifying tissue clearing. Cell
162, 246–257.
Cell 165, 1–14, June 16, 2016 13
Please cite this article in press as: Renier et al., Mapping of Brain Activity by Automated Volume Analysis of Immediate Early Genes, Cell(2016), http://dx.doi.org/10.1016/j.cell.2016.05.007
Rodgers, K.M., Benison, A.M., Klein, A., and Barth, D.S. (2008). Auditory,
somatosensory, and multisensory insular cortex in the rat. Cereb. Cortex 18,
2941–2951.
Roth, B.L., Ciaranello, R.D., and Meltzer, H.Y. (1992). Binding of typical and
atypical antipsychotic agents to transiently expressed 5-HT1C receptors.
J. Pharmacol. Exp. Ther. 260, 1361–1365.
Schwarz, M.K., Scherbarth, A., Sprengel, R., Engelhardt, J., Theer, P., and
Giese, G. (2015). Fluorescent-protein stabilization and high-resolution imaging
of cleared, intact mouse brains. PLoS ONE 10, e0124650.
Shamonin, D.P., Bron, E.E., Lelieveldt, B.P.F., Smits, M., Klein, S., and Staring,
M.; Alzheimer’s Disease Neuroimaging Initiative (2014). Fast parallel image
registration on CPU and GPU for diagnostic classification of Alzheimer’s dis-
ease. Front. Neuroinform. 7, 50.
Sommer, C., Straehle, C., Kothe, U., and Hamprecht, F.A. (2011). Ilastik: Inter-
active learning and segmentation toolkit. 8th IEEE International Symposium on
Biomedical Imaging (ISBI 2011). Proceedings, 230–233.
Spiegel, I., Mardinly, A.R., Gabel, H.W., Bazinet, J.E., Couch, C.H., Tzeng,
C.P., Harmin, D.A., and Greenberg, M.E. (2014). Npas4 regulates excitatory-
inhibitory balance within neural circuits through cell-type-specific gene pro-
grams. Cell 157, 1216–1229.
Sumner, B.E.H., Cruise, L.A., Slattery, D.A., Hill, D.R., Shahid, M., and Henry,
B. (2004). Testing the validity of c-fos expression profiling to aid the thera-
peutic classification of psychoactive drugs. Psychopharmacology (Berl.)
171, 306–321.
Susaki, E.A., Tainaka, K., Perrin, D., Kishino, F., Tawara, T., Watanabe, T.M.,
Yokoyama, C., Onoe, H., Eguchi, M., Yamaguchi, S., et al. (2014). Whole-brain
imaging with single-cell resolution using chemical cocktails and computational
analysis. Cell 157, 726–739.
14 Cell 165, 1–14, June 16, 2016
Susaki, E.A., Tainaka, K., Perrin, D., Yukinaga, H., Kuno, A., and Ueda, H.R.
(2015). Advanced CUBIC protocols for whole-brain and whole-body clearing
and imaging. Nat. Protoc. 10, 1709–1727.
Tachikawa, K.S., Yoshihara, Y., and Kuroda, K.O. (2013). Behavioral transition
from attack to parenting in male mice: a crucial role of the vomeronasal sys-
tem. J. Neurosci. 33, 5120–5126.
vom Saal, F.S. (1985). Time-contingent change in infanticide and parental
behavior induced by ejaculation in male mice. Physiol. Behav. 34, 7–15.
Wang, K.H., Majewska, A., Schummers, J., Farley, B., Hu, C., Sur, M., and
Tonegawa, S. (2006). In vivo two-photon imaging reveals a role of arc in
enhancing orientation specificity in visual cortex. Cell 126, 389–402.
Wee, C.L., Naumann, E.A., Nnaemeka, O., Schoppik, D., Fitzgerald, J.E., Por-
tugues, R., Lacoste, A.M.B., Riegler, C., Schier, A.F., Randlett, O., et al. (2015).
Whole-brain activity mapping onto a zebrafish brain atlas. Nat. Methods 12,
1039–1046.
Wu, Z., Autry, A.E., Bergan, J.F., Watabe-Uchida, M., and Dulac, C.G. (2014).
Galanin neurons in the medial preoptic area govern parental behaviour. Nature
509, 325–330.
Yushkevich, P.A., Piven, J., Hazlett, H.C., Smith, R.G., Ho, S., Gee, J.C., and
Gerig, G. (2006). User-guided 3D active contour segmentation of anatomical
structures: significantly improved efficiency and reliability. Neuroimage 31,
1116–1128.
Zingg, B., Hintiryan, H., Gou, L., Song, M.Y., Bay, M., Bienkowski, M.S., Fos-
ter, N.N., Yamashita, S., Bowman, I., Toga, A.W., and Dong, H.W. (2014).
Neural networks of the mouse neocortex. Cell 156, 1096–1111.