Embed Size (px)
Citation preview

State Auditor’s Office reports are available on the Internet at http://www.sao.texas.gov/.
An Audit Report on
Incentive Compensation at the Permanent School Fund, General Land
Office, Teacher Retirement System, and Employees Retirement System
August 2020 Report No. 20-040

An Audit Report on
Incentive Compensation at the Permanent School Fund, General Land Office, Teacher Retirement System, and Employees Retirement System
SAO Report No. 20-040 August 2020
This audit was conducted in accordance with Texas Government Code, Sections 321.0131 and 321.0132.
For more information regarding this report, please contact Michael Clayton, Audit Manager, or Lisa Collier, First Assistant State Auditor, at (512) 936-9500.
Overall Conclusion
The Permanent School Fund Division (PSF Division) of the Texas Education Agency and the General Land Office (GLO) calculated and paid incentive compensation in accordance with their policies and procedures for plan year 2019.
The Teacher Retirement System (TRS) calculated and paid incentive compensation in accordance with its policies and procedures for plan year 2019. However, it did not ensure that it paid the correct amount of executive compensation.
The Employees Retirement System (ERS) calculated and paid incentive compensation in accordance with its policies and procedures for plan year 2019. However, it should further strengthen controls over its calculation and review process.
Auditors communicated other, less significant issues separately in writing to TRS and ERS management.
Table 1 on the next page presents a summary of the findings in this report and the related issue ratings. (See Appendix 2 for more information about the issue rating classifications and descriptions.)
Incentive Compensation for Plan Year 2019
Through their incentive compensation plans for plan year 2019, the PSF Division, GLO, ERS, and TRS awarded a total of $21,566,773 in incentive compensation to 288 employees. Specifically:
The PSF Division awarded $4,002,338 to 53 employees.
GLO awarded $489,278 to 5 employees.
TRS awarded $13,105,824 to 156 employees.
ERS awarded to $3,969,333 to 74 employees.
Sources: The PSF Division, GLO, TRS, and
ERS.

An Audit Report on Incentive Compensation at the Permanent School Fund, General Land Office, Teacher Retirement System, and Employees Retirement System
SAO Report No. 20-040
ii
Table 1
Summary of Chapters and Related Issue Ratings
Chapter Title Issue Rating a
1 The PSF Division Calculated and Paid Plan Year 2019 Incentive Compensation in Accordance With Its Policies and Procedures
Low
2 GLO Calculated and Paid Plan Year 2019 Incentive Compensation in Accordance With Its Policies and Procedures
Low
3 TRS Calculated and Paid Plan Year 2019 Incentive Compensation and Executive Performance Incentive Compensation in Accordance With Its Policies and Procedures; However, It Did Not Ensure That It Paid the Correct Amount of Executive Compensation
Low
4 ERS Calculated and Paid Plan Year 2019 Incentive Compensation in Accordance With Its Policies and Procedures, But It Should Further Strengthen Controls Over Its Calculation and Review Process
Low
a A chapter is rated Priority if the issues identified present risks or effects that if not addressed could critically affect the audited
entity’s ability to effectively administer the program(s)/function(s) audited. Immediate action is required to address the noted concern and reduce risks to the audited entity.
A chapter is rated High if the issues identified present risks or effects that if not addressed could substantially affect the audited entity’s ability to effectively administer the program(s)/function(s) audited. Prompt action is essential to address the noted concern and reduce
risks to the audited entity.
A chapter is rated Medium if the issues identified present risks or effects that if not addressed could moderately affect the audited entity’s ability to effectively administer program(s)/function(s) audited. Action is needed to address the noted concern and reduce risks to a more desirable level.
A chapter is rated Low if the audit identified strengths that support the audited entity’s ability to administer the program(s)/function(s) audited or the issues identified do not present significant risks or effects that would negatively affect the audited entity’s ability to effectively administer the program(s)/function(s) audited.
Summary of Management’s Response
At the ends of the TRS and ERS chapters in this report, auditors made recommendations to address the issues identified during this audit. TRS and ERS agreed with the recommendations in this report.
Audit Objective and Scope
The objective of this audit was to determine whether the PSF Division, GLO, TRS, and ERS calculate and pay incentive compensation in accordance with policies and procedures.
The scope of this audit covered incentive compensation plan years ending September 30, 2019, at the PSF Division; June 30, 2019, at GLO; September 30, 2019, at TRS; and August 31, 2019, at ERS.

Contents
Detailed Results
Chapter 1 The PSF Division Calculated and Paid Plan Year 2019 Incentive Compensation in Accordance With Its Policies and Procedures ........................................................ 1
Chapter 2 GLO Calculated and Paid Plan Year 2019 Incentive Compensation in Accordance With Its Policies and Procedures ............................................................. 3
Chapter 3 TRS Calculated and Paid Plan Year 2019 Incentive Compensation and Executive Performance Incentive Compensation in Accordance With Its Policies and Procedures; However, It Did Not Ensure That It Paid the Correct Amount of Executive Compensation ...................... 5
Chapter 4 ERS Calculated and Paid Plan Year 2019 Incentive Compensation in Accordance With Its Policies and Procedures, But It Should Further Strengthen Controls Over Its Calculation and Review Process ........................... 9
Appendices
Appendix 1 Objective, Scope, and Methodology .............................. 13
Appendix 2 Issue Rating Classifications and Descriptions .................... 17
Appendix 3 Internal Control Components ...................................... 18
Appendix 4 Related State Auditor’s Office Reports .......................... 20

An Audit Report on Incentive Compensation at the Permanent School Fund, General Land Office, Teacher Retirement System, and Employees Retirement System
SAO Report No. 20-040 August 2020
Page 1
Detailed Results
Chapter 1
The PSF Division Calculated and Paid Plan Year 2019 Incentive Compensation in Accordance With Its Policies and Procedures
The Permanent School Fund Division (PSF Division) of the Texas Education Agency calculated and paid incentive compensation for its plan year ending September 30, 2019, in accordance with its policies and procedures.
The PSF Division awarded a total of $4,002,338 in incentive compensation to 53 employees. The PSF Division awarded the most incentive compensation to its chief investment officer, who was awarded $332,177 payable over a three-year period. That $332,177 represented 8.3 percent of the $4,002,338 in total incentive compensation that the PSF Division awarded.
The PSF Division calculates incentive compensation based on an employee’s achievement of performance goals related to total fund performance and the performance of the employee’s assigned asset classes, as applicable. With the exception of the performance of certain asset classes, both fund and asset class performance are calculated based on three-year rolling historical performance data. The PSF Division calculates incentive compensation awards using investment performance data reported on gross-of-fees basis (see text box for more information on gross-of-fees and net-of-fees).
The PSF Division awards incentive compensation if the performance of the total fund or the individual asset classes, as applicable, exceeds selected benchmarks. Total fund investment performance exceeded the target benchmark by 0.51 percent (51 basis points) (see text box for additional information on basis points) for the three-year period from October 1, 2016, to September 30, 2019.
The PSF Division pays incentive compensation awards for a plan year over a three-year installment schedule. Specifically, for most
employees, the PSF Division pays 50 percent of an incentive compensation
1 The risk related to the issues discussed in Chapter 1 is rated as Low because the audit identified strengths that support the audited entity’s ability to administer the program(s)/function(s) audited or the issues identified do not present significant risks or effects that would negatively affect the audited entity’s ability to effectively administer the program(s)/function(s) audited.
Chapter 1 Rating:
Low 1
Gross-of-Fees and Net-of-Fees Basis
The PSF Division calculates incentive compensation awards using investment performance data reported on a gross-of-fees basis.
Gross-of-fees indicates that the return on investment does not include the effect of fees. Net-of-fees indicates that the return on investment does include the effect of fees.
Sources: The PSF Division and the Guidance Statement on the Application of the [Global Investment Performance Standards] GIPS Standards to Asset Owners (https://www.gipsstandards.org/standards/Documents/Guidanc
e/gs_revised_asset_owner.pdf).
Basis Points
One basis point is 0.01 percent or one one-hundredth of a percentage point.
Source: Morningstar, Inc. website at
http://www.morningstar.com/InvGlossary/basis_point_definition
_what_is.aspx.

An Audit Report on Incentive Compensation at the Permanent School Fund, General Land Office, Teacher Retirement System, and Employees Retirement System
SAO Report No. 20-040 August 2020
Page 2
award after the performance period for the current plan year, 25 percent of that award after the next plan year, and 25 percent of that award after the third plan year. As a result, an employee may receive an incentive award payment that consists of partial awards from three plan years.
Table 2 presents the positions eligible to earn incentive compensation according to the PSF Division’s incentive compensation plan, as well as the incentive compensation award, or award range, for each eligible position for plan year 2019.
Table 2
PSF Division Incentive Compensation Awards for Plan Year 2019
Eligible Position Incentive Compensation Award or Award Range a
Chief Investment Officer $332,177
Deputy Chief Investment Officer and Director of Fixed Income $239,225
Director of Private Markets $231,944
Director of Equities $227,133
Deputy Executive Administrator $210,010
Director of Global Risk Control Strategies $203,589
Portfolio Manager II - III $86,236 to $124,982
Director of Finance $67,669
Director of Investment Technology $67,968
Director II $47,913 to $49,802
General Counsel V $80,473
Systems Analyst IV - VII $7,265 to $49,292
Attorney V $47,963
Investment Analyst I - IV $35,721 to $82,539
Business Analyst IV $37,456
Financial Analyst I - IV $8,199 to $33,207
Manager II $26,179
Accountant VI - VII $16,540 to $36,642
Staff Services Officer III $11,419 to $12,668
a Award range applies to multiple employees in an eligible position.
Source: The PSF Division.
An Audit Report on Incentive Compensation at the Permanent School Fund, General Land Office, Teacher Retirement System, and Employees Retirement System
SAO Report No. 20-040 August 2020
Page 3
Chapter 2
GLO Calculated and Paid Plan Year 2019 Incentive Compensation in Accordance With Its Policies and Procedures
The General Land Office (GLO) calculated and paid incentive compensation for its plan year ending June 30, 2019, in accordance with its policies and procedures.
GLO awarded a total of $489,278 in incentive compensation to 5 employees. GLO awarded the most incentive compensation to its chief investment officer, who was awarded $276,816 payable over a two-year period. That $276,816 represented 56.6 percent of the $489,278 in total incentive compensation that GLO awarded.
GLO’s incentive compensation plan compares investment performance of the total fund against a target benchmark on a one-year, three-year, and five-year performance period basis. GLO calculates incentive compensation based on an employee’s achievement of an investment performance component (60 percent) and a qualitative performance component (40 percent).
GLO calculates incentive compensation awards using investment performance data reported on gross-of-fees basis (see text box for more information on gross-of-fees and net-of-fees). The investment performance of the total fund exceeded the target benchmark; therefore, GLO awarded incentive compensation for plan year 2019. Total fund investment performance:
Exceeded the target benchmark by 6.5 percent (650 basis points)3 for the one-year period from July 1, 2018, to June 30, 2019.
Exceeded the target benchmark by 9.85 percent (985 basis points) for the three-year period from July 1, 2016, to June 30, 2019.
2 The risk related to the issues discussed in Chapter 2 is rated as Low because the audit identified strengths that support the
audited entity’s ability to administer the program(s)/function(s) audited or the issues identified do not present significant risks or effects that would negatively affect the audited entity’s ability to effectively administer the program(s)/function(s) audited.
3 One basis point is 0.01 percent or one one-hundredth of a percentage point. See text box on page 1 for additional information on basis points.
Chapter 2 Rating:
Low 2
Gross-of-Fees and Net-of-Fees Basis
GLO calculates incentive compensation awards using investment performance data reported on a gross-of-fees basis.
Gross-of-fees indicates that the return on investment does not include the effect of fees. Net-of-fees indicates that the return on investment does include the effect of fees.
Sources: GLO and the Guidance Statement on the Application of the [Global Investment Performance Standards] GIPS Standards to Asset Owners at https://www.gipsstandards.org/standards/Documents/Guidance/gs_revised_asset
_owner.pdf.

An Audit Report on Incentive Compensation at the Permanent School Fund, General Land Office, Teacher Retirement System, and Employees Retirement System
SAO Report No. 20-040 August 2020
Page 4
Exceeded the target benchmark by 6.78 percent (678 basis points) for the five-year period from July 1, 2014, to June 30, 2019.
GLO pays incentive compensation awards for a plan year over a two-year installment schedule. Specifically, the plan pays 50 percent of an incentive compensation award after the performance period for the current plan year, and the remaining 50 percent of that award on the anniversary of the first payment. As a result, an employee may receive an incentive award payment that consists of partial awards from two plan years.
Table 3 presents the positions eligible to earn incentive compensation awards according to GLO’s incentive compensation plan and the incentive compensation award for each eligible position for plan year 2019.
Table 3
GLO Incentive Compensation Awards for Plan Year 2019
Eligible Position Incentive Compensation Award
Chief Investment Officer $276,816
Real Assets Portfolio Manager $139,056
Senior Financial Analyst $38,640
Investment Portfolio Assistant $22,598
Investment Analyst $12,168
Source: GLO.
An Audit Report on Incentive Compensation at the Permanent School Fund, General Land Office, Teacher Retirement System, and Employees Retirement System
SAO Report No. 20-040 August 2020
Page 5
Chapter 3
TRS Calculated and Paid Plan Year 2019 Incentive Compensation and Executive Performance Incentive Compensation in Accordance With Its Policies and Procedures; However, It Did Not Ensure That It Paid the Correct Amount of Executive Compensation
Incentive Compensation Plan
The Teacher Retirement System (TRS) calculated and paid incentive compensation for its plan year ending September 30, 2019, in accordance with its policies and procedures.
TRS awarded a total of $13,057,059 in incentive compensation to 155 employees (excluding $48,765 awarded to the executive director as part of the separate executive performance incentive pay plan). TRS awarded the most incentive compensation to a senior managing director, who was awarded $423,077 payable over a two-year period. That $423,077 represented 3.2 percent of $13,057,059 in total incentive compensation that TRS awarded.
TRS awards incentive compensation based on an employee’s achievement of investment performance and qualitative performance components. The investment performance component consists of two categories: (1) performance measured against established benchmarks (50 percent) and (2) performance measured against selected peer groups (30 percent). The qualitative performance component (20 percent) measures an employee’s performance in a variety of areas, such as interpersonal relationship skills, accountability, and teamwork.
TRS’s plan measures investment performance for both the benchmark and peer group categories on a one-year (33 percent) and three-year (67 percent) performance period basis. TRS awards incentive compensation if investment performance exceeds selected benchmarks or peer group performance for the one-year or three-year performance periods.
TRS calculates incentive compensation awards using investment performance data reported on a net-of-fees basis for performance measured against established benchmarks and a blend of both gross-of-fees and net-of-
4 The risk related to the issues discussed in Chapter 3 is rated as Low because the audit identified strengths that support the
audited entity’s ability to administer the program(s)/function(s) audited or the issues identified do not present significant risks or effects that would negatively affect the audited entity’s ability to effectively administer the program(s)/function(s) audited.
Chapter 3 Rating:
Low 4

An Audit Report on Incentive Compensation at the Permanent School Fund, General Land Office, Teacher Retirement System, and Employees Retirement System
SAO Report No. 20-040 August 2020
Page 6
fees for performance measured against selected peer groups depending on the asset class (see text box for more information on gross-of-fees and net-of-fees). The total fund investment performance:
Did not meet the target benchmark by 0.16 percent (16 basis points) for the one-year period from October 1, 2018, to September 30, 2019.
Exceeded the target benchmark by 0.69 percent (69 basis points)5 for the three-year period from October 1, 2016, to September 30, 2019.
Moreover, TRS pays incentive compensation awards for a plan year over a two-year installment schedule. Specifically, TRS pays 50 percent of an incentive compensation award after the performance period for the current plan year, and it pays the remaining 50 percent of that award on the anniversary of the first payment. As a result, an employee may receive an incentive award payment that consists of partial awards from two plan years.
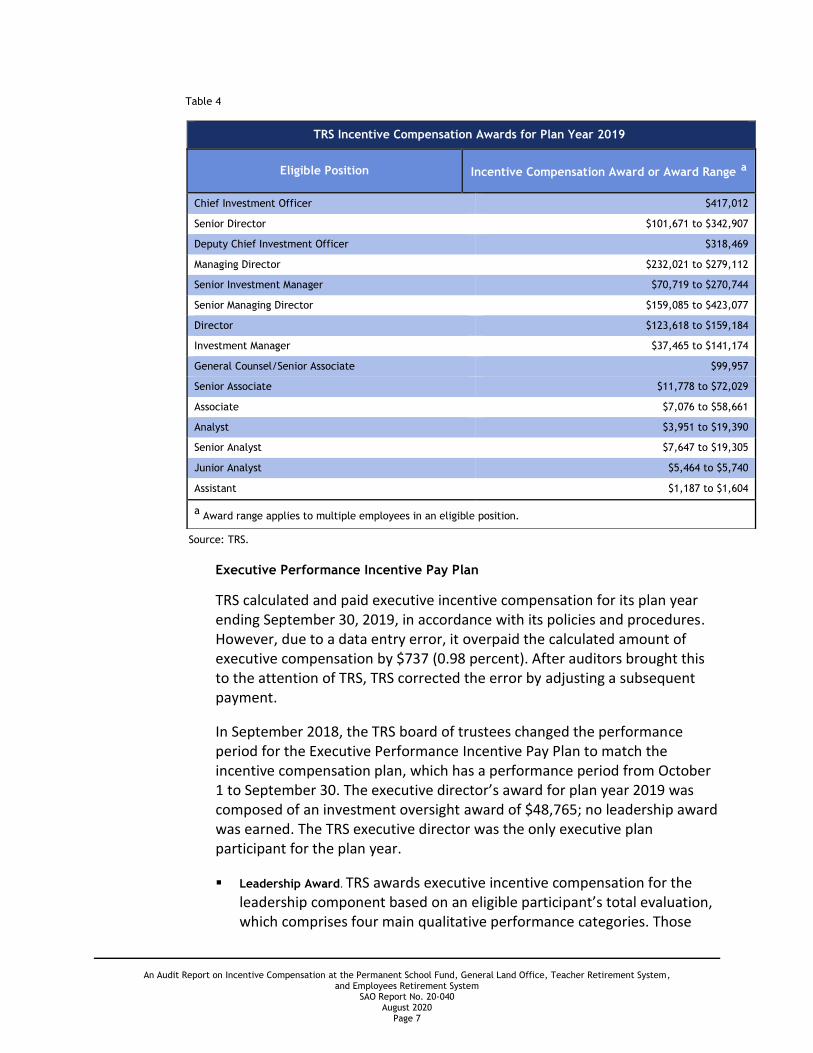
Table 4 on the next page presents the positions eligible to earn incentive compensation according to TRS’s incentive compensation plan and the incentive compensation award, or award range, for each eligible position for plan year 2019.
5 One basis point is 0.01 percent or one one-hundredth of a percentage point. See text box on page 1 for additional information
on basis points.
Gross-of-Fees and Net-of-Fees Basis
TRS calculates incentive compensation awards using investment performance data reported on a net-of-fees and gross-of-fees basis.
Gross-of-fees indicates that the return on investment does not include the effect of fees. Net-of-fees indicates that the return on investment does include the effect of fees.
Sources: TRS and the Guidance Statement on the Application of the [Global Investment Performance Standards] GIPS Standards to Asset Owners at https://www.gipsstandards.org/standards/Documents/Guidance/
gs_revised_asset_owner.pdf.
An Audit Report on Incentive Compensation at the Permanent School Fund, General Land Office, Teacher Retirement System, and Employees Retirement System
SAO Report No. 20-040 August 2020
Page 7
Table 4
Source: TRS.
Executive Performance Incentive Pay Plan
TRS calculated and paid executive incentive compensation for its plan year ending September 30, 2019, in accordance with its policies and procedures. However, due to a data entry error, it overpaid the calculated amount of executive compensation by $737 (0.98 percent). After auditors brought this to the attention of TRS, TRS corrected the error by adjusting a subsequent payment.
In September 2018, the TRS board of trustees changed the performance period for the Executive Performance Incentive Pay Plan to match the incentive compensation plan, which has a performance period from October 1 to September 30. The executive director’s award for plan year 2019 was composed of an investment oversight award of $48,765; no leadership award was earned. The TRS executive director was the only executive plan participant for the plan year.
Leadership Award. TRS awards executive incentive compensation for the leadership component based on an eligible participant’s total evaluation, which comprises four main qualitative performance categories. Those
TRS Incentive Compensation Awards for Plan Year 2019
Eligible Position Incentive Compensation Award or Award Range a
Chief Investment Officer $417,012
Senior Director $101,671 to $342,907
Deputy Chief Investment Officer $318,469
Managing Director $232,021 to $279,112
Senior Investment Manager $70,719 to $270,744
Senior Managing Director $159,085 to $423,077
Director $123,618 to $159,184
Investment Manager $37,465 to $141,174
General Counsel/Senior Associate $99,957
Senior Associate $11,778 to $72,029
Associate $7,076 to $58,661
Analyst $3,951 to $19,390
Senior Analyst $7,647 to $19,305
Junior Analyst $5,464 to $5,740
Assistant $1,187 to $1,604
a Award range applies to multiple employees in an eligible position.

An Audit Report on Incentive Compensation at the Permanent School Fund, General Land Office, Teacher Retirement System, and Employees Retirement System
SAO Report No. 20-040 August 2020
Page 8
performance categories are (1) leadership effectiveness, (2) strategic foresight, (3) culture and engagement, and (4) operational effectiveness.
Investment Oversight Award. Beginning with the 2018 plan year, the TRS board of trustees added an investment oversight performance award, which is based on the one-year and three-year investment performance of the total fund.
TRS pays executive incentive compensation for each component over a two-year installment schedule. For both components, TRS pays 50 percent of an incentive compensation award the first year and it pays the remaining 50 percent of that award on the first anniversary of the first payment.
Recommendation
TRS should strengthen controls over payments made from its executive performance incentive pay plan to ensure that it pays the correct amount of executive compensation.
Management’s Response
TRS agrees with the recommendation and has updated the executive performance incentive pay plan process to include two additional levels of review for all data inputs and payment calculations.

An Audit Report on Incentive Compensation at the Permanent School Fund, General Land Office, Teacher Retirement System, and Employees Retirement System
SAO Report No. 20-040 August 2020
Page 9
Chapter 4
ERS Calculated and Paid Plan Year 2019 Incentive Compensation in Accordance With Its Policies and Procedures, But It Should Further Strengthen Controls Over Its Calculation and Review Process
The Employees Retirement System (ERS) calculated and paid incentive compensation for its plan year ending August 31, 2019, in accordance with its policies and procedures. However, ERS should further strengthen controls over its calculation and review process.
ERS awarded a total of $3,969,333 in incentive compensation to 74 employees; however, one recipient resigned prior to receiving the award. ERS awarded the most incentive compensation to its chief investment officer, who was awarded $285,629 payable over a three-year period. That $285,629 represented 7.2 percent of the total incentive compensation that ERS awarded. In addition, members of the ERS board of trustees approved the executive director’s participation in the incentive compensation plan for plan year 2019; the executive director was awarded $194,653 payable over a three-year period.
Plan Information
ERS awards incentive compensation based on an employee’s achievement of qualitative and quantitative performance goals. The qualitative performance goal represents 25 percent of the employee’s overall participant goals. The quantitative performance goals represent the remaining 75 percent of that employee’s overall participant goals, with a minimum of 25 percent of the overall participant goals to be evaluated based on relative trust fund performance.
For the executive director, the overall participant goals consist of a quantitative component (50 percent) based on relative trust fund performance and a qualitative component (50 percent) reflecting performance in overall agency leadership, management, communications, policy matters, staff development, and the implementation of agency strategic initiatives.
6 The risk related to the issues discussed in Chapter 4 is rated as Low because the audit identified strengths that support the
audited entity’s ability to administer the program(s)/function(s) audited or the issues identified do not present significant risks or effects that would negatively affect the audited entity’s ability to effectively administer the program(s)/function(s) audited.
Chapter 4 Rating:
Low 6

An Audit Report on Incentive Compensation at the Permanent School Fund, General Land Office, Teacher Retirement System, and Employees Retirement System
SAO Report No. 20-040 August 2020
Page 10
ERS calculates incentive compensation awards using investment performance data reported on a net-of-fees basis (see text box for more information on gross-of-fees and net-of-fees). ERS calculates the investment performance goals based on (1) an employee’s achievement of benchmarks related to the relative trust fund performance and (2) the performance of the employee’s assigned asset classes, individual portfolios, or individual research coverage for one-year, three-year, and five-year periods, depending on the employee’s length of service. The total relative trust fund investment performance:
Did not meet the target benchmark by 0.20 percent (20 basis points)7 for the one-year period from September 1, 2018, to August 31, 2019.
Exceeded the target benchmark by 0.85 percent (85 basis points) for the three-year period from September 1, 2016, to August 31, 2019.
Exceeded the target benchmark by 0.39 percent (39 basis points) for the five-year period from September 1, 2014, to August 31, 2019.
ERS pays most incentive compensation awards for a plan year over a three-year installment schedule. For most employees, ERS pays 50 percent of an incentive compensation award after the performance period for the current plan year, 25 percent of that award after the next plan year, and 25 percent of that award after the third plan year. As a result, an employee may receive an incentive award payment that consists of partial awards from three plan years.8
Table 5 on the next page presents the positions eligible to earn incentive compensation according to ERS’s incentive compensation plan and the incentive compensation award, or award range, for each eligible position for plan year 2019.
7 One basis point is 0.01 percent or one one-hundredth of a percentage point. See text box on page 1 for additional information
on basis points.
8 For investment operations specialists, ERS pays 50 percent of an incentive compensation award after the performance period for the current plan year, and it pays the remaining 50 percent of that award after the next plan year. For investment administrative support staff, ERS pays 100 percent of an incentive compensation award after the performance period for the current plan year.
Gross-of-Fees and Net-of-Fees Basis
ERS calculates incentive compensation awards using investment performance data reported on a net-of-fees basis.
Gross-of-fees indicates that the return on investment does not include the effect of fees. Net-of-fees indicates that the return on investment does include the effect of fees.
Sources: ERS and the Guidance Statement on the Application of the [Global Investment Performance Standards] GIPS Standards to Asset Owners at https://www.gipsstandards.org/standards/Documents/Guidanc
e/gs_revised_asset_owner.pdf.

An Audit Report on Incentive Compensation at the Permanent School Fund, General Land Office, Teacher Retirement System, and Employees Retirement System
SAO Report No. 20-040 August 2020
Page 11
Table 5
ERS Incentive Compensation Awards for Plan Year 2019
Eligible Position Incentive Compensation Award or
Award Range a
Chief Investment Officer $285,629
Asset Class Portfolio Managers/Directors $52,149 to $216,237
Executive Director $194,653
General Counsel and Chief Compliance Officer
$122,085
Supervising Portfolio Manager $71,184 to $113,438
Investment and Securities, Attorney $86,539 to $101,313
Portfolio Manager I - V $6,380 to $92,855
Chief Trader II $65,764
Director of Investment Services $62,737
Investment Analyst III - IV $3,322 to $57,828
Risk Management and Applied Research Portfolio Manager
$55,041
Trader I - II $28,813 to $41,633
Investment Analyst I - II $5,153 to $16,240
Investments and Securities, Paralegal $12,099
Financial Analyst I-IV (Investment Operations Specialist)
$567 to $9,647
Investment and Securities Support $155 to $2,786
a Award range applies to multiple employees in an eligible position.
Source: ERS.
Prior Year Recommendation
As noted in An Audit Report on Incentive Compensation at the Permanent School Fund, General Land Office, Teacher Retirement System, and Employees Retirement System (State Auditor’s Office Report No. 19-048, August 2019) (see Appendix 4 for more information about related reports), for plan year 2018 ERS changed its process for calculating incentive compensation by developing a database to calculate and track incentive compensation awards, but it had not finalized procedures for the new process. In that report, auditors recommended that ERS update its incentive compensation policies and procedures to reflect its current processes because using outdated or draft policies and procedures increases the risk of awarding and paying inaccurate incentive compensation. Although ERS had taken steps to strengthen controls over its incentive compensation processes since that report, the incentive compensation plan database procedures remained in draft form at the time of this audit.

An Audit Report on Incentive Compensation at the Permanent School Fund, General Land Office, Teacher Retirement System, and Employees Retirement System
SAO Report No. 20-040 August 2020
Page 12
Recommendation
ERS should further strengthen its controls over incentive compensation by ensuring that policies and procedures are updated and reflect current processes.
Management’s Response
ERS agrees with the recommendation of further strengthening controls over the incentive compensation program by ensuring the policies and procedures are updated and reflect current processes.
ERS continues to enhance its controls and review processes to help ensure that payment amounts are accurate and align with the plan policies and procedures. In doing this, additional enhancements to further the progress was made. The database users’ guide (functional instructions) is approximately 80% complete.
Human Resources plans to continue working with the Finance team and other ICP program staff to finalize the database procedures (database users’ guide) no later than February 28, 2021.
Responsible Position: Director of Human Resources
Implementation Date: February 28, 2021
An Audit Report on Incentive Compensation at the Permanent School Fund, General Land Office, Teacher Retirement System, and Employees Retirement System
SAO Report No. 20-040 August 2020
Page 13
Appendices
Appendix 1
Objective, Scope, and Methodology
Objective
The objective of this audit was to determine whether the Permanent School Fund Division (PSF Division) of the Texas Education Agency, the General Land Office (GLO), the Teacher Retirement System (TRS), and the Employees Retirement System (ERS) calculate and pay incentive compensation in accordance with policies and procedures.
Scope
The scope of this audit covered incentive compensation plan years ending September 30, 2019, at the PSF Division; June 30, 2019, at GLO; September 30, 2019, at TRS; and August 31, 2019, at ERS. The scope also included a review of significant internal control components related to determining whether the PSF Division, GLO, TRS, and ERS calculate and pay incentive compensation in accordance with policies and procedures (see Appendix 3 for more information about internal control components).
Methodology
The audit methodology included collecting information and documentation from the audited agencies; reviewing incentive compensation plans, policies, procedures, and other guidance related to incentive compensations; and analyzing and evaluating data and the results of tests.
Data Reliability and Completeness
Auditors assessed the reliability of the incentive compensation award data used in this audit by tracing the data to supporting documentation and by reviewing access to the data. Auditors verified the completeness of the incentive compensation award data by comparing pay calculation information in the incentive compensation award spreadsheets that the audited agencies used to calculate payments to payment data in the Uniform Statewide Accounting System, the Uniform Statewide Payroll/Personnel System, and the Standardized Payroll/Personnel Reporting System. Auditors determined that the incentive compensation award data was sufficiently reliable for the purposes of this audit.

An Audit Report on Incentive Compensation at the Permanent School Fund, General Land Office, Teacher Retirement System, and Employees Retirement System
SAO Report No. 20-040 August 2020
Page 14
Sampling Methodology
Auditors selected nonstatistical samples of incentive compensation awards for testing based on risk for the PSF Division, TRS, and ERS incentive compensation plans. These sample designs were chosen to address specific risk factors identified in the populations and items were selected because they had a high potential for error. The sample items were generally not representative of the populations for the entities; therefore, it would not be appropriate to project the test results to those populations.
Auditors tested the entire population of incentive compensation awards for the TRS executive performance incentive pay plan and the GLO incentive compensation plan.
Information collected and reviewed included the following:
Incentive compensation plan documentation at the PSF Division, GLO, TRS, and ERS, including policies and procedures for calculating and paying incentive compensation.
TRS and ERS boards of trustees meeting minutes.
Incentive compensation payment calculation spreadsheets and related data input source data for incentive compensation plan years ending September 30, 2019, at the PSF Division; June 30, 2019, at GLO; September 30, 2019, at TRS; and August 31, 2019, at ERS.
Incentive compensation recipients’ personnel documentation.
Payroll data for incentive compensation payments.
Investment performance reports from custodian banks.
Procedures and tests conducted included the following:
Interviewed management and key personnel at the PSF Division, GLO, TRS, and ERS.
Tested and recalculated recipients’ incentive compensation awards for incentive compensation plan years ending September 30, 2019, at the PSF Division; June 30, 2019, at GLO; September 30, 2019, at TRS; and August 31, 2019, at ERS to determine whether the payments complied with plan provisions.
Verified that incentive compensation award payments matched award calculations.
Tested compliance with the audited agencies’ policies and procedures.

An Audit Report on Incentive Compensation at the Permanent School Fund, General Land Office, Teacher Retirement System, and Employees Retirement System
SAO Report No. 20-040 August 2020
Page 15
Tested access controls, including segregation of duties, over the spreadsheets and data that GLO, TRS, and ERS used to calculate incentive compensation.
Reviewed agreed-upon procedures for ERS.
Criteria used included the following:
Section 44, Article III, Texas Constitution and related statutes.
Rider 13, page III-37, and Rider 20, page III-10, General Appropriations Act (85th Legislature).
Texas attorney general opinions related to incentive compensation.
The PSF Division’s Performance Incentive Pay Plan, effective October 1, 2018.
The PSF Division’s Investment Procedures Manual, amended June 2018.
GLO’s Performance Incentive Pay Plan, effective July 1, 2018.
GLO’s Performance Incentive Plan Procedures.
TRS’s Investment Performance Plan, effective October 1, 2018.
TRS’s Investment Performance Plan: Policy/Procedures.
TRS’s Executive Performance Incentive Pay Plan, for both the leadership performance period and the investment oversight performance period, effective October 1, 2018.
TRS’s Executive Performance Plan: Policy/Procedures.
ERS’s Incentive Compensation Plan for Key Investment Professionals and Leadership Employees, effective September 1, 2018.
ERS’s General Procedure Reference ERS Incentive Compensation Plan
ERS’s Monthly Analyst Attribution Performance procedures.

An Audit Report on Incentive Compensation at the Permanent School Fund, General Land Office, Teacher Retirement System, and Employees Retirement System
SAO Report No. 20-040 August 2020
Page 16
Project Information
Audit fieldwork was conducted from May 2020 through July 2020. We conducted this performance audit in accordance with generally accepted government auditing standards. Those standards require that we plan and perform the audit to obtain sufficient, appropriate evidence to provide a reasonable basis for our findings and conclusions based on our audit objectives. We believe that the evidence obtained provides a reasonable basis for our findings and conclusions based on our audit objectives.
The following members of the State Auditor’s staff performed the audit:
Benjamin Nathanial Keyfitz, CPA, CFE (Project Manager)
Teri Lynn Incremona, CFE (Assistant Project Manager)
Steven Arnold, CFE (Team Member)
Robert H. (Rob) Bollinger, CPA, CGMA, CFE (Team Member)
Tyler Miller (Team Member)
Ann E. Karnes, CPA (Quality Control Reviewer)
Michael Owen Clayton, CPA, CISA, CFE, CIDA (Audit Manager)

An Audit Report on Incentive Compensation at the Permanent School Fund, General Land Office, Teacher Retirement System, and Employees Retirement System
SAO Report No. 20-040 August 2020
Page 17
Appendix 2
Issue Rating Classifications and Descriptions
Auditors used professional judgment and rated the audit findings identified in this report. Those issue ratings are summarized in the report chapters/sub-chapters. The issue ratings were determined based on the degree of risk or effect of the findings in relation to the audit objective(s).
In determining the ratings of audit findings, auditors considered factors such as financial impact; potential failure to meet program/function objectives; noncompliance with state statute(s), rules, regulations, and other requirements or criteria; and the inadequacy of the design and/or operating effectiveness of internal controls. In addition, evidence of potential fraud, waste, or abuse; significant control environment issues; and little to no corrective action for issues previously identified could increase the ratings for audit findings. Auditors also identified and considered other factors when appropriate.
Table 6 provides a description of the issue ratings presented in this report.
Table 6
Summary of Issue Ratings
Issue Rating Description of Rating
Low The audit identified strengths that support the audited entity’s ability to administer the program(s)/function(s) audited, or the issues identified do not present significant risks or effects that would negatively affect the audited entity’s ability to effectively administer the program(s)/function(s) audited.
Medium Issues identified present risks or effects that if not addressed could moderately affect the audited entity’s ability to effectively administer the program(s)/function(s) audited. Action is needed to address the noted concern(s) and reduce risks to a more desirable level.
High Issues identified present risks or effects that if not addressed could substantially affect the audited entity’s ability to effectively administer the program(s)/function(s) audited. Prompt action is essential to address the noted concern(s) and reduce risks to the audited entity.
Priority Issues identified present risks or effects that if not addressed could critically affect the audited entity’s ability to effectively administer the program(s)/function(s) audited. Immediate action is required to address the noted concern(s) and reduce risks to the audited entity.

An Audit Report on Incentive Compensation at the Permanent School Fund, General Land Office, Teacher Retirement System, and Employees Retirement System
SAO Report No. 20-040 August 2020
Page 18
Appendix 3
Internal Control Components
Internal control is a process used by management to help an entity achieve its objectives. The U.S. Government Accountability Office’s Generally Accepted Government Auditing Standards require auditors to assess internal control when internal control is significant to the audit objectives. The Committee of Sponsoring Organizations of the Treadway Commission (COSO) established a framework for 5 integrated components and 17 principles of internal control, which are listed in Table 7.
Table 7
Internal Control Components and Principles
Component Component Description Principles
Control Environment The control environment sets the tone of an organization, influencing the control consciousness of its people. It is the foundation for all other components of internal control, providing discipline and structure.
The organization demonstrates a commitment to integrity and ethical values.
The board of directors demonstrates independence from management and exercises oversight of the development and performance of internal control.
Management establishes, with board oversight, structures, reporting lines, and appropriate authorities and responsibilities in the pursuit of objectives.
The organization demonstrates a commitment to attract, develop, and retain competent individuals in alignment with objectives.
The organization holds individuals accountable for their internal control responsibilities in the pursuit of objectives.
Risk Assessment Risk assessment is the entity’s identification and analysis of risks relevant to achievement of its objectives, forming a basis for determining how the risks should be managed.
The organization specifies objectives with sufficient clarity to enable the identification and assessment of risks relating to objectives.
The organization identifies risks to the achievement of its objectives across the entity and analyzes risks as a basis for determining how the risks should be managed.
The organization considers the potential for fraud in assessing risks to the achievement of objectives.
The organization identifies and assesses changes that could significantly impact the system of internal control.
Control Activities Control activities are the policies and procedures that help ensure that management’s directives are carried out.
The organization selects and develops control activities that contribute to the mitigation of risks to the achievement of objectives to acceptable levels.
The organization selects and develops general control activities over technology to support the achievement of objectives.
The organization deploys control activities through policies that establish what is expected and procedures that put policies into action.

An Audit Report on Incentive Compensation at the Permanent School Fund, General Land Office, Teacher Retirement System, and Employees Retirement System
SAO Report No. 20-040 August 2020
Page 19
Internal Control Components and Principles
Component Component Description Principles
Information and Communication
Information and communication are the identification, capture, and exchange of information in a form and time frame that enable people to carry out their responsibilities.
The organization obtains or generates and uses relevant, quality information to support the functioning of internal control.
The organization internally communicates information, including objectives and responsibilities for internal control, necessary to support the functioning of internal control.
The organization communicates with external parties regarding matters affecting the functioning of internal control.
Monitoring Activities Monitoring is a process that assesses the quality of internal control performance over time.
The organization selects, develops, and performs ongoing and/or separate evaluations to ascertain whether the components of internal control are present and functioning.
The organization evaluates and communicates internal control deficiencies in a timely manner to those parties responsible for taking corrective action, including senior management and the board of directors, as appropriate.
Source: Internal Control – Integrated Framework, Committee of Sponsoring Organizations of the Treadway Commission, May 2013.

An Audit Report on Incentive Compensation at the Permanent School Fund, General Land Office, Teacher Retirement System, and Employees Retirement System
SAO Report No. 20-040 August 2020
Page 20
Appendix 4
Related State Auditor’s Office Reports
Table 8
Related State Auditor’s Office Reports
Number Report Name Release Date
19-048 An Audit Report on Incentive Compensation at the Permanent School Fund, General Land Office, Teacher Retirement System, and Employees Retirement System
August 2019
19-003 An Audit Report on Incentive Compensation at the Permanent School Fund, General Land Office, Employees Retirement System, and Teacher Retirement System
September 2018
18-001 An Audit Report on Incentive Compensation at the Permanent School Fund, General Land Office, Employees Retirement System, and Teacher Retirement System
September 2017
16-030 An Audit Report on Incentive Compensation at the Permanent School Fund, General Land Office, Employees Retirement System, and Teacher Retirement System
June 2016
15-032 An Audit Report on Incentive Compensation at Selected Agencies May 2015

Copies of this report have been distributed to the following:
Legislative Audit Committee The Honorable Dan Patrick, Lieutenant Governor, Joint Chair The Honorable Dennis Bonnen, Speaker of the House, Joint Chair The Honorable Jane Nelson, Senate Finance Committee The Honorable Robert Nichols, Member, Texas Senate The Honorable Giovanni Capriglione, House Appropriations Committee The Honorable Dustin Burrows, House Ways and Means Committee
Office of the Governor The Honorable Greg Abbott, Governor
Employees Retirement System Members of the Employees Retirement System Board of Trustees
Ms. Ilesa Daniels, Chair Mr. I. Craig Hester, Vice Chair Mr. Brian Barth Dr. James Kee Ms. Catherine Melvin
Mr. Porter Wilson, Executive Director
General Land Office The Honorable George P. Bush, Land Commissioner and Chairman of the
School Land Board Members of the School Land Board
Mr. Gilbert Burciaga Mr. Michael A. Neill Mr. Scott Rohrman Mr. Todd A. Williams

Permanent School Fund Members of the State Board of Education
Dr. Keven Ellis, Chair Mr. Marty Rowley, Vice Chair Ms. Georgina C. Pérez, Secretary Mr. Lawrence A. Allen Jr. Ms. Donna Bahorich Ms. Barbara Cargill Mr. Ruben Cortez Jr. Ms. Aicha Davis Ms. Patricia Hardy Ms. Pam Little Mr. Tom Maynard Ms. Sue Melton-Malone Mr. Ken Mercer Ms. Marisa B. Perez-Diaz Mr. Matt Robinson
Mr. Mike Morath, Commissioner of Education
Teacher Retirement System Members of the Teacher Retirement System Board of Trustees
Mr. Jarvis V. Hollingsworth, Chair Ms. Nanette Sissney, Vice Chair Mr. Michael Ball Mr. David Corpus Mr. John Elliott Mr. Christopher Moss Mr. James Nance Mr. Robert Walls Jr.
Mr. Brian Guthrie, Executive Director

This document is not copyrighted. Readers may make additional copies of this report as needed. In addition, most State Auditor’s Office reports may be downloaded from our website: www.sao.texas.gov. In compliance with the Americans with Disabilities Act, this document may also be requested in alternative formats. To do so, contact our report request line at (512) 936-9500 (Voice), (512) 936-9400 (FAX), 1-800-RELAY-TX (TDD), or visit the Robert E. Johnson Building, 1501 North Congress Avenue, Suite 4.224, Austin, Texas 78701. The State Auditor’s Office is an equal opportunity employer and does not discriminate on the basis of race, color, religion, sex, national origin, age, or disability in employment or in the provision of services, programs, or activities. To report waste, fraud, or abuse in state government visit https://sao.fraud.texas.gov.