Embed Size (px)
Citation preview

1
An Assessment of the Contribution of Ecosystems in Protected Areas to Sector
Growth and Human Well Being in Romania
Improving the Financial Sustainability of the Carpathian System of Protected Areas (PAs)
Final Report, October 2012
Bogdan Popa and Camille Bann

2
Contents Acronyms and abbreviations ......................................................................................................................... 4
List of figures ................................................................................................................................................. 5
List of tables .................................................................................................................................................. 7
Acknowledgments ......................................................................................................................................... 8
EXECUTIVE SUMMARY .............................................................................................................................. 9
1 Introduction .......................................................................................................................................... 18
1.1 Study context............................................................................................................................... 18
1.2 Objective of study ........................................................................................................................ 19
1.3 Overview of Approach ................................................................................................................. 19
1.4 Limitations and challenges .......................................................................................................... 20
1.5 The Carpathian Network of Protected Areas .............................................................................. 20
1.6 Layout of report ........................................................................................................................... 22
2 Conceptual Framework and Methodology ........................................................................................... 23
2.1 Protected Areas and Ecosystem Services .................................................................................. 23
2.2 Sector Scenario Analysis ............................................................................................................ 26
2.2.1 Overview ................................................................................................................................. 26
2.2.2 Sector Focus ........................................................................................................................... 27
2.2.3 Ecosystem management scenarios – BAU and SEM ............................................................. 29
2.2.4 Indicators ................................................................................................................................. 31
2.2.5 The Importance of Time .......................................................................................................... 33
2.2.6 Valuing Ecosystem services ................................................................................................... 34
2.2.7 Overview of methodology ........................................................................................................ 36
3 The CNPAs and the targeted PAs in Romania .................................................................................... 38
3.1 Targeted PAs in Romania ........................................................................................................... 38
3.2 Qualitative assessment of ES provided by pilot PAs .................................................................. 38
4 The Contribution of Ecosystems in PAs to sector growth & welfare ................................................... 41
4.1 The Value of PA ESs to Tourism ................................................................................................ 42
4.1.1 Introduction .............................................................................................................................. 42
4.1.2 Ecotourism management in the Carpathian PAs under BAU ................................................. 43
4.1.3 Characterization of BAU and SEM scenarios ......................................................................... 45
4.1.4 Analysis ................................................................................................................................... 47
4.1.5 Contribution of ecosystems of PAs to economic activity and employment ............................. 52
4.2 The value of PA ecosystems services to Forestry and Hunting ................................................. 54
4.2.1 Introduction .............................................................................................................................. 54
4.2.2 Characterization of BAU and SEM scenarios (provisioning services) .................................... 56
4.2.3 Carbon sequestration .............................................................................................................. 63

3
4.3 The value of ecosystem services of PAs to Agriculture .............................................................. 66
4.3.1 Introduction .............................................................................................................................. 66
4.3.2 Characterization Modeling BAU and SEM scenarios .............................................................. 67
4.4 The Value of ecosystems in the targeted PAs to Water Supply Sector ...................................... 73
4.4.1 Background ............................................................................................................................. 73
4.4.2 Characterization of BAU and SEM scenarios ......................................................................... 74
4.5 Natural Disaster mitigation and risk reduction ............................................................................ 83
4.5.1 Background ............................................................................................................................. 83
4.5.2 Characterization of BAU and SEM scenarios ......................................................................... 84
5 The estimated values of ecosystems of PAs at the national level ....................................................... 90
5.1 High level assessment of PA ecosystems at system-level to the economy ............................... 90
5.2 The costs of SEM ........................................................................................................................ 92
6 Conclusions and Recommendations ................................................................................................... 94
6.1 Conclusions ................................................................................................................................. 94
6.2 Recommendations ...................................................................................................................... 96
6.2.1 Tourism ................................................................................................................................... 96
6.2.2 Forestry and Hunting ............................................................................................................... 96
6.2.3 Agriculture ............................................................................................................................... 97
6.2.4 Water resources ...................................................................................................................... 97
6.2.5 Natural Disaster Management ................................................................................................ 97
6.2.6 General further research needs .............................................................................................. 97
6.2.7 Policy and finance ................................................................................................................... 98
6.2.8 Institutional aspects ................................................................................................................. 98
Annex 1: Characterization of pilot PAs ..................................................................................................... 104
Annex 2: Logical scheme for soil erosion calculation ............................................................................... 111
Annex 3: Romania‟s Carpathian PAs ........................................................................................................ 112
Annex 4: Summary of values for the 5 Pilot Pas, valuation approaches and beneficiaries ...................... 116
Annex 5: Glossary of Terms...................................................................................................................... 119

4
Acronyms and abbreviations ANP Apuseni Natural Park ANAR National Agency “Romanian Waters” ANRM National Agency for Mineral Resources BAU Business as Usual BEF Biomass Extension Factor CNPA Carpathians Network of Protected Areas CBA Cost Benefit Analysis CS Consumer Surplus ESA Ecosystem Services Approach ES Ecosystem Service FMP Forest Management Plan GEF Global Environment Facility GDP Gross Domestic Product GIS Geographical Informational System IUCN International Nation for Conservation of Nature IPCC International Panel on Climate Change INCDT National Institute for Tourism Development Research LAC Latin America and the Caribbean LSU Livestock Unit MNP Maramures Mountains Natural Park MA Millennium Assessment MP Management Plan NFA National Forest Administration – Romsilva NTFP Non Timber Forest Products NPV Net Present Value NBT Nature Based Tourism NEF National Environmental Fund PA Protected Area PCNP Piatra Craiului National Park PAME Protected Areas Management Effectiveness PPP Purchasing Power Parity PV Present Value PES Payments for Ecosystem Services ReNP Retezat National Park REA Romanian Ecotourism Association SFS Sustainable Financing Strategy SSA Sector Scenario Approach SOP Sectorial Operational Programme SNAM National Society of Mineral Waters S.A. SEM Sustainable Ecosystem Management TEV Total Economic Value UNDP United Nations Development Project VAT Value Added Tax VNNP Vanatori Neamt Natural Park WWF World Fund For Nature WTP Willingness to Pay WTTC World Travel and Tourism Council

5
List of figures Figure 1-1: Distribution of the Romanian Carpathian PAs .......................................................................... 21 Figure 2-1: Overview of SSA Approach ...................................................................................................... 26 Figure 2-2: Shifting patterns of BAU /SEM ................................................................................................. 34 Figure 2-3: Key methodological steps ......................................................................................................... 37 Figure 4-1: Baseline value for the 5 PAs – Tourism (Euros / year) ............................................................ 49 Figure 4-2: Tourism sector values BAU CS included (PV10%=€787.2mill) ............................................... 49 Figure 4-3: Tourism sector values BAU CS excluded (PV10%=€439.3mill) .............................................. 50 Figure 4-4: Tourism sector values SEM CS included (PV10%=€1,289.9 mill) ........................................... 50 Figure 4-5: Tourism sector values SEM CS excluded (PV10%=€802.4mill) .............................................. 50 Figure 4-6: Tourism value under BAU and SEM over 25 years .................................................................. 51 Figure 4-7: Cumulative value of SEM over BAU ......................................................................................... 52 Figure 4-8: Baseline value for the 5 PAs – Forestry and Hunting............................................................... 59 Figure 4-9: Forestry sector values BAU (PV10%=€77.3million) ................................................................. 59 Figure 4-10: Forestry sector values SEM (PV10%=€74.5 million) ............................................................. 60 Figure 4-11: The pilot PA ecosystems‟ value to Forestry and Hunting under BAU and SEM .................... 61 Figure 4-12: Trends of BAU and SEM scenario for ReNP .......................................................................... 61 Figure 4-13: Trends of BAU and SEM scenario for VNNP ......................................................................... 61 Figure 4-14: Gains to beneficiary groups – SEM ........................................................................................ 62 Figure 4-15: Cumulative added value of SEM over BAU ............................................................................ 63 Figure 4-16: Results of CO2 modelling: example MNP .............................................................................. 64 Figure 4-17: Indirect use values - BAU – carbon sequestration for the 5 pilot PAs (PV@10%=14.4 million EUR) ............................................................................................................................................................ 65 Figure 4-18: Indirect use values - SEM – carbon sequestration for the 5 pilot PAs (PV@10%=20.2 million EUR) ............................................................................................................................................................ 66 Figure 4-19: Baseline value for the ecosystems in the 5 PAs – Agriculture ............................................... 69 .Figure 4-20: Food production value – BAU (PV@10% discount rate, 25 years=€174 mill) ...................... 70 Figure 4-21: Food production value – SEM (PV@10% discount rate over 25 years=€190 mill) ................ 70 Figure 4-22: BAU and SEM scenario values for ANP - best case .............................................................. 71 Figure 4-23: BAU and SEM scenario values for PCNP – worst case ......................................................... 71 Figure 4-24: The pilot PA BAU and SEM values ........................................................................................ 71 Figure 4-25: Potential beneficiaries of SEM over BAU ............................................................................... 72 Figure 4-26: Cumulative value of SEM over BAU ....................................................................................... 72 Figure 4-27:Links between land management and the value of regulating services .................................. 74 Figure 4-28: Example of watersheds identification and mapping - MNP .................................................... 75 Figure 4-29: Year 2010 PA Maramures, soil erosion areas in BAU (first map) and SEM (second map) scenarios (Source: Transilvania University 2012) ...................................................................................... 77 Figure 4-30: Estimated values of the fresh water ecosystems of 5 PAs –urban water supply – BAU (PV@10% discount rate, 25 years =€20.7mill) ........................................................................................... 80 Figure 4-31: Estimated values of the fresh water ecosystems 5 PAs – urban water supply – SEM (PV@10% discount rate, 25 years =€21.5mill) ........................................................................................... 81 Figure 4-32: Estimated values of the FW ecosystems of 5 PAs –urban and bottled water supply – BAU (PV@10% discount rate, 25 years =€176.3mill) ......................................................................................... 81 Figure 4-33: Estimated values of the Fresh Water ecosystems of 5 PAs – urban and bottled water supply – SEM (PV@10% discount rate, 25 years =€177.2mill) ............................................................................. 82 Figure 4-34: Distribution of ecosystems values in MNP - BAU vs. SEM (Public and private) (2011 .......... 82 Figure 4-35: Disaster risk map in MNP (source Transilvania University 2011) .......................................... 85 Figure 4-36: Estimated value of ecosystems in Pilot PAs in terms of flood prevention services ............... 87 Figure 4-37: Potential benefits of the ecosystems in 5 PAs in damage costs reduction – using forest surface approach (Ceroni 2007). ................................................................................................................ 87 Figure 4-38: Costs saved by ecosystem services of Pilot PAs - BAU (PV@10%=10.8 million EUR) ........ 88 Figure 4-39: Costs saved by Ecosystem services of Pilot PAs - SEM (PV@10%=14.5 million EUR) ....... 88

6
Figure 4-40: Costs saved by ecosystem services of the Pilot PAs (preventive costs included) - BAU (PV@10%=67.1 million EUR) ..................................................................................................................... 88 Figure 4-41: Costs saved by Ecosystem services of.Pilot PAs (preventive costs included- SEM (PV@10%=119.3 million EUR) ................................................................................................................... 89 Figure 5-1: FTE Gap Analysis by program area ......................................................................................... 93

7
List of tables Table 0-1 Summary of ecosystems values for the 5 pilot sites ................................................................... 13 Table 2-1: Potential PA ecosystem services and links to productive sectors (Source: Bann & Popa)....... 25 Table 2-2: Overview of how sectors benefit from ES provided by PAs in Romania and management challenges ................................................................................................................................................... 28 Table 2-3: Differences in Management Approaches of BAU and SEM ...................................................... 31 Table 2-4: Comparing BAU and SEM - Potential Indicators ....................................................................... 33 Table 2-5: Scope of Economic Valuation Methods ..................................................................................... 35 Table 3-1: Key features of the pilot sites ..................................................................................................... 38 Table 3-2: Qualitative assessment of PA services and benefits at Pilot Sites ............................................ 39 Table 4-1: Key features of BAU and SEM scenarios for tourism sector in the 5 pilot PAs ......................... 46 Table 4-2: Travel and tourism in pilot PA impact in 2010 (mill EUR) .......................................................... 53 Table 4-3:Summary of BAU and SEM scenario for the forestry sector for the pilot PAs ............................ 57 Table 4-4: Information on forests in pilot PAs ............................................................................................ 58 Table 4-5: CO2 sequestered quantities in 2010 and in a 25 years period in BAU and SEM scenarios ..... 65 Table 4-6: Characterization of BAU and SEM for food production related to PA grazing lands ................. 68 Table 4-7: Carrying capacity of natural pastures within the pilot PAs ........................................................ 68 Table 4-8: Average quantity of eroded soil under the BAU and SEM scenarios ........................................ 76 Table 4-9: Baseline value for water supply for the 5 pilot PAs (Euros per year) ........................................ 79 Table 4-10: Risk level as % of forest coverage under BAU and SEM in targeted PAs. ............................. 85 Table 4-11: Characterization of BAU and SEM values for floods incidence .............................................. 86 Table 5-1: Summary of ecosystems values for the 5 pilot sites .................................................................. 91 Table 5-2: Financial gap analysis by program area, per year ..................................................................... 92 Table 5-3:. Overview of Cost Categorizes .................................................................................................. 92 Table 0-1: Romanian CNPAs) ................................................................................................................. 113 Table 0-2: Qualitative Assessment of Romania Carpathian Protected Areas .......................................... 114

8
Acknowledgments The authors would like to thank the following people for their valuable contributions and support throughout the project - Monica Moldovan (UNDP), Doru Irimie (UNDP), Dragos Mihai (NFA – Romsilva), Robert Pache (NFA – Romsilva), Mircea Verghelet (Director of PCNP), Sebastian Catanoiu (Director, VNNP), Ioan Vasile Abrudan (Transilvania University), Ioan Dutca (Transilvania University), Mihai Nita (Transilvania University), Mihai Zota (Consultant), Marlon Flores (Consultant) and Lucy Emerton (Consultant).
9
EXECUTIVE SUMMARY
Background
The Carpathian Mountains, which extend over an area of 210,000 km2 in Central and Eastern Europe, are
included in the WWF Global 200 Ecoregion list and host Europe's most extensive tracts of montane
forest, the largest remaining natural mountain beech and beech/fir forest ecosystems, and the largest
area of virgin forest left in Europe. Romania holds 54% of the Carpathian mountain range.
The Carpathian Network of Protected Areas (CNPA) is comprised of 285 protected areas that cover
31,978 km2. However this network of Protected Areas (PAs) is considered to be insufficient in terms of
scale, connectivity and management to prevent the irreversible loss of biodiversity in the Carpathian
ecoregion. PAs of the Carpathian mountains face a range of pressures including the overexploitation of
forest resources through logging and poaching and habitat degradation and fragmentation caused by the
construction of roads, houses and tourism infrastructure that is not properly planned and developed
(Project Document, 2009). Futhermore, the Carpathian PAs are underfunded. For example, the 5
Romanian PAs selected for study by this project received around €950,000 in funding in 2010, while
€1,600,000 is considered to be necessary to meet basic needs and around €2,550.000 to optimally
manage the sites (UNDP 2011).
This study sets out the economic and social aruguments for the Romanian CNPAs. More specifically the
study aims to generate evidence of how a sustainably managed CNPAs supports productivity in key
sectors such as tourism, forestry and industry, using key indicators such as employment, tax revenue,
foreign exchange earnings and equity aspects. The study also seeks to demonstrate the costs associated
with unsustainable management. This evidence will be used to convince public and private decision-
makers of the importance of PAs to growth and productivity in key sectors of the Romania economy and
to the welfare of the population in general. Such evidence will provide part of the rationale for better PA
financing. The study also demonstrates the application of the Sector Scenario Analysis (SSA) approach
to PA ecosystems, as an approach that can be replicated at other sites across the network.
Approach
Following the Sector Scenario Analysis (SSA), the analysis is at the sector level, but it starts with an
understanding and quantification of Ecosystem Services. A core part of the SSA approach is the
comparison of two scenarios, Business as Usual (BAU) and Sustainable Ecosystem Management (SEM),
to illustrate the contribution of ecosystem services under two broad management scenarios to key
productive sectors of the economy. The approach aims to go beyond a traditional social cost benefit
analysis (CBA) of policy options, by providing information on a range of indicators, in addition to the Net

10
Present Value (NPV), that are important to decision makers – such as the contribution of an ecosystem
service to employment creation and poverty alleviation.
The pilot sites selected for study are Apuseni Natural Park (ANP), Retezat National Park (ReNP), Piatra
Craiului National Park (PCNP), Vanatori-Neamt Natural Park (VNP) and Maramures Mountains Natural
Park (MNP). The sectors studied are: tourism and recreation; forestry and hunting; agriculture; water
resources; and, disaster risk management.
It is important to note that the valuation estimates presented in this report are not comprehensive, and are
based on a number of assumptions. The study relies on the limited data that are available for the
Romanian system of PAs, and value transfer estimates. The resulting analysis should therefore be seen
as an initial (and incomplete) assessment of the economic contribution of pilot PAs. It is to be hoped that
when new data become available, or as more detailed studies are undertaken, the figures presented in
this report can be supplemented, improved and updated.
Key Findings
The analysis covers an assessment of how ecosystem services provided by the pilot PAs contribute to
tourism and recreation benefits, primary wood production associated with the active management of
forests, NTFP values and hunting carried out in and around PAs, carbon sequestration, food provision
(milk) related to PA pastures, and water provision to the bottled water industry and for urban supply in the
case of the water resources sector. The analysis of disaster mitigation is focused on the damage costs
avoided as a result of the erosion and water flow regulation services provided by the PAs. The key
findings for each sector covered by the study are provided below.
Tourism. The value of tourism and recreational activities for the five pilot PAs is estimated at just over
€109.5 million in 2010. Furthermore tourism has a substantial multiplier effect across the economy. Based
on a study by the World Travel and Tourism Council in 2011 tourism within the pilot PAs generates €365
million (or 0.3% of the GDP). In addition it creates around 37,100 full-time job equivalents. Importantly,
according to the Romanian Ecotourism Association (REA), around 80-90% of eco-tourism expenditure
remains in the areas where the tourism program is operating, benefitting many rural areas. A continuation
of BAU in the 5 pilot PAs may cost Romania‟s economy more than €2.6 billion over the next 25 years in
lost tourism revenue alone.
There are many untapped tourism and recreational opportunities that could be developed in order to
increase revenues from PAs. Tourists and recreational visitors in the 5 pilot PAs are estimated to be
willing to pay almost €42 million a year more than they are currently being charged. However, increased
funding and policy action is required to capture these potential revenue streams. Some sites have more
capacity for tourism development than others. For example, ANP and PCNP are clearly „honey pots‟ are
eco-tourism development should initially focus on these areas.
The main beneficiaries from PA tourism are private tourist operators. Payment for Ecosystem Services
(PES) mechanisms may offer opportunities for PAs administrations to derive finding for i) tourism

11
infrastructure development; ii) management of visitors; iii) biodiversity conservation studies; and, iv)
operating costs.
Forestry. The value of forest provisioning services (timber, Non-timber forest products (NTFP) and
hunting) for the pilot PAs is estimated at around €9.1 million per year (2010). Under BAU forestry
activities may add some €2.8 million over the next 25 years to Romania‟s economy. However, this
revenue will disappear after 30 years as the capacity of PAs to generate economically valuable wood and
NTFP is eroded. This is without taking into consideration the considerable losses in other forest
ecosystem services such as carbon sequestration, water and soil erosion regulation and landscape
provision and tourism. SEM implies a decrease in forest wood, NTFP and hunting values in the short term
and a fall in public income due to compensatory payments for areas taken out of production.
Nevertheless, in the long run, the value of PAs under the SEM scenario will recover, and is projected to
generate a higher Net Present Value (NPV) beyond a 25 year horizon. In addition other ecosystem
services generated and/or maintained by sustainable forestry (e.g. carbon sequestration, water and soil
erosion regulation, landscape) are ensured.
Currently the full potential of NTFP is not being captured. The SEM scenario assumes a significant
increase in NTFP production with Retezat and VNNP PAs showing particular potential in this respect.
Carbon sequestration functions of the forest under SEM could generate an additional €33 million
(cumulative value over 25 years). However, it will not be possible for Romania to access the voluntary
carbon markets, and thereby capture the value of sequestered carbon in protected areas, until central
authorities adopt a clear legal framework and institutional arrangements permitting this (e.g. to monitor
and guarantee the sequestered quantities).
Agriculture. The value of the provisioning service food for the ecosystems of the 5 pilot PAs is estimated
at around €20.0 million in 2010. For the ecosystems where the carrying capacity is exceeded SEM
implies a fall in the value of food provided by pastures in the short and long term. However, the annual
values after 10-15 years are significantly higher than the BAU values. In addition BAU also sometimes
results in irreversible damage to ecosystems. A continuation of BAU in terms of pasture management in
the 5 PAs could cost Romania‟s economy some €84 million over the next 25 years. The success of SEM
however requires motivating local communities to maintain traditional breeding practices.
Water resources. The ecosystems of the pilot PAs provide a number of key regulating services including
soil loss prevention and the regulation of water flow and quality. Water quality and quantity is very
important to the many brands of mineral water sourced from the Carpathian mountains. The estimated
total cumulative value to the economy of SEM relative to BAU of clean water provision, based on water
treatment cost avoided, is estimated at 35.4 million (over 25 years). The NPV of SEM is €0.9 million.
Private water bottling companies are the main beneficiary and are identified as potential partners in
Payment for Ecosystem Services (PES) schemes.
Around 70% of the watershed areas in the PAs are forested and soil erosion is currently well regulated,
as a result there is not a significant monetary difference between the BAU and SEM scenario. However, it
12
is important to note that the benefits provided by the ecosystem services could be lost through increases
pressures on the sites.
Natural disasters. Romania has a long history of natural disasters (floods and landslides). The potential
economic loss associated with these events is estimated at 6% of the GDP accounting for approximately
$2,300 million a year, with an annual probability of occurrence of 0.5 % (World Bank 2008). The quality
and quantity of ecosystems significantly impacts the frequency and severity of natural disasters and the
growing emphasis on PAs could play a central role in risk reduction under sustainable forest ecosystem
management. If the upstream protection functions of the ecosystems of 3 pilot PAs serve to minimize the
impact of floods by just 25% below what it would have been in the absence of the protective functions,
then the ecosystems‟ value of flood control in terms of avoided damage costs (projected on a pro rata
basis) equates to an average of €0.4 million a year – 9 million a year based on a damage cost avoided
and preventative expenditure approach respectively. When applying the damage cost avoided and
preventative expenditure values as upper and lower value limits for the ecosystems of the 5 pilot PAs
over the next 25 years, the water retention regulating services within the PAs in terms of mitigating
natural disasters (flood control), is valued at between € 27 million and €182 million (under BAU) and €44
million and €482 million under SEM.
The results are summarized in the Table below. The NPV of SEM (based on the PV of SEM minus the PV
of BAU) for the 5 sites is estimated at €518 million. The cumulative benefit of SEM for all five PAs is
€2,794 million (i.e. the total benefit of SEM relative to BAU over 25 years). This can be viewed as the
benefit of SEM or the cost to the economy of continuing with BAU.
High level assessment of PA ecosystems at system-level to the economy
There are 21 major protected areas (12 national parks and 10 nature parks) included in the Romanian
CNPA. Based on the analysis of the ecosystems of the 5 pilot protected areas it is possible to derive very
high level estimates of the value of SEM for the Romanian CNPA system as a whole. Scaling up the
values for the 5 pilot areas to the whole network, based on the number of hectares and assuming that the
5 pilot sites are representative of the whole area, provides SEM with a NPV of €1,685 million (and
cumulative value of around €9,000 million over BAU). These should be viewed as very high level, initial
indicative values.

13
Table 0-1 Summary of ecosystems values for the 5 pilot sites
ES
Typ
e
Service BAU Value
(PV @10%,
2011-2035,
mill EUR)
SEM value
(PV@10%,
2011-2035, mill
EUR)
NPV (PV SEM
– PV BAU)
@10%, 2011-
2035, mill
EUR
Total
cumulative
benefit
under SEM
(25 years,
mill EUR)
Pro
vis
ion
ing
Serv
ice
s Food / agriculture products 174.00 190.00 16 83.90
Wood & NTFPs 77.30 74.50 -2.8 -2.80
Water supply (reduced
treatment costs associated
with regulating services of
soil erosion and water flow
regulation)
176.3 177.2 0.9 35.4
Source of energy (fuel etc) 0.00 0.00 .- 0.00
Reg
ula
tin
g
Serv
ices
Regulation of GHGs 14.40 20.20 5.80 33.30
Micro-climate stabilization 0.00 0.00 - 0.00
Soil erosion and water
regulation (storage and
retention) related to
disaster mitigation
10.80 14.40 3.60 17.50
Nutrient retention 0.00 0.00 - 0.00
Cu
ltu
ral
Serv
ices
Spiritual, religious, cultural
heritage
0.00 0.00 - 0.00
Educational 0.00 0.00 - 0.00
Recreation and ecotourism 787.20 1,282.90 494.8 2,626.80
Landscape and amenity 0.00 0.00 - 0.00
Biodiversity non-use 0.00 0.00 - 0.00
TOTAL 1,440.7 2,000.6 556.4 2,794
Conclusions
This study demonstrates that Romania‟s PAs are an important and productive asset providing a
significant flow of economically valuable goods and services. The results show that there are significant
benefits associated with moving from the BAU management of the areas to SEM. The NPV of SEM
(based on the PV of SEM minus the PV of BAU) for the 5 sites is estimated at €518 million. The additional
cumulative value of ecosystems under SEM in the five PAs is estimated at around €2,800 million (over 25
years). However, it is important to recognize that many ecosystem services are being provided/operating
at close to the SEM level (e.g. the watershed protection function of the parks which contributes to soil

14
stabilisation and water flow regulation and purification and grazing lands in some parks). Therefore, the
significant benefits already provided (under the BAU scenario) are at risk if the parks at not sustainably
managed. Note therefore needs to be taken of the values that could be lost as a result of damage or loss
of the ecosystem service. In such cases the significant values under BAU need to be protected and
enhanced where possible.
The results can be taken as an underestimate of the value of the ecosystems in the five pilot sites given
that a number of ecosystem services are not accounted for. These include fisheries, hydropower, micro-
climate stabilisation, nutrient retention, spiritual, religious and cultural heritage, education, landscape and
amenity and biodiversity non-use.
Inevitably movement towards SEM will incur costs – for example SEM for the tourism sector requires
investment in visitor centres, infrastructure and staff to monitoring and manage tourism flows, while SEM
for the forestry and agriculture sector will require compensation payments for restriction imposed on
existing activities. By and large these costs are not included in the analysis and the benefits of SEM may
therefore be overestimated. However based on a high level comparison of the cost of optimally managing
the PAs, the benefits are shown to outweigh the costs many times.
There are a number of uncertainties surrounding the estimates that could be reduced through further
studies. There is uncertainty is related to the valuation approaches used (e.g. benefit transfer has been
used in a number of instances and site specific studies are required for more reliability) and the physical
data (e.g. there are limited surveys of visitor numbers, WTP, CS and tourist profiles). However, of note is
the fact that this study has been able to contribute to the availability of scientific data through the site
specific modelling that has been undertake to determine soil erosion and associated changes in water
flow and quality.
The analysis highlights the difficulties in estimating the regulating services and specifying how regulating
services interact to provide ultimate benefits. For example soil erosion underpins the water quantity and
quality estimates used to estimate water treatment costs. The analysis also highlights the
interdependencies between sectors. For example, ecotourism depends on SEM within agriculture, forest
and the water resources sector.
The key sector benefiting from PAs is shown to be the tourism sector which if sustainably managed has
the potential to generate an additional €2,626 million over the next 25 years (94% of the total additional
value of SEM). It is important to note that this value depends on the continued provision of healthy PAs
ecosystems that contribute to the tourism experience and for which tourists are prepared to pay. While
costs were not included in the BAU-SEM analysis for tourism, based on analysis by NFA-Romsilva (and
assuming costs are constant over 25 years) cumulative cost over 25 years for tourism is estimated at 2.8
million, indicating that that SEM can more than cover its administration and management costs. This
finding should help the Romania CNPAs in its current preparation of a PA entry passes and fees policy.
The significant consumer surplus estimated for tourism and recreational experiences within PAs in
Romania suggests that mechanisms, such as entrance fees, would be successful. Entrance fees can
15
also be used to control demand and minimize impacts on the site. Currently entrance fees are very low or
non-existent, so there is therefore the scope to introduce and increase entrance fees, particularly at sites
where the tourism potential is high. However, realizing the full tourism potential (benefits) is dependent on
the prior investment in tourism and recreational facilities.
SEM is seen to enhance employment, especially in the tourism sector, and has the ability to promote
equitable growth through providing opportunities in rural communities surrounding PAs. The distribution of
the benefits and values among potential beneficiaries is also important, particularly in terms of ensuring
an equitable distribution of benefits and costs and in designing potential PES. There are four main groups
economically impacted by PAs: PAs authorities, other government agencies, the private sector, and
households. They cover most sectors and population groups in the country and include beneficiaries at
local, regional and national levels.
Recommendations
Recommendations have been identified for the sectors studied to facilitate the design of sector specific
policies to sustainably manage important ecosystems services. Separate recommendations for additional
future research, and relating to policy and institutional strengthening have also been identified.
Tourism
Studies to determine appropriate entrance fees at the sites, and how entrance fees should be
introduced and managed.
Improved data collection on visitor numbers. Data should be collected by NIS or by statistical
surveys conducted by professionals on behalf of PA administrations.
Further studies to determine the potential for introducing tourism related PES mechanisms.
Forestry and Hunting
Develop NTFPs management and harvesting as part of a sustainable management strategy for
the forest areas within the protected areas. This will require undertaking more detailed studies of
their capacity and market potential
To realize SEM more areas need to be taken under protection and adequate compensation for
any lost production due to forest land use restrictions needs to be provided.
In terms of PES, opportunities to set up payments from private companies benefiting from NTFP
production should be explored.
Agriculture
Encouraged breeding where the carrying capacity of pastures has not yet been reached. This is
likely to require incentives for farmers. Further consultation with farmers and studies are required
to design an effective incentive mechanism.
Compensate households where breeding / grazing needs to be reduced.

16
Water resources
Explore potential PES schemes. For example, for Bottle water companies to pay a percent of
their revenues to the NEF, which would be used to finance projects submitted by PAs focused on
the sustainable management of mineral water springs.
Further study of the bottle water industry is required to generate data on the efficiency of the
bottling companies (costs for processing and bottling); costs associated with the temporary
stoppage in the delivery of an ES (for example, during heavy rains spring may have too many
nitrates due to infiltration from pastures and need to be closed); and value added along the
production chain.
Natural Disaster Management
Further studies are required to generate data on the cost of damage to public infrastructure,
household damage costs and the frequency of natural disaster events.
General further research needs
Development of PA ecosystem-based PA management plans.
More detailed study of the links between BAU and SEM to employment, tax revenues and other
key indicators in addition to NPV. In most cases the data was not available to report on these
indicators within this study.
Detailed analysis of the costs of SEM
Site specific studies to refine ecosystem valuation estimates. This study has relied largely on
value transfer estimates, there are also very few primary economic valuation studies available in
Romania. To refine the estimates sites specific studies of the sites could be undertaken,
especially for their tourism values which is a key driver for the 5 pilot sites studies.
Refinement of aggregate / system wide assessment.
Establishment of a permanent review group to support research and findings composed of
politicians and academics is recommended.
Policy and Finance
Based on the conclusion and arguments of SEM it is clear that sectors need to introduce policies to
protect PA ecosystems services. Cross sector co-operation is also vital given that a number of sectors
both benefit from and have the ability to degrade ecosystems through their activities. The results of this
study can be used to inform the development of sector policies that ensure the sustainable management
of PA ecosystems and to design sustainable financing mechanisms.
The development of PES and other sustainable financing opportunities is ongoing as part of the broader
UNDP-GEF study. The mechanisms being explored related to tourism, water management and
ecosystem compensation.

17
Institutional aspects
Several institutional reforms are recommended to support the transition to SEM and an ecosystems
based management approach. These include:
Increased capacity for NEF administration to deal with biodiversity conservation applications
and project monitoring;
Establishment of an Association of PA administrations to support administration of funds;
Increased capacity at the NEPA (National Environment Protection Agency) to formally verify
and approve the MP of the PA;
Enhanced Co-ordination between the Ministry of Environment and Forests and the Rural
Development Programme Management Authority to determine a compensation payments
system for forests;
Development of a carbon registry mechanism at the Ministry of Environment and Forests to
initiate movement towards carbon trading;

18
1 Introduction
1.1 Study context
This study is a component of the United Nations Development Programme – Global Environment Facility
(UNDP-GEF) project “Improving the Financial Sustainability of the Carpathian System of Protected Areas
(PAs).‟ The overall objective of the UNDP-GEF project is to secure the financial sustainability of
Romania‟s Carpathian network of PAs, as a model for replication across the entire Carpathian Network of
Protected Areas (CNPA). This is to be achieved through the development of a supportive legislative
framework and sustainable PA financing strategy and the building of institutional and individual capacities
of management authorities and other local stakeholders. The project consist of two main components as
summarized below.
Component 1 of the project - Supportive legislative framework and Sustainable PA Financing
Strategy, consists of the following outputs - (i) development of a set of by-laws and adoption of
amendments to existing laws; (ii) development of a Sustainable Financing Strategy (SFS) for 22 large
PAs in the Romanian portion of the Carpathians; (iii) acheivement of the Government‟s commitment to
gradually increase funding (e.g. 20% yearly increases from 2007 level) for the targeted PAs; (iv)
development of model business plans to demonstrate specific market-based revenue mechanisms for 5
clusters of PAs in the Romanian Carpathians; (v) Validation of a set of PA diversified income-generation
mechanisms (market and non-market options) in at least 3 PAs; and, (vi) Documentation and transfer of
lessons and knowledge to key actors representing PAs from other Carpathian countries.
Component 2 of the project - Institutional and individual capacities of management authorities and
other local stakeholders to realize sustainable financing of PAs developed includes the following
outputs: (i) Training of a critical number of PA finance professionals; (ii) establishment of a Carpathian
National Association of Protected Area managers: (iii) Improved information management linking PA
management plans (programs and activities) with financial management/accounting system; and, (iv) A
strengthen public PA management committee with a mandate to monitor revenue and expenditure of
PAs.
Based on the results of Outputs I and II of component I the project will develop a communications
strategy aimed at decision-makers, private sector executives and civil society. This study will inform the
communications strategy by setting out the economic and social aruguments for the Romanian CNPAs.
More specifically the study aims to generate evidence of how a sustainably managed CNPAs supports
productivity in key sectors such as tourism, forestry and industry, using key indicators such as
employment, job creation, tax revenue, foreign exchange earnings and equity aspects. The study also
seeks to demonstrate the costs associated with unsustainable management. This evidence will be used
to convince public / private decision-makers of the importance of PAs to growth and productivity in key
sectors of the Romania economy and to the welfare of the population in general. Such evidence will
provide part of the rationale for better PA financing.

19
1.2 Objective of study
At present there is little policy-relevant information on the economic value of PAs in Romania, and PAs
are accorded a low budgetary and economic policy priority. Public and corporate decision makers, facing
increasing pressure on funding, tend to allocate less financial resources to PAs relative to other sectors,
which are perceived to be more productive in development terms. Over the past 10 years the Carpathian
PAs in Romania has been underfunded; the 5 pilot PAs selected for study by this project received around
€950,000 in funding in 2010, while €1,600,000 is considered to be necessary to meet basic needs and
around €2,550.000 to optimally manage the sites (UNDP 2011) Therefore, PAs managers face a
challenge in communicating the linkages between PA biodiversity conservation and the wider welfare
benefits to communities and the economy in general.
This study seeks to address this challenge by demonstrating that PAs are an important and productive
asset providing a significant flow of economically valuable goods and services. Economic studies drawing
out the significance of these services in monetary terms and their contribution to local, regional and
national economies can be a powerful way of demonstrating the significance of PAs to decision makers.
The key objectives of this study are to:
Demonstrate the importance of ecosystem services provided in and around protected areas to
the Romanian economy
Demonstrate the application of the Sector Scenario Analysis (SSA) approach to PA ecosystems,
as an approach that can be replicated to other sites across the network.
1.3 Overview of Approach
This study was undertaken over 12 months. Key parties involved in the study were the National Forest
Administration (NFA) – Romsilva, as the project implementing agency, UNDP as coordinator, PAs
administrations as collaborators, different agencies and organizations in each study sector as data
providers and scenarios analysis participants and national and international consultants. The Transilvania
University in Brasov assisted in data collection and compilation for all components of this study.
This study has attempted to apply the Sector Scenario Approach (SSA) to 5 pilot PAs in Romania‟s
Carpathian Mountains. The pilot sites are Apuseni Natural Park (ANP), Retezat National Park (ReNP),
Piatra Craiului National Park (PCNP), Vanatori-Neamt Natural Park (VNP) and Maramures Mountains
Natural Park (MNP). Evidence has been gathered to demonstrate how ecosystem services provided in
and around these PAs support productivity and growth in key sectors of the economy under two
scenarios - Business as Usual (BAU) and Sustainable Ecosystem Management (SEM). The sectors
studied are: tourism and recreation; forestry and hunting; agriculture; water resources; and, disaster risk
management.

20
1.4 Limitations and challenges
The valuation estimates presented in this report are not comprehensive, and are based on a number of
assumptions. The study also relies on the limited data that are available for the Romanian system of PAs,
and value transfer estimates. There are many limitations to the value transfer approach which are mainly
to do with the credibility of applying data about a particular site or ecosystem to another context which
might have very different biological, ecological and socio-economic characteristics. Where transfer values
have been used, a conservative approach has been taken.
The resulting analysis should therefore be seen as an initial (and incomplete) assessment of the
economic contribution of pilot PAs. It is to be hoped that when new data become available, or as more
detailed studies are undertaken, the figures presented in this report can be supplemented, improved and
updated.
1.5 The Carpathian Network of Protected Areas
The Carpathian Mountains extend over an area of 210,000 km2 in Central and Eastern Europe covering
seven countries: The Czech Republic, Hungary, Poland, Romania, Serbia, Slovakia and Ukraine. The
Mountains are included in the WWF “Global 200” Ecoregion list and host Europe's most extensive tracts
of montane forest, the largest remaining natural mountain beech and beech/fir forest ecosystems, and the
largest area of virgin forest left in Europe. In addition to forests, which cover about 90,000 km2,1
, the area
hosts semi-natural habitats such as montane pastures and hay meadows, which are the result of
centuries of traditional management of the land. One-third (3,988 plant species) of all European vascular
plant taxa are found in this region, 481 of which are endemic. The Carpathians form a 'bridge' between
Europe's northern forests and those in the south and west and thereby provide a vital corridor for the
dispersal of plants and animals throughout Europe. It is also the last region in Europe to support viable
populations of large carnivores supporting an estimated 8,000 brown bears, 4,000 wolves, and 3,000 lynx
(Project Document, 2009).
Romania holds 54% of the Carpathian mountain range of medium elevation (1,136m on average) with just
a few peaks exceeding 2,500 meters in altitude.
Under the Carpathian Convention established at The Conference of Kiev in May 20032 all seven range
states have taken measures to protect this ecoregion. The Carpathian Network of Protected Areas
(CNPA) is comprised of 285 protected areas that cover 31,978 km2. However this network of PAs is
1 Romanian Carpathian forest: 55,000 km
2, Slovakia Carpathian forests: 17,500 km
2; Ukrainian Carpathians: 15,000 km
2, Poland
Carpathian forests: 4,800 km2.
2 The Carpathain Convention states that: “The parties shall cooperate in developing an ecological network
in the Carpathians, as a continuant part of the Pan-European Ecological Network, in establishing and
supporting a Carpathian Network of Protected Areas, as well as enhancing conservation and sustainable
management in the areas outside of protected areas”.

21
considered to be insufficient in terms of scale, connectivity and management to prevent the irreversible
loss of biodiversity in the Carpathian ecoregion. Only 17% of the ecoregion is protected, which is very low
when compared with the Alpine Bioregion of Europe that has 35% coverage by the network of Natura
2000 sites. In general, the northwest of the Carpathians is more effectively covered and managed than
the southeast portion (Project Document, 2009). Figure 1-1 illustrates the distribution of Romania‟s
Carpathian PAs.
PAs of the Carpathian mountains face a range of pressures including the overexploitation of forest
resources through logging and poaching which have intensified as a result of land restitution and
privatization; and, habitat degradation and fragmentation caused by the construction of roads, houses and
tourism infrastructure that is not properly planned and developed (Project Document, 2009).
Figure 1-1: Distribution of the Romanian Carpathian PAs
The long term goal for the CNPA is to establish a scientifically-based and representative regional network
of well-managed protected areas that are sustainably financed, provide social and economic benefits, and
ensure the participation of local communities. To achieve this goal, the range states need to improve the
biogeographical representation of protected areas, strengthen management of the sites and secure a
sustainable stream of financing for the PAs. Current finance streams are inadeqaute. For example, in
Romaina the CNPAs currently receive no funding from the national budget and their current annual
income is estimated at US$5 million - half of what is required to implement basic conservation (pay
salaries, utilities, fuel and basic equipment). The UNDP Financial Sustainability Scorecard assessment
estimated that the US$9 million per year is required to achieve a basic level of conservation and US$15
Million a year for an optimal level of conservation (i.e. full implementation of all PA management plans).
22
1.6 Layout of report The rest of this report is organized as follows:
Chapter 2 presents the conceptual framework for the SSA and details how the SSA framework has been
applied in this study.
Chapter 3 provides a summary of the 5 pilot PAs and a qualitative overview of the ecosystem services
that they provide. A more detailed overview of the pilot PAs is provided in Annex 1.
Chapter 4 is the main analytic section of the report. Chapter 4 presents the findings on the contribution of
ecosystems in the pilot PAs to sector growth and welfare for five key sectors - tourism, forestry (including
hunting), agriculture, water resources and disaster management.
Chapter 5 provides a high level estimate of the economic contribution of the Carpathian Arc Ecosystem
as a whole, based on the findings for the 5 pilot PAs, and discusses the requirements for completing a
more robust estimate of the economic importance of the network as a whole. It also provides high level
estimates of the cost of optimally managing the five pilot sites.
Chapter 6 concludes and presents recommendations.

23
2 Conceptual Framework and Methodology
This Chapter sets out the conceptual framework that underpins the methodology adopted in this study,
and an overview of how this conceptual framework was applied.
2.1 Protected Areas and Ecosystem Services
The conceptual framework is grounded in the Ecosystem Services Approach (ESA). An ecosystem (e.g.
forest, wetland, marine area) is a natural unit of living things (animals, plants and micro-organisms) and
their physical environment, e.g. forest, river. Ecosystems services (ES) relate to a flow of resources or
service from the natural environment that directly or indirectly benefit people. The Millennium Ecosystem
Assessment (MA 2005) presents a framework to assist in the identification of ES, classifying them into the
following four categories:
Provisioning services relate to the tangible products, such as timber, non timber forest products
(NTFPs), fish and pharmaceuticals products provided by ecosystems;
Regulating services refer to an ecosystems natural processes such as carbon sequestration and
water regulation that contribute to social wellbeing;
Cultural services relate to the non-material benefits obtained from ecosystems, for example, through
tourism and educational use; and,
Supporting services are necessary for the production of all other ecosystem services (e.g. soil
formation or nutrient cycling). They differ from the other services in that their impacts on people are
either indirect (via provisioning, regulating or cultural services) or occur over a very long time.
The Ecosystem Services Approach (ESA) explicitly recognizes that ecosystems (e.g. forests, wetlands)
and the biological diversity contained within them contribute to individual and social wellbeing. Importantly
it recognizes that this contribution extends beyond the provision of goods such as timber and fish to the
natural regulating functions such as carbon sequestration. The ESA therefore provides a framework for
considering whole ecosystems in decision making and for valuing the services they provide.
It is important to note that economic valuation is focussed on the „final benefits‟ or „outcomes‟ realised by
society from the services an ecosystems provide, not the services and functions that contribute to those
outcomes. This is to avoid double counting. The benefits generated by supporting services, while
fundamental to the provision of final benefits, are not valued independently as they are intermediate benefits
which contribute to the provision of a range of final benefits. Their value is captured in the valuation of the
final outcomes associated with the services they support. Supporting services include soil formation and
retention, primary production and habitat provision.

24
Health is also not explicitly listed as an ecosystem service as health benefits are considered to be
provided by a range of services such as fish, flood protection benefits and a clean environment for
recreation. The health cost associated with a decline in these services may be used to measure the
benefits provided by an ecosystem. Biodiversity is also considered to be cross cutting, the final benefits
of which could be associated with a range of services. An exception is biodiversity non-use which is listed
as a separate service.
The Millennium Ecosystem Assessment (MA, 2005) emphasizes that Protected Areas (PAs) provide
critical ES that support human prosperity and survival, like clean water, flood and storm mitigation, fish
stock replenishment, and carbon sequestration. Conceptually, healthy and bio-diverse ecosystems
generate greater amounts, higher quality, and more stable flows of ES over time. It is therefore critical
that countries establish PA systems to protect viable populations of diverse species and representative
ecosystem samples. The system level approach aims to broaden PAs from a set of scattered sites that
protect few species to a system that provides viable support to biodiversity and ecosystems at the
national or regional level (Flores in Bovarnick et al, 2010), thus further enhancing the provision of vital ES.
A system level approach is being promoted in the Carpathian Mountains.
Table 2-1 provides a typology of ecosystems services that may be associated with a PA. The Table
indicates the likely provision of these services against IUCN‟s PA management categories. Table 2-1 also
notes which sectors of the economy may benefit from the provision of PA ecosystem services.

25
Table 2-1: Potential PA ecosystem services and links to productive sectors (Source: Bann & Popa).
ES
Type
Service Benefit / outcome IUCN PA Management
Categories3
Sectors
supported by
ecosystem
service
I II III IV V VI
Pro
vis
ion
ing
Serv
ices
Food Wild meats, fruits, freshwater fish and
seafood harvested for commercial and
subsistence purposes.
● ● ● ● ●
Households
Fishery, Tourism,
Agriculture
Wood Timber, fuel wood and fibre ●
Households,
Industry
Water Public water supply, water for industrial
and agricultural usage ● ● ● ● ● Agriculture,
Industry, Tourism
Natural medicines Natural medicines ● ● ● ● ●
Household
Biochemicals Biochemicals and genetics ● ● ● ● ● Agriculture
Ornamental
resources
Ornamental resources ● ● ● ● ●
Industry
Source of energy
(fuel etc)
Energy provision e.g., hydropower ● ● ● ● ●
Energy
Reg
ula
tin
g S
erv
ices
Regulation of GHGs Carbon sequestration ● ● ● ● ● ●
Potentially all
Micro-climate
stabilization
Air quality ● ● ● ● ● ●
Potentially all
Water regulation
(storage and
retention)
Flood and storm protection
● ● ● ● ● ●
Tourism, Industry,
Households,
agriculture
Waste processing Detoxification of water and sediment /
waste ● ● ● ● ● ●
Tourism, Industry,
Households,
agriculture
Nutrient retention Improved water quality ● ● ● ● ● ●
Fisheries,
Agriculture
Cu
ltu
ral S
erv
ices
Spiritual, religious,
cultural heritage
Use of environment in books, film,
painting, folklore, national symbols,
architecture, advertising
● ● ● ● ● ●
Tourism,
Households
Educational A „natural field laboratory‟ for
understanding biological processes ● ● ● ● ●
Households
Recreation and
ecotourism
Bird watching, hiking, canoeing, ● ● ● ● ● ●
Tourism
Landscape and
amenity
Property price premiums due to views ● ● ● ● ●
Tourism,
Households
Biodiversity non-use Enhanced wellbeing associated for
example with bequest or altruistic
motivations
● ● ● ● ● ●
Potentially all
3 Ia Strict Nature Reserve; Ib Wilderness Area; II National Park; III Natural Monument or Feature; IV Habitat/Species Management
Area; V Protected Landscape/ Seascape; VI Protected area with sustainable use of natural resources.
26
2.2 Sector Scenario Analysis
2.2.1 Overview
The Sector Scenario Analysis (SSA) was applied in a major study by UNDP in the Latin American and the
Caribbean (LAC) in 2010 (Bovarnick et al 2010). A guidebook for its broader application is currently under
development. The analysis is at the sector level, but it starts with an understanding and quantification of
ES. A core part of the SSA approach is the comparison of two scenarios, Business as Usual (BAU) and
Sustainable Ecosystem Management (SEM), to illustrate the contribution of ecosystem services under
two broad management scenarios to key productive sectors of the economy. The approach aims to go
beyond a traditional social cost benefit analysis (CBA) of policy options, by providing information on a
range of indicators, in addition to the Net Present Value (NPV), that are important to decision makers –
such as the contribution of an ecosystem service to employment creation and poverty alleviation.
The analysis lends itself to the generation of politician-friendly data. An ecosystem-centric approach cuts
across sectors and ministerial mandates, whereas a sectoral approach aligns with the organization of
Ministries. It can therefore be used to facilitate the incorporation of ES values and their management into
economic planning, policy and investment at the sectoral level.
Key questions that the approach seeks to answer include:
To what extent do key sectors depend economically on the natural inputs of PAs?
What opportunities do these sectors have to benefit from maintaining ES?
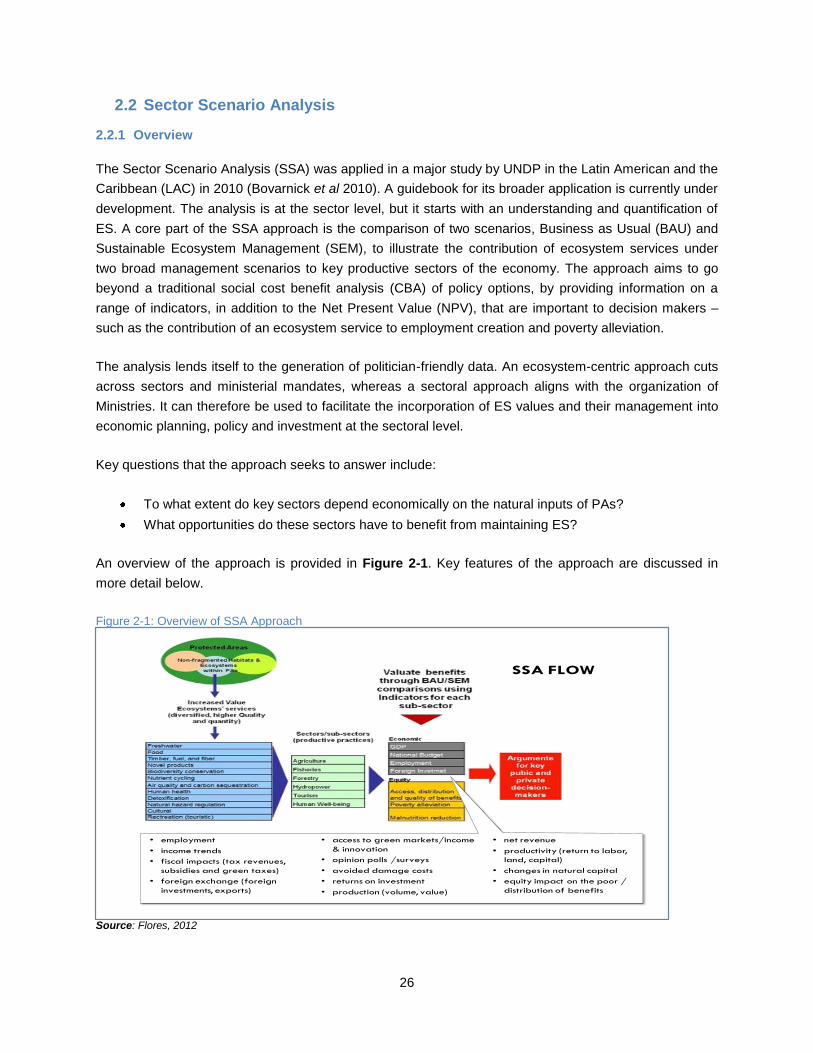
An overview of the approach is provided in Figure 2-1. Key features of the approach are discussed in
more detail below.
Figure 2-1: Overview of SSA Approach
33
• employment
• income trends
• fiscal impacts (tax revenues,
subsidies and green taxes)
• foreign exchange (foreign
investments, exports)
• access to green markets/income
& innovation
• opinion polls /surveys
• avoided damage costs
• returns on investment
• production (volume, value)
• net revenue
• productivity (return to labor,
land, capital)
• changes in natural capital
• equity impact on the poor /
distribution of benefits
SSA FLOW
Source: Flores, 2012

27
2.2.2 Sector Focus
The approach considers the ES provided by PAs as inputs into a country‟s economic sectors and
presents data on the economic value of ES to each sector.
Ecosystems within Romania‟s PAs provide ecosystem services (ES) such as water provision and
regulation, soil fertility, pollination, pest control, growth and reproduction of food species, storm mitigation,
climate regulation and waste assimilation, which directly and indirectly provide inputs into the production
of key sectors in Romania‟s economy. Key sectors benefiting from the ES provided by PAs include -
agriculture, fisheries, forestry, nature-based tourism, human settlements and hydropower. The
contribution of ES to sector productivity and growth can be degraded and lost under BAU scenarios and
enhanced under SEM.
The logic to drawing out the contribution of ES under different management regimes to key sectors is that
it can provide a comprehensive and tailored argument to present to sector Ministries. This can facilitate
the integration of ecosystem management and protection into key sector plans and strategies, and aid
negotiations with other Ministries were the management of an ES by one sector clearly impacts its
provision to another (for example, the tourism sector may be adversely impacted by unsustainable
agricultural or forestry practices).Table 2-2 highlights how ES can contribute to different sectors.

28
Table 2-2: Overview of how sectors benefit from ES provided by PAs in Romania and management challenges Sector Key ES Management challenges / Issues
Agriculture A sustainable, high-quality water supply depends on well-maintained ecosystems that are often preserved within PAs. Water is critical for irrigation and other uses. More than 80% of Romania's water supply (excluding the Danube) and 40% of Ukraine's water supply comes from the Carpathians (Project Document, 2009). Therefore water provision services are important. Forest PAs provide natural habitats for genetically-important crop wild relatives, and many species that pollinate crops and control pests.
These services are frequently under-valued and provided for free encouraging overuse. Further research is needed to assess the links between reduced water quality, lower flows, and PA ecosystem management. PAs can be of use in developing solutions to degradation in freshwater ecosystems.
Forestry The Carpathians host Europe's most extensive tracts of montane forest, the largest remaining natural mountain beech and beech/fir forest ecosystems, and the largest area of virgin forest left in Europe. The Carpathian forests cover about 90,000 km
2.
Carpathian PAs therefore provide an important carbon storage service. Payments for carbon storage in Carpathian PAs could mean a significant revenue (i.e., foreign exchange transfers and funding to pay for the transition to SEM). The argument for that is valid if PAs are under direct threat of deforestation.
Under BAU, direct threats to (Romania‟s) Carpathian forests include illegal logging and infrastructure development. Furthermore, current Income from taxes, timber, and forest products is low sending incorrect signals to the market and negatively impacting government expenditure for forest management. Taxes and fees on timber and other forest products need to be set at appropriate levels, so that the Government has a vested interest in sound forest management, sustainable commercial logging, and prevention of illegal activity, to ensure future revenue flows. This is relevant to PAs that allow sustainable use of forest resources.
Nature Tourism
PAs contribute to nature-based tourism (NBT) / ecotourism. This depends on the natural attractions provided by PAs, such as the habitats with wild plants and animals, exotic foods, fresh water and air, viewscapes, and cultural services essential to NBT. Tourists find NBT experiences, trekking, wild life viewing (including bird-watching), hunting, whitewater rafting, kayaking, and canoeing, more valuable when they take place in healthy ecosystems, such as those found in PAs (Flores, in Bovarnick et al 2010).
Under BAU PA-based NBT is undermined by insufficient investment in the conditions required to manage NBT and the supporting PA well resulting in negative external costs. It is assumed that if PAs shift to SEM practices, NBT will generate greater economic value.
Human Settlements
Human settlements benefit from PAs through the provision of a variety of critical services such as the provision of fresh water, regulation of natural hazards, and natural mitigation of climate change. Forest and wetland PAs provide cheap, clean drinking water to countless rural and urban populations, including a third of the world‟s most populated cities (Dudley et al. 2010). Well-managed natural forests almost always provide higher quality water, with less sediment and fewer pollutants than water from other catchments (Aylward, 2000). Research has shown that about a third (33 out of 105) of the world‟s largest cities obtain a significant portion of their drinking water directly from PAs (Dudley et al. 2010).
Watershed conservation can greatly improve water quality and quantity, reducing water treatment costs.
Hydropower
PA can provide water for hydropower production Poor PA management results in sedimentation of waterways and reduced water for hydropower. Under SEM sedimentation is reduced supporting hydropower production and also benefiting irrigated agriculture and potable water supplies.

29
2.2.3 Ecosystem management scenarios – BAU and SEM
The approach aims to provide evidence of the economic benefits, both direct and indirect, of PA
ecosystems. The analysis looks at these benefits in terms of the potential decline in productivity due to
ecosystem degradation that would result from no action or change (BAU) and compares it to productivity
and under SEM. The Business as Usual (BAU) and Sustainable Ecosystem Management (SEM) are
generic scenarios used as the basis for assessing the economic values of ecosystem services (ES).
These two management scenarios are described below, based on Flores in Bovarnick et al, 2010.
2.2.3.1 Business as Usual
Under BAU PAs are underfunded, lack management capacity and face severe threats. They are unlikely
to provide basic protection to biodiversity and ecosystems functions. This is the case in Romania where
the funding gap to provide a basic level of conservation is estimated at US$5 million a year and US$9
million a year to provide an optimal level of conservation.
Under BAU, planning and management functions are typically supported by limited human, financial,
institutional, and informational resources (Lockwood et al. 2006). Too often, PA conservation goals and
objectives are poorly linked to conservation programs and costs, and existing budgets are not linked to
programmatic priorities. Altogether, this makes it difficult to measure effectiveness, estimate realistic
needs, and determine financial gaps. Further, at national levels in the BAU scenario, domestic funding for
PAs is often stagnant as a result of constrained national budgets, obsolete legal and regulatory
frameworks, lack of transparency, poor accountability, as well as a lack of political will to support
“greening” of national development plans. Protected area budgets may simply be based on previous-year
expenses, while transfers to PA system agencies are often late and less than what was actually
approved; and due to limited implementation capacity, protected area agencies often fail to execute their
allocated resources.
BAU is characterized by a focus on short-term gains (e.g. < 10 years), externalization of impacts and their
costs, and little or no recognition of the economic value of ES.
2.2.3.2 Sustainable Ecosystem management (SEM)
Under SEM, funding and capacity are available to meet basic to optimal protection needs. SEM is
understood as an advanced management approach in which protected area management functions are
more aligned with human, financial, institutional, and informational resources. In SEM, protected area‟s
conservation goals and objectives are linked to ecosystems conservation programs and are realistically
linked to funding. As a result, ecosystem health improves and their benefits, in terms of increased
productivity and equity, expand. By and large, the benefits of SEM outweigh its costs.
Under a SEM scenario, the focus is on long-term gains (10-20 years), while the costs of impacts are
internalized. Degradation of ES is avoided, thereby generating potential for a long-term flow of ecosystem
30
goods and services. SEM practices tend to support ecosystem sustainability, not for ideological reasons,
but, rather, as a practical, cost-effective way to realize long-run profits.
SEM complements the commonly used ‟protected area management effectiveness‟ (PAME) approach.
PAME is used to assess how well a PA is managed, that is the extent to which it is protecting values, and
achieving goals and objectives (Hockings et al. 2006). SEM brings an additional dimension of ecosystems
management, namely a better understanding of the economic costs of ES loss in PAs. A key feature of
SEM is adequate funding, and the SSA approach aims to build economic arguments to promote
increased funding to protect biodiversity and ecosystems in PAs.
The Costs of SEM. The provision of PA benefits, however, is not free; there are significant costs
associated with PA management, both in terms of direct expenditures, and in terms of indirect costs or
impacts, and opportunity costs (alternative uses foregone). Governments must either set aside funding for
PAs every year or establish self-financing mechanisms. The tendency of direct expense to grow with
improved PA coverage or quality provides an easy argument for those that choose to favour BAU with its
short-term gains, which can be quite attractive, even if resource-depleting.
In many cases, PA management programs include both characteristics of BAU and SEM. The shift from
BAU Table 2-3 summarises the key differences between the two management approaches.
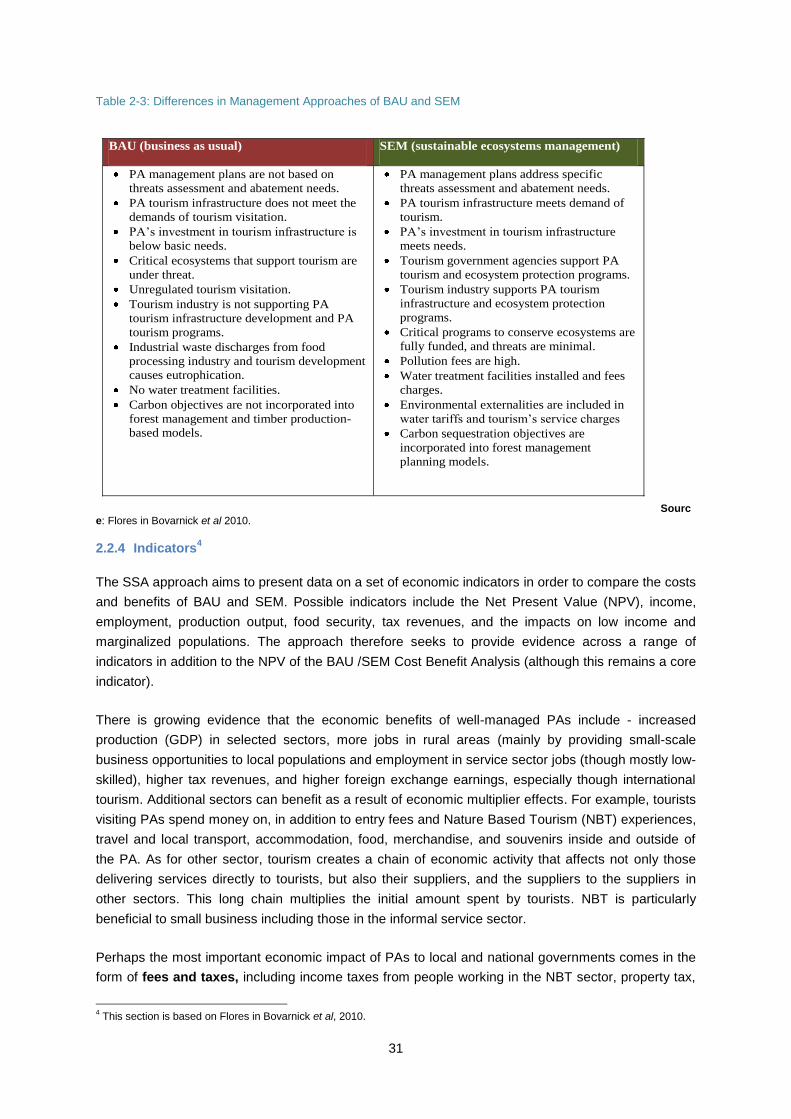
31
Table 2-3: Differences in Management Approaches of BAU and SEM
BAU (business as usual) SEM (sustainable ecosystems management)
PA management plans are not based on
threats assessment and abatement needs.
PA tourism infrastructure does not meet the
demands of tourism visitation.
PA’s investment in tourism infrastructure is
below basic needs.
Critical ecosystems that support tourism are
under threat.
Unregulated tourism visitation.
Tourism industry is not supporting PA
tourism infrastructure development and PA
tourism programs.
Industrial waste discharges from food
processing industry and tourism development
causes eutrophication.
No water treatment facilities.
Carbon objectives are not incorporated into
forest management and timber production-
based models.
PA management plans address specific
threats assessment and abatement needs.
PA tourism infrastructure meets demand of
tourism.
PA’s investment in tourism infrastructure
meets needs.
Tourism government agencies support PA
tourism and ecosystem protection programs.
Tourism industry supports PA tourism
infrastructure and ecosystem protection
programs.
Critical programs to conserve ecosystems are
fully funded, and threats are minimal.
Pollution fees are high.
Water treatment facilities installed and fees
charges.
Environmental externalities are included in
water tariffs and tourism’s service charges
Carbon sequestration objectives are
incorporated into forest management
planning models.
Source: Flores in Bovarnick et al 2010.
2.2.4 Indicators4
The SSA approach aims to present data on a set of economic indicators in order to compare the costs
and benefits of BAU and SEM. Possible indicators include the Net Present Value (NPV), income,
employment, production output, food security, tax revenues, and the impacts on low income and
marginalized populations. The approach therefore seeks to provide evidence across a range of
indicators in addition to the NPV of the BAU /SEM Cost Benefit Analysis (although this remains a core
indicator).
There is growing evidence that the economic benefits of well-managed PAs include - increased
production (GDP) in selected sectors, more jobs in rural areas (mainly by providing small-scale
business opportunities to local populations and employment in service sector jobs (though mostly low-
skilled), higher tax revenues, and higher foreign exchange earnings, especially though international
tourism. Additional sectors can benefit as a result of economic multiplier effects. For example, tourists
visiting PAs spend money on, in addition to entry fees and Nature Based Tourism (NBT) experiences,
travel and local transport, accommodation, food, merchandise, and souvenirs inside and outside of
the PA. As for other sector, tourism creates a chain of economic activity that affects not only those
delivering services directly to tourists, but also their suppliers, and the suppliers to the suppliers in
other sectors. This long chain multiplies the initial amount spent by tourists. NBT is particularly
beneficial to small business including those in the informal service sector.
Perhaps the most important economic impact of PAs to local and national governments comes in the
form of fees and taxes, including income taxes from people working in the NBT sector, property tax,
4 This section is based on Flores in Bovarnick et al, 2010.
32
VAT, export tax, entry fees, and royalties from concessions. In the US, for example, the travel and
tourism industry generates about US$105 billion in tax revenues annually. These revenues can be
severely undermined by BAU practices: poor investment in tourism in PAs and the conditions of
absent or non-functional tax collection systems. Tourism is the main foreign exchange earner for
many developing countries.
PAs can also have an important influence on equity and poverty alleviation, benefiting communities
within or near to PAs and society at large. Engagement of nearby communities and other
stakeholders is a key feature of SEM. This will help ensure that externalities are taken into account
and that all affected parties are integrated into the planning and implementation process resulting in
sustainable and equitable outcomes conducive to poverty alleviation. Assessing the effects of PAs on
poverty is however complex, requiring consideration of a range of factors related to rural populations
such as income, livelihood security, access to infrastructure and markets, education, empowerment,
gender, health, and access to natural resources.
Indicators that can be used to compare SEM and BAU across key sectors are summarized in Table
2-4.

33
Table 2-4: Comparing BAU and SEM - Potential Indicators
Indicators
Productive sectors Well-being Comparison
Fo
restr
y
Ag
ricu
ltu
re
Fis
he
ries
Hyd
rop
ow
er
Ind
us
try
To
uri
sm
Natu
ral
dis
aste
r
mit
iga
tio
n
Wate
r su
pp
ly
co
vera
ge
Ru
ral
livelih
oo
ds
BAU SEM
Net Present Value ●
●
●
●
●
●
●
●
? ?
Employment (direct, indirect, induced) ●
●
●
●
●
●
? ?
Income trends ●
●
●
●
●
●
●
? ?
Fiscal impacts (tax revenues, subsidies and green taxes)
●
●
●
●
●
●
? ?
Foreign exchange (foreign investments, exports)
●
●
●
●
●
●
? ?
Access to green markets / income and innovation potential)
●
●
●
●
●
●
●
? ?
Avoided damage costs ●
? ?
Returns on investment ●
●
●
●
●
●
●
●
●
? ?
Production (volume, value) ●
●
●
●
●
●
●
●
●
? ?
Changes in natural capital ●
●
●
●
●
●
? ?
Equity impacts on the poor / distribution of benefits
●
●
? ?
Opinion polls/surveys ●
●
●
●
●
●
●
●
●
? ?
Source: Flores, 2012
2.2.5 The Importance of Time
The methodology recognizes that for policy makers, static (time bound) point data is of limited value.
In a situation when choices need to be made between different types of land-use and development
practices, the current total value of an ecosystem reveals nothing about how that value might change
over time, the current quality of the resources and if current management practices are sustainable or
not. The current value of a resource may be high but be based on unsustainable rates of resource
depletion and in the extreme may result in ecosystem collapse. It is therefore important to evaluate
how ecosystem services might be reduced through damaging management practices or enhanced
through sustainable management over a suitable time horizon.
Figure 2-2 illustrates one possible scenario. In this case, BAU profits exceed those of SEM in the
short run, but ecosystem degradation gradually decreases them. SEM net revenues are negative in
the first years, as sunk investment costs take a toll. In such situations Government policies can either
target the up-front costs (e.g. technical assistance) or promote a longer planning horizon (e.g. cheap
access to credit) (Bovarnick et al, 2010). Therefore to make well-informed decisions, decision makers
need a cost benefit analysis that includes a sensible time dimension that tracks resource depletion
over time under different management practices.

34
Figure 2-2: Shifting patterns of BAU /SEM
Source: Bovarnick et al, 2010
2.2.6 Valuing Ecosystem services
In undertaking a social cost benefit analysis of the BAU SEM management scenarios a range of
valuation approaches may be adopted to estimate the market and non-marketed ecosystem services
provided. These approaches are well documented in the environmental economics literature. This
section provides an overview of available valuation approaches along with references to other
sources where more detail on key valuation approaches may be found. The main categories of
valuation approaches are as follows:
Market price approaches: Consider use values associated with ecosystem goods and services
that are bought and sold in actual markets.
Productivity approaches: Focus on the relationship between an ecosystem service (e.g. the
provision of clean water) and the production of a market good (e.g. agricultural crops). The use
value of ecosystem service is inferred by changes in production that result from changes in the
ecosystem as an input to production (e.g. quantity or quality).
Revealed preference methods: Estimate the use value of ecosystem non-market goods and
services by observing behaviour related to market goods and services that can be linked to the
ecosystem service in some way. For example the travel cost method may be used to value
tourism in PAs where there are no entrance fees through the cost (both money and time)
incurred in undertaking the tourism activities.
Stated preference methods: These survey based approaches create hypothetical markets to
determine the value of non-market goods and services. Individuals are typically asked what they
would be willing to pay or accept for a specified change in the provision of an ecosystem service.
Stated preference techniques are the only approaches that can estimate all the various
components of Total Economic Value (TEV) - direct and indirect use value and non-use value.
Broadly speaking market price and productivity approaches are ordinarily applied to value market
goods and services, while revealed preference and stated preference approaches are applied to
value non-market goods and services. However, there can be overlaps between methods and often

35
combinations of methods are required for informed decision-making for specific management issues.
Table 2-5 summarises the scope of the different valuation methods5.
Table 2-5: Scope of Economic Valuation Methods
Valuation Method Component of TEV Scope – types of goods and services
Market pricing methods Use value (direct and indirect)
Market goods and services and market substitutes (for non-market goods and services)
Direct use value: limited to commodities (e.g. fish, timber) or the contribution of ecosystem services such as water provision to marketed products (e.g. agriculture, forestry, fisheries, manufacturing, power generation)
Indirect use value: estimating avoided damage (e.g. from flooding) or marketed substitutes (e.g. cost of water treatment) or tangible impacts (e.g. cost of illness)
Production input methods (e.g. production function approach)
Use value (direct and indirect)
Market goods and services
Use value: Limited to the role of ES as an input to production processes (e.g. the effect of water quality on agriculture).
Revealed preference methods
Hedonic pricing (e.g. hedonic property pricing)
Use value (direct and indirect)
Non-market goods and services
Use value: The contribution of ES to environmental amenity that can be observed from markets (e.g. property market).
Travel cost method Use value (direct and indirect)
Non-market goods and services
Use value: The contribution of ES to recreation and tourism activities that is revealed by the travel costs incurred by users.
Multi-site recreation demand models
Use value (direct and indirect)
Non-market goods and services
Use value: The contribution of ecosystems to recreation activities that is revealed by the choice decisions (i.e. whether to visit a specific site or not) and travel costs incurred by recreation users.
Stated preference methods
Contingent valuation TEV (use and non-use value)
Non-market goods and services
TEV: The contribution of ecosystems to most non-market goods and services can be captured by contingent valuation.
Choice modeling (e.g. choice experiment)
TEV (use and non-use value)
Non-market goods and services
TEV: The contribution of ecosystems to most non-market goods and services can be captured by choice modeling approaches.
Benefits transfer
Unit value transfer / function transfer
TEV (use and non-use value), depending on evidence used
All of the above depending on the type of study from which evidence is sourced.
Source: Adapted from Worley Parsons Canada Ltd and eftec (2009)
5 For more information on the hedonic pricing approach see Taylor, L. 2003. „The hedonic method‟, in Champ, P., Boyle, K.,
and Brown, T (eds) (2003) A primer in Non-market valuation. Dordrecht: Klwuer; Maler K-G (1974) Environmental Economics, John Hopkins University Press for Resources for the Future, Baltimore. For more information on the TCM see: Bockstael, N.E and McConnell, K.E. (2006) Environmental and Resource Valuation with Revealed Preferences: A Theoretical Guide to Empirical Models, Springer; Ward, F.A. and Beal, D.J. (2000) Valuing nature with travel costs models: a manual, Edward Elgar Publishing; Kanninen, B. (2006) Valuing Environmental Amenities Using Stated Choice Studies: A Common Sense Approach to Theory and Practice, Springer. For more information on stated preference methods see: Arrow, K.R. Solow, P.R. Portney, E.E. Leamer, R. Radner, and H. Schuman „Report of the NOAA Panel on Contingent Valuation‟. Federal Register 58 (1993): 4601-14. Bateman, I., Carson, R.T. Day, B. Hanemann, M. Hanley, N. Hett, T. Jones-Lee, M.Loomes, G. Mourato, S. Ozdemiroglu, E. Pearce, D.W. Sudgen, R. and Swanson, J. (2002). Economic Valuation with Stated Preference Techniques: A Manual, Edward Elgar, Cheltenham, UK.

36
2.2.7 Overview of methodology
The conceptual framework presented in Sections 2.1 and 2.2 serves as a guide for the application of
the SSA approach. However, in reality, the research effort has to be tailored to match priority areas of
research and available resources. This section details the approach used in this study. An overview of
the methodological steps is provided in Figure 2-3.
This valuation study is focuses on 5 pilot PAs: Apuseni Natural Park (ANP), Retezat National Park
(RNP), Piatra Craiului National Park (PCNP), Vanatori-Neamt Natural Park (VNP) and Maramures
Mountains Natural Park (MNP). The study involved analysis of key ecosystem service values for each
of the 5 pilot PAs and looked at the economic linkages between PA ecosystem services, production
practices and outputs in the following productive - agriculture, tourism, forestry, water supply and
disaster prevention/mitigation. At the same time, the study looks at how economic costs and benefits
are distributed: within and between sectors and socioeconomic groups identifying winners and losers
from alternative PA/ecosystem management approaches and scenarios.
Two scenarios are analyzed – BAU and SEM. The Business As Usual Scenario illustrates what would
happen if current practices and activities continue at their current level of (chronic) under-financing.
Under this scenario on-going ecosystem degradation and loss is anticipated. The SEM scenario
reflects an effective, well-managed and adequately-funded PAs management. The study examines
the state of ecosystems under each scenario, the goods and services provided, and the impact on
local and national economic output and wellbeing where possible.
The study extrapolates the few data that are available for Romanian system of PAs, and of necessity
employs value transfers. The primary source of data is valuation studies that have been carried out in
Central, South and Eastern European countries with similar economic, institutional and ecological
conditions to Romania. All values have been adjusted to bring them to 2012 Romania price levels,
applying a consumer price index (CPI) deflator to account for domestic inflation, and using
appropriate Gross Domestic Product Purchasing Power Parity (GDP PPP) conversion rates to
equalise differences between Romania and other countries.
The aim of the SSA of the pilot PAs is to provide local decision makers with arguments for investing in
PAs conservation, and to generate information that could be directly incorporated into pilot PAs
business plans. Key messages for Romania‟s CNPA have also been drawn from these representative
sites.

37
Figure 2-3: Key methodological steps
Scoping Select pilot sites and develop a conceptual understanding of physical characteristics, uses, threats and key Ecosystem Services for pilot sites.
Select key sectors
Select key Ecosystem Services for study
Determine indicators to be used to assess BAU and SEM scenarios
Data
collection Collect data on Ecosystem services selected for study for each
sector (biophysical data, market data, existing valuation studies, data on key indicators)
Define
scenarios Define BAU and SEM scenarios for each sector, taking into
consideration data availability
Analysis Valuation of ES using appropriate valuation technique, and analysis of other key indicators selected for the SSA
Modelling provision of ES under BAU and SEM and the benefits of ES provision / cost of ES degradation under each scenario using key indicators selected for each sector
Distributional analysis – understanding who wins and losers under the different scenarios
Reporting Statement of how sectors benefit from PA related Ecosystems services and recommendations to optimise their flow
Opportunities for mainstreaming economic evidence in sectoral plans and strategies
System level analysis
Priority areas for further research

38
3 The CNPAs and the targeted PAs in Romania
3.1 Targeted PAs in Romania
The main features of the five Carpathian pilot PAs are summarized in Table 3-1. More detail on each
PA is provided in Annex 1.
Table 3-1: Key features of the pilot sites PA Area (ha) Location Key characteristics
Apuseni Natural Park (ANP) 148,850 Western Romania, Central-North Western side of Apuseni Mountains, covering parts of Cluj, Bihor and Alba Counties
Biodiversity, karst landscape, local tradition in wood processing, cultural heritage
Maramures Mountains Natural Park (MNP)
148,850 North Romania, covering almost all the area of Maramures Mountains, northern – eastern part of Maramures County
Biodiversity, mountain landscape, local tradition in architecture and natural products, cultural and historic heritage
Piatra Craiului National Park (PCNP)
14,773 Meridional Carpathians, Central Romania, stretching over the counties of Brasov and Arges,
Longest lime edge in the country, local traditions and architecture, biodiversity
Retezat National Park (ReNP)
38,138 Western part of Romania, part of the Retezat – Godeanu masiff, stretching over the counties of Hunedoara, Caras – Severin and Gorj.
Glaciar lakes, mountain landscape, biodiversity, local traditions
Vanatori Neamt Natural Park (VNNP)
30,818 North-western part of Romania, eastern slope of the Oriental Carpathians (Neamt Mountains) and under mountains hills of Neamt, stretching over the county of Neamt
Vegetation low mountains landscape, local ethnic and spiritual traditions, historic and cultural heritage of the communities, biodiversity, Bison bonasus repopulation
Source: Management plans for the 5 PAs.
3.2 Qualitative assessment of ES provided by pilot PAs
Natural and National Parks in Romania‟s Carpathians provide a wide range of ES, which support the
productivity of many sectors and benefit individuals. The differences between parks in terms of the
ecosystem services they provide are not significant, but it is possible to identify ES of particular
importance for each PA. The variation between parks in terms of ecosystem services provision is a
result of the differences in their natural features, protection and conservation goals, maturity based on
when the park and park administration were established, and, management efforts and processes in
place. A qualitative assessment of the ES provided by the pilot PAs can be seen in Table 3-2. It is
evident from Table 3-2 that the majority of ES are provided across the sites, with micro-climate
stabilization, water regulation and recreation and tourism considered to be important at all sites. Table
3-12 also identifies the sectors that benefit from the provision of a given ES and in turn the sectors
that may impact the provision of ES through their activities. For example, industry, households and
the tourism sector benefit from water provision, however the quality and quantity of water will be
impacted by, for example, agricultural practices (such as the use of agrochemicals) and forestry
(extraction practices).
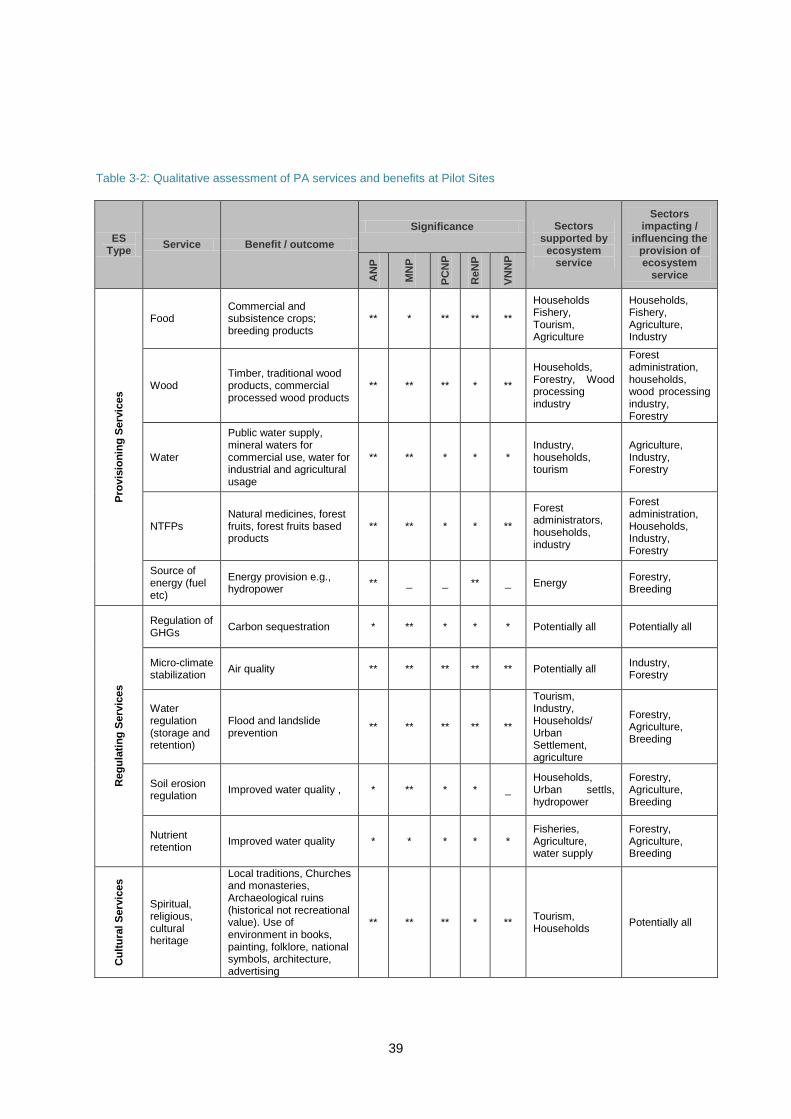
39
Table 3-2: Qualitative assessment of PA services and benefits at Pilot Sites
ES Type
Service Benefit / outcome
Significance Sectors supported by
ecosystem service
Sectors impacting /
influencing the provision of ecosystem
service AN
P
MN
P
PC
NP
ReN
P
VN
NP
Pro
vis
ion
ing
Serv
ices
Food Commercial and subsistence crops; breeding products
** * ** ** **
Households Fishery, Tourism, Agriculture
Households, Fishery, Agriculture, Industry
Wood Timber, traditional wood products, commercial processed wood products
** ** ** * **
Households, Forestry, Wood processing industry
Forest administration, households, wood processing industry, Forestry
Water
Public water supply, mineral waters for commercial use, water for industrial and agricultural usage
** ** * * * Industry, households, tourism
Agriculture, Industry, Forestry
NTFPs Natural medicines, forest fruits, forest fruits based products
** ** * * **
Forest administrators, households, industry
Forest administration, Households, Industry, Forestry
Source of energy (fuel etc)
Energy provision e.g., hydropower
** _ _ ** _ Energy Forestry, Breeding
Reg
ula
tin
g S
erv
ices
Regulation of GHGs
Carbon sequestration * ** * * * Potentially all Potentially all
Micro-climate stabilization
Air quality ** ** ** ** ** Potentially all Industry, Forestry
Water regulation (storage and retention)
Flood and landslide prevention
** ** ** ** **
Tourism, Industry, Households/ Urban Settlement, agriculture
Forestry, Agriculture, Breeding
Soil erosion regulation
Improved water quality , * ** * * _ Households, Urban settls, hydropower
Forestry, Agriculture, Breeding
Nutrient retention
Improved water quality * * * * * Fisheries, Agriculture, water supply
Forestry, Agriculture, Breeding
Cu
ltu
ral S
erv
ices
Spiritual, religious, cultural heritage
Local traditions, Churches and monasteries, Archaeological ruins (historical not recreational value). Use of environment in books, painting, folklore, national symbols, architecture, advertising
** ** ** * ** Tourism, Households
Potentially all

40
Educational A „natural field laboratory‟ for understanding biological processes
? ? * * * Households Potentially all
Recreation and ecotourism
Recreational fishing and hunting, birdwatching, hiking, Holiday destination (aesthetic views), archaeological ruins (historical not recreational value)
** ** ** ** ** Tourism Potentially all
Landscape and amenity
Property price premiums due to views
? ? * * _ Tourism Potentially all
Biodiversity non-use
Enhanced wellbeing associated for example with bequest or altruistic motivations
? ? * * * Potentially all Potentially all
Code: ** service important, * service provided, - service not relevant,? uncertain of provision
Source: Based on interviews with the Administrative Directors of the PAs and the PA Management Plans.

41
4 The Contribution of Ecosystems in PAs to sector growth & welfare
This Chapter examines the economic contribution of the 5 pilot PAs to the tourism, forestry and
agricultural and water resources sector, and to disaster mitigation in Romania. It covers an
assessment of tourism and recreation benefits in the case of the tourism sector, primary wood
production associated with the active management of forests, the value of NTFP and hunting carried
out in and around PAs and carbon sequestration values in the case of the forest sector, food provision
(milk) related to PA pastures in the case of the agriculture sector and water provision to the bottled
water industry and for urban supply in the case of the water resources sector. The analysis of disaster
mitigation is focused on the damage costs avoided as a result of the erosion and water flow regulation
services provided by the PAs.
For each sector the following format has been followed: (i) a box summarizing the key findings for
each sector; (ii) an introduction to the sector specifying the ecosystem services of interest; (iii) an
overview of the current situation in Romania; (iv) a description of the two scenarios modeled (BAU
and SEM); and, (v) the valuation methodology, analysis and results.
In many cases the valuation is based on the direct production benefits to key sectors (tourism,
agriculture, forestry and water resources) associated with the active use and management of
ecosystems in and around PAs. However, these sectors also benefit indirectly through a range of
regulating services6.
6 For tourism, it is assumed that the benefits associated with regulating services are captured through the valuation estimates,
as services such as clean water and air are considered to be part of the eco-tourism experience

42
4.1 The Value of PA ESs to Tourism
Box 4-1: The key findings for the tourism sector
Tourism within PAs is of considerable economic value. The value of tourism and
recreational activities for the five pilot PAs is estimated at just over €109.5 million in 2010
Tourism has a substantial multiplier effect across the economy. Based on a study by
the World Travel and Tourism Council in 2011 tourism within the pilot PAs generates
€365 million (or 0.3% of the GDP), including gross visitor spending of more than €280
million, capital investment in excess of €194 million. In addition it creates around 37,100
full-time job equivalents. Importantly, according to the Romanian Ecotourism Association
(REA), around 80-90% of eco-tourism expenditure remains in the areas where the
tourism program is operating, benefitting many rural areas.
Continuing to accord PAs a low policy and funding priority will incur long term
economic losses. A continuation of BAU in the 5 pilot PAs may cost Romania‟s
economy more than €2.6 billion over the next 25 years in lost tourism revenue alone;
There are many untapped tourism and recreational opportunities that could be
developed in order to increase revenues from PAs. Tourists and recreational visitors
in the 5 pilot PAs are estimated to be willing to pay almost €42 million a year more than
they are currently being charged in entry fees, tours, etc. However, increased funding and
policy action is required to capture these potential revenue streams.
Some sites have more capacity for tourism development than others. For example, ANP
and PCNP are clearly „honey pots‟ are eco-tourism development should initially focus on
these areas.
4.1.1 Introduction
This chapter is focused on eco-tourism or Nature Based Tourism (NBT), rather than sustainable
tourism. Ecotourism refers to a sub-section of the tourism sector, while the principles of sustainable
tourism apply to all types of tourism activities, operations, establishments and projects7.
A definition of ecotourism taken from Romanian legislation closely aligns with international definitions
(Quebec declaration, UNEP/WTO, 2003), “a tourism kind in which the main objective is observing and
acknowledging the value of nature and local traditions, that should fulfill the following conditions: i) to
contribute at nature protection and conservation, ii) to utilize local human resources, iii) have an
7 The concept of sustainable tourism was defined by the IUCN, WWF and PNABE in the early 90s. It is
“envisaged as leading to management of all resources in such a way that economic, social and aesthetic needs
can be fulfilled while maintaining cultural integrity, essential ecological processes, biological diversity and life
support systems” (INCDT 2009). It is generally accepted by academicians, international organizations and
tourism operators that caring for the environment is an ethical duty and that sustainable tourism makes sound
economic sense (IUCN 2010).

43
educational character, respect for nature – tourists and local communities awareness, iv) to have an
insignificant negative impact over the natural and socio-cultural environment”.
In Romania communities have historically cohabited with nature such that human presence and
natural landscape are closely linked. As a consequence ecotourism and rural tourism are strongly
connected, making it hard to separate the two.
Ecotourism is supported by the protection and development of protected areas, which maintains the
quality and quantity of the many ecosystem services that underpin ecotourism activities. Romania in
general and the Carpathian PAs in particular have a remarkable natural potential providing unspoiled
natural landscapes, clean water and air, and biologically diverse habitats, fauna and flora. In
addition to this natural capital, the Romanian Carpathian PAs benefit from a rich ethnographic
potential with remarkable authenticity and originality. This cultural and spiritual heritage is
represented by traditional architectural values, manufacturing techniques and facilities, customs and
ancestral traditions (such as traditional community specific celebrations and holidays). Furthermore,
historic monuments, archeological sites, museums and old orthodox vestiges increase the eco-
tourism potential. All these natural and cultural features contribute to the range of important
ecosystem services provided by PAs (section 2.1).
Global ecotourism is increasing by 20-34% annually; a trend that is also evident in Romania.
According to the Romanian Ecotourism Association (REA), the economic impact of ecotourism
programs within the REA has increased significantly from 0.95 million € in 2004 to 1.6 million € in
2008. Tourists visiting Romania are increasingly appreciating places where natural resources are
protected, but this is not yet the central interest to the majority of tourists. Ecotourism is a small
segment of the tourist market and is confronted with many problems including: weak cooperation at
the local level, minimal and inappropriate promotion at the national and international level, a limited
and undiversified eco-tourism offering, weak infrastructure and the lack of a specialized work force.
4.1.2 Ecotourism management in the Carpathian PAs under BAU
Accommodation facilities exist within, or in the immediate vicinity of, almost all the Carpathian areas -
a fact favorable to the development of eco-tourism in the area (INCDT 2009) 8
. Based on the data
provided by INCDT and NFA – Romsilva the following facilities are available at the pilot site: ANP -
150 facilities within the park and more than 600 in the vicinity of the park borders; MNP - 40 facilities
within the park and more than 30 outside of the park; PCNP - 10 facilities within the park and more
than 50 outside; ReNP - 5 facilities in the park and more than 10 outside; and, VNNP - 2 facilities in
the Park and more than 50 outside (excluding accommodation facilities provided by monasteries)
(INCDTa 2009).
There is evidence that spending on hotels in areas with attractive natural landscapes tend to be
greater than in other places. Work carried out in Croatia by the Institute of Tourism has for example
found that there is a premium of as much as 24-32% attached to the price that visitors are willing to
pay for hotels located in forest areas, and that landscape is a decisive factor in visitors‟ choice of
hotels (Pagiola, 1996).
8 There are some exceptions e.g. Natural Park Gradistea Muncelului – Cioclovina,

44
Unfortunately a number of constraints related to eco-tourism infrastructure and PA management can
also be noted:
a) Camping sites and refuges9. Only a few parks have these facilities and they are generally
not in good condition or properly managed; in many cases they are privately managed by
entities who do not cooperate with park administrations;
b) Hunting cabins. There are more than 200 hunting cabins, managed by NFA-Romsilva, in
Romania. Around 120 of these are located in the Carpathians, but only 5 or so are located in
the parks. They are currently under-utilized, but could be important for tourism if promoted
and managed.
c) Visitor centers. Only 4 Carpathian parks have visitor centers - Retezat, Lunca Muresului,
Piatra Craiului and Vanatori Neamt. Not all of these visitor centers are operational. They face
maintenance difficulties and offer limited attractions;
d) Access infrastructure. Some of the PAs administrations have developed tourist access
routes, but in general they are in bad condition and insufficient;
e) Special tours organized by PAs administrations are lacking and suffer from poor promotion
and a lack of diversification;
f) Promotion of ecotourism is poor. Promotion materials are lacking on the internet, through
tour operators and through the main communication channels (newspapers, television and
radio). Even where tourist profiles exist, direct marketing of services are not undertaken.
g) Public relations in many parks are not properly managed leading to conflicts with community
members over the lack of compensation measures and inappropriate restrictions.
h) Biodiversity, a potential attraction for tourists from an educational point of view, is not
very well studied. Maps of habitats and species, pointing out special biodiversity features
and restrictions are being designed and published but this process has just started and is
seriously underfunded. There are very few wildlife viewing sites / observational facilities within
the parks. Proper biodiversity mapping is also urgently required to understand the carrying
capacity of the PAs and manage the flow of visitors in a way that does not damage the
valuable ecosystems.
i) Even where PAs have developed management plans (MP), with tourism development
measures included, they are not fully enforced due to the complicated and bureaucratic legal
framework and the lack of a centralized vision and strategy10
.
Under these conditions, the development of the ecotourism is restricted, making it impossible to fully
realize the social and economic benefits that a well-managed ecotourism sector can provide. These
benefits include: i) local jobs; ii) stimulation of the local economy due to infrastructure and services
development; iii) stimulation of the rural economy through encouraging the development of local
traditional products; iv) improvement of intercultural relationships; and, v) the design and
implementation of self-financing mechanisms as instruments for protection and conservation.
It is important to note that poorly managed eco-tourism activities can lead to costs related to natural
resource degradation. Management based on short term economic gains and overexploitation of
9 Refuges are common in mountain areas and offer basic overnight accommodation for hikers
10 All the parks have submitted MPs to the Ministry of Environment and Forests, or at least a simplified plan of
actions and conservation measures. Unfortunately, only 4 have been officially approved by the Government due to the limited capacity available to assess the MPs or other central government agencies being against some of the measures, which causes delays.

45
natural and cultural resources puts pressure on sensitive areas and can trigger many problems such
as: noise, pollution, over use and development of landscape resources, replacement of local traditions
with methods that are temporarily perceived as efficient. All of these aspects place ecosystem
services at risk and compromise the sustainable tourism potential of an area.
4.1.3 Characterization of BAU and SEM scenarios
For the purpose of this study, BAU and SEM scenarios were developed building on the current
(baseline) situation described in section 4.1.2.
Business As Usual is defined as a continuation of PAs underfunding and a disconnection between
the increasing interest in eco-tourism and the quality of the ecotourism experience being offered at
sites. In spite of the PAs remarkable natural and cultural resources, the lack of biodiversity studies
makes it impossible to known and manage sensitive areas and describe new features and species;
damage to biodiversity through tourism may therefore occur and/or tourists may lose interest on
account of the lack of biodiversity information. The absence of facilities for visitors also restricts the
proper management and accounting of tourist flows. Poor access, visitor facilities, tour guides and
management and low diversification will discourage / shorten the duration of visits and willingness to
pay. Poor marketing further works against tourists choosing Romania‟s PAs as an eco-tourism
destination.
In the BAU scenario, the absence of clear compensation measures for land owners may also be an
incentive for them to continue using some natural resources (e.g. wood or hay) in an unsustainable
way. This may lead to ecosystem degradation, which will negatively affect tourism demand. This
situation is likely to be made worse by the absence of properly enforced MPs and PA regulations.
Poor water management will impact water quality, and industry may affect the air quality, while
uncontrolled infrastructure development may result in a loss of traditional architectural styles typically
favored by tourists11
. As a consequence of BAU, ecotourism does not develop and visitor numbers
and willingness to pay decline.
Sustainable Ecosystem Management reflects a situation in which the increasing interest for
ecotourism in PAs is matched with measures that encourage and optimize its potential. With proper
funding, PA administrators are able to develop and enforce MPs. The MPs provide for the ongoing
evaluation of biodiversity, development and diversification of access and visitor facilities,
implementation of special conservation measures, use of compensatory payments, proper control of
industrial development and natural resources use, pro-nature education and development of the
tourism strategy and management. Under these conditions it is reasonable to count on an increase in
tourist numbers, longer visiting periods and increased expenditures and WTP.
Enforcement of MPs, with proper compensation payments, creates the bases for strong relationships
with community members, who will benefit from the increased eco-tourism both economically and
socially. SEM also means better promotion of the PAs.
11
In Maramures, accommodation facilities based on the local architectural styles are more profitable and attract tourists compatible with an eco-tourist profile.

46
Better enforcement of building regulations will increase the attractiveness of areas, and, in time
demonstrate that newly adopted architectural styles are likely to lead to reduced earnings relative to
the conservation of tradition style accommodation and traditions, which will attract tourists. Overtime
tourism related damages will decline, based on a strong collaboration between tour operators,
communities and PAs administration in terms of tourism management. The key features of the BAU
and SEM scenarios adopted for the 5 pilot PAs are summarized In Table 4-1.
Table 4-1: Key features of BAU and SEM scenarios for tourism sector in the 5 pilot PAs Site Indicators BAU SEM
General
Description No active management of tourism; no visitor facilities and poor access facilities; continuing illegal logging and improper use of pastures leading to the landscape degradation; ongoing transition from traditional local architecture to modern style buildings.
Active tourism management; development of access and visitor facilities; sustainable natural resource usage; increased emphasis on local traditions; introduction of entrance fees when the expectations of tourists and the tourism offer are balanced.
Total visitor arrivals
Increase 4.8% per year till 2026 (MRDT 2007),stagnant after that
Total overnight stays
Increase 6.8% per year till 2026 (MRDT 2007), 2.5% per year after that
Average expenditures per visitor per visit (food & hotel)
No change over short-term, but decrease over longer term as PAs stagnate / decline
No change over short-term, but increase over longer term as PAs improve
% PA tourists spending on food & hotels
No change over short-term, but decrease over longer term as PAs stagnate / decline
No change over short-term, but increase over longer term as PAs improve
Total PA tourist consumer surplus per visitor
No change until 2016, after which decreases
No change till 2016 then increases by 1% till 2020 and then 1.5% until 2025. Stagnant after that
ANP Recorded number visitors to PA
Years 1- 5 1% increase; Years 5-10 – 0.8% increase; Years 10-15 – 0.7%, stagnant after that.
Increasing: Years 1-5 – 2%, Years 5-10 – 3%, Years 10-15 – 5%, Years 15-20 2%, Year 10-25 – 1%.
PA entry fees values
Change in line with recorded number of visitors, starting from baseline 2010 value (10% of visitors paying 1EUR/visit)
Entry fee at present level (1EUR/visit) Revenues increase up to a point where 50% of the visitors are paying.
MNP Recorded number of visitors to PA
Years 1- 5 1% increase; Years 5-10 – 0.8% increase; Years 10-15 – 0.7% increase, stagnant after that.
Increasing: Year 1-5 – 1%, year 5-10 – 2%, year 10-15 – 2%, stagnant after that
PA entry fees No change – no entry fee value Introducing entry fee in 2015 at 1EUR/visit level. Revenues increase up to a point where 50% of the visitors are paying.
PCNP
Recorded number visitors to PA
Increasing Years 1- 5, 1%; Years 5-10, 0.8%; Years 10-15, 0.7% (as a result of capturing proportion of overall visitor increase to Romania), stagnant after that.
Increasing: Year 1-5 – 2%, year 5-10 – 3%, year 10-15 – 5%, year 15-20 2%, year 10-25 – 1%.
PA entry fees No change – no entry fee value
Entry fee introduced in 2015 at 1EUR/visit. Revenues increase related to an increase in number of visitors paying from 10% to 50% in 2035
ReNP Recorded number visitors to PA
Increase - Year 1- 5, 1%; Year 5-10, 0.8%; Year 10-15, 0.7%. Stagnant after that.
Increasing: Year 1-5, 1%; year 5-10, 2%; year 10-15 2%; stagnant after that
PA entry fees Change in line with recorded number of visitors, starting from baseline 2010 value (70% of visitors paying 1EUR/visit)
VNNP Recorded number visitors to PA
Increasing -Year 1- 5 1%; Year 5-10 – 0.8%; Year 10-15 – 0.7%. Stagnant after that.
Increasing: Year 1-5 – 2%, year 5-10 – 2%, year 10-15 – 3%, year 15-20 2%, year 10-25 – 1%.
PA entry fees No change – no entry fee collected
Introducing entry fee in 2015 at 1EUR/visit level. Total revenue increasing from 5% of the visitors paying up to a value corresponding to 25% of the visitors

47
paying in 2035
The SEM and BAU scenario are not identical for the 5 pilot PAs, especially in terms of the evolution of
visitor numbers and the collection of entry fees. At present 2 pilot PAs generate revenues from entry
fees, set at 5 RON/visitor (around 1EUR), that is ReNP (where fees are collected from about 70% of
visitors) and ANP (where fees are collected from about 10% of visitors12
). SEM for ReNP implies
continuing to collect entry fees from 70% of visitors while SEM for ANP implies increasing the level of
visitors paying entry fees to 50%. For MNP and PCNP we assume that entry fees will be introduced
after 5 years and that collection of this fee will increase to up to 50% of visitors in 2035. Due to the
number of entry points into the park and the main tourist activity (i.e. visiting monasteries and
churches rather than eco- tourism) for VNNP the SEM scenario implies the introduction of entry fees
in 2015, with the collection rate increasing to 25% of visitors paying in 2035.
4.1.4 Analysis
In terms of the number of visitors, the pilot PAs were ranked based on their accessibility and
attraction. ANP and PCNP are clearly „honey pots‟ and visitor numbers are anticipated to increase
more at these sites under SEM, VNNP takes a middle position, while ReNP (due to its geography
(mountain edges) and the tradition of the park) and MNP (due to travel time, access and visiting
facilities) experience a lower increase in visitor numbers under SEM (Table 4-1).
Visitor numbers. Data on the number of visitors entering the PAs per year are available for all the
pilot PAs, however concerns over the reliability of the data has promoted a conservative approach in
the use of this data in the analysis. The INCDT study (2009) provides estimates13
of the number of
visitors for all the Parks in 2009: 300,000 in ANP; 100,000 in PCNP; 10,000 in ReNP, 10,000 in MNP
and 400,000 in VNNP (INCDTa 2009). Statistics on the number of visitors in Romania have been
derived from the National Institute of Statistics (NIS, 2011), and extrapolated to derive 2010 baseline
data for all the parks based on the INCDT study for 2009. This baseline data was used in the
scenario analysis for BAU and SEM as detailed in Table 4-1.
In MNP, Ceroni (2007) estimate 10,000 visitors based on the numbers reported by the railway
operator in Vaser Valley. However, based on interviews with park administration employees, it seems
likely that the number of people visiting Maramures Area (including MNP) is far higher than this, as
the available data are only based on those sites for which visitor records are kept. To account for this,
the study makes a conservative estimate that half as many tourists are visiting areas in the MNP as
recorded. As a result the figure used for MNP is 13,050 visitors in 201014
.
Visitor expenditure. Visitor expenditure on entrance fees, travel, accommodation and souvenirs etc.
12
This low collection rate is due to a number of factors including – the difficulty of supervising the many entry
points into the park; organization issues including a lack of collaboration with the local tourist operators, and limited facilities and services. 13 Data on visitor numbers are usually provided by PA administrations based on data collected from local
operators; in the future, the precision of these estimates needs to be improved. Data should be collected by NIS or by statistical surveys conducted by professionals on behalf of PA administrations. 14
There were 10,000 visitors in 2007. This translates to 8,700 visitors in 2010 (based on decrease in number of
visitors from 2007 to 2010 (NIS, 2011)). The data relates only to the valley of Vaser, which covers only 10% of the Park. It is assumed that half as many tourists visit the other parts of the park, resulting in a total of 8,700+4,350 = 13050 visitors in 2010, for the whole park.

48
can make an important economic impact at the local to national scale. In 2010, ANP generated direct
revenues of 34,000 € mainly from visitor fees (ANP has 4 small visiting centers and 4 information
points). ReNP also generated some income from visitor fees (ReNP has 2 visiting centers and one
information point). MNP, PCNP and VNNP didn‟t generate any direct revenues from entry fees and
other charges, but visitors to these pilot areas spent money on hotels and restaurants.
The study in MNP (Ceroni, 2007) has been used across the pilot sites, as this is the only available
study on PA tourism expenditure. Ceroni calculates average visitor expenditure per visit on food and
accommodation15
at RON 483.5 in 2007, equivalent to €135.5 per visitor per visit (2010 prices). The
average duration of a visit was 5 days, suggesting a total daily expenditure per visitor of €27.1
(Ceroni, 2007). This estimate appears conservative compared to similar studies in the region. For
example a study of Durmitor National Park in Montenegro revealed a gross turnover of €1.6 million for
hotels and restaurants, translating into an average accommodation fee of €12.6, plus typical spending
on food, drinks and other services of €46.0 per visitor day (UNDP 2011). In Tatra National Park in
Poland visitors spend around €45 per day, and in Slovakia‟s Slovensky Raj National Park total visitor
expenditure averages €54 per person day (Getzner 2009).
In order to derive total expenditure estimates for the PAs, the likely proportion of visitors camping and
staying in hotels was taken into consideration. In ReMP and PCNP the majority of tourists use tents
while trekking around the high altitude areas; conversely, in MNP and VNNP the majority of tourists
use hotels. Based on the data provided by INCDT (INCDT 2009a) it is assumed that 70% of tourists in
ANP, 75% tourists in MNP, 40% of tourists in PCNP, 20% of tourists in ReNP and 60% of tourists in
VNNP stay in hotels. Thus, direct spending on hotels may account for annual revenues of €20,4
million in ANP, €1.3 million in MNP, €5.5 million in PCNP, €0.28 million in ReNP and €32.7 million in
VNNP16
. This is considered to be a conservative estimate as it is based on a low estimate of visitor
expenditure relative to other studies and a likely under-reporting of tourist numbers.
Consumer surplus of visitors. The total economic value of PA tourism is greater than the amount of
money people actually spend. This is because some tourists would be willing to pay more than they
do on entry fees, hotels and restaurants, travel costs etc. to enjoy the tourism experience of a PA.
This “consumer surplus” is measured by a visitor‟s maximum willingness to pay for the PA tourism
experience less their actual expenditure.
In 2005 a study was carried out in five parks in Romania (Bucegi, Cozia, Domogled, Piatra Craiului,
Portile de Fier) to determine the economic value of recreation. The Travel Cost Method used
information about respondent‟s actual travel costs to determine Consumer Surplus based on the
demand curve. The results showed an average consumer surplus per visitor of €42 (Dumitras 2008,
Dumitras et al 2011) in 2007. In 2010 prices (using PPP conversions), this is equivalent to an average
consumer surplus per visitor of €50.7. This is an average estimate from 5 Parks, and of the pilot sites
only PCNP is included among them. For PCNP consumer surplus is €44.317
.
15
Entrance fees did not exist at this time. 16
This is based on the number of visitors multiplied by the percentage of tourists with longer stays multiplied by with the total expenditure per visit (135.5 €)
17 Another less detailed study in MNP in 2007 found that just under 60% of visitors were willing to contribute
between €18 (for the conservation of traditional landscapes) and €21 (for wildlife conservation programmes) to PA funding (Ceroni 2007).

49
Based on an average consumer surplus per visitor of €50.7 (derived from Dumitras 2008, Dumitras et
al 2011) for all sites except PCNP, for which the site specific consumer surplus estimate of €44.3 was
adopted and visitor numbers total consumer surplus for each site is estimated at: €15,3 million a year
in ANP, € 0.7 million a year in MNP, €4.4 million in PCNP, €0.5 million in ReNP and €20.3 million in
VNNP. The baseline value for the 5 pilot sites, together with the distribution of the baseline value
among main beneficiaries, is presented in Figure 4-1.
Figure 4-1: Baseline value for the 5 PAs – Tourism (Euros / year)
Direct revenues (visitor expenditure on hotels and restaurants plus revenues to PAs)
68,366,536.3
Visitor consumer surplus (based on Dumitras et al 2011)
41,219,620.0
Total PA ecosystem value to tourism
109,586,156.3
Including
Revenues to PAs (based on
entrance fees etc)
41,000.0
Revenues to hotels and
restaurants (based on Ceroni, 2007)
68,325,536.3
Consumer surplus (based on
Dumitras et al 2011)
41,219,620.0
Applying the BAU and SEM scenario and calculating the present value (PV) for a 25 years period
(2010 – 2035) provides the results shown in Figures 4-2 to 4-5. The results are reported with and
without the consumer surplus values for both the BAU (Figure 4-2 and 4-3) and the SEM scenario
(Figures 4-4 and 4-5).
Figure 4-2: Tourism sector values BAU CS included (PV10%=€787.2mill)

50
Figure 4-3: Tourism sector values BAU CS excluded (PV10%=€439.3mill)
Figure 4-4: Tourism sector values SEM CS included (PV10%=€1,289.9 mill)
Figure 4-5: Tourism sector values SEM CS excluded (PV10%=€802.4mill)

51
The continuation of BAU in the pilot PAs results in an increase in tourism values over the short term,
followed by a progressive decline related to the degradation and loss of biodiversity and ecosystem
services overtime and the consequence fall in visitor numbers. The present value under BAU for the 5
pilot PAs is €787.2 million (including consumer surplus) and €439.3 million based on expenditure
values only Apuseni Natural Park and Vanatori Neamt Natural Park make up 89% of this value18
. The
values of the ecosystems from the parks range from €6.2 mill (ReNP) to €381.8 mill (VNP).
Sustainable Ecosystem Management (SEM) results in a progressive increase in tourism values at the
pilot sites, as both the quality of biodiversity and ecosystems and the tourism services offered
improve. The increased number of visitors is the main determinant for the increase in PAs revenues.
While not considered in the SEM scenario, tourism revenues could be further increased by raising
prices / entrance fees overtime. Although an increase in the value of tourism is sustained over the 25
years, the rate of growth slows as the ecosystem and biodiversity status is restored and as the PAs
carrying capacity is reached. Sustainable eco-tourism discourages an increase in tourists beyond the
sites carrying capacity, visitor numbers therefore plateau in the long run. The PV (10% rate over 25
years) for the 5 pilot PAs is calculated at €1,289.9 million level (including consumer surplus) and
€802.4 million based only on expenditure. The Apuseni Natural Park and Vanatori Neamt Natural
Park make up 92% of this value. The values for the parks range from €8.5 mill (ReNP) and €604.8
mill (VNP). Figure 4-6 illustrates the different trajectory for tourism value under BAU and SEM for the
5 pilot sites.
The NPV of SEM is €502.7 million including consumer surplus and €363 excluding consumer surplus.
Figure 4-6: Tourism value under BAU and SEM over 25 years
PA authorities derive a small amount of revenue from entry fees. The private sector (represented by
tour operators, hotels, pensions, restaurants, transportation companies and souvenir manufacturers)
is the main beneficiary across the 5 PAs. The private sector is therefore the key stakeholder to
engage with in the development of any potential payments for ecosystem services mechanisms. It is
18
While VNNP is not considered to be a honey pot site, there are many visitors to the monasteries in the area.

52
worth noting that an increase in private sector revenues may also indirectly increase local and
national budgets, based on the profitability of the sector19
.
The value added by SEM across the pilot PAs to the tourism sector is a clear indication of the
potential gains association with SEM, and the costs of BAU. SEM implies sustained and increasing
tourism value supported by a well managed PA while a continuation of BAU results in the steady loss
of tourism value as the capacity of PAs to generate economically valuable goods and services is
eroded. These long-term losses outweigh the short-term gains. The added value of the ecosystems of
the 5 PAs steadily increases over the years in line with an increase in the quality of ecosystem
management (Figure 4-7). The total cumulative (additional) value (over 25) to the tourism sector
as a result of moving to SEM from BAU in the 5 pilot sites is around €2.6 billion.
Figure 4-7: Cumulative value of SEM over BAU
4.1.5 Contribution of ecosystems of PAs to economic activity and employment
As is the case with other sectors and PA goods and services, the total economic impact of PA tourism
is far greater than the direct spending on entry fees, hotels and restaurants. The tourism sector also
benefits from visitor expenditures on secondary and support services, resulting in significant indirect
and induced impacts. These include capital inflows and investments on infrastructure and equipment,
government spending for example on tourism marketing and promotion, aviation, administration,
security services, resort area security services and sanitation, and domestic purchases of goods and
services by the sectors dealing directly with tourists (for example, food and cleaning services by
hotels, fuel and catering services by airlines, and IT services by travel agents). The induced
contribution of tourism also includes the income and jobs supported by the spending of those who are
directly or indirectly employed by the travel and tourism industry.
The World Travel and Tourism Council (WTTC, 2011) presents its economic impact research for
Romania‟s tourism sector, based on a methodology consistent with that approved by the UN Statistics
Division. This shows that around 94% of visitor spending is on leisure travel. Assuming that these
figures can be assigned on a pro rata basis to the estimated 534,300 visitors to the pilot PAs, then it is
estimated that tourism within the pilot PAs makes a total direct, indirect and induced contribution to
19
There is no available data on the eco-tourism‟s sectors profitability but further calculations could be made
based on the profitability tax (set at 16% in Romania) and the average number of employees (wages are taxed at
up to 45% for budget funds such as health and unemployment.

53
GDP of some €365 million in 2010 (Table 4-2). This includes gross visitor spending of more than
€280 million, public expenditures of almost €25 million and capital investment in excess of €194
million, as well as some 37,100 full-time job equivalents.
Table 4-2: Travel and tourism in pilot PA impact in 2010 (mill EUR)
All domestic and international tourism [1]
All Leisure travel [2] PA tourism [3]
a. Visitor exports 1,356.3 1,274.9 112.2
b. Domestic expenditure 2,069.0 1,944.8 171.1
c. Government individual spending 46.0 43.2 3.8
d. Purchases by tourism providers -1,816.1 -1,707.1 -150.2
Direct contribution to GDP (€ million) 1,655.2 1,555.9 136.9
Other impacts (indirect & induced)
Domestic supply chain 1,724.1 1,620.7 142.6
Capital investment 2,344.8 2,204.1 193.9
Government collective spending 252.9 237.7 20.9
Imported goods from indirect spending -2,436.8 -2,290.6 -201.5
Induced 873.6 821.1 72.2
Indirect and induced contribution to GDP (€ million)
2,758.6 2,593.1 228.1
TOTAL CONTRIBUTION TO GDP (€ million)
4,413.8 4,149.0 365.0
Employment (‘000 jobs)
Direct employment 234.3 220.2 19.4
Indirect employment 214.3 201.4 17.7
Total employment („000 jobs) 448.6 421.7 37.1
Source: [1] WTTC 2011, [2] imputed from WTTC figures for 2009 and 2010, [3] imputed on a pro rata base on NIS and INCDT records of visitors
Note: See Annex 5 for definition of key terms used in Table
Of note is the fact that the impact of ecotourism at the local level is significantly higher than that of
„classical‟ tourism. According REA members, approximately 80-90% of eco-tourism expenditure
remains in the areas where the tourism program is operating, which are mainly in rural areas. This
data only relates to the 16 tour operators that are members of RAE and is concentrated in Brasov and
neighbor counties, while the potential for developing ecotourism more broadly across Romania is
considered to be extensive.

54
4.2 The value of PA ecosystems services to Forestry and Hunting Box 4-2: The key findings for the forestry and hunting sector
The Pilot PAs are of considerable value to the Forestry sector. The value of forest
provisioning services (timber, Non-timber forest products (NTFP) and hunting) for the pilot
PAs is estimated at around €9.1 million per year (2010);
Continuing to accord PAs a low priority in terms of policy and funding will result in
economic losses in the long term. Under BAU forestry activities may add some €2.8
million over the next 25 years to Romania‟s economy. However, this revenue will
disappear after 30 years as the capacity of PAs to generate economically valuable wood
and NTFP is eroded. This is without taking into consideration the considerable losses in
other forest ES such as carbon sequestration, water and soil erosion regulation and
landscape provision and tourism.
SEM implies a decrease in forest wood, NTFP and hunting values in short term and a fall
in public income due to compensatory payments for area taken out of production.
Nevertheless, in the long run, the value of PAs under the SEM scenario will recover, and
are projected to generate a higher NPV beyond a 25 year horizon. In addition other ES
generated / maintained by sustainable forestry (e.g. carbon sequestration, water and soil
erosion regulation, landscape) are ensured.
Currently the full potential of NTFP is not being captured. The SEM scenario assumes a
significant increase in NTFP production with Retezat and VNNP showing particular
potential in this respect.
Carbon sequestration functions of the forest under SEM could generate an additional €33
million (cumulative value over 25 years).
It will not be possible for Romania to access the voluntary carbon markets, and thereby
capture the value of sequestered carbon in protected areas, until central authorities
adopt a clear legal framework and institutional arrangements permitting this (e.g. to
monitor and guarantee the sequestered quantities).
4.2.1 Introduction
This section includes primary wood production associated with the active management of forests and
the value of NTFP and hunting carried out in and around PAs (i.e. direct use values of the PAs). A key
forest regulating service, carbon sequestration, is also estimated. It is important to note that a number
of other forest regulating and supporting services are captured via their contribution to other sectors20
.
During the communist period Romania had one of the best performing forest management systems in
Europe, with all State forest managed following sustainability principles. However, the process of
forest restitution, where areas were returned to former owners, triggered important legal and
institutional changes as well as illegal logging and unsustainable forest harvesting in some areas. A
20
Forest landscape values are considered to be captured by tourism values, while the value of forest regulatory services in terms of water provision and regulation and soil erosion are covered in the water resources sector (section 4.4). .

55
stable system is now in place with almost all the forest (6.0 million ha out of 6.3 million ha) being
administrated by NFA Romsilva or by private forest districts.
NFA Romsilva follows Forest Management Plans, which are reviewed every 10 years, and are based
on sustainable principles such as biological diversity conservation. The forest is divided into functional
categories21
. In T1 and T2 categories there are important restrictions regarding forest harvesting.
Based on functional zoning of the PAs, the protected forests are usually categorized as T1 and T2
forests, both for state and private forests. The state has prepared a legal framework for compensating
T1 and T2 private forests owners, but payments have not yet taken place.
Wood harvesting, collection and sale of NTFP and hunting are the most important activities within the
sector. Wood is a valuable product used in construction, furniture, pulp and paper, heating, and
energy production. The Carpathian forest ecosystems provide important quantities of economically
attractive wood species such as beech, spruce and oak. Based on official statistics, 59% of the
annual increment is harvested. Forest harvesting is a complex activity with potential impacts on
biodiversity and the ES provided by PAs such as carbon sequestration, air quality, water and soil
erosion regulation, nutrient retention, landscape, and the production of NTFP. Therefore, sustainable
forest management is crucial for effective provision of PAs ecosystem services.
No statistics are available on the extent of illegal logging, but while this is occurring in almost all areas
it is not considered to be significant. However, illegal clear cutting in some parts of the Carpathians
has created problems in the past, and remains a potential threat. For example, the floods and
landslide in Maramures in 2006 -2010 can be linked to clear cutting that occurred in Borsa and Viseu
forests in 2001-2005 (Giurgiu, 2010). Furthermore, clear cutting in private forests in Arges County and
around PCNP have had significant negative effects on the quality and effectiveness of ecosystems
and its landscape (http://www.realitatea.net/defrisari-in-piatra-craiului_308741.html ).
In theory forest ecosystems within the PAs are managed according to the forest and parks
management plans, but in reality these plans are not always fully enforced due a range of factors,
typical of the BAU scenario, including:
- Not all PA MPs are approved and therefore they are not enforced in all cases;
- There is no compensation for harvesting restrictions within private forests and owners
therefore have no incentive to restrict harvesting;
- In some of the PAs there may be the need to extend the area of protected forests, but in the
absence of a comprehensive biodiversity inventory and monitoring system, and with
resistance from forest administrators and owners, these forests continue to be harvested for
wood, which may be having a number of negative effects on the provision of important ES;
- While there is a good legal framework in place, enforcement of the law is weak and in many
cases over cutting and illegal logging is evident;
NTFP are potentially important for local economies. However, even in areas, such as Maramures,
where the collection and processing of NTFP is economically significant, those products are not
managed and harvested in a way that captures their full potential. Forest administrators often
21
T1 – no cuttings allowed except in very special circumstances; T2 – conservation cuttings allowed, no production purpose; T3: cuttings allowed with low intensity, multiage stands; T4 – regeneration cuttings allowed, regeneration under forest – one age stands; T5 – clear-cuttings followed by artificial or vegetative regeneration.

56
concentrate on wood harvesting and processing and pay little attention to the economic potential of
NTFPs.
In terms of revenue hunting is not very important compared with wood production. Nevertheless,
recreational hunting is an important service offered by forests. The legal framework controls and
restricts hunting, but is facing significant problems in terms of enforcement. Hunting quotas are
approved by the central authority, and generally speaking are not reached, but it is hard to quantify
the extent of illegal hunting, which is evident
4.2.2 Characterization of BAU and SEM scenarios (provisioning services)
Under Business as Usual (BAU) timber harvesting will continue to support a number of wood related
industries. Due to the limited extent of protected forests within the PAs (T1 and T2 areas), biodiversity
losses may occur in some areas. At the same time, negative impacts on water, nutrient and soil
erosion regulation, landscape and air quality will continue. Ineffective enforcement of the legal
framework will result in ongoing illegal logging and hunting. The absence of an equitable system of
compensatory payments will encourage local forest owners to overcut. BAU does not encourage
optimal management of NTFP, and the potential of those products will decrease due to ecosystem
degradation.
With the present limited levels of protected forest areas (T1 and T2), the potential threat to
biodiversity (which is not yet properly assessed due to ongoing lack of funding for proper identification
and monitoring of flora and fauna) will lead to continuous degradation of potentially valuable
ecosystems, hindering the development of recreation, tourism and educational activities.
The Sustainable Ecosystem Management (SEM) scenario would involve less emphasis on wood
production supported by: (i) an expansion of T1 and T2 areas where justified on account of their
biodiversity significance; (ii) Compensatory payments for private forest owners; and, (iii) optimal
harvesting of NTFPs. The reduction of forest harvesting will create opportunities for increasing the
potential of NTFP (guided by studies on sustainable use) and recreational hunting. Enforced PA MPs,
together with a better enforcement of forestry specific regulations will lead to a reduction in illegal
logging and hunting.
The analysis has used GIS data bases of the forest management plans of forest areas within the PAs.
The forest areas within the parks are divided into 2 categories – strictly protected area (categories T1
and T2) where no cuttings are allowed, and areas where sustainable cutting is permitted (T3 and T4).
Standing volumes were calculated based on stand composition, age and productivity class using
standard equations for volume calculation. Extracted volumes were provided by the PA forest
administrations or calculated based on national averages provided by the Ministry of Environment and
Forests – Status of Romanian Forests 2010. An estimation of illegal logging is based on Government
reports and expert opinion. In order to determine appropriate compensation values for T1 and T2
forests, a formula was adopted which included all the technical norms adopted by the Government for
this purpose22
.
Table 4-3 summarizes the BAU and SEM forest sector scenarios for the pilot PAs.
22
The formula takes into account: forest area, average standing wood price, annual increment per ha, and correction factors depending on species and functional category (Ministerial order 625/04.09.2006)

57
Table 4-3:Summary of BAU and SEM scenario for the forestry sector for the pilot PAs Description of
indicators BAU SEM
Wood harvesting
T1 and T2 areas – strictly protected areas
No compensatory payments T1 and T2 areas remain constant
Compensatory payments in place. Increase in T1 and T2 areas
T2 and T3 areas Thinning
Legal logging at national 2010 average (i.e. 59% of annual increment)
Legal logging at national 2010 average (i.e. 59% of annual increment) decreasing 7% per year between 2016 and 2030. Constant after 2030. Decrease in T3 and T4 areas.
All areas Illegal logging at 5% of legal logging level No illegal logging after 5 Years
NTFP and hunting
NTFP potential Harvested at present levels and declining over time
Increase in harvest levels over time up to sustainable limit
Recreational hunting Decreasing potential Increasing potential
The pilot PAs have a total forest area of 190,064 ha with a total standing volume of 59,191 m3
(2010),
consisting of fir, spruce, birch, oak, and other hard and softwood species. Data relating to the Pilot
PAs forests is presented in Table 4-4 (Transilvania University 2012, MMP 2010).
The value of forests in terms of wood harvested in the pilot PAs was €6.7 million in 2010. The
percentage of public owned forest within the pilot PAs varies from 40% in PCNP to 97% in ANP. This
influences public expenditure on compensatory payments under SEM across the PAs, i.e. where
private forests are significant (e.g. PCNP), compensatory payments are higher. Public revenue from
harvested wood in 2010 for the pilot PAs was around € 5.2 million (1.6 in ANP, 2.7 in MNP, 0.1 in
PCNP, 0.6 in ReNP and 0.2 in VNNP).
Both private and public forest administrators contribute 3% of the value of standing wood sales to the
National Environmental Fund (NEF). This added an additional € 0.2 million to public revenues from
forestry in 2010. Illegal logging is estimated at around €331,816 accruing to the private sector in 2010.

58
Table 4-4: Information on forests in pilot PAs
Species Area (ha) Standing volume
(,000 m3)
Volumes extracted 2010
(m3)
Average prices(standing wood, RON/m
3)
ANP
Resinous 37,607 10,352 65,554.0 84.73
Birch 10,980 3,023 19,140.1 69.04
Oaks 16 4 27.8 114.8
Other hardwood species 143 39 249.0 75.08
Other softwood species 0 0 0.0 58.63
TOTAL 48,746 13,418 84,970.8
MNP
Resinous 55,958 17,201 11,9549.7 84.73
Birch 28,717 8,827 61,352.4 69.04
Oaks 1,450 446 3,098.8 114.8
Other hardwood species 235 72 502.6 75.08
Other softwood species 14 4 29.2 58.63
TOTAL 86,375 26,550 184,532.7
PCNP
Resinous 5,535 2,907 9,272.8 84.73
Birch 4,026 2,114 6,745.0 69.04
Oaks 0 0 0.0 114.8
Other hardwood species 0 0 0.0 75.08
Other softwood species 40 21 67.6 58.63
TOTAL 9,602 5,042 16,085.3
ReNP
Resinous 17,216 8,294 43,965.6 84.73
Birch 2,024 975 5,168.5 69.04
Oaks 36 18 92.9 114.8
Other hardwood species 0 0 0.0 75.08
Other softwood species 1 0.3 0.2 58.63
TOTAL 19,277 9,287.3 49,227.2
VNNP
Resinous 22,719 4,259 15,997.8 84.73
Birch 3,102 581 2,184.2 69.04
Oaks 292 54 205.8 114.8
Other hardwood species 0 0 0.0 75.08
Other softwood species 1 0.1 0.0 58.63
TOTAL 26,114 4,894.1 18,387.9
TOTALS TOR ALL PILOT PAs
Source: Transilvania University 2011
Recent studies (Ceroni 2007, Transilvania University 2011) estimate the value of non-timber forest
products harvested (NTFP) under sustainable conditions and sold at €2.1 million (€0.6 million in ANP,

59
€1.0 million in MNP, €0.1 million in PCNP, €0,1 million in ReNP and € 0.3 million in VNNP). Key NTFP
are mushrooms, wild berries, medicinal plants, ornamental plants and Christmas trees (Ceroni 2007,
Transilvania University 2011).
Ceroni (2007) estimates hunting in MNP at RON 0.1 million, but expresses some doubts regarding
the sustainability of this activity. Data from a study by the Transilvania University (2012) provides
similar values. Taking a conservative approach, 75% of this value has been adopted as
corresponding to a sustainable hunting level. In 2010 prices this is equivalent to €58,278 (€13,278 for
ANP, €27,906 for MNP, €3,069 for PCNP, €6,910 for ReNP and €7448 for VNNP). The total baseline
value of the 5 pilot PAs can be seen in the Figure 4-8 (including the distribution of this value among
the main beneficiaries).
Figure 4-8: Baseline value for the 5 PAs – Forestry and Hunting
Public revenues 6,008,403.9
Market earnings 3,109,247.5
User consumer surplus
Total value of PA water supplies 9,117,651.4
Including (note: values not additive)
Revenues to PA authorities -
Revenue to other public agencies 6,008,403.9
Non commercial
users/beneficiaries
Private sector 3,109,247.5
The results under the BAU and SEM scenario are provided in Figure 4-9 and Figure 4-10.
Figure 4-9: Forestry sector values BAU (PV10%=€77.3million)

60
Figure 4-10: Forestry sector values SEM (PV10%=€74.5 million)
A continuation of BAU in the pilot PAs results initially in a more or less constant value for the forestry
sector. The quantity wood harvested falls over time due to the normal stand evolution, but this is also
taken into consideration in the SEM scenario. The limited use of NFTP is the main factor determining
a decrease in forest sector value under BAU relative to SEM. However, this decrease is not severe,
assuming that other forest regulating services continue to be provided. The present estimated value
of ecosystems in the 5 PAs for the BAU scenario is €77.3 million (Figure 4-9)
SEM will result initially in a decrease in forest sector values, as wood harvesting declines due to a
reduction in T3 and T4 areas and in the percent of the annual increment being harvested, and as
compensation increases in line with the increase in T1 and T2 areas. Overtime, the value of PAs
forest related value steadily increases, recovering the value lost through the reduction in wood
harvesting, due to the increased value of NTFP. The productivity of NTFP is underpinned by a healthy
ecosystems and biodiversity. The rate of growth eventually slows as optimal NFTP harvesting rates
are reached, and is constant in the long run. The PV (10% rate over 25 years) for the 5 pilot PAs is
estimated at €74.5 million (Figure 4-10).
There are significant differences between the pilot PAs in terms of forest sector benefits/value (Figure
4-9, Figure 4-10). Under BAU, PV values range from €3.3 mill EUR (PCNP) to €39.7 mill (MNP).
Under SEM, PV values range from €3.2 mill (PCNP) to €37.5 mill EUR (MNP).
As illustrated in Figure 4-11, while BAU is equivalent or superior to SEM in the short term, in the
medium – long term SEM is more profitable. Furthermore in the long term under BAU values continue
to decline, while under the SEM the (high) value becomes constant through time reflecting the
sustainable management of the areas.

61
Figure 4-11: The pilot PA ecosystems‟ value to Forestry and Hunting under BAU and SEM
The profile for the BAU and SEM scenario are similar for ANP, MNP and PCNP. However, it is worth
noting the situation for ReNP and VNNP (Figure 4-12, Figure 4-13). In VNNP, SEM is equivalent or
superior to BAU over the 25 year assessment period and also shows significant gains in the medium
to long term. This is due to the influence of NFTP. n VNNP the natural conditions (lower altitude,
water availability, forested and non forested areas, a suitable habitat for traditional fruits and an
existing tradition in NTFP collection) support greater weight being placed on NTFP values compared
with wood at the site. In ReNP the situation is the opposite – higher altitude, mountain plateaus
supports a lower weight being placed on NTFP. As a result the BAU scenario remains superior over
the long term.
Figure 4-12: Trends of BAU and SEM scenario for ReNP
Figure 4-13: Trends of BAU and SEM scenario for VNNP

62
PA authorities are not represented among the beneficiary groups as neither BAU nor SEM includes
revenues to PAs authorities. The private sector is the main beneficiary, indicating again the potential
to develop PES type arrangements with the private sector. Under SEM forest administrators lose
revenue due to the decline in timber production and increase in compensatory payments but gain
from NTFP production (Figure 4-14).
Figure 4-14: Gains to beneficiary groups – SEM
Sustainable ecosystem management implies a decrease in PA values in short term and a fall in public
income due to compensatory payments. Nevertheless, in the long run, the value of PAs under the
SEM scenario will recover, and are projected to generate higher values beyond a 25 year horizon
based on trend analysis. In addition other ES generated / maintained by sustainable forestry (e.g.
carbon sequestration, water and soil erosion regulation, landscape) are ensured (Figure 4-15).
BAU is superior to SEM over the 25 year time horizon, generating an additional €2.8 million.
However, given the gains to other sectors supported by sustainable forestry (e.g. tourism revenues
are partly contingent on undisturbed forests which contribute to landscape values and a range of
regulating services such as water and soil retention support agriculture and industry and carbon
sequestration), this loss is very small. After 32 years SEM is superior to BAU.

63
Figure 4-15: Cumulative added value of SEM over BAU
4.2.3 Carbon sequestration
4.2.3.1 Introduction
Ecosystems, such as forests and pasture land, provide an important carbon sequestration service.
The value of this service is not currently captured in Romania, although a growing international
market in carbon presents potential opportunities for doing so.
Emissions quotas were calculated for Romania in the 90s, after signing the Kyoto Protocol, which
took into consideration heavily polluting old communist style industries, which were in decline. This
consequently left Romania with „reserves' in terms of carbon emissions and little incentive until
recently to increase carbon sequestration. As a result, Romania has an important carbon reserve that
could be traded on international carbon market. Furthermore, carbon potential is high since forests in
and around protected areas has been well regulated, and afforestation of degraded and agricultural
land has been undertaken. However, institutional and legal arrangements for participating in carbon
markets are not in place. It will not be possible for Romania to access the voluntary carbon markets,
and thereby capture the value of sequestered carbon in protected areas, until central authorities adopt
a clear legal framework and institutional arrangements permitting this (e.g. to monitor and guarantee
the sequestered quantities).
4.2.3.2 Carbon sequestration – Characterization of BAU and SEM scenarios
In order to value carbon sequestration within the pilot PAs, the same assumptions have been adopted
as for the forestry sector in terms of wood harvested quantities (see section 4.2). Carbon sequestered
by other ecosystems has not been estimated.
BAU assumes a continuation of wood harvesting at present levels (as a percent of annual increment
of forest stands), keeping the present area of strictly protected forests and some illegal logging. Under
the SEM scenario, illegal logging is eliminated, T1 and T2 forest areas are expanded and the fall in
harvested wood quantities in production forest eventually leads to an increase in sequestered carbon.

64
The CO2 accumulated stock was modeled using GIS based on forest stands description from PAs
administrations (data from Forest Management Plans). For every species and production class a
regression equation was defined to determine the standing volume/ha. Based on the stand area and
the consistency of the stands, the total standing volume was determined for each stand. The Biomass
Extension Factor (BEF) used was 1.2, this value being the minimum value proposed by the
Intergovernmental Panel on Climate Change (IPCC) Guide (IGES 2006). The average wood density
values used are also conservative and based on IPCC guidelines. Corresponding coefficients for
carbon concentrations within wood biomass were used by species, and based on IPCC guidelines,
CO2 quantities were estimated for every forest stand.
4.2.3.3 Analysis
The BAU and SEM scenario characterization for CO2 consisted of applying the above described
methodology for stand volumes based on the harvested volumes as calculated for the forestry sector.
For CO2 only additional stands from year to year were considered. Interesting data were obtained
through this method (Figure 4-16). It can be seen that a greater additional quantity of CO2 is
accumulated in the protected forests as well as in the youngest stands.
Figure 4-16: Results of CO2 modelling: example MNP
Source: Transilvania University, 2011
The total amount of additional CO2e in the 5 pilot PAs from 2009 to 2010 is estimated at 490.1 tones
(see data for every pilot PA in the Table 4-5). Based on the reported average price for CO2e,
estimated by New Energy Finance and Ecosystem Marketplace (Ecosystem Marketplace 2011) for
Clear Development Mechanism under Kyoto protocol, active in Romania23
($4.5/tCO2e in 2010,
decreasing from $4.7/tCO2e in 2009), the baseline value of CO2 sequestered in the pilot PAs is
around €1.6 million.
23
Afforestation of degraded agricultural land project in Romania, based on Emission Reduction Purchase Agreement (ERPA) between PCF (World Bank) and National Forest Administration – ROMSILVA, signed in May 2004 (price $3.6/tCO2e)

65
Table 4-5: CO2 sequestered quantities in 2010 and in a 25 years period in BAU and SEM scenarios
PA Additional CO2,
2009-2010 (t)
Baseline indirect
use value 2010
(EUR)
Additional CO2 in
25 years – BAU (t)
Additional CO2 in
25 years – SEM t)
ANP 101,92 351,979 2,321,934 4,352,347
MNP 266,88 921,670 6,361,569 11,515,098
PCNP 36,36 125,569 851,223 1,599,768
ReNP 62,566 216,070 1,414,380 2,655,160
VNNP 22,336 77,137 499,355 976,642
A continuation of business as usual will result in a slow decline in PA carbon sequestration values due
to a decline in harvested volumes (based on age class distribution detailed in FMP), and hence less
CO2 sequestered. Under the BAU scenario, the present value (PV) of the carbon sequestration
service of the 5 pilot PAs over the next 25 years is around €14.4 million (Figure 4-17).
Proper PA management and law enforcement under SEM will initially result in a decline in PA carbon
sequestration value as the harvested volumes are not significantly smaller than in BAU scenario in the
first years. After this, due to a fall in the volume harvested (the same reduction scheme used for
forestry sector valuation) carbon accumulation increases. By the end of the appraisal period,
increased increments, together with relatively constant harvested volumes, result in a stable value.
Under the SEM scenario the PV of carbon sequestration over the next 25 years is just over €20.2
million for the 5 pilot PAs (Figure 4-18). With the proper legislation in place, it should be possible to
realize this benefit in the future assuming the ongoing supply of carbon funding. The total cumulative
value of SEM relatives to BAU is estimated at €33.3 million.
Figure 4-17: Indirect use values - BAU – carbon sequestration for the 5 pilot PAs (PV@10%=14.4 million EUR)

66
Figure 4-18: Indirect use values - SEM – carbon sequestration for the 5 pilot PAs (PV@10%=20.2 million EUR)24
4.3 The value of ecosystem services of PAs to Agriculture Box 4-3: The key findings for the agriculture sector
The value of the provisioning service food for the ecosystems of the 5 pilot PAs is
estimated at around €20.0 million in 2010;
For the ecosystems where the carrying capacity is exceeded SEM implies a fall in the
value of food provided by pastures in the short and long term. However, the annual
values after 10-15 years are significantly higher than the BAU values. In addition BAU
also sometimes results in irreversible damage to ecosystems
A continuation of BAU in terms of pasture management in the 5 PAs could cost
Romania‟s economy some €84 million over the next 25 years (this is based on the
cumulative value of SEM relative to BAU).
SEM requires motivating local communities to maintain traditional breeding practices.
4.3.1 Introduction
Grazing is the main agricultural activity carried out within the Carpathian PAs25
. Animals typically feed
on household plots using hay harvested from privately owned lands or in the open access natural
pastures. Cows and sheep are a very important revenue source for households surrounding the PAs,
and also sustain the production of traditional eco-food products.
Domestic animal husbandry is an example of a traditional and sustainable relationship between local
communities and nature, which has contributed to the rural landscape within the PAs. Ancient animal
husbandry traditions continued to be practiced throughout the communist period in the mountain
areas, where collectivization was partly avoided.
24
The declining slope in the last years of SEM is due to particularities of the stands: increasing age and decreasing accumulation.
25 There is some agricultural land within the Carpathian PAs, but their area and productivity is very low. They are
mainly used to produce fruit that is then consumed domestically.

67
Unmanaged pastures can in the long run damage biodiversity and ecosystem services. For example,
over grazing and over harvesting of hay can damage ecosystems through a decline in vegetation
density, the loss of key species and soil erosion. Conversely, without active management the species
composition in under grazed areas is likely to change reducing the area of pasture and/or its carrying
capacity. There is therefore a strong argument for the active management of pastures located within
the PAs based on an understanding of their carrying capacity, which is yet to be determined.
Pasture areas within the Carpathian PAs are both under and over-grazed. Under-grazing is due to
decreasing animal populations in remote mountain areas partly explained by low economic returns
from animal husbandry which discourages animal breeding in small rural communities. Conversely
overgrazing is due to limited land resources in or around bigger communities resulting in the number
of animals exceeding the carrying capacity of the pastures. In some PAs both over and under grazing
is evident; areas that are easier to access are overgrazed while pastures far away from settlements in
the mountains are under grazed. In such cases, even if the carrying capacity for the PA as a whole is
not exceeded, overgrazing may be causing ecosystem damage at specific locations. Carrying
capacity studies are therefore needed not only at the PA level but for each pasture area within a PA.
This Section analyses the value of food (milk), a provisioning service, provided by pastures located in
the pilot PAs26
. The other ES provided by agricultural pastures are considered to be captured
indirectly through other sectors (e.g. tourism).
4.3.2 Characterization Modeling BAU and SEM scenarios
In PCNP and ReNP the carrying capacity is surpassed by the number of animals and overgrazing is
evident. For these two PAs the BAU scenario assumes that overgrazing will continue in the pastures,
leading to pasture degradation and ultimately a dramatic reduction in pasture productivity. The SEM
scenario assumes that in the short run grazing reaches its carrying capacity and is maintained at this
level into the long term. However, realizing SEM in these two pilot PAs may not be very easy;
reducing the number of animals is likely to require compensatory payments for members of the
community and / or the demonstration of viable income generating alternatives.
According to the Management Plans for the PAs and the expert opinion of the Transilvania University
in MNP, ANP and VNNP the pasture carrying capacity is not exceeded. For these PAs the BAU
scenario assumes that the number of animals will increase, or decrease, in line with the population
forecasts and that the pasture carrying capacity will decrease due to the absence of any active
management. The SEM scenario assumes that in the first 5-10 years, as a result of encouraging
local communities to actively manage their pastures, the carrying capacity will be reached and then
remain constant over the long term. This situation depends on the success of breeding initiatives, the
encouragement of which may require investment and animal husbandry remaining profitable.
Table 4-6 summaries the BAU and SEM scenarios for the food production supported by pasture
within PAs.
26
Meat production has not been considered.

68
Table 4-6: Characterization of BAU and SEM for food production related to PA grazing lands
Site BAU SEM
MNP, ANP, VNNP At the PA level pasture carrying capacity is not exceeded. No active management of pastures. Number of animals follows the present trends (decrease in line with population). As a result of the absence of active management the carrying capacity declines over time.
By encouraging traditional breeding, the number of animals reaches the carrying capacity. Pastures are actively managed by maintaining breeding at the area‟s carrying capacity The carrying capacity decreases initially then increases until it reaches an optimum level as a consequence of active management.
ANP, PCNP At the PA level pasture carrying capacity is exceeded. The carrying capacity dramatically declines after a few years without significant change in number of animals. The number of animals is maintained for the first 5 years at high levels but decreases after that due to reduced carrying capacity.
The number of animals decreases from year 1 to avoid degradation of pastures. In 5-10 years the carrying capacity is reached. Due to active management, an optimal long term equilibrium is sustained
The following data has been used in the analysis - area of pasture, average over grazing or actual
overgrazing data (where available), milk prices/earnings (assuming that earnings are unitary based on
LSU (Livestock Unit)27
indicator for pastures and hay production areas).
Studies of pasture capacity are available for Piatra Craiului, Vanatori Neamt and Retezat Parks. They
provide an equivalent production using LSU for assessing all areas.
In PCNP for a total pasture area of 379 ha the carrying capacity was estimated at 260 LSU in 2000
(i.e. 1.4 LSU / ha), while there were 566 LSU using the pastures, suggesting overgrazing of 218%
(Transilvania University 2012). In ReNP in 2004 (Cernelea 2004) for a total area of 14,937 ha there
were 6,395 LSU, slightly more than the carrying capacity of 6,300 LSU (i.e. 0.41 LSU/ha). The
average carrying capacity is 0.68 LSU / ha for Piatra Craiului, 0.42 LSU/ha for Retezat and 0.8 LSU /
ha for Vanatori Neamt. Taking a conservative approach, an average of 0.45 LSU/ha was used in the
calculations for the pilot PAs for which carrying capacity studies were not available.
For MNP the data collected in 2007 (Ceroni 2007) translates into a total of 20,347 LSU on a total area
of 50,341 ha of pastures within MNP. The same data were collected from different sources (PAs
management plans, Transilvania University 2011, Cernelea, 2004) for the pilot PAs (Table 4-7).
Table 4-7: Carrying capacity of natural pastures within the pilot PAs
PAs Surface of
pastures (ha)
Total support capacity (LSU) LSU
Total Per ha Total Per ha
ANP 21,619 9,730 0.45 9,650 0.44
MNP 50,341 22,653 0.45 17,840 0.35
PCNP 2,147 1,450 0.68 3,380 1.57
ReNP 14,937 6,422 0.42 7,810 0.52
VNNP 3,057 2,446 0.8 1,523 0.50
Assuming that a LSU produces 15 liters of milk per day (MARD 2011), an average producer price of
RON 0.7 per liter in 2008 (CC 2009), and that the number of animals is more or less constant
between 2007 - 2011 the following values are derived:
27
LSU is the feed requirement used as the basis of comparison of different classes and species of stock.

69
- ANP – around €4.8 million. The carrying capacity is virtually reached. An additional value of
18,000 EUR could be considered given that the pastures are not entirely used up to their
carrying capacity. The challenge for ANP is maintaining the active management of the
pasture by keeping local communities interested in the present level of breeding. ANP reflects
the best situation within the pilot PAs in that the number of animals more or less corresponds
to the sites carrying capacity.
- Figure 4-22Figure 4-22).
- MNP - around €8.8 million. An additional €0.8 million could be considered due to the fact that
the pastures are not used at their carrying capacity. This value is consistent with the value
determined in 2007 (Ceroni 2007) of €9.4 million, using another valuation method.
- PCNP – around €1.6 million. This value is not sustainable, and the consequences of a
continuation of BAU could be significant. Under SEM the pasture related benefits of PCNP
could stabilize around €0.6 million per year; PCNP is an extreme case reflecting the costs of
extensive over-grazing. A comparison of milk values under BAU and SEM is provided in
Figure 4-23.
- ReNP – around €3.8 million, but this is also not based on sustainable pasture use. The
situation is not as extreme as in PCNP but nonetheless solutions for reducing the pressure on
the pastures need to be found. The sustainable value under SEM is €3.2 million.
- VNNP – around €1.0 million. An additional €0.2 million could be considered due to the fact
that the pastures are not used to their carrying capacity
Figure 4-19 presents the baseline for the pilot PAs. The production surplus relates to the additional
(potential) value that could be realized by the currently under-grazed areas. All the values accrue to
private beneficiaries. It was not possible to find data on the economic impact of the agriculture sector
(multiplier effects, income, and employment).
Figure 4-19: Baseline value for the ecosystems in the 5 PAs – Agriculture
Direct revenues from milk sales
19,755,356.2
Production surplus
1,082,589.2
Total agriculture value
20,837,945.4
Including (note: values not additive)
Revenues to PA authorities
-
Revenue to other public
agencies
-
Production surplus
1,082,589.2
Private sector revenues
19,755,356.2
Figure 4-20 and Figure 4-21 show the PV of food production under BAU and SEM for the five pilot
sites. SEM is shown to be superior to BAU by €16million (10% discount rate, over 25 years) Due to
the fact that some sites are close to SEM management already, the difference between BAU and

70
SEM in this instance is not so big. MNP‟s pastures do not have a very high carrying capacity, but
MNP has the highest values among the parks due to the large area of pastures.
.Figure 4-20: Food production value – BAU (PV@10% discount rate, 25 years=€174 mill)
Figure 4-21: Food production value – SEM (PV@10% discount rate over 25 years=€190 mill)
The continuation of BAU in the pilot PAs initially results in stable values. However, values fall after 5
years for two main reasons: (i) for PAs where the carrying capacity is not exceeded, the value of milk
declines due a lack of active pasture management; (ii) for PAs where the carrying capacity is
exceeded pastures experience rapid degradation as a result of overgrazing.
SEM shows stable values if the aggregate data for the 5 pilot PAs is considered (Figure 4-21).
However, For PAs where the support capacity is not exceeded (i.e. ANP (which is almost in a SEM
situation), MNP and VNNP) do not record a significant increase in value under the SEM scenario
(Figure 4-22). For PAs where the carrying capacity is exceeded (PCNP and ReNP) SEM results in a
significant decrease in value compared to the present unsustainable situation in the short run, but
achieves a long term equilibrium (Figure 4-23).

71
Figure 4-22: BAU and SEM scenario values for ANP - best case
Figure 4-23: BAU and SEM scenario values for PCNP – worst case
Figure 4-24: The pilot PA BAU and SEM values
PA authorities are not represented among the beneficiary groups as revenues to PAs authority was
not considered under either scenario. The private sector is the main beneficiary and therefore the
focus for any potential PES type arrangements. The production surplus relates to the potential added
value accuring to animal owners as a result of using the currently untapped carrying capacity (Figure
4-25).

72
Figure 4-25: Potential beneficiaries of SEM over BAU
For the PAs where the carrying capacity is exceeded SEM implies a fall in the value of food provided
by pastures in the short and long term. However, the annual values after 10-15 years are significantly
bigger than the BAU values, and in addition BAU also sometimes results in irreversible damages to
ecosystems (for instance under grazing in the high altitude pastures results in pastures being
populated with Pinus mugo, thus changing the ecosystem, (Cernelea 2004)). SEM requires motivating
local communities to maintain traditional breeding practices. If this is successful, the value added by
SEM is significant. The total cost of continuing business as usual over 25 years, for the
agricultural sector for the ecosystems of the 5 PAs is estimated at €84 million (Figure 4-26).
This is considered to be a conservative estimate as the value added through the processing chain is
not considered. Furthermore, markets for eco traditional products are growing adding more potential
value for the PAs. Quantitative data on these aspects are not available.
Figure 4-26: Cumulative value of SEM over BAU

73
4.4 The Value of ecosystems in the targeted PAs to Water Supply Sector
4.4.1 Background Box 4-4: The key findings for the water supply sector
The ecosystems of targeted PAs provide a number of key regulating services including
soil loss prevention and the regulation of water flow and quality.
Water quality and quantity is very important to the many brands of mineral water sourced
from the Carpathian mountains.
The estimated total cumulative value to the economy of SEM relative to BAU of clean
water provision, based on water treatment cost avoided is estimated, at 35.4 million (over
25 years). The NPV of SEM is €0.9 million.
Private water bottling companies are the main beneficiary and potential partners in PES
schemes, which are yet to be explored for the PAs
Currently, soil erosion is quite well regulated in the ecosystems in PAs, and as a result
there is not a significant monetary difference between the BAU and SEM scenario.
However, it is important to realize that the benefits provided by the ES could be lost
through increased pressures on the ecosystems
Well-maintained mountain ecosystems play a role in water retention and the regulation of surface
water flows, which influences soil erosion and sediment transportation, and water filtering which helps
maintain water quality. The Romanian Carpathians are the main source of water for a large part of
Romania. Furthermore, water quality and quantity is very important to the many brands of mineral
water sourced and bottled in the mountains in the west and center of the county as well as to many
other industries and households28
.
This section attempts a quantification and monetary estimation of the contribution of PA regulating
services - water regulation and soil erosion prevention to water users in urban areas and bottled
water companies and breweries/soft drinks manufacturers. Its main focus is the costs avoided by
SEM and the benefits of clean water.
Watershed protection and the development of infrastructure to improve water utilization have a long
history in Romania. Infrastructure designed to prevent flooding can be found on many mountain
rivers, but the sustainable management of the watershed ecosystems is the key to the whole effort.
The legal framework regarding watershed protection includes restrictions regarding the management
of forest and pastures in the mountain areas. Unfortunately, in many cases these provisions are not
properly enforced, compromising the provision of the regulating services. Reductions in forest cover
and even clear cutting in some cases, together with an over utilization of the mountain pastures has
resulted in a decrease in the ability of ecosystem to retain water and protect against soil erosion. The
optimal provision of regulating services requires SEM, which will maintain forest and pasture
ecosystems in the Carpathians PAs.
28
The area surrounding the pilot PAs is not very important for land cultivation. Irrigation water for agriculture is sourced
downstream at some distance from the PAs and has not been considered.

74
4.4.2 Characterization of BAU and SEM scenarios
Detailed data were collected and interpreted on the biophysical linkages between ecosystem status,
land use and land cover, and impacts on downstream water flow and quality - especially the impact of
land use/land cover change on soil loss and the relationship between soil loss and downstream
silt/sediment transport. The links between the changes in the quality and quantity of ecosystem
regulating services and the monetary value of this change are summarized in Figure 4-27.
Figure 4-27:Links between land management and the value of regulating services
Watershed identification and mapping is based on a digital elevation model for each pilot PA. Figure
4-28 provides an example of watershed identification and mapping in MNP, Transilvania University,
2011). Surface area and the maximum and average slope were calculated for each watershed. To
determine the baseline vegetation coverage information was taken from forest management plans
submitted by NFA-Romsilva. Based on this information a 25 year model was developed for the BAU
and SEM scenarios.

75
Figure 4-28: Example of watersheds identification and mapping - MNP
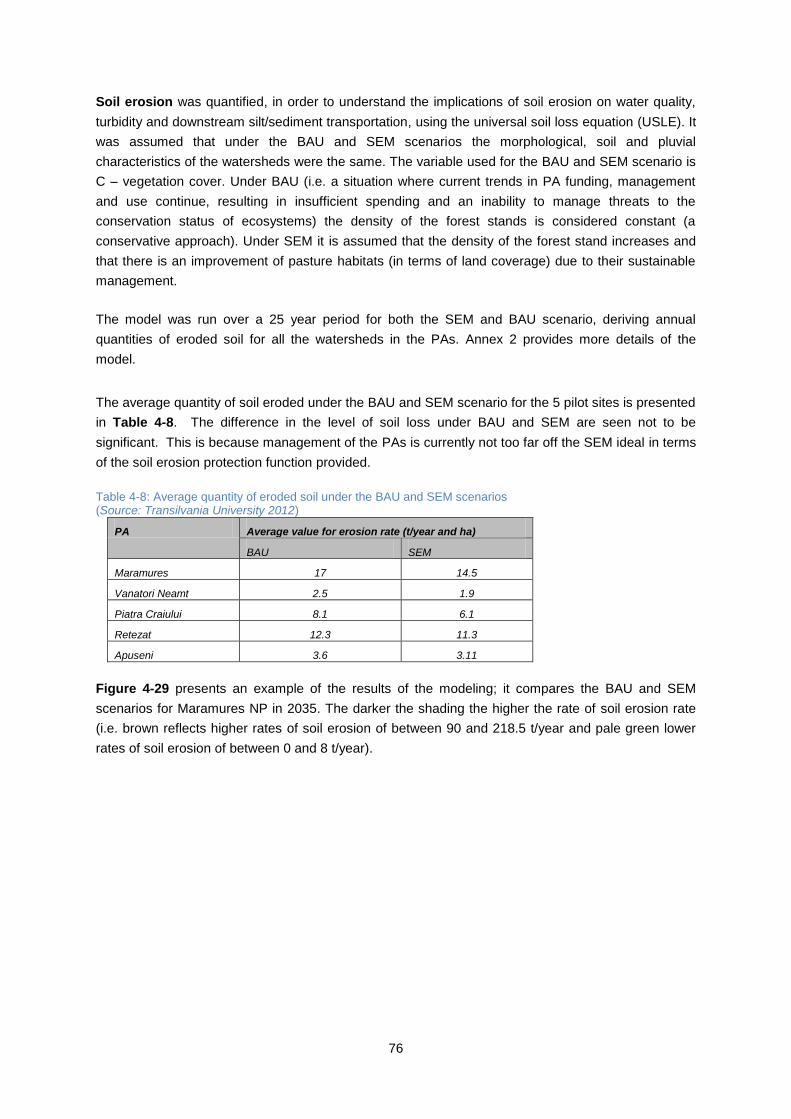
76
Soil erosion was quantified, in order to understand the implications of soil erosion on water quality,
turbidity and downstream silt/sediment transportation, using the universal soil loss equation (USLE). It
was assumed that under the BAU and SEM scenarios the morphological, soil and pluvial
characteristics of the watersheds were the same. The variable used for the BAU and SEM scenario is
C – vegetation cover. Under BAU (i.e. a situation where current trends in PA funding, management
and use continue, resulting in insufficient spending and an inability to manage threats to the
conservation status of ecosystems) the density of the forest stands is considered constant (a
conservative approach). Under SEM it is assumed that the density of the forest stand increases and
that there is an improvement of pasture habitats (in terms of land coverage) due to their sustainable
management.
The model was run over a 25 year period for both the SEM and BAU scenario, deriving annual
quantities of eroded soil for all the watersheds in the PAs. Annex 2 provides more details of the
model.
The average quantity of soil eroded under the BAU and SEM scenario for the 5 pilot sites is presented
in Table 4-8. The difference in the level of soil loss under BAU and SEM are seen not to be
significant. This is because management of the PAs is currently not too far off the SEM ideal in terms
of the soil erosion protection function provided.
Table 4-8: Average quantity of eroded soil under the BAU and SEM scenarios (Source: Transilvania University 2012)
PA Average value for erosion rate (t/year and ha)
BAU SEM
Maramures 17 14.5
Vanatori Neamt 2.5 1.9
Piatra Craiului 8.1 6.1
Retezat 12.3 11.3
Apuseni 3.6 3.11
Figure 4-29 presents an example of the results of the modeling; it compares the BAU and SEM
scenarios for Maramures NP in 2035. The darker the shading the higher the rate of soil erosion rate
(i.e. brown reflects higher rates of soil erosion of between 90 and 218.5 t/year and pale green lower
rates of soil erosion of between 0 and 8 t/year).
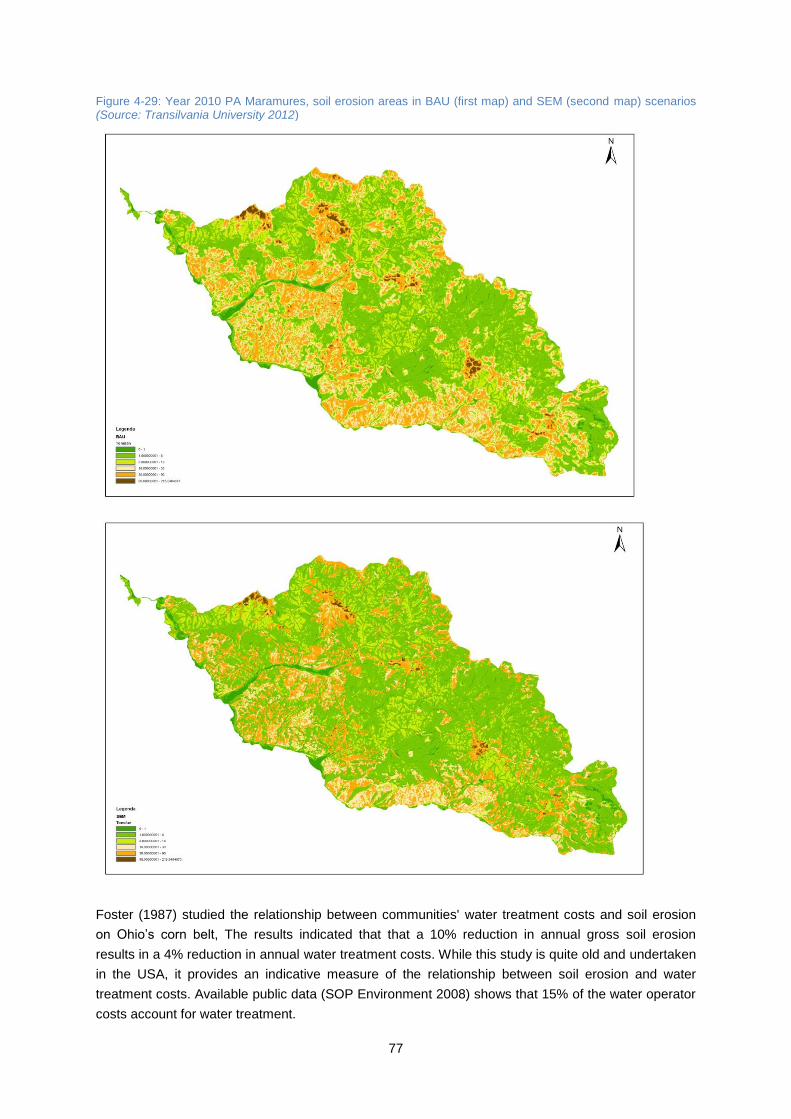
77
Figure 4-29: Year 2010 PA Maramures, soil erosion areas in BAU (first map) and SEM (second map) scenarios (Source: Transilvania University 2012)
Foster (1987) studied the relationship between communities' water treatment costs and soil erosion
on Ohio‟s corn belt, The results indicated that that a 10% reduction in annual gross soil erosion
results in a 4% reduction in annual water treatment costs. While this study is quite old and undertaken
in the USA, it provides an indicative measure of the relationship between soil erosion and water
treatment costs. Available public data (SOP Environment 2008) shows that 15% of the water operator
costs account for water treatment.

78
Bottled water industry
Ecosystems of the Maramures Natural Park support many mineral water springs, but only one
(Borsa – Valea Vinului) is used by a commercial water bottling company. SNAM S.A. Bucharest
(Societatea Nationala Ape Minerale a sub concession of a private company – DELMAR Ltd) utilizes
about 30,000 m3 of water a year and generates almost €120,000 a year in concession fees for ANRM
(source: SNAM 2011, interview). However, the bottling capacity of DELMAR Ltd. is 50,000 m3
/ year.
Therefore an additional 20,000 m3 a year could be utilized, representing the potential to generate
additional revenues from concession fees29
of €80,000 a year.
There are no commercially used mineral water springs in Apuseni National Park, but nearby in the
Ladului watershed, in the immediate vicinity of the Crisul Cald and Aleu watersheds, there is one of
the most important facilities for bottled mineral water in Romania - Stana de Vale. The concession
belongs to SNAM SA Bucharest, but is leased by one of the biggest companies in South Europe –
European Drinks, who use the springs in Stana de Vale to bottle around 340 million liters of mineral
water or derivate beverages. The concession paid to the state budget is around €1,360,000 (SNAM
2011). It is certain that the Stana de Vale spring is influenced by ANP‟s ecosystem services; it is
estimated that 40%-50% of water provision (filtration) depends on ecosystems of ANP (based on the
expert opinion of Romania Water‟s employees), given that two of the nearby watersheds (all the
mountain area around Stana de Vale) originate within ANP.
In ReNP, PCNP and VNNP there are no springs used for mineral water either in the PAs or in the
vicinity of the parks.
Assuming a conservative production ratio of raw to bottled water of 50% and an average retail price of
€0.2/liter, ecosystems in the pilot PAs are key to sustaining the current gross value of companies,
which is estimated at €17 million, while potential earnings (based on the estimated water surplus30
in
MMNP and ANP) may add another €10 million.
Urban water supply
Based on the data from the Somes Tisa Basin Management Plan (Rowaters 2010), water from the
ecosystems of Maramures Natural Park accounts for approximately 6% of water consumption in the
area and serves a population of 113,400. Given that over 90% of rural settlements only use
groundwater and do not pay for the consumption, only the urban population using water provided by
urban water operators are included in the calculations, that is 63,500 inhabitants (Rowaters 2010)31
.
Consumers pay VITAL S.A Baia Mare, the local water operator, a tariff of €0.4 per m3 (RON1.75 per
m3).
According to the Somes Tisa Basin Management Plan (Rowaters 2010), water from the Fantanele
reservoir covers almost all the consumption in Cluj County. Data from the local water operator SC
Compania de Apa Somes shows that 98% of the water used in Cluj Napoca city and the small
localities around comes from Tarnita, Somesul Cald and Gilau lakes - Fantanele lake, inside ANP is
the source of water for all these lakes. This means it serves a population of around 350,000
29
The concession fee is the amount of money paid by the concessioner to the state, measured in RON/m3.
30 The surplus relates to the available water which is not currently bottled.
31 56% of the population is urban
79
inhabitants. Consumers pay SC Compania de Apa Somes SA, the local water operator, a tariff of
€0.35 per m3 (RON 1.6 per m
3).
According to the Management Plan for Siret Basin (Rowater 2010) urban areas around VNNP (Tg.
Neamt mainly) only groundwater.
Urban water for 17,900 inhabitants in Zarnesti town comes entirely from PCNP, from Gura Raului
area (interview with CL Zarnesti, 2011). Consumers pay SC Morani Impex SRL, the local water
operator, a tariff of €0.08 per m3 (RON 0.33 per m
3).
Urban water supply for approximately 2,456 households in Hateg and 582 households in Santamaria
Orlea is provided by Raul Mare River coming from Gura Apei reservoir, inside the ReNP. This is equal
to around 9,100 inhabitants for the two towns. Consumers pay SC Apa Prod SRL Deva, the local
water operator, a tariff of €0.3 per m3 (RON 1.33 per m
3).
Average urban consumption in Romania is 110 liters per person / day (Rowaters 2010). The user fee
charged by municipal water operators is €0.01 per m3 - 43.84 RON per 1,000m
3 (Rowaters 2010).
Municipal water operators are public owned companies, and the tariff is cost based, with a minimum
profit going to public sector. Based on discussions with Rowaters, it is assumed that these charges
include fees paid to Rowaters plus the treatment and distribution costs and a gross profit of 10%.
These tariff rates are considered to be low, and therefore consumer surplus is expected to be
significant but has not been accounted for.
Table 4-9 summarises the baseline values for water supply provided by the ecosystems of PAs for
domestic water supply and to the bottle water industry.
Table 4-9: Baseline value for water supply for the 5 pilot PAs (Euros per year) Domestic water supply
a. Water operators – gross revenues from consumers. (i.e. Number of users
× water consumption × price). 6,684,147.15
b. Water operators - gross profit. (i.e. gross revenues minus costs for
treatment and distribution minus tariffs paid to Rowaters) 2,215,317.67
c. Revenues to ANAR1 (
i.e. revenues of Rowaters from water operators) 177,137.29
d. SUB TOTAL – fresh water ES – urban water (b + c) 2,392,454.96
Bottled water industry
e. ANRM 2 revenues from existing bottled water concessions 680,000
f. ANRM revenues from potential bottled water concessions [400,000]
g. Actual income to bottle companies 17,000,000
h. Potential income to bottle companies [10,000,000]
i. SUB-TOTAL - ES value for bottled water based on (g) 17,000,000
Distribution of revenues from bottle water
j.PA authorities 0
k.Other government (revenue for ANAR - Rowaters and ANRM + profit of
water operators, b + c + e) 3,072,454.96
l. Private sector (g - e) 16,320,000
Notes: 1/Water companies pay Rowaters for using water. They are responsible for treatment and distribution
and charge the final user. They are State owned companies, except for the company in Zarnesti-PNP. 2/ ANRM are The National Agency for Mineral Resources. They issue concessions to bottling companies.

80
In comparing the BAU and SEM scenarios it is assumed that water treatment and distribution costs
will be higher under BAU on account of the higher level of soil erosion(as modeled by the Transilvania
University.
A continuation of BAU will result in ongoing soil erosion resulting in higher water treatment costs for
urban supply. Under the BAU scenario, the net present value (NPV) of the economic contribution of
the ecosystems in the 5 pilot PAs over the next 25 years is just under €20.7 million (Figure 4-30 32
).
Treatment and distribution costs have been considered.
Proper PA management and law enforcement will result in a progressive increase in the quality of
water supplied for urban use related to a decline in soil erosion. Under the SEM scenario the PV of
gross economic contribution of the ecosystems of the 5 PAs over the next 25 years is just under
€21.5 million (Figure 4-31).
For bottled water no significant differences in the benefits are evident between the BAU and SEM
scenarios as illustrated in Figure 4-32 and Figure 4-33. This is because the current management of
the sites is quite close to the sustainable ecosystem management level, hence while soil erosion
quantities decrease under the SEM scenario, their influence over the monetary values captured
downstream is not that big. Over a 25 year time horizon, the SEM generates additional benefits of
€0.9 million (NPV, 10% discount rate over 25 years).
Figure 4-30: Estimated values of the fresh water ecosystems of 5 PAs –urban water supply – BAU (PV@10% discount rate, 25 years =€20.7mill)
32
In the calculations for the graph in Figure 4-30 and Figure 4-32 the bottle water industry was not considered.

81
Figure 4-31: Estimated values of the fresh water ecosystems 5 PAs – urban water supply – SEM (PV@10% discount rate, 25 years =€21.5mill)
Figure 4-32: Estimated values of the FW ecosystems of 5 PAs –urban and bottled water supply – BAU (PV@10% discount rate, 25 years =€176.3mill)
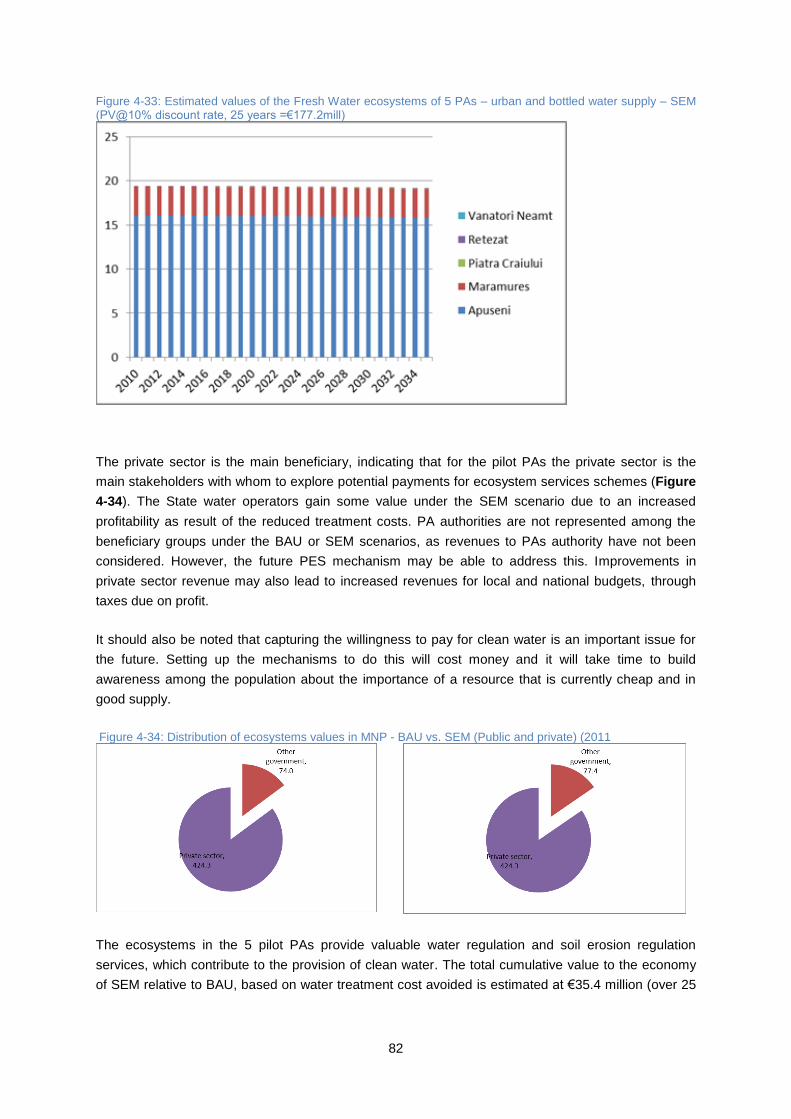
82
Figure 4-33: Estimated values of the Fresh Water ecosystems of 5 PAs – urban and bottled water supply – SEM (PV@10% discount rate, 25 years =€177.2mill)
The private sector is the main beneficiary, indicating that for the pilot PAs the private sector is the
main stakeholders with whom to explore potential payments for ecosystem services schemes (Figure
4-34). The State water operators gain some value under the SEM scenario due to an increased
profitability as result of the reduced treatment costs. PA authorities are not represented among the
beneficiary groups under the BAU or SEM scenarios, as revenues to PAs authority have not been
considered. However, the future PES mechanism may be able to address this. Improvements in
private sector revenue may also lead to increased revenues for local and national budgets, through
taxes due on profit.
It should also be noted that capturing the willingness to pay for clean water is an important issue for
the future. Setting up the mechanisms to do this will cost money and it will take time to build
awareness among the population about the importance of a resource that is currently cheap and in
good supply.
Figure 4-34: Distribution of ecosystems values in MNP - BAU vs. SEM (Public and private) (2011
The ecosystems in the 5 pilot PAs provide valuable water regulation and soil erosion regulation
services, which contribute to the provision of clean water. The total cumulative value to the economy
of SEM relative to BAU, based on water treatment cost avoided is estimated at €35.4 million (over 25

83
years). Private water bottling companies are the main beneficiary and potential partners in PES
systems.
Around 70% of the watershed areas in the PAs are forested and soil erosion is currently well
regulated, as a result there is not a significant monetary difference between the BAU and SEM
scenario. However, it is important to note that the benefits provided by the ES could be lost through
increases pressures on the sites.
4.5 Natural Disaster mitigation and risk reduction
Box 4-5: Key findings for natural disaster and risk reduction sector
Romania has a long history of natural disasters (floods and landslides). The potential
economic loss associated with these events is estimated at 6% of the GDP accounting for
approximately $2,300 million a year, with an annual probability of occurrence of 0.5 %
(World Bank 2008).
The quality and quantity of ecosystems significantly impacts the frequency and severity of
natural disasters and the growing emphasis on PAs could play a significant role in risk
reduction under sustainable forest ecosystem management.
If the upstream protection functions of the ecosystems of 3 pilot PAs serve to minimize the
impact of floods by 25% below what it would have been in the absence of the protective
functions, then the ecosystems‟ value of flood control in terms of avoided damage costs
(projected on a pro rata basis) equates to an average of €0.4 million a year – 9 million a year
based on a damage cost avoided and preventative expenditure approach respectively.
When applying the damage cost avoided and preventative expenditure values as upper and
lower value limits for the ecosystems of the 5 pilot PAs over the next 25 years, the
water retention regulating services within the PAs in terms of mitigating natural
disasters (flood control), is valued at between € 27 million and €182 million (under BAU)
and €44 million and €482 million under SEM.
4.5.1 Background
Floods and landslides rank among the major natural hazards facing mountain areas in Romania.
Annual average incidence of major flood related events in Romania is 1.03 events / year with an
exposed population of 1,174,894 people. The potential economic loss associated with these events
is estimated at 6% of GDP accounting for approximately US$2,300 million a year, with an annual
probability of occurrence of 0.5 % (World Bank 2008). Statistics show that farmland, housing, traffic
and communication lines are endangered by flooding. Over recent years there have been marked
increases in losses from property damage and lost revenue due to business interruption caused by
extreme weather events. Major flooding events were recorded in July 2004, July and September
2005 and March 2006 affecting 14,128, 14,669, 30,800 and 17,071 people respectively (WHO
2011). Flooding is particularly intense in mountainous areas and low-lying floodplains (MEF 2005). It
is likely that the frequency and severity of these events will increase in the future, both due to on-
going ecosystem degradation and because of climate change.
Romania has had to live with natural disasters for a long time, and has adopted specific regulations
aimed at minimizing their risk. These regulations were effective before the fall of the communist

84
regime, when the state was the major land owner. For example, the forest categorization system
(e.g. T1 and T2 – protection forests) was driven by the recognition of the protection role of the forest,
not only for biodiversity conservation, but in particular for water and soil erosion regulation.
Due to changes in property ownership, regulations being less strictly enforced during the transition
period, forest overharvesting (sometimes clear cutting) and increasing pressure on pastures and
agricultural land the protective role of ecosystems has diminished, and the incidence of floods and
landslides has increased in the last 10-15 years. Infrastructure developed to reduce the impact of
natural disasters such as dams, slope regulating systems, torrent regulating infrastructure, etc. has
been virtually abandoned or insufficiently maintained in some areas. This has also contributed to an
increase in the incidence of disaster events, although it is hard to isolate the influence of the
damaged ecosystems from the poor maintenance or lack of protective infrastructure.
The quality and quantity of ecosystems significantly impacts the frequency and severity of natural
disasters and the growing emphasis on PAs could play a significant role in risk reduction under a
sustainable ecosystem management scenario.
4.5.2 Characterization of BAU and SEM scenarios
In order to value role of the ecosystems of PAs in mitigating floods and landslides, the assumptions
used to estimate soil erosion were adopted (see section 4.4.2). Under the BAU scenario the density of
the forest stands is conservatively considered to be constant. Under the SEM scenario it is assumed
that the density of the forest stands increases and that there is an improvement in natural pasture
habitats (in terms of land coverage) due their sustainable management.
The assumptions are based on the fact that under the BAU scenario, the unsustainable management
of the forests and the inactive management of pastures (or overgrazing in some case) will decrease
the water retention functions of the ecosystems. This translates into a higher incidence of flash floods.
Conversely under the SEM scenario, the water retention function is stronger resulting in a decreased
incident of flash floods.
The methodology adopted required accessing a large volume of information across many sectors and
was prompted by the finding that there is a strong correlation between eroded soil quantity and
disaster risk (Pradhan 2011)33
. The results show a direct proportionality between soil erosion and the
risk of landslide and floods events. Forested areas (in green) have no disaster risk while deforested
areas have the highest risk (in red).The intermediary levels are: very small risk, small risk, medium
risk. Risk for floods and landslide event were calculated based on eroded soil quantity using different
scientific formula and indicators (Figure 4-35)34
.
33
Several case studies published in 2010 and 2011 demonstrate a direct link between soil erosion and the risk of
landslide. 34
Formulas are based on a digital model of the terrain (expressed by indicators) and soil erosion quantities that are measured. The results are based on extrapolating the measured results and finding average empirical coefficients.

85
Figure 4-35: Disaster risk map in MNP (source Transilvania University 2011)
Risk maps and the percentage of area at risk have been derived for each pilot site. Table 4-10
summarizes the results of the BAU and SEM modeling for the ecosystems in the pilot PAs. For
VNNP the results show no difference between BAU and SEM, this largely due to the lower altitude
and gentler slopes found in the park.
Table 4-10: Risk level as % of forest coverage under BAU and SEM in targeted PAs.
PA Risk level % of surface - BAU % of surface - SEM
Apuseni Low and very low 96 99
Moderate 3 1
High and very high 1 0
Muntii Maramuresului Low and very low 75 90
Moderate 21 9
High and very high 4 1
Piatra Craiului Low and very low 97 99
Moderate 3 1
High and very high 0 0
Retezat Low and very low 99 100
Moderate 1 0
High and very high 0 0
Vanatori Neamt Low and very low 99 99
Moderate 1 1
High and very high 0 0
The results indicate that the differences between BAU and SEM are significant only for MNP, PCNP
and ANP. For ReNP and VNNP the differences are very small. These findings correlate with data

86
recorded for disaster events; there are major floods recorded for the last years in MNP, some events
took place in ANP and PCNP while almost no major events were recorded in ReNP and VNNP. The
data were translated into a general decreasing annual incidence of major flood events, used when
calculating the costs avoided by SEM. The decreasing incidence of floods for the pilot parks under
SEM are shown in Table 4-11, along with the BAU scenario indicators.
Table 4-11: Characterization of BAU and SEM values for floods incidence Site indicator BAU SEM
General Number of people affected by flash floods
Change in line with population plus a factor of 1.2 to account for increasing density of settlement & development
% of potentially affected population avoiding damages
Decreasing 1% years 1-5, 1% years 5-10, 2% years 10-15, 3% years 15-20, 4% years 20-25
Increasing 5% years 1-15, 4% years 15-25
Forest capacity to prevent flood events
Decreasing 1% years 1-5, 2 % years 5-10, 3% years 15-25
Increasing 5% years 1-10, 3% years 10-25
Costs / expenditures avoided / ha
Change in line with population plus a factor of 1.2 to account for increasing density of settlement & development
Forest surfaces considered
Double the T1 and T2 area
ANP Frequency of flash floods/year
Increasing 0.1% years 1-15, 0.3% years 15-25
Decreasing 2% years 1-5;, 1% years 5-25
MNP Increasing 0.2% years 1-15, 0.5% years 15-25
Decreasing 3% years 1-5, 2% years 5-25
PCNP Increasing 0.05% years 1-15, 0.15% years 15-25
Decreasing 1% years 1-5; 0.5% years 5-25
Given the results of the risk assessment, which covered a 25 year period, and the availability of data
(some records are only for ANP, MNP and PCNP) the valuation was based on the average number
of people affected by floods and expenditures to repair infrastructure (CJAlba 2010, CJCluj 2010, CJ
Bihor 2010, CJ Brasov 2010, CJ Arges 2010) for ANP and PCNP. For the two PAs the total
population affected is around 1,500 and damage to public infrastructure is estimated at €1,543,300.
No comprehensive MNP-level data are available on either the damage costs associated with floods
and landslides, or of the expenditures that are made to prevent or mitigate them. Detailed data can
be found about the area of Borsa, Viseu de sus and Poienile de sub Munte related to flood and
landslide events in July 2008 (CJM 2008). Damage due to floods was reported by 677 households in
Viseu de sus, Borsa and Poienile de sub Munte municipalities, all inside the park: affecting 2,600
people. The total compensation directly paid to the population was €84,000, or €124 per household.
In addition, damage to public and commercial infrastructure (roads and bridges) was estimated to
total €3.0 million. The number of households affected by flooding around Vaser Valley in 2008
accounts for just 19% of the total population affected by internationally reported floods in 2004 and
2006 (WHO 2011). It is clear that the Carpathian PAs may play an appreciable role in providing flood
mitigation in Romania which is regularly affected by flooding. Extrapolating the historical data on the
frequency and impact of flooding events, we can assume that a flash flood (affecting 2,500 people)
occurs every 1.03 years.
If the upstream protection functions of the 3 pilot PAs serve to minimize the impact of floods by just
25% below what it would have been in the absence of the protective functions, then the value of
flood control in terms of damage costs avoided (projected on a pro rata basis) equates to an
average of €1.3 million a year.
It is also possible to look at the preventive expenditures. Work carried out in 2007 in MNP
estimates the value of water regulation and flood control services provided by forested ecosystems

87
from public expenditures at €150/hectare – equivalent to €181 in 2010 prices (Ceroni 2007)35
. If
these values are applied to a surface equal to twice the area T1 and T2 forests in all 5 PAs36
, and
assuming that the forest‟s flood mitigation capacity is 60%37
, this translates into annual benefits of
some €9 million a year (Figure 4-36). Applying the BAU and SEM scenario over the data processed
using Ceroni‟s model results in much higher values compared to the damage cost avoided approach,
but the data is scarce and unreliable.
Figure 4-36: Estimated value of ecosystems in Pilot PAs in terms of flood prevention services
EUR
Damage costs avoided 1,364,641
Preventive expenditures avoided 8,992,138
Total PA flood protection value 1.3 – 9.0 million
Figure 4-37: Potential benefits of the ecosystems in 5 PAs in damage costs reduction – using forest surface approach (Ceroni 2007).
A continuation of business as usual will result initially in a slow decrease followed from 2020 with a
dramatic decrease in damage cost avoided due to the increased incidents of floods coupled with the
reduced ecosystem protection capacity. Under the SEM scenario there is a slow increase in the
damage costs avoided. Under the BAU scenario, the present value (PV) of the damage costs avoided
by ecosystem services in the pilot PAs over the next 25 years is just over €10.8 million. The PV for
SEM scenario is estimated at €14.5 million (Figure 4-38 and Figure 4-39). Under the preventative
cost approach the cost under BAU is 67.061 million and under SEM – 119.301 million.
35
In this study values were derived from Croitoru et al. (2007) who estimated watershed protection values based on direct public spending to protect forest with a hydrological value. Croitoru reports values between 45 and 150 euro per hectare per year for different Mediterranean countries including Slovenia and Croatia. The upper value of 150 euro (502.05 RON) per hectare from Croitoru was chosen for application in MNP, given that the area is particularly prone to floods. This value is most likely an underestimate of the public spending necessary to fully protect the water regulation functions in MNP” 36
This is taken to be a conservative approach, as it does not consider the whole forest area 37
Conservative estimate - based on expert opinion.

88
Figure 4-38: Costs saved by ecosystem services of Pilot PAs - BAU (PV@10%=10.8 million EUR)
Figure 4-39: Costs saved by Ecosystem services of Pilot PAs - SEM (PV@10%=14.5 million EUR)
Figure 4-40: Costs saved by ecosystem services of the Pilot PAs (preventive costs included) - BAU
(PV@10%=67.1 million EUR)
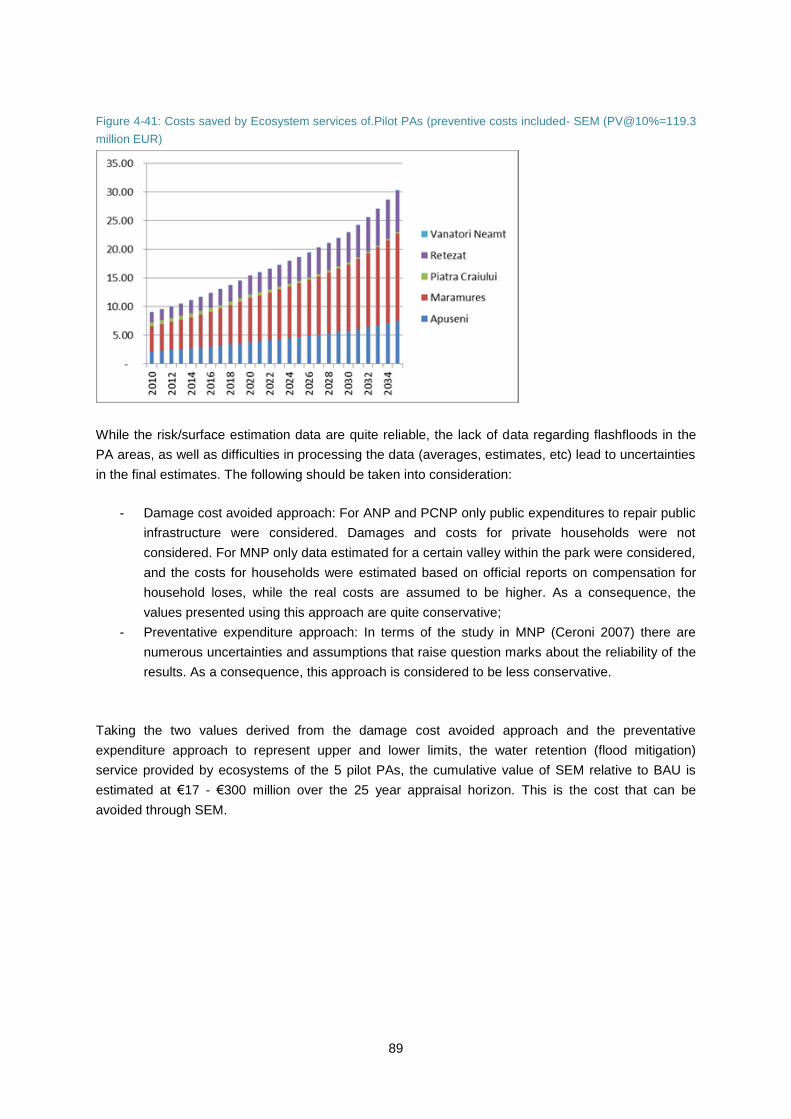
89
Figure 4-41: Costs saved by Ecosystem services of.Pilot PAs (preventive costs included- SEM (PV@10%=119.3
million EUR)
While the risk/surface estimation data are quite reliable, the lack of data regarding flashfloods in the
PA areas, as well as difficulties in processing the data (averages, estimates, etc) lead to uncertainties
in the final estimates. The following should be taken into consideration:
- Damage cost avoided approach: For ANP and PCNP only public expenditures to repair public
infrastructure were considered. Damages and costs for private households were not
considered. For MNP only data estimated for a certain valley within the park were considered,
and the costs for households were estimated based on official reports on compensation for
household loses, while the real costs are assumed to be higher. As a consequence, the
values presented using this approach are quite conservative;
- Preventative expenditure approach: In terms of the study in MNP (Ceroni 2007) there are
numerous uncertainties and assumptions that raise question marks about the reliability of the
results. As a consequence, this approach is considered to be less conservative.
Taking the two values derived from the damage cost avoided approach and the preventative
expenditure approach to represent upper and lower limits, the water retention (flood mitigation)
service provided by ecosystems of the 5 pilot PAs, the cumulative value of SEM relative to BAU is
estimated at €17 - €300 million over the 25 year appraisal horizon. This is the cost that can be
avoided through SEM.

90
5 The estimated values of ecosystems of PAs at the national level While it is useful to have an estimate of the contribution individual parks, and the 5 pilot parks overall,
make to the Romanian economy and welfare, there are conservation benefits in managing the PAs as
a network. Therefore an understanding of the economic importance of the overall network of PAs is
important. This Chapter attempts a high level estimation of the contribution of the Carpathian System
as a whole to Romania‟s economy based on the evidence generated on the five pilot PAs. It also set
outs the steps to developing and refining this assessment.
There are currently 106 PAs in Romania covering a total area of 1,057.487 hectares. The Ministry of
Environment and Sustainable Development are legally responsible for these PAs. There are 21 major
protected areas (12 national parks and 10 nature parks) included in the Romanian CNPA. Annex 3
presents an overview of the Carpathian PAs noting their total surface areas and forest cover. It also
provides a qualitative assessment of the Romanian Carpathian Protected Areas, including the 5 pilot
sites, based on the expert opinion of the park managers and the study team. On the basis of the
qualitative assessment across the sites, the pilot studies can be taken to be broadly representative of
the network as a whole in terms of the range of Ecosystem Services they provide and the relative
significance of these services.
5.1 High level assessment of PA ecosystems at system-level to the economy
Annex 5 provides an overall summary table of the valuation approach, findings and uncertainties for
each of the PA ecosystem service assessed in this study. Table 5-1 based on Annex 5 estimates the
NPV of SEM (based on the PV of SEM minus the PV of BAU) for the 5 sites at €518 million. The
cumulative value of all five PAs is €2,794 million. A very high level estimate of the value of the entire
Carpathian network of PAs can be based on the value of the ecosystem services of the 5 pilot PAs,
which represents just over 30% of the total area of the entire network (Table 5-1). This is estimated at
a NPV for SEM of €1,685 million and a cumulative value of €9,084 million.

91
Table 5-1: Summary of ecosystems values for the 5 pilot sites
ES
Ty
pe
Service BAU Value (PV @10%, 2011-2035, mill EUR)
SEM value (PV@10%, 2011-2035, mill EUR)
NPV (PV SEM – PV BAU)
@10%, 2011-2035, mill EUR
Total cumulative
benefit under SEM (25
years, mill EUR)
Pro
vis
ion
ing
Se
rvic
es
Food / agriculture products 174.00 190.00 16 83.90
Wood & NTFPs 77.30 74.50 -2.8 -2.80
Water supply (reduced treatment costs associated with regulating services of soil erosion and water flow regulation )
176.3 177.2 0.9 35.4
Source of energy (fuel etc) 0.00 0.00 .- 0.00
Reg
ula
tin
g S
erv
ice
s Regulation of GHGs 14.40 20.20 5.80 33.30
Micro-climate stabilization 0.00 0.00 - 0.00
Soil erosion and water regulation (storage and retention) related to disaster mitigation
10.80 14.40 3.60 17.50
Nutrient retention 0.00 0.00 - 0.00
Cu
ltu
ral
Se
rvic
es
Spiritual, religious, cultural heritage
0.00 0.00 - 0.00
Educational 0.00 0.00 - 0.00
Recreation and ecotourism 787.20 1,282.90 494.8 2,626.80
Landscape and amenity 0.00 0.00 - 0.00
Biodiversity non-use 0.00 0.00 - 0.00
TOTAL 1,440.7 2,000.6 556.4 2,794
These aggregated results should be taken as a very high level indicative estimate. They are based on
the estimates for five pilot sites which themselves include a number of assumptions and uncertainties.
To refine the estimates sites specific studies of the sites could be undertaken, especially for their
tourism values which is a key driver for the 5 pilot sites studies. The aggregated value may be an
underestimate in that many ecosystem services have not been valued, but the estimated services
may also be overestimated due to the fact that many of costs of SEM have not be taken into
consideration.
Importantly the dependency of the values to scale also needs to be taken into consideration. For
some services, for example recreation and tourism there is a steep relationship between area (scale)
and value. That is the provision of the first few sites bring high benefits, but adding more and more
sites can add relatively little to total value. Therefore independently valuing sites and adding them up
can lead to a misleading assessment. The overall assessment of the area needs to account for
changing marginal values as total quantities change over a region (i.e. taking into account substitute
sites in the case of tourism values).

92
5.2 The costs of SEM
The financial (management) costs of BAU and SEM have not been considered in detail as part of this
study, which has focussed on illuminating the cost of BAU in terms of ecosystem service degradation
and hence the ability of PA ecosystem services to support productive sectors. This section provides
an overview of the financial costs associated with the optimal management of the Carpathian PAs, for
the 5 pilot PAs, based on a recent assessment by NFA-Romsilva (2010 figures).
Table 5-2 presents the financial gap analysis by program area for the five pilot sites. The total gap is
estimated to be €666,658 / year. More detail on cost categories in provided in Table 5-3. Figure 5-1
presents the FTE gap analysis by program area.
It should be noted that the PAs have not yet developed yet an ecosystems-based PA management
plan, so the cost indicated here may be underestimates. This will needed. Nad further discuss in the
conclusions and recommendations.
If we assume that costs are constant over 25 years, the total cost over 25 years to optimally manage
tourism is €2.8 million (compared to €2,626 million in estimated benefits). This suggests that the
investment in SEM (optimal management), for which total cumulative cost would be €16.7 million, is
cost beneficial.
Table 5-2: Financial gap analysis by program area, per year
Cost category Available Basic (gap) Optimal (gap) Total
Biodiversity management 70,212 99,121 263,098 432,431
Tourism 24,856 50,040 39,480 114,376
Awareness, heritage, local development
9,128 7,940 11,048 28,116
management & admin 37,819 28,392 28,524 94,735
TOTAL 142,015 185,493 342,150 669,658
Source: NFA-Romsilva
Table 5-3:. Overview of Cost Categorizes
P1 Biodiversity management
1.1. Inventory and mapping 1.2. . Monitoring the conservation state 1.3. Patrol, implement regulations, special
measures of protection 1.4. Data management 1.5. Reintroduction of extinct species 1.6. Ecological reconstruction
P2 Tourism
2.1. Recreational infrastructure 2.2. Tourism opportunities and services, information, marketing and promotion 2.3. Visitor management
P3 Awareness, heritage, local development 3.1. Traditions and communities 3.2. Public awareness and communication 3.3. Ecological education
P4 Management & Administration
4.1. Equipment and infrastructure 4.2. Management staff 4.3. Strategic documents and planning 4.4. Staff Training
Source: NFA-Romsilva

93
Figure 5-1: FTE Gap Analysis by program area

94
6 Conclusions and Recommendations
6.1 Conclusions
This study has attempted an initial assessment of the economic contribution of the ecosystems of the
Carpathian Network of PAs. It has adopted an ecosystem-based Sector Scenario Approach, the
objective of which is to provide evidence of the contribution of PA ecosystem services to productivity
and growth for key sectors of the economy and to identify appropriate policies that enhance the
provision of these ecosystem services over the long term.
The results show that there are significant benefits associated with moving from the BAU
management of the areas to SEM. The NPV of SEM (based on the PV of SEM minus the PV of BAU)
for the 5 sites is estimated at €518 million. The additional cumulative value of ecosystems under SEM
in the five PAs is estimated at around €2,800 million (over 25 years). However, it is important to
recognise that many ecosystem services are being provided/operating at close to the SEM level (e.g.
the watershed protection function of the parks which contributes to soil stabilisation and water flow
regulation and purification and grazing lands in some parks). Therefore, the significant benefits
already provided (under the BAU scenario) are at risk if the parks at not sustainably managed. Note
therefore needs to be taken of the values that could be lost as a result of damage or loss of the
ecosystem service. In such cases the significant values under BAU need to be protected and
enhanced where possible.
The results can be taken as an underestimate of the value of the ecosystems in the five pilot sites
given that a number of ecosystem services are not accounted for. These include fisheries,
hydropower, micro-climate stabilisation, nutrient retention, spiritual, religious and cultural heritage,
education, landscape and amenity and biodiversity non-use.
Fisheries and hydropower are dependent on water quality and quantity. The monetary significance of
these sectors under BAU and SEM is yet to be properly assessed. However, significant economic
cost could be imposed through a deterioration in ecosystem heath (for example loss of watershed
protection forest and increase soil erosion could result in siltation of downstream dams adversely
affecting electricity production cost and profitability).
Inevitably movement towards SEM will incur costs – for example SEM for the tourism sector requires
investment in visitor centres, infrastructure and staff to monitoring and manage tourism flows, while
SEM for the forestry and agriculture sector will require compensation payments for restriction imposed
on existing activities. By and large these costs are not included in the analysis and the benefits of
SEM may therefore be overestimated. However based on a high level comparison of the cost of
optimally managing the PAs, the benefits are shown to outweigh the costs many times.
There are a number of uncertainties surrounding the estimates that could be reduced through further
studies. There is uncertainty related to the valuation approaches used (e.g. benefit transfer has been
used in a number of instances and site specific studies are required for more reliability) and the

95
physical data (e.g. there are limited surveys of visitor numbers, WTP, CS and tourist profiles).
However, of note is the fact that this study has been able to contribute to the availability of scientific
data through the site specific modelling that has been undertake to determine soil erosion and
associated changes in water flow and quality.
The analysis highlights the difficulties in estimating the regulating services and specifying how
regulating services interact to provide ultimate benefits. For example soil erosion underpins the water
quantity and quality estimates used to estimate water treatment costs. The analysis also highlights the
interdependencies between sectors. For example, ecotourism depends on SEM within agriculture,
forest and the water resources sector.
The key sector benefiting from PAs is shown to be the tourism sector which if sustainably managed
has the potential to generate an additional €2,626 million over the next 25 years (94% of the total
additional value of SEM). It is important to note that this value depends on the continued provision of
healthy PAs ecosystems that contribute to the tourism experience and for which tourists are prepared
to pay. While costs were not included in the BAU-SEM analysis for tourism, based on analysis by
NFA-Romsilva (and assuming costs are constant over 25 years) cumulative cost over 25 years for
tourism is estimated at 2.8 million. This conservative approach adopted in the analysis (i.e. a
conservative estimate of visitor numbers, expenditure and level of entry fee has been used) adds
confidence to the finding that SEM can more than cover its administration and management costs.
This finding should help the Romania CNPAs in its current preparation of a PA entry passes and fees
policy.
The significant consumer surplus estimated for tourism and recreational experiences within PAs in
Romania suggests that mechanisms, such as entrance fees, would be successful. Entrance fees
can also be used to control demand and minimize impacts on the site. Currently entrance fees are
very low or non-existent, so there is therefore the scope to introduce and increase entrance fees,
particularly at sites where the tourism potential is high. However, realizing the full tourism potential
(benefits) is dependent on the prior investment in tourism and recreational facilities.
In addition SEM is seen to enhance employment, especially in the tourism sector, and has the ability
to promote equitable growth through providing opportunities in rural communities surrounding PAs.
The distribution of the benefits and values among potential beneficiaries is also important, particularly
in terms of ensuring an equitable distribution of benefits and costs and in designing potential PES.
There are four main groups economically impacted by PAs: PAs authorities, other government
agencies, the private sector, and households. They cover most sectors and population groups in the
country and include beneficiaries at local, regional and national levels.
Based on analysis of the ecosystems of the 5 pilot protected areas it is possible to derive very high
level estimates of the value of SEM for the system as a whole. Scaling up to values for the 5 pilot
areas for the whole network, based on the number of hectares and assuming that the 5 pilot sites are
representative of the whole area provides SEM with a NPV of €1,685 million (and cumulative value of
around €9,000 million over BAU). This provides an argument for investing in conserving the
Romanian CNPA as a whole. These very initial and rough estimates do however need to be refined
through more detailed studies at the pilot sites and site specific studies at other sites in the network.

96
6.2 Recommendations
Recommendations have been identified for the sectors studied to facilitate the design of sector
specific policies to sustainably manage important ecosystems services. Separate recommendations
for additional future research, and relating to policy and institutional strengthening have also been
identified.
6.2.1 Tourism
The following approaches to managing entrance fees could be further explored, and are being
reviewed in the proposed PA entry passes and fess policy:
Entrance fees could be applied at the honey pot sites and the funds redistribute across the
network using the Association of PAs Administrators;
An entrance fee of 2 EUR/per visit could be introduced at the honey pot sites.
A diverse set of payment options could be explored (e.g. internet, cash machines,
accommodation operators, transport operators) and/or incentives (e.g. stickers) to encourage
payment;
Awareness campaigns are recommended to introduce news of any proposed higher entrance
fees.
A realistic target should be set, e.g. that 50% of visitors pay within the next 10 years.
A further study could be conducted to determine the appropriate entrance fee for key sites. The
priority should be to develop tourism at „honey pot sites‟ based on a detailed understanding of the
carrying capacity of the area and actions needed to fully develop and manage ecotourism at these
sites (e.g. the development of visitor centres infrastructure, trails, signage etc).
Data on visitor numbers are key to the proper management of the protected areas. These are
usually provided by PA administrations based on data collected from local operators; in the future, the
precision of these estimates needs to be improved. Data should be collected by NIS or by statistical
surveys conducted by professionals on behalf of PA administrations.
Further study is required to determine the potential for introducing tourism related PES mechanisms.
Private tours operators are the main beneficiary from tourism within the PAs. A possible mechanism
to explore is tourism operators paying PAs for collaboration in terms of touring, hotels and cable cabin
operators. Tourism operators (restaurants, hotels, tour operators, etc.) could for example pay 0.5-
1.5% of their revenues to the National Environmental Fund (NEF). This payment would visible to
tourist on receipts etc. The NEF would then spend this money on the PAs.
6.2.2 Forestry and Hunting
As part of a sustainable management strategy for the forest areas within the protected areas, NTFPs
management and harvesting should be developed. This will require undertaking more detailed studies
of their capacity and market potential.
SEM requires taking more areas under protection and providing adequate compensation for any lost
production due to forest land use restrictions. One possibility is to use European funding available for

97
Natura 2000, as a lot of parks overlap with the Natura 2000 network. However, this is only an option
once Management plans, defining the conservation measures are in place,
In terms of PES, there may be opportunities in the future to set up payments from private companies
benefiting from NTFP production.
6.2.3 Agriculture
To derive the benefits of SEM breeding needs to be encouraged where the carrying capacity has not
yet been reached. This is likely to require the provision of incentives to farmers, and further
consultation with farmers. Studies are required to design an effective incentive mechanism.
Conversely, farmers will require compensation where breeding / grazing needs to be reduced.
6.2.4 Water resources
A potential PES schemes in the water resources sector is for Bottle water companies to pay a percent
of their revenues to the NEF, which would be used to finance projects submitted by PAs focused on
the sustainable management of mineral water springs.
Further study of the bottle water industry is required to generate data on the efficiency of the bottling
companies (costs for processing and bottling); costs associated with the temporary stoppage in the
delivery of an ES (for example, during heavy rains springs may have too many nitrates due to
infiltration from pastures and not be usable); and value added along the production chain.
6.2.5 Natural Disaster Management
Further studies are required to generate data on the cost of damage to public infrastructure,
household damage costs and the frequency of natural disaster events.
6.2.6 General further research needs
There are a number of research needs generic to all the sectors, these include:
The PAs have not yet developed yet an ecosystems-based PA management plan, and this is
a priority need looking forward;
More detailed study of the links between BAU and SEM to employment, tax revenues and
other key indicators in addition to NPV. In most cases the data was not available to report on
these indicators within this study;
Detailed analysis of the costs of SEM;
Site specific studies to refine ecosystem valuation estimates. This study has relied largely on
value transfer estimates, there are also very few primary economic valuation studies available
in Romania. To refine the estimates sites specific studies of the sites could be undertaken,
especially for their tourism values which is a key driver for the 5 pilot sites studies.
Refinement of aggregate / system wide assessment
The establishment of a permanent review group to support research and findings composed
of politicians and academics is recommended.

98
6.2.7 Policy and finance
Based on the conclusion and arguments of SEM it is clear that sectors need to introduce policies to
protect PA ecosystems services. Cross sector co-operation is also vital given that a number of sectors
both benefit from and have the ability to degrade ecosystems through their activities. The results of
this study can be used to inform the development of sector policies that ensure the sustainable
management of PA ecosystems and to design sustainable financing mechanisms.
The development of PES and other sustainable financing opportunities is ongoing as part of the
broader UNDP-GEF study. The following financing mechanisms are currently being explored:
Tourism
o The introduction / increase in entrance fees to capture willingness to pay building
on the findings of this study and focussed on the “honey pots” sites;
o Contributions from tourism operators – for example PA tourism operators paying
a certain percentage of their profit to the NEF (National Environmental Fund),
with PA administration projects then being financed by the fund;
Water
o Similar to tourism, bottling water operators contributing a certain percentage of
their profit to the NEF (National Environmental Fund)
o For urban water supply, Rowaters paying for clean water (as part of an integrated
PES mechanism).
Ecosystem compensation – investors paying for any residual impact of their activities to
the NEF.
Reform of the legal framework of the National Environmental Fund would be required based on the
design of these innovative financing mechanisms.
6.2.8 Institutional aspects
Several institutional reforms are recommended to support the transition to SEM and an ecosystems
based management approach (these are linked with the envisaged financing mechanisms described
above):
Increased capacity for NEF administration to deal with biodiversity conservation
applications and project monitoring;
Establishment of an Association of PA administrations to support administration of funds;
Increased capacity at the NEPA (National Environment Protection Agency) to formally
verify and approve the MP of the PA;
Enhanced Co-ordination between the Ministry of Environment and Forests and the Rural
Development Programme Management Authority to determine a compensation payments
system for forests;
Development of a carbon registry mechanism at the Ministry of Environment and Forests
to initiate movement towards carbon trading;

99
References
ANP 2008, Management Plan of Apuseni Natural Park – Apuseni Natural Park Administration
Aylward, B. 2000. Economic analysis of land-use change in a watershed context. Presented at a
UNESCO Symposium/Workshop on Forest-Water-People in the Humid Tropics, Kuala Lumpur,
Malaysia. 31 July - 4 August, 2000.
Bovarnick, A., F. Alpizar, C. Schnell, Editors, 2010 The Importance of Biodiversity and Ecosystems in
Economic Growth and Equity in Latin America and the Caribbean: An economic valuation of
ecosystems, United Nations Development
Programme, 2010.Ceroni, M. 2007. Ecosystem services and local economy in Maramures Mountains
Natural Park, Romania. Report submitted to United Nations Development Programme (UNDP)
Bucharest
CJM 2008 – Activity Report of the Maramures County Council. Raport de activitate 06/2008 –
12/2008, Consiliul Judetean Maramures.
CC2010 – Investigation report regarding milk market. Raport de investigatie privind piata laptelui.
Consiliul National al Concurentei 2010, Bucuresti
Cernelea, E., 2004 Traditia pasunatului transhumant in Retezat, Ed. Ferma Bucurest aug 2004
Dudley, N., S. Stolton, A. Belokurov, L. Krueger, N. Lopoukhine, K. MacKinnon, T. Sandwith and N.
Sekhran (editors), 2010; Natural Solutions: Protected areas helping people cope with climate
change. IUCN WCPA, TNC, UNDP, WCS, The World Bank and WWF, Gland, Switzerland,
Washington DC and New York, USA
Dumitras, D. 2008 Comparing welfare estimates from travel cost and contingent valuation –
application to the recreation value of Romanian parks, Lucrari Stiintifice, Seria I, 10(4)
Dumitras, D., Ariton, F., Merce, E., 2011. A brief Economic Assessment on the Valuation of National
and Natural Parks: the case of Romania. Not. Bot. Hort. Agrobot. Cluj 39 (1):134-138.
Ecosystem Marketplace, 2011, State of the Forest Carbon Markets 2011, From Canopy to Currency,
www.ecosystemsmarketplace.com
eftec (2009). Valuing Environmental Impacts: Practical Guidelines for the Use of Value Transfer in
Policy and Project Appraisal. Submitted to the Department for Rural Affairs, UK.

100
Ghetau. Vasile, 2002. Declinul demografic al Romaniei: ce perspective? Sociologie Românească,
Volumul II, Nr. 2, 2004
Giurgiu V., 2010, Consideratii asupra starii padurilor Romaniei, Revista Padurilor nr.2/2010,
Bucuresti
Getzner, M. 2009. Economic and cultural values related to Protected Areas Part A: Valuation of
Ecosystem Services in Tatra (PL) and Slovensky Raj (SK) national parks. WWF World Wide
Funds for Nature Danube Carpathian Programme (DCP), Vienna.
Hidroelectrica, 2011 Annual Activity Report, Raport Anual de Activitate Hidroelectrica SA, Bucuresti
Hockins M., Stolton S., Levington F., Dudley N., Courrau J., 2006, Evaluating Effectiveness – A
Framework for Assessing Management Effectiveness of Protected Areas, 2nd
edition
IUCN – 2010 (José María de Juan Alonso) – Sustainable Tourism in the Mediterranean Panorama
and perspectives, strategies and actions, working document, summarized version, October 2010
INCDT – 2009 Institutul National de Cercetare – Dezvoltare in Turism (National Institute for Research
and Development for Tourism), - Strategia nationala de dezvoltare a ecoturismului in Romania,
Faza 1 – Experienta ecoturistica la nivel national si international, Bucuresti 2009.
IGES 2006 Institute for Global Environmental Strategies for IPCC, Guidelines for National
Greenhouse Gas Inventories
(http://www.ipcc.ch/publications_and_data/publications_and_data_reports.shtml#4)
Lockwood, M., Worboys G.L., Kothari A. (2006) Managingprotected areas: a global guide. Earthscan,
London, UK.
D.Lynn Forster, Cris P. Bardos et al. 1987. Soil erosion and water treatment costs. Journal of Soil and
Water Conservation, September/October 1987 vol. 42 no. 5 349-352
Millenium Ecosystem Assessment. 2005. “Ecosystems and human well-being. Synthesis.”
Washington D.C.: Island Press.
MMP – 2010 Starea Padurilor Romaniei, Annual Report prepared by Forest Department,
www.mmediu.ro/paduri/management_forestier.htm
MRDT. 2007. Masterplan for National Tourism in Romania 2007-2026. Ministry of Regional
Development and Tourism

101
MRDT 2009. Romanian National Strategy for Eco-tourism Development. Ministry of Regional
Development and Tourism
MNP 2008, Management Plan of Maramures Natural Park, Maramures Mountains Natural Park
Administration
MEF 2005. Romanian climate change mitigation strategy 2005-2007. Ministry of Environment and
Forests, http://www.mmediu.ro
/protectia_mediului/schimbari_climatice/1_Documentatie/SNSC_ro.pdf
MARD 2011 – Technical norms for determining pasturing capacity. Ministerul Agriculturii si Dezvoltarii
Rurale, Bucuresti 2011
NIS 2011. Romanian Tourism Statistical Abstract. National Institute of Statistics
NIS 2010. Romanian Tourism Statistical Abstract, National Institute of Statistics
OMT (2007), Master Planul pentru dezvoltarea turismului naţional 2007 – 2026 Strategia nationala de
dezvoltare a ecoturismului in Romania
OMT (2005), Technical assistance for the elaboration of the ecotourism strategy ofRomania (Final
report)
OMT (1999), Codul global de etică pentru turism
Philips. A. (ed.) 1998. Economic Values of Protected Areas: Guidelines for Protected Area Managers.
Task Force on Economic Benefits of Protected Areas of the World Commission on Protected
Areas (WCPA), the Economics Service Unit of IUCN International Union for Conservation of
Nature (IUCN), Gland.
POS Mediu. 2008. Manualul National al operatorilor de apa si canalizare (National Guidelines for
Water and water sewage systems operators), FOPIP 1 – 2003 )ISPA measure – Romania
RO16PPA012, EuropeAid/119629/D/SV/RO)
Pagiola, S. 1996. Republic of Croatia Coastal Forest Reconstruction and Protection Project: Annex J.
Economic Analysis. Staff Appraisal Report: Report: Republic of Croatia Coastal Forest
Reconstruction and Protection Project, World Bank, Washington DC.
B Pradhan, A Chaudhari, J Adinarayana, M F Buchroithner (2011) Soil erosion assessment and its
correlation with landslide events using remote sensing data and GIS : a case study at Penang
Island, Malaysia Environmental Monitoring and Assessment 1-13
PreventionWeb. 2011. Romania - Disaster Statistics: Data related to human and economic losses

102
from disasters that have occurred between 1900 and 2011.
PCNP,2008, Management Plan of Piatra Craiului National Park, Piatra Craiului National Park
Administration
Rowaters. 2010. Plan de management al spatiului hidrografic Somes Tisa (Management plan of
Somes Tisa water basin), Administratia Bazinala de Apa Somes-Tisa
Ruzzier, M., Žujo, J., Marinšek, M. and S. Sosič. 2010. Guidelines for economic evaluation of the
natural assets of the PAs. South East Europe Transnational Cooperation Programme, Institute
of the Republic of Slovenia for Nature Conservation, Ljubljana.
RNP 2009, Management Plan of Retezat National Park, Retezat National Park Administration
SCBD. 2008. Protected Areas in Today‟s World: Their Values and Benefits for the Welfare of the
Planet. Technical Series No. 36, Secretariat of the Convention on Biological Diversity,
Montreal.
TEEB. 2008. The Economics of Ecosystems and Biodiversity. An Interim Report.
TEEB. 2010. The Economics of Ecosystems and Biodiversity: Mainstreaming the Economics of
Nature: A synthesis of the approach, conclusions and recommendations of TEEB.
Transilvania University, 2011, Data collection and primary interpretation for valuation of 5 pilot Pas in
Romania, final draft, UNDP-GEF project Romania, 3458
UNEP (2001) Ecotourism and sustainability in publication Industry and environment,nr.3-4, vol. 24,
Nairobi, Kenya;
UNEP (2002) Revue trimestrielle Our planet, vol 13, nr.1 – Mountains and ecotourism, Nairobi,
Kenya;
UNDP, 2011. The Economic Value of PAs in Montenegro, final draft, UNDP GEF project Montenegro,
4279: Catalysing Financial Sustainability of Protected Areas in Montenegro
VNP 2010, Management Plan of Vanatori – Neamt Natural Park, Vanatori-Neamt Natural Park
administration
World Bank 2008, South Eastern Europe – Disaster Risk Mitigation and Adaptation Programme, The
World Bank, Sustainable Development Department Europe and Central Asia Region and
UN/ISDR secretariat Europe, march 2008
WHO. 2011. EM-DAT International Disasters Database: Romania Country Profile. World Health

103
Organization (WHO) Collaborating Centre for Research on the Epidemiology of Disasters
Emergency Events Database EM-DAT, maintained by Université catholique de Louvain,
Brussels. http://www.emdat.be/result-country-profile

104
Annex 1: Characterization of pilot PAs (ANP 2008, MNP 2008, PCNP 2008, ReNP 2009, VNNP 2010)
Apuseni Natural Park (ANP)
Area: 75,784 ha
Location: Western Romania, Central-North Western side of Apuseni Mountains, covering parts of
Cluj, Bihor and Alba Counties
Flora: The vegetation is structured by altitude as follows: mountain meadows, spruce forests (Picea abies) and deciduous forests, where one can encounter species such as: beech (Fagus silvatica), hornbeam (Carpinus betulus), Sycamore maple (Acer pseudoplatanus), Wych elm (Ulmus montana), ash (Fraxinus excelsior), wild cherry (Cerasus avium), field maple (Acer campestre), White birch (Betula verrucosa), rowan (Sorbus aucuparia), goat willow (Salix caprea), black walnut (Juglans regia)
etc.
Fauna: Many invertebrate species have been identified in the park, some being new to science, and some others being endemic to the Apuseni Mountains. The underground fauna is very well represented on ANP territory: many species are endemic and many are only found in one or two caves. Best represented is the group of Cholevinae coleopterans (Leiodidae) and Trechinae (Carabidae). The cave-dwelling genera Drimeotus and Pholeuon are endemic to the Apuseni mountains. The other genus Pholeuon also has an endemic sub-genus in the Bihor mountains, Pholeuon (s.str.), which is represented in ANP by 22 taxa. Among the Trechinae, the genus Duvalius is not endemic for Romania, however, 18 species of Bihor are endemic to this mountain range. In the aquatic ecosystems of ANP over 15 species of fish are found: brown trout (Salmo trutta fario), rainbow trout (Salmo irideus), brook trout (Salvelinus fontinalis), grayling (Thymallus thymallus), bullhead (Cottus gobio), minnow (Phoxinus phoxinus), Danubian barbel (Barbus meridionalis petenyi), barbel (Barbus barbus), nase (Chondrostoma nasus), stone loach (Noemacheilus barbatulus), spined loach (Cobitis taenia taenia), chub (Leuciscus cephalus) and roach (Rutilus rutilus carpathorossicus). Among amphibians 10 species were identified, of which worth mentioning are the fire salamander (Salamandra salamandra), the yellow-bellied toad (Bombina variegata), newts (Triturus alpestris, T. cristatus, Triturus vulgaris ampelensis). Among reptiles, 8 species can be listed: the common adder (Vipera berus), wall lizard (Podarcis muralis), viviparous lizard (Zootoca vivipara), sand lizard (Lacerta agilis), slow worm (Anguis fragilis colchicus), smooth snake (Coronella austriaca), Aesculapian snake (Elaphe longissima) and the grass snake (Natrix natrix). All common mountain bird species live in the area. In coniferous forests the following prevail: ring ouzel (Turdus torquatus), crossbill (Loxia curvirostra), nutcracker (Nucifraga caryocatactes), willow tit (Parus montanus), goldcrest (Regulus regulus), three-toed woodpecker (Picoides trydactilus), hazel grouse (Tetrastes bonasia), crested tit (Parus cristatus). In the deciduous forests, openings and meadows are encountered: woodpigeon (Columba palumbus), raven (Corvus corax), black wood-pecker (Dryocopus martius), mistle thrush (Turdus viscivorus), bullfinch (Pyrrhula pyrrhula), chaffinch (Fringilla coelebs), etc. Near the watercourse are encountered: dipper (Cinclus cinclus), grey wagtail (Motacilla cinerea) and the common sandpiper (Actitis hypoleucos). The following raptors are found in the park: Lesser Spooted Eagle (Aquila pomarina), Golden Eagle (A. chrysaetos), Common Bussard (Buteo buteo), Kestrel (Falco tinnunculus) and Red-footed Falcon (F. verspertinus), Sparrow Hawk (Accipiuter nisus) and Goshawk (A. gentilis). The mammal fauna includes species common to beech and spruce mountain forests, and also chamois (Rupicapra rupicapra) that has been reintroduced into the upper basin of Crisul Pietros – Boga valleys. The large mammal fauna is well represented by wolf (Canis lupus), lynx (Lynx lynx), bear (Ursus arctos), roe deer (Capreolus capreolus), red deer (Cervus elaphus), wild boar (Sus scrofa). Among the carnivores we find the wild cat (Felis silvestris), the polecat (Mustela putorius), and the otter (Lutra lutra). The small rodents are represented by 10 species, some of them having a special importance, as they have been listed in the EU Habitats Directive 92/94/EEC: bank vole (Clethrionomys glareolus), common vole (Microtus arvalis), field vole (M. agrestis), house mouse (Mus muculus), yellow-necked mouse (Apodemus flavicollis), striped field mouse (A. agrarius), wood mouse (A. sylvaticus), common dormouse (Muscardinus avellanarius), fat dormouse (Myoxus glis) and red squirrel (Sciurus vulgaris). The small insectivores are also well represented in ANP with 8

105
identified species (excluding bats): common shrew (Sorex araneus), pygmy shrew (S. minutus), alpine shrew (S. alpinus), water shrew (Neomys fodiens), Miller's water shrew (N. anomalus), white-toothed shrew (Crocidura leucodon), mole (Talpa europaea) and hedgehog (Erinaceus concolor). A few caves have special importance also due to the bat colonies they shelter (Lup Nicoara, 2005: Borda, 1998/199, 2002, Database of the Romanian Bat Protection Association): greater horseshoe bat (Rhinolophus ferrumequinum), lesser horseshoe (Rh. hipposideros), Rh. euryale, Myotis myotis, M. blythii, M. nattereri, M. brandtii, M. mystacinus, M. bechsteinii, M. emarginatus, M. daubentonii, M. dasycneme, noctule bat (Nyctalus noctula), Pipistrellus pipistrellus, Plecotus auritus, P. austriacus, Barbastella barbastellus, Miniopterus schreibersii, out of which the species Rhinolophus ferrumequinum, Myotis myotis and Miniopterus schreibersii has a great scientific importance.
Landscape: The Apuseni Mountains are characterized by a remarkable karst landscape, both for its extension and for its richness and variety of forms. The cliffs, mountains meadows and surface karst phenomena are landscape units of major interest. These are represented by dolines, short blind valleys (where the water infiltrates the limestone rocks through sink holes or swallow holes), karst plateaus, dry valleys, karren, polje (closed and flat hydrographic depressions with underground drainage), gorges, defilés etc. A particularity of Bihor Mountains is the presence of the forested karst, one of the few regions of this kind in Romania. The forest influences the development of underground caves but, at the same time, it sustains a remarkable biodiversity on the surface. The existence of this kind of landscape is one of the premises for the existence of ice caves.
Rationale for PA selection - socio-economic context: Specific karst environment biodiversity conservation is among the main reasons for selecting the area for protection. The area is among the last areas of those dimensions benefitting from the forested karts landscape. At the same time, the human communities within the area of the park represent an eloquent example of the “motii” population, only found in Romania at this site. The high aesthetic quality of the landscape is a result of the use of specific unique traditional methods for managing the land and organizing the local communities. There are 55 villages in the area of the park with a total estimated population of around 35,000 inhabitants. The local economy covers small scale agriculture and breading, forestry and wood processing, commerce and tourism. Mining activities have been very important in the past, and may become important again in the future. The area of the park is an important source of clean water to be used by downstream population.

106
Maramures Mountains Natural Park (MNP)
Area: 75,784 ha
Location: North Romania, Almost all the area of Maramures Mountains, covering northern – eastern
part of Maramures County
Flora: The vegetation types identified in the park are: i) Beech (Fagus sylvatica) and oak (Quercus petraea) vegetation layer, with a lot of other forest species such as Tilia cordata, Prunus avium, Acer pseudoplatanus, Carpinus betulus ii) Mixed mountain – pre-mountain forests (between 700 – 1,200 m altitude) with Fagus sylvatica, Fraxinus excelsior, Ulmus glabra, Larix decidua, Betula pendula, etc.; iii) Mixed mountain forests (between 1,000 – 1,400 m altitude) with Fagus sylvatica, Abies alba, Picea abies, Acer pseudoplatanus, Fraxinus excelsior; iv) Spruce mountain forests (over 1,300 m altitude); v) mountain meadows. A special zonal position is held by aquatic ecosystems, of great importance being the high altitude peat bogs within the spruce forests. A total number of 1,521 taxa were identified in the park, 27 of them being endemic taxa of the Romanian Carpathians: Achillea schurii, Aconitum moldavicum, Armeria pocutia, Campanula carpatica, Campanula serrata, Cardaminopsis neglecta, Centaurea carpatica, Centaurea melanocalathia, Chrysosplenium alpinum, Cochlearia officinalis subsp. pyrenaica, Dentaria glandulosa, Dianthus tenuifolius, Doronicum carpaticum, Festuca carpatica, Festuca porcii, Heracleum carpaticum, Hieracium kotschyanum, Melamphyrum saxosum, Phyteuma tetramerum, Phyteuma vagneri, Poa granitica ssp.disparilis, Ranunculus carpaticus, Scabiosa lucida, Silene nutans ssp. dubia, Symphytum cordatum, Trisetum fuscum.
Fauna: No less than 7 invertebrate taxa (out of a total of 74) were identified for the first time in Romania within the area of MNPN: Rhaphium ensicome, Rhaphium rivale, Argyra spoliata, Diaphorus halteralis, Hilara albitarsis, Empis (s.str.) nuntia, Empis (s.str.) planetica. An impressive number of Lepidoptera were also identified: 136. There are also important fish populations, increasing in biodiversity with the decrease in altitude: Salmo trutta fario, Thymallus thymallus, Hucho hucho, PhoxiriLis phoxinus, Cottus gobio, Barbus peloponnensius petenyi, Chondrostoma nasus, Leuciscus souffia agassizi (endemic for Maramures area). Amphibians are also well represented: Salamandra salamandra, Triturus alpestris, Triturus montandoni (endemic for Oriental Carpathians), Bombina variegate, Bufo bufo, Rana dalmatina, Rana temporaria. All Carpathians specific birds can be seen in the MNP, of note are Lyrurus tetrix, Tetrao urogallus, Tetrastes bonasia (rare species), Aquila crysaetos, Aquila pomarina, etc. Mammals populations is also complete: wolf (Canis lupus), lynx (Lynx lynx), bear (Ursus arctos), roe deer (Capreolus capreolus), red deer (Cervus elaphus), wild boar (Sus scrofa), the polecat (Mustela putorius), and the otter (Lutra lutra).
Landscape: Besides the valuable natural landscapes, Maramures Mountains are characterized by a very specific rural landscape with special local traditional architecture evident in houses and churches.
Rationale for PA selection - socio-economic context: MNP has been a natural park since 2005, in order to conserve landscape and local traditions, protect the natural, spiritual and cultural heritage of the area, practice sustainable forest management and encourage tourism based on these values. The area represents many natural, ethnic, cultural and historic values but also faces numerous problems related mainly with mining activities undertaken in the past, which left a physical mark in degraded sites but also a mark on the social environment by turning a once prosperous zone into a poor one. As a consequence of these specific local aspects, the objectives of the PA administration are diverse. There are 10 communes and towns in the area of the park with a total estimated population of around 115,000 inhabitants. The local economy covers small scale agriculture and breading, forestry and wood processing, small manufacture (traditional products including local trational food industry) commerce and tourism. Wood processing showcased in the architecture of local houses is a special feature of the area and an important touristic attraction. The area was a traditional mining area, while the industry is not very well represented today is has left an important historic impact on the landscape. The area of the park is an important source of clean water to be used by downstream population.

107
Piatra Craiului National Park (PCNP)
Area: 14,773 ha
Location: The entire Piatra Craiului National Park is located in the Meridional Carpathians, Central Romania, and it also includes parts of the neighboring mountain passes Rucar-Bran and Rucar-Zarnesti. The Piatra Craiului National Park stretches over the counties of Brasov and Arges, including areas belonging to the towns of Zarnesti, Moeciu (Magura and Pestera villages), Bran, Rucar and Dambovicioara.
Flora: The richness of the species inside the Piatra Craiului National Park is the result of the extremely diverse conditions the territory provides for the development of the vegetation. The altitude exceeding 2,200 m provides the appropriate development conditions for almost all of the Carpathian Chain alpine and mountain species. Fungi, moss, lichens and flower plants species thrive in the area.. A total number of 1170 plant species and subspecies have been identified throughout the national park‟s territory. 181 species have been included into the "Red List of superior plants in Romania" as endemic, rare or vulnerable species, proving the importance of the Piatra Craiului National Park from the point of view of flora species conservation. Improtant species include garofita pietrei craiului (Dianthus callizonus) the symbol of the Piatra Craiului massif, this mountain being the only place in the world to house this species, Taxus baccata, Angelica arhangelica, Nigritella nigra and N. rubra, Papaver alpinum ssp. corona-sancti-stefani; Linaria alpine, Leontopodium alpinum, Trolius europaeus, Rhododendron mytifolium, Gladiolus imbricatus, Gentiana lutea, Daphne blagayana, Daphne cneorum, etc. These species benefit from a strict conservation regime and attract nature lovers to Piatra Craiului during the summer..: The Piatra Craiului National Park houses an impressive number of mountain orchids, 48 species out of the 53 species found in Romania. Due to the high declivity of the mountain slopes, the vegetation layers formed according to the altitude are best noticeable here, the massif being surrounded, from the bottom towards the ridge, by hay fields, forests, bare rocks and alpine meadows.
Fauna: Invertebrate are particularly rich numbering 35 endemic species (e.g Nesticus constantinescui (Arahnida) and Rhagidia carpatica (Arahnida, Acari)) and 91 species identified as new to science.. There is also a large number of butterfly species, to date 216 species have been identified as either rare or endemic: Psodos coracinus dioszeghy,sub; Apamea zeta sandorokovacsi; Erebia pronoe found in the Carpathians only in Piatra Craiului and Bucegi; Pieris bryoniae mentioned in the red list of European day butterflies, etc. The fish, amphibians and reptiles fauna is slightly poorer, if compared to the other vertebrates group. The Piatra Craiului National Park also holds a rich bird fauna, including the 111 species identified so far, on the territory, rendering the area an ideal destination for bird watching. The climate and geology conditions, the geomorphology, the structure of the flora and vegetation, have created the proper conditions for the development of a particularly diverse mammal group. Over 40% of the 100 mammal species found in Romania live here. To date 21 species of bats have been identified in caves or old tree hollows throughout the national park. Many of these species are included in the strictly protected species category, according to the Bern Convetion, 6 of them are listed in the European Council Directive 92/43 EEC (Rhinolophus ferrumequinum, R. euriale, Myotis bechsteinii, M. blythii, M. myotys, Barbastella barbastellus) and one species - Vespertilio murinus - is included in the Bonn Convention. The Piatra Craiului National Park also holds a large population of large carnivores: bears - Ursus arctos; wolves - Canis lupus; lynx - Lynx lynx.
Landscape: The main landscape feature is the 25km long limestone ridge, oriented from NE to SW – the longest and tallest limestone ridge in the country. Piatra Craiului National Park shelters several habitats types and species of European interest. For example: bushes with Pinus mugo and Rhododendron myrtifolium, alpine and subalpine calcareous grasslands, calcareous and calchist screes of the mountain to alpine levels, mountain hay meadows, Luzulo-Fagetum beech forests, acidophilous Picea forests of the mountain to alpine levels etc. Beside the impressive natural landscape of Piatra Craiului, the local communities and villages create a very attractive landscape with households scattered on the top of the hills, where the locals have preserved centuries old traditions, in harmony with nature
Rationale for PA selection - socio-economic context: The main reasons for establishing Piatra Craiului as a National Park were: to maintain the biodiversity, landscape and species conservation, to
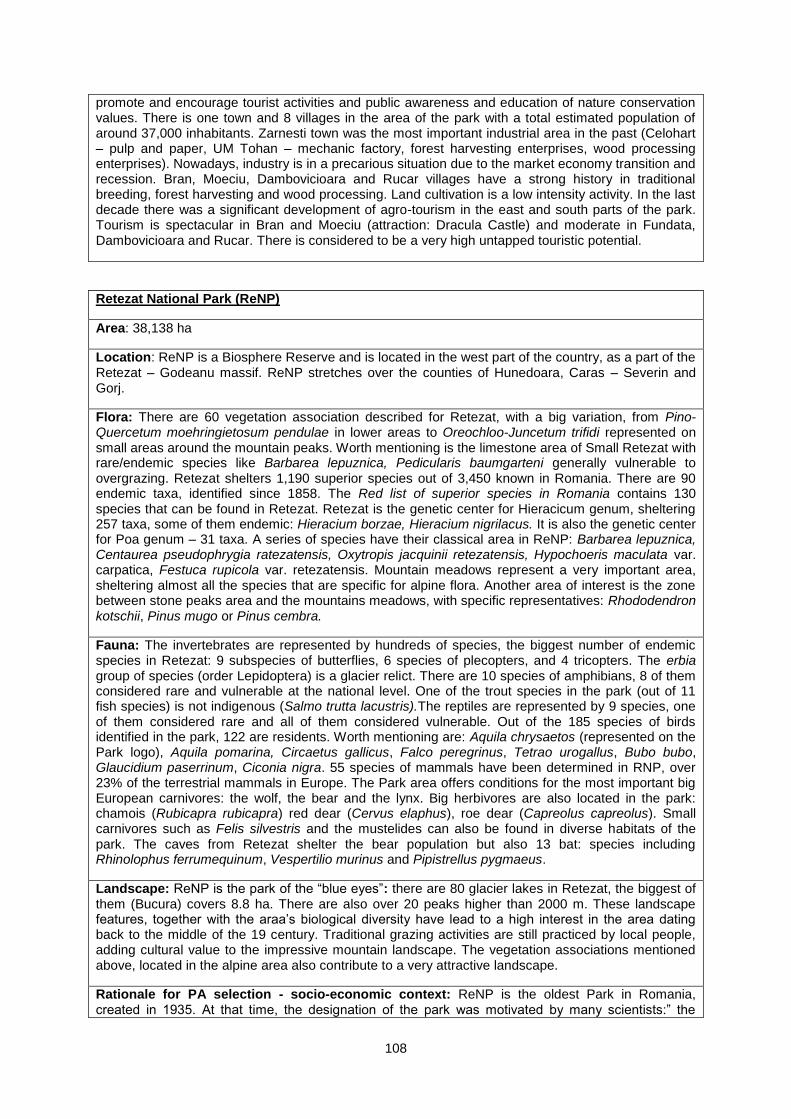
108
promote and encourage tourist activities and public awareness and education of nature conservation values. There is one town and 8 villages in the area of the park with a total estimated population of around 37,000 inhabitants. Zarnesti town was the most important industrial area in the past (Celohart – pulp and paper, UM Tohan – mechanic factory, forest harvesting enterprises, wood processing enterprises). Nowadays, industry is in a precarious situation due to the market economy transition and recession. Bran, Moeciu, Dambovicioara and Rucar villages have a strong history in traditional breeding, forest harvesting and wood processing. Land cultivation is a low intensity activity. In the last decade there was a significant development of agro-tourism in the east and south parts of the park. Tourism is spectacular in Bran and Moeciu (attraction: Dracula Castle) and moderate in Fundata, Dambovicioara and Rucar. There is considered to be a very high untapped touristic potential.
Retezat National Park (ReNP)
Area: 38,138 ha
Location: ReNP is a Biosphere Reserve and is located in the west part of the country, as a part of the Retezat – Godeanu massif. ReNP stretches over the counties of Hunedoara, Caras – Severin and Gorj.
Flora: There are 60 vegetation association described for Retezat, with a big variation, from Pino-Quercetum moehringietosum pendulae in lower areas to Oreochloo-Juncetum trifidi represented on small areas around the mountain peaks. Worth mentioning is the limestone area of Small Retezat with rare/endemic species like Barbarea lepuznica, Pedicularis baumgarteni generally vulnerable to overgrazing. Retezat shelters 1,190 superior species out of 3,450 known in Romania. There are 90 endemic taxa, identified since 1858. The Red list of superior species in Romania contains 130 species that can be found in Retezat. Retezat is the genetic center for Hieracicum genum, sheltering 257 taxa, some of them endemic: Hieracium borzae, Hieracium nigrilacus. It is also the genetic center for Poa genum – 31 taxa. A series of species have their classical area in ReNP: Barbarea lepuznica, Centaurea pseudophrygia ratezatensis, Oxytropis jacquinii retezatensis, Hypochoeris maculata var. carpatica, Festuca rupicola var. retezatensis. Mountain meadows represent a very important area, sheltering almost all the species that are specific for alpine flora. Another area of interest is the zone between stone peaks area and the mountains meadows, with specific representatives: Rhododendron kotschii, Pinus mugo or Pinus cembra.
Fauna: The invertebrates are represented by hundreds of species, the biggest number of endemic species in Retezat: 9 subspecies of butterflies, 6 species of plecopters, and 4 tricopters. The erbia group of species (order Lepidoptera) is a glacier relict. There are 10 species of amphibians, 8 of them considered rare and vulnerable at the national level. One of the trout species in the park (out of 11 fish species) is not indigenous (Salmo trutta lacustris).The reptiles are represented by 9 species, one of them considered rare and all of them considered vulnerable. Out of the 185 species of birds identified in the park, 122 are residents. Worth mentioning are: Aquila chrysaetos (represented on the Park logo), Aquila pomarina, Circaetus gallicus, Falco peregrinus, Tetrao urogallus, Bubo bubo, Glaucidium paserrinum, Ciconia nigra. 55 species of mammals have been determined in RNP, over 23% of the terrestrial mammals in Europe. The Park area offers conditions for the most important big European carnivores: the wolf, the bear and the lynx. Big herbivores are also located in the park: chamois (Rubicapra rubicapra) red dear (Cervus elaphus), roe dear (Capreolus capreolus). Small carnivores such as Felis silvestris and the mustelides can also be found in diverse habitats of the park. The caves from Retezat shelter the bear population but also 13 bat: species including Rhinolophus ferrumequinum, Vespertilio murinus and Pipistrellus pygmaeus.
Landscape: ReNP is the park of the “blue eyes”: there are 80 glacier lakes in Retezat, the biggest of them (Bucura) covers 8.8 ha. There are also over 20 peaks higher than 2000 m. These landscape features, together with the araa‟s biological diversity have lead to a high interest in the area dating back to the middle of the 19 century. Traditional grazing activities are still practiced by local people, adding cultural value to the impressive mountain landscape. The vegetation associations mentioned above, located in the alpine area also contribute to a very attractive landscape.
Rationale for PA selection - socio-economic context: ReNP is the oldest Park in Romania, created in 1935. At that time, the designation of the park was motivated by many scientists:” the

109
superior region of Retezat must be transformed into a grandiose park: an important scientific reserve” (A. Borza, 1935). Based on present legislation, the main scope of RNP is the protection and conservation of representative samples for bio-geographic national space, containing vary valuable natural elements of physic-geographic, floral, fauna, hydrological, geological, paleontological, caves and soil related etc. aspects, offering the possibility of visiting for scientific purposes, education and tourism. The park area si not very populated, only villages from 2 communes (Rau de Mori and Salas), and a town (Uricani) influence the park. The main economic activities in the area are: breading, forest harvesting, wood processing, small scale agriculture, part of the community members basing their existence on those activities. Another part of the community‟s members have jobs outside the area, and outside the community. The unemployment rate is rather high, finding jobs being difficult. The difficult economic conditions affecting the communities are determined basically by: week infrastructure, lack of capital for implementing development projects, aging of the population, lack of information access, lack of strategic approach of authorities regarding industrial development, decline of traditions and reduction of traditional product‟s importance and demand.
Vanatori Neamt Natural Park (VNNP)
Area: 30,818 ha
Location: North-western part of Romania, eastern slope of the Oriental Carpathians (Neamt Mountains) and under mountains hills of Neamt, stretching over the county of Neamt.
Flora: The vegetation is structured by altitude: i) holm oak forests, lower altitude, with Quercus dalechampii mixed with Quercus pedunculiflora, Fagus sylvatica, Tilia cordata – Moldavian holm forests; ii) beech and mixed beech forests with Fagus sylvatica, Picea abies and Abies alba (noticeable two rare species - Romania Fagus taurica and Fagus orientalis); iii) zonal meadow vegetation along riversides with Alnus sp.; iv) secular meadows: Festuco-Agrostetum capilaris, Trifolio – Lolietum perennis, Rorippo – Agrostetum stolonifere. The diversity of the flora of the territory is remarkable: more than 1,831 species and subspecies. There are a number of remarkable endemic species: Centaurea carpatica ssp. rarăurensis (creşte numai în Moldova), Cirsium decussatum, C. furiens, C. grecescui, Dentaria glandulosa, Hepatica transsilvanica, Leucanthemum waldstenii, Phyteuma wagneri, Ranunculus carpaticus, Symphytum cordatum and also a number of 50 floral rarities: Allium schoenoprasum ssp. sibiricum, Anacamptis pyramidalis, Carex disticha, Cephalanthera rubra, Caelogossum viride, Corallorhiza trifida, Crepis mollis, Dactylorhiza cordigera ssp. cordigera, D. incarnata, D. maculata ssp. maculata, D. sambucina, Dianthus campestris ssp. campestris, D. collinus ssp. glabriusculus, Dianthus collinus ssp. moldavicus Epipactis atrorubens, E. helleborine, E. palustris, E. purpurata, Epypogyum aphyllum, Erigeron alpinus, Galium pumilum ssp. pumilum, Gentrianella germanica, Gymnadenia conopsea, G.odoratissima, Herminium monorchis, Hypochoeris glabra, Lathyrus pannonicus ssp. collinus, Leguosia speculum-veneris, Liparis loeselii, Listera cordata, Luzula forsteri, L. luzulina, Mercurialis ovata, Microstylis monophyllos, Monotropa hypopytis ssp. hypopytis, Neotia nidus-avis, Orchis coriophora ssp. coriophora, O. elegans, O. mascula ssp. signifera, O. morio, O. ustulata, Pedicularis sceptrum-carolinum, Petasites paradoxus, Platanthera bifolia, Polemonium coeruleum, Potentilla neumanniana, Ranunculus circinatus, Salix aurita, Scandix pecten-veneris ssp. pecten-veneris, Scorzonera humilis, Streptopus amplexifolius, Traunsteinera globosa, Trollius europaeus, Typha schuttleworthii, Valeriana simplicifolia, Angelica archangelica, Cypripedium calceolus, Taxus baccata etc.
Fauna: The fauna is characteristic of the Carpathians: numerous invertebrates including a significant number of Lepidoptera – 138, fish – 7 rare species (including Salmo trutta), reptiles – 3 species (including Vipera berus), amphiibians – 11 species (including Carpathian endemism Triturus montandoni), birds – 101 species (including Accipiter gentilis, Accipiter nisus, Aquila pomarina, Buteo buteo, Buteo lagopus, Strx aluco, Strix uralensis, Crex crex, Ciconia nigra, Ciconia ciconia, Tetrao urogalus, Alcedo athis), mammals – 35 species, among them Ursus arctos, Canis lupus, Vulpes vulpes, Lynx lynx, Felix sylvestris, Martes martes, Mustela erminea, Mustela nivalis, Mustela putorius, Sciurus vulgaris, Meles meles, Erinaceus europaeus, Cervus elaphus, Capreolus capreolus, Sus scrofa, Lepus europaeus, Glis glis.
VNNP is closely associated with Bison bonasus, once very common in Romania and then absent for a long period, the Bison has been successfully repopulated within the park in a long and ambitious project.
Landscape: VNNP is the park of the natural forests, churches and monasteries and Bison bonasus.

110
Complex forests, the majority of them being very close to their natural condition in a hilly area creates an unforgettable landscape (famous places include Silver Forest – with birch and Copper Forest). The landscape is completed by numerous churches and monasteries ituated on large valleys surrounded by forests and meadows, close to very picturesque villages featuring traditional architecture. Lakes and traditionally managed meadows (with trees and hay deposits) are important elements of the VNNP landscape. The recent repopulation of bisons as well as the development of infrastructure to facilitate sightseeing over the Bison bonasus breeding area is also a spectacular and attractive landscapes.
Rationale for PA selection - socio-economic context: VNNP was estabished in 1999, aimed at the protection of the natural, spiritual and cultural heritage of the area, sustainable forest management, landscape and local traditions conservation, bison repopulation, and the encouragement of ecotourism. The most important objective of the park administration is the conservation of the landscapes where natural and human interaction over time has created a distinct area, with significant landscape, cultural and biological values. There are 5 important settlement (The town Targu Neamt among them) in the park area, with a total population of around 48,000 inhabitants. There are also a large number of monks populating the 14 monasteries in the area. The main economic activities are: small scale agriculture, breeding, commerce, traditional products manufacturing, and increasingly – tourism. Orthodox monarchal tourism is a very important part of this sector that is considered to have great potential. There are a lot of famous cultural and historic sites within the park.

111
Annex 2: Logical scheme for soil erosion calculation
The formula used for calculating the annual quantity of eroded soil is based on indicators established through experiments and measurement. The formula is the following:
A= R x K x LS x C x P R – Pluvial erodibility K- Soil erodibility LS – Topography indicator P – Usage of land (not applicable in this study as applies only to surfaces within villages and towns, therefore set to 1) C – Vegetation covering In the BAU and SEM scenario analysis the variable indicator is C – the vegetation covering. Source: Terente, 2008, Transilvania University, 2011
A – annual quantity of eroded soil: R , K, LS, P – factors depending on surface, slope. Length of slope, soil quality C – vegetation covering

112
Annex 3: Romania’s Carpathian PAs
There are currently 106 PAs in Romania covering a total area of 1,057.487 hectares. The Ministry of
Environment and Sustainable Development are legally responsible for these PAs. There are 21 major
protected areas (12 national parks and 10 nature parks) included in the Romanian CNPA. Table 01
presents an overview of the Carpathian PAs noting their total surface areas and forest cover. The
pilot sites are highlighted.
Table 0-2 provides a qualitative assessment of the Romanian Carpathian Protected Areas, including
the 5 pilot sites, based on the expert opinion of the park managers and the study team. On the basis
of the qualitative assessment across the sites, the pilot studies can be taken to be broadly
representative of the network as a whole in terms of the range of Ecosystem Services they provide
and the relative significance of these services.

113
Table 0-1: Romanian CNPAs)
PARKS
Admin.
institution
Total surface
ha
Forest type
Forest cover Strictly
protected
forest
- ha - % - ha -
NATIONAL PARKS
1 Călimani Romsilva 24,041.0 16,118.5 67.05 8,464.3
2 Cheile Bicazului – Hăşmaş Romsilva 6,575.0 6,345.5 96.51 4,823.7
3 Cheile Nerei – Beuşniţa Romsilva 36,758.0 29,165.0 79.34 7,588.0
4 Cozia Romsilva 17,100.0 16,055.6 93.89 7,839.9
5 Domogled - Valea Cernei Romsilva 61,211.0 45,641.8 74.56 19,755.3
6 Piatra Craiului Romsilva 14,773.0 10,170.8 68.85 3,753.68
7 Retezat Romsilva 38,138.0 19,254.0 50.49 884.9
8 Muntii Rodnei Romsilva 46,399.0 27,670.3 59.64 13,323.6
9 Semenic - Cheile Caraşului Romsilva 36,160.7 30,743.1 85.02 9,405.2
10 Buila – Vânturariţa Romsilva 4,186.0 3,850.7 91.99 1,496.9
11 Ceahlău C Council 8,396.0 7,321.9 87.21 3,243.6
12 Defileul Jiului Romsilva 11,127.0 9,422.0 84.68 9,012.0
Nature parks
13 Apuseni Romsilva 75,784.0 48,795.5 64.39 11,647.0
14 Bucegi Romsilva 32,663.0 21,357.7 65.39 5,805.0
15 Grădiştea Muncelului - Cioclovina Romsilva 38,184.0 26,229.7 68.69 4,357.1
16 Porţile de Fier Romsilva 115,655.0 63,919.5 55.27 9,610.4
17 Vânători Neamţ Romsilva 30,818.0 26,322.6 85.41 11,417.0
18 Munţii Maramureşului Romsilva 148,850.0 72,000.0 48.37 8,850.0
19 Putna – Vrancea Romsilva 38,204.0 30,563.5 80.00 6,423.2
20 Geoparcul Dinozaurilor Tara h. U. Bucharest 102,392.0 45,256.0 44.20 0.0
21 Geoparcul Platoul Mehedinţi C Council 106,000.0 6,000.0 5.66 0.0
22 Defileul Mureşului Superior no admin. 9,156.0 7,500.0 81.91 1,000.0
TOTAL 1,002,570.7 569,703.7 56.82 148,700.8
National Parks 304,864.7 221,759.2 89,591.1
Nature Parks 697,706.0 347,944.5 59,109.7
CNPA Romania 1,002,570.7 569,703.7 148,700.8
Source: PA Management Plans

114
Table 0-2: Qualitative Assessment of Romania Carpathian Protected Areas
ES Type
Service Benefit / outcome
Pla
tou
l
Me
he
din
ti
Cio
clo
vin
a
Defi
leu
l J
iulu
i
Bu
ce
gi
Cea
hla
u
Cali
ma
ni
Defi
leu
Mu
res
ulu
i
Ro
dn
ei
Ch
eil
e N
ere
i
Ch
eil
e
Bic
azu
lui
Se
me
nic
Do
mo
gle
d
Pu
tna
Vra
nc
ea
Bu
ila
Va
ntu
rari
ta
Po
rtil
e d
e
Fie
r
Ta
ra
Hate
gu
lui
AN
PM
MM
P
Pia
tra
Cra
iulu
i N
P
RN
P
Va
na
tori
Nea
mt
NP
Pro
vis
ion
ing
Se
rvic
es
Wood Timber, traditional wood products, commercial processed wood products
* * ** ** ** ** * ** * ** * * ** ** ** ** ** ** ** * **
Water Public water supply, mineral waters for commercial use, water for industrial and agricultural usage
* * * ** ** ** ** ** ? ** _ _ * * * ** ** ** * * *
NTFPs Natural medicines, forest fruits, forest fruits based products
* * _ * ** ** * ** ** * _ * _ _ ? ** ** ** * * **
Source of energy (fuel etc)
Energy provision e.g., hydropower _ _ ** * _ * * * ** _ * * * * * ** ** _ _ ** _
Reg
ula
tin
g S
erv
ice
s
Regulation of GHGs
Carbon sequestration ** ** ** ** ** ** ** ** ** ** ** ** * * ? ** * ** * * *
Micro-climate stabilization
Air quality ** ** ** ** ** ** ** ** ** ** * ** ** * _ ** ** ** ** ** **
Water regulation (storage and retention)
Flood and landslide prevention
* * * ** ** ** ** ** * ** _ * * ** _ * ** ** ** ** **
Soil erosion regulation
Improved water quality , * * ** ** ** ** * * ** ** _ _ * * ? * * ** * * _
Nutrient retention
Improved water quality ? ** ? * * ** * * ** * _ * * * * * * * * * *
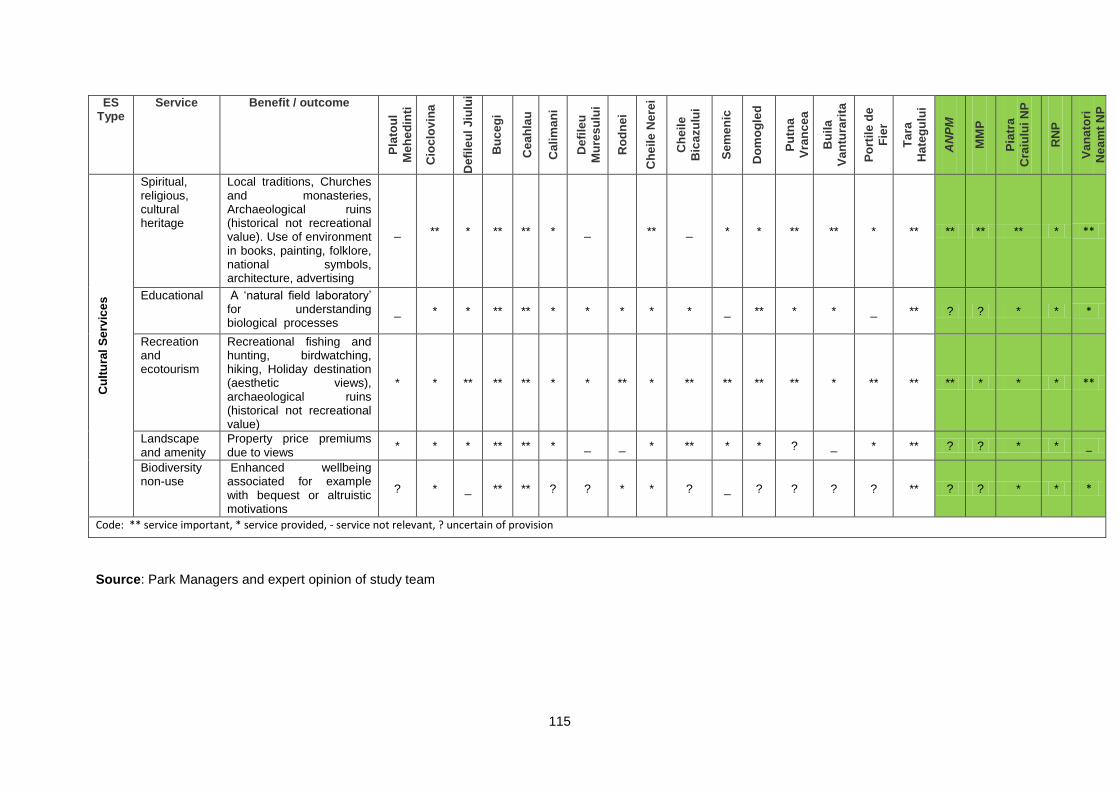
115
ES Type
Service Benefit / outcome
Pla
tou
l
Me
he
din
ti
Cio
clo
vin
a
Defi
leu
l J
iulu
i
Bu
ce
gi
Cea
hla
u
Cali
ma
ni
Defi
leu
Mu
res
ulu
i
Ro
dn
ei
Ch
eil
e N
ere
i
Ch
eil
e
Bic
azu
lui
Se
me
nic
Do
mo
gle
d
Pu
tna
Vra
nc
ea
Bu
ila
Va
ntu
rari
ta
Po
rtil
e d
e
Fie
r
Ta
ra
Hate
gu
lui
AN
PM
MM
P
Pia
tra
Cra
iulu
i N
P
RN
P
Va
na
tori
Nea
mt
NP
Cu
ltu
ral
Se
rvic
es
Spiritual, religious, cultural heritage
Local traditions, Churches and monasteries, Archaeological ruins (historical not recreational value). Use of environment in books, painting, folklore, national symbols, architecture, advertising
_ ** * ** ** * _
** _ * * ** ** * ** ** ** ** * **
Educational A „natural field laboratory‟ for understanding biological processes
_ * * ** ** * * * * * _ ** * * _ ** ? ? * * *
Recreation and ecotourism
Recreational fishing and hunting, birdwatching, hiking, Holiday destination (aesthetic views), archaeological ruins (historical not recreational value)
* * ** ** ** * * ** * ** ** ** ** * ** ** ** * * * **
Landscape and amenity
Property price premiums due to views
* * * ** ** * _ _ * ** * * ? _ * ** ? ? * * _
Biodiversity non-use
Enhanced wellbeing associated for example with bequest or altruistic motivations
? * _ ** ** ? ? * * ? _ ? ? ? ? ** ? ? * * *
Code: ** service important, * service provided, - service not relevant, ? uncertain of provision
Source: Park Managers and expert opinion of study team
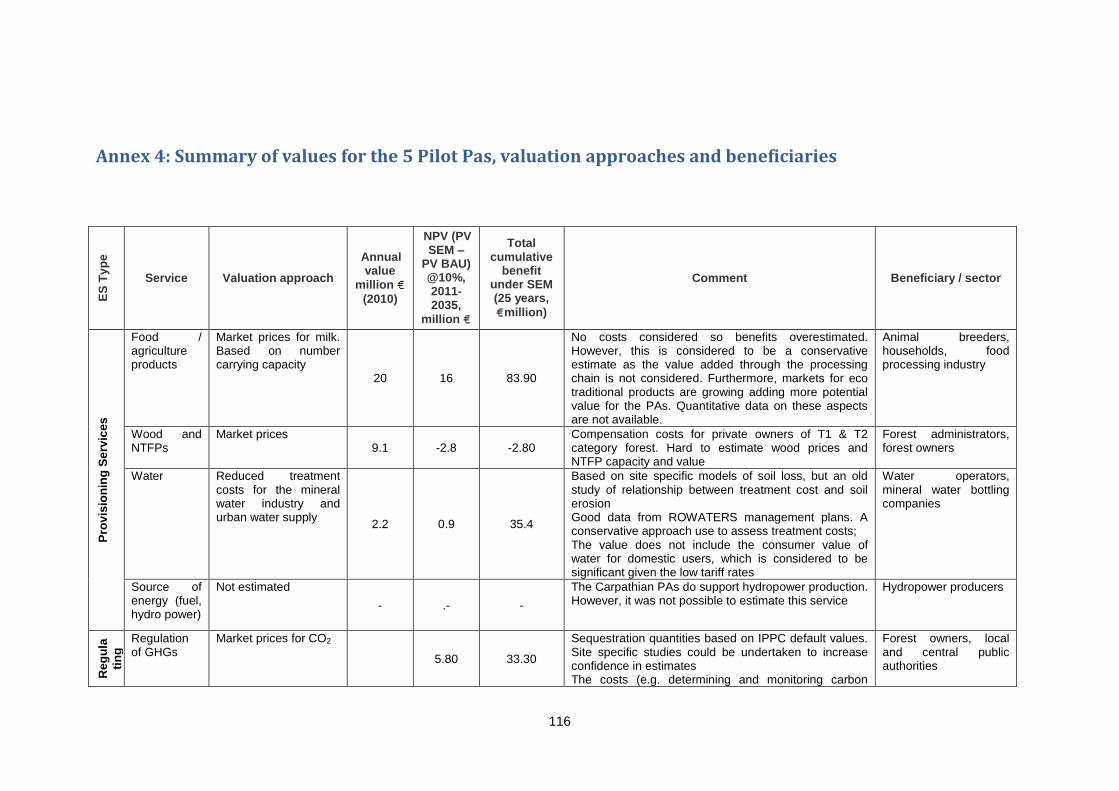
116
Annex 4: Summary of values for the 5 Pilot Pas, valuation approaches and beneficiaries
ES
Ty
pe
Service Valuation approach
Annual value
million
(2010)
NPV (PV SEM –
PV BAU) @10%, 2011-2035,
million
Total cumulative
benefit under SEM (25 years,
million)
Comment Beneficiary / sector
Pro
vis
ion
ing
Se
rvic
es
Food / agriculture products
Market prices for milk. Based on number carrying capacity
20 16 83.90
No costs considered so benefits overestimated. However, this is considered to be a conservative estimate as the value added through the processing chain is not considered. Furthermore, markets for eco traditional products are growing adding more potential value for the PAs. Quantitative data on these aspects are not available.
Animal breeders, households, food processing industry
Wood and NTFPs
Market prices 9.1 -2.8 -2.80
Compensation costs for private owners of T1 & T2 category forest. Hard to estimate wood prices and NTFP capacity and value
Forest administrators, forest owners
Water Reduced treatment costs for the mineral water industry and urban water supply
2.2 0.9 35.4
Based on site specific models of soil loss, but an old study of relationship between treatment cost and soil erosion Good data from ROWATERS management plans. A conservative approach use to assess treatment costs; The value does not include the consumer value of water for domestic users, which is considered to be significant given the low tariff rates
Water operators, mineral water bottling companies
Source of energy (fuel, hydro power)
Not estimated
- .- -
The Carpathian PAs do support hydropower production. However, it was not possible to estimate this service
Hydropower producers
Reg
ula
tin
g
Se
rvic
es
Regulation of GHGs
Market prices for CO2
5.80 33.30
Sequestration quantities based on IPPC default values. Site specific studies could be undertaken to increase confidence in estimates The costs (e.g. determining and monitoring carbon
Forest owners, local and central public authorities
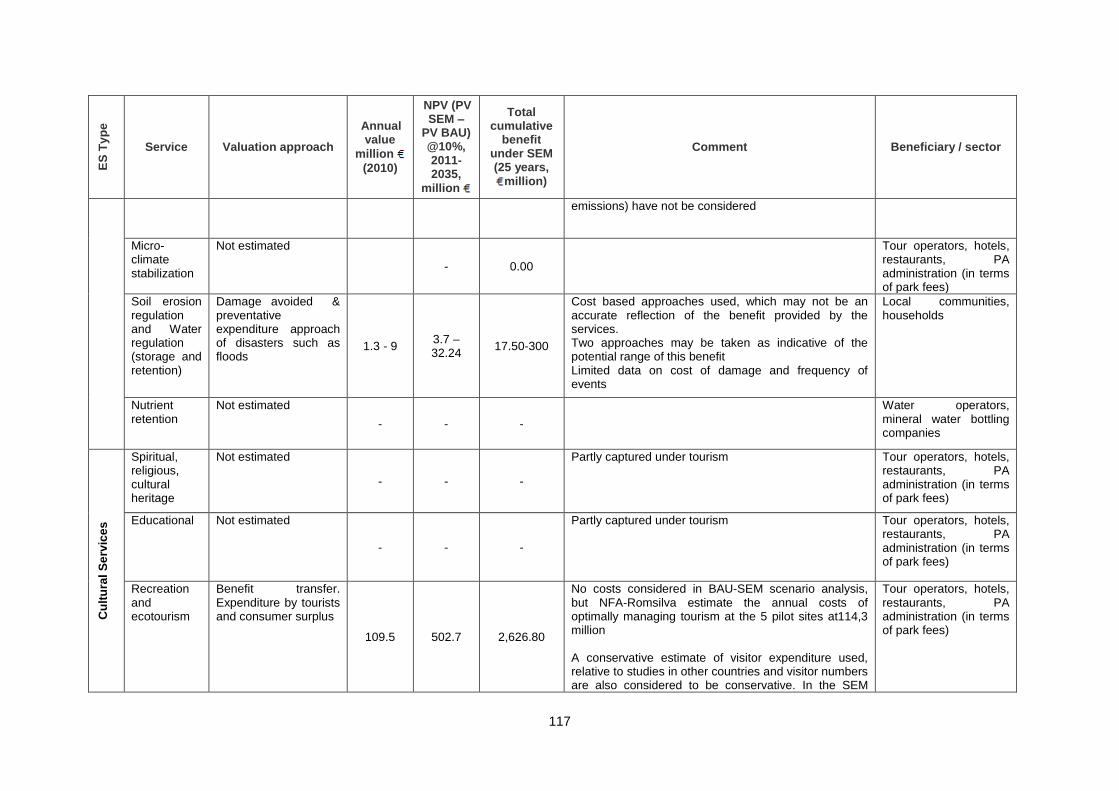
117
ES
Ty
pe
Service Valuation approach
Annual value
million
(2010)
NPV (PV SEM –
PV BAU) @10%, 2011-2035,
million
Total cumulative
benefit under SEM (25 years,
million)
Comment Beneficiary / sector
emissions) have not be considered
Micro-climate stabilization
Not estimated
- 0.00
Tour operators, hotels, restaurants, PA administration (in terms of park fees)
Soil erosion regulation and Water regulation (storage and retention)
Damage avoided & preventative expenditure approach of disasters such as floods
1.3 - 9 3.7 – 32.24
17.50-300
Cost based approaches used, which may not be an accurate reflection of the benefit provided by the services. Two approaches may be taken as indicative of the potential range of this benefit Limited data on cost of damage and frequency of events
Local communities, households
Nutrient retention
Not estimated
- - -
Water operators, mineral water bottling companies
Cu
ltu
ral
Se
rvic
es
Spiritual, religious, cultural heritage
Not estimated
- - -
Partly captured under tourism Tour operators, hotels, restaurants, PA administration (in terms of park fees)
Educational Not estimated
- - -
Partly captured under tourism Tour operators, hotels, restaurants, PA administration (in terms of park fees)
Recreation and ecotourism
Benefit transfer. Expenditure by tourists and consumer surplus
109.5 502.7 2,626.80
No costs considered in BAU-SEM scenario analysis, but NFA-Romsilva estimate the annual costs of optimally managing tourism at the 5 pilot sites at114,3 million A conservative estimate of visitor expenditure used, relative to studies in other countries and visitor numbers are also considered to be conservative. In the SEM
Tour operators, hotels, restaurants, PA administration (in terms of park fees)
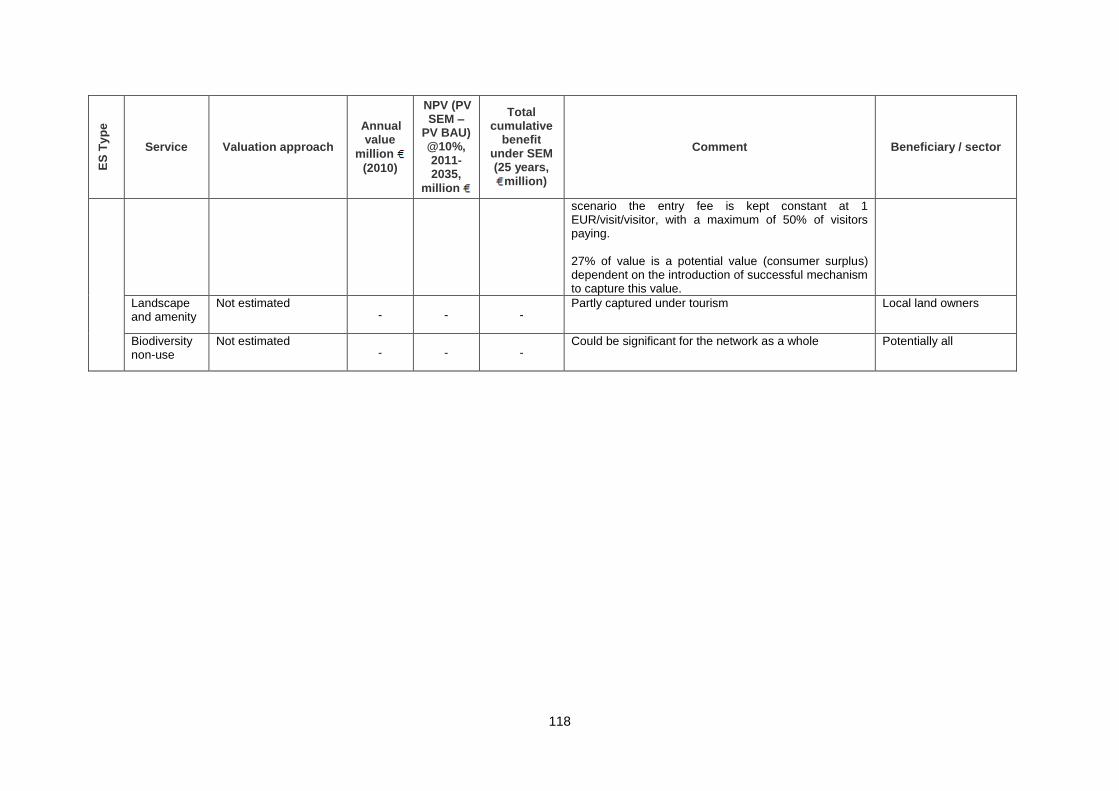
118
ES
Ty
pe
Service Valuation approach
Annual value
million
(2010)
NPV (PV SEM –
PV BAU) @10%, 2011-2035,
million
Total cumulative
benefit under SEM (25 years,
million)
Comment Beneficiary / sector
scenario the entry fee is kept constant at 1 EUR/visit/visitor, with a maximum of 50% of visitors paying. 27% of value is a potential value (consumer surplus) dependent on the introduction of successful mechanism to capture this value.
Landscape and amenity
Not estimated - - -
Partly captured under tourism Local land owners
Biodiversity non-use
Not estimated - - -
Could be significant for the network as a whole Potentially all

119
Annex 5: Glossary of Terms
Appraisal The process of defining objectives, examining
options and weighing up the cost benefits, risks and
uncertainties of proposed policies, programme or
projects before a decision is made
Bequest value Non-use benefit associated with the knowledge that
natural resources will be passed on to future
generations.
Carrying capacity The maximum population that the environment /
ecosystems can sustain indefinitely
Consumer Surplus The difference between the price paid and the
maximum amount an individual is willing to pay to
obtain a good; this reflects the additional benefits
that is gained by consumers in consumption of a
good or service.
Contingent valuation A stated preference approach to valuing non-market
goods and services where individuals are asked
what they are willing to pay (or accept) for a change
in the provision of non-market good and service
Cost Benefit Analysis A decision making tool that compares costs and
benefits of a proposed policy or project in monetary
terms
Cultural services A category of ecosystem services that relates to the
non-material benefits obtained from ecosystems, for
example through recreation.
Damage cost avoided approach Estimates the value of ecosystem services based on the costs of avoiding damages due to lost services. The damage cost avoided method uses either the value of property protected, or the cost of actions taken to avoid damages, as a measure of the benefits provided by an ecosystem. For example, if a wetland protects adjacent property from flooding, the flood protection benefits may be estimated by the damages avoided if the flooding does not occur
Direct use value Economic value associated with use of a resource
in either a consumptive manner or non-consumptive
manner.
Discounting The process of expressing future values in present
value terms. This allows for the comparison of flows
of cost and benefit over time regardless of when
they occur.
Economic value The monetary measure of the wellbeing associated
with the change in the provision of some good. For
market goods this is ordinarily measured by market
price; for non-market goods this ordinarily measured
by willingness to pay (WTP) or willingness to accept
(WTA).
Economic valuation evidence Economic values, value functions and other
empirical
(monetary valuation evidence) evidence available from existing (primary) studies
that provides the source of evidence for value

120
transfer. Previous value transfer analyses may also
provide evidence for current applications.
Ecosystem services approach. A term that is used to describe a framework for
analyzing how human populations are dependent
upon the condition of the natural environment. The
approach explicitly recognizes that ecosystems and
the biological diversity contained within them
contribute to individual and social wellbeing
Existence value Non-use value derived from knowing that a
resource continues to exist, regardless of use made
of it by oneself or others now or in the future.
Hedonic pricing method A revealed preference valuation method that
estimates the use value of a non-market good or
service by examining the relationship between the
non-market good and the demand for some market-
priced complementary good (e.g. property or land
prices).
Indirect use value Economic value associated with the services
supported by a resource as opposed to the actual
use of the resource itself; e.g. key ecosystem
services such as nutrient cycling, habitat provision
and climate regulation.
Marginal change An incremental change (ordinarily a „unit change‟) in
the provision of a market or non-market good or
service.
Market goods Goods and services traded in formal markets.
Market price The value of the provision of goods and services
that may be directly observed from markets.
Monetisation The assignment of a monetary value to a change in
the provision of a non-market good or service.
Net present value (NPV) The difference between the present value of costs
and the present value of benefits.
Non-use value (passive use value) Economic value not associated with any use of a
resource, but derived altruistic, bequest and
existence values.
Meta-analysis An empirical study that collates data from multiple
valuation studies on a particular good, with the
purpose of identifying the key factors that influence
estimated economic values.
Non-market goods and services Goods and services that are not traded in markets
and are consequently „un-priced‟ (e.g.
environmental goods and services).
Present value A future value (cost or benefit) expressed in present
terms by means of discounting.
The preventative expenditure approach A market pricing approach that examines upfront payments to prevent degradation. Also referred to as the „defensive expenditure approach„ „mitigation approach‟ or „avertive behaviour approach‟. There are two different approaches to this type of analysis and only one of them is truly a cost-based valuation technique. If estimates of what people are willing to pay to prevent damage to the environment or

121
themselves are elicited through the use of constructed markets, or by the examination of past events in similar circumstances through the use of revealed preferences exhibited through actual or surrogate markets, first based estimates of value will be derived.
Producer surplus The difference between the minimum amount a
seller is willing to accept for a good and the actual
price received; this reflects the additional benefit in
exchange gained by the producer (e.g. „profit‟).
Regulating services A category of ecosystem services which refers to
the regulation of ecosystem processes such as
climate regulation, air quality regulation, water
regulation (e.g. flood control), water quality
regulation (purification/detoxification) and erosion
control.
Revealed preference methods Economic valuation methods that estimate the use
value of non-market goods and services by
observing behaviuor related to market goods and
services (e.g. travel cost method and hedonic
pricing method).
Stated preference methods Economic valuation methods that use questionnaire
surveys to elicit individuals‟ preferences (i.e.
willingness to pay and/or willingness to accept) for
changes in the provision on non-market goods or
services.
Supporting services A category of ecosystem services which are
necessary for the production of all other ecosystem
services, such as soil formation and retention,
nutrient cycling, water cycling and the provision of
habitat.
Total economic value (TEV) The economic value of a resource comprised of its
use and non-use values.
Travel cost method A revealed preference and survey based valuation
method that uses the cost incurred by individuals
traveling and gaining access to a recreation site as
a proxy for the recreational use value of that site.
Unit value transfer Transfer of a mean average (or median) value
estimate for a study good to estimate the value of
policy good.
Use value The economic value that is derived from using or
having potential to use a resource. It is the net sum
of direct use values, indirect use values and option
values.
Value transfer (benefits transfer) Process by which readily available economic
valuation evidence is applied in a new context for
which valuation is required.
Welfare (wellbeing) A measure of satisfaction or „utility‟ gained from a
good or service.

122
Willingness to accept compensation (WTA) The monetary measure of the value of forgoing a
gain in the provision of a good or service or allowing
a loss
Willingness to pay (WTP) The monetary measure of the value of obtaining a
gain in the provision of good or service or avoiding a
loss
Source: Adapted from eftec (2009) World Travel and Tourism Council Definitions used in Table 4-2 Visitor exports (WTTC, 2011) Spending within the country by international tourist for both
business and leisure trips, including spending on transport Domestic expenditure Spending within a country by that country‟s residents for both
business and leisure trips. Multi-use durables are not included since they are not purchased solely for tourism purposes
Government individual spending Government spending on individual non-market services for
which beneficiaries can be separately identified. These social transfers are directly comparable to consumer spending and, in certain cases, may represent public provision of consumer services. For example it includes provision of services in national parks and museums.
Direct contributions to GDP GDP generated by industries that deal directly with tourist,
including hotels, travel agents, airlines and other passenger transport services, as well as the activities of restaurant and leisure industries that deal directly with tourists.
Indirect contributions The contribution to GDP and jobs of capital investments,
Government collective spending and supply-chain effects Capital investments Includes capital investments spending in all sectors directly
involved in the Travel and Tourism industry. This also constitutes the investment spending by other industries on specific tourism assets such as new visitor accommodation and passenger transport equipment, as well as restaurants and leisure facilities for specific tourism use.
Government collective spending General government spending in support of general tourism
activity. This can include national as well as regional and local government spending. For example it includes tourism promotion, visitor information services, administrative services and other public services.
Supply chain effects Purchases of domestic goods and services directly by
different sectors of the Travel and Tourism Industry as inputs to their final tourism output. .
Induced contributions The broader contributions to GDP and employment of
spending by those who are directly or indirectly employed in tourism.