Embed Size (px)
Citation preview

ISWS/CIR-164/86
Circular 164 STATE OF ILLINOIS
DEPARTMENT OF ENERGY AND NATURAL RESOURCES
An Assessment of Nitrification in an RBC Plant
by SHUN DAR LIN and DANA B. SHACKLEFORD
ILLINOIS STATE WATER SURVEY CHAMPAIGN
1986

CONTENTS
PAGE
Abstract 1
Introduction 1 Objectives and report plan 1 Acknowledgments 2
RBC system 2
Methods 4
Results and discussion 4
RBC influent 4 SNH3-N to TNH3-N and SOrg-N to TOrg-N ratios 6 Loading 7 Stages 1 and 2 8 Nitrification in stages 3 and 4 12 Factors affecting nitrification 14
Effect of BOD5 14 Temperature 14 Dissolved oxygen 16 pH 16 Alkalinity and NOx-N 17
Stage 5 and secondary clarifier 19
Nitrogen budget 20 Removal kinetics 21 Design considerations 27
Summary and conclusions 27
References 29

Funds derived from University of Illinois administered grants and contracts were used to produce this report.
Printed by authority of the State of Illinois (SWS-7-86-200)

AN ASSESSMENT OF NITRIFICATION IN AN RBC PLANT
by Shun Dar Lin and Dana B. Shackleford
ABSTRACT
To evaluate the nitrification efficiency in a rotating biological contactor (RBC) system, samples were collected from the wastewater t reatment plant at Princeton, Illinois, twice a week for over a year. Significant nitrification occurred in stages 3 and 4. Stage 3 achieved an average soluble ammonia nitrogen (SNH3-N) removal efficiency of 40% for an influent concentration ranging from 2 to 18 mg/L with a stage loading ra te of 0.4 lb SNH3-N/d/1000 sq ft. Stage 4 removed an additional 64% from the stage 3 effluent. A linear relationship was found between effluent and influent SNH3-N concentrations at stages 3 and 4. These relationships are proposed for RBC design purposes.
Significant nitrification will occur when the soluble BOD5 (SBOD5) concentration is reduced to about 15 mg/L. With favorable conditions, both SBOD5 and SNH3-N removals took place at stages 1 and 2 for some periods. Practically no nitrification occurred in stage 5 or in the secondary clarifier.
INTRODUCTION
Wastewater effluent ammonia nitrogen (NH3-N) limitations have been promulgated in Illinois and many other s tates . To comply with Illinois effluent standards, a rotating biological contactor (RBC) system was installed in 1979 at Princeton, Illinois. The facility was designed to meet effluent requirements of 10 mg/L 5-day total biochemical oxygen demand (TBOD5), 12 mg/L total suspended solids (TSS), and 1.5 mg/L NH3-N.
Objectives and Report Plan
The purpose of this study was to evaluate the performance of each stage in a train of an RBC system in terms of NH3-N removal. The specific objectives of the study were: 1) to determine the removal efficiency of soluble ammonia nitrogen (SNH3-N)
1

and soluble organic nitrogen (SOrg-N) for each stage; 2) to ascertain the relationship between SNH3-N reduction and alkalinity, ni trate nitrogen (NO3-N), pH, and other factors; 3) to develop a nitrogen budget for each stage; and 4) to characterize NH3-N removal kinetics for design purposes.
This report describes the RBC system at Princeton and the procedures and results of the study. It also includes a proposed RBC design approach.
Acknowledgments
The study was conducted under the general supervision of Stanley A. Changnon, Jr . , Chief Emeritus of the Illinois State Water Survey. The ISCO automatic samplers were borrowed from the USEPA through John McQuire. The personnel of the Princeton Wastewater Treatment Plant were most helpful in sample collections. Dave Hullinger, Brent Gregory, Richard Twait, Mike Crandall, and Donald Schnepper performed chemical analyses; many staff members of the Water Quality Section of the State Water Survey collected samples; and Donald Schnepper and Robert Sinclair assisted in the data analysis. Raman Raman reviewed the manuscript, and Gail Taylor edited the final report . Illustrations were prepared by John Brother, Jr . , and William Motherway, Jr . Linda Johnson typed the original manuscript and revisions.
This study was fully supported by state resources without external funding.
RBC SYSTEM
A layout of the wastewater t reatment facility is shown in figure 1. The RBC installation consists of two 5-stage trains (figure 2) operating in parallel. Each of the first two stages in each train provides 100,000 sq ft (9290 m2) of media (standard density) and is designed for BOD5 removal. Each of the remaining six contactors has 150,000 sq ft (13,935 m2) of media (high density) and is provided for NH3-N removal. Each unit ro ta tes at 1.6 rpm with a mechanical drive and is covered.
During dry weather flow the settled sewage from the primary clarifiers flows by gravity to the RBC units. During high flow periods a portion of the settled sewage is routed to a trickling filter and then back to the RBC units. There are two secondary clarifiers following the RBC units. The secondary clarifier effluent is further t rea ted by rapid sand filters. Effluent from the filters is then chlorinated before being
2

Figure 1. Schematic flow diagram of Princeton wastewater treatment plant
Figure 2. Profile of an RBC train
3

discharged to the receiving stream. The pertinent design features for the RBC system are as follows:
Design flow: 1.63 mgd (6170 m3 /d) Peak flow: 4.58 mgd (17300 m3 /d) Hydraulic loading: 1.25 gpd/sq ft (51 L/m2 /d) Total BOD5 loading: 1.12 lb/d/1000 sq ft (55 g/m2 /d) Ammonia-N loading: 0.10 lb/d/1000 sq ft (0.5 g/m2 /d) Detention time: 2 hours
METHODS
The south train was arbitrarily selected for the study. Wastewater samples were collected with ISCO automatic samplers from the RBC influent, the effluents of each stage of the train, and the effluent of a secondary clarifier. Samples were composited from hourly collections obtained over two 24-hour periods each week. Analyses were performed for to ta l and soluble BOD5, total and soluble ammonia nitrogen, organic nitrogen, ni trate nitrogen (NO3-N), nitr i te nitrogen (NO2-N), and total alkalinity. Temperature, dissolved oxygen, and pH were recorded in the field. Analyses were performed on each composite sample in accordance with Standard Methods (1).
The period of study extended from January 1981 to the middle of January 1982. Except during the periods July 8-22, 1981, and January 1982 the wastewater flow was about equally divided between the two trains. During these two periods, the wastewater flow was intentionally routed only through the south train in order to stress the system.
RESULTS AND DISCUSSION
RBC Influent
A summary of wastewater quality for the RBC influent is shown in table 1. The temporal variations in wastewater temperature, flow ra t e , dissolved oxygen (DO), soluble BOD5 (SBOD5), and SNH3-N for the RBC influent are depicted in figure 3. The temperature was generally low (7.5-12.1°C) from January through March 1981 with an average of 10.3°C. It increased steadily to a high of 21°C in July 1981 and then varied
4

Table 1. Water Qual i ty of RBC Inf luen t at Pr inceton
Winter Spring Sumner F a l l 1981 Shock Periods
1 /6-2 /18 11 /9 -12 /28 2 /23-5 /20 5 /25-9 /8 9 /14-11/4 7 / 8 - 7 / 2 2 / 8 1 1 /5 -13 /82
Temperature, °C 7 . 5 - 1 6 . 2 9 . 2 - 1 5 . 0 1 5 . 5 - 2 0 . 8 1 7 . 0 - 2 0 . 9 1 9 . 9 - 2 1 . 1 1 0 . 5 - 1 1 . 9 DO, mg/L 0 . 8 - 4 . 5 2 . 7 0 - 7 . 8 8 0 .72 -5 .25 0 .05 -3 .91 0 . 2 3 - 2 . 6 4 4 . 0 1 - 4 . 8 4 PH 7 .38 -7 .95 7 . 6 5 - 7 . 9 2 7 .52 -7 .81 7 .00 -7 .86 7 . 5 2 - 7 . 7 2 7 . 8 6 - 8 . 0 1 A l k a l i n i t y , 223-323 245-291 234-299 253-310 265-289 286-297
mg/L as CaCO3
TNH3-N, mg/L 8 .33 -20 .84 2 .26 -16 .01 5 .23 -11 .99 4 .41 -16 .05 10 .00 -15 .08 1 4 . 6 0 - 1 6 . 6 6 SNH3-N, mg/L 8 .07 -19 .96 1 .65-15 .86 4 .06 -11 .17 4 .41 -15 .17 9 . 5 8 - 1 4 . 9 3 1 4 . 6 0 - 1 5 . 0 9 N03-N, mg/L 0 . 0 7 - 3 . 7 4 0 . 1 6 - 4 . 8 4 0 .10 -4 .65 0 .01 -2 .15 0 . 1 3 - 2 . 1 6 0 . 9 0 - 1 . 4 6 N02-N, mg/L 0 . 0 4 - 0 . 4 4 0 . 1 2 - 0 . 4 8 0 .05 -0 .62 0 .01 -0 .27 0 . 0 1 - 0 . 4 1 0 . 2 1 - 0 . 6 2 TKN, mg/L 12 .82 -32 .24 5 .82 -22 .05 6 .82 -19 .52 12 .29 -25 .05 1 2 . 5 8 - 2 4 . 4 0 2 2 . 6 1 - 2 9 . 3 8 SKN, mg/L 9 . 1 1 - 2 2 . 9 6 3 .88 -17 .46 5 .23 -14 .11 8 .23 -18 .56 10 .64 -17 .64 17-59-20 .05 S o l i d s , mg/L
Disso lved 400-540 444-528 424-544 440-540 472-504 504-616 Suspended 52-160 32-214 30-228 50-132 52-184 76-128 V o l a t i l e Susp. 48-116 24-150 26-144 46-108 46-120 64-120 S e t t l e a b l e 0-2 .4 0 . 2 - 5 . 0 0 . 1 - 7 . 5 0 . 0 2 - 1 . 6 0 0 . 4 - 1 . 2 0 0 . 0 5 - 0 . 2 8
TB0D5, mg/L 4 7 . 6 - 1 2 6 . 7 2 5 . 5 - 1 0 7 . 8 2 4 . 9 - 7 4 . 6 2 8 . 8 - 9 6 . 5 3 2 , 2 - 9 3 . 3 9 1 . 6 - 1 0 8 . 6 SBOD5 , mg/L 1 2 . 7 - 5 6 . 8 6 . 1 - 3 2 . 7 3 . 8 - 2 8 . 6 1 2 . 8 - 4 4 . 0 8 . 6 - 3 7 . 4 3 5 . 9 - 5 5 . 8 Flow, mgd 0 .45 -0 .87 0 . 5 4 - 2 . 0 4 0 . 7 1 - 1 . 5 1 0 . 5 6 - 1 . 0 1 1 .0 -1 .12 1 .15-1 .24
Figure 3. Temporal variations in observed wastewater flow, temperature, dissolved oxygen, soluble BOD5, and soluble NH3-N for RBC influent
5

only ±2°C up through September 1981. After September 1981, temperatures steadily decreased. For this investigation 12°C and 19°C temperatures were found applicable for defining seasonal changes.
Flow ra tes generally ranged from 0.5 to 0.8 mgd (1900-3000 m3/d) except for some peak flows (figure 3). High flows were due to precipitation and infiltration.
Dissolved oxygen concentrations in the RBC influent were frequently below 1.0 mg/L during the July shock period and during September and October 1981 (figure 3). The DO values were high during the spring and cold weather periods as well as during high flow periods. Both SBOD5 (figure 3) and TBOD5 concentrations were generally low during the spring, and high for the summer and fall seasons.
Ammonia and Kjeldahl nitrogen in both total and soluble forms were quite variable, with lower concentrations occurring in April and May 1981. This was probably a result of the spring snowmelt and infiltration. Ammonia nitrogen concentrations were high during winter and fall (figure 3).
The RBC influent contained high total alkalinity ranging from 220 to 300 mg/L as C a C 0 3 . The pH values ranged from 7.4 to 8.0. Soluble phosphate varied from 0.9 to 4.5 mg/L as P. While sulfate concentrations were for the most part in the range of 40 to 80 mg/L, the concentrations of TSS (30-230 mg/L) and volatile suspended solids (VSS 24-150 mg/L) displayed no seasonal patterns. However, settleable solids varied widely from sample to sample (0.02-7.50 mg/L).
SNH3-N to T N H 3 - N and SOrg-N to TOrg-N Ratios
The ratios of SNH3-N to TNH3-N and SOrg-N to TOrg-N were determined for each sample. For SNH3-N/TNH3-N the range was generally from 0.81 to 1.00. Many of the samples had rat ios of 1.00. Low SNH3-N/TNH3-N ratios of about 0.7 were observed for the period April 15-22, 1981, and were the result of high flow. Under normal operations, the average SNH3-N/TNH3-N ratios were 0.95, 0.94, 0.93, 0.91, 0.85, and 0.69 for the RBC influent and the five stage effluents, respectively. The annual average ratios of SOrg-N/TOrg-N for the corresponding samples were 0.32, 0.28, 0.23, 0.20, 0.22, and 0.09. For practical purposes TNH3-N and SNH3-N can be considered to be the same in the RBC influent and the first four stages. SNH3-N and SOrg-N have been used for the purposes of evaluation in this study because they are the more readily available forms of nitrogen for use in microbial synthesis and nitrification.
6

Loading
Table 2 summarizes the conventional design loading and observed loading rates for normal operations and the two shock periods in the south train of the RBC system. The average values for normal operations were slightly lower than design ra tes except for the TBOD5 loading r a t e , which was about one-half of design.
The temporal variations in hydraulic and mass loading rates are shown in figure 4. Hydraulic loading was high in the spring (April-June 1981) and low (72% of design) during winter (January-March 1981). The average hydraulic loading for the summer and fall 1981 seasons were, respectively, close to and 18% lower than design values. During the shock periods the average hydraulic loadings exceeded design values by 30% and 40% for July 1981 and January 1982, respectively.
In general, SNH3-N loading ra tes were low during spring and high during the fall (figure 4). The average loading ra tes for certain periods are listed in figure 5 in parentheses. Average SNH3-N loadings during the July 1981 and January 1982 shock periods were respectively 60% and 130% higher than design values.
Figure 4 also shows that SBOD5 loading ra tes during the first half of 1981 ranged from 0.1 to 0.2 lb/d/1000 sq ft (0.49 to 0.98 g/m2 /d). The SBOD5 loadings during the last half of 1981 were about double those of the first half of the year. During the shock periods, the SBOD5 loadings were 1.6 to 3.3 times higher than those of normal operations (table 2).
Table 2. Loading Rates in South Train of RBC System
Annual Shock periods (normal operations) 7/8-22/1981 1/5-13/1982
Parameter Design Average Range Average Range Average Range Flow, mgd 0.82 0.76 0.45-2.04 1.06 1.00-1.12 1.19 1.15-1.23 Detention time, hours 2.0 2.16 0.80-3.64 1.56 1.45-1.64 1.38 1.33-1.43
Hydraulic loading 1.25 1.17 0.69-3.14 1.62 1.53-1.72 1.83 1.78-1.90 (gpd/sq ft)
SNH3-N loading 0.10 0.092 0.043-0.14 0.16 0.13-0.21 0.23 0 .22-0.23 (lB/d/1000 sq f t)
SBOD5 loading - 0.21 0.07-0.41 0.34 0.11-0.54 0.70 0 .54-0.83 (lb/d/1000 sq ft)
TBOD5 loading 1.12 0.62 0.31-1.02 0.98 0.42-1.29 1.51 1.43-1.63 (lb/d/1000 sq ft)
Note: 1 gpd/sq ft = 40.74 l/m2-d; 1 lb/d/1000 sq ft = 4.88 g/m2-d
7
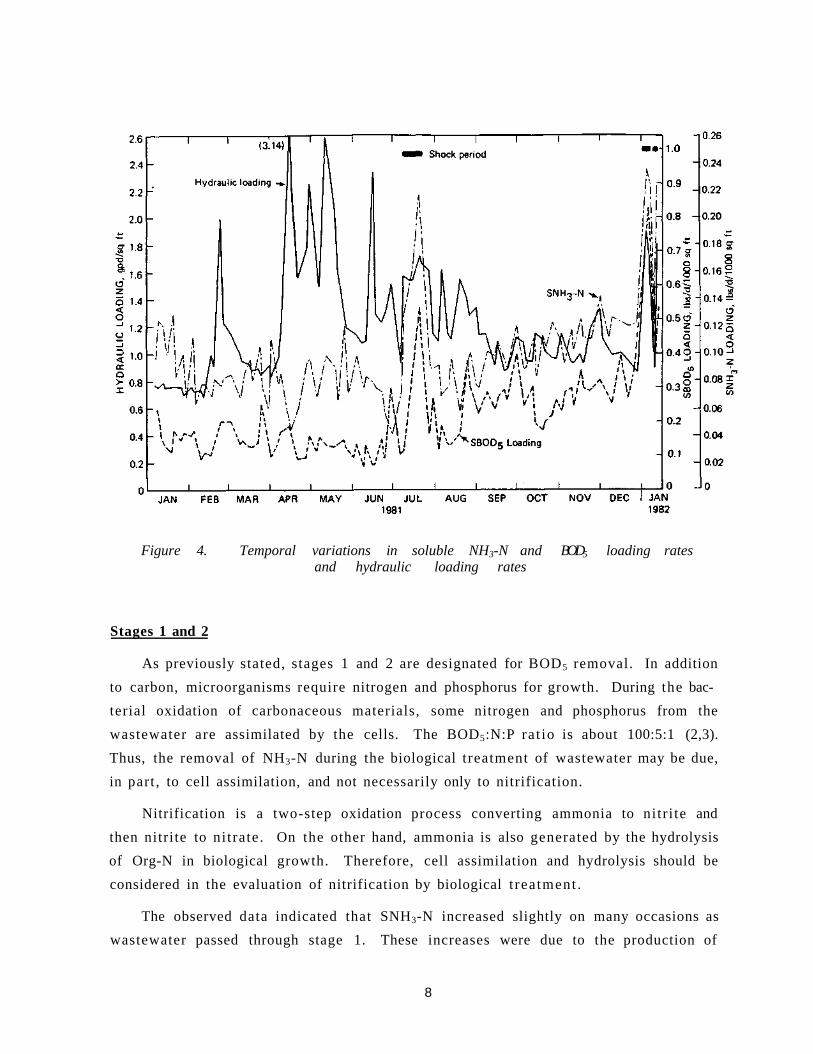
Figure 4. Temporal variations in soluble NH3-N and BOD5 loading rates and hydraulic loading rates
Stages 1 and 2
As previously stated, stages 1 and 2 are designated for BOD5 removal. In addition to carbon, microorganisms require nitrogen and phosphorus for growth. During the bacterial oxidation of carbonaceous materials, some nitrogen and phosphorus from the wastewater are assimilated by the cells. The BOD5:N:P ra t io is about 100:5:1 (2,3). Thus, the removal of NH3-N during the biological treatment of wastewater may be due, in part , to cell assimilation, and not necessarily only to nitrification.
Nitrification is a two-step oxidation process converting ammonia to nitr i te and then nitrite to ni trate. On the other hand, ammonia is also generated by the hydrolysis of Org-N in biological growth. Therefore, cell assimilation and hydrolysis should be considered in the evaluation of nitrification by biological t rea tment .
The observed data indicated that SNH3-N increased slightly on many occasions as wastewater passed through stage 1. These increases were due to the production of
8

Figure 5. Profiles of average SNH3-N, soluble organic-N, NOx-N, and alkalinity concentrations through the RBC system
(Average loading rates shown in parentheses)
9

Figure 5. Concluded
10

NH3-N from the hydrolysis of Org-N. Similar observations have been reported by others (4-7). According to Mueller et al. (8), SOrg-N is hydrolyzed by both heterotrophic and autotrophic species.
Nevertheless, there was some SNH3-N reduction in stage 1 during January 1981 and May through early November 1981, excluding the July shock period. The cumulative removal curves for stage 2, shown in figure 5, are also representative of stage 1 with the exception of November and December 1981. Nitrification occurred at stage 2 during October 5 - December 18, 1981 (figures 5j and 5k). On many occasions, however, the SNH3-N concentration in stage 2 had also increased from that of stage 1. This indicated that hydrolysis of Org-N must also have occurred at stage 2 during certain periods.
For the period May 25 - July 6, 1981, an average of 4.7 mg/L SBOD5 (1.1 mg/L -6.4 mg/L) was removed from the wastewater during stage 1 (9). Five percent of 4.7 mg/L SBOD5, or 0.24 mg/L N, would have been assimilated by heterotrophic organisms. An average of 2.31 mg/L SNH3-N was removed at stage 1 (figure 5f) as a result of nitrification, assimilation, and hydrolysis. SOrg-N was reduced by 0.61 mg/L (figure 5f). Thus nitrification removed 2.68 mg/L SNH3-N (2.31 - 0.24 + 0.61) during stage 1.
It was evident that carbonaceous oxidation and nitrification were occurring simultaneously in the first stage during this period. Miller et al. (7) observed a similar phenomenon. It may be concluded that under certain environmental conditions nitrifiers and heterotrophic bacteria can co-exist in an RBC unit. The relative concentrations of the two groups at any specific point in an RBC system are a function of the nutrient concentrations and other environmental factors.
According to the USEPA (10), if the TBOD5/TKN ratio is greater than 5.0 the t reatment system is classified as a combined carbon oxidation-nitrification process. If the TBOD5/TKN ratio is less than 3.0, the system is classified as a separate stage nitrification process. There is no practical example for a range of TBOD5/TKN between 3.0 and 5.0. Treatment facilities with the TBOD5/TKN rat io between 3.0 and 5.0 could be considered to have an intermediate degree of separation between carbon oxidation and nitrification (10). This is the case for Princeton's RBC system. At Princeton the rat io of TBOD5 to total Kjeldahl nitrogen (TKN) at the RBC influent ranged, for the most part , from 3.0 to 5.0 with an annual average of 3.7. The majority of ratios of SBOD5 to soluble Kjeldahl nitrogen (SKN) fell between 1.0 and 2.0 with an average of 1.8.
11

Nitrification in Stages 3 and 4
Biological nitrification, which converts ammonia to ni t ra te , is carried out by two predominant genera of autotrophic nitrifying bacteria that derive their energy from the oxidation of inorganic nitrogen under aerobic conditions. Nitrosomonas converts ammonia to ni t r i te , and Nitrobacter then transforms nitrite to ni t rate . The development and predominance of nitrifying organisms in an RBC system is a natural phenomenon, requiring no special management except provision for appropriate hydraulic and mass loading rates .
Heterotrophic nitrification also can occur when nitri te and/or ni t rate are produced from organic or inorganic compounds by heterotrophic organisms (more than 100 species including fungi). However, the amount of oxidized nitrogen formed by heterotrophic organisms is relatively small (11).
The growth ra t e of nitrifying bacteria is much less than that of heterotrophic bacteria. Nitrifying bacteria have a longer generation t ime of at least 10 to 30 hours (11,12). They are also much more sensitive to such environmental conditions as temperature, pH, DO, and substrate concentrations (13,14). The growth ra te of nitrite-oxidizers is much greater than that of ammonia-oxidizers (10,11).
Figure 5 shows that SNH3-N concentrations are significantly reduced as wastewater passes through stages 3 and 4. Under normal operations, Org-N concentrations are generally less than 2 mg/L, with only minimal concentration changes across stages 3 and 4. The assimilation of SNH3-N for carbon oxidation is insignificant in these two stages. Therefore, for purposes of this study, a reduction in SNH3-N is considered to be due only to nitrification.
A wide range, from a high of 19 mg/L SNH3-N during the winter to a low of 2 mg/L for the spring, was observed in stage 3 influent. High SNH3-N concentrations in the RBC influent during the July shock period were associated with the normal industrial wastewater dilutions due to industrial shutdown for vacations. The annual mean stage loading ra t e was 0.40 lb SNH3-N/d/1000 sq ft (1.95 g/m2 /d) .
An examination of figures 5 and 6 reveals that significant nitrification occurred in both stages 3 and 4. Table 3 summarizes the performance efficiencies at stages 3 and 4 based on their influent and effluent SNH3-N concentrations under normal operations. Poor performance in both stages was observed during the period April 15 - May 20, 1981, due to the combination of low influent SNH3-N concentrations, high flows, and
12

Figure 6. Soluble ammonia nitrogen removal through the RBC system
Table 3. Soluble NH3-N Removal in Stages 3 and 4
Stage 3, % Stage 4, % Mean temp., Period Mean Range Mean Range °c
19 81 average (normal operations) 40 11-87 64 22-95 15.1
1/6-2/18/81 36 11-65 59 22-92 10.3 2/23-3/11/81 36 34-37 59 41-89 9.9 3/16-4/8/81 47 34-69 76 51-92 11.5 4/15-5/20/81 29 15-42 54 31-93 13.9 5/25-7/6/81 52 21-87 69 40-95 17.6 7/8-7/22/81* 13 3-26 43 24-57 20.2 7/27-8/12/81 42 32-62 63 33-87 20.1 8/19-9/30/81 44 25-62 73 52-97 20.0 10/5-11/4/81 40 24-50 69 34-80 17.7 11/9-12/28/81 31 25-42 57 36-75 14.4 1/5-1/13/82* 5 (-24) 2-8 17 11-29 11.1 * Induced shock periods
13
short hydraulic detention times. The annual mean removal efficiencies were 40 and 64% of the incoming SNH3-N concentrations at stages 3 and 4, respectively. Similar situations have been observed by others (7,14,15). In contrast , for most pilot studies, the majority of ammonia (72-97%) in wastewater is removed during the first s tage of the RBC system (16-19). At Migazaki City, Japan, nitrification was reported to be nearly complete after only two of four RBC stages of t rea tment , with 70% removal at stage 1 (20).
Factors Affecting Nitrification
Effect of BOD5
The li terature indicates that nitrification is sensitive to organic loading and depends on the carbon removal RBC units. This is because nitrifiers have a much slower growth ra te than heterotrophs. There are differences in the reported values for the critical concentrations of organic mat te r . They are as follows: TBOD5 approaching 30 mg/L (4,20-22); TBOD5 reaching 20 mg/L (6); SBOD5 less than 20 mg/L (23); SBOD5
reduced to 15 mg/L (22,24); SBOD5 around 10 mg/L (4); COD less than 50 mg/L (14 mg/L TBOD5) (5); and an organic loading below 20 g COD/m2 /d (25). These differences are due to the different wastewaters used with various bench- and pilot-scale setups.
At Princeton, significant nitrification generally commenced at stage 3. The SBOD5
concentrations in the stage 3 influent ranged from 4.4 to 18 mg/L with an annual mean of 9.2 mg/L under normal operations. As previously mentioned, from late May 1981 through June 1981 nitrification also occurred during stage 1 when the SBOD5
concentrations in the RBC influent were generally below 15 mg/L. It can be concluded from the Princeton data that nitrification can occur when the SBOD5 concentration is reduced to 15 mg/L.
Temperature
The ra te of biological nitrification is strongly influenced by temperature. Nitrification is much more sensitive to temperature than the carbonaceous BOD removal process. However, nitrification in the RBC process is generally not as sensitive to temperature as that in the act ivated sludge process.
Table 3 suggests the effect of wastewater temperature on RBC performance. Under normal operations, the lower the temperature, the lower the removal efficiency.
14

A pilot-plant study by Lue-Hing et al. (20) with very high strength NH3-N wastewater indicated that the maximum NH3-N removal ra te in the first stage ranged from 95 lb/d/ 1000 cu ft (1.5 kg/m3/d) at 9°C to 170 lb/d/1000 cu ft (2.7 kg/m3 /d) at 20°C. There was almost a two-fold increase at the higher temperature. This is in agreement with the suggestion in the l i terature that a nitrification rate decrease of about 50% occurs for each 10°C drop in wastewater temperature below 30°C (10). According to Murphy et al. (26), between 10°C and 20°C the Q10 (the rat io of reaction ra tes at two temperature values with a 10°C difference) is 2.33. The temperature sensitivity of an RBC system is similar to that of an activated sludge process with a 10-day solids retention time (SRT) (26).
The optimum temperature range for nitrification is 30-36°C (13,14,27). Bushwell et al. (27) reported that there is little growth of Nitrosomonas below 5°C. It has been shown through laboratory tests that at 5°C there is no NH3-N removal by RBC units (28). Nitrobacter has not been found to grow at temperatures below 4°C or above 45°C (14). Nevertheless, there are no municipal wastewater t reatment plants that can afford to adjust temperature to the optimum. At Princeton, the plant was operated in the range of 7.5°C to 21°C, which is below optimum temperatures for nitrification.
It is apparent from figures 5 and 6 and tables 3 and 4 that nitrification deteriorated during the January 1982 shock period from a combination of low temperature (11°C) and high hydraulic (1.83 gpd/sq ft; 75 L/m2/d) and high SNH3-N (0.23 lb/d/1000 sq ft; 1.12 g/m2/d) loading rates . During this period, there was no nitrification occurring at stage 3 and little nitrification at stage 4. During the July 1981 shock period there was little SNH3-N removal occurring at stage 3 and somewhat more occurring at stage 4 (table 3 and figures 5 and 6). These were affected only by high hydraulic and mass loadings. Due to the shorter retention time, carbonaceous-removal bacteria took over as the major constituent of the biomass in stages 3 and 4, and nitrifying bacteria lost out due to the competition.
A report of an RBC pilot-plant study at Columbus, Indiana [Hao and Hendricks (29)] reported that during a cold period (January 26 - March 11, 1975) 59% of NH3-N removal was achieved at 2.5 gpd/sq ft (102 L/m2 /d), and 80 to 93% NH3-N removal was achieved at 1.5 gpd/sq ft (61 L/m2/d) during other periods. Similarly, Richard et al. (30) claimed that NH3-N removal by filtration through a submerged biological filter, using a pozzolana filter medium, was directly proportional to temperature and retention time.
15

Table 4 . Cumula t ive P e r c e n t Removal of S o l u b l e NH3-N a c r o s s RBC System
Secondary P e r i o d 1 2 3 4 _5 c l a r i f i e r
1981 a v e r a q e (normal o p e r a t i o n s ) 9 17 44 77 78 83
1 / 6 - 2 / 1 8 / 8 1 6 8 36 70 77 86 2 / 2 3 - 3 / 1 1 / 8 1 1 7 18 71 67 74 3 / 1 6 - 4 / 8 / 8 1 5 17 55 89 86 89 4 / 1 5 - 5 / 2 0 / 8 1 -2 12 41 59 68 79 5 / 2 5 - 7 / 6 / 8 1 22 16 52 86 85 85 7 / 8 - 7 / 2 2 / 8 1 * -3 0 .3 25 51 40 40 7 / 2 7 - 8 / 1 2 / 8 1 14 20 48 78 76 65 8 / 1 9 - 9 / 3 0 / 8 1 18 18 52 84 73 84 1 0 / 5 - 1 1 / 4 / 8 1 9 24 52 84 82 87 1 1 / 9 - 1 2 / 2 8 / 8 1 6 21 42 74 80 81 1 / 5 - 1 / 1 3 / 8 2 * -9 3 4 18 34 40 Winte r (Jan - Mar) 4 11 38 74 77 84 S p r i n g (Aor - June) 10 18 50 77 78 82 Summer ( J u l - Sep) 13 14 40 75 68 70 F a l l (Oct - Dec) 7 23 46 79 81 84
* Induced shock p e r i o d s
Dissolved Oxygen
Theoretically, the oxygen demand for the biological oxidation of 1 mg/L of NH 3 -N
to NO 3 -N is 4.57 mg/L. This does not include any synthesis that may be brought about
by the nitrifiers. At Princeton, the DO profiles across the RBC system followed a
general pattern of rapid initial decline at s tages 1, 2, and/or 3 with rapid recovery at
each s tage thereafter, especial ly stage 5. This pattern of a DO profile is similar to that
reported by others (8,9,16,22).
The DO concentrations at stage 3 ranged from 0.6 to 5.3 mg/L with an annual mean
of 2.3 mg/L. For stage 4, the DO concentrations varied from 1.4 to 4.8 mg/L with an
annual mean of 2.6 mg/L . These values of DO concentrations at s tages 3 and 4 show
that DO was not a limiting factor for nitrif ication. On the average, DO concentration
increased by 2.0 mg/L at s tage 5.
pH
In the biological nitrification process, as ammonia is oxidized, DO and carbonate
(CO 3=) are used while nitrate and carbonic acid (H2CO3) are produced. This causes a
destruction of alkalinity coupled with a depression in pH.
16

The pH has an important effect on the nitrification process. Normally the optimal pH for ni t r i te- and nitrate-forming bacteria is slightly alkaline, although no exact optimum pH value has been defined. Reported data show a wide range for optimum pH of 7.0 to 9.0 with maximum activity at an approximate pH of 8.5 (4,7,10-14,16-20,31-34). Below pH 7.0 the adverse effects on ammonia oxidation become pronounced (32,33). Nitrifiers, either in suspended growth or in attached thin film, are severely inhibited when there is a drop of pH below 6.8 (10). Nitrification ceases completely below a pH of 5.5 in submerged filters (13).
At Princeton the pH of the RBC influent ranged from 7.0 to 8.0. At the influent to stage 3, the pH ranged from 7.4 to 7.9. A slight decrease (7.1 to 7.8) in the stage 3 effluent was observed. These values are within the optimum range for ammonia oxidation.
The pH drop from stage to stage may be caused by the destruction of alkalinity by nitrification. Nevertheless, there was virtually no pH change in the wastewater through stage 4, where the maximum amount of nitrification occurred. The median values for pH at the seven sampling stations were all within a small range: 7.6 - 7.7. Typically, high buffering capacity (alkalinity: 220-320 mg/L as CaCO3) of the RBC influent did not allow a significant pH depression due to alkalinity consumption during nitrification.
Alkalinity and NOx-N
By stoichiometric calculations, 7.14 mg/L of alkalinity as CaCO 3 will be destroyed for every 1 mg/L of NH3-N oxidized. However, Sherrard (35) claimed that this value was in error and should be less for biological nitrification because ammonia is incorporated into the biomass, resulting in a lesser quantity of NH3-N available for oxidation to ni t rate . The alkalinity destruction in a nitrifying activated sludge process is a function of the SRT and influent wastewater BOD5:N:P ra t io . Alleman and Irving (36) observed an extremely low value (2.73 mg/L of alkalinity as CaCO3 per 1 mg/L NH3-N oxidized) for nitrification in a sequencing (fill-and-draw configuration design) batch reactor . In the RBC system at Cadillac, Michigan, alkalinity declined 8.1 mg/L for each mg/L of NH3-N oxidized (37,38).
The occurrence of nitrification in an RBC system can be determined from changes in alkalinity, pH, NOx-N (NO2-N plus NO3-N), and biomass appearances. The significant reductions in alkalinity and the increases in NOx-N concentrations shown in figure 5 support the fact that nitrification occurred in stages 3 and 4 during the July
17

1981 shock period (figure 5g) and in stages 4 and 5 during the January 1982 shock period
(figure
The ratios of alkalinity reduction/SNH3-N removal and NOx-N fo rmat ion /SN 3 -N removal for each sample were calculated for stages 3 and 4. The average values for the selected periods are listed in table 5. A wide range of values was observed for both ratios at each of the two stages. Under normal operations, the ratios of alkalinity reduction to NH3-N removal at stages 3 and 4 were 6.8 and 9.1, respectively. For stage 4, mean ratios were above the theoretical value of 7.1 except during the winter shock period.
Stoichiometrically, 1 mg/L of NOx-N will be generated for each 1 mg/L of NH3-N that is oxidized. The mean ratio of NOx-N formation/SNH3-N removal for stage 3 was 0.94, a reasonable value based on expectations, while for stage 4 it was 1.49 (table 5). The values in table 5 suggest that the actual amount of SNH3-N oxidized at stage 4 was greater at all times than observed values, and the amount oxidized at stage 3 during the spring was greater than observed values. In contrast, in a pilot-plant study, Hao and Hendricks (18) found a low ratio (0.5) of NO3-N formation/NH3-N removal.
A question arises: where does the extra SNH3-N come from? It is postulated that sloughed-off biomass from the previous stage breaks up and releases SNH3-N as the
Table 5. Rat ios of A l k a l i n i t y Destroyed and NOx-N Formed to Soluble NH3-N Removed
A l k a l i n i t y des t royed / NOx-N formed/ SNH3-N removed SNH3-N removed
Period Stage 3 Stage 4 Stage 3 Stage 4 1981 average 6.8 9.1 0.94 1.49
1/6-2/18/81 6.4 8.5 0.98 1.75 2/23-3/11/81 5.0 9.4 0.94 0.96 3 /16-4/8/81 7.1 8.5 0.82 1.83 4/15-5/20-81 8.9 11.5 1.25 1.74 5/25-7/6/81 8.9 12.7 1.19 2.06 7 /8 -7 /22 /81* - 8.3 - 1.04 7/27-8/12/81 5.8 9.2 0.89 1.40 8/19-9/30/81 4.9 11.4 1.14 1.31 10/5-11/4/81 7.4 8.5 0.90 1.03 11/9-12/28/81 4.9 8.0 0.66 1.15 1/5-1/13/82* - 4.0 - 0.1.6
Induced shock per iods
18

wastewater passes through each successive treatment unit. SH3-N also can be released from bottom sludge deposits. For stage 3, it seems that the use of alkalinity reduction or NOx-N formation, rather than SNH3-N removal, would be more useful in the evaluation of nitrification. Further discussion on this will be presented later.
Stage 5 and Secondary Clarifier
Inspection of table 4 and figures 5 and 6 shows that very litt le nitrification occurred at either stage 5 or the secondary (2°) clarifier. This was presumably due to the low influent SNH3-N concentration. The average SNH3-N for the stage 5 influent was 2.0 mg/L with a range of 0.2 to 14.5 mg/L. The stage 5 effluent averaged 1.6 mg/L SNH3-N with a range of 0.2 to 6.4 mg/L. Under normal operations, the added benefit of stage 5 is not justifiable and can be said to be a wasteful unit operation without added removal efficiency. However, with the structural design of Princeton's RBC system, it would be very difficult to remove the fifth stage from service to save operational costs.
Figure 5 suggests that regardless of the variation in RBC influent SNH3-N concentrations, under normal operations most secondary effluent SNH3-N concentrations were less than 2.0 mg/L, with an annual mean of 1.5 mg/L and a range of values from 0.2 to 4.0 mg/L. High effluent SNH3-N values were observed during the cold weather period (November through February). High values were also obtained during the July 1981 shock period. Recovery to lower normal effluent concentrations occurrred about one month after this shock period.
The overall SNH3-N removal efficiency was only 83% (table 4). For the secondary clarifier, under normal operations there was no seasonal difference in the percent removal efficiencies. However, the effluent SNH3-N concentrations were generally higher during cold weather.
During the July 1981 shock period, the hydraulic loadings exceeded design ra te by 30%, and NH3-N loading exceeded design by 60%. The average influent SNH3-N was 12.2 mg/L. The average SNH3-N concentration from the secondary clarifier was 7.3 mg/L. This resulted in an overall reduction of only 40%.
Total NH3-N data obtained in this study were evaluated in terms of the 1.5 mg/L effluent standard. Forty-five out of 80 secondary effluent collections, under normal operations, were in compliance with the Illinois standard; i.e., 56% of the time the secondary effluent could have been discharged directly into the receiving stream.
19

Nitrogen Budget
The transformations of various nitrogen forms, with average concentration values, are depicted in figure 7 for Princeton's RBC system. The total nitrogen (sum of NH3-N, Org-N, NO2-N, and NO3-N) entering the RBC system during normal operations remained somewhat constant at approximately 19 mg/L. Theoretically the total nitrogen concentration should remain constant as wastewater passes through the RBC units. In practice, though, some NH3-N may be lost to the atmosphere by stripping. It has been reported that the degree of NH3-N stripping in an RBC process is slight: approximately 4% of the total N budget (8,39). Ford et al. (14) reported that little NH3-N stripping occurs in an activated sludge process when the mean pH value is less than 8.5. A noticeable loss of NH3-N, most probably attributable to air stripping, was observed when the pH was 8.9. NO2-N and/or NO3-N produced from the aerobic biofilm may be partially converted to gaseous nitrogen (N2, N2O) by denitrifying bacteria and may be lost to the air if the DO concentration is very low.
Figure 7. Changes of nitrogen forms in the RBC system
20

Murphy et a l . (26) measu red ni t rogen b a l a n c e . They found t h a t 15% of t o t a l N
enter ing an RBC sys tem did no t appear in t he e f f luent . At P r i n c e t o n , losses of 10 and
30% t o t a l N occur red as the w a s t e w a t e r passed s t age 4 and the secondary c lar i f ie r
eff luent , r e spec t i ve ly (figure 7). NO 2 -N c o n c e n t r a t i o n s , r e p r e s e n t e d by solid bars in
figure 7, r e m a i n e d fairly cons tan t with a var ia t ion of 0.21 - 0.38 m g / L .
It is appa ren t from figure 7 t ha t changes in concen t r a t ion occur red for t he various
forms of n i t rogen as t he w a s t e w a t e r flowed through the RBC s y s t e m . There were smal l
r educ t ions in NH 3 -N and NO 3 -N with inc reases in the Org-N concen t r a t i on when the
w a s t e w a t e r passed through the sys tem, excep t at s t age 5. This was because of the con
figuration of t he con t ac to r s — t h e r e is a 12" drop at t h e bo t t om of s t ages 3 - 5 . The
se t t l ed sludge was chopped and scoured in s t age 5. A major i ty of the insoluble Org-N
was r emoved by sed imen ta t ion in the c lar i f iers (figure 7).
Removal Kinetics
Many s tudies employ e i t he r t h e Monod growth k ine t i c s or Michael is -Menton e n z y m e
kinet ics for modeling N H 3 - N . On the basis of s t e a d y - s t a t e condi t ions and a c o m p l e t e -
mix chamber , t h e genera l r e a c t i o n r a t e can be developed from the m a s s ba lance and can
be wr i t t en as :
(1)
(2)
where
r = r e a c t i o n (ni tr if icat ion) r a t e , lb /d /1000 sq ft (g /m 2 /d )
Q = flow r a t e , mgd (m 3 /d )
A = sur face a r e a of med ia , sq ft (m2)
S m - 1 , S m = influent and eff luent subs t ra te concen t r a t i ons a t s t a g e m, mg/L
Kn = n t h - o r d e r cons tan t
F i r s t -o rde r k ine t i c s can be wr i t t en as :
r1 = K1Sm (3)
when the r e a c t i o n r a t e i s p ropor t iona l to t he s u b s t r a t e c o n c e n t r a t i o n s .
21

Half-order kinetics can be written as:
(4)
when the reaction ra te is proportional to the one-half power of the substrate concentration.
Zero-order kinetics can be written as:
ro = Ko (5)
when the reaction ra te is independent of the substrate concentration.
The literature shows different opinions concerning the reaction ra te for ammonia oxidation of wastewater treated by an RBC system or by other fixed-film processes. The ra te of nitrification has been described with respect to NH3-N concentration as first-order (4,7,22,24-28,32,37,40-47), zero-order (7,24,44-51), and half-order (47,52) kinetics. Nitrification rates vary from first-order at low substrate concentrations to zero-order at high concentrations (5,24,44,46). Reported concentration values for zero-order reaction ra tes vary among investigators: 2.5 mg/L (5), 5.0 mg/L (24), and 6.0 mg/L (44) of NH3-N.
Recently a laboratory study by Poon et al. (47) indicated that both first-order and half-order kinetics applied equally well for SNH3-N loadings from 0 - 1 lb/d/1000 sq ft ( 0 - 5 g/m2/d) and beyond with SBOD5 loadings within the range of 0 - 1.6 lb/d/1000 sq ft (0 - 7.8 g/m2 /d). Biofilm kinetics may involve three regions which are first-order followed by half-order and then by zero-order as NH3-N concentrations and loadings increase (52). For the in-situ measurement of nitrifying bacteria kinetics in mixed culture , Hall and Murphy (45) reported that nitrification is zero-order with respect to substrate concentration and first-order with respect to the nitrifier bacterial concentration.
Other investigators (13,35,53-55) have developed conceptual models incorporating the fundamentals of substrate, oxygen diffusion, and biofilm growths. Mass transfer resistances have been applied for the reaction kinetics by others (56-59). Famularo et al. (51) proposed a model for an RBC system by applying oxygen and substrate transports with both liquid and biofilm resistants. An S-shaped curve was suggested by Poon et al. (60,61), showing that SNH3-N removal is initially first-order, changing to half-order as the SNH3-N loading increases, and finally reaching a maximum ra te (zero-order) with very high SNH3-N loadings.
22

Discrepancies in reaction ra te kinetics may be due to varying wastewater types, substrate concentrations, and environmental conditions employed in bench- and/or pilot-scale studies. Assumptions of constant reaction rates within all stages and steady-flow conditions are not always valid. An RBC system has varying reaction rates for the various stages. The wastewater flow of a t reatment plant is always in a non-steady state and is never constant. Therefore, it is necessary to investigate conditions within each stage of the RBC system.
Conventional hydraulic and mass loading rates are derived from the total media area for all stages combined and not just from the surface area of each stage. They are meaningless because actual loading rates are higher than conventionally calculated ra tes and vary from one stage to the other. Loading ra tes based on the surface area at each stage should be used.
In order to compare the manufacturer's design criteria with the observed data from stages 3 and 4, the data were plotted (not included) as percentage SNH3-N removal versus stage hydraulic loading ra te and effluent SNH3-N concentration versus hydraulic loading ra te . The plotted points were found to be scattered. It was impossible to obtain the curves with respect to SNH3-N concentration as stated in the design manual. It can be concluded that SNH3-N removal is unaffected by the hydraulic loading r a t e .
The expression "percent removal" or "percent remaining" is generally used in nitrification reactions and is not meaningful in the evaluation of reaction ra tes . The amount of SNH3-N removed per unit area per unit t ime (lb/d/1000 sq ft), R, does correspond to reaction rates or unit ra tes of nitrification.
Figures 8 and 9 show that SNH3-N removal increased as its loading increased up to a maximum limit. Both figures indicate that the SNH3-N "stage" loading ra tes (L) over 0.6 lb/d/1000 sq ft (2.9 g/m2/d) will cause a deterioration in RBC performance, which did occur during the shock periods. Ito and Matsuo (25) found that the maximum rate was 0.82 lb/d/1000 sq ft (4 g/m2/d) for bench-scale RBC units. The maximum removal (reaction or nitrification) ra te at Princeton was 0.35 lb/d/1000 sq ft (1.7 g/m2 /d) (figure 9).
The relationships for reaction (or removal) r a t e (R) versus influent SNH3-N concentration (Si) and also for reaction ra te versus SNH3-N "stage" loading ra te (L) for both stages 3 and 4 (excluding shock periods) were evaluated by 3-way (linear, semi-log, log-log) regression analysis. Occasionally log-log relationships produced the highest correlations, but for the most part linear relationships produced the best correlations.
23

Figure 8. Soluble NH3-N removal at stage 3
Figure 9. Soluble NH3-N removal at stage 4
24

Table 6 suggests that , in general, the correlation coefficients for R vs. L regressions are slightly bet ter than those for R vs. Si. The correlation coefficients were not great but were satisfactory for biological data . Regressions for R vs. Si will yield the popular first-order kinetics as expressed in equation 3. First-order kinetics are completely unaffected by hydraulic or mass loading rates, environmental conditions, wastewater characteristics (temperature, pH, DO, hydraulic detention time, etc.) or configuration or operation modes of RBC equipment. Recently, however, Marsh et al. (62) developed an empirical equation to predict NH3-N concentration variation in an RBC system on the basis of temperature, influent NH3-N, BOD concentrations, and flow ra te .
There are numerous uncontrollable factors in the RBC process. The dynamic changes in microbial populations and their metabolic activities within a treatment process are never consistent and do not follow any simple or complex model assumptions. Several models describe NH3-N removal relationships in RBC systems, but none is applicable to the Princeton data. To determine the reaction ra te for nitrification, the
Table 6. Resul t s of Regression Analyses of Reaction Rates (R, lb /d/1000 sq f t )
v s . In f luen t SNH3-N Loadings (L) and Concentrat ions (Si)
Stage R vs . L ( lb/d/1000 sq f t ) R v s . Si (mq/L) and Corr. Cor re la t ion
per iod Linear r e l a t i o n s h i p coeff. coe f f i c i en t Stage 3
1981 average R = 0.031 + 0.30L 0.44 0.46 Jan-Mar 1981 R = 0.069 + 0.61L 0.67 0.50 Apr-Jun 1981 - 0.19 0.56 Jul-Sep 1981 R = 0.035 + 0.32L 0.51 0.65 Oct-Dec 1981 - 0.24 -0.10
Stage 4 1981 average R = 0.030 + 0.49L 0.71 0.62 Jan-Mar 1981 R = 0.025 + 0.49L 0.62 .0.47 Apr -Jun 1981 R = 0.018 + 0.53L 0.72 0.81 Jul-Sep 1981 R = 0.027 + 0.53L 0.82 0.83 Oct-Dec 1981 R = 0.062 + 0.35L 0.54 0.38
25

empirical relationship between SNH3-N "stage" loading rates and removal ra tes , as shown in table 6, may be more useful.
The observed SNH3-N data from stages 3 and 4 were also subjected to evaluation using the relationships between stage influent SNH3-N loading conditions (rate, L, and concentration, Si) and effluent concentrations (Se). Better relationships existed between Se and Si for each stage, with good correlation coefficients (table 7). This meant that the effluent SNH3-N concentration increased as its influent concentration increased.
On the basis of the coefficients of correlation values in tables 6 and 7, one may conclude that the relationship between Se and Si is more useful in design considerations than the relationship between R and L. The current manufacturer's design curves are based on the relationship between Se and hydraulic loading ra te . However, one study of SBOD5 removal (9) suggested that there is a linear relationship between the SBOD5
removal ra te and stage SBOD5 loading ra te , with no relationship between effluent and influent SBOD5 concentrations.
Table 7. Resul t s of Regression Analyses of Eff luent SNH3-N Concentra t ions (Se)
v s . In f luen t SNH3-N Loadings (L) and Concent ra t ions (Si)
Stage Se(mq/1) v s . L ( lb /d /1000sq f t ) Se(mg/L) vs . Si(mg/L) and Cor r e l a t i on Corr .
per iod c o e f f i c i e n t coeff . Linear r e l a t i o n s h i p Stage 3
1981 average 0.68 0.85 Se = 0.62 Si - 0.14 Jan-Mar 1981 0.45 0.66 Se = 0.52 Si + 0.91 Anr-Jun 1981 0.64 0.78 Se = 0.52 Si + 0.29 Jul-Sep 1981 0.82 0.79 Se = 0.51 Si + 0.32 Oct-Dec 1981 0.77 0.96 Se = 0.97 Si - 0.31
Stage 4 1981 average 0.65 0.72 Se = 0.44 Si - 0.44 Jan-Mar 1981 0.51 0.53 Se = 0.79 Si - 0.22
Apr-Jun 1981 0.63 0.20
Jul-Sep 1981 0.83 0.77 Se = 0.39 Si - 0.31 Oct-Dec 1981 0.70 0.80 Se = 0.71 Si - 0.21
26
Design Considerations
For the design of nitrification in an RBC system, SBOD5 and SNH3-N concentrations and loading rates with temperature, DO, pH, and alkalinity should be carefully examined. If an RBC process is designated for both carbonaceous and ammonia removals, some reduction of SNH3-N will occur within the first few stages that are designed primarily for SBOD5 removal. For example, at Princeton an average 17% of the SNH3-N was reduced in the first two stages (table 4). In considering the SNH3-N concentration entering the first nitrification stage, one needs to take into account the reduction of SNH3-N occurring within the carbonaceous stages from the RBC system influent. Stage loading ra tes should be used instead of the conventional overall loading ra te .
Engineers should select a size for the first nitrification unit on the basis of availability and engineering experiences. A contactor with a surface area of 100,000 or 150,000 sq ft (9290 or 13,935 m2) is commonly used. The effluent SNH3-N concentration from the first nitrification stage can be estimated by using the relationship between effluent and influent SNH3-N concentrations (Se vs. Si) developed from similar RBC systems or from a laboratory-scale model. Scale-up is needed, though, from the laboratory units. This procedure can be repeated for the second nitrification unit and so on (size can be smaller) until the design effluent limitations are met .
SUMMARY AND CONCLUSIONS
Collection of operational data at the Princeton wastewater t reatment plant's RBC system was conducted on a twice-a-week basis over a one-year period from early January 1981 to the middle of January 1982. This study was conducted to gain insights into the phenomenon of NH3-N oxidation occurring within each stage of an RBC system. The following conclusions can be drawn from the data obtained.
1. Hydraulic and SNH3-N loading ra tes , under normal operations, were only slightly lower than those of design (conventional); while TBOD5 loading ra tes averaged much less at about one-half of design.
2. Hydrolysis or organic nitrogen occurred in stages 1 and 2 on many occasions.
27

3. With favorable environmental conditions during June 1981, both SBOD5 and SNH3-N removals occurred simultaneously in stage 1. This was also the case
. for stage 2 during November and December 1981.
4. Stage 3 gave an average SNH3-N removal efficiency of 40% for an influent concentration ranging from 2 to 18 mg/L SNH3-N with a stage loading of 0.4 lb SNH3-N/d/1000 sq ft (1.95 g/m2 /d) . Furthermore, stage 4 achieved an additional 64% SNH3-N removal from the stage 3 effluent.
5. Nitrification occurring in stages 3 and 4 deteriorated during shock loading periods. It took about one month before these stages returned to their normal operational status after the 3-week July shock period.
6. Nitrification took place as the SBOD5 concentration was reduced to 15 mg/L. It was affected by the wastewater temperature, which ranged from 7.5 to 21°C.
7. DO concentrations within stages 3 and 4 were not a limiting factor for ammonia oxidation.
8. Normally the pH in the RBC system was within the optimum, ranging from 7.5 to 7.8 pH units. The drop of pH due to nitrification was insignificant.
9. The average ratios of alkalinity destruction/NH3-N removal for stages 3 and 4 were 6.8 and 9.1, respectively. The mean ratios of NOx-N formation/SNH3-N removal were 0.94 and 1.49, respectively, for stages 3 and 4. A release of SNH3-N from a break-up of biomass and scouring of bottom deposits was suspected in stage 4.
10. Practically no nitrification occurred in stage 5 or the secondary clarifier. Normally, the SNH3-N concentrations for the secondary clarifier effluents were below 2.0 mg/L irrespective of RBC influent concentrations. Overall, the RBC system removed 83% of the SNH3-N regardless of the seasonal variations in influent SNH3-N concentrations, but effluent concentrations were highest during cold weather. About 56% of the t ime, TNH3-N in the secondary effluent met the 1.5 mg/L NH3-N effluent standard.
11. Only about 10% of total nitrogen of all forms in the RBC system's influent was
not accounted for at the effluent for stage 5.
28

12. Soluble NH3-N removal was not found to be related to hydraulic loading rates .
The loading ra te should be calculated on the basis of the surface area at each
stage within the RBC system and not for all stages combined.
13. The maximum stage loading rate was limited to 0.6 lb SNH3-N/d/1000 sq ft (2.9
g/m2 /d) . The maximum nitrification ra te was found to be 0.35 lb
SNH3-N/d/1000 sq ft (1.7 g/m2 /d).
14. A linear relationship existed between effluent and influent SNH3-N concentra
tions at stages 3 and 4 where nitrification occurred. This relationship is
proposed for use in RBC process design.
REFERENCES
1. Standard methods for the examination of water and wastewater. 1980. American Association of Public Health, New York, NY, 15th ed., 1134 p.
2. Sawyer, C. N. 1956. Biological t reatment of sewage and industrial waste, 1. J. McCabe and W. W. Eckenfelder, Jr., eds., Reinhold, NY.
3. McCarty, P. L. 1970. Biological processes for nitrogen removal — theory and application. Proceedings 13th Sanitary Engineering Conference Nitrate and Water Supply: Source and Control, University of Illinois, Urbana, p. 136.
4. Antonie, R. L. 1975. Fixed biological surfaces — wastewater t reatment . CRC Press, Inc., West Palm Beach, FL, 200 p.
5. Weng, C, and A. H. Malof. 1974. Nitrification in biological fixed-film rotating disk system. Journal Water Pollution Control Federation v. 46(7):1674-1685.
6. Banerji, S. K. 1980. ASCE water pollution management task committee report on rotating biological contactor for secondary t reatment . Proceedings First National Symposium/Workshop on RBC Technology (Proc. FNSWRBCT), v. 1:31-52.
7. Miller, R. D., C. I. Noss, A. Ostrofsky, and R. S. Ryczak. 1980. Rotating biological contactor process for secondary treatment and nitrification following a trickling filter. Proc. FNSWRBCT, v. 11:1035-1063.
8. Mueller, J. A., P. Paquin, and J. Famularo. 1980. Nitrification in rotating biological contactors. Journal Water Pollution Control Federation v. 52(4):688-710.
9. Lin, S.D., D. H. Schnepper, and R. L. Evans. 1985. A close look at changes in BOD5 and solids in an RBC system. In review.
10. U.S. Environmental Protection Agency. 1975. Process design manual for nitrogen control. Chapters 2-4.
29

11. Painter, H. A. 1970. A review of l i terature on inorganic nitrogen metabolism. Water Research v. 4(6):393-450.
12. Painter, H. A. 1975. Microbial transformations of inorganic nitrogen. Proceedings Conference on Nitrogen as Wastewater Pollutant, Copenhagen, Denmark.
13. Haug, R. T., and P. L. McCarty. 1972. Nitrification with submerged filters. Journal Water Pollution Control Federation v. 44(12):2086-2102.
14. Ford, D. L., R. Churchwell, and J. W. Kachtick. 1980. Comprehensive analysis of nitrification of chemical processing wastewaters. Journal Water Pollution Control Federation v. 52(11):2726-2746.
15. Clark, J. H., E. M. Moseng, and T. Asano. 1978. Performance of a rotating biological contactor under varying wastewater flow. Journal Water Pollution Control Federation v. 50(5):896-911.
16. Hitdlebaugh, J.A., and R. D. Miller. 1980. Full-scale rotating biological contactor for secondary t reatment and nitrification. Proc. FNSWRBCT v. 1:269-294.
17. Stover, E. L., and D. F. Kincannon. 1975. One-step nitrification and carbon removal. Water & Sewage Works v. 122(6):66-69.
18. Hao, O., and G. F. Hendricks. 1975. Rotating biological reactors remove nutrients, part II. Water & Sewage Works v. 122(11):48-50.
19. Lue-Hing, C, A. W. Obayashi, D. R. Zenz, B. Washington, and B. M. Sawyer. 1974. Nitrification of a high ammonia content sludge supernatant by use of rotating discs. Presented at 29th Annual Purdue Industrial Waste Conference, May 7-9, The Metropolitan Sanitary District of Greater Chicago, 29 p.
20. Lue-Hing, C, A. W. Obayashi, D. R. Zenz, B. Washington, and B. M. Sawyer. 1976. Biological nitrification of sludge supernatant by rotating disks. Journal Water Pollution Control Federation v. 48(l):25-46.
21. Hynek, R. J., and H. Iemura. 1980. Nitrogen and phosphorus removal with rotating biological contactors. Proc. FNSWRBCT v. 1:295-324.
22. Antonie, R. L., D. L. Kluge, and J. H. Mielke. 1974. Evaluation of a rotating disk wastewater t rea tment plant. Journal Water Pollution Control Federation v. 46(3):498-511.
23. Autotrol Corporation. 1978. Wastewater t reatment systems — design manual. Autotrol Corp., Milwaukee, WI.
24. Antonie, R. L. 1974. Nitrification of activated sludge: Bio-surf process part II. Water & Sewage Works v. 121(13):54-55.
25. Ito, K., and T. Matsuo. 1980. The effect of organic loading on nitrification in RBC wastewater t rea tment process. Proc. FNSWRBCT v. II:1165-1175.
30

26. Murphy, K. L., P. M. Sutton, R. W. Wilson, and B. E. Jank. 1977. Nitrogen control: design considerations for supported growth systems. Journal Water Pollution Control Federation v. 49(4):549-557.
27. Bushwell, A. H., T. Shiota, N. Lawrence, and I. Van Meter. 1954. Laboratory studies on the kinetics of the growth of Nitrosomonas with relation to the nitrification phase of the BOD test. Applied Microbiology v. 2:21-25.
28. Pano, A., and E. J. Middlebrooks. 1982. The kinetics of rotating biological contactors at temperature: 5°C, 15°C, and 20°C. Proc. First International Conference on Fixed Film Biological Processes (FICFFBP) v. I:261-308.
29. Hao, O., and G. F. Hendricks. 1975. Rotating biological reactors remove nutrients, part I. Water & Sewage Works v. 122(10):70-73.
30. Richard, Y., L. Brener, G. Martin, and C. Leblance. 1978. Study of the nitrification of surface water. Progress in Water Technology v. 10(56): 17-32.
31. Young, J. C, E. R. Baumann, and D. J. Wall. 1975. Packed-bed reactors for secondary effluent BOD and ammonia removal. Journal Water Pollution Control Federation v. 47(l):46-78.
32. Munch, W. L. 1978. Control ammonia nitrogen with single-stage nitrification. Water & Wastes Engineering v. 15(8):16-20.
33. Strat ta, J. M., and D. A. Long. 1980. Nitrification enhancement through pH control with rotating biological contactors. Proc. FNSWRBCT v. II:1177-1192.
34. Strat ta , J. M., D. A. Long, and M. C. Doherty. 1982. Improvement of nitrification of rotating biological contactors by means of alkaline chemical addition. Proc. FICFFBP v. II:758-801.
35. Sherrard, J. H. 1976. Destruction of alkalinity in aerobic biological wastewater t reatment . Journal Water Pollution Control Federation v. 48(7):1834-1839.
36. Alleman, J. E., and R. L. Irving. 1980. Nitrification in the sequencing batch biological reactor . Journal Water Pollution Control Federation v. 52(II):2747-2754.
37. Chou, C. C, R. J. Hynek, and R. A. Sullivan. 1980. Comparison of full scale RBC performance with design criteria. Proc. FNSWRBCT v II:1101-1125.
38. Singhal, A. K. 1980. Phosphorus and nitrogen removal at Cadillac, Michigan. Journal Water Pollution Control Federation v. 52(ll):2761-2770.
39. Mueller, J. A., J. Famularo, and J. Fitzpatrick. 1980. Analysis of design of rotating biological contactors. Proc. FNSWRBCT v. II:921-960.
40. McHarness, D. D., R. T. Haug, and P. L. McCarty. 1975. Field studies of nitrification with submerged filters. Journal Water Pollution Control Federation v. 47(2):291-309.
31

41. Torpey, W., H. Heukelekian, A. J. Kaplovsky, and R. Epstein. 1971. Rotating discs with biological growth prepare wastewater for disposal or reuse. Journal Water Pollution Control Federation v. 43(11):2181-2188.
42. Pescod, N.B., and J. V. Nair. 1972. Biological disc filtration for tropical waste t reatment . Water Research (Great Britain) v. 6(12):1509-1523.
43. Zenz, D. R., E. Bogusch, M. Krup, T. B. S. Prakasam, and C. Lue-Hing. 1980. Pilot-scale studies on the nitrification of primary and secondary effluents using rotating biological discs at the Metropolitan Sanitary District of Greater Chicago. Proc. FNSWRBCT v.. II:1221-1246.
44. Crawford, P. M. 1980. Use of rotating biological contactors for nitrification at the city of Guelph water pollution control plant, Guelph, Ontario, Canada. Proc. FNSWRBCT v. II: 1247-1273.
45. Hall, E. R., and K. L. Murphy. 1980. Estimation of nitrifying biomass and kinetics in wastewater. Water Research (Great Britain) v. 14(4):297-304.
46. Kornegay, B. H., and J. F. Andrews. 1968. Kinetics of fixed film biological reactors . Journal Water Pollution Control Federation v. 40(11):R460-R468.
47. Poon, C. P. C, E. D. Smith, and V. A. Strickler. 1982. Study of fixed film biological contactors for recreational area wastewater t reatment application. Proc. FICFFBP v. I:524-541.
48. Torpey, W., H. Heukelekian, A. J. Kaplovsky, and L. Epstein. 1972. Effects of exposing slimes on rotating discs to atmospheres enriched with oxygen. Advances in Water Pollution Research, ed. S. H. Jenkins, Pergamon, London, pp. 405-415.
49. Huang, C.-S., and N. E. Hopson. 1974. Nitrification ra te in biological processes. Proceedings ASCE, Journal of Environmental Engineering Division v. 100(EE2):409-422.
50. LaMotta, J. 1976. Internal diffusion and reaction in biological films. Environmental Science and Technology v. 10(8):765-769.
51. Famularo, J., J. A. Mueller, and T. Mulligan. 1978. Application of mass transfer to rotating biological contactors. Journal Water Pollution Control Federation v. 50(4):653-671.
52. Harremoes, P. 1972. Biofilm kinetics. Chapter 4 in Water Pollution Microbiology, R. Mitchell, ed.
53. Schroeder, E. D. 1977. Water and wastewater t reatment . McGraw-Hill, New York, pp. 288-312.
54. Rit tman, B. E., and P. L. McCarty. 1978. Variable-order model of bacteria film kinetics. Proceedings ASCE, Journal Environmental Engineering Division v. 104(EE5):889-900.
32

55. Hansford, G. S., J. F. Andrews, C. J. Grieves, and A. D. Carr. 1978. A steady-state model for the rotating biological disc reactor . Water Research (Great Britain) v. 12(10):855-868.
56. Grieves, C. G. 1972. Dynamic and steady s ta te models for the rotating biological disc reactor . Ph.D. Thesis, Clemson University, Clemson, SC.
57. Frieman, A. A., R. C. Woods, and R. C. Wilkey. 1976. Kinetic response of rotating biological contactors. Proceedings 31st Industrial Waste Conference, Purdue University, Ann Arbor Science Publishers, Inc., Ann Arbor, MI, pp. 420-433.
58. Frieman, A. A., L. E. Robbins, and R. C. Woods. 1979. Effect of disc rotational speed on biological contactor efficiency. Journal Water Pollution Control Federation v. 51(ll):2678-2690.
59. Harremoes, P. 1982. Criteria for nitrification in fixed film reactors. Water Science Technology (Great Britain) v. 14(1):167-187.
60. Poon, C. P. C, H. Chin, E. D. Smith, and W. J. Mikucki. 1980. Upgrading trickling filter effluent with a RBC system. Proc. FNSWRBCT v. II:997-1014.
61. Poon, C. P. C, H. K. Chin, E. D. Smith, and W. J. Mikucki. 1981. Upgrading with rotating biological contactors for ammonia nitrogen removal. Journal Water Pollution Control Federation v. 53(7):1158-1165.
62. Marsh, D., L. Benefield, E. Bennett, D. Linstedt, and R. Hartman. 1981. Coupled trickling filter — rotating biological contactor nitrification process. Journal Water Pollution Control Federation v. 53(10):1469-1480.
33