Embed Size (px)
Citation preview
AN APPROACH ON DETERMINING OPTIMUM ACOUSTIC CONDITIONS
FOR TURKISH CLASSICAL MUSIC
A THESIS SUBMITTED TO
THE GRADUATE SCHOOL OF NATURAL AND APPLIED SCIENCES
OF
MIDDLE EAST TECHNICAL UNIVERSITY
BY
TUNA TORUN
IN PARTIAL FULFILLMENT OF THE REQUIREMENTS
FOR
THE DEGREE OF MASTER OF SCIENCE
IN
BUILDING SCIENCE IN ARCHITECTURE
SEPTEMBER 2019

Approval of the thesis:
AN APPROACH ON DETERMINING OPTIMUM ACOUSTIC
CONDITIONS FOR TURKISH CLASSICAL MUSIC
submitted by TUNA TORUN in partial fulfillment of the requirements for the degree
of Master of Science in Building Science in Architecture Department, Middle
East Technical University by,
Prof. Dr. Halil Kalıpçılar
Dean, Graduate School of Natural and Applied Sciences
Prof. Dr. Fatma Cânâ Bilsel Head of Department, Architecture
Prof. Dr. Arzu Gönenç Sorguç
Supervisor, Architecture, METU
Examining Committee Members:
Assoc. Prof. Dr. Ali Murat Tanyer
Architecture, METU
Prof. Dr. Arzu Gönenç Sorguç
Architecture, METU
Assoc. Prof. Dr. Ayşe Tavukçuoğlu
Architecture, METU
Assoc. Prof. Dr. Semra Arslan Selçuk
Architecture, Gazi University
Assoc. Prof. Dr. Hatice Günseli Demirkol
Architecture, Eskişehir Technical University
Date: 24.09.2019
iv
I hereby declare that all information in this document has been obtained and
presented in accordance with academic rules and ethical conduct. I also declare
that, as required by these rules and conduct, I have fully cited and referenced all
material and results that are not original to this work.
Name, Surname:
Signature:
Tuna Torun
v
ABSTRACT
AN APPROACH ON DETERMINING OPTIMUM ACOUSTIC
CONDITIONS FOR TURKISH CLASSICAL MUSIC
Torun, Tuna
Master of Science, Building Science in Architecture
Supervisor: Prof. Dr. Arzu Gönenç Sorguç
September 2019, 160 pages
From past to present, performance spaces are being designed in order to provide better
listening conditions according to their function. Rooms for classical music have
different qualities in comparison to rooms for speech, for instance. However, while
acoustic design regarding western-originated performances have been present for
centuries, no such attempt has been made for Turkish classical music (TCM).
This study aims to search for possible acoustic conditions that would complement the
characteristics of TCM and try to improve the overall quality of spaces where TCM
may be performed. After an in depth analysis of room acoustics parameters, acoustic
evaluation systems and characteristics of TCM, spectral analyses are done for western
classical music, opera and TCM, in order to understand the distinctions between the
three. Afterwards, three different performance spaces with different qualities are
modelled digitally in the 3D environment which were then transferred into Odeon
room acoustics software, where anechoic audio recordings of TCM are auralised.
A listening test is made with the auralisations for the correlation of objective and
subjective acoustic parameters, and an acoustic evaluation survey is conducted to the
listeners. Afterwards, a virtual room is modelled with conditions close to an anechoic
room, where various changes are made in order to achieve better conditions for TCM
vi
through trial and error. Finally, four alternatives with the best conditions are taken into
a listening test. The results are believed to yield close-to-optimum acoustic conditions
for TCM, and may be used for in depth future studies.
Keywords: Turkish Classical Music, Room Acoustics, Acoustic Evaluation, Acoustic
Design

vii
ÖZ
KLASİK TÜRK MÜZİĞİ İÇİN OPTİMUM AKUSTİK KOŞULLARIN
BELİRLENMESİ ÜZERİNE BİR YAKLAŞIM
Torun, Tuna
Yüksek Lisans, Mimarlık
Tez Danışmanı: Prof. Dr. Arzu Gönenç Sorguç
Eylül 2019, 160 sayfa
Performans mekanları, geçmişten günümüze fonksiyonları doğrultusunda dinleyiciye
daha iyi koşullar sağlayacak şekilde tasarlanmaktadır. Örneğin, klasik müzik için
tasarlanan mekanlar konuşma için tasarlanmış mekanlara göre farklı koşullara
sahiptir. Ancak, sözü geçen mekanlarda akustik tasarım batı doğuşlu performans
türleri için yüzyıllardır süregelse de, Klasik Türk Müziği (KTM) için günümüze
kadar bu alanda bir çalışma yapılmamıştır.
Bu çalışmada KTM’nin karakteristik özelliklerini ortaya çıkaracak ve KTM icra
edilebilecek mekanların bütüncül akustik kalitesini iyileştirecek muhtemel akustik
koşulların arayışına girilmiştir. Hacim akustiği parametreleri, akustik değerlendirme
sistemleri ve KTM’nin yapısal özellikleri hakkında derinlemesine bir araştırmanın
ardından batı klasik müziği, opera ve KTM arasındaki farklılıkları gösterecek
spektrum analizleri yapılmıştır. Sonrasında, farklı özelliklere sahip üç performans
mekanı 3 boyutlu ortamda modellenerek anekoik KTM ses kayıtları bu mekanlarda
Odeon programı kullanılarak oralize edilmiştir.
Öznel ve nesnel akustik parametreler arasındaki bağlantıyı kurabilmek adına, yapılan
oralizasyonlar ile bir dinleme testi gerçekleştirilmiş ve dinleyicilere akustik
değerlendirme yapacakları bir anket sunulmuştur. Daha sonra anekoik oda koşullarına
viii
yakın olacak şekilde bir sanal oda modellenmiş ve KTM için daha iyi koşullar elde
edebilmek adına oda üzerinde deneme-yanılma yolu ile çeşitli değişiklikler
yapılmıştır. Son olarak, yapılan denemeler içerisinde en iyi koşullara sahip olduğu
düşünülen dört alternatif, bir dinleme testine sokulmuştur. Elde edilen sonuçların
KTM için optimuma yakın koşullar sağladığı ve bu sonuçların gelecek çalışmalar için
kullanılabileceği düşünülmektedir.
Anahtar Kelimeler: Klasik Türk Müziği, Hacim Akustiği, Akustik Değerlendirme,
Akustik Tasarım
ix
To all those in life whose stories remain unfinished, and melodies unwritten;
x
ACKNOWLEDGMENTS
I would initially like to thank my supervisor Prof. Dr. Arzu Gönenç Sorguç for her
guidance and patience in the course of this study.
I would also like to appreciate the technical support given by Assoc. Prof. Aslı
Özçevik Bilen, Gonca Örün, Yusuf Seven, Murat Akgün, Hulusi Zaim Buyan, Ali
Yalçın and Meysam Heshmati Far.
I give my special thanks for the conservatory teaching members including but not
limited to; Prof. Ruhi Ayangil, Assoc. Prof. Esra Berkman and Instructor Meriç
Düzbaş, as well as the countless students of the conservatory and Turkish classical
music performers.
Last but not least, I would like to thank my two families; my real family and my
lifelong friends, for their support, understanding and love. I could not have done it
without any of them.
xi
TABLE OF CONTENTS
ABSTRACT ............................................................................................................ v
ÖZ vii
ACKNOWLEDGMENTS ........................................................................................ x
TABLE OF CONTENTS ........................................................................................ xi
LIST OF TABLES ................................................................................................ xiv
LIST OF FIGURES .............................................................................................. xvi
LIST OF ABBREVIATIONS ................................................................................ xx
CHAPTERS
1. INTRODUCTION ............................................................................................ 1
1.1. Argument ...................................................................................................... 1
1.2. Aim and Objectives ....................................................................................... 2
1.3. Materials and Method .................................................................................... 3
1.4. Contribution .................................................................................................. 4
1.5. Disposition .................................................................................................... 4
2. LITERATURE REVIEW.................................................................................. 7
2.1. Architectural Acoustics.................................................................................. 7
2.2. Room Acoustic Parameters .......................................................................... 10
2.2.1. Objective Acoustic Parameters .............................................................. 10
2.2.1.1. Reverberation Time ........................................................................ 11
2.2.1.2. Early Decay Time ........................................................................... 14
2.2.1.3. Clarity ............................................................................................ 15
xii
2.2.1.4. Early Lateral Energy Fraction and Late Arriving Lateral Energy ... 16
2.2.1.5. Bass Ratio and Treble Ratio............................................................ 17
2.2.2. Subjective Acoustic Parameters ............................................................. 17
2.2.2.1. Definition and Clarity ..................................................................... 18
2.2.2.2. Reverberance .................................................................................. 18
2.2.2.3. Warmth ........................................................................................... 19
2.2.2.4. Intimacy .......................................................................................... 19
2.2.2.5. Listener Envelopment ..................................................................... 19
2.2.2.6. Balance........................................................................................... 20
2.3. Specifications of Performance Spaces .......................................................... 20
2.3.1. Acoustic Design Criteria ....................................................................... 20
2.3.1.1. Room Size and Shape ...................................................................... 21
2.3.1.2. Purpose of Use ............................................................................... 24
2.3.1.3. Stage Proportions ........................................................................... 24
2.3.1.4. Design of the Audience Area ........................................................... 25
2.3.2. Acoustic Evaluation of Performance Spaces .......................................... 27
2.4. Brief Information on Turkish Classical Music .............................................. 31
2.4.1. History of Turkish Classical Music ........................................................ 31
2.4.2. Characteristics of Turkish Classical Music............................................ 38
3. THEORIES AND POSTULATE .................................................................... 45
3.1. Frequency Spectrum Analysis ...................................................................... 46
3.2. Reading and Interpreting Spectrograms ....................................................... 47
3.3. Analyses of Selected Songs ......................................................................... 50
3.3.1. Analyses for Turkish Classical Music .................................................... 51
xiii
3.3.2. Analyses for Western Classical Music ................................................... 53
3.3.3. Analyses for Opera ................................................................................ 60
3.4. Analyses of Musical Components ................................................................ 63
3.5. Discussion ................................................................................................... 68
4. MATERIALS AND METHODOLOGY ......................................................... 75
4.1. Anechoic Room Recordings ........................................................................ 76
4.2. Modelling of the Performance Spaces .......................................................... 77
4.3. Listening Test and Evaluation Sheet ............................................................ 84
5. RESULTS AND DISCUSSION ...................................................................... 87
5.1. Auralisations of Three Performance Spaces ................................................. 87
5.2. Anechoic Chamber Auralisations ................................................................. 89
5.3. Results of the First Listening Test ................................................................ 92
5.4. Determining Optimum Conditions for the Three Room Cases .................... 102
5.5. Results of the Second Listening Test ......................................................... 105
5.6. Discussion ................................................................................................. 107
6. CONCLUSION ............................................................................................ 117
6.1. Summary ................................................................................................... 117
6.2. Limitations and Recommendations ............................................................ 120
REFERENCES .................................................................................................... 121
APPENDICES……………………………………………………………………..127
xiv
LIST OF TABLES
TABLES
Table 2.1. Volume ratios depending on function .................................................... 21
Table 2.2. Leo Beranek’s evaluation system (1962) ............................................... 27
Table 2.3. Leo Beranek’s evaluation system (1996) ............................................... 28
Table 2.4. Yoichi Ando’s evaluation system .......................................................... 28
Table 2.5. Makams used in Turkish Classical Music .............................................. 41
Table 3.1. Outputs of the analyses of three musical styles in terms of frequency
spectra, musical structure and dominant elements .................................................. 68
Table 3.2. Major features of classical music, opera and Turkish classical music ..... 71
Table 4.1. Material properties of surfaces in Ankara Opera House ......................... 82
Table 4.2. Material properties of surfaces in ESMMMO conference hall ................ 83
Table 4.3. Material properties of surfaces in Air Force conference hall .................. 83
Table 5.1. EDT, RT, C80, D50, BR and TR values of performance spaces ............... 87
Table 5.2. Absorption coefficients that were assigned in the box room references .. 90
Table 5.3. EDT, RT, C80, D50, BR and TR values of the box room preferences….90
Table 5.4. Absorption coefficients that were assigned in the box room alternatives...91
Table 5.5. EDT, RT, C80, D50, BR and TR values of the box room alternatives….92
Table 5.6. Proposed optimum acoustic parameters for Turkish classical music……102
Table 5.7. Absorption coefficients of existing and modified materials in three
performance spaces………………………………………………………………...103
Table 5.8. Acoustic parameters of performance spaces…………………………….104
Table 5.9. Correlation of objective and subjective parameters in the anechoic box
room…...…………………………………………………………………………..107
Table 5.10. Correlation of objective and subjective parameters in Ankara Opera
House……………………………………………………………………………...108
xv
Table 5.11. Correlation of objective and subjective parameters in ESMMMO
conference hall……………………………………………………………………..109
Table 5.12. Correlation of objective and subjective parameters in Air Force conference
hall...……………………………………………………………………………….109
Table 5.13. Proposed optimum conditions for Turkish classical music……………112
Table 5.14. Parameters and conditions of the selected three performance spaces…113
xvi
LIST OF FIGURES
FIGURES
Figure 2.1. Demonstration of reverberation time (Beranek, 2004) .......................... 11
Figure 2.2. Optimum reverberation times at 500 Hz for different types of spaces
(Maekawa, 1994) ................................................................................................... 13
Figure 2.3. Graphs of different sound decays of rooms with equal RT values (Mehta
et al, 1999) ............................................................................................................. 14
Figure 2.4. Plan types for performance spaces: a) rectangular type b) fan type c)
horseshoe type d) geometrical type ........................................................................ 22
Figure 2.5. M. David Egan’s evaluation system (empty) ........................................ 29
Figure 2.6. M. David Egan’s evaluation system (filled) .......................................... 30
Figure 2.7. Display of the 9 intervals between two notes ........................................ 39
Figure 2.8. Names of the tones used in Turkish Classical Music and their indicators
.............................................................................................................................. 39
Figure 2.9. Percussion instruments used in Turkish music ...................................... 42
Figure 2.10. Woodwind instruments used in Turkish music.................................... 43
Figure 2.11. String instruments used in Turkish music ........................................... 43
Figure 3.1. The waveform of the C note on the piano (Ladefoged, 1995) ............... 47
Figure 3.2. The frequency spectrum of the C note on the piano (Ladefoged, 1995) . 47
Figure 3.3. Bird chirping, (top) waveform graph, (bottom) spectrogram ................. 49
Figure 3.4. Male saying “hello”, (top) waveform graph, (bottom) spectrogram....... 50
Figure 3.5. a) Spectrogram view of “Dediler Zamanla Hep”, performed by Zeki Müren
(1989) b) Spectrogram view of “Ada Sahilleri” performed by Fasl-ı Beyoğlu (2014)
c) Spectrogram view of “Seni Sordum Yıldızlara” performed by Zeki Müren (1989)
.............................................................................................................................. 51
Figure 3.6. Spectrogram view of “Lale Devri” performed by Sezen Aksu (2009) ... 52
xvii
Figure 3.7. a) Spectrogram view of “Les Toreadors” from “Carmen” (Bizet, 1875) b)
Spectrogram view of “Concerto Grosso in A minor op. 6 no. 4” (Handel, 1739) c)
Spectrogram view of “Overture” from “Don Giovanni” (Mozart, 1787) ................ 54
Figure 3.8. Spectrogram view, breakdown on “Les Toreadors” from “Carmen” (Bizet,
1875) ..................................................................................................................... 55
Figure 3.9. Spectrogram view of the octave bands produced by a solo violin playing a
C major scale, from “Concerto Grosso in A minor op. 6 no. 4” (Handel, 1739) ..... 56
Figure 3.10. Partial spectrogram view of “Also Sprach Zarathustra, op. 30” (Strauss,
1896) ..................................................................................................................... 57
Figure 3.11. a) Spectrogram view of “Fur Elise” (Beethoven, 1810) b) Spectrogram
view of “Moonlight Sonata” (Beethoven, 1801) c) Spectrogram view of “The Merry
Peasant” (Schumann, 1848) ................................................................................... 58
Figure 3.12. Partial spectrogram view of “Moonlight Sonata” (Beethoven, 1801) .. 59
Figure 3.13. a) Spectrogram view of “Casta Diva” by Maria Callas in “Norma”
(Bellini, 1958) b) Spectrogram view of “Vesti la Giuba” by Enrique Caruso in
“Pagliacci” (Leoncavallo, 1892) c) Spectrogram view of “La Donna é Mobile” by
Luciano Pavarotti in “Rigoletto” (Verdi, 1851) ...................................................... 61
Figure 3.14. Partial spectrogram view of “Si, mi chiamano Mimi” by Renata Tebaldi
from “La Boheme” between 3:05 – 3:20 (Puccini, 1896) ........................................ 62
Figure 3.15. The basic components of a symphony orchestra ................................. 64
Figure 3.16. Frequency ranges of human voice ...................................................... 65
Figure 3.17. Frequency ranges of orchestral instruments ........................................ 66
Figure 3.18. a) Spectrogram view of “Yar Saçların Lüle Lüle” by Semiramis Pekkan
(1972) b) Spectrogram view of “Overture” from “The Magic Flute” (Mozart, 1791) c)
Spectrogram view of “Mein Herr Marquis” from “Die Fledermaus” (Strauss, 1874)
.............................................................................................................................. 69
Figure 4.1. Axonometric view of Ankara Opera House .......................................... 77
Figure 4.2. Plan view of Ankara Opera House ........................................................ 78
Figure 4.3. Section view of Ankara Opera House ................................................... 78
Figure 4.4. Axonometric view of ESMMMO conference hall................................. 79
xviii
Figure 4.5. Plan view of ESMMMO conference hall .............................................. 79
Figure 4.6. Section view of ESMMMO conference hall ......................................... 80
Figure 4.7. Axonometric view of Air Force conference hall ................................... 80
Figure 4.8. Plan view of Air Force conference hall ................................................. 81
Figure 4.9. Section view of Air Force conference hall ............................................ 81
Figure 5.1. Axonometric view of the anechoic box room ....................................... 89
Figure 5.2. Listening test results for Sample 1………………………………………93
Figure 5.3. Listening test results for Sample 2………………………………………94
Figure 5.4. Listening test results for Sample 3………………………………………95
Figure 5.5. Listening test results for Sample 4………………………………………96
Figure 5.6. Listening test results for Sample 5………………………………………96
Figure 5.7. Listening test results of four preferences for Sample 4…………………98
Figure 5.8. Listening test results of most and least preferable alternatives…………99
Figure 5.9. Listening test results of the evaluation for most preferable song……….99
Figure 5.10 Listening test results of the evaluation for least preferable song………100
Figure 5.11. Listening test results of the song preferences in Ankara Opera House..105
Figure 5.12. Listening test results of the song preferences in ESMMMO conference
hall…………………………………………………………………………………106
Figure 5.13. Listening test results of the song preferences in Air Force conference
hall…………………………………………………………………………………106
Figure 5.14. Evaluation scores of the three performance spaces…………………..110
Figure A.1. Blank sheet of acoustic evaluation survey…………………………….127
Figure B.1. Spectrogram view of classical music pieces…………………………..128
Figure B.2. Spectrogram view of classical music pieces, continued……………..129
Figure B.3. Spectrogram view of classical music pieces, continued.…………….130
Figure B.4. Spectrogram view of opera pieces …………..………………………..131
Figure B.5. Spectrogram view of opera pieces, continued………………………..132
Figure B.6. Spectrogram view of opera pieces, continued………………………..133
Figure B.7. Spectrogram view of Turkish classical music pieces………………….134
xix
Figure B.8. Spectrogram view of Turkish classical music pieces, continued…….135
Figure B.9. Spectrogram view of Turkish classical music pieces, continued…..….136
Figure C.1. EDT values in octave bands for Ankara Opera House…………………137
Figure C.2. T30 values in octave bands for Ankara Opera House…………………138
Figure C.3. C80 values in octave bands for Ankara Opera House…………………139
Figure C.4. D50 values in octave bands for Ankara Opera House…………………140
Figure C.5. LF80 values in octave bands for Ankara Opera House………………..141
Figure C.6. SPL values in octave bands for Ankara Opera House…………………142
Figure C.7. Ts values in octave bands for Ankara Opera House…………………..143
Figure C.8. LG80, SPL(A) and STI values for Ankara Opera House……………..144
Figure C.9. EDT values in octave bands for ESMMMO Conference Hall………..145
Figure C.10. T30 values in octave bands for ESMMMO Conference Hall………..146
Figure C.11. C80 values in octave bands for ESMMMO Conference Hall………..147
Figure C.12. D50 values in octave bands for ESMMMO Conference Hall………..148
Figure C.13. LF80 values in octave bands for ESMMMO Conference Hall……....149
Figure C.14. SPL values in octave bands for ESMMMO Conference Hall………..150
Figure C.15. Ts values in octave bands for ESMMMO Conference Hall………….151
Figure C.16. LG80, SPL(A) and STI values for ESMMMO Conference Hall…….152
Figure C.17. EDT values in octave bands for Air Force HQ Conference Hall…….153
Figure C.18. T30 values in octave bands for Air Force HQ Conference Hall……..154
Figure C.19. C80 values in octave bands for Air Force HQ Conference Hall……..155
Figure C.20. D50 values in octave bands for Air Force HQ Conference Hall……..156
Figure C.21. LF80 values in octave bands for Air Force HQ Conference Hall……157
Figure C.22. SPL values in octave bands for Air Force HQ Conference Hall…….158
Figure C.23. Ts values in octave bands for Air Force HQ Conference Hall……….159
Figure C.24. LG80, SPL(A) and STI values for Air Force HQ Conference Hall….160
xx
LIST OF ABBREVIATIONS
ABBREVIATIONS
TCM: Turkish classical music
RT: Reverberation time
T30: Reverberation time in 30 milliseconds
EDT: Early decay time
C80: Clarity
D50: Distinctness
BR: Bass ratio
SPL: Sound pressure level
LF80: Early lateral energy fraction
LG80: Late arriving lateral energy
Ts: Central time
STI: Speech transmission index
SPL(A): Sum of weighted sound pressure level
Hz: Hertz
dB: Decibel
TRT: Turkish Radio and Television
1
CHAPTER 1
1. INTRODUCTION
This chapter presents information based on previously done research in the regarding
field and provides an introduction to the study. After a brief background summary, a
motivation and argument has been presented for this research, followed by the aim
and objectives of the research. The contributions of the proposed study are also
presented after the aim and objectives. Finally, a brief layout of the contents in this
thesis is introduced in the disposition section.
1.1. Argument
Auditory perception is just as important as visual perception when it comes to human
comfort. For years, the study of architectural acoustics aims to improve acoustic
comfort both in outdoor and indoor spaces. While building acoustics focuses
essentially on reducing unwanted noise in order to provide acoustic comfort, the main
purpose room acoustics is to make sure that the sound reaches all the listeners with
the most suitable conditions in rooms of which the main purpose is listening.
Performance spaces are being used almost as early as the history of mankind. From
ancient Greek theaters to Renaissance cathedrals, man has always struggled to design
special spaces for rituals, dances, drama or music. While said spaces were being
designed with acoustics in mind, it was not up until the end of the 19th century where
acoustics had started to be studied as a science. As the research on acoustics has
progressed, new discoveries have been made such as objective acoustic parameters,
where one can measure certain aspects of spaces such as reverberation time, early
decay time or clarity index, in order to distinguish good and bad qualities of a room.
2
However, researchers have started to realize that acoustics could not be evaluated
solely by using objective parameters, due to human perception being a subjective
element, hence the subjective acoustic parameters were found in order to see the
relationship between the objective qualities of a room and the reaction of a listener.
The study of room acoustics has led to an advancement on principles and technologies
in the design of performance spaces. Performance spaces that were being built had
started to become more and more successful in terms of acoustic quality. Although,
these improvements were more significant in the west, mainly focusing on western art
forms such as classical music, opera or drama. Today, most concert halls in Turkey
are designed to be multi-purpose and provide average acoustic conditions to abide
with a wide range of performances. Although some may have slightly better conditions
in terms of room acoustics, few of them specialize to achieve specific conditions for
specific types of music, mainly western classical music. There are also examples of
concert venues striving to obtain preferable acoustic conditions for rock and pop
concerts, however, no efforts have been made in order to analyze and determine the
best acoustic conditions for Turkish classical music (TCM), which is different than
western classical music in terms of instruments, modes (makam), measures and
monophony.
1.2. Aim and Objectives
This thesis aims to investigate optimum acoustic conditions for TCM by determining
favorable objective and subjective parameters that are suitable in order to design
performance spaces that specialize for TCM which would enhance the listeners’
general experience while listening to a TCM performance. The primary concern in the
first place is to examine the characteristics of TCM to find out its similarities and
differences between other types of music, such as the instruments that are used, the
traditional spaces where TCM has used to be played, or the size of a traditional TCM
orchestra. This brings out the possibility to figure out the objective and subjective
3
acoustic parameters that are needed for optimum acoustic quality. Afterwards, the
parameters that are believed to be effective to create a successful performance space
for TCM need to be tested for more accurate results. This is only possible to a certain
point, since optimum parameters for performance halls require evaluating a feasible
amount of rooms to be able to determine a standard quality. This problem may be
counteracted by changing the parameters of a certain room and experimenting through
a process of trial and error. After a reasonable amount of scenarios have been tested,
the optimum conditions for TCM could be figured out.
1.3. Materials and Method
In order for this study to be executed, firstly an anechoic recording of a TCM
performance is required. This is done in an anechoic room with musicians playing
various pieces. After this process is done, the recorded performances will be
transferred into Odeon room acoustics software to be simulated and auralised.
Three different performance spaces are modelled which have different sizes, forms
and acoustic parameters. The anechoic recordings are then auralised as mentioned
before. The auralisations are used for a listening test, conducted to professionals who
are experienced in Turkish music.
Deriving from the results of the listening test, the room with the best conditions is
selected. The next step is to get closer to optimum conditions for TCM. This is done
by using a model of a room which has the properties of an anechoic chamber. The
model is altered to generate various different conditions that have different acoustic
parameters. Anechoic recordings are auralised in these different room scenarios to see
which parameters yield the best results. A second listening test is conducted with the
auralisations from said scenarios and objective acoustic parameters are correlated with
subjective parameters for more accurate results.
4
1.4. Contribution
Research has been done in the field of room acoustics since the end of the 19th century
that focuses on performance spaces and how to improve them. Optimum acoustic
parameters for classical music, opera, theater and speech have become well
acknowledged today. However, the information regarding optimum conditions for
TCM is very limited, even to this day. This study aims to be a guiding light for future
studies regarding TCM. It is considered that the study will be the first step for
determining a standard for TCM acoustic conditions, and even bring up a new research
area that focuses on TCM exclusively.
1.5. Disposition
This thesis consists of five chapters. In the first chapter, a brief introduction has been
made along with the argument behind the research and aim and objectives that it
possesses. The chapter is then followed by the contributions of the research and the
disposition of the whole study.
The second chapter presents previous work in the related field and a discussion about
conducted studies. After giving brief information in the field of architectural acoustics,
studies concerning objective and subjective acoustic parameters are introduced in
detail and acoustic evaluation methods are presented. Afterwards, a brief information
about Turkish classical music is given, which talks about the history of TCM along
with its musical characteristics and instruments.
The third chapter consists of analyses of song samples from western classical music,
opera and TCM. The songs are analyzed in terms of frequency spectra, musical
structure and dominant elements. The analyses are then compared with each other in
order to understand the similarities and differences between each other. Later,
inferences are made regarding the acoustic properties of TCM such as the optimum
reverberation times, early decay times and bass ratio.
5
In the fourth chapter, the materials and method of this study is given. First, three
performance spaces are modelled in Odeon room acoustics software and acoustic
measurements are made. Afterwards, anechoic TCM recordings are auralised to be
taken into a listening test. After the listening test, various attempts are made in a virtual
box trying to find out optimum acoustic conditions for TCM. Ultimately, a second
listening test is conducted from the outputs.
The fifth chapter consists of the results that are obtained in the study. Since the study
has yet to be conducted, there are no results available at the moment. However, it is
planned to achieve a better understanding in terms of perceptual effects and their
relationship between objective aspects of said spaces.
The final chapter which is the conclusion chapter, provides the reader with a brief
summary of the study. At the end of this chapter, the limitations for this study are
discussed and suggestions have been proposed for future studies.

7
CHAPTER 2
2. LITERATURE REVIEW
The second chapter lays out information gathered from earlier literature that is relevant
to the topic. The acquired data is presented under five sections. The first section talks
about basic principles of architectural acoustics to provide background information to
the reader. Afterwards, a second section about room acoustic parameters is introduced.
Objective and subjective parameters that are used in this thesis are explained in detail
and recommended optimum values are given. The third section informs the reader
about the design of performance spaces. Design criteria such as form, size and function
are discussed followed by examples of acoustic evaluation systems. Next is the fourth
section that focuses on Turkish classical music (TCM). Starting with the history of
TCM, the section investigates the main aspects and characteristics of TCM and
informs the reader about the types of instruments that are commonly used in TCM
along with the traditional performance spaces that were used for TCM in the Ottoman
period. The fifth and final section discusses a brief summary of all the literature and
points out inadequacies and lack of research on the subject.
2.1. Architectural Acoustics
After coming out of its source, sound travels through air and it is similar to how light
travels considering they both travel in straight lines and their intensity can diminish in
accordance to the distance travelled. However, while light has an imperceptible
vibration, sound is actually the vibration of matter. Thus, the properties of sound are
used in architecture, which creates the term of architectural acoustics (Elson, 1921).
In the words of Mommertz (2009), "acoustics is derived from the Greek word ακουειν
8
(akouein), which means "to hear", and is the branch of science that deals with sound,
including its generation, transmission, analysis and perception.". Architectural
acoustics has been around since more than 2500 years ago, when Pythagoras examined
musical relationships and Vitruvius worked on the acoustic design of amphitheaters.
In the modern era, acoustics became a scientific field of studies and in the 20th
century, room acoustics and building acoustics have been introduced to the field of
this science (Barron, 1993).
Hearing is a very complex mechanism for humans in terms of sensing acoustic signals.
The average hearing frequency range of a human is between 20Hz and 20000Hz
(Kleiner, 2012). According to Kleiner, higher frequencies and binaural hearing allow
for good directional hearing. Different frequencies, sound levels and timbres have
different effects on the human brain activity. Although "good acoustics" mostly refer
to well-designed concert halls or ancient theatres, every closed space has an acoustic
dimension (Kuttruff, 2006). As Mommertz (2009) puts it, "Hearing and understanding
are fundamental prerequisites for communication, and the acoustic feedback of an
interior for speech or music is essential; infiltrating noise is disturbing – and can even
be unhealthy." Usually, humans are not aware of the acoustic quality of a certain
space. However, when difficulties in perception -such as not being able to understand
speech or being in a noisy office environment- occur, they tend to get disturbed and
this usually has mental or even physiological consequences.
Architectural acoustics can be divided into two main categories: building acoustics
and room acoustics. Building acoustics deals with sound insulation and noise control.
Its primary purpose is to prevent unwanted sounds to travel and spread within the
building, whereas room acoustics is more concerned with how the propagation of
sound affects the listener's perception in a certain room (Beranek, 2004). The
perception of the listener depends on the properties of sound fields. They can be
related directly to the energy levels as well as the volume of the space in which the
sound is distributed, just as much as they can be time-dependent (Long, 2006).
9
According to Mommertz (2009), building acoustics deals with sound propagation
inside a building whether it should be from room to room, from outside to inside or
even from inside to outside. It is concerned with the prevention of unwanted acoustic
disturbance; or in other words, noise (Long, 2006).
Noise control can be done by proper application of acoustic insulation and in order to
achieve that, one must know the acoustic properties of building materials (Mommertz,
2009). Large and flat materials work well with absorbing lower-frequency sounds
while porous materials are highly efficient with high-frequency sounds (Long, 2006).
It is usually recommended that a balanced combination of both materials should be
used in order to obtain satisfactory noise control. It can be said that there are two main
types of sound propagation: airborne and structure-borne sound propagation (Kleiner,
2012).
If a sound is created in a room, this causes the surrounding elements to vibrate. These
vibrations are then transmitted to a bordering room, leading to an airborne sound.
Structure-borne sounds on the other hand are sounds when structural elements are
vibrated by means of direct mechanical actions such as walking on the floor or
operating machinery. This may be avoided by using absorbent materials where there
is direct contact with the sound source causing the noise (Mommertz, 2009).
We can understand that hearing experience does not rely on sound propagation alone,
but the design and perception of space, as well. Therefore, room acoustics should deal
with acoustic issues as well as sensible design (Mommertz, 2009). The study of room
acoustics involves many other cases such as architecture, art, music, physics,
engineering and psychology (Kleiner, 2012). We can examine room acoustics in two
categories: technical room acoustics and psychological room acoustics. Technical
room acoustics can be divided into three subcategories as well: geometrical, statistical
and wave theory room acoustics. As Kleiner suggests, all of these approaches need to
be fully understood to be able to successfully design the acoustic conditions in spaces.
10
2.2. Room Acoustic Parameters
Room acoustics deals with the satisfactory perception of a listener in a certain space,
as mentioned earlier. Each listener in an audience may have their individual subjective
experience in a space, and these subjective assessments determine whether or not the
audience is satisfied in said spaces in terms of acoustic quality. However, the use of
these subjective opinions in a scientific point of view is only possible by converting
the subjective outputs into objective parameters (Kara, 2009). Experiments done in
existent and simulated sound environments have resulted in the development of
objective acoustic parameters that correlate with relevant subjective opinions. These
parameters have been accepted as identifiers for perceiving acoustic quality and have
become standardized in most cases (Yüksel Can, 2012).
When examining a closed space, evaluation parameters can be broken down into two
main categories, one being the objective parameters which depend on individual
perception and the other being the measurable subjective parameters (Beranek, 2004).
2.2.1. Objective Acoustic Parameters
Subjective parameters in room acoustics are parameters that have absolute numerical
values, in contrary to subjective parameters. While previous research has presented
recommended values for these parameters, said values may differ according to the
practice (Barron, 1993). While this situation may cause deficient approaches in the
aim of obtaining certain values, it has been a guiding light in terms of acoustic quality.
Objective parameters can be associated with subjective parameters (Gade,2007).
For this study, the objective parameters that were investigated are: reverberation time
(RT), early decay time (EDT), clarity (C80), definition (D50), early lateral energy
fraction (LF80), late arriving lateral energy (LG80) bass ratio (BR) and treble ratio (TR).
11
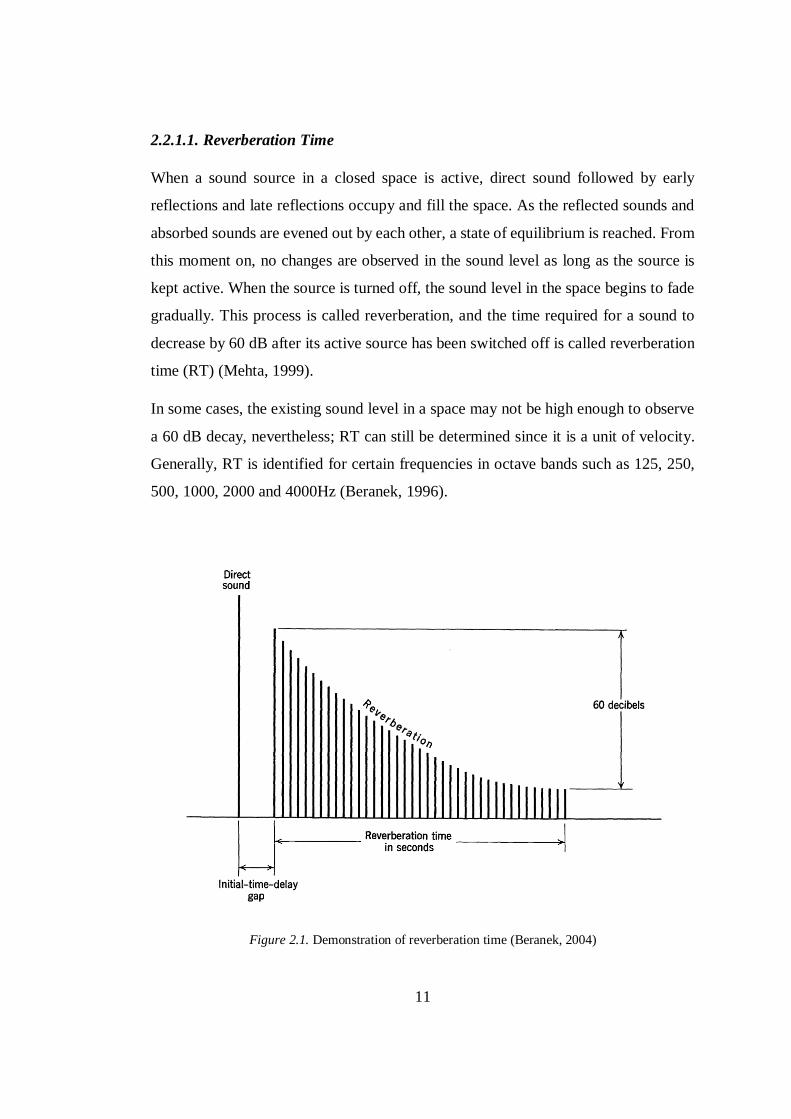
2.2.1.1. Reverberation Time
When a sound source in a closed space is active, direct sound followed by early
reflections and late reflections occupy and fill the space. As the reflected sounds and
absorbed sounds are evened out by each other, a state of equilibrium is reached. From
this moment on, no changes are observed in the sound level as long as the source is
kept active. When the source is turned off, the sound level in the space begins to fade
gradually. This process is called reverberation, and the time required for a sound to
decrease by 60 dB after its active source has been switched off is called reverberation
time (RT) (Mehta, 1999).
In some cases, the existing sound level in a space may not be high enough to observe
a 60 dB decay, nevertheless; RT can still be determined since it is a unit of velocity.
Generally, RT is identified for certain frequencies in octave bands such as 125, 250,
500, 1000, 2000 and 4000Hz (Beranek, 1996).
Figure 2.1. Demonstration of reverberation time (Beranek, 2004)
12
Earlier research relating to reverberation time has been done in the beginning of the
20th century by Walter C. Sabine who used to carry on with his studies as a physics
professor in Harvard University. After a request regarding on solving the acoustic
problems that were causing difficulties of intelligibility in the New Fogg Art Museum
auditorium, Sabine had started experiments in three of Harvard’s auditoriums.
Eventually, Sabine had come up with a theory about sound absorption qualities of
materials and had explained a relationship with material absorption and sound decay,
thus coming up with an equation for RT (Long, 2006). The outcomes of his studies
pointed out that in theory, RT is equal in the entirety of a space, independent of the
position of the sound source. The effect of an absorbent surface is also in theory
independent of its position in the space. By this means, the RT equation was developed
to only depend on the volume and total absorption (Beranek, 1996).
RT60 = 0.161 · V / A [2.1.]
RT60 = reverberation time in seconds
V = room volume in m3
A = α · S = equivalent absorption surface or area in m2
α = absorption coefficient
S = absorbing surface area in m2
A = α1 · S1 + α2 · S2 + α3 · S3 + ..
Sabine’s equation for RT is shown above. With this equation, the total absorption of
a space can be determined by multiplying surface areas by their relative absorption
coefficients and then adding the results together. By dividing the volume to this value,
the RT of a space can be determined. As can be figured out from the equation, RT
values differ according to the size and function of a space. An example of different
RT values for different sized spaces used for various purposes can be seen below in
Figure 2.2. (Maekawa, 1994).
13
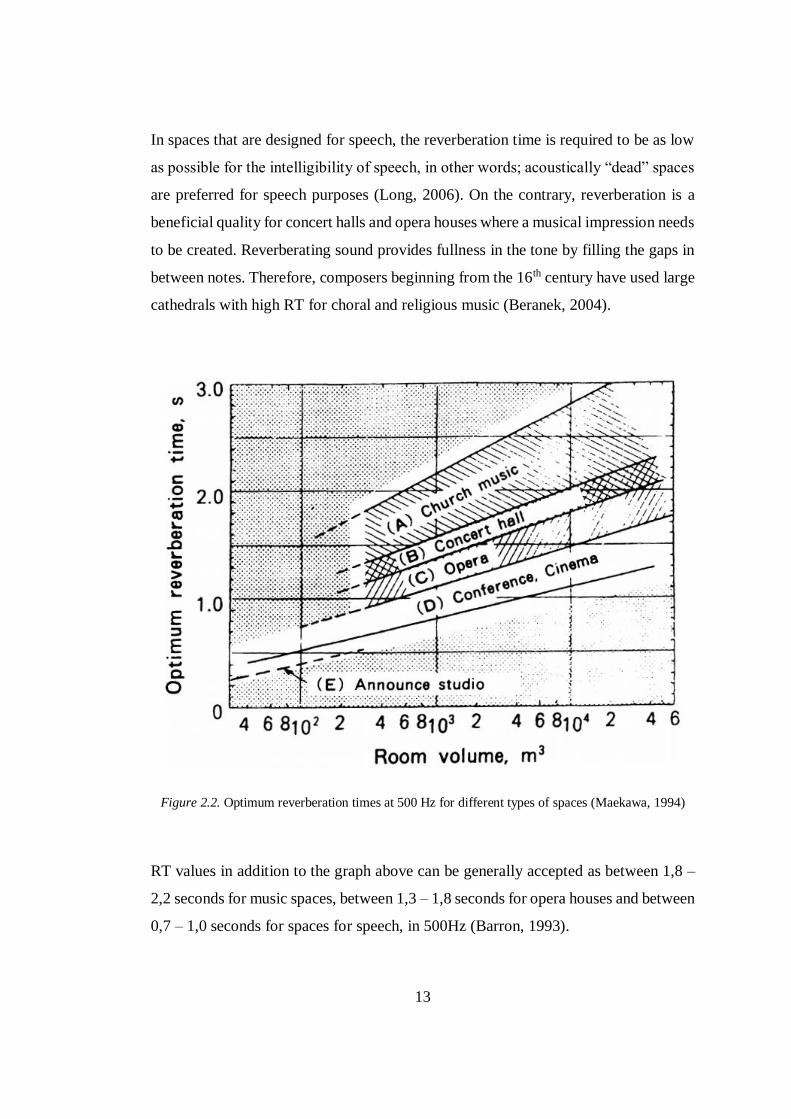
In spaces that are designed for speech, the reverberation time is required to be as low
as possible for the intelligibility of speech, in other words; acoustically “dead” spaces
are preferred for speech purposes (Long, 2006). On the contrary, reverberation is a
beneficial quality for concert halls and opera houses where a musical impression needs
to be created. Reverberating sound provides fullness in the tone by filling the gaps in
between notes. Therefore, composers beginning from the 16th century have used large
cathedrals with high RT for choral and religious music (Beranek, 2004).
Figure 2.2. Optimum reverberation times at 500 Hz for different types of spaces (Maekawa, 1994)
RT values in addition to the graph above can be generally accepted as between 1,8 –
2,2 seconds for music spaces, between 1,3 – 1,8 seconds for opera houses and between
0,7 – 1,0 seconds for spaces for speech, in 500Hz (Barron, 1993).
14
2.2.1.2. Early Decay Time
Earlier studies by Sabine and other researchers regarding reverberation time, have
suggested that the decay of the sound level after the source has been shut down
followed a constant decrease within the 60 dB decay process. However, applied
experiments in real concert halls have unveiled that this process might not be
homogenous. Since in speech and music, the subsequent later section of a
reverberation may be masked due to the upcoming sounds or notes, thus the sound
decay process can only be perceived within breaks. This situation has brought upon
an alternative parameter to RT, which is early decay time (EDT) that has yielded better
correlations with reverberation during ongoing music or speech (Gade, 2007).
Early decay time examines the initial decay part of the sound and allows a comparison
with RT. To be put on technical terms, EDT is defined by multiplying the time it takes
for sound to decrease from 0 dB to -10 dB with 6. The reason for multiplying the
duration with 6 is to provide a correlation with RT in order to make easier
comparisons. This way, differences between the earlier decreases in sound levels and
the reverberation times can be distinguished (Beranek, 1996).
In rooms where uniform sound distribution is observed, the RT and EDT values are
considerably close to each other, even equal in some cases. The sound decay process
is uniform and linear in these situations (Barron, 1993). However, in cases where the
sound distribution is uneven, sound decay diagrams show refractions despite RT
values being the same (Mehta et al, 1999).
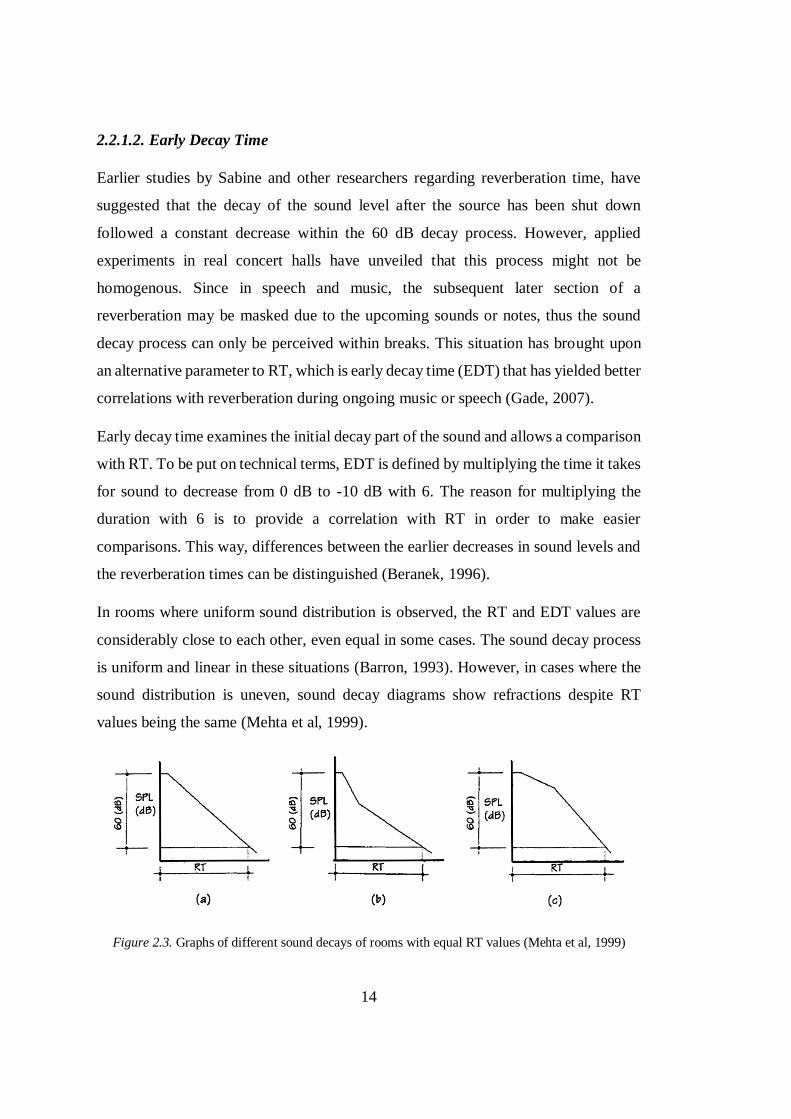
Figure 2.3. Graphs of different sound decays of rooms with equal RT values (Mehta et al, 1999)
15
Different sound decay diagrams of spaces with equal RT values by Mehta et al (1999)
are shown in Figure 2.3. Diagram (a) belongs to a space where uniform sound
distribution can be observed in such manner the EDT and RT values are equal, making
the decay in early and late reflections linear. On the other hand, diagram (b) shows
that the EDT and RT values are different from each other. In this case, early reflections
decay faster than late reflections, which can be interpreted as the EDT being shorter
than RT. The shorter EDT allows to prevent masking and shows an increase in
intelligibility and clarity. Lastly, diagram (c) shows a case where the EDT value is
higher than RT. This causes the sound to lose its intelligibility, but also makes the
musical feeling of envelopment to increase (Mehta et al, 1999). It was found out that
cases where EDT values are 1.1 times bigger than RT values yield the best acoustic
conditions in concert halls and opera houses (Beranek, 2004).
Even though EDT may be used to better express reverberance as opposed to RT, the
essential parameter is still considered as RT. The reason behind this is the fact that
most of the room acoustic parameters affiliate with RT and RT is also referred to in
regulations concerning room acoustics in structures (Gade, 2007).
2.2.1.3. Clarity
Being an important parameter for music, clarity (C80) is measured by dividing the
direct sound energy to the sound energy that is produced 80 milliseconds after the
initial sound. This parameter is also referred to as early-to-late sound index. Clarity
was first derived from the distinctness (D50) parameter that was found by Thiele in
1953. The distinctness parameter used 50 milliseconds as a time gap for speech
intelligibility, which was then changed to 80 milliseconds to be used for music by the
proposal of Reichardt in 1975, becoming what is used today as C80 (Barron, 1993).
As seen in the equation below, C80 is basically the ratio of early sound energy and late
sound energy. This equation was afterwards transformed to be used with speech, by
16
decreasing the time limit from 80 milliseconds to 50 milliseconds, creating the C50
parameter, which is directly linked to the D50 parameter (Beranek, 2004).
C80 = 10log (early sound energy / late sound energy) [2.2]
The clarity parameter is affected by the tempo of music, decreasing as the tempo
increases. This is caused by the increase of late sound energy (Barron, 1993).
Therefore, clarity is inversely proportional to the sound fullness in a room. Since
fullness is dependent on RT, C80 is inversely proportional to RT as well (Mehta, 1999).
Beranek (1996) has proposed that optimum C80 values vary between -4 dB and +4 dB
while Barron (2009) stated that optimum values may vary between -2 dB and +2 dB.
2.2.1.4. Early Lateral Energy Fraction and Late Arriving Lateral Energy
The early lateral energy fraction (LF80) parameter was first derived from subjective
tests where spatial impression (SI) was measured by a linear system. This parameter
is calculated by dividing the sound pressure level (SPL) of early lateral sounds to the
SPL of early omnidirectional sounds in the first 80 milliseconds coming after the direct
sound. Further studies have found out that LF80 can be correlated with the apparent
source width (ASW) which is a subjective parameter (Barron, 1993). The optimum
LF80 values that were proposed are between 0,15 – 0,20 for chamber music (Gade,
2007) and 0,10 – 0,35 for classical music (Long, 2006).
Studies done by Bradley and Soulodre (1995) have showed that late arriving lateral
energy (LG80) is directly connected to the subjective acoustic parameter Listener
Envelopment (LEV). It was found out that LEV could solely be observed under
situations where LG80 is present. It was also found out that listeners’ ability to
distinguish the effects of early lateral reflections would decrease in the presence of
late arriving lateral energy (Bradley & Soulodre, 1995).
17
2.2.1.5. Bass Ratio and Treble Ratio
Bass ratio (BR) is the ratio of the RT in low frequencies to the RT of mid frequencies.
It can be calculated by dividing the sum of RT in 125Hz and 250Hz to the sum of RT
500Hz and 1000Hz. Treble ratio is the ratio between the sum of RT in 2000Hz and
4000Hz and the sum of 500Hz and 1000Hz (Everest & Pohlamann, 2009). Bass ratio
is used to determine the subjective parameter “warmth” in rooms. The equation for
bass ratio is presented below (Barron, 1993).
BR = (T125Hz + T250Hz) / (T500Hz + T1000Hz) [2.3]
In spaces with RT values of 1.8 seconds and higher, the recommended BR value varies
between 1.1 and 1.25. For spaces with RT lower than 1.8 seconds, BR values between
1.1 and 1.45 is recommended. Rooms with BR values lower than 1.0 lack of warmth.
On the other hand, BR values that are too high should be avoided (Mehta et al, 1999).
2.2.2. Subjective Acoustic Parameters
Subjective parameters cannot be measured or calculated, unlike objective parameters.
Physically measurable values may give predictable results in room acoustics,
however; it is not an easy task to make assumptions based solely on measured values.
While one listener in a room might consider the acoustic quality sufficient, another
may think of it as inadequate, thus pointing out different acoustic characteristics in a
room. Therefore, subjective parameters should be taken into consideration just as
much as objective parameters when it comes to acoustic design (Barron, 1993).
For this study, the following subjective parameters are used: definition and clarity,
reverberance, warmth, intimacy, listener envelopment and balance.
18
2.2.2.1. Definition and Clarity
Musically speaking, definition and clarity are terms with similar meaning. Both
describe the circumstance where the sounds during a musical performance could be
distinguishable from each other. There are two types of clarity: horizontal clarity and
vertical clarity (Beranek, 2004).
Horizontal clarity can be explained as the distinguishability of subsequent sounds. The
performer or composer can determine the musical qualities that affect clarity such as
tempo, repetition of notes and relevant loudness of successive notes in their own
preference. Objective acoustic parameters that affect clarity are reverberation time
(RT) and early decay time (EDT) (Beranek, 1996).
Vertical clarity, on the other hand, is a parameter that defines the ability to tell apart
simultaneously played sounds, which relies on the performer/composer, room acoustic
quality and the hearing level of the listener. The composer may define vertical clarity
by choosing the notes that would be played together, the notes surrounding them and
the instruments these notes would be played on. Vertical clarity determines the
harmony between different instruments and early decay time, as well (Beranek, 1996).
2.2.2.2. Reverberance
In a room, as mentioned earlier in objective acoustic parameters, after the initial direct
sound and the following reflections occur, the total sound energy in the room start to
remain constant. Later, when the sound source is shut down, the reflected sounds begin
to decay gradually. This process is called reverberation (Türk, 2011).
Reverberance is the subjective equivalent of RT and is particularly related to indoor
sounds. When a note is played, for instance, the listener first hears the direct sound
coming from its source, and the reflected sounds afterwards. The value of
reverberance is directly dependent on RT (Beranek, 2004).
19
2.2.2.3. Warmth
Musical warmth is defined as the liveness of bass or the fullness of the bass tone
relative to the mid frequency tone. The warmth of the bass tone can be achieved if the
RT of low frequencies between 125 – 250Hz are longer than the RT of mid frequencies
between 500 – 1000Hz. On the contrary, if this ratio between low and mid frequencies
is too high, irregularities between sounds may occur and may cause what can be called
“humming” sounds. The subjective warmth parameter is directly linked to the
objective bass ratio parameter (Beranek, 1996).
2.2.2.4. Intimacy
The visual intimacy in a room depends on how the users perceive the surroundings of
the room as they were close. The same case applies to sound, meaning it is perceived
as it was coming from a nearby surface, which is called acoustic intimacy. If music
played in a small room also sounds as if it is being played in a small room, thereby the
said room has acoustic intimacy. The indicator of a listener’s impression on the size
of a room is the time between the direct sound and the first reflection which is the
initial time delay gap parameter (ITDG) (Beranek, 2004).
While Beranek (2004) correlates intimacy with ITDG, it was later found out that
intimacy also relies on the room volume. Smaller volumes yield shorter ITDG values,
thus the intimacy feeling is stronger in smaller rooms. Shorter values of ITDG also
point out to shorter EDT values. Therefore, as EDT values decrease, intimacy is
increased (Long, 2006).
2.2.2.5. Listener Envelopment
Listener envelopment (LEV) can be described as the listener’s feeling of being
surrounded by sound and music around them. Research has found out that LEV could
be linked to RT, EDT, C80, LF80 and LG80 individually. Each parameter has a different
20
level of effect on LEV. While RT, EDT and C80 have significantly less effect on the
assessment of LEV, LF80 and LG80 were discovered to be highly correlated with it.
Studies have shown that there is a 97% consistency between LEV and LF80, while
LEV and LG80 have a consistency of 99,7% in between. Therefore, the LG80 parameter
is considered to be the most reliable for measuring LEV (Bradley & Soulodre, 1995).
2.2.2.6. Balance
A well balanced acoustic space requires for the orchestral sections and the solo
musicians to be in harmony with each other. Balance might be lost from time to time
in a performance, which may be caused by the stage being on center, being too close
the musician during certain parts of a performance, or a solo performance not being
supported sufficiently. Alongside, balance depends on the musicians and their seating
on the stage, and the authority of the conductor. Furthermore, the balance in an opera
house between the orchestra and the singers relies on stage design, support of early
reflections to the singer and the design of the orchestra pit (Beranek, 2004).
2.3. Specifications of Performance Spaces
This section talks about essential information that is needed when designing spaces
where listening is the key function, such as physical conditions of a room and the
required acoustic parameter values. Afterwards, acoustic evaluation examples from
different studies and researchers are presented.
2.3.1. Acoustic Design Criteria
Architectural acoustic design has developer over the years all the way from ancient
Greek theaters to multi-purpose halls of the 20th century. Recent studies have made it
possible to achieve a better understanding between overall acoustic quality and the
21
geometrical characteristics of a room. Design parameters such as form and size affect
objective acoustic parameters, hence having an impact to determine subjective
influence in performance spaces (Kwon & Siebein, 2007).
Rooms with different functions require different needs in terms of design. In rooms
for speech, the main goal is for the listener to understand the speaker, in other words,
clarity, along with preserving the ability to locate the position of the sound source
which is most essential for theaters. Rooms for music, on the other hand, have five
different parameters for optimum values to be provided (Hawkes & Douglas, 1970).
These five parameters are as follows:
Room size
Room shape
Purpose of use
Stage proportions
Design of the audience area
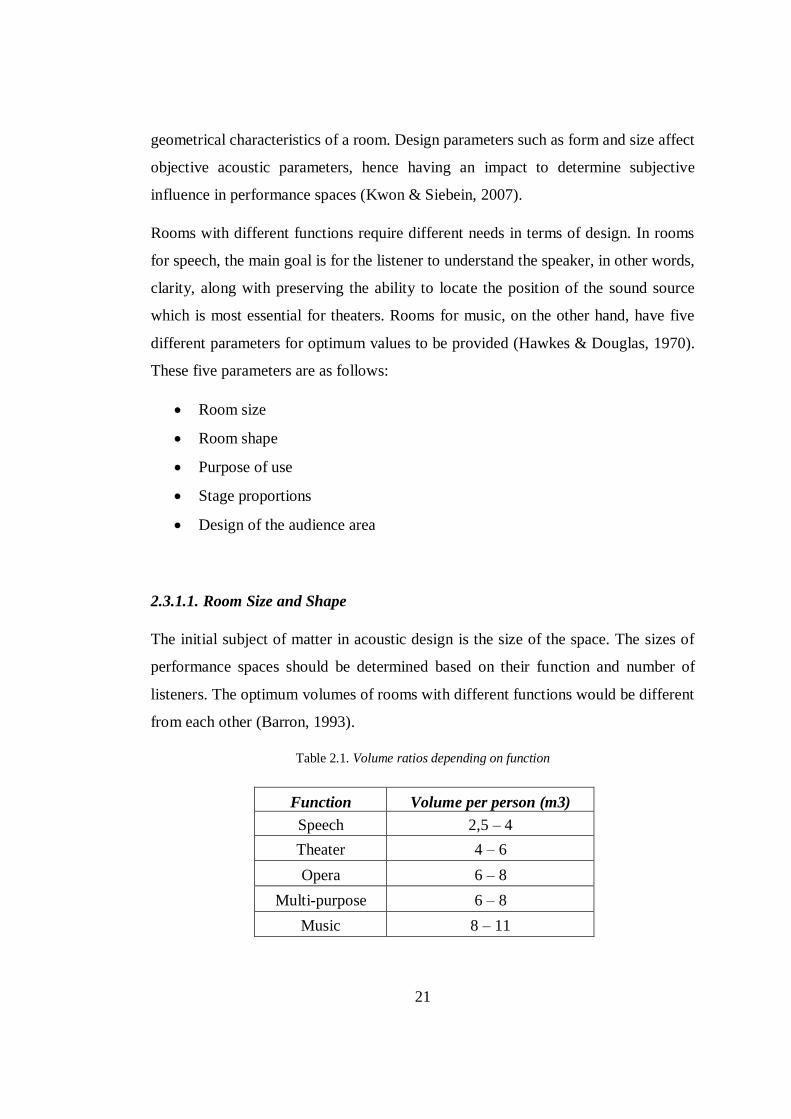
2.3.1.1. Room Size and Shape
The initial subject of matter in acoustic design is the size of the space. The sizes of
performance spaces should be determined based on their function and number of
listeners. The optimum volumes of rooms with different functions would be different
from each other (Barron, 1993).
Table 2.1. Volume ratios depending on function
Function Volume per person (m3)
Speech 2,5 – 4
Theater 4 – 6
Opera 6 – 8
Multi-purpose 6 – 8
Music 8 – 11
22
As air itself has an absorbent tendency for frequencies of 1000Hz and higher, room
size affects total absorption and RT values. Studies have shown that the required
volume per person varies depending on the function (Kuttruff, 1991). Examples
showing optimum volumes per person is presented above in Table 2.1.
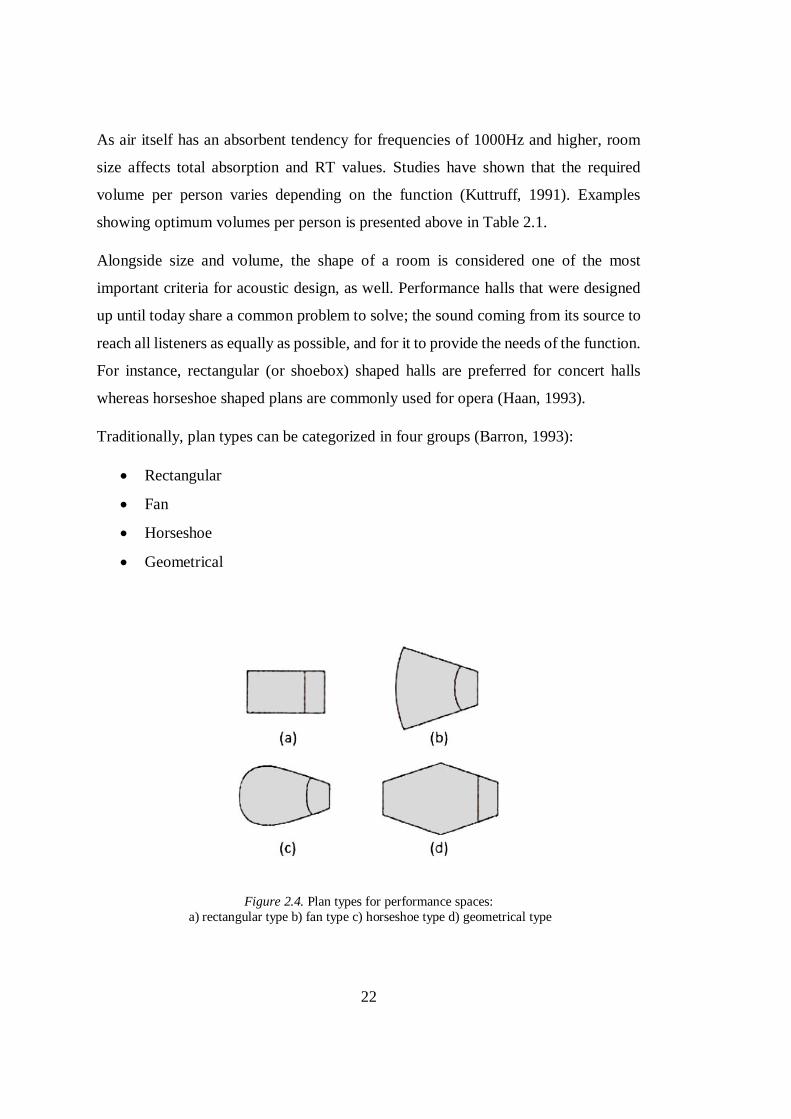
Alongside size and volume, the shape of a room is considered one of the most
important criteria for acoustic design, as well. Performance halls that were designed
up until today share a common problem to solve; the sound coming from its source to
reach all listeners as equally as possible, and for it to provide the needs of the function.
For instance, rectangular (or shoebox) shaped halls are preferred for concert halls
whereas horseshoe shaped plans are commonly used for opera (Haan, 1993).
Traditionally, plan types can be categorized in four groups (Barron, 1993):
Rectangular
Fan
Horseshoe
Geometrical
Figure 2.4. Plan types for performance spaces:
a) rectangular type b) fan type c) horseshoe type d) geometrical type
23
The rectangular or horseshoe plan type has been considered the most trustable design
method for performance halls, along with its convenience of construction, as long as
appropriate sizes are chosen. The parallel lateral walls provide adequate early and late
reflections thus increasing spatial impression (Long, 2006). However, as the size and
the number of listeners increases, the width and depth of the room increases as well,
causing a decay in the sound level through the back areas of the space (Egan, 2007).
Fan type halls are usually preferred as the room size increases. The biggest benefit
gained from fan type halls is the ability to place more listeners closer to the stage by
enlarging the sides. This however, brings a disadvantage along. Since the rear wall is
concave shaped, an acoustic problem called focusing might occur. This may be solved
by placing scattering materials on the rear wall, or changing the center of focus on the
rear wall by manipulating the radius of the concave (Everest & Pohlamann, 2009).
Horseshoe plan types are used mostly for opera houses, rather than concert halls.
Listeners are seated along the walls to provide further absorption and sound can reach
all listeners homogenously, as well. These types of halls might also suffer from a
problem of focusing (Beranek, 2004).
Geometrical plans today are designed by incorporating together different aspects of
the traditional plan types, such as using parallel lateral walls with a concave rear wall
or rooms with complex geometries that have walls that are placed in different angles
to form uneven shapes (Kwon & Siebein, 2007).
Despite the fact that ideal forms and shapes are present for each function and design,
there are some common design criteria that all of the aforementioned plan types
suggest. Rooms with too large depth or rooms that are too wide with little depth should
be avoided. Places that are close to the stage should be more reflective as well as
lateral walls, while rear walls should have absorbent materials. Parallel surfaces
should be covered with scattering material in order to prevent lateral echoes and
finally, low ceilings should be avoided (Mehta et al, 1999).
24
2.3.1.2. Purpose of Use
There are a number of purposes of use that are needed in a performance space. While
a space may be designed in the aim of serving a single purpose, having a flexible
design that allows the space to be used for multiple purposes might also be the case.
The first step is to determine the initial purpose of a performance hall (Barron, 1993).
For concerts, the situation might change depending on the type of orchestra, such as a
symphony orchestra that includes an average of 90 people or chamber orchestras
which include 10 – 12 musicians up to 40 – 50 in some cases. Recitals on the other
hand, are the smallest scaled musical performance which consist of solo singers and
virtuosos (Kuttruff, 2006).
Theatre or drama generally includes more than 12 performers; however, it might vary
between 2 to 20 people depending on the play. Operas, ballets and musicals
occasionally consist of singers, dancers, choirs and an orchestra. They require specific
stage design alongside an orchestra pit and storages/warehouses for décor. The stage
is usually divided with a curtain (Egan, 2007).
2.3.1.3. Stage Proportions
Stage form and size is an important subject in terms of creating suitable acoustic
conditions for the musicians and affecting how these conditions are perceived by the
audience. It is essential for the musicians to hear each other effectively and receiving
positive feedback from the audience. A stage shell that envelops the orchestra is
considered to be effective on the subjective and objective evaluations of the room and
the acoustic performance of the musicians (Gade, 1989).
The stage walls and ceiling is also an essential part of the process of reflecting sounds
to the audience. Additionally, if the stage is designed too wide, listeners on the sides
of the stage might hear instruments that are closer to them before the ones that are not.
On the contrary, if the stage is too deep, sounds of the instruments from the back line
25
of the orchestra might reach the audience with a time delay (Mehta et al, 1999). In
order to avoid these circumstances, it is acceptable to design a stage that assures
optimum conditions, instead of a sizable stage. For symphony orchestras, a stage
platform that is 16,7 meters to 12,2 meters is generally recommended. An area of 150
meter squares is adequate for an orchestra of 100 people. Moreover, the ceiling of the
stage should not be any higher than 6 – 8 meters (Beranek, 2004). Ultimately, the stage
floor should be elevated from the audience area in order to accommodate both visual
and acoustic comfort. However, this elevation may not be higher than 1,05 meters,
since it would break line of sight for the initial rows of the audience (Barron, 1993).
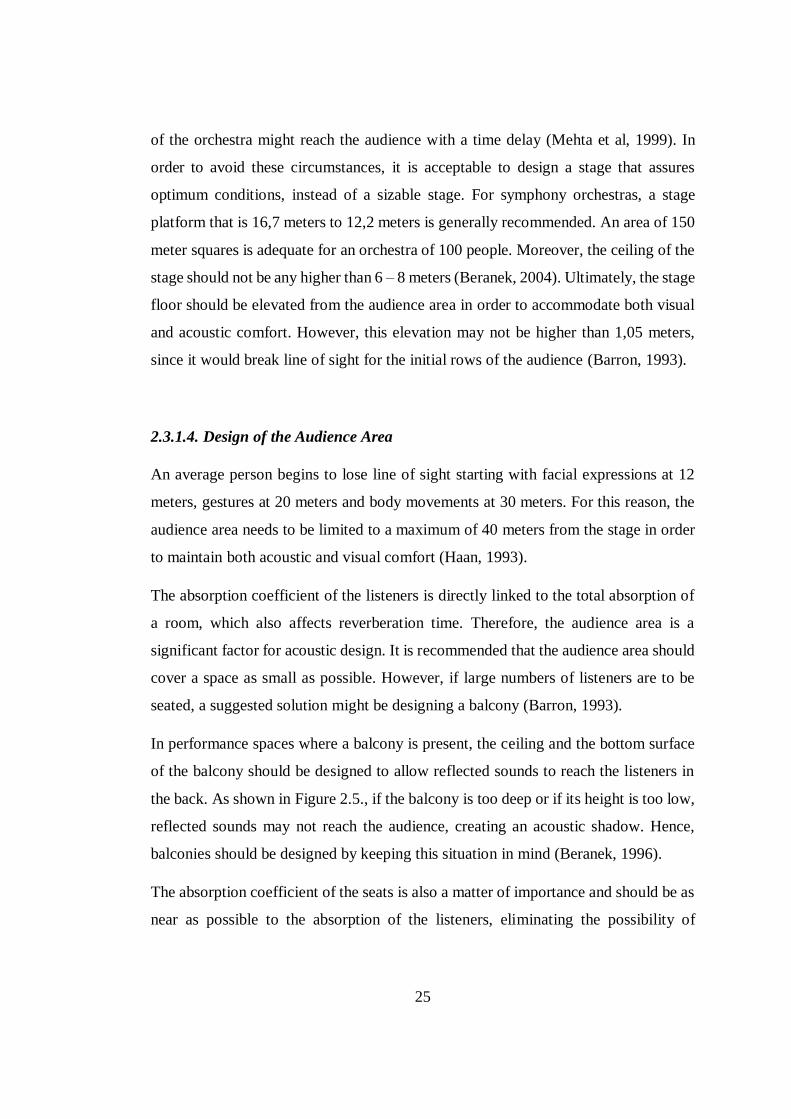
2.3.1.4. Design of the Audience Area
An average person begins to lose line of sight starting with facial expressions at 12
meters, gestures at 20 meters and body movements at 30 meters. For this reason, the
audience area needs to be limited to a maximum of 40 meters from the stage in order
to maintain both acoustic and visual comfort (Haan, 1993).
The absorption coefficient of the listeners is directly linked to the total absorption of
a room, which also affects reverberation time. Therefore, the audience area is a
significant factor for acoustic design. It is recommended that the audience area should
cover a space as small as possible. However, if large numbers of listeners are to be
seated, a suggested solution might be designing a balcony (Barron, 1993).
In performance spaces where a balcony is present, the ceiling and the bottom surface
of the balcony should be designed to allow reflected sounds to reach the listeners in
the back. As shown in Figure 2.5., if the balcony is too deep or if its height is too low,
reflected sounds may not reach the audience, creating an acoustic shadow. Hence,
balconies should be designed by keeping this situation in mind (Beranek, 1996).
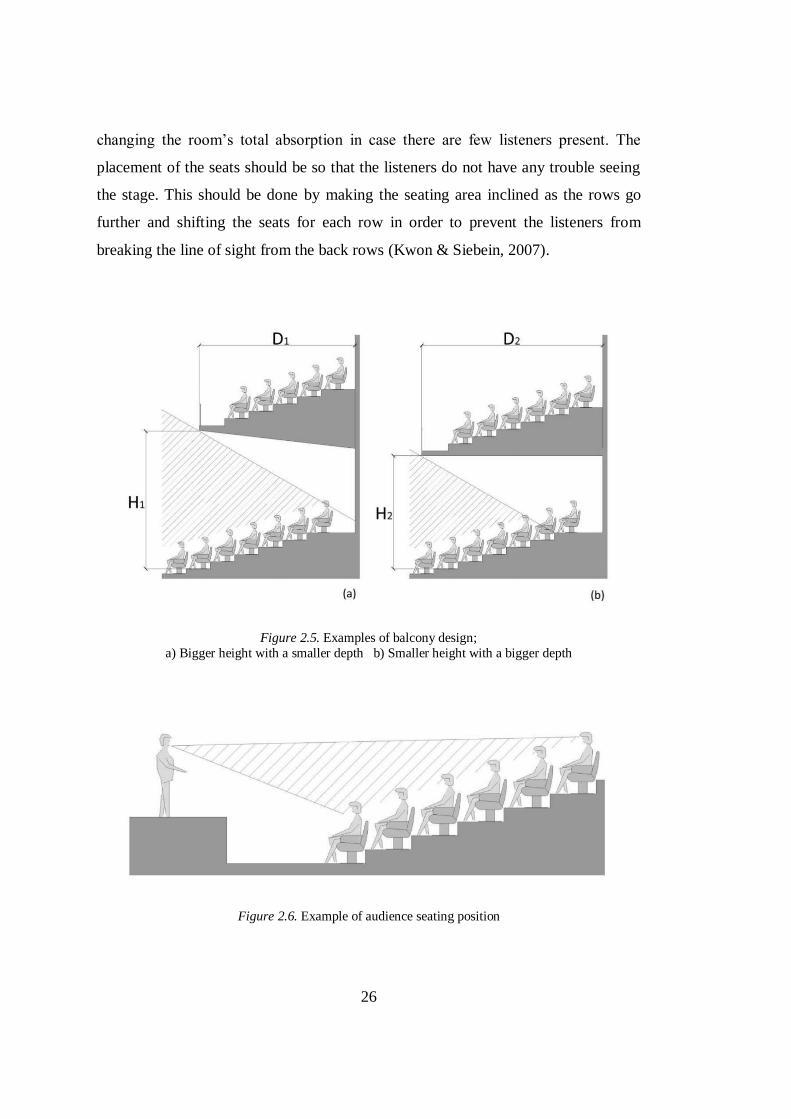
The absorption coefficient of the seats is also a matter of importance and should be as
near as possible to the absorption of the listeners, eliminating the possibility of
26
changing the room’s total absorption in case there are few listeners present. The
placement of the seats should be so that the listeners do not have any trouble seeing
the stage. This should be done by making the seating area inclined as the rows go
further and shifting the seats for each row in order to prevent the listeners from
breaking the line of sight from the back rows (Kwon & Siebein, 2007).
Figure 2.5. Examples of balcony design;
a) Bigger height with a smaller depth b) Smaller height with a bigger depth
Figure 2.6. Example of audience seating position
27
2.3.2. Acoustic Evaluation of Performance Spaces
There are many systems for the acoustic evaluation of performance spaces, which vary
from one acoustician to another. This is mainly due to the importance of a certain
acoustic parameter for a certain acoustician. Therefore, every acoustician has their
own evaluation system. Some examples that are globally acknowledged are presented
in this section of this thesis.
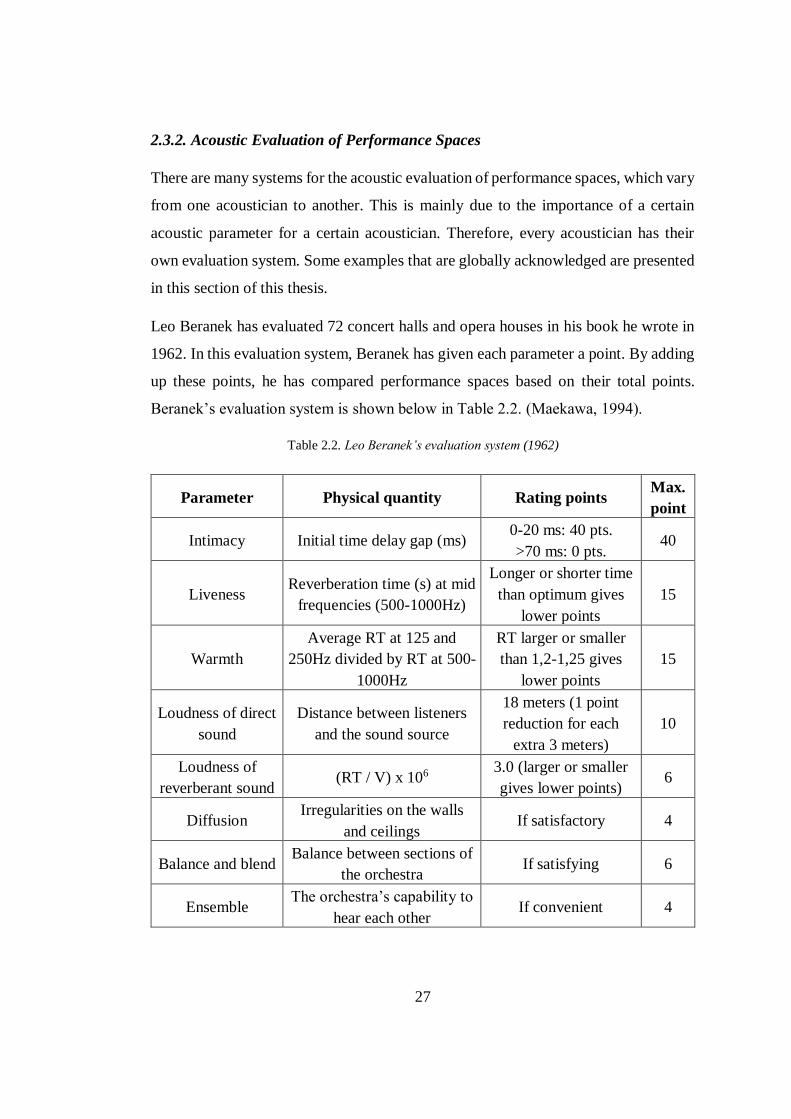
Leo Beranek has evaluated 72 concert halls and opera houses in his book he wrote in
1962. In this evaluation system, Beranek has given each parameter a point. By adding
up these points, he has compared performance spaces based on their total points.
Beranek’s evaluation system is shown below in Table 2.2. (Maekawa, 1994).
Table 2.2. Leo Beranek’s evaluation system (1962)
Parameter Physical quantity Rating points Max.
point
Intimacy Initial time delay gap (ms) 0-20 ms: 40 pts.
>70 ms: 0 pts. 40
Liveness Reverberation time (s) at mid
frequencies (500-1000Hz)
Longer or shorter time
than optimum gives
lower points
15
Warmth
Average RT at 125 and
250Hz divided by RT at 500-
1000Hz
RT larger or smaller
than 1,2-1,25 gives
lower points
15
Loudness of direct
sound
Distance between listeners
and the sound source
18 meters (1 point
reduction for each
extra 3 meters)
10
Loudness of
reverberant sound (RT / V) x 106
3.0 (larger or smaller
gives lower points) 6
Diffusion Irregularities on the walls
and ceilings If satisfactory 4
Balance and blend Balance between sections of
the orchestra If satisfying 6
Ensemble The orchestra’s capability to
hear each other If convenient 4
28
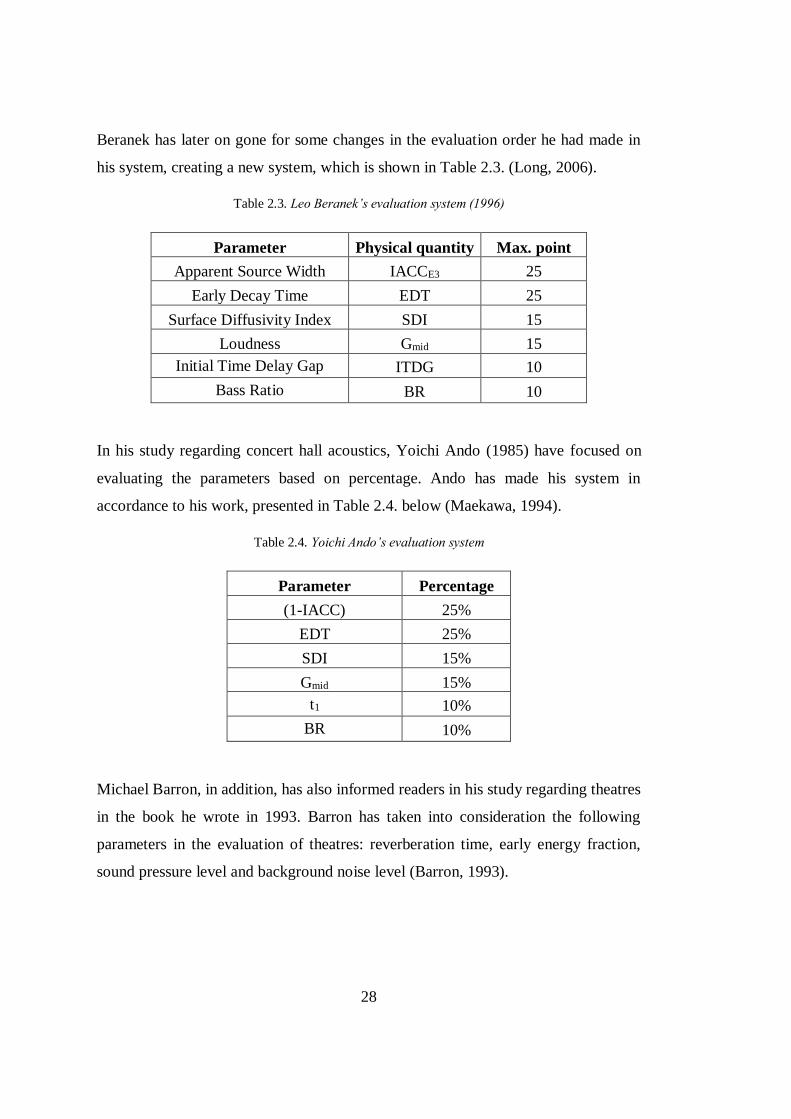
Beranek has later on gone for some changes in the evaluation order he had made in
his system, creating a new system, which is shown in Table 2.3. (Long, 2006).
Table 2.3. Leo Beranek’s evaluation system (1996)
Parameter Physical quantity Max. point
Apparent Source Width IACCE3 25
Early Decay Time EDT 25
Surface Diffusivity Index SDI 15
Loudness Gmid 15
Initial Time Delay Gap ITDG 10
Bass Ratio BR 10
In his study regarding concert hall acoustics, Yoichi Ando (1985) have focused on
evaluating the parameters based on percentage. Ando has made his system in
accordance to his work, presented in Table 2.4. below (Maekawa, 1994).
Table 2.4. Yoichi Ando’s evaluation system
Parameter Percentage
(1-IACC) 25%
EDT 25%
SDI 15%
Gmid 15%
t1 10%
BR 10%
Michael Barron, in addition, has also informed readers in his study regarding theatres
in the book he wrote in 1993. Barron has taken into consideration the following
parameters in the evaluation of theatres: reverberation time, early energy fraction,
sound pressure level and background noise level (Barron, 1993).
29
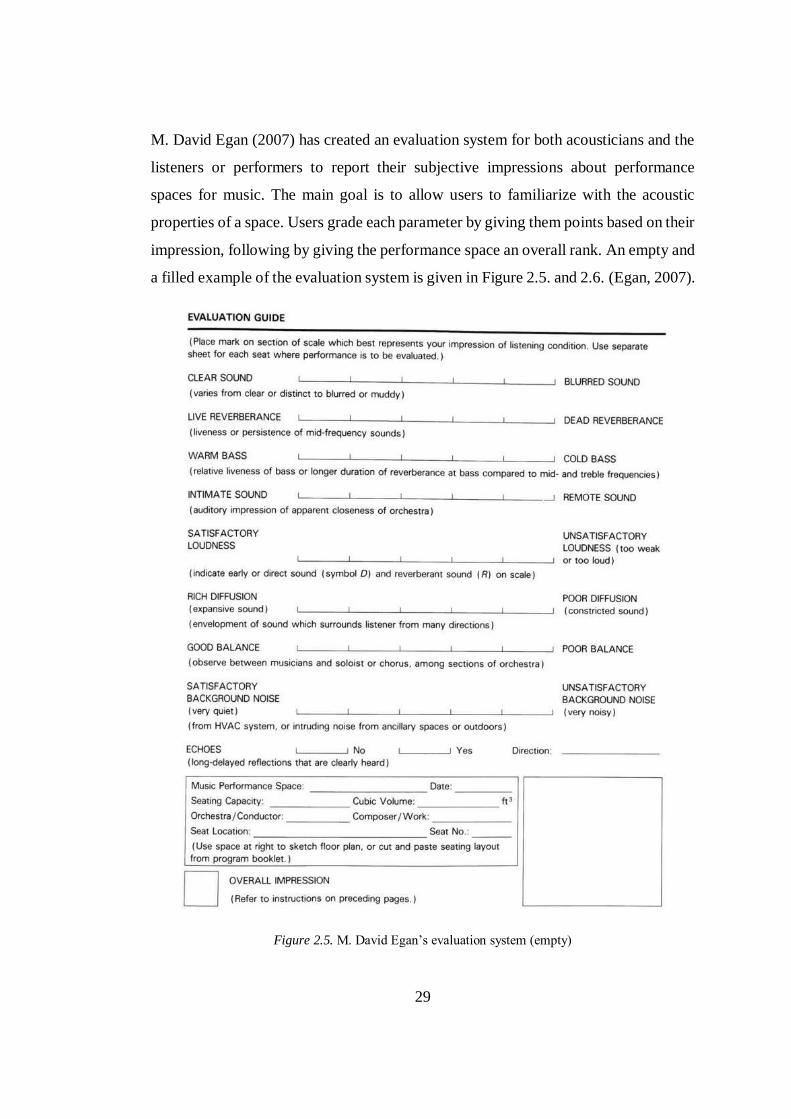
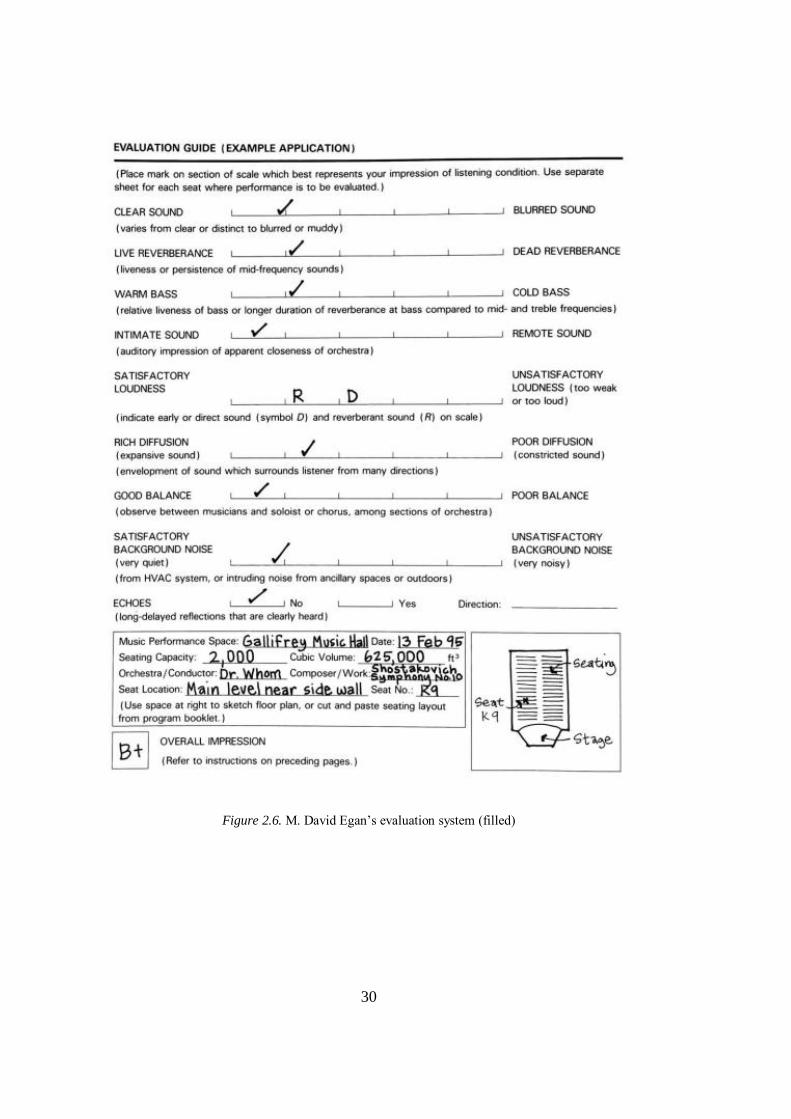
M. David Egan (2007) has created an evaluation system for both acousticians and the
listeners or performers to report their subjective impressions about performance
spaces for music. The main goal is to allow users to familiarize with the acoustic
properties of a space. Users grade each parameter by giving them points based on their
impression, following by giving the performance space an overall rank. An empty and
a filled example of the evaluation system is given in Figure 2.5. and 2.6. (Egan, 2007).
Figure 2.5. M. David Egan’s evaluation system (empty)
30
Figure 2.6. M. David Egan’s evaluation system (filled)
31
2.4. Brief Information on Turkish Classical Music
In this section, Turkish classical music (TCM) is examined, starting with the
chronological timeline of TCM beginning from the origins of Turkish music followed
by the Ottoman period and up to this day. Afterwards, the characteristics of TCM is
inspected in terms of musical aspects and instruments. Finally, some examples are
given from the places that TCM was performed during the Ottoman period.
2.4.1. History of Turkish Classical Music
The history of Turks is known to descend as far as the Altais. (Özgür & Aydoğan,
2015). Since the ancient times, the Turks have scattered over a wide area on Asia,
creating their own cultural values as well as integrations with different cultures such
as Chinese, Persian, Indian, Arabic and Bizantian, creating the stepping stones of the
values of today (Yener, 2014). The evolution, transformation and development of
music throughout history can be commonly linked to the social structure of a
commune (Körükçü, 1998). History of music can also be defined as humanity’s way
of expressing their ways of living and epochal emotions and ideas through the use of
instruments and sounds (Özgür & Aydoğan, 2015). Thus, it can be considered
essential that the Turkish communal structure has to be clarified in order to understand
today’s Turkish classical music (Körükçü, 1998).
Turkish music is without a doubt an influential aspect of Turkish culture, carrying the
traces of a rich cultural heritage (Yener, 2014). Yener states that the Turkish history
of music is not a scientific area that was researched comprehensively to this day. Some
historians and musicologists assume that music in Turks has been a part since the
origins of Turkish history, while others talk about a musical history of 6000 years in
Turks. Since it was difficult to obtain written documents before the last 1500 years, of
Turkish history, cultural and social data on the previous periods are quite limited
(Körükçü, 1998).
32
When viewed in chronological order, it can be seen that the Turkish culture has
reached today via five different periods which are Central Asia, Ancient Anatolia
(Mediterranian and Aegean), Islam, the Ottoman era and finally western culture (Can
& Levendoğlu, 2002). In the very beginning, like in other primitive societies, there
have been individuals who have undertaken the roles of an enchanter, healer or bard
in the Altai commune. These people were called shamans and the music they made
was described as shamanic music. The shamans, having a strong impact on society,
used to sing hymns and requiems on important days for the society (Uçan, 2000).
Research shows that the Altai melodies which first started on two frets, reaching to
four frets in time, were simple melodies despite the varieties in rhythm, and human
voice stood out among the instruments (Özkan, 2013). The very first accompanying
instruments were found to be the drum and def, furthermore it is considered that the
horn (boru) and lute (kopuz) have taken their first forms in the Altai era.
The first written documents regarding central Asian music were believed to be
gathered from Chinese sources. According to these sources, travelling Turkish
musicians would stay at Chinese palaces for long periods and have gained reputation
while doing so. The relationship with the Chinese has especially increased during the
Hun Empire, thus creating mutual cultural interactions (Malm, 1967). According to
Malm, musical movements originating from centers of commerce like Hotan, Kuça
and Turfan have affected China significantly, making western Turkistan music
influential in northern China. It is also known that during the Hun Empire period,
according to old Turkish tradition, women and men would dine and play instruments
together in holidays and celebrations (Özgür & Aydoğan, 2015). Another important
tradition seen in central Asia beginning from the Hun period was the establishment of
the brigadier (tuğ) party. This custom that uses the drums and banners as a symbol of
power has stretched all the way up to the Ottoman era, resulting in the birth of the
janissary band (mehter) tradition (Selanik, 1996).
Central Asia has been an important core for musical relationships throughout the Silk
Road between the Near East and the Far East. Musical instruments and styles have
33
been transported and have spread across settlements between caravan trails (Can,
2001). The Islamic period which started with the Arabic invasion in the closing of the
8th century has brought a new Near Eastern influence upon central Asia. Followinf this
century, Islam has started to spread across the Turks (Lewis, 1968). From the first
years of Islam, a new kind of music has started to arise with the mingling and blending
of musical aspects of Arabic, Greek, Iranian and Turkish nations (Ugan, 1988).
Turkish classical music has emerged as a product of urban culture and comprises of
folk music, military music, religious music and classical music (Turabi, 1993). After
moving from the nomadic lifestyle into sedentary living, urbanization has accelerated
and writing has become literature. The effects of Arabic and Persian culture has also
reflected upon language, making it possible to see these changes in the terminology
of traditional TCM (Levendoğlu, 2005). Al-Farabi, the great physician and
philosopher who lived in the 10th century has also had an interest in musical lore and
had written “Kitab’ül Musiki el Kebir” (The Great Book of Music) in Persian, which
is considered the most important literary piece about eastern music theory. Another
important person in Turkish music, İbn-i Sina has also used Persian language when
talking about music theory (Yener, 2014). After the translation of Greek musical
pieces beginning from the 10th century, the physical and mathematical attributes of
music have also started to be researched (Turabi, 2004). Turabi explains in his words
that “Even though the thinkers of Islam have been influenced by Greek science and
philosophy, they have enriched the present inheritance and thus have created and
original musical literature”.
The central Asian music culture which developed throughout the 8th and 13th century
and have widespread across China, central Africa and the Caucasus, has reached its
peak in the 14th century, only having to slowly lose its old value around the 15th
century. Therefore, Islamic societies, mainly the Turks, Arabs and Persians have
started establishing their own musical formations, each having their own personal
characteristics (Can, 2001). It is considered that the starting period of what we accept
TCM as of today has been built upon the time when the Ottomans became settled in
34
palaces, which was towards the end of the 15th century (Körükçü, 1998). During this
period, Hz. Mavlana and his mevlevi cult was an essential starting point for the
development of Turkish music, followed by the southern Azerbaijani Turk Safiyuddin
Urmevi who wrote two books about music in Arabic: “Kitabü’l Edvar” and
“Risayetü’ş Şerefiye” (Yener, 2014). Another Azerbaijani Turk named Meragalı
Abdulkadir has written six consequent books about Turkish music which are in the
following order: “Cami’ul Elhan”, “Makasid’ul Elhan”, “Şerh’ul Kitab’ul Edvar”,
“Fervaid-i Aşere”, “Zübbet’ül Edvar” and “Kenz’ül Elhan” (Körükçü, 1998).
According to Körükçü, these six books are the foundations of future studies and are
an influential source for knowledge about TCM in the past. In this period, Turkish
music which had the traces of old traditions, has blended the values of Islamic culture
into its fibre, creating the background of the style remembered as TCM today.
Traditional formations that were brought from central Asia have formed into makams
over time, becoming richer and richer.
During the 15th century, science and arts has progressed with the support from the
palace and the sultans of the period. Musicians from across the globe have travelled
to the Ottoman Empire, gathering in capitals such as İstanbul, Edirne and Bursa. The
first examples of musical literature written in Turkish were found in this time period
(Levendoğlu, 2005). The Enderun school of music that was established in Topkapı
Palace was considered the biggest education center during the period where music was
passed on via teacher-apprentice relationship (meşk) and where Turkish music was
institutionalized and gained classical property (Körükçü, 1998). Another important
establishment that used to give musical education were the Mevlevi lodges
(Mevlevihane) where not only mevlevi music was taught, but non-religious and
religious music, along with supporting practices such as literature and language were
taught as well, followed by military lodges (Mehterhane) where the mehter tradition
from the Hun Empire period was passed on (Ak, 2014). Music was also taught in
dervish lodges (tekke), mosques and coffee houses which are briefly explained in the
Section 2.3.3. of this chapter.
35
Following with the 16th century, the classical style has formed in Turkish music,
growing apart from the Persian/Iranian influence to a more local style. Moreover, old
musical patterns have changed along with the instruments, makams have been
redefined, religious music has started to shape into unique forms and pieces were
written in Ottomani Turkish instead of Arabic and Persian (Behar, 2015). The 17th
century is considered as a critical point for Turkish music due to the fact that it had
influenced the following centuries in terms of musical history (Gürbüz, 2010). During
this period, musicians from abroad have come to Istanbul to both teach and learn about
music where they were introduced to military “mehter” music which they further on
were influenced by to form bands similar to mehter (Tanrıkorur, 2011).
After the 18th century had arrived, Turkish music has continued to thrive while
composers kept sticking to the customs of classical style and adding some
improvements to it, making the classical period reach its peak. Between the years 1718
and 1730, an era of tranquility and peace called the Lale (Tulip) Period had taken
place, where relations with Europe have been increased, causing the start of a
“westernization” time for the Ottoman Empire. These changes in trade, culture and
arts have also influenced music, resulting in the birth of song form (Gürbüz, 2010).
In this century, some individuals have tried to create a note system to write music
down, and even though the first attempts by Nayi Osman Dede and Abdülbaki Nasır
Dede have not been acknowledged in the musical district, the Armenian church
preacher and composer Hampartzum Limoncuyan has created a note system which is
remembered as “The Hampartzum Note” and has been acknowledged and used to
write down many Turkish classical pieces, preventing them to be forgotten in the
future (Behar, 2014). Between the 17th century to the 19th century which is considered
as the “Classical Era” similarities have been found between TCM and western
classical music. While in western music, concertos and symphonies were being
composed, pieces in big forms such as Kar, Beste and Semai have been produced in
TCM. These musical pieces were supported by aristocrats and the palace, making
music become an art of order (Aşıroğlu, 2009).
36
Traditional Ottoman/Turkish music has lived its so called “golden age” in the 19th
century. With the changes of ideas and politics in Europe, the understanding in arts
have changed as well. With the developing of the middle class, a new audience has
emerged and more diverse repertoires have come into topic (Ak, 2014). With the
democratic movements in the Ottoman Empire, arts have come down to the common
folk and has become simple, unlike the Classical Era, lyricism has blossomed, melodic
structures have overgone changes and the forms have become smaller (Körükçü,
1998). In this period, the people have become interested in western music and this
case has influenced a new movement to be born in music called romanticism. After
the janissary household which was the state’s main military unit was shut down in
1826, a formation of a new modern army has led to a change in Turkish music with
the closing of the military music schools “Mehterhane” and opening of “Müzika-yı
Hümayun” in its place, which would soon lead to the perish of the Enderun school
(Kaygusuz, 2014). As Kaygusuz puts it, with western music taking its place in the
palace because of the Müzika-yı Hümayun, piano parts have started to be written in
Turkish pieces and new types of performances such as marches, opera, operettas and
waltz have started to form. The addition of the piano has then caused traditional
instruments like the kanun and oud to slowly be abandoned over time.
As the 19th century began to end and the 20th century took its place, classical rules and
styles have collectively started to come to an end (Körükçü, 1998). This sudden envy
to European style has caused Turkish composers to be pushed aside and composers
have slowly started to become distant from the palace, with the most important of
them being İsmail Dede Efendi (Karamahmutoğlu, 2014). Composer İsmail Dede
Efendi has tried to adapt to this modernization in music, writing pieces in waltz
rhythm, however, it is believed that he was unpleasant with the situation and changes
of the era (Özcan, 2014). In shorter words, the period starting with the 17th century
and ending with the 20th, was an era of modernization and westernization. Although
local music was not completely frowned upon, the state had shifted from favouring
Turkish music over western music, leading to an identity crisis and the disappearance
37
of original Turkish classical music (Kaygusuz, 2014). After the shutdown of the
Enderun music school in 1908, Turkish music was all on its own with the state
withdrawing its funding and support. In this environment, music was kept being taught
by people who still like and appreciate Turkish music in meetings in residences. By
these civilian formations which are considered the foundations of the musical unions
today, the people’s musical needs were fulfilled and it was made possible to raise
students in the sense of a school (Körükçü, 1998).
A school of drama was founded in 1912 named “Darü’l Bedai” which also had a
musical branch in the aim of producing music for the plays. This was the first
institution after the Enderun for Turkish music. Because of the difficult conditions of
World War I, the Darü’l Bedai was forced to shut down, leading to the establishment
of “Darü’l Elhan” (house of melody) which only taught music and worked to identify
classical pieces (Paçacı, 1999).
After the declaration of the Republic in 1923, efforts were made to create a national
identity and redefining the historical and cultural structure. These efforts have led the
state to determine a western music-based policy, resulting in the dispatch of Turkish
music from the Darü’l Elhan completely and having the school’s name changed into
the Conservatory (Körükçü, 1998). The first radio broadcast has aired in Turkey in
1927. With a movement started by Ziya Gökalp, who was neither a musician or a
musicologist, Turkish music was completely banned from the radio in 1934 (Paçacı,
1999). According to Körükçü (1998), Ziya Gökalp had thought that a new form of
music needed to be created by blending together Turkish folk music and western music
and TCM to be completely banished. However, he had not been able to comprehend
that TCM and folk music were the same in basis, just different in style and form.
Positive efforts in music have also been made in the Republican period despite the
various complications and setbacks. The Ankara State Conservatory has opened in
1936 along with the Ankara Radio in 1938. The conservatory started the education of
Turkish music once more when Hüseyin Saadettin Arel was made in charge of it in
38
1943 (Paçacı, 1999). Alongside these institutions, various other establishments were
founded with the state’s resources during the first 50 years of the Republic such as the
Ankara State Opera and Ballet, the Presidential Symphony Orchestra, the Istanbul
State Opera and Ballet and the İzmir State Conservatory (Kaygusuz, 2014). Another
important progress was the establishment of the “State Conservatory of Turkish
Music” in 1976, followed by the establishment of the “Ministry of Culture State Choir
of Turkish Classical Music” in 1980.
With the growth of the record industry, many musicians have started to compose songs
that are more easily understood and sang. Composers such as Muhlis Sabahattin and
Sadettin Kaynak have written music in a form that was never seen before, influenced
by western music. Another influential musician who had brought the tradition of solo
singing to TCM was Nurettin Selçuk, who used to sing standing up and in a formal
suit (Körükçü, 1998). This solo singing concept has withered in time, making concerts
for the entertainment industry to surface, thus TCM performers have started to lose
their old styles and attitudes. The Turkish Radio and Television (TRT) had been the
protector of TCM up to the 1980s, yet; as private radios and networks have started
broadcasting in the 1990s, the overall cultural and artistic understanding of Turkey
had started to change. Today, with the growth of technology and the presence of the
internet, various types of music are within reach and the musical preferences of the
society has changed due to this case, thus popular music is more in demand and TCM
is less likely to be preferred in an overall scenario.
2.4.2. Characteristics of Turkish Classical Music
The most important aspect that distinguishes Turkish music from western music is that
Turkish music is monophonic whereas western music is polyphonic. In western music,
an octave band consists of 12 sounds each with an equal interval in between. Turkish
music, on the other hand, has 24 sounds with uneven intervals in an octave band. These
sounds are called tones (perde) and in order to produce these sounds, different types
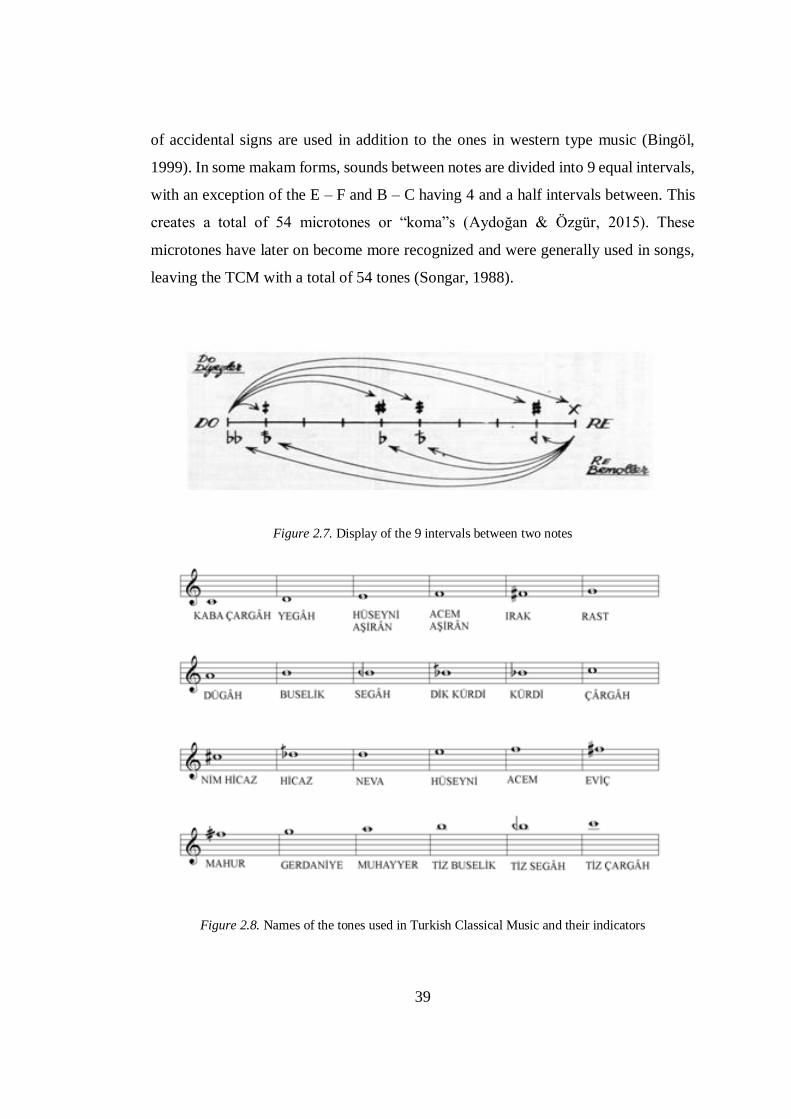
39
of accidental signs are used in addition to the ones in western type music (Bingöl,
1999). In some makam forms, sounds between notes are divided into 9 equal intervals,
with an exception of the E – F and B – C having 4 and a half intervals between. This
creates a total of 54 microtones or “koma”s (Aydoğan & Özgür, 2015). These
microtones have later on become more recognized and were generally used in songs,
leaving the TCM with a total of 54 tones (Songar, 1988).
Figure 2.7. Display of the 9 intervals between two notes
Figure 2.8. Names of the tones used in Turkish Classical Music and their indicators
40
Another important distinction between Turkish music and western music is the use of
octaves. While subsequent octaves in western music only differ in pitch, meaning that
they can be analyzed together in terms of musical characteristics. On the contrary in
Turkish music, notes of different pitches are usually named individually, such as a G4
note is named “Rast” while a G5 note which is an octave higher is called “Gerdaniye”
(Bozkurt, 2008). Western music uses key signatures as a fundamental component to
define major and minor scales, whereas Turkish music refers to melodic movement
(seyir) and the chords included in the seyir just as much as it refers to the key
signatures in the pieces composed (Akkoç, 2002).
The term “makam” can be described as a series of rules put together that assures the
music to progress in a form of introduction, body and conclusion. These rules are
called seyir. Makams cannot be changed by composers and seyirs prevent makams to
become a random series of sounds. It is known that in TCM there are makams with
different seyirs even though they have the same sequences (Tanrıkorur, 2011). The
difference between two makams can usually be a slight change of one sound in a tone,
therefore the definite sizes of certain intervals are of utmost importance. Musicians
have generally gone into dispute due to the small tonal differences in similar sequences
in TCM (Signell, 2006). As mentioned before, sounds in TCM are composed of 9
intervals between notes called komas. Hundreds of makams have been written with
the koma intervals and every makam has its own unique quality. Another aspect of
TCM is the authentic rhythm system in which the patterns are called “usül”. These
musical diversity points out to the richness of the Turkish makam system (Say, 2002).
Makam aims to define the relationship between the “durak” pitch and “güçlü” pitch
(which are the two most important tones in a makam) in a sequence. Makams are used
in three different forms in terms of seyir (Özkan, 2013):
1) Ascendant seyir 2) Descendant seyir 3) Ascendant – descendant seyir
In Turkish music there are three different kinds of makam (Bingöl, 1999):
1) Main makam 2) Şed makam 3) Unified/composite makam
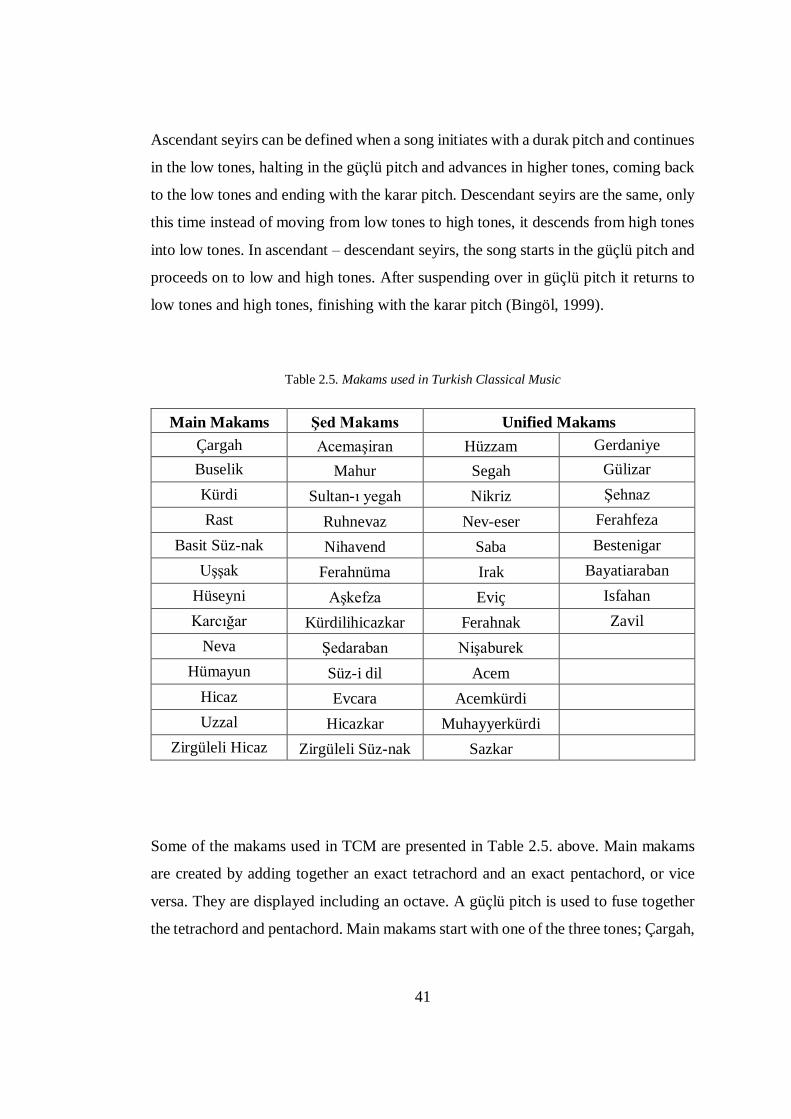
41
Ascendant seyirs can be defined when a song initiates with a durak pitch and continues
in the low tones, halting in the güçlü pitch and advances in higher tones, coming back
to the low tones and ending with the karar pitch. Descendant seyirs are the same, only
this time instead of moving from low tones to high tones, it descends from high tones
into low tones. In ascendant – descendant seyirs, the song starts in the güçlü pitch and
proceeds on to low and high tones. After suspending over in güçlü pitch it returns to
low tones and high tones, finishing with the karar pitch (Bingöl, 1999).
Table 2.5. Makams used in Turkish Classical Music
Main Makams Şed Makams Unified Makams
Çargah Acemaşiran Hüzzam Gerdaniye
Buselik Mahur Segah Gülizar
Kürdi Sultan-ı yegah Nikriz Şehnaz
Rast Ruhnevaz Nev-eser Ferahfeza
Basit Süz-nak Nihavend Saba Bestenigar
Uşşak Ferahnüma Irak Bayatiaraban
Hüseyni Aşkefza Eviç Isfahan
Karcığar Kürdilihicazkar Ferahnak Zavil
Neva Şedaraban Nişaburek
Hümayun Süz-i dil Acem
Hicaz Evcara Acemkürdi
Uzzal Hicazkar Muhayyerkürdi
Zirgüleli Hicaz Zirgüleli Süz-nak Sazkar
Some of the makams used in TCM are presented in Table 2.5. above. Main makams
are created by adding together an exact tetrachord and an exact pentachord, or vice
versa. They are displayed including an octave. A güçlü pitch is used to fuse together
the tetrachord and pentachord. Main makams start with one of the three tones; Çargah,
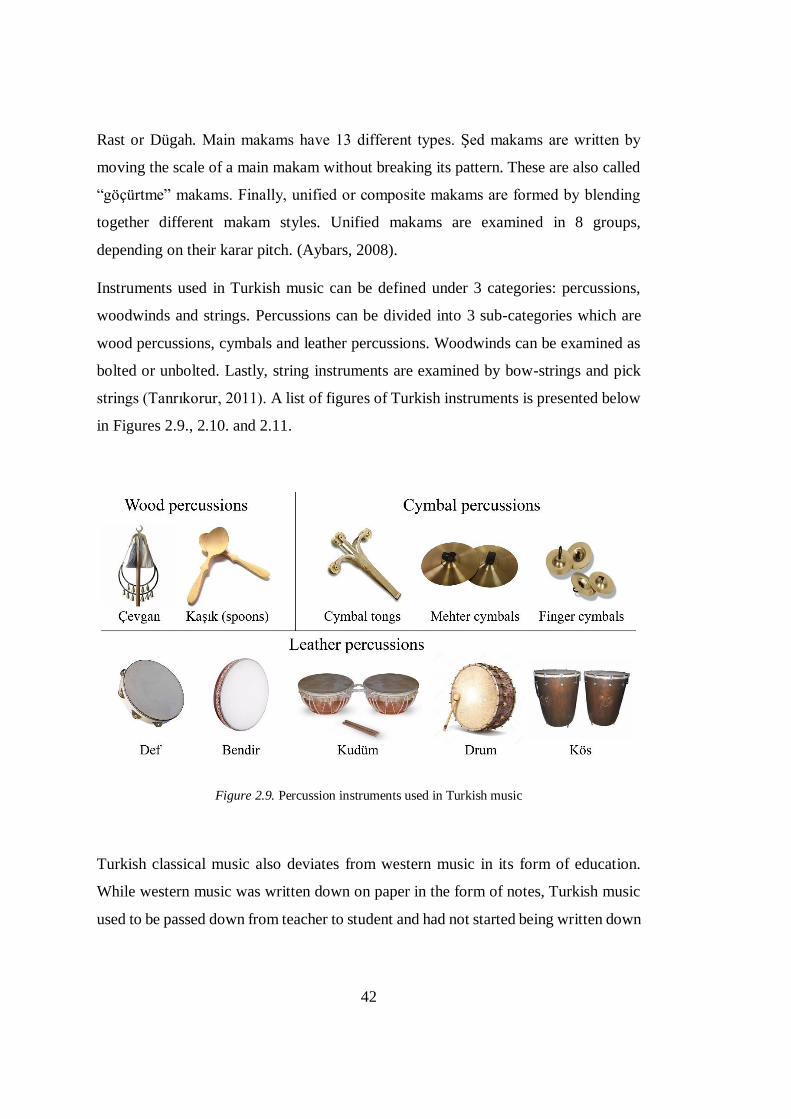
42
Rast or Dügah. Main makams have 13 different types. Şed makams are written by
moving the scale of a main makam without breaking its pattern. These are also called
“göçürtme” makams. Finally, unified or composite makams are formed by blending
together different makam styles. Unified makams are examined in 8 groups,
depending on their karar pitch. (Aybars, 2008).
Instruments used in Turkish music can be defined under 3 categories: percussions,
woodwinds and strings. Percussions can be divided into 3 sub-categories which are
wood percussions, cymbals and leather percussions. Woodwinds can be examined as
bolted or unbolted. Lastly, string instruments are examined by bow-strings and pick
strings (Tanrıkorur, 2011). A list of figures of Turkish instruments is presented below
in Figures 2.9., 2.10. and 2.11.
Figure 2.9. Percussion instruments used in Turkish music
Turkish classical music also deviates from western music in its form of education.
While western music was written down on paper in the form of notes, Turkish music
used to be passed down from teacher to student and had not started being written down
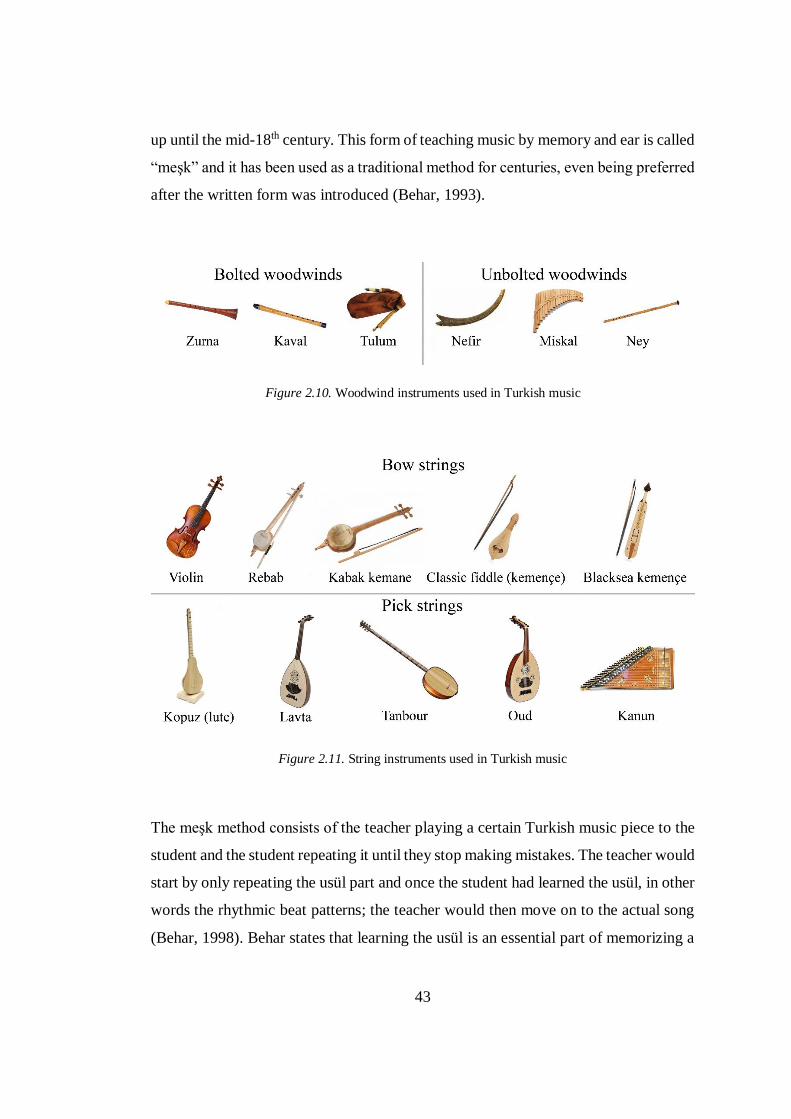
43
up until the mid-18th century. This form of teaching music by memory and ear is called
“meşk” and it has been used as a traditional method for centuries, even being preferred
after the written form was introduced (Behar, 1993).
Figure 2.10. Woodwind instruments used in Turkish music
Figure 2.11. String instruments used in Turkish music
The meşk method consists of the teacher playing a certain Turkish music piece to the
student and the student repeating it until they stop making mistakes. The teacher would
start by only repeating the usül part and once the student had learned the usül, in other
words the rhythmic beat patterns; the teacher would then move on to the actual song
(Behar, 1998). Behar states that learning the usül is an essential part of memorizing a
44
Turkish song, because each song has their own particular usül and cannot be played
with another usül, thus once an usül is memorized, it is easier to associate other aspects
of a song such as makam and lyrics. It is also believed that Turkish music can only be
performed perfectly with the meşk system and reading from notes would never be the
same as learning from someone who has mastered the art form to its core (Sezgin,
1982). Citing music from paper is also considered to cause a lack of emotion, personal
interpretations and enthusiasm, whereas a performer immerse themselves when
playing by memory and create a much more intimate music as a result (Yavaşça,
1981).
45
CHAPTER 3
3. THEORIES AND POSTULATE
As previously explained in Chapter 2, TCM has certain differences from western
classical music. It uses different kinds of traditional instruments. While western
orchestras are mainly composed of string sections, brass sections, percussions and the
piano; instruments like the tambour, kanun, oud, bağlama and bendir are the common
key instruments of TCM. Western classical music is often polyphonic, whereas TCM
almost always deals with monophony. Opera on the other hand, has a slight similarity
to TCM because of the fact that both music styles may include vocals.
In order to establish a strong argument on whether TCM needs different acoustic
conditions or not, an analysis showing the differences of objective values between
TCM and other types of music is required.
In this chapter, the three aforementioned music styles are compared in terms of:
Frequency spectrum
Musical structure
Dominant elements
Musical components
For this analysis, a sample of 100 songs have been selected for each type of music:
TCM, western classical music and finally, opera. These songs are then analyzed using
an audio-visual software called Sonic Visualiser. The software is free to download
from its official website, and it provides the user with visual data of the audio such as
waveform graphs and spectrograms (Cannam et al, 2010).
46
The songs have been selected according to their capability of reflecting their music
style, and of their commonness; in other words, popularity.
3.1. Frequency Spectrum Analysis
As mentioned before in Chapter 2, sound travels in waveform and its wave length
changes depending on its pitch. Natural sounds have different frequencies inside them
and the timbre depends on the correlation between the frequency gaps. When
inspecting a sound, we need to determine its frequency spectrum in order to imagine
how it would sound like to the human ear. Could a note played from a string instrument
be coming from a cello, or from a violin? By looking at the note’s frequency spectrum,
we can guess which instrument had created the sound.
Frequency spectra provide us with power levels relevant to the frequency. Ladefoged
(1995) explains that by applying a Fourier analysis to a soundwave, a frequency
spectrum is formed. In Figure 3.1. below, the waveform of a C note played on the
piano can be seen, followed by the frequency spectrum of said note in Figure 3.2.
(Ladefoged, 1995). The top figure shows that multiple different vibrations create one
wave, which forms the characteristic sound of a piano. In the bottom figure, sound
level distributions according to each frequency band can be seen.
Just like frequency spectra, spectrograms allow one to visually examine audio
components by transcribing sound data into graphs (Johnson, 2012). The difference
between a spectrum and spectrogram is the presence of the time factor, Johnson states.
While a spectrum can show power levels in a single time unit, a spectrogram illustrates
the temporal changes in spectra. If we were to put it into simple words, we can say
that a spectrogram is the “picture” of a sound.
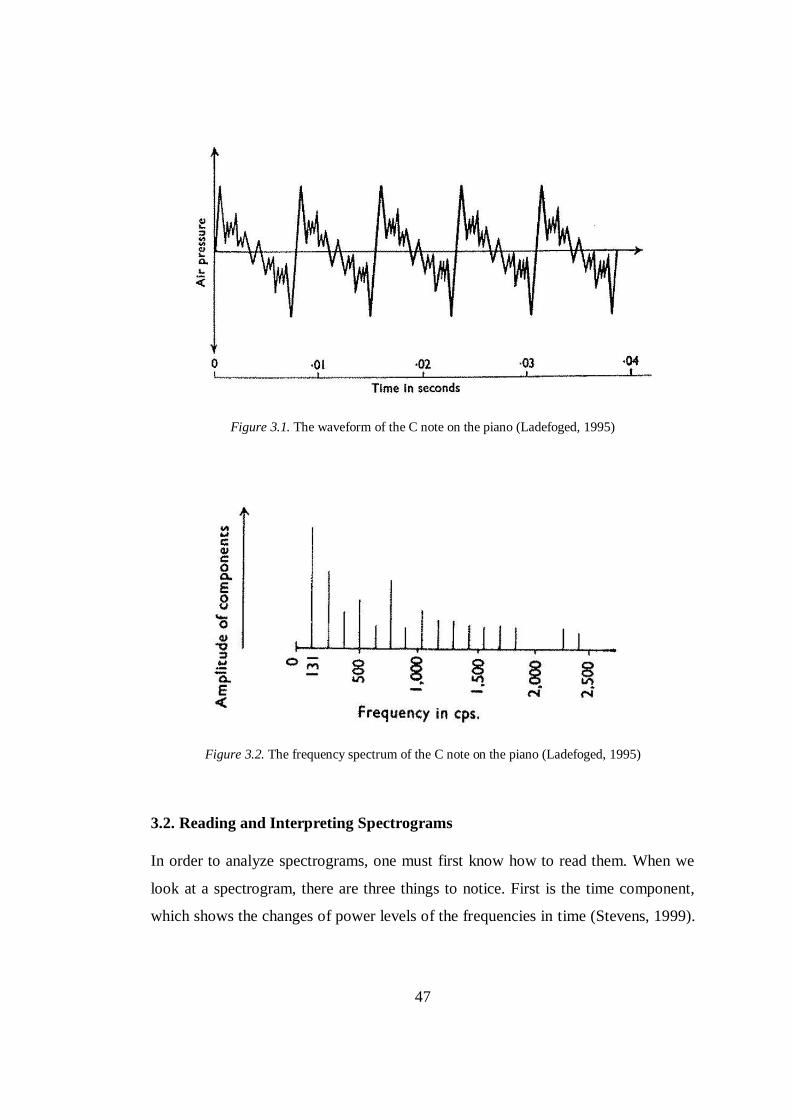
47
Figure 3.1. The waveform of the C note on the piano (Ladefoged, 1995)
Figure 3.2. The frequency spectrum of the C note on the piano (Ladefoged, 1995)
3.2. Reading and Interpreting Spectrograms
In order to analyze spectrograms, one must first know how to read them. When we
look at a spectrogram, there are three things to notice. First is the time component,
which shows the changes of power levels of the frequencies in time (Stevens, 1999).
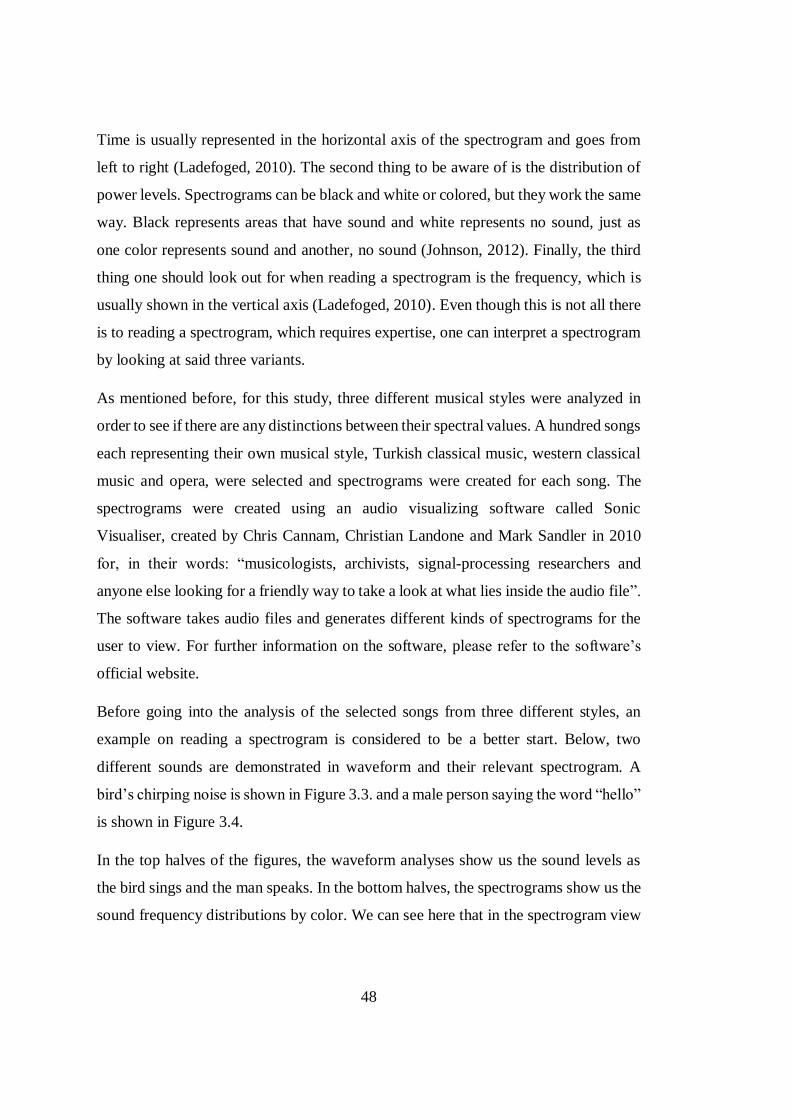
48
Time is usually represented in the horizontal axis of the spectrogram and goes from
left to right (Ladefoged, 2010). The second thing to be aware of is the distribution of
power levels. Spectrograms can be black and white or colored, but they work the same
way. Black represents areas that have sound and white represents no sound, just as
one color represents sound and another, no sound (Johnson, 2012). Finally, the third
thing one should look out for when reading a spectrogram is the frequency, which is
usually shown in the vertical axis (Ladefoged, 2010). Even though this is not all there
is to reading a spectrogram, which requires expertise, one can interpret a spectrogram
by looking at said three variants.
As mentioned before, for this study, three different musical styles were analyzed in
order to see if there are any distinctions between their spectral values. A hundred songs
each representing their own musical style, Turkish classical music, western classical
music and opera, were selected and spectrograms were created for each song. The
spectrograms were created using an audio visualizing software called Sonic
Visualiser, created by Chris Cannam, Christian Landone and Mark Sandler in 2010
for, in their words: “musicologists, archivists, signal-processing researchers and
anyone else looking for a friendly way to take a look at what lies inside the audio file”.
The software takes audio files and generates different kinds of spectrograms for the
user to view. For further information on the software, please refer to the software’s
official website.
Before going into the analysis of the selected songs from three different styles, an
example on reading a spectrogram is considered to be a better start. Below, two
different sounds are demonstrated in waveform and their relevant spectrogram. A
bird’s chirping noise is shown in Figure 3.3. and a male person saying the word “hello”
is shown in Figure 3.4.
In the top halves of the figures, the waveform analyses show us the sound levels as
the bird sings and the man speaks. In the bottom halves, the spectrograms show us the
sound frequency distributions by color. We can see here that in the spectrogram view
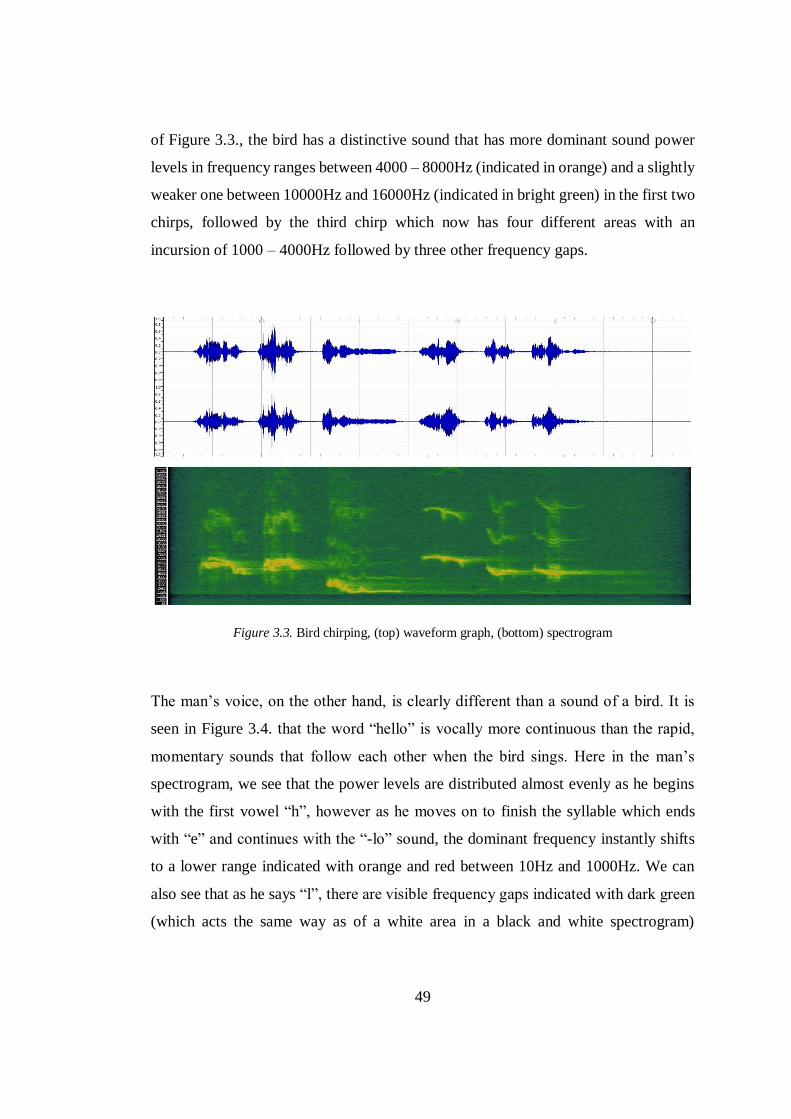
49
of Figure 3.3., the bird has a distinctive sound that has more dominant sound power
levels in frequency ranges between 4000 – 8000Hz (indicated in orange) and a slightly
weaker one between 10000Hz and 16000Hz (indicated in bright green) in the first two
chirps, followed by the third chirp which now has four different areas with an
incursion of 1000 – 4000Hz followed by three other frequency gaps.
Figure 3.3. Bird chirping, (top) waveform graph, (bottom) spectrogram
The man’s voice, on the other hand, is clearly different than a sound of a bird. It is
seen in Figure 3.4. that the word “hello” is vocally more continuous than the rapid,
momentary sounds that follow each other when the bird sings. Here in the man’s
spectrogram, we see that the power levels are distributed almost evenly as he begins
with the first vowel “h”, however as he moves on to finish the syllable which ends
with “e” and continues with the “-lo” sound, the dominant frequency instantly shifts
to a lower range indicated with orange and red between 10Hz and 1000Hz. We can
also see that as he says “l”, there are visible frequency gaps indicated with dark green
(which acts the same way as of a white area in a black and white spectrogram)
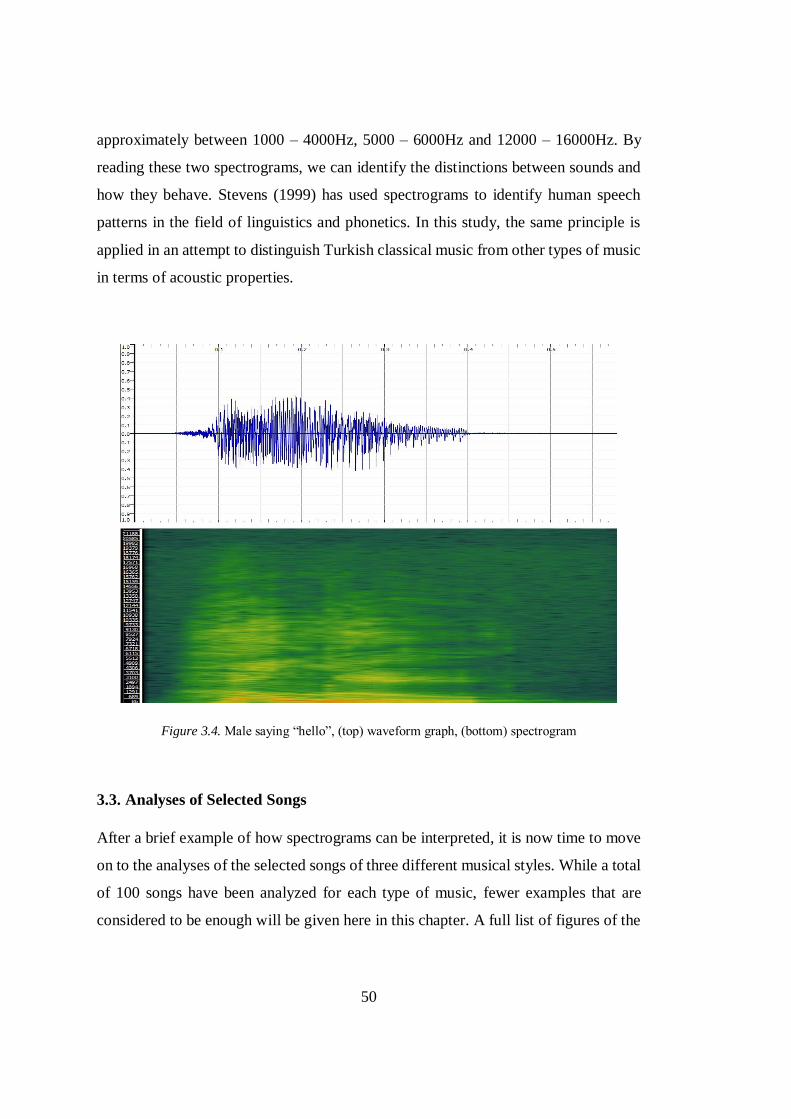
50
approximately between 1000 – 4000Hz, 5000 – 6000Hz and 12000 – 16000Hz. By
reading these two spectrograms, we can identify the distinctions between sounds and
how they behave. Stevens (1999) has used spectrograms to identify human speech
patterns in the field of linguistics and phonetics. In this study, the same principle is
applied in an attempt to distinguish Turkish classical music from other types of music
in terms of acoustic properties.
Figure 3.4. Male saying “hello”, (top) waveform graph, (bottom) spectrogram
3.3. Analyses of Selected Songs
After a brief example of how spectrograms can be interpreted, it is now time to move
on to the analyses of the selected songs of three different musical styles. While a total
of 100 songs have been analyzed for each type of music, fewer examples that are
considered to be enough will be given here in this chapter. A full list of figures of the
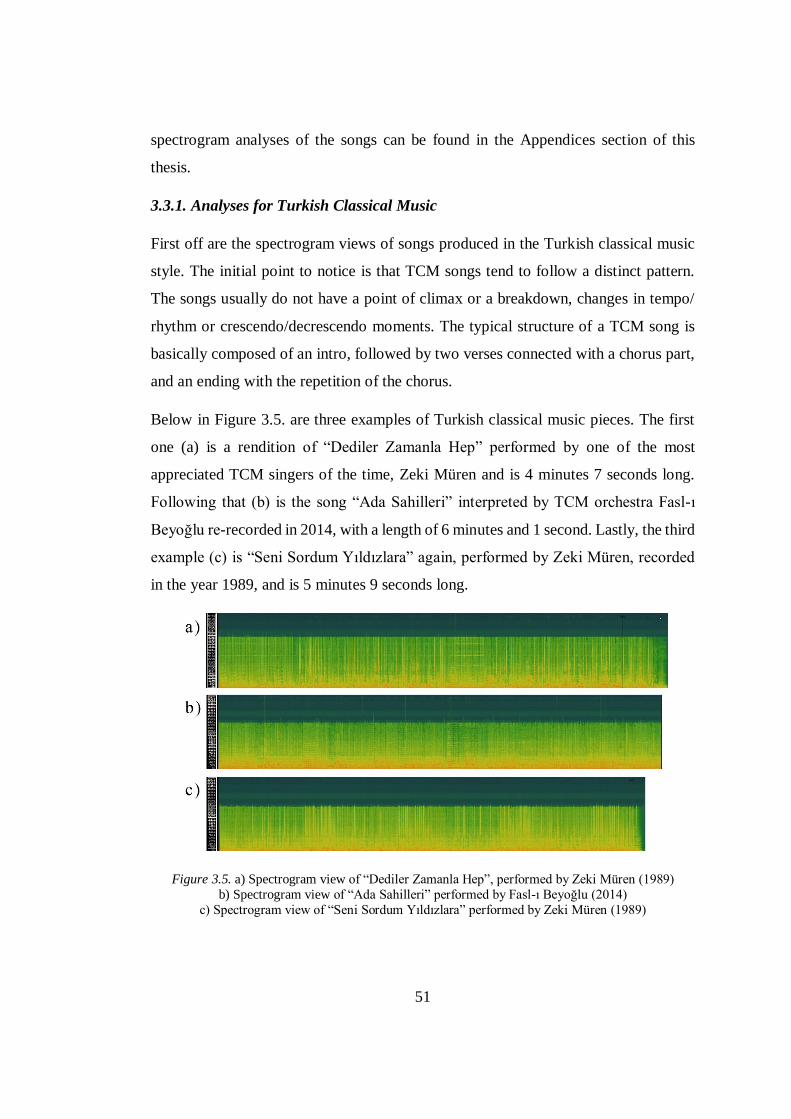
51
spectrogram analyses of the songs can be found in the Appendices section of this
thesis.
3.3.1. Analyses for Turkish Classical Music
First off are the spectrogram views of songs produced in the Turkish classical music
style. The initial point to notice is that TCM songs tend to follow a distinct pattern.
The songs usually do not have a point of climax or a breakdown, changes in tempo/
rhythm or crescendo/decrescendo moments. The typical structure of a TCM song is
basically composed of an intro, followed by two verses connected with a chorus part,
and an ending with the repetition of the chorus.
Below in Figure 3.5. are three examples of Turkish classical music pieces. The first
one (a) is a rendition of “Dediler Zamanla Hep” performed by one of the most
appreciated TCM singers of the time, Zeki Müren and is 4 minutes 7 seconds long.
Following that (b) is the song “Ada Sahilleri” interpreted by TCM orchestra Fasl-ı
Beyoğlu re-recorded in 2014, with a length of 6 minutes and 1 second. Lastly, the third
example (c) is “Seni Sordum Yıldızlara” again, performed by Zeki Müren, recorded
in the year 1989, and is 5 minutes 9 seconds long.
Figure 3.5. a) Spectrogram view of “Dediler Zamanla Hep”, performed by Zeki Müren (1989)
b) Spectrogram view of “Ada Sahilleri” performed by Fasl-ı Beyoğlu (2014)
c) Spectrogram view of “Seni Sordum Yıldızlara” performed by Zeki Müren (1989)
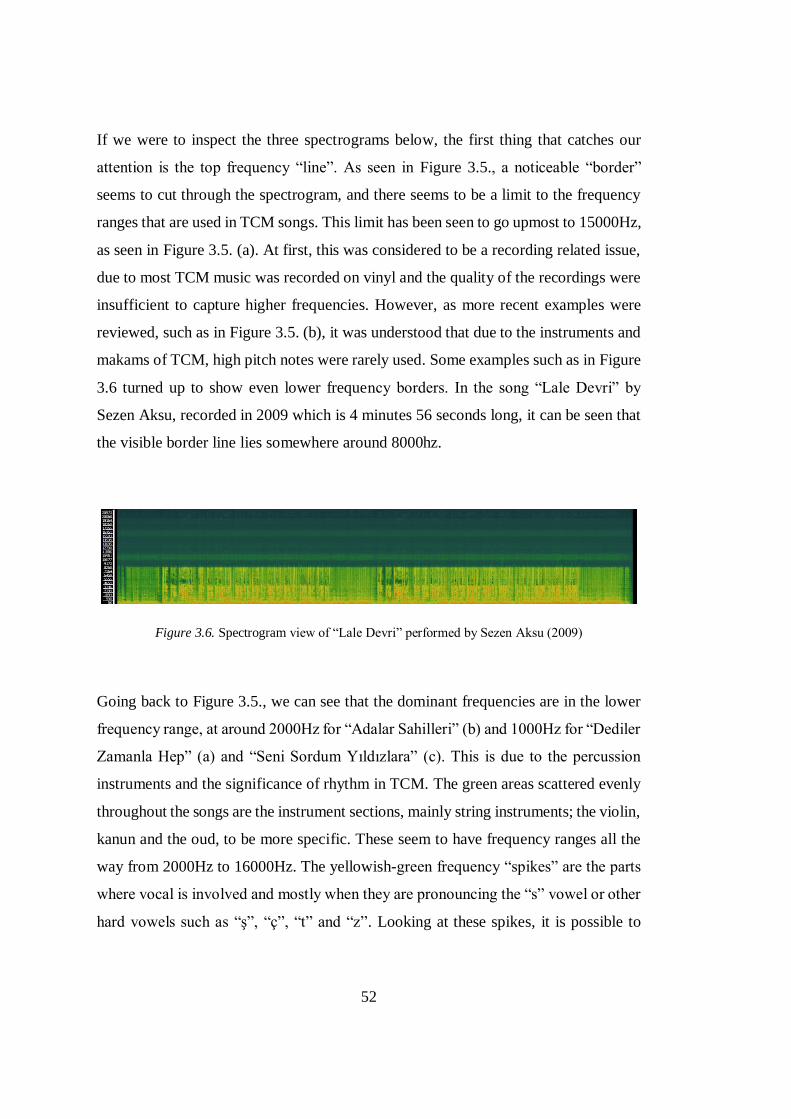
52
If we were to inspect the three spectrograms below, the first thing that catches our
attention is the top frequency “line”. As seen in Figure 3.5., a noticeable “border”
seems to cut through the spectrogram, and there seems to be a limit to the frequency
ranges that are used in TCM songs. This limit has been seen to go upmost to 15000Hz,
as seen in Figure 3.5. (a). At first, this was considered to be a recording related issue,
due to most TCM music was recorded on vinyl and the quality of the recordings were
insufficient to capture higher frequencies. However, as more recent examples were
reviewed, such as in Figure 3.5. (b), it was understood that due to the instruments and
makams of TCM, high pitch notes were rarely used. Some examples such as in Figure
3.6 turned up to show even lower frequency borders. In the song “Lale Devri” by
Sezen Aksu, recorded in 2009 which is 4 minutes 56 seconds long, it can be seen that
the visible border line lies somewhere around 8000hz.
Figure 3.6. Spectrogram view of “Lale Devri” performed by Sezen Aksu (2009)
Going back to Figure 3.5., we can see that the dominant frequencies are in the lower
frequency range, at around 2000Hz for “Adalar Sahilleri” (b) and 1000Hz for “Dediler
Zamanla Hep” (a) and “Seni Sordum Yıldızlara” (c). This is due to the percussion
instruments and the significance of rhythm in TCM. The green areas scattered evenly
throughout the songs are the instrument sections, mainly string instruments; the violin,
kanun and the oud, to be more specific. These seem to have frequency ranges all the
way from 2000Hz to 16000Hz. The yellowish-green frequency “spikes” are the parts
where vocal is involved and mostly when they are pronouncing the “s” vowel or other
hard vowels such as “ş”, “ç”, “t” and “z”. Looking at these spikes, it is possible to
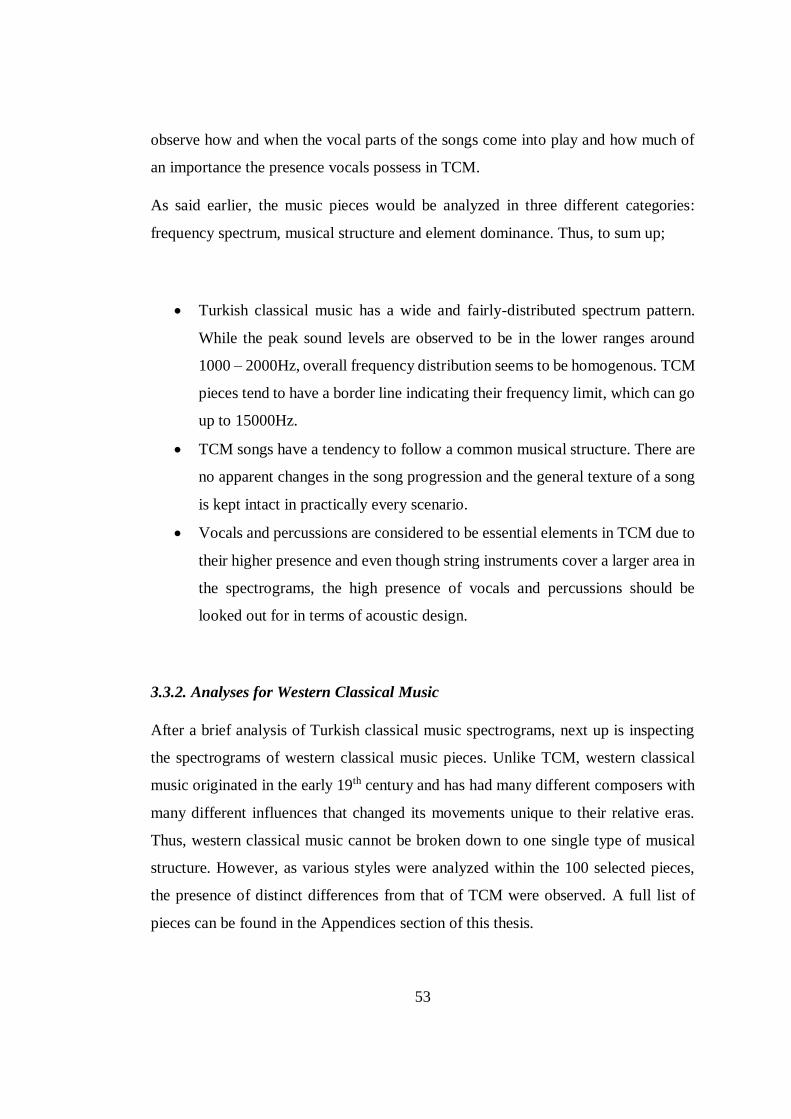
53
observe how and when the vocal parts of the songs come into play and how much of
an importance the presence vocals possess in TCM.
As said earlier, the music pieces would be analyzed in three different categories:
frequency spectrum, musical structure and element dominance. Thus, to sum up;
Turkish classical music has a wide and fairly-distributed spectrum pattern.
While the peak sound levels are observed to be in the lower ranges around
1000 – 2000Hz, overall frequency distribution seems to be homogenous. TCM
pieces tend to have a border line indicating their frequency limit, which can go
up to 15000Hz.
TCM songs have a tendency to follow a common musical structure. There are
no apparent changes in the song progression and the general texture of a song
is kept intact in practically every scenario.
Vocals and percussions are considered to be essential elements in TCM due to
their higher presence and even though string instruments cover a larger area in
the spectrograms, the high presence of vocals and percussions should be
looked out for in terms of acoustic design.
3.3.2. Analyses for Western Classical Music
After a brief analysis of Turkish classical music spectrograms, next up is inspecting
the spectrograms of western classical music pieces. Unlike TCM, western classical
music originated in the early 19th century and has had many different composers with
many different influences that changed its movements unique to their relative eras.
Thus, western classical music cannot be broken down to one single type of musical
structure. However, as various styles were analyzed within the 100 selected pieces,
the presence of distinct differences from that of TCM were observed. A full list of
pieces can be found in the Appendices section of this thesis.
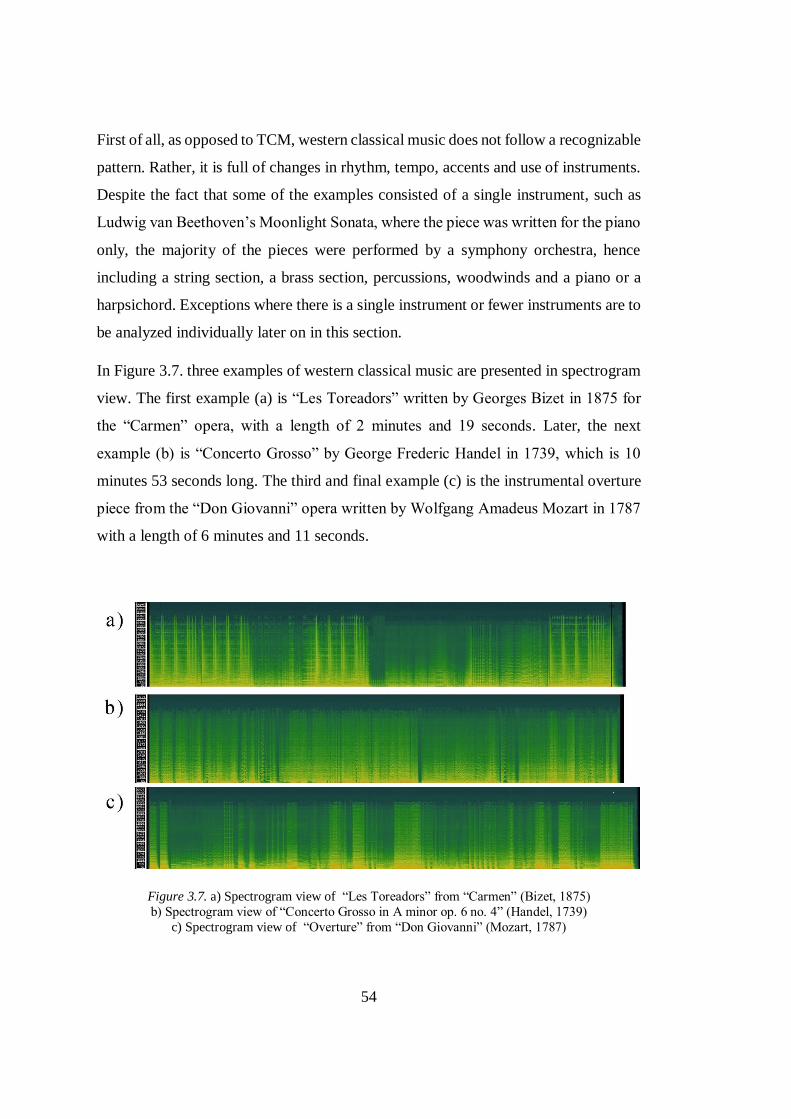
54
First of all, as opposed to TCM, western classical music does not follow a recognizable
pattern. Rather, it is full of changes in rhythm, tempo, accents and use of instruments.
Despite the fact that some of the examples consisted of a single instrument, such as
Ludwig van Beethoven’s Moonlight Sonata, where the piece was written for the piano
only, the majority of the pieces were performed by a symphony orchestra, hence
including a string section, a brass section, percussions, woodwinds and a piano or a
harpsichord. Exceptions where there is a single instrument or fewer instruments are to
be analyzed individually later on in this section.
In Figure 3.7. three examples of western classical music are presented in spectrogram
view. The first example (a) is “Les Toreadors” written by Georges Bizet in 1875 for
the “Carmen” opera, with a length of 2 minutes and 19 seconds. Later, the next
example (b) is “Concerto Grosso” by George Frederic Handel in 1739, which is 10
minutes 53 seconds long. The third and final example (c) is the instrumental overture
piece from the “Don Giovanni” opera written by Wolfgang Amadeus Mozart in 1787
with a length of 6 minutes and 11 seconds.
Figure 3.7. a) Spectrogram view of “Les Toreadors” from “Carmen” (Bizet, 1875)
b) Spectrogram view of “Concerto Grosso in A minor op. 6 no. 4” (Handel, 1739)
c) Spectrogram view of “Overture” from “Don Giovanni” (Mozart, 1787)
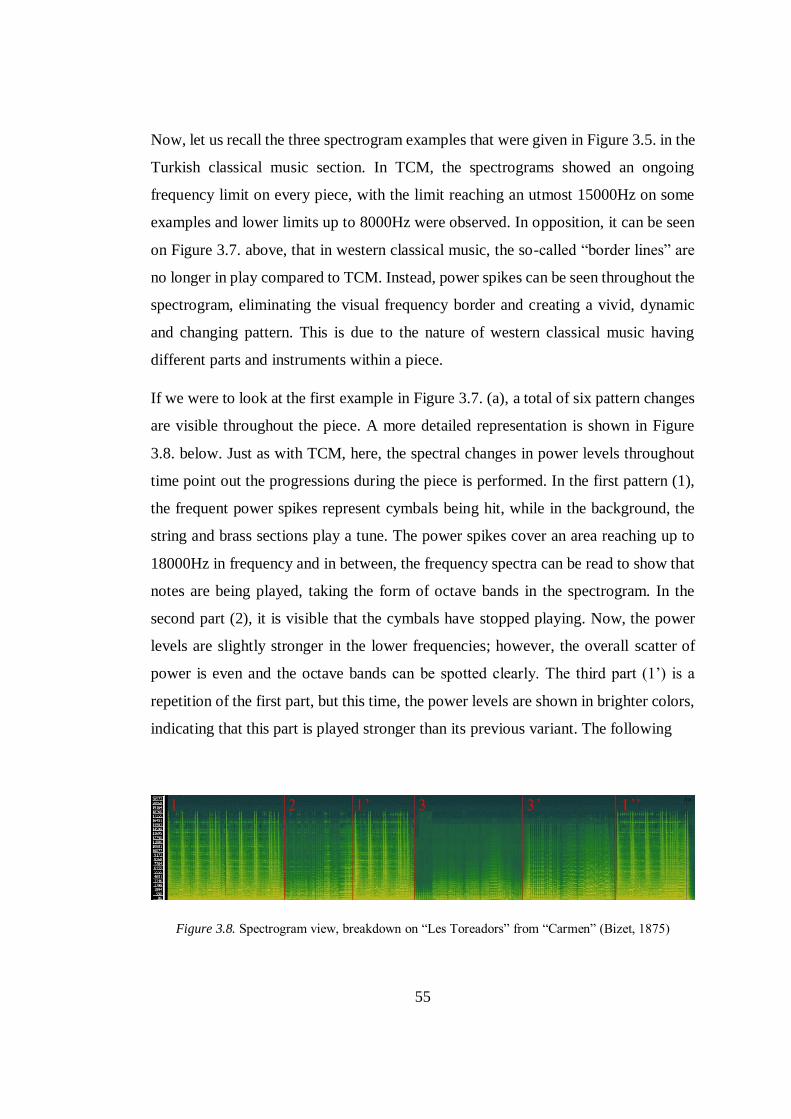
55
Now, let us recall the three spectrogram examples that were given in Figure 3.5. in the
Turkish classical music section. In TCM, the spectrograms showed an ongoing
frequency limit on every piece, with the limit reaching an utmost 15000Hz on some
examples and lower limits up to 8000Hz were observed. In opposition, it can be seen
on Figure 3.7. above, that in western classical music, the so-called “border lines” are
no longer in play compared to TCM. Instead, power spikes can be seen throughout the
spectrogram, eliminating the visual frequency border and creating a vivid, dynamic
and changing pattern. This is due to the nature of western classical music having
different parts and instruments within a piece.
If we were to look at the first example in Figure 3.7. (a), a total of six pattern changes
are visible throughout the piece. A more detailed representation is shown in Figure
3.8. below. Just as with TCM, here, the spectral changes in power levels throughout
time point out the progressions during the piece is performed. In the first pattern (1),
the frequent power spikes represent cymbals being hit, while in the background, the
string and brass sections play a tune. The power spikes cover an area reaching up to
18000Hz in frequency and in between, the frequency spectra can be read to show that
notes are being played, taking the form of octave bands in the spectrogram. In the
second part (2), it is visible that the cymbals have stopped playing. Now, the power
levels are slightly stronger in the lower frequencies; however, the overall scatter of
power is even and the octave bands can be spotted clearly. The third part (1’) is a
repetition of the first part, but this time, the power levels are shown in brighter colors,
indicating that this part is played stronger than its previous variant. The following
Figure 3.8. Spectrogram view, breakdown on “Les Toreadors” from “Carmen” (Bizet, 1875)
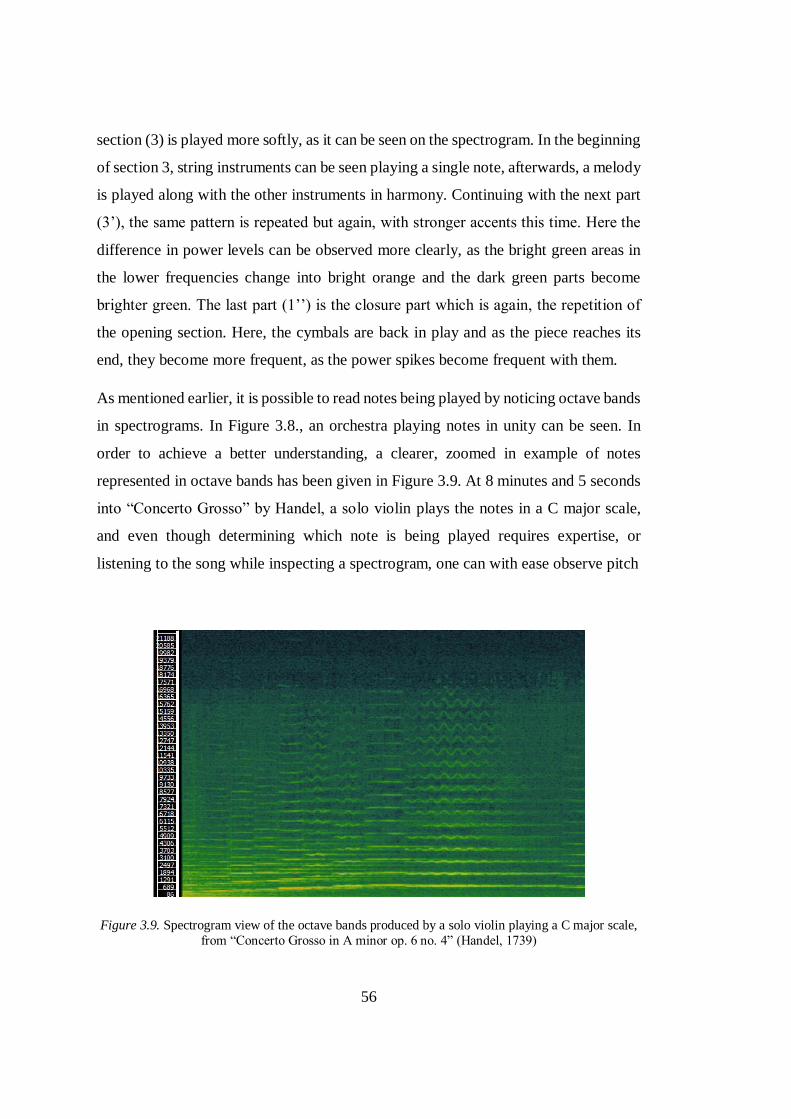
56
section (3) is played more softly, as it can be seen on the spectrogram. In the beginning
of section 3, string instruments can be seen playing a single note, afterwards, a melody
is played along with the other instruments in harmony. Continuing with the next part
(3’), the same pattern is repeated but again, with stronger accents this time. Here the
difference in power levels can be observed more clearly, as the bright green areas in
the lower frequencies change into bright orange and the dark green parts become
brighter green. The last part (1’’) is the closure part which is again, the repetition of
the opening section. Here, the cymbals are back in play and as the piece reaches its
end, they become more frequent, as the power spikes become frequent with them.
As mentioned earlier, it is possible to read notes being played by noticing octave bands
in spectrograms. In Figure 3.8., an orchestra playing notes in unity can be seen. In
order to achieve a better understanding, a clearer, zoomed in example of notes
represented in octave bands has been given in Figure 3.9. At 8 minutes and 5 seconds
into “Concerto Grosso” by Handel, a solo violin plays the notes in a C major scale,
and even though determining which note is being played requires expertise, or
listening to the song while inspecting a spectrogram, one can with ease observe pitch
Figure 3.9. Spectrogram view of the octave bands produced by a solo violin playing a C major scale,
from “Concerto Grosso in A minor op. 6 no. 4” (Handel, 1739)
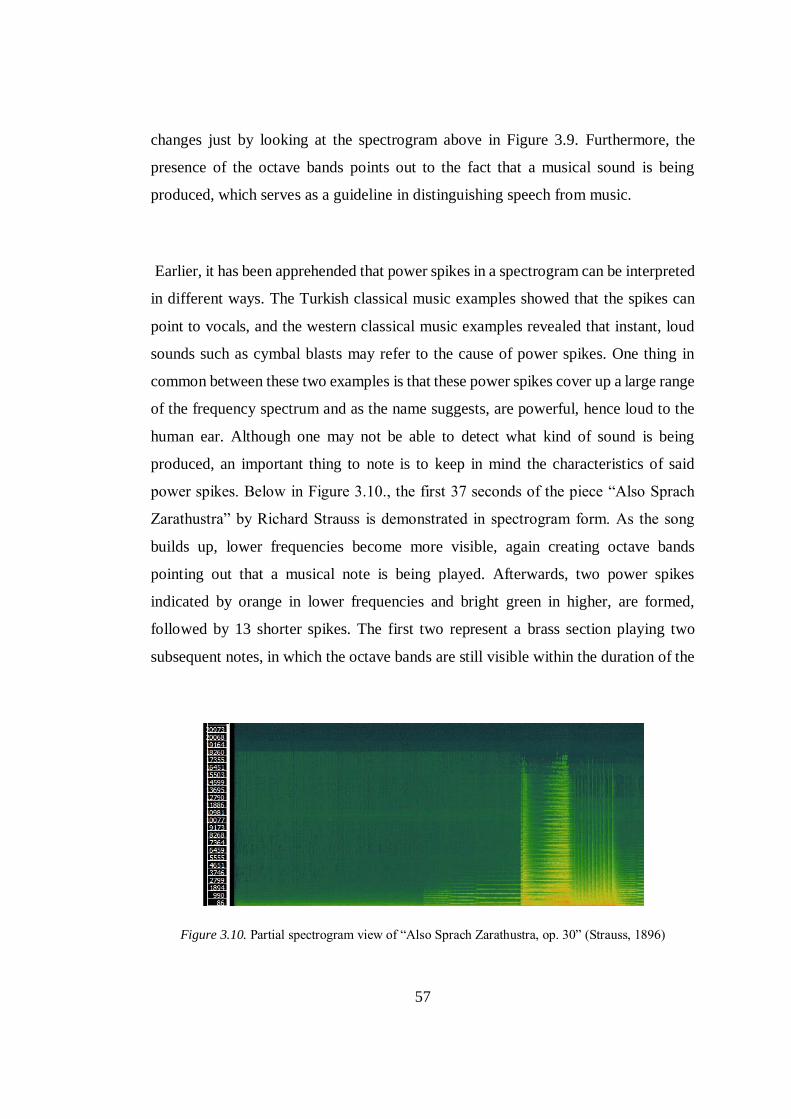
57
changes just by looking at the spectrogram above in Figure 3.9. Furthermore, the
presence of the octave bands points out to the fact that a musical sound is being
produced, which serves as a guideline in distinguishing speech from music.
Earlier, it has been apprehended that power spikes in a spectrogram can be interpreted
in different ways. The Turkish classical music examples showed that the spikes can
point to vocals, and the western classical music examples revealed that instant, loud
sounds such as cymbal blasts may refer to the cause of power spikes. One thing in
common between these two examples is that these power spikes cover up a large range
of the frequency spectrum and as the name suggests, are powerful, hence loud to the
human ear. Although one may not be able to detect what kind of sound is being
produced, an important thing to note is to keep in mind the characteristics of said
power spikes. Below in Figure 3.10., the first 37 seconds of the piece “Also Sprach
Zarathustra” by Richard Strauss is demonstrated in spectrogram form. As the song
builds up, lower frequencies become more visible, again creating octave bands
pointing out that a musical note is being played. Afterwards, two power spikes
indicated by orange in lower frequencies and bright green in higher, are formed,
followed by 13 shorter spikes. The first two represent a brass section playing two
subsequent notes, in which the octave bands are still visible within the duration of the
Figure 3.10. Partial spectrogram view of “Also Sprach Zarathustra, op. 30” (Strauss, 1896)
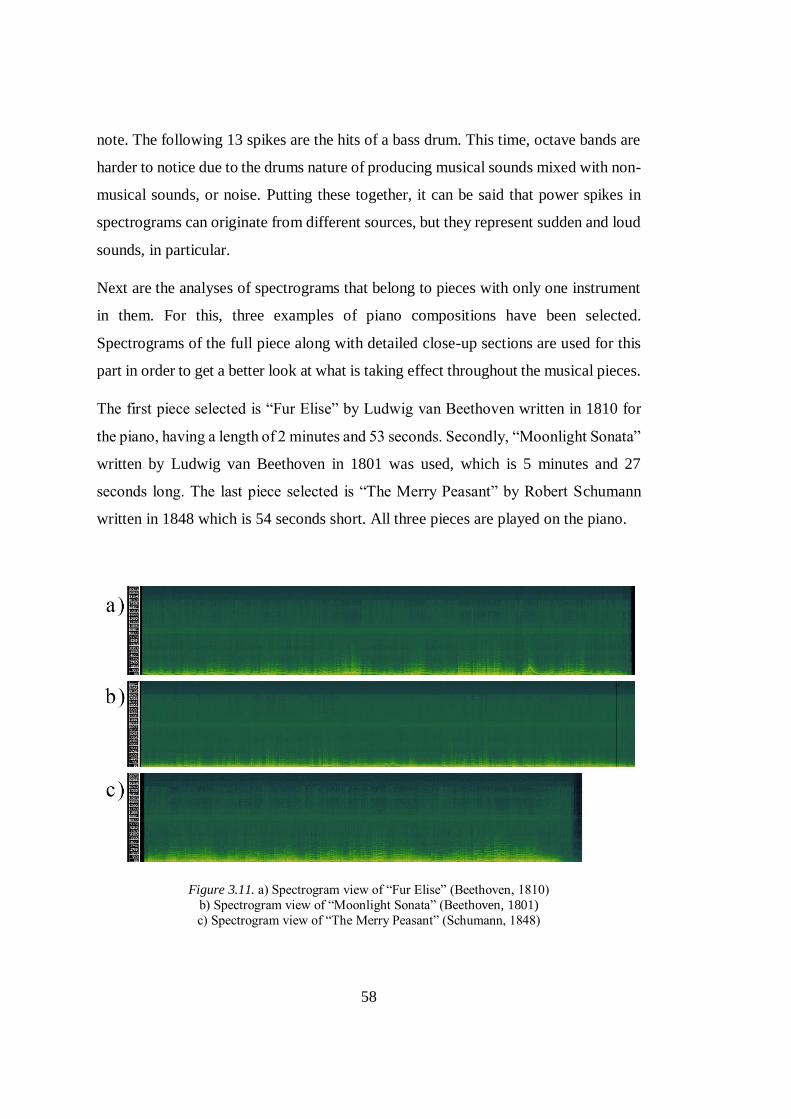
58
note. The following 13 spikes are the hits of a bass drum. This time, octave bands are
harder to notice due to the drums nature of producing musical sounds mixed with non-
musical sounds, or noise. Putting these together, it can be said that power spikes in
spectrograms can originate from different sources, but they represent sudden and loud
sounds, in particular.
Next are the analyses of spectrograms that belong to pieces with only one instrument
in them. For this, three examples of piano compositions have been selected.
Spectrograms of the full piece along with detailed close-up sections are used for this
part in order to get a better look at what is taking effect throughout the musical pieces.
The first piece selected is “Fur Elise” by Ludwig van Beethoven written in 1810 for
the piano, having a length of 2 minutes and 53 seconds. Secondly, “Moonlight Sonata”
written by Ludwig van Beethoven in 1801 was used, which is 5 minutes and 27
seconds long. The last piece selected is “The Merry Peasant” by Robert Schumann
written in 1848 which is 54 seconds short. All three pieces are played on the piano.
Figure 3.11. a) Spectrogram view of “Fur Elise” (Beethoven, 1810)
b) Spectrogram view of “Moonlight Sonata” (Beethoven, 1801)
c) Spectrogram view of “The Merry Peasant” (Schumann, 1848)
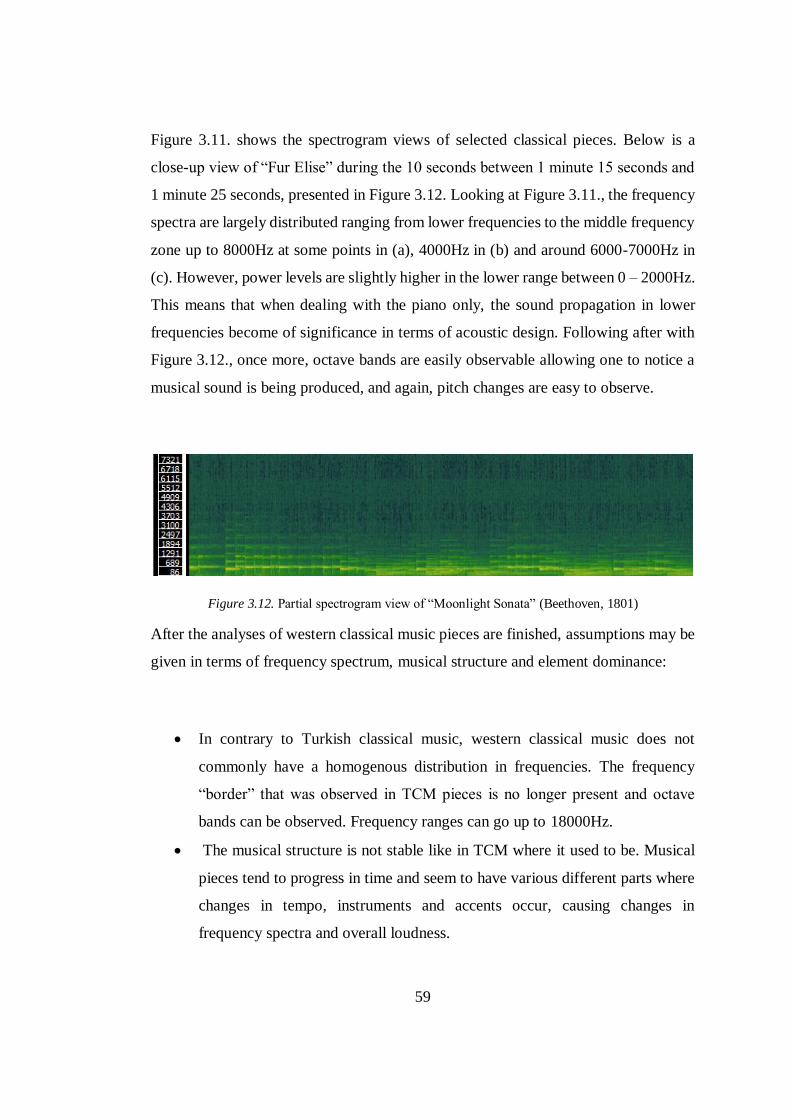
59
Figure 3.11. shows the spectrogram views of selected classical pieces. Below is a
close-up view of “Fur Elise” during the 10 seconds between 1 minute 15 seconds and
1 minute 25 seconds, presented in Figure 3.12. Looking at Figure 3.11., the frequency
spectra are largely distributed ranging from lower frequencies to the middle frequency
zone up to 8000Hz at some points in (a), 4000Hz in (b) and around 6000-7000Hz in
(c). However, power levels are slightly higher in the lower range between 0 – 2000Hz.
This means that when dealing with the piano only, the sound propagation in lower
frequencies become of significance in terms of acoustic design. Following after with
Figure 3.12., once more, octave bands are easily observable allowing one to notice a
musical sound is being produced, and again, pitch changes are easy to observe.
Figure 3.12. Partial spectrogram view of “Moonlight Sonata” (Beethoven, 1801)
After the analyses of western classical music pieces are finished, assumptions may be
given in terms of frequency spectrum, musical structure and element dominance:
In contrary to Turkish classical music, western classical music does not
commonly have a homogenous distribution in frequencies. The frequency
“border” that was observed in TCM pieces is no longer present and octave
bands can be observed. Frequency ranges can go up to 18000Hz.
The musical structure is not stable like in TCM where it used to be. Musical
pieces tend to progress in time and seem to have various different parts where
changes in tempo, instruments and accents occur, causing changes in
frequency spectra and overall loudness.
60
Just like the musical structure, dominant elements change according to
the progression in the songs. String sections can follow brass sections
and the whole orchestra can play together in harmony. However, when
certain instruments are about to play solo, the behavior of said
instruments should be kept in mind when it comes to acoustic design.
3.3.3. Analyses for Opera
The final analyses of this section are of the selected pieces in the opera style. Once
again, 100 examples of opera music were analyzed in spectrogram view. The pieces
were selected to reflect the overall history of opera. A full list of opera pieces can be
found in the Appendices section of this thesis.
In the previous two sections, Turkish classical music and western classical music were
analyzed. Before continuing with opera, a quick reminder of the analyses of TCM and
western classical music might assist in the inspection of the opera pieces. As recalled,
TCM had a distinct pattern in terms of frequency spectra and musical structure,
whereas western classical music was more volatile. Opera on the other hand, lies
somewhere in between these two styles of music.
Just like TCM, vocals are a crucial element of an opera and occasionally, there are
multiple vocals or even a choir. This creates an essential necessity to be able to locate
the position of individual vocals in order to distinguish who is singing on the stage
during an opera. On the other hand, there is also a symphony orchestra in most operatic
pieces, creating a similarity in certain aspects with western classical music. There are
song progressions throughout an opera piece just as in western classical pieces. Since
operas tell a story or an event via music and acting, the overall atmosphere tends to
change according to the emotions that are reflected. Instruments might start playing
louder or softer, there may be parts where the vocal sings solo or the instruments
accompany the vocals with harmony, or some parts may even be solely composed of
instruments, without vocals. In other words, opera can be considered a blend of the
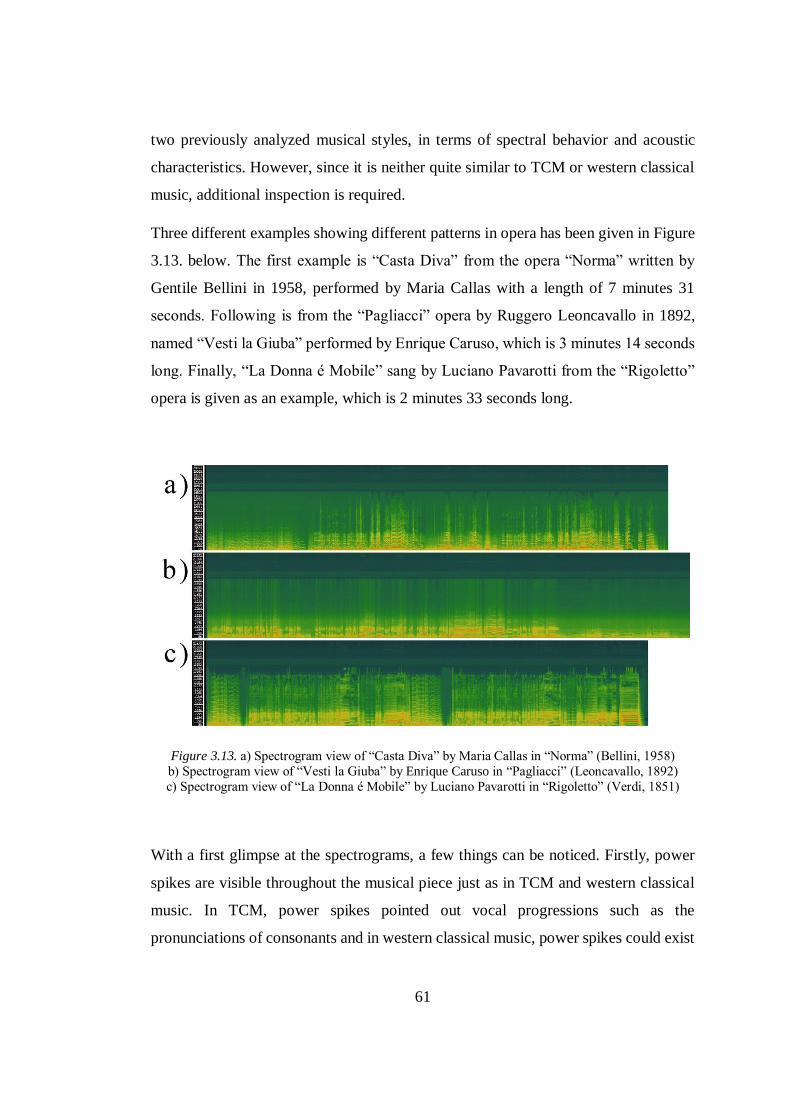
61
two previously analyzed musical styles, in terms of spectral behavior and acoustic
characteristics. However, since it is neither quite similar to TCM or western classical
music, additional inspection is required.
Three different examples showing different patterns in opera has been given in Figure
3.13. below. The first example is “Casta Diva” from the opera “Norma” written by
Gentile Bellini in 1958, performed by Maria Callas with a length of 7 minutes 31
seconds. Following is from the “Pagliacci” opera by Ruggero Leoncavallo in 1892,
named “Vesti la Giuba” performed by Enrique Caruso, which is 3 minutes 14 seconds
long. Finally, “La Donna é Mobile” sang by Luciano Pavarotti from the “Rigoletto”
opera is given as an example, which is 2 minutes 33 seconds long.
Figure 3.13. a) Spectrogram view of “Casta Diva” by Maria Callas in “Norma” (Bellini, 1958)
b) Spectrogram view of “Vesti la Giuba” by Enrique Caruso in “Pagliacci” (Leoncavallo, 1892)
c) Spectrogram view of “La Donna é Mobile” by Luciano Pavarotti in “Rigoletto” (Verdi, 1851)
With a first glimpse at the spectrograms, a few things can be noticed. Firstly, power
spikes are visible throughout the musical piece just as in TCM and western classical
music. In TCM, power spikes pointed out vocal progressions such as the
pronunciations of consonants and in western classical music, power spikes could exist
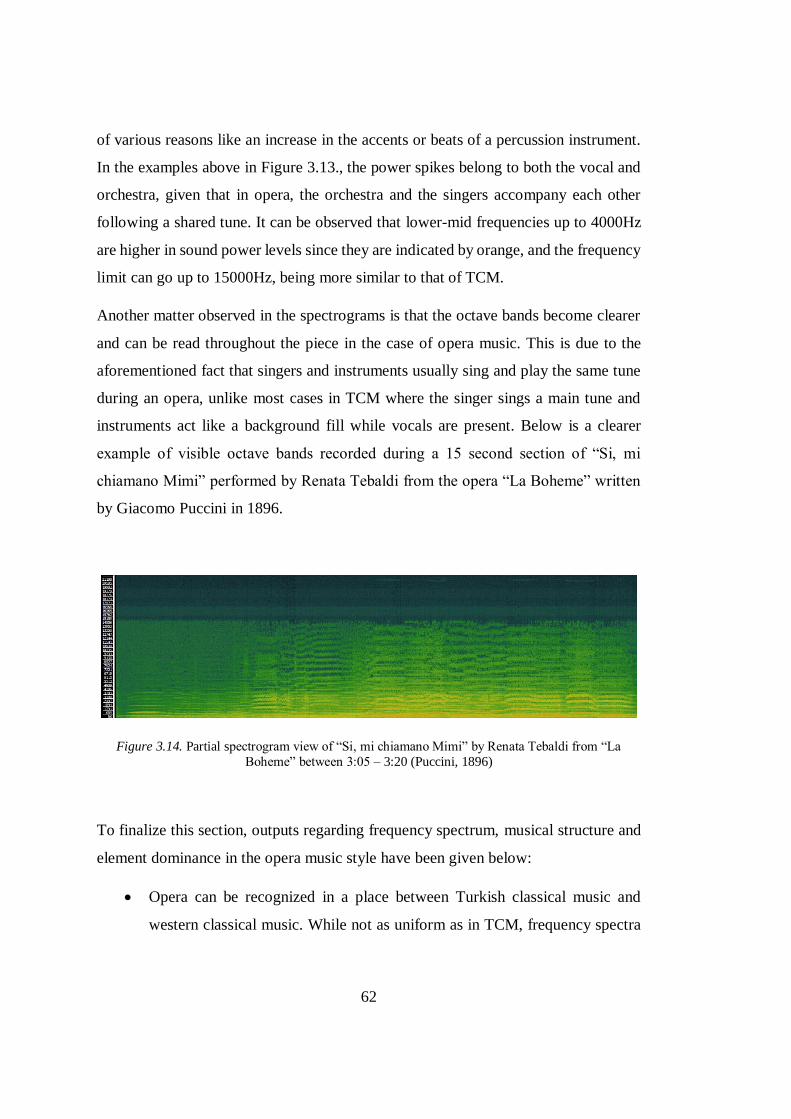
62
of various reasons like an increase in the accents or beats of a percussion instrument.
In the examples above in Figure 3.13., the power spikes belong to both the vocal and
orchestra, given that in opera, the orchestra and the singers accompany each other
following a shared tune. It can be observed that lower-mid frequencies up to 4000Hz
are higher in sound power levels since they are indicated by orange, and the frequency
limit can go up to 15000Hz, being more similar to that of TCM.
Another matter observed in the spectrograms is that the octave bands become clearer
and can be read throughout the piece in the case of opera music. This is due to the
aforementioned fact that singers and instruments usually sing and play the same tune
during an opera, unlike most cases in TCM where the singer sings a main tune and
instruments act like a background fill while vocals are present. Below is a clearer
example of visible octave bands recorded during a 15 second section of “Si, mi
chiamano Mimi” performed by Renata Tebaldi from the opera “La Boheme” written
by Giacomo Puccini in 1896.
Figure 3.14. Partial spectrogram view of “Si, mi chiamano Mimi” by Renata Tebaldi from “La
Boheme” between 3:05 – 3:20 (Puccini, 1896)
To finalize this section, outputs regarding frequency spectrum, musical structure and
element dominance in the opera music style have been given below:
Opera can be recognized in a place between Turkish classical music and
western classical music. While not as uniform as in TCM, frequency spectra
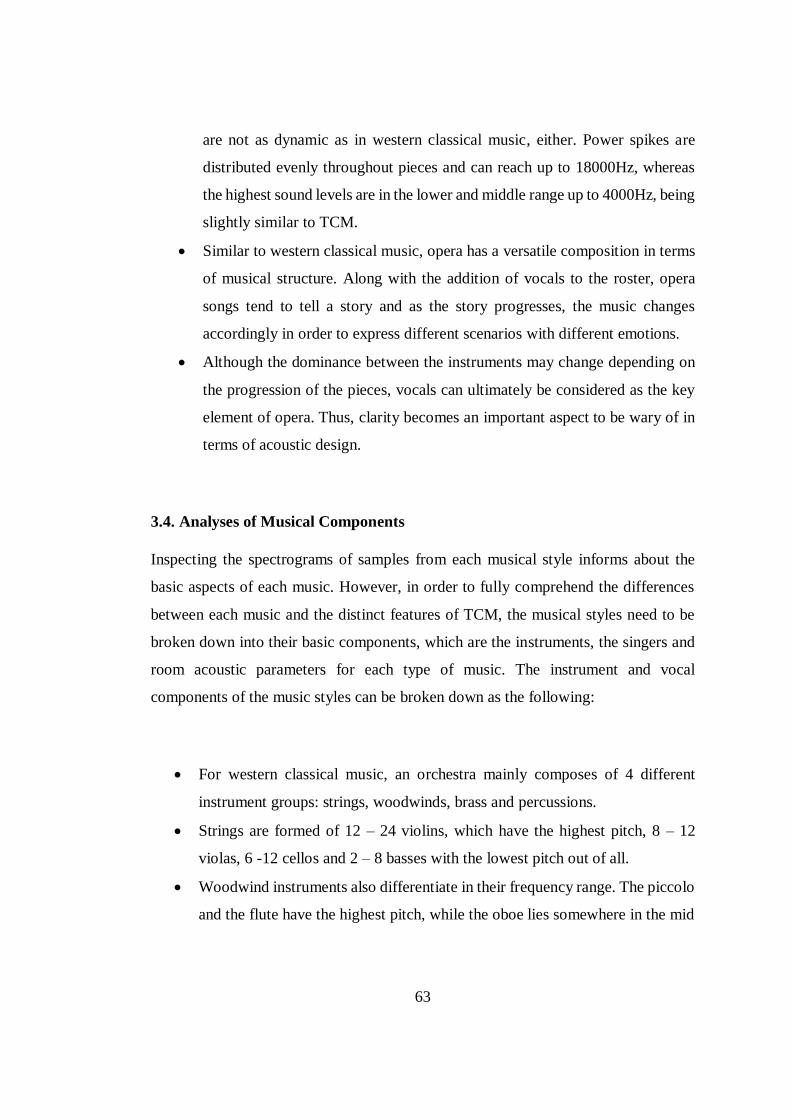
63
are not as dynamic as in western classical music, either. Power spikes are
distributed evenly throughout pieces and can reach up to 18000Hz, whereas
the highest sound levels are in the lower and middle range up to 4000Hz, being
slightly similar to TCM.
Similar to western classical music, opera has a versatile composition in terms
of musical structure. Along with the addition of vocals to the roster, opera
songs tend to tell a story and as the story progresses, the music changes
accordingly in order to express different scenarios with different emotions.
Although the dominance between the instruments may change depending on
the progression of the pieces, vocals can ultimately be considered as the key
element of opera. Thus, clarity becomes an important aspect to be wary of in
terms of acoustic design.
3.4. Analyses of Musical Components
Inspecting the spectrograms of samples from each musical style informs about the
basic aspects of each music. However, in order to fully comprehend the differences
between each music and the distinct features of TCM, the musical styles need to be
broken down into their basic components, which are the instruments, the singers and
room acoustic parameters for each type of music. The instrument and vocal
components of the music styles can be broken down as the following:
For western classical music, an orchestra mainly composes of 4 different
instrument groups: strings, woodwinds, brass and percussions.
Strings are formed of 12 – 24 violins, which have the highest pitch, 8 – 12
violas, 6 -12 cellos and 2 – 8 basses with the lowest pitch out of all.
Woodwind instruments also differentiate in their frequency range. The piccolo
and the flute have the highest pitch, while the oboe lies somewhere in the mid
64
frequencies. The bassoon has a range in the low frequencies, and lastly, the
clarinet is known to cover a wide frequency range, from low to high.
Brass instruments have different ranges, as well as the other instrument groups.
The highest pitched of all is the trumpet, while the French horn covers mid to
high frequencies. The trombone has a range of low to mid frequencies. Lastly,
the tuba has the lowest pitch which is in the low frequencies.
Percussions can be divided into two groups as pitched and non-pitched
percussions. Pitched percussions include instruments such as the piano, the
xylophone, the marimba and the timpani. The piano can cover a wide range of
frequency, while the xylophone and the marimba are usually in the mid to high
frequencies. Non-pitched percussions comprise mainly of drums and cymbals.
The snare drum has a higher frequency range than the bass drum, which has a
bass sound with a range in the low frequencies. The cymbal sections provide
high frequency sounds.
Figure 3.15. The basic components of a symphony orchestra
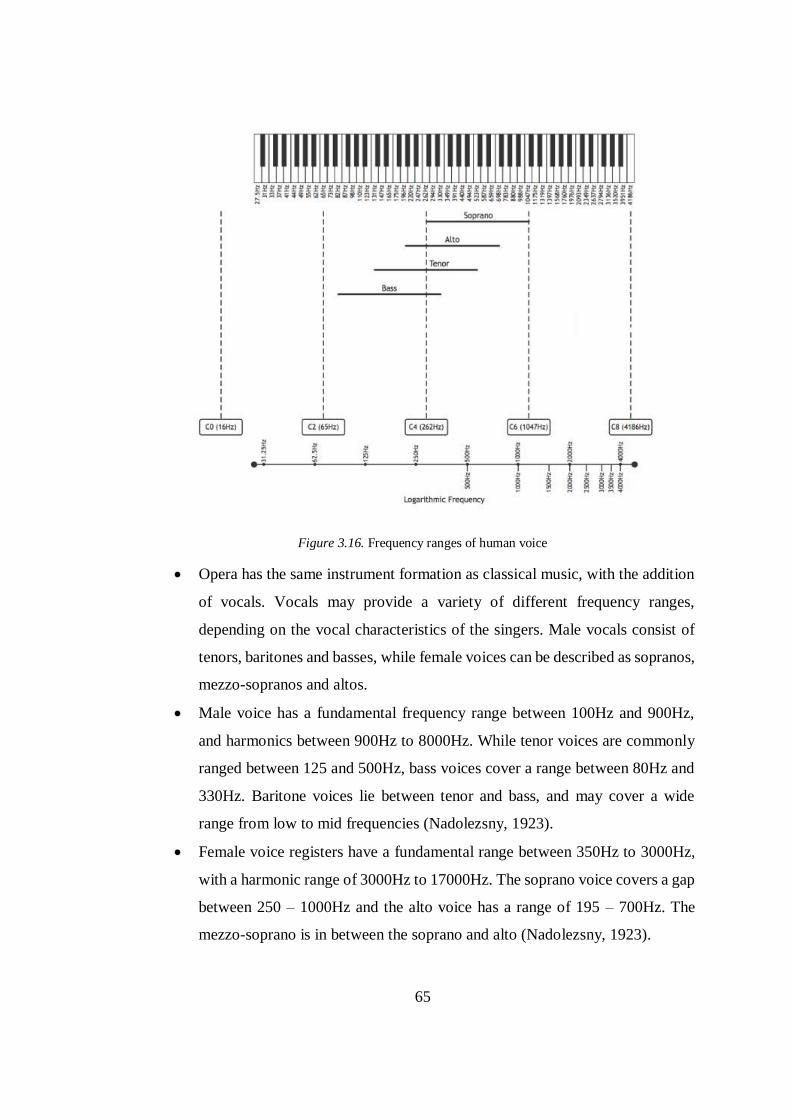
65
Figure 3.16. Frequency ranges of human voice
Opera has the same instrument formation as classical music, with the addition
of vocals. Vocals may provide a variety of different frequency ranges,
depending on the vocal characteristics of the singers. Male vocals consist of
tenors, baritones and basses, while female voices can be described as sopranos,
mezzo-sopranos and altos.
Male voice has a fundamental frequency range between 100Hz and 900Hz,
and harmonics between 900Hz to 8000Hz. While tenor voices are commonly
ranged between 125 and 500Hz, bass voices cover a range between 80Hz and
330Hz. Baritone voices lie between tenor and bass, and may cover a wide
range from low to mid frequencies (Nadolezsny, 1923).
Female voice registers have a fundamental range between 350Hz to 3000Hz,
with a harmonic range of 3000Hz to 17000Hz. The soprano voice covers a gap
between 250 – 1000Hz and the alto voice has a range of 195 – 700Hz. The
mezzo-soprano is in between the soprano and alto (Nadolezsny, 1923).
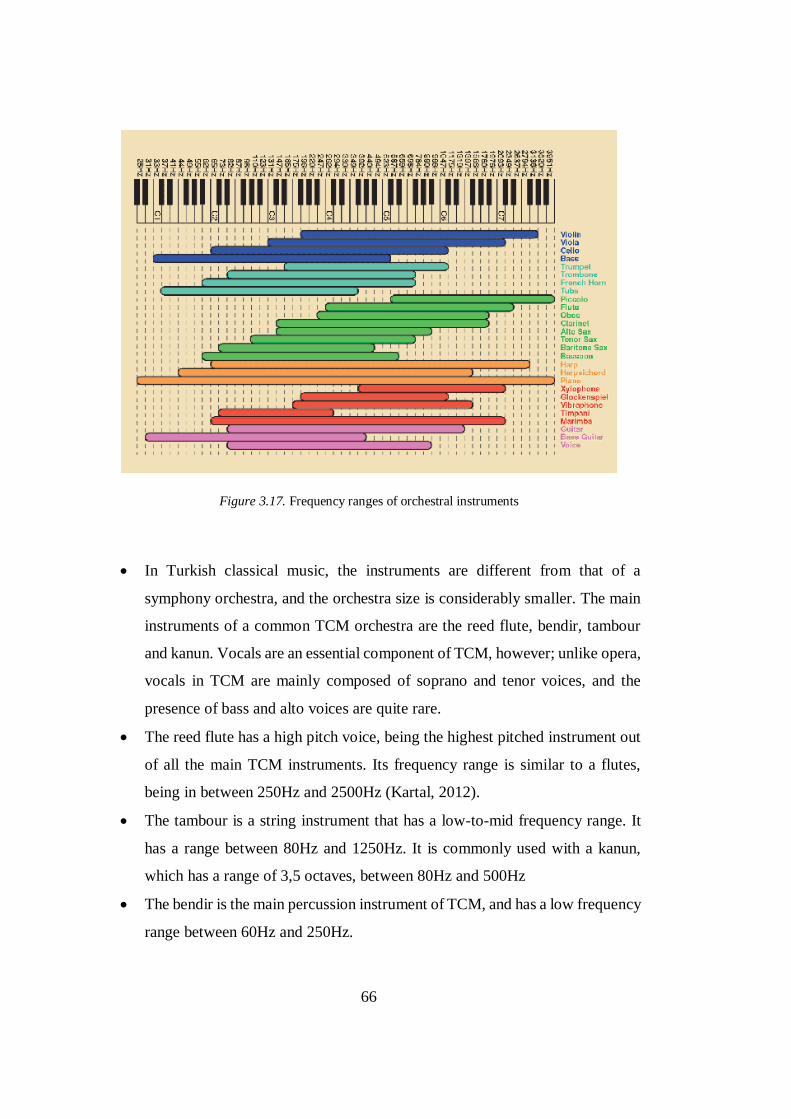
66
Figure 3.17. Frequency ranges of orchestral instruments
In Turkish classical music, the instruments are different from that of a
symphony orchestra, and the orchestra size is considerably smaller. The main
instruments of a common TCM orchestra are the reed flute, bendir, tambour
and kanun. Vocals are an essential component of TCM, however; unlike opera,
vocals in TCM are mainly composed of soprano and tenor voices, and the
presence of bass and alto voices are quite rare.
The reed flute has a high pitch voice, being the highest pitched instrument out
of all the main TCM instruments. Its frequency range is similar to a flutes,
being in between 250Hz and 2500Hz (Kartal, 2012).
The tambour is a string instrument that has a low-to-mid frequency range. It
has a range between 80Hz and 1250Hz. It is commonly used with a kanun,
which has a range of 3,5 octaves, between 80Hz and 500Hz
The bendir is the main percussion instrument of TCM, and has a low frequency
range between 60Hz and 250Hz.
67
Regarding the room acoustic parameters needed for classical music, opera and TCM;
the specifications may be listed as follows:
Western classical music is heard best in rectangular shaped rooms. The
acceptable volume per listener is considered to be 8 to 11 cubic meters. The
optimum reverberation times for classical music is between 1,8 and 2,2
seconds. Early decay time values that are more than 1,1 times the RT value is
accepted as successful. C80 and D50 values are observed best between -4 dB
and +4 dB, and 0,45 – 0,60 respectively. Bass ratios that are higher than 1,00
result in a better listening experience. For classical music, a BR value between
1,00 – 1,40 is considered acceptable (Beranek, 1996).
Horseshoe shaped halls are commonly preferred for opera. For the room size,
6 to 8 cubic meters is considered to be acceptable. Optimum RT values are
most successful results when in between 1,3 and 1,8 seconds. EDT values are
best recognized between 1,40 and 1,75 seconds. C80, D50 and BR values may
be accepted the same for opera as to western classical music (Beranek, 1996).
Turkish classical music is known to be performed in small rooms during the
Ottoman period. There is limited information on the acoustic qualities of
rooms where TCM was performed, and no widely-acknowledged standards
for TCM acoustic parameters. Currently, parameters that are accepted for
chamber music is considered feasible for TCM. However, further inspection
and research on this topic is sought today. The acceptable RT value for
chamber music is between 0,8 and 1,1 seconds. The C80 parameter is believed
to be most successful between 0 and +4 dB. BR values between 1,1 and 1,2
can be considered favorable (Özçevik & Yüksel Can, 2015).
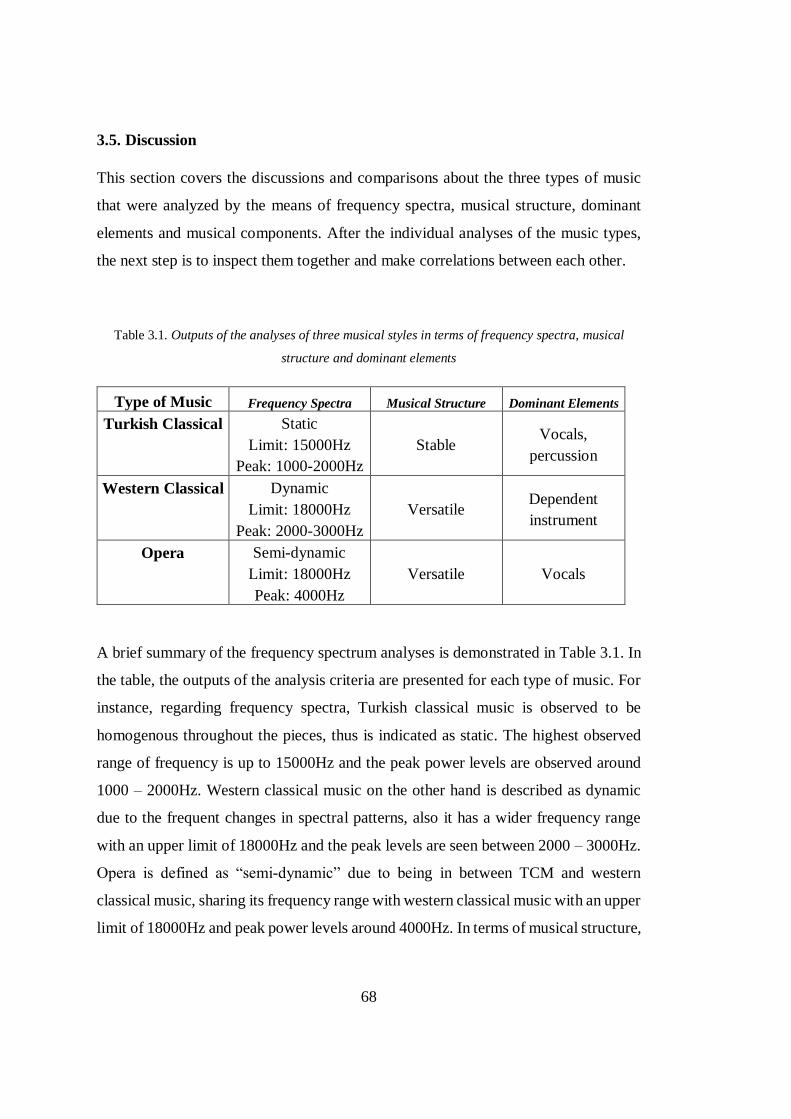
68
3.5. Discussion
This section covers the discussions and comparisons about the three types of music
that were analyzed by the means of frequency spectra, musical structure, dominant
elements and musical components. After the individual analyses of the music types,
the next step is to inspect them together and make correlations between each other.
Table 3.1. Outputs of the analyses of three musical styles in terms of frequency spectra, musical
structure and dominant elements
Type of Music Frequency Spectra Musical Structure Dominant Elements
Turkish Classical Static
Limit: 15000Hz
Peak: 1000-2000Hz
Stable Vocals,
percussion
Western Classical Dynamic
Limit: 18000Hz
Peak: 2000-3000Hz
Versatile Dependent
instrument
Opera Semi-dynamic
Limit: 18000Hz
Peak: 4000Hz
Versatile Vocals
A brief summary of the frequency spectrum analyses is demonstrated in Table 3.1. In
the table, the outputs of the analysis criteria are presented for each type of music. For
instance, regarding frequency spectra, Turkish classical music is observed to be
homogenous throughout the pieces, thus is indicated as static. The highest observed
range of frequency is up to 15000Hz and the peak power levels are observed around
1000 – 2000Hz. Western classical music on the other hand is described as dynamic
due to the frequent changes in spectral patterns, also it has a wider frequency range
with an upper limit of 18000Hz and the peak levels are seen between 2000 – 3000Hz.
Opera is defined as “semi-dynamic” due to being in between TCM and western
classical music, sharing its frequency range with western classical music with an upper
limit of 18000Hz and peak power levels around 4000Hz. In terms of musical structure,
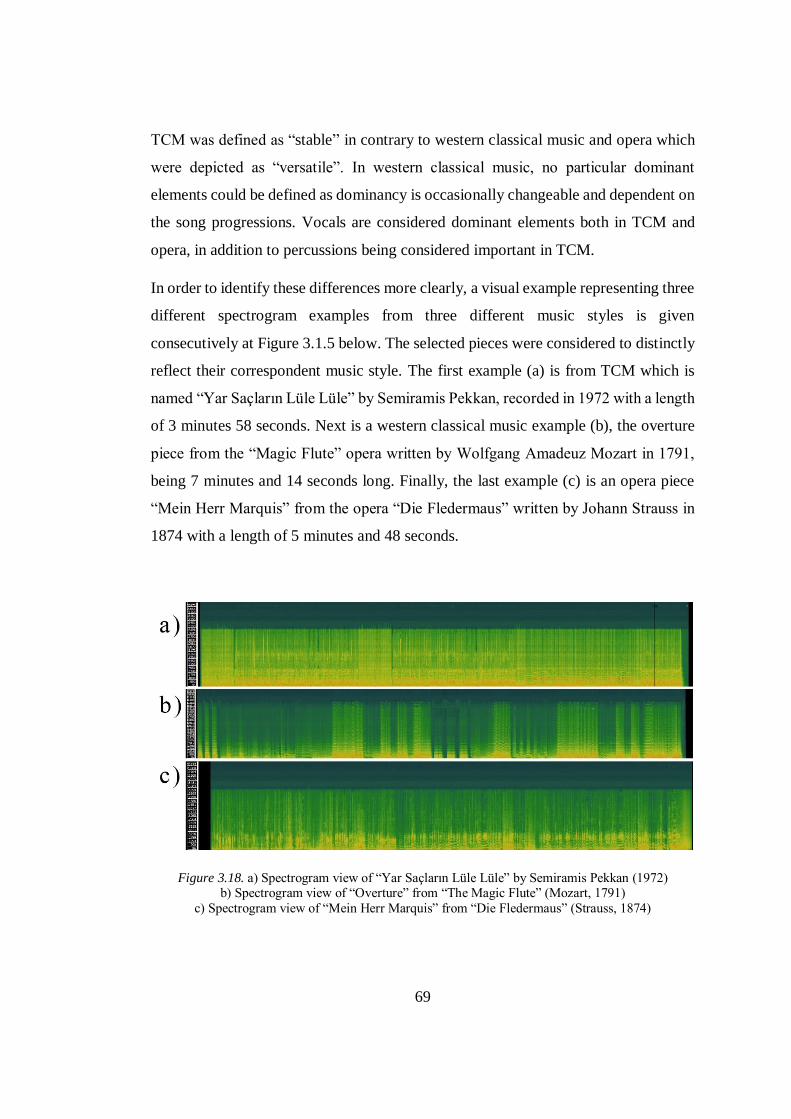
69
TCM was defined as “stable” in contrary to western classical music and opera which
were depicted as “versatile”. In western classical music, no particular dominant
elements could be defined as dominancy is occasionally changeable and dependent on
the song progressions. Vocals are considered dominant elements both in TCM and
opera, in addition to percussions being considered important in TCM.
In order to identify these differences more clearly, a visual example representing three
different spectrogram examples from three different music styles is given
consecutively at Figure 3.1.5 below. The selected pieces were considered to distinctly
reflect their correspondent music style. The first example (a) is from TCM which is
named “Yar Saçların Lüle Lüle” by Semiramis Pekkan, recorded in 1972 with a length
of 3 minutes 58 seconds. Next is a western classical music example (b), the overture
piece from the “Magic Flute” opera written by Wolfgang Amadeuz Mozart in 1791,
being 7 minutes and 14 seconds long. Finally, the last example (c) is an opera piece
“Mein Herr Marquis” from the opera “Die Fledermaus” written by Johann Strauss in
1874 with a length of 5 minutes and 48 seconds.
Figure 3.18. a) Spectrogram view of “Yar Saçların Lüle Lüle” by Semiramis Pekkan (1972) b) Spectrogram view of “Overture” from “The Magic Flute” (Mozart, 1791)
c) Spectrogram view of “Mein Herr Marquis” from “Die Fledermaus” (Strauss, 1874)
70
Examining the three spectrogram examples yields clearer information about the
differences and similarities between the music styles. In the first example (a), the
frequency “border” can be distinguished, with an upper limit of 14000Hz and peak
power levels between 1000 – 2000Hz. The latter examples (b) and (c) display the
dynamic spectral changes over time and versatile musical structure as opposed to the
static progression in TCM (a). Power spikes can be seen throughout all three examples,
indicating vocal patterns in (a) and (c) and cymbal blasts in (b), however; they are
much more recognizable in (b) and (c) unlike (a). Although dominant elements cannot
be identified solely by inspecting the spectrograms, the presence of frequent power
spikes in (a) points out the possibility of speech, furthermore, octave bands can be
observed in all three, indicating the presence of musical sounds which then can be
interpreted as harmonized vocals with instruments.
Different performance types require different acoustic conditions, as mentioned
earlier. Barron (1993) suggested optimum reverberation times (RT) for mid
frequencies should be approximately between 1,8 and 2,2 seconds for classical music,
and between 1,3 and 1,8 seconds for opera depending on the type. Reverberation times
for low frequencies may be 1.2 – 1.4 RT and high frequencies may be 0.8 RT (Egan,
1977). Early decay times (EDT) between 2,25 and 2,75 seconds are considered to give
the best results for concert halls and optimum results were observed around 1,40 –
1,75 seconds for opera houses (Beranek, 2004). Clarity (C80) values for classical music
and opera are most successful between -4 dB and +4 dB, however values between 0
and +4 dB are considered slightly more successful, in addition; distinctness (D50)
values are known to provide the best results between 0,45 – 0,60 (Beranek, 1996).
Table 3.2. below presents the breakdown of major features for each type of music.
Classical music and opera both house symphony orchestras with a large quantity of
musicians. Turkish classical music, on the other hand, has a smaller orchestra
commonly with 4 to 10 people.
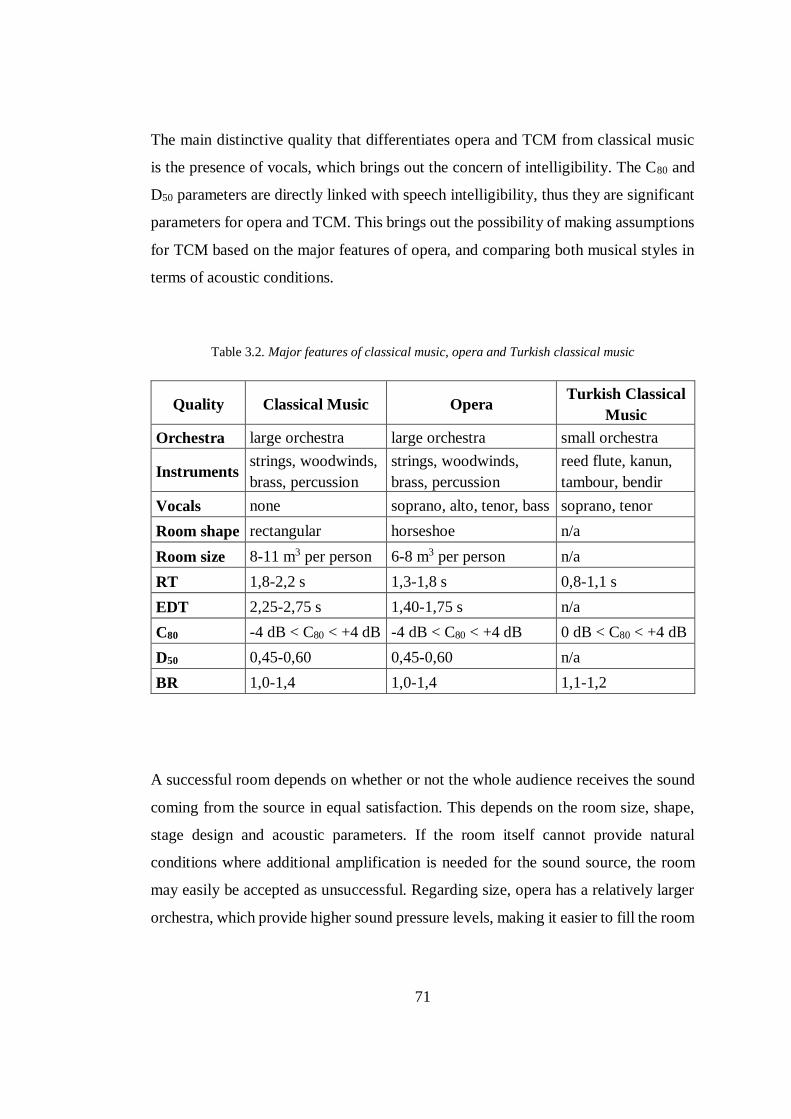
71
The main distinctive quality that differentiates opera and TCM from classical music
is the presence of vocals, which brings out the concern of intelligibility. The C80 and
D50 parameters are directly linked with speech intelligibility, thus they are significant
parameters for opera and TCM. This brings out the possibility of making assumptions
for TCM based on the major features of opera, and comparing both musical styles in
terms of acoustic conditions.
Table 3.2. Major features of classical music, opera and Turkish classical music
Quality Classical Music Opera Turkish Classical
Music
Orchestra large orchestra large orchestra small orchestra
Instruments strings, woodwinds,
brass, percussion
strings, woodwinds,
brass, percussion
reed flute, kanun,
tambour, bendir
Vocals none soprano, alto, tenor, bass soprano, tenor
Room shape rectangular horseshoe n/a
Room size 8-11 m3 per person 6-8 m3 per person n/a
RT 1,8-2,2 s 1,3-1,8 s 0,8-1,1 s
EDT 2,25-2,75 s 1,40-1,75 s n/a
C80 -4 dB < C80 < +4 dB -4 dB < C80 < +4 dB 0 dB < C80 < +4 dB
D50 0,45-0,60 0,45-0,60 n/a
BR 1,0-1,4 1,0-1,4 1,1-1,2
A successful room depends on whether or not the whole audience receives the sound
coming from the source in equal satisfaction. This depends on the room size, shape,
stage design and acoustic parameters. If the room itself cannot provide natural
conditions where additional amplification is needed for the sound source, the room
may easily be accepted as unsuccessful. Regarding size, opera has a relatively larger
orchestra, which provide higher sound pressure levels, making it easier to fill the room
72
and reach the audience. TCM, however, has a smaller orchestra, thus needing
amplification in most cases. This may bring out the question of the room size and
shape, which affect the RT and EDT values that are required for TCM where no
amplification is necessary for successful results.
Instruments that are used in opera are the same as a symphony orchestra, where
various instruments from four instrument groups have an overall wide range of
frequency. TCM has a limited number of traditional Turkish instruments, with a
limited range in terms of frequency, in response to opera. The reed flute is more
dominant in mid-to-high frequencies, where the kanun, tambour and bendir have a low
frequency range. Hence, it can be assumed that the management of low frequencies
are essential for TCM and the BR parameter is directly linked to this matter.
Additionally, the higher pitched vocals and the reed flute also need to avoid masking
from low frequencies, which brings out the TR parameter in question.
The discussions that were made above can be summarized as:
Turkish music and opera both have vocals as their distinctive feature. C80 and
D50 parameters play a large role on the acoustic conditions for both.
RT and EDT values are significant parameters to determine room shapes and
sizes for TCM, where amplification is not needed.
While opera has a wide frequency range due to the variety of different
instrument groups, TCM is more predominantly based in the low-to-mid
frequencies. The BR parameter is directly linked to this matter, thus becomes
a significant factor regarding the acoustic conditions of TCM.
As a result of soprano and tenor voices being more common in TCM, high
frequencies require to be clear and distinct. This depends on the TR parameter
and needs to be dealt with for optimum results.
73
Previous literature points out that although some studies have been done to analyze
the acoustic parameters for existing spaces where Turkish music was performed
during the Ottoman period, no studies were found in the scope of determining
optimum acoustic conditions for TCM.
A study done by Gülçin Konuk (2010) inspects four case studies of closed spaces in
Ottoman palaces, typically music chambers in their master’s thesis, and puts forth
several suggestions for future studies for acoustic conditions of TCM. Konuk
recommends that until further studies have been made to determine optimum
conditions, parameters for chamber music could be taken as a reference when
examining similar traditional spaces. However, Konuk’s analyses of the four spaces
yield results that are far from optimum conditions, especially in terms of C80 values.
Konuk suggests that a new C80 value should be determined for TCM.
Özçevik & Yüksel Can (2015) have also proposed a method for the evaluation of
rooms used for performing Turkish music. Three different rooms were examined in
terms of room acoustic parameters and objective parameters were correlated with
subjective parameters. Fırat & Yüksel Can (2015) have made a study on the acoustic
properties of Mevlevi lodges (Mevlevihane) where TCM used to be performed. In
both of these studies, the optimum parameters for chamber music were considered as
applicable for TCM, since there was no information available regarding actual
optimum values for TCM.
The distinguishing factor of this thesis that differentiates from previous studies
regarding Turkish music is that while previous studies focused on the evaluation of
existing spaces, this study mainly focuses on creating a guideline to design a room
from scratch that is able to meet the conditions for TCM.
This study gives an example on the lack of acoustic design for Turkish music and
points out that spaces for music were not designed and calculated deliberately or
intentionally, and were built without acoustic concerns in mind. This becomes an issue
for both performers and listeners of Turkish music. Since no building was designed to
74
fit TCM conditions (even though some may have coincidentally), Turkish music was
never given the opportunity to fully transfer its musical characteristics in its ideal
forms. This thesis is considered to be a guideline and a starting point for future studies
in the aim of achieving better conditions for TCM and improve the quality of Turkish
music, perhaps even bring back the art form as it was commonly appreciated and
acknowledged as it used to be.
75
CHAPTER 4
4. MATERIALS AND METHODOLOGY
In this chapter, the materials and method of the study is to be presented. The first
section talks about the materials used for the study. Anechoic recordings of five
different TCM pieces were provided by the courtesy of previous researchers who were
involved in a TUBİTAK project that had to be postponed due to limited budget and
time. These recordings are then transferred into Odeon room acoustics software to be
auralised in three different performance spaces with different RT, EDT, C80, D50, BR
and TR values.
Carrying on, further experiments are conveyed in the aim of obtaining suitable
parameters for TCM. A box shaped room is modelled in Odeon and the conditions of
an anechoic room are calibrated into the model. Next, the objective acoustic
parameters of the room are adjusted by changing the reflective materials of the room.
Auralisations are made and listened along with each adjustment, and better conditions
are created with each step. The conditions are decided by deriving from current
information on classical music, opera and chamber music, along with assumptions that
were developed from the analyses in Chapter 3.
Afterwards, the auralisations made in the box room are presented to a test group of
experts to be listened. The listeners are asked to fill out an evaluation form about the
different conditions for each song. The evaluation consists of a semantic differential
scale test of the following parameters: clarity, warmth, richness, intimacy and overall
satisfaction. The subjective results of the test are used to determine possible optimum
acoustic conditions and parameters for TCM.
The outputs derived from the listening test are then applied to the three performance
spaces in hopes of enhancing the acoustic quality and bringing it closer to an optimum.
76
A second listening test is conducted to the same test group where the existent
conditions of the performance spaces and the improved conditions are asked to be
compared. The subjective results of the questionnaire are then correlated with the
objective parameters of the three spaces. Results are discussed in the fifth chapter.
4.1. Anechoic Room Recordings
This study aims to find out suitable acoustic parameter values for TCM, hence the
listeners should be able to hear examples of Turkish music as if they were in the room
themselves in order to assess the acoustic quality of said spaces. The first step on doing
this is making an anechoic recording of a TCM performance. Since this study has had
its limitations, the author was unable to create their own recordings. However,
recordings from a previously done research by Özçevik & Yüksel Can (2015) were
used for the study, with the authors’ permissions. The recordings were taken in the
anechoic chamber which belongs to TUBİTAK National Metrology Institute, with the
conduction of Prof. Dr. Ruhi Ayangil and an orchestra of six instruments. A total of
five recordings and the instruments that were used in this study are as follows:
Sample 1: Female vocal, male vocal, tambour, kanun
Sample 2: Reed flute, bendir, tambout (instrumental)
Sample 3: Single reed flute partition in hicaz makam
Sample 4: Female vocal, male vocal, bendir, reed flute, kanun
Sample 5: Female vocal, male vocal, bendir, tambour, kanun
The examples mentioned above are then taken into Odeon room acoustics software
and auralisations are made using the convolution method. Detailed information on the
performance spaces for the auralisations are presented in the next section.
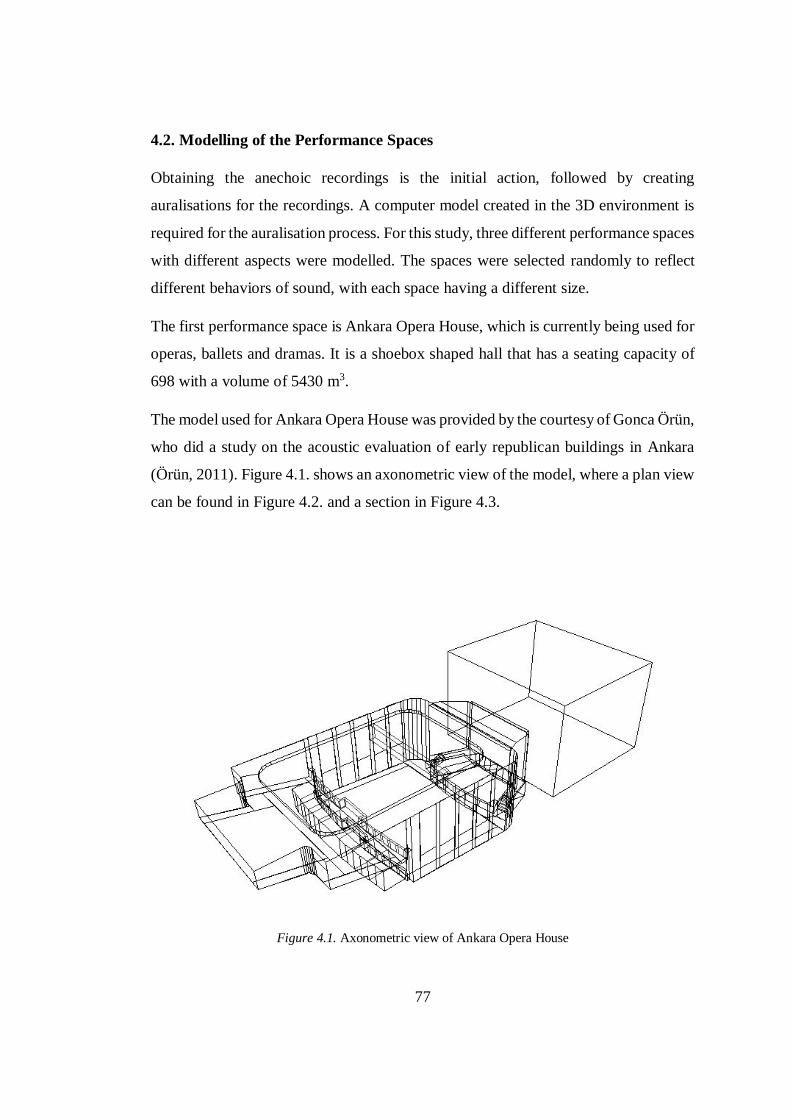
77
4.2. Modelling of the Performance Spaces
Obtaining the anechoic recordings is the initial action, followed by creating
auralisations for the recordings. A computer model created in the 3D environment is
required for the auralisation process. For this study, three different performance spaces
with different aspects were modelled. The spaces were selected randomly to reflect
different behaviors of sound, with each space having a different size.
The first performance space is Ankara Opera House, which is currently being used for
operas, ballets and dramas. It is a shoebox shaped hall that has a seating capacity of
698 with a volume of 5430 m3.
The model used for Ankara Opera House was provided by the courtesy of Gonca Örün,
who did a study on the acoustic evaluation of early republican buildings in Ankara
(Örün, 2011). Figure 4.1. shows an axonometric view of the model, where a plan view
can be found in Figure 4.2. and a section in Figure 4.3.
Figure 4.1. Axonometric view of Ankara Opera House
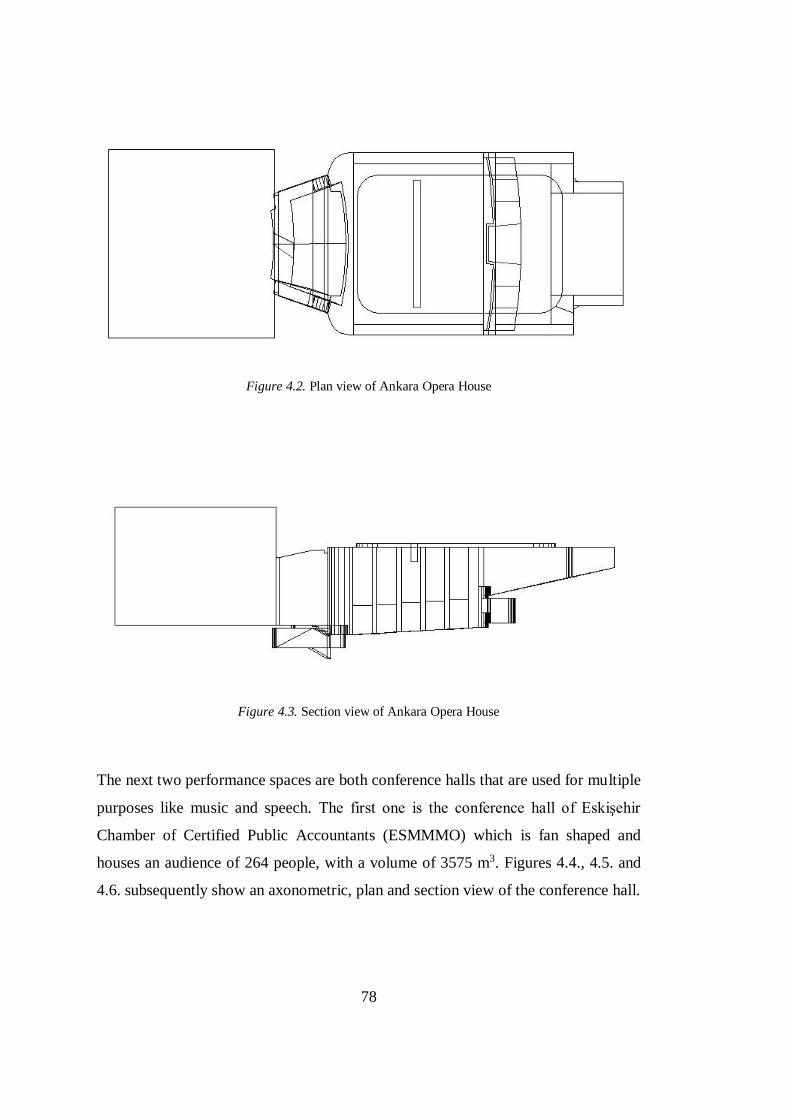
78
Figure 4.2. Plan view of Ankara Opera House
Figure 4.3. Section view of Ankara Opera House
The next two performance spaces are both conference halls that are used for multiple
purposes like music and speech. The first one is the conference hall of Eskişehir
Chamber of Certified Public Accountants (ESMMMO) which is fan shaped and
houses an audience of 264 people, with a volume of 3575 m3. Figures 4.4., 4.5. and
4.6. subsequently show an axonometric, plan and section view of the conference hall.
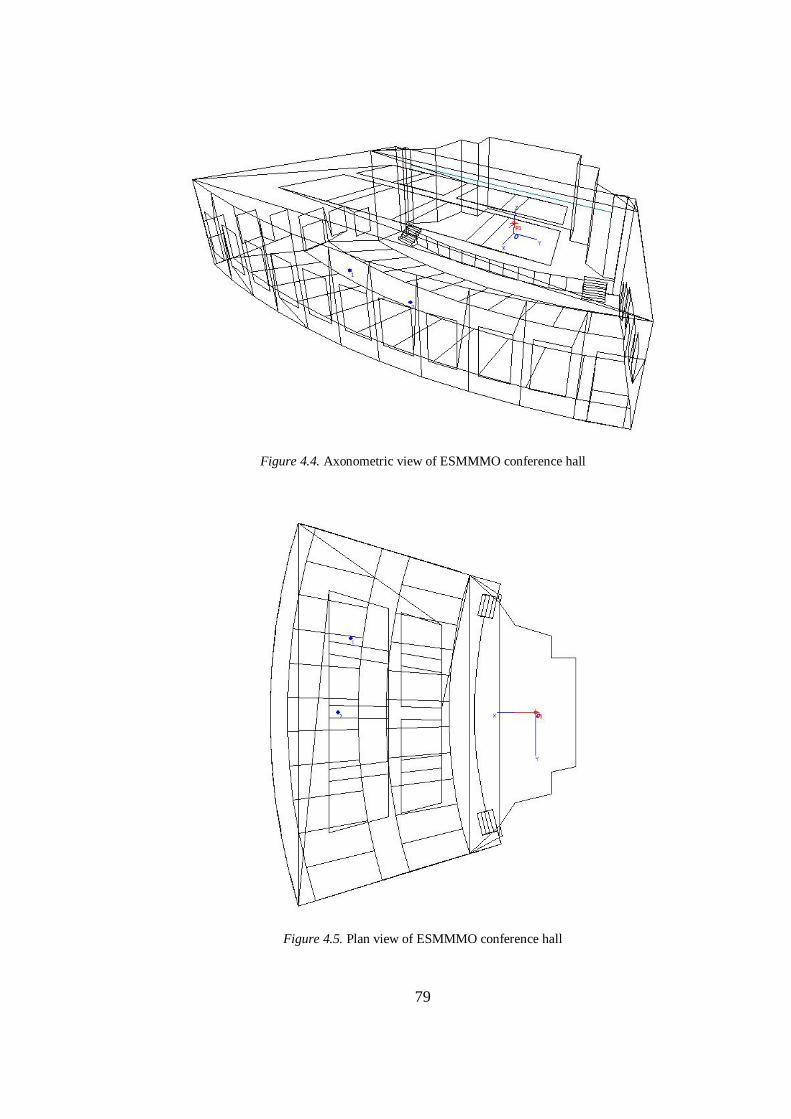
79
Figure 4.4. Axonometric view of ESMMMO conference hall
Figure 4.5. Plan view of ESMMMO conference hall
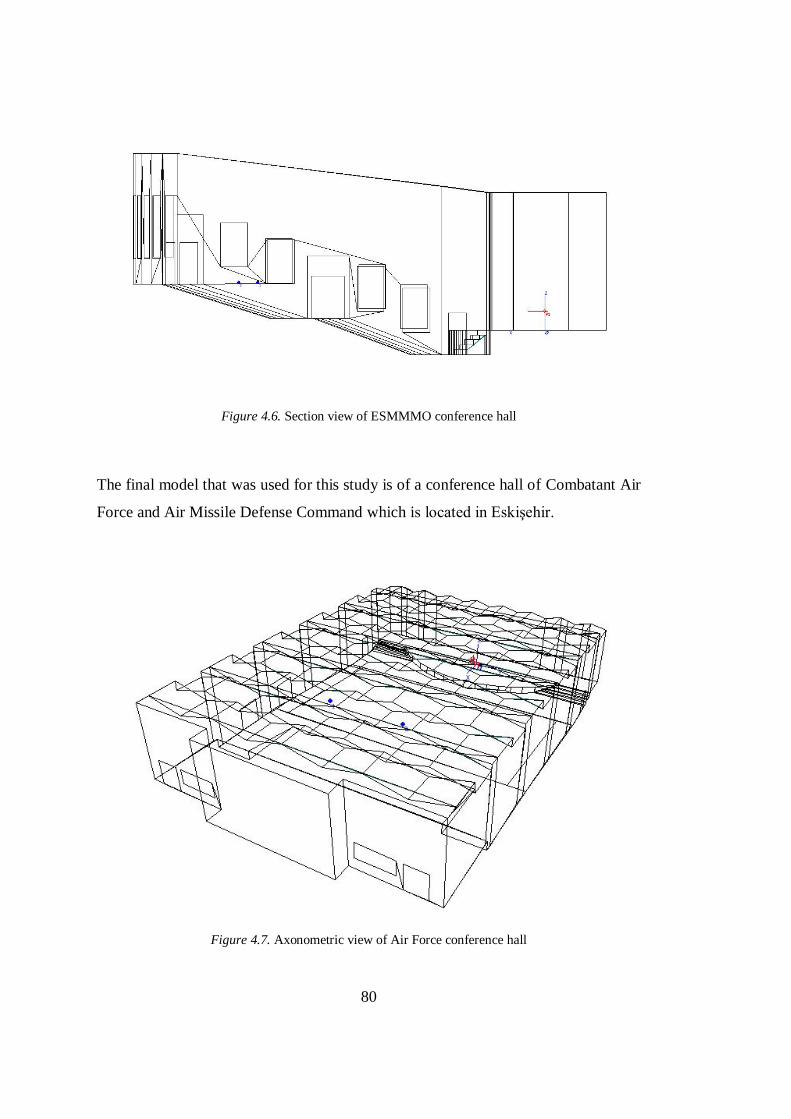
80
Figure 4.6. Section view of ESMMMO conference hall
The final model that was used for this study is of a conference hall of Combatant Air
Force and Air Missile Defense Command which is located in Eskişehir.
Figure 4.7. Axonometric view of Air Force conference hall
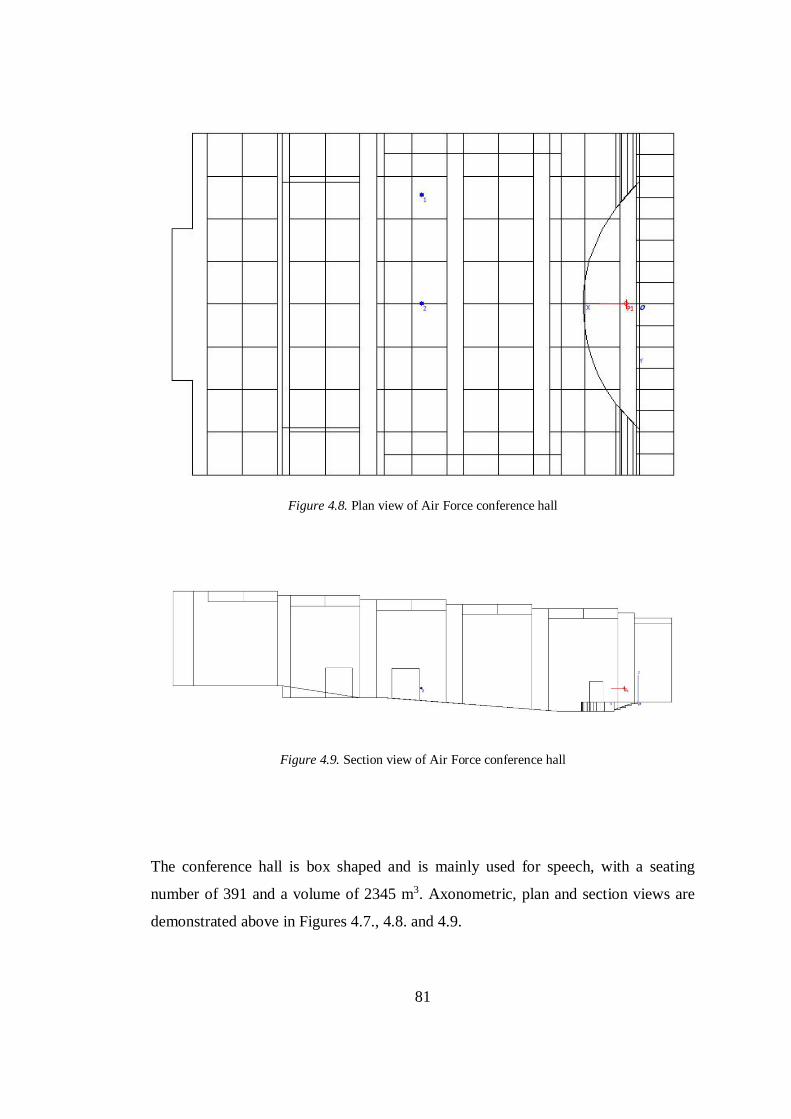
81
Figure 4.8. Plan view of Air Force conference hall
Figure 4.9. Section view of Air Force conference hall
The conference hall is box shaped and is mainly used for speech, with a seating
number of 391 and a volume of 2345 m3. Axonometric, plan and section views are
demonstrated above in Figures 4.7., 4.8. and 4.9.
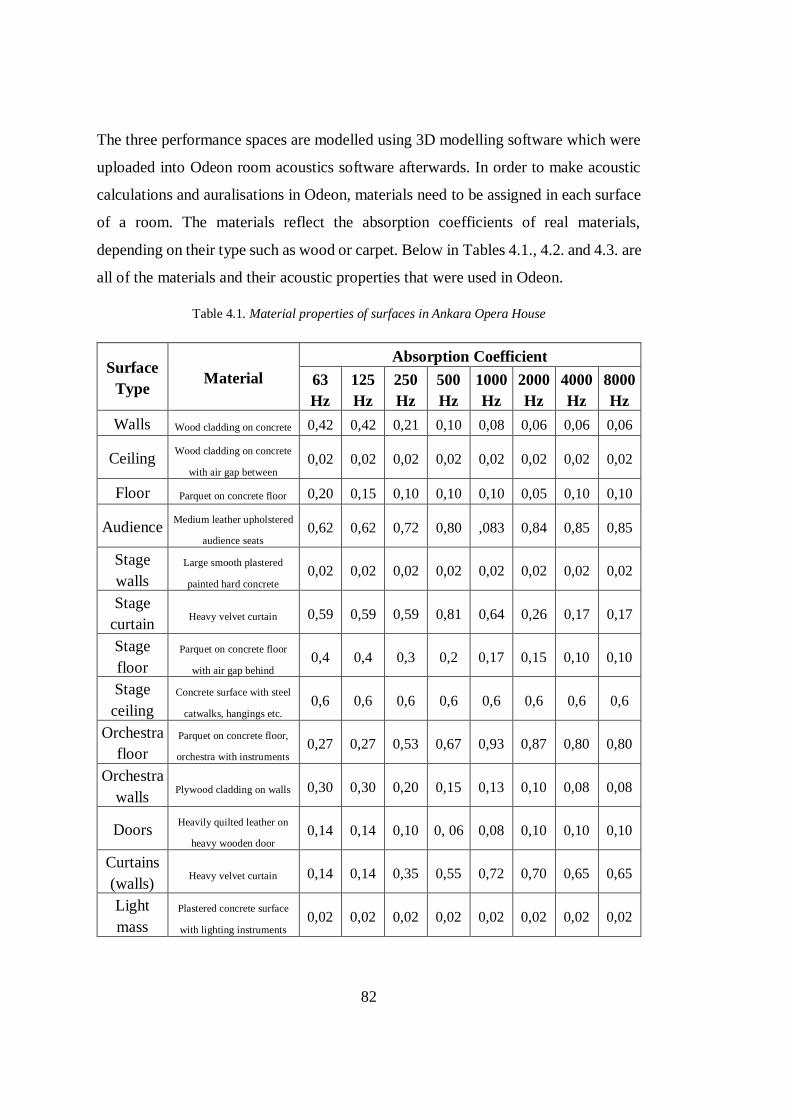
82
The three performance spaces are modelled using 3D modelling software which were
uploaded into Odeon room acoustics software afterwards. In order to make acoustic
calculations and auralisations in Odeon, materials need to be assigned in each surface
of a room. The materials reflect the absorption coefficients of real materials,
depending on their type such as wood or carpet. Below in Tables 4.1., 4.2. and 4.3. are
all of the materials and their acoustic properties that were used in Odeon.
Table 4.1. Material properties of surfaces in Ankara Opera House
Surface
Type Material
Absorption Coefficient
63
Hz
125
Hz
250
Hz
500
Hz
1000
Hz
2000
Hz
4000
Hz
8000
Hz
Walls Wood cladding on concrete 0,42 0,42 0,21 0,10 0,08 0,06 0,06 0,06
Ceiling Wood cladding on concrete
with air gap between 0,02 0,02 0,02 0,02 0,02 0,02 0,02 0,02
Floor Parquet on concrete floor 0,20 0,15 0,10 0,10 0,10 0,05 0,10 0,10
Audience Medium leather upholstered
audience seats 0,62 0,62 0,72 0,80 ,083 0,84 0,85 0,85
Stage
walls
Large smooth plastered
painted hard concrete 0,02 0,02 0,02 0,02 0,02 0,02 0,02 0,02
Stage
curtain Heavy velvet curtain 0,59 0,59 0,59 0,81 0,64 0,26 0,17 0,17
Stage
floor
Parquet on concrete floor
with air gap behind 0,4 0,4 0,3 0,2 0,17 0,15 0,10 0,10
Stage
ceiling
Concrete surface with steel
catwalks, hangings etc. 0,6 0,6 0,6 0,6 0,6 0,6 0,6 0,6
Orchestra
floor
Parquet on concrete floor,
orchestra with instruments 0,27 0,27 0,53 0,67 0,93 0,87 0,80 0,80
Orchestra
walls Plywood cladding on walls 0,30 0,30 0,20 0,15 0,13 0,10 0,08 0,08
Doors Heavily quilted leather on
heavy wooden door 0,14 0,14 0,10 0, 06 0,08 0,10 0,10 0,10
Curtains
(walls) Heavy velvet curtain 0,14 0,14 0,35 0,55 0,72 0,70 0,65 0,65
Light
mass
Plastered concrete surface
with lighting instruments 0,02 0,02 0,02 0,02 0,02 0,02 0,02 0,02
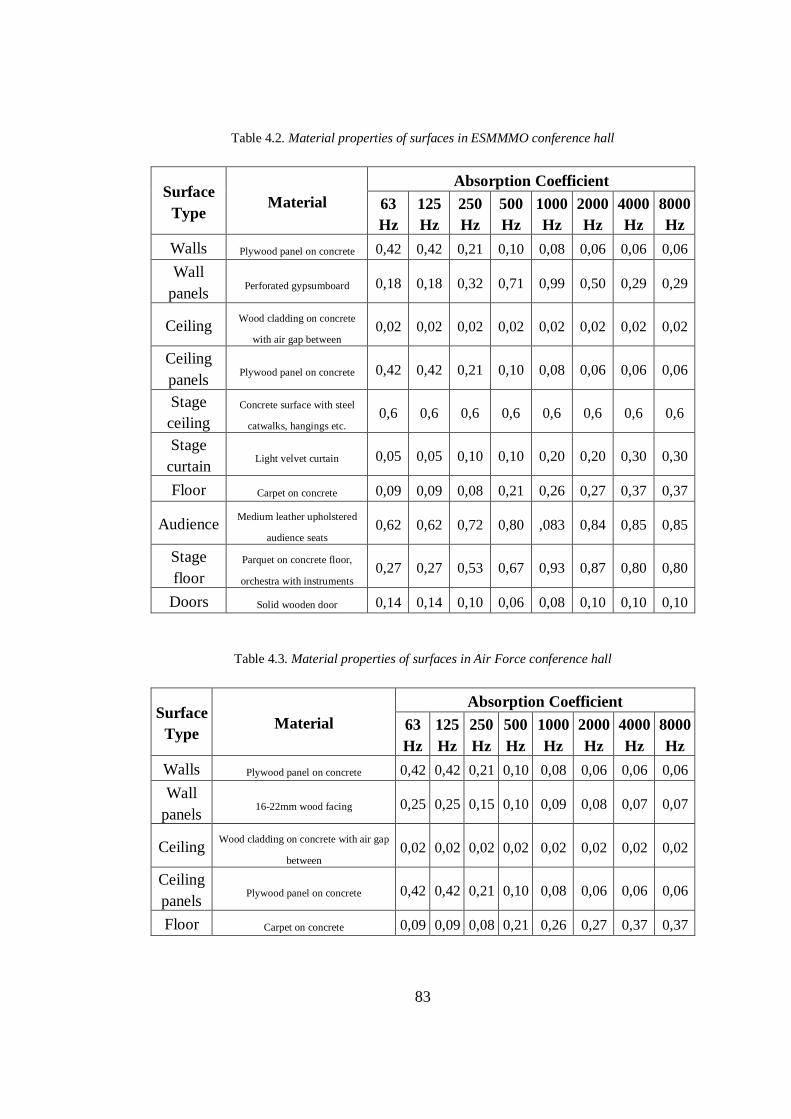
83
Table 4.2. Material properties of surfaces in ESMMMO conference hall
Surface
Type Material
Absorption Coefficient
63
Hz
125
Hz
250
Hz
500
Hz
1000
Hz
2000
Hz
4000
Hz
8000
Hz
Walls Plywood panel on concrete 0,42 0,42 0,21 0,10 0,08 0,06 0,06 0,06
Wall
panels Perforated gypsumboard 0,18 0,18 0,32 0,71 0,99 0,50 0,29 0,29
Ceiling Wood cladding on concrete
with air gap between 0,02 0,02 0,02 0,02 0,02 0,02 0,02 0,02
Ceiling
panels Plywood panel on concrete 0,42 0,42 0,21 0,10 0,08 0,06 0,06 0,06
Stage
ceiling
Concrete surface with steel
catwalks, hangings etc. 0,6 0,6 0,6 0,6 0,6 0,6 0,6 0,6
Stage
curtain Light velvet curtain 0,05 0,05 0,10 0,10 0,20 0,20 0,30 0,30
Floor Carpet on concrete 0,09 0,09 0,08 0,21 0,26 0,27 0,37 0,37
Audience Medium leather upholstered
audience seats 0,62 0,62 0,72 0,80 ,083 0,84 0,85 0,85
Stage
floor
Parquet on concrete floor,
orchestra with instruments 0,27 0,27 0,53 0,67 0,93 0,87 0,80 0,80
Doors Solid wooden door 0,14 0,14 0,10 0,06 0,08 0,10 0,10 0,10
Table 4.3. Material properties of surfaces in Air Force conference hall
Surface
Type Material
Absorption Coefficient
63
Hz
125
Hz
250
Hz
500
Hz
1000
Hz
2000
Hz
4000
Hz
8000
Hz
Walls Plywood panel on concrete 0,42 0,42 0,21 0,10 0,08 0,06 0,06 0,06
Wall
panels 16-22mm wood facing 0,25 0,25 0,15 0,10 0,09 0,08 0,07 0,07
Ceiling Wood cladding on concrete with air gap
between 0,02 0,02 0,02 0,02 0,02 0,02 0,02 0,02
Ceiling
panels Plywood panel on concrete 0,42 0,42 0,21 0,10 0,08 0,06 0,06 0,06
Floor Carpet on concrete 0,09 0,09 0,08 0,21 0,26 0,27 0,37 0,37
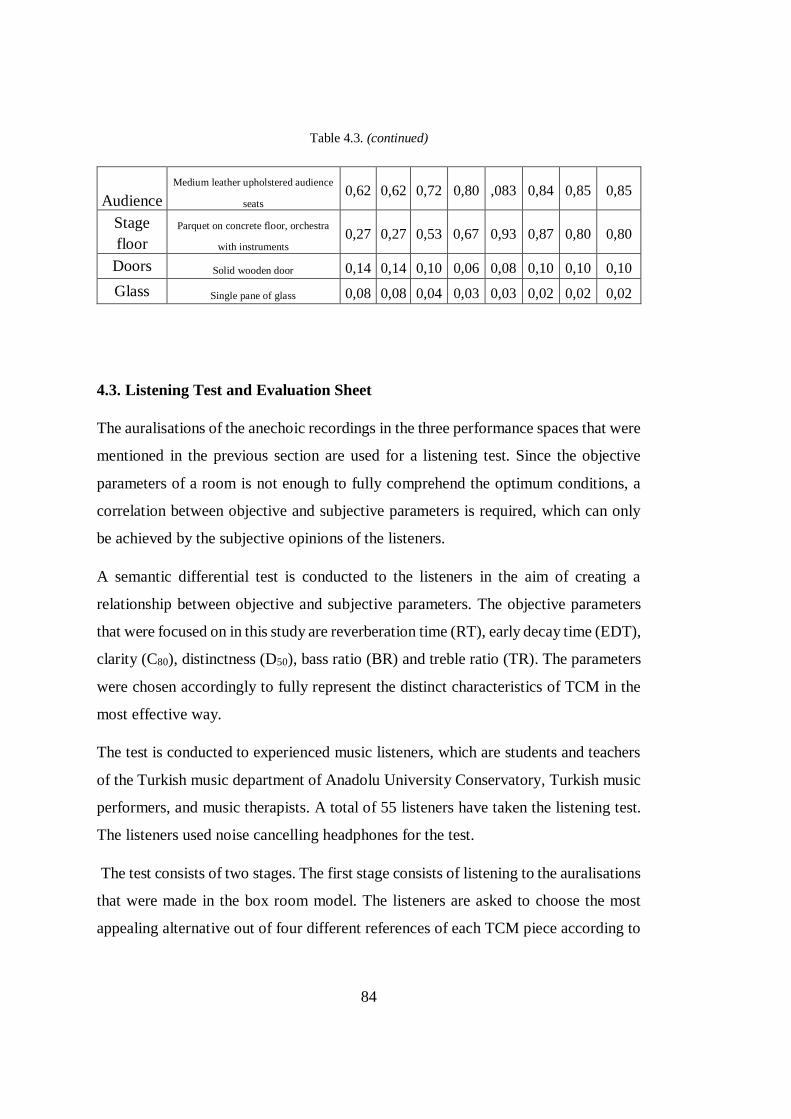
84
Table 4.3. (continued)
Audience
Medium leather upholstered audience
seats 0,62 0,62 0,72 0,80 ,083 0,84 0,85 0,85
Stage
floor
Parquet on concrete floor, orchestra
with instruments 0,27 0,27 0,53 0,67 0,93 0,87 0,80 0,80
Doors Solid wooden door 0,14 0,14 0,10 0,06 0,08 0,10 0,10 0,10
Glass Single pane of glass 0,08 0,08 0,04 0,03 0,03 0,02 0,02 0,02
4.3. Listening Test and Evaluation Sheet
The auralisations of the anechoic recordings in the three performance spaces that were
mentioned in the previous section are used for a listening test. Since the objective
parameters of a room is not enough to fully comprehend the optimum conditions, a
correlation between objective and subjective parameters is required, which can only
be achieved by the subjective opinions of the listeners.
A semantic differential test is conducted to the listeners in the aim of creating a
relationship between objective and subjective parameters. The objective parameters
that were focused on in this study are reverberation time (RT), early decay time (EDT),
clarity (C80), distinctness (D50), bass ratio (BR) and treble ratio (TR). The parameters
were chosen accordingly to fully represent the distinct characteristics of TCM in the
most effective way.
The test is conducted to experienced music listeners, which are students and teachers
of the Turkish music department of Anadolu University Conservatory, Turkish music
performers, and music therapists. A total of 55 listeners have taken the listening test.
The listeners used noise cancelling headphones for the test.
The test consists of two stages. The first stage consists of listening to the auralisations
that were made in the box room model. The listeners are asked to choose the most
appealing alternative out of four different references of each TCM piece according to
85
musical quality. Afterwards, the listeners are presented with 10 different alternatives
for a single TCM song, and are asked to select four alternatives which they find most
pleasing. Finally, the listeners are asked to fill out two evaluation sheets, one for the
alternative that they have appreciated the most, and one for the least.
The second stage involves listening to the existent and improved alternatives for each
TCM piece that were auralised in the three performance spaces. The listeners are then
asked to fill the aforementioned evaluation sheet for both instances, and to choose
between the two instances for different parameter preferences. A blank example of the
evaluation sheet can be found in the Appendices section of this thesis.

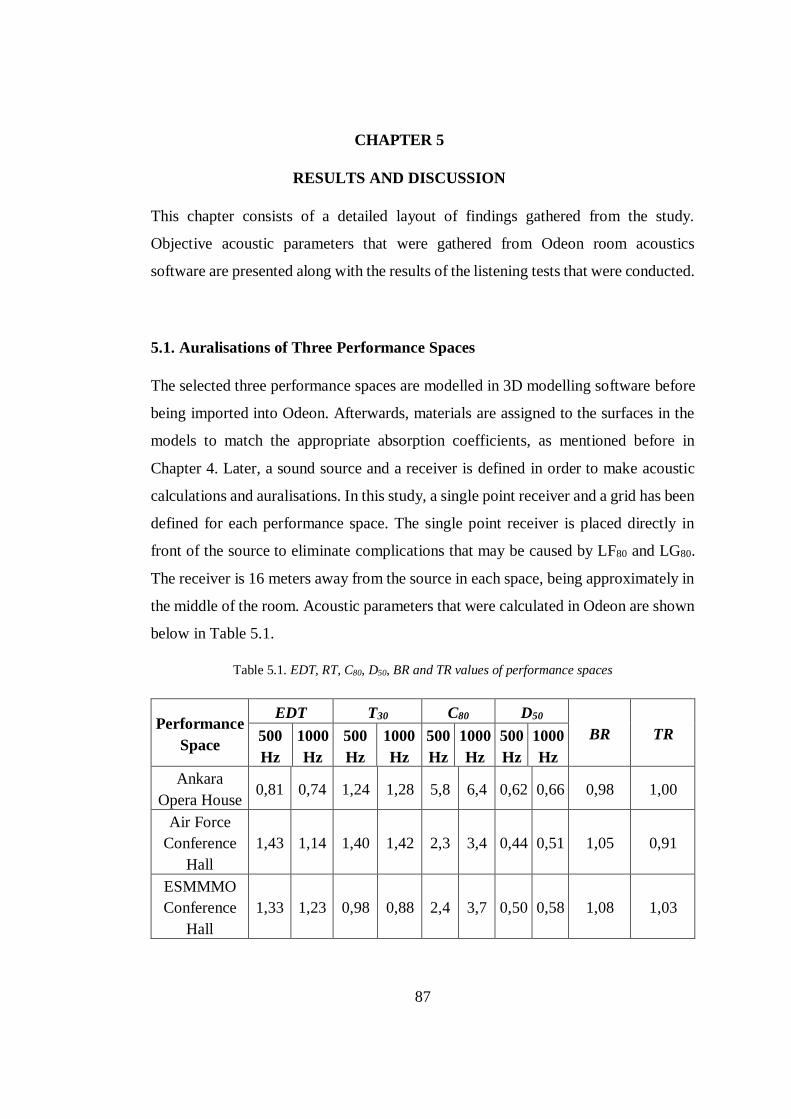
87
CHAPTER 5
5. RESULTS AND DISCUSSION
This chapter consists of a detailed layout of findings gathered from the study.
Objective acoustic parameters that were gathered from Odeon room acoustics
software are presented along with the results of the listening tests that were conducted.
5.1. Auralisations of Three Performance Spaces
The selected three performance spaces are modelled in 3D modelling software before
being imported into Odeon. Afterwards, materials are assigned to the surfaces in the
models to match the appropriate absorption coefficients, as mentioned before in
Chapter 4. Later, a sound source and a receiver is defined in order to make acoustic
calculations and auralisations. In this study, a single point receiver and a grid has been
defined for each performance space. The single point receiver is placed directly in
front of the source to eliminate complications that may be caused by LF80 and LG80.
The receiver is 16 meters away from the source in each space, being approximately in
the middle of the room. Acoustic parameters that were calculated in Odeon are shown
below in Table 5.1.
Table 5.1. EDT, RT, C80, D50, BR and TR values of performance spaces
Performance
Space
EDT T30 C80 D50
BR TR 500
Hz
1000
Hz
500
Hz
1000
Hz
500
Hz
1000
Hz
500
Hz
1000
Hz
Ankara
Opera House 0,81 0,74 1,24 1,28 5,8 6,4 0,62 0,66 0,98 1,00
Air Force
Conference
Hall
1,43 1,14 1,40 1,42 2,3 3,4 0,44 0,51 1,05 0,91
ESMMMO
Conference
Hall
1,33 1,23 0,98 0,88 2,4 3,7 0,50 0,58 1,08 1,03
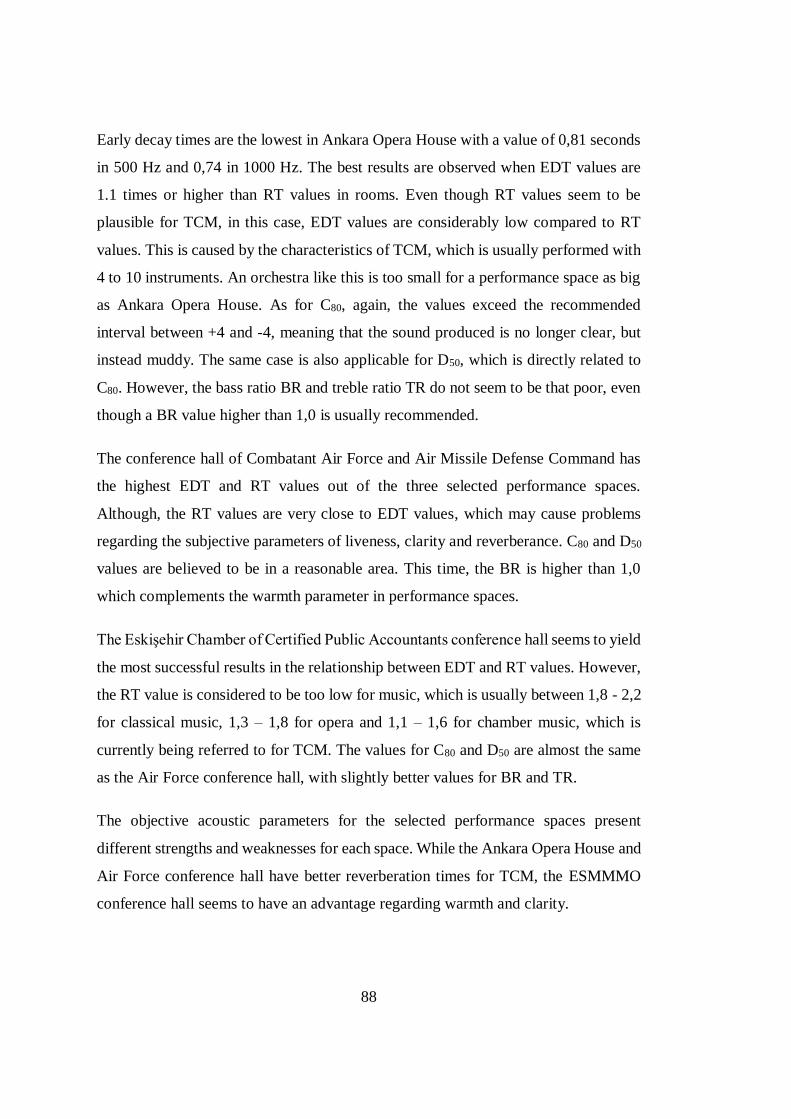
88
Early decay times are the lowest in Ankara Opera House with a value of 0,81 seconds
in 500 Hz and 0,74 in 1000 Hz. The best results are observed when EDT values are
1.1 times or higher than RT values in rooms. Even though RT values seem to be
plausible for TCM, in this case, EDT values are considerably low compared to RT
values. This is caused by the characteristics of TCM, which is usually performed with
4 to 10 instruments. An orchestra like this is too small for a performance space as big
as Ankara Opera House. As for C80, again, the values exceed the recommended
interval between +4 and -4, meaning that the sound produced is no longer clear, but
instead muddy. The same case is also applicable for D50, which is directly related to
C80. However, the bass ratio BR and treble ratio TR do not seem to be that poor, even
though a BR value higher than 1,0 is usually recommended.
The conference hall of Combatant Air Force and Air Missile Defense Command has
the highest EDT and RT values out of the three selected performance spaces.
Although, the RT values are very close to EDT values, which may cause problems
regarding the subjective parameters of liveness, clarity and reverberance. C80 and D50
values are believed to be in a reasonable area. This time, the BR is higher than 1,0
which complements the warmth parameter in performance spaces.
The Eskişehir Chamber of Certified Public Accountants conference hall seems to yield
the most successful results in the relationship between EDT and RT values. However,
the RT value is considered to be too low for music, which is usually between 1,8 - 2,2
for classical music, 1,3 – 1,8 for opera and 1,1 – 1,6 for chamber music, which is
currently being referred to for TCM. The values for C80 and D50 are almost the same
as the Air Force conference hall, with slightly better values for BR and TR.
The objective acoustic parameters for the selected performance spaces present
different strengths and weaknesses for each space. While the Ankara Opera House and
Air Force conference hall have better reverberation times for TCM, the ESMMMO
conference hall seems to have an advantage regarding warmth and clarity.
89
5.2. Anechoic Chamber Auralisations
A virtual box room is modelled after the auralisations of the selected three rooms. This
box is adjusted to have conditions close to the anechoic room in TUBİTAK National
Metrology Institute. Its dimensions are 8,89 x 3,99 x 3,53 meters. The walls of the
anechoic room are covered with Ferrite and carbon-impregnated hybrid sponges. In
Odeon, a custom material is made to imitate the absorption coefficients of the room.
Afterwards, the material absorption coefficients were altered into four different
reference points and reconstructed auralisations were made in order to assess the
acoustic quality of TCM recordings.
Figure 5.1. Axonometric view of the anechoic box room
References 1 through 4 were constructed in order to construct rooms that have
distinguishable RT values, with Reference 1 having the lowest RT and Reference 4
having the highest. As the RT values were modified, other parameters have changed
due to the changing room conditions, as well.
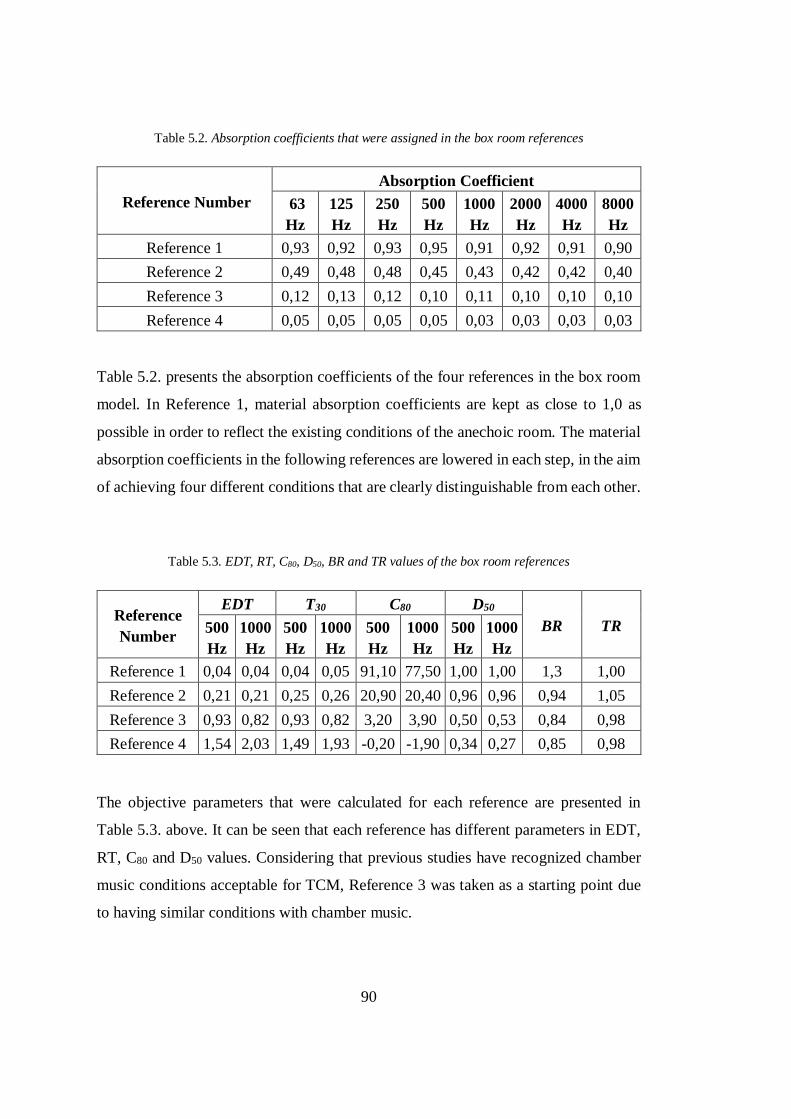
90
Table 5.2. Absorption coefficients that were assigned in the box room references
Reference Number
Absorption Coefficient
63
Hz
125
Hz
250
Hz
500
Hz
1000
Hz
2000
Hz
4000
Hz
8000
Hz
Reference 1 0,93 0,92 0,93 0,95 0,91 0,92 0,91 0,90
Reference 2 0,49 0,48 0,48 0,45 0,43 0,42 0,42 0,40
Reference 3 0,12 0,13 0,12 0,10 0,11 0,10 0,10 0,10
Reference 4 0,05 0,05 0,05 0,05 0,03 0,03 0,03 0,03
Table 5.2. presents the absorption coefficients of the four references in the box room
model. In Reference 1, material absorption coefficients are kept as close to 1,0 as
possible in order to reflect the existing conditions of the anechoic room. The material
absorption coefficients in the following references are lowered in each step, in the aim
of achieving four different conditions that are clearly distinguishable from each other.
Table 5.3. EDT, RT, C80, D50, BR and TR values of the box room references
Reference
Number
EDT T30 C80 D50
BR TR 500
Hz
1000
Hz
500
Hz
1000
Hz
500
Hz
1000
Hz
500
Hz
1000
Hz
Reference 1 0,04 0,04 0,04 0,05 91,10 77,50 1,00 1,00 1,3 1,00
Reference 2 0,21 0,21 0,25 0,26 20,90 20,40 0,96 0,96 0,94 1,05
Reference 3 0,93 0,82 0,93 0,82 3,20 3,90 0,50 0,53 0,84 0,98
Reference 4 1,54 2,03 1,49 1,93 -0,20 -1,90 0,34 0,27 0,85 0,98
The objective parameters that were calculated for each reference are presented in
Table 5.3. above. It can be seen that each reference has different parameters in EDT,
RT, C80 and D50 values. Considering that previous studies have recognized chamber
music conditions acceptable for TCM, Reference 3 was taken as a starting point due
to having similar conditions with chamber music.
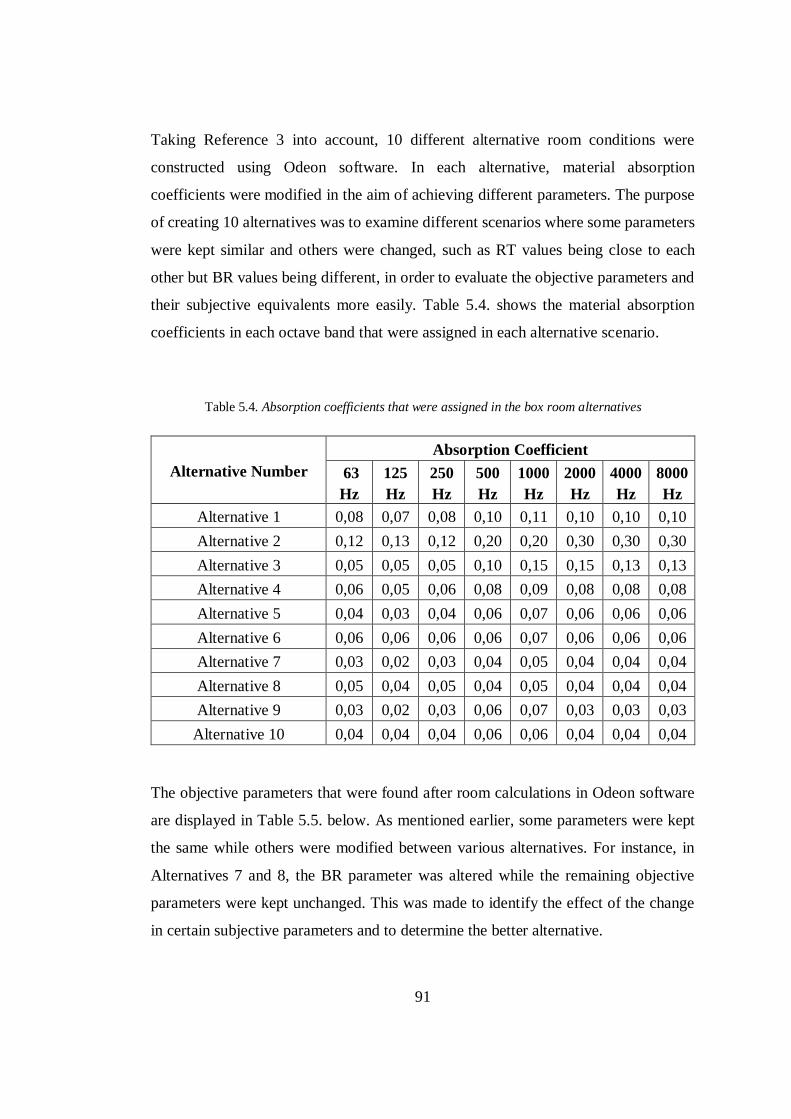
91
Taking Reference 3 into account, 10 different alternative room conditions were
constructed using Odeon software. In each alternative, material absorption
coefficients were modified in the aim of achieving different parameters. The purpose
of creating 10 alternatives was to examine different scenarios where some parameters
were kept similar and others were changed, such as RT values being close to each
other but BR values being different, in order to evaluate the objective parameters and
their subjective equivalents more easily. Table 5.4. shows the material absorption
coefficients in each octave band that were assigned in each alternative scenario.
Table 5.4. Absorption coefficients that were assigned in the box room alternatives
Alternative Number
Absorption Coefficient
63
Hz
125
Hz
250
Hz
500
Hz
1000
Hz
2000
Hz
4000
Hz
8000
Hz
Alternative 1 0,08 0,07 0,08 0,10 0,11 0,10 0,10 0,10
Alternative 2 0,12 0,13 0,12 0,20 0,20 0,30 0,30 0,30
Alternative 3 0,05 0,05 0,05 0,10 0,15 0,15 0,13 0,13
Alternative 4 0,06 0,05 0,06 0,08 0,09 0,08 0,08 0,08
Alternative 5 0,04 0,03 0,04 0,06 0,07 0,06 0,06 0,06
Alternative 6 0,06 0,06 0,06 0,06 0,07 0,06 0,06 0,06
Alternative 7 0,03 0,02 0,03 0,04 0,05 0,04 0,04 0,04
Alternative 8 0,05 0,04 0,05 0,04 0,05 0,04 0,04 0,04
Alternative 9 0,03 0,02 0,03 0,06 0,07 0,03 0,03 0,03
Alternative 10 0,04 0,04 0,04 0,06 0,06 0,04 0,04 0,04
The objective parameters that were found after room calculations in Odeon software
are displayed in Table 5.5. below. As mentioned earlier, some parameters were kept
the same while others were modified between various alternatives. For instance, in
Alternatives 7 and 8, the BR parameter was altered while the remaining objective
parameters were kept unchanged. This was made to identify the effect of the change
in certain subjective parameters and to determine the better alternative.
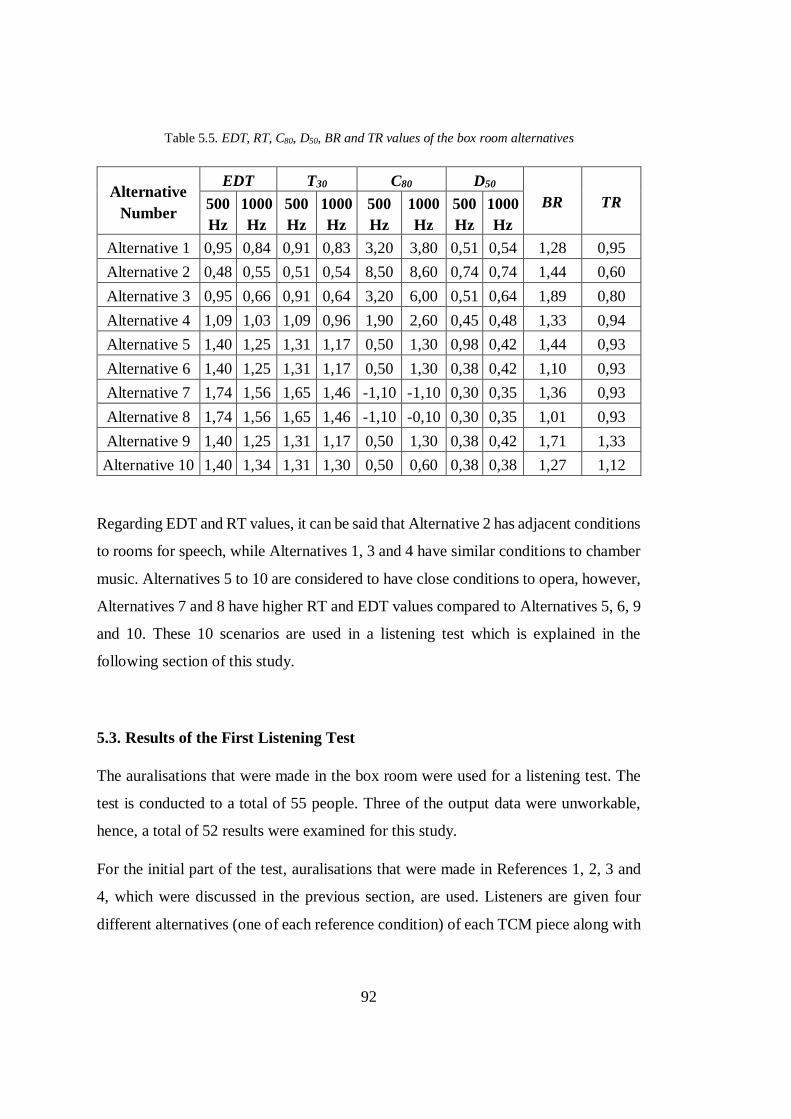
92
Table 5.5. EDT, RT, C80, D50, BR and TR values of the box room alternatives
Alternative
Number
EDT T30 C80 D50
BR TR 500
Hz
1000
Hz
500
Hz
1000
Hz
500
Hz
1000
Hz
500
Hz
1000
Hz
Alternative 1 0,95 0,84 0,91 0,83 3,20 3,80 0,51 0,54 1,28 0,95
Alternative 2 0,48 0,55 0,51 0,54 8,50 8,60 0,74 0,74 1,44 0,60
Alternative 3 0,95 0,66 0,91 0,64 3,20 6,00 0,51 0,64 1,89 0,80
Alternative 4 1,09 1,03 1,09 0,96 1,90 2,60 0,45 0,48 1,33 0,94
Alternative 5 1,40 1,25 1,31 1,17 0,50 1,30 0,98 0,42 1,44 0,93
Alternative 6 1,40 1,25 1,31 1,17 0,50 1,30 0,38 0,42 1,10 0,93
Alternative 7 1,74 1,56 1,65 1,46 -1,10 -1,10 0,30 0,35 1,36 0,93
Alternative 8 1,74 1,56 1,65 1,46 -1,10 -0,10 0,30 0,35 1,01 0,93
Alternative 9 1,40 1,25 1,31 1,17 0,50 1,30 0,38 0,42 1,71 1,33
Alternative 10 1,40 1,34 1,31 1,30 0,50 0,60 0,38 0,38 1,27 1,12
Regarding EDT and RT values, it can be said that Alternative 2 has adjacent conditions
to rooms for speech, while Alternatives 1, 3 and 4 have similar conditions to chamber
music. Alternatives 5 to 10 are considered to have close conditions to opera, however,
Alternatives 7 and 8 have higher RT and EDT values compared to Alternatives 5, 6, 9
and 10. These 10 scenarios are used in a listening test which is explained in the
following section of this study.
5.3. Results of the First Listening Test
The auralisations that were made in the box room were used for a listening test. The
test is conducted to a total of 55 people. Three of the output data were unworkable,
hence, a total of 52 results were examined for this study.
For the initial part of the test, auralisations that were made in References 1, 2, 3 and
4, which were discussed in the previous section, are used. Listeners are given four
different alternatives (one of each reference condition) of each TCM piece along with
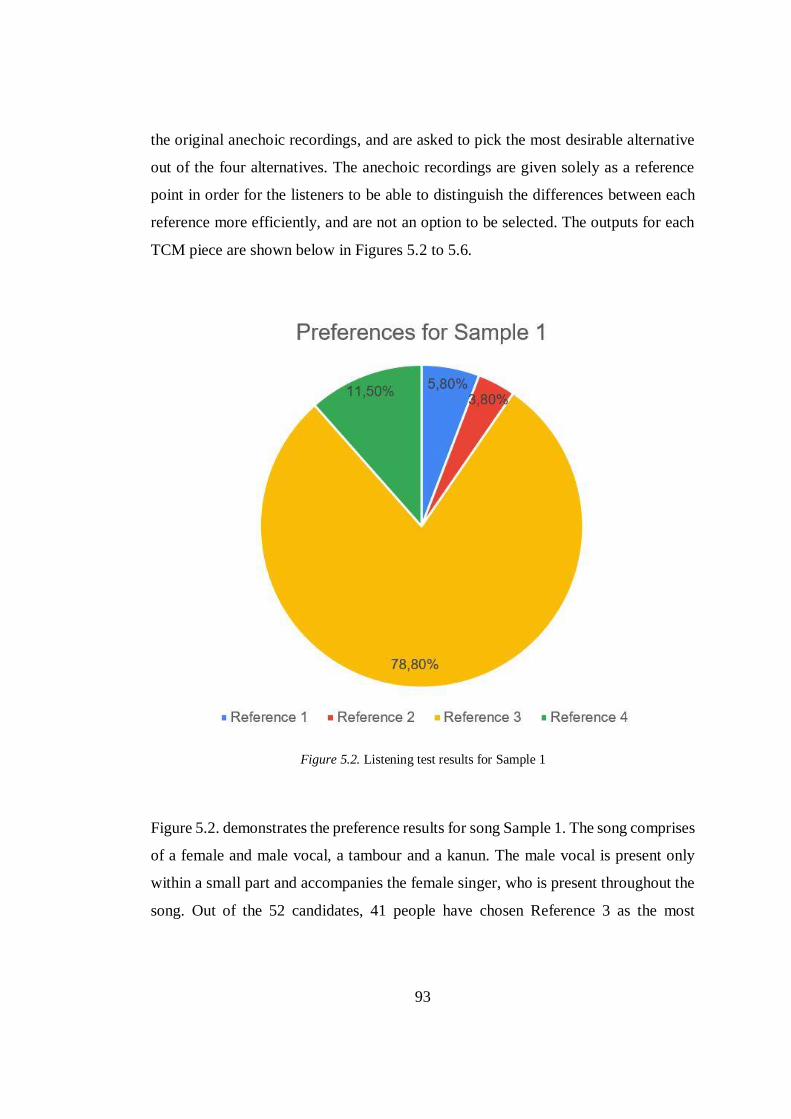
93
the original anechoic recordings, and are asked to pick the most desirable alternative
out of the four alternatives. The anechoic recordings are given solely as a reference
point in order for the listeners to be able to distinguish the differences between each
reference more efficiently, and are not an option to be selected. The outputs for each
TCM piece are shown below in Figures 5.2 to 5.6.
Figure 5.2. Listening test results for Sample 1
Figure 5.2. demonstrates the preference results for song Sample 1. The song comprises
of a female and male vocal, a tambour and a kanun. The male vocal is present only
within a small part and accompanies the female singer, who is present throughout the
song. Out of the 52 candidates, 41 people have chosen Reference 3 as the most
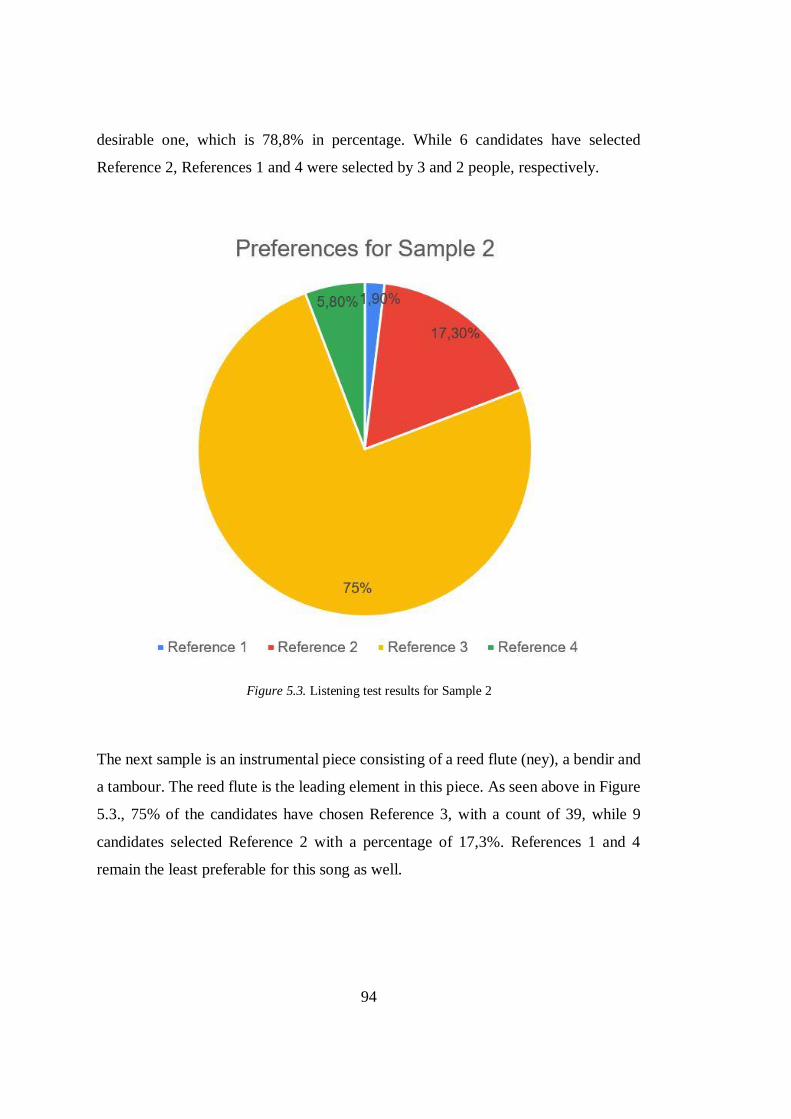
94
desirable one, which is 78,8% in percentage. While 6 candidates have selected
Reference 2, References 1 and 4 were selected by 3 and 2 people, respectively.
Figure 5.3. Listening test results for Sample 2
The next sample is an instrumental piece consisting of a reed flute (ney), a bendir and
a tambour. The reed flute is the leading element in this piece. As seen above in Figure
5.3., 75% of the candidates have chosen Reference 3, with a count of 39, while 9
candidates selected Reference 2 with a percentage of 17,3%. References 1 and 4
remain the least preferable for this song as well.
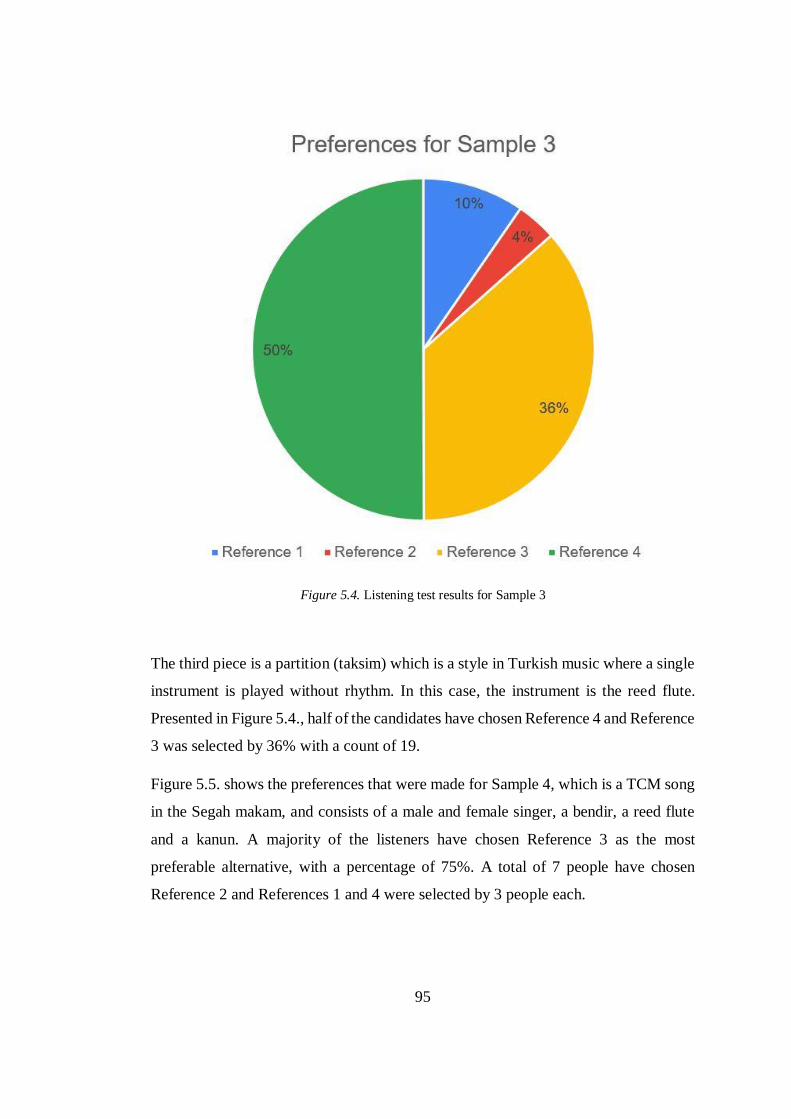
95
Figure 5.4. Listening test results for Sample 3
The third piece is a partition (taksim) which is a style in Turkish music where a single
instrument is played without rhythm. In this case, the instrument is the reed flute.
Presented in Figure 5.4., half of the candidates have chosen Reference 4 and Reference
3 was selected by 36% with a count of 19.
Figure 5.5. shows the preferences that were made for Sample 4, which is a TCM song
in the Segah makam, and consists of a male and female singer, a bendir, a reed flute
and a kanun. A majority of the listeners have chosen Reference 3 as the most
preferable alternative, with a percentage of 75%. A total of 7 people have chosen
Reference 2 and References 1 and 4 were selected by 3 people each.
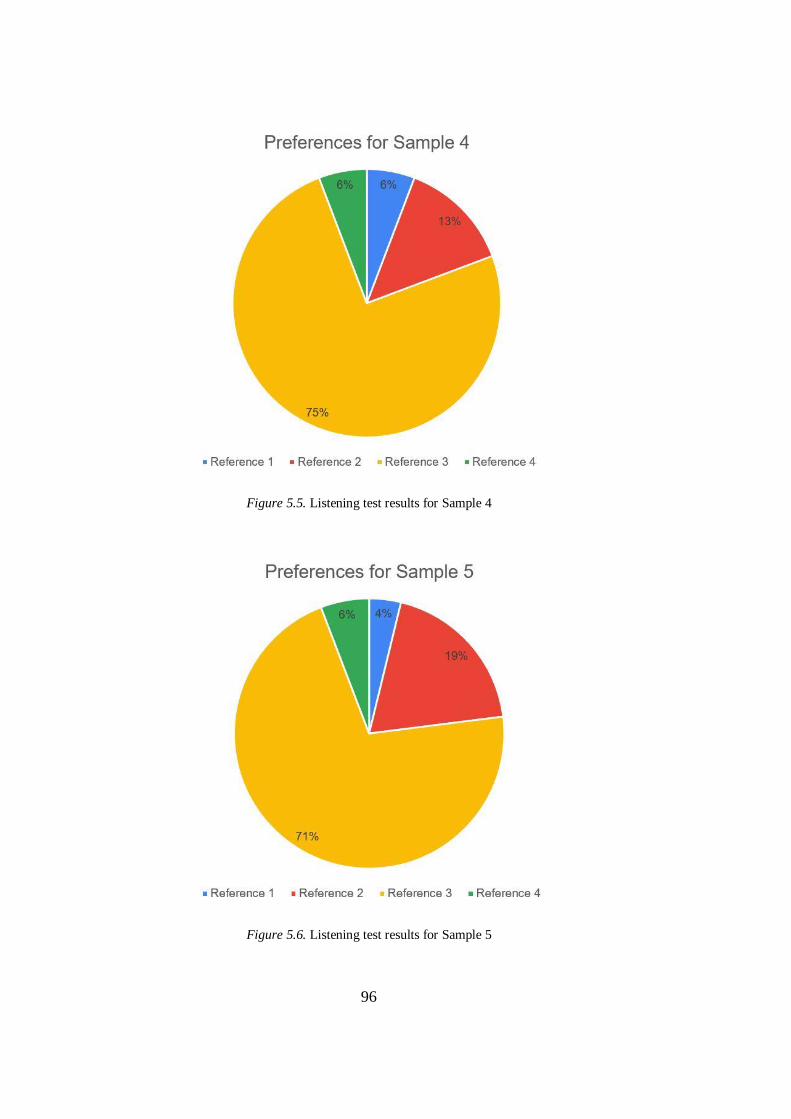
96
Figure 5.5. Listening test results for Sample 4
Figure 5.6. Listening test results for Sample 5
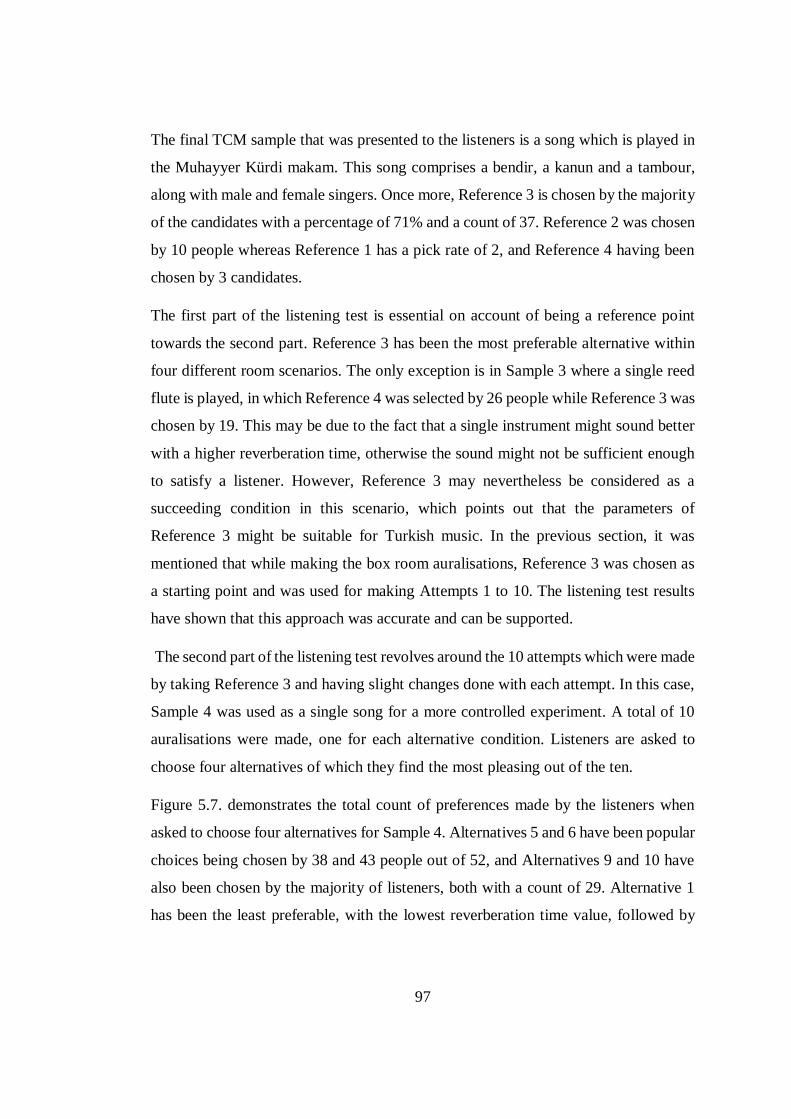
97
The final TCM sample that was presented to the listeners is a song which is played in
the Muhayyer Kürdi makam. This song comprises a bendir, a kanun and a tambour,
along with male and female singers. Once more, Reference 3 is chosen by the majority
of the candidates with a percentage of 71% and a count of 37. Reference 2 was chosen
by 10 people whereas Reference 1 has a pick rate of 2, and Reference 4 having been
chosen by 3 candidates.
The first part of the listening test is essential on account of being a reference point
towards the second part. Reference 3 has been the most preferable alternative within
four different room scenarios. The only exception is in Sample 3 where a single reed
flute is played, in which Reference 4 was selected by 26 people while Reference 3 was
chosen by 19. This may be due to the fact that a single instrument might sound better
with a higher reverberation time, otherwise the sound might not be sufficient enough
to satisfy a listener. However, Reference 3 may nevertheless be considered as a
succeeding condition in this scenario, which points out that the parameters of
Reference 3 might be suitable for Turkish music. In the previous section, it was
mentioned that while making the box room auralisations, Reference 3 was chosen as
a starting point and was used for making Attempts 1 to 10. The listening test results
have shown that this approach was accurate and can be supported.
The second part of the listening test revolves around the 10 attempts which were made
by taking Reference 3 and having slight changes done with each attempt. In this case,
Sample 4 was used as a single song for a more controlled experiment. A total of 10
auralisations were made, one for each alternative condition. Listeners are asked to
choose four alternatives of which they find the most pleasing out of the ten.
Figure 5.7. demonstrates the total count of preferences made by the listeners when
asked to choose four alternatives for Sample 4. Alternatives 5 and 6 have been popular
choices being chosen by 38 and 43 people out of 52, and Alternatives 9 and 10 have
also been chosen by the majority of listeners, both with a count of 29. Alternative 1
has been the least preferable, with the lowest reverberation time value, followed by
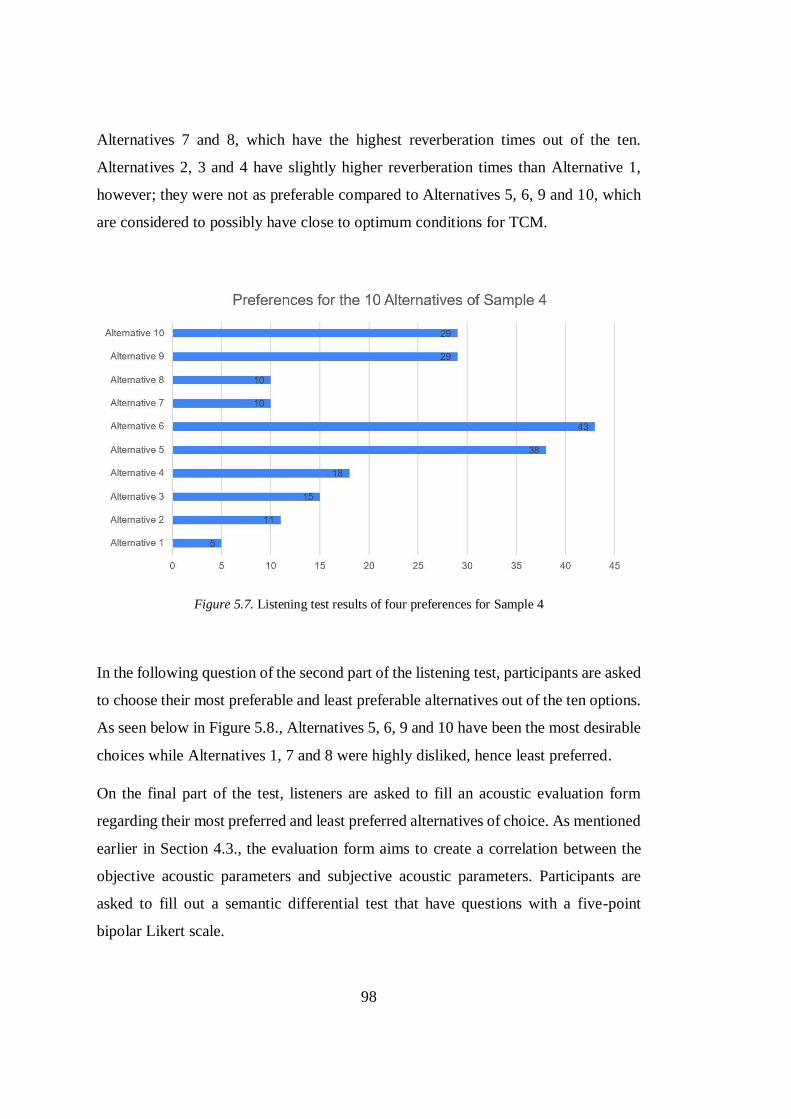
98
Alternatives 7 and 8, which have the highest reverberation times out of the ten.
Alternatives 2, 3 and 4 have slightly higher reverberation times than Alternative 1,
however; they were not as preferable compared to Alternatives 5, 6, 9 and 10, which
are considered to possibly have close to optimum conditions for TCM.
Figure 5.7. Listening test results of four preferences for Sample 4
In the following question of the second part of the listening test, participants are asked
to choose their most preferable and least preferable alternatives out of the ten options.
As seen below in Figure 5.8., Alternatives 5, 6, 9 and 10 have been the most desirable
choices while Alternatives 1, 7 and 8 were highly disliked, hence least preferred.
On the final part of the test, listeners are asked to fill an acoustic evaluation form
regarding their most preferred and least preferred alternatives of choice. As mentioned
earlier in Section 4.3., the evaluation form aims to create a correlation between the
objective acoustic parameters and subjective acoustic parameters. Participants are
asked to fill out a semantic differential test that have questions with a five-point
bipolar Likert scale.
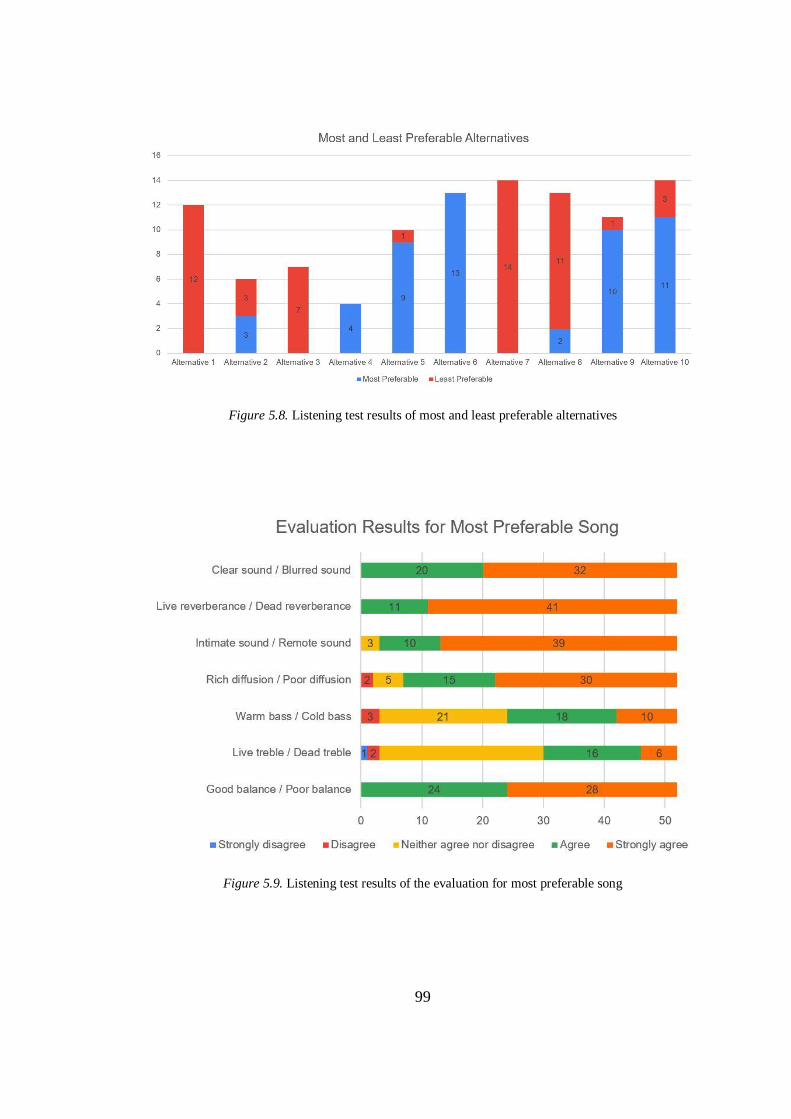
99
Figure 5.8. Listening test results of most and least preferable alternatives
Figure 5.9. Listening test results of the evaluation for most preferable song
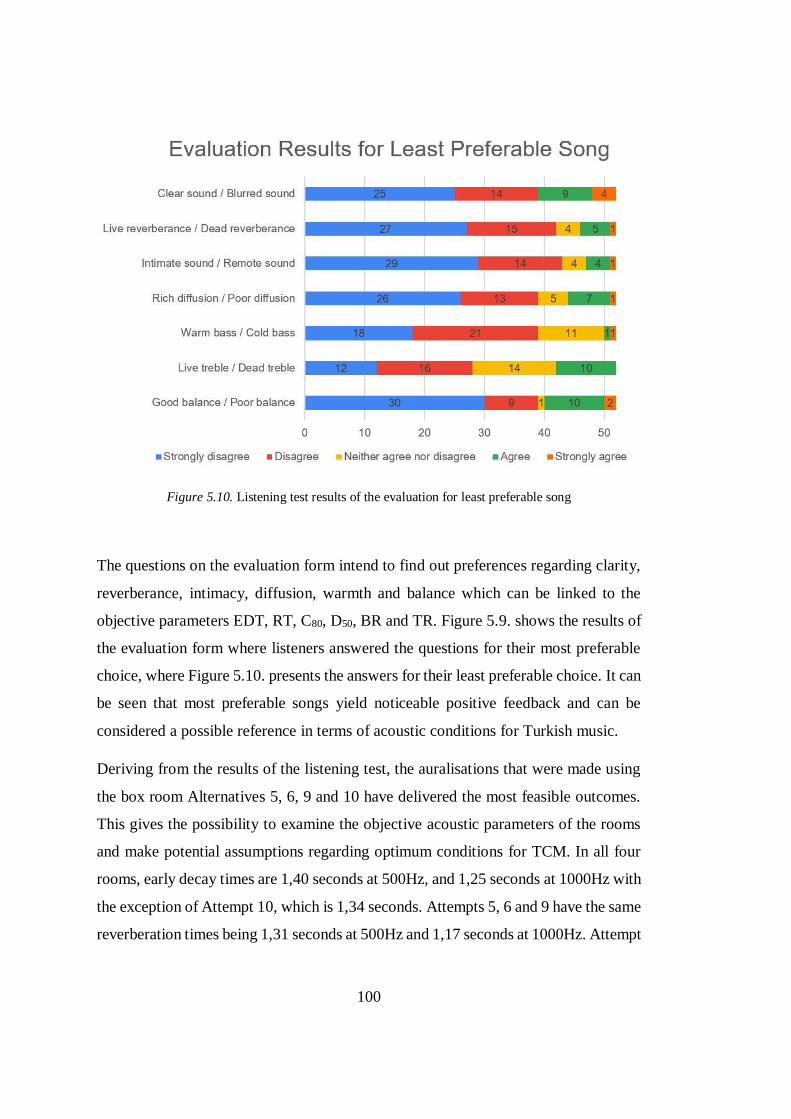
100
Figure 5.10. Listening test results of the evaluation for least preferable song
The questions on the evaluation form intend to find out preferences regarding clarity,
reverberance, intimacy, diffusion, warmth and balance which can be linked to the
objective parameters EDT, RT, C80, D50, BR and TR. Figure 5.9. shows the results of
the evaluation form where listeners answered the questions for their most preferable
choice, where Figure 5.10. presents the answers for their least preferable choice. It can
be seen that most preferable songs yield noticeable positive feedback and can be
considered a possible reference in terms of acoustic conditions for Turkish music.
Deriving from the results of the listening test, the auralisations that were made using
the box room Alternatives 5, 6, 9 and 10 have delivered the most feasible outcomes.
This gives the possibility to examine the objective acoustic parameters of the rooms
and make potential assumptions regarding optimum conditions for TCM. In all four
rooms, early decay times are 1,40 seconds at 500Hz, and 1,25 seconds at 1000Hz with
the exception of Attempt 10, which is 1,34 seconds. Attempts 5, 6 and 9 have the same
reverberation times being 1,31 seconds at 500Hz and 1,17 seconds at 1000Hz. Attempt
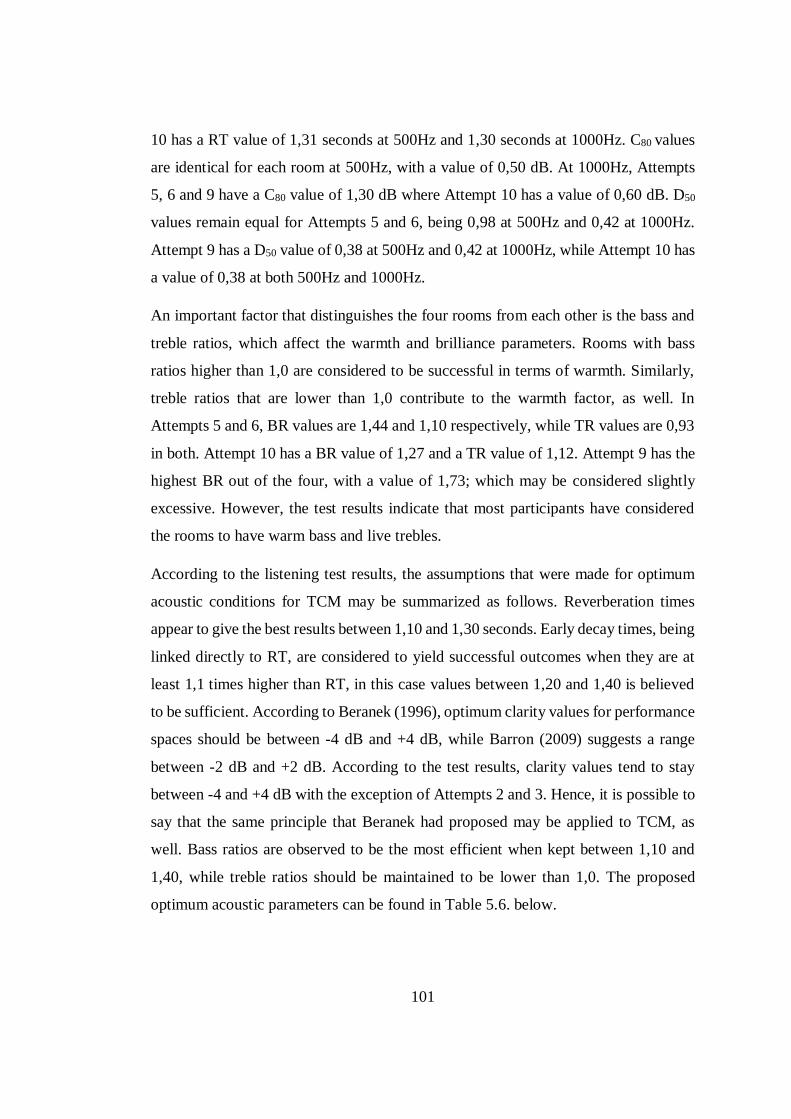
101
10 has a RT value of 1,31 seconds at 500Hz and 1,30 seconds at 1000Hz. C80 values
are identical for each room at 500Hz, with a value of 0,50 dB. At 1000Hz, Attempts
5, 6 and 9 have a C80 value of 1,30 dB where Attempt 10 has a value of 0,60 dB. D50
values remain equal for Attempts 5 and 6, being 0,98 at 500Hz and 0,42 at 1000Hz.
Attempt 9 has a D50 value of 0,38 at 500Hz and 0,42 at 1000Hz, while Attempt 10 has
a value of 0,38 at both 500Hz and 1000Hz.
An important factor that distinguishes the four rooms from each other is the bass and
treble ratios, which affect the warmth and brilliance parameters. Rooms with bass
ratios higher than 1,0 are considered to be successful in terms of warmth. Similarly,
treble ratios that are lower than 1,0 contribute to the warmth factor, as well. In
Attempts 5 and 6, BR values are 1,44 and 1,10 respectively, while TR values are 0,93
in both. Attempt 10 has a BR value of 1,27 and a TR value of 1,12. Attempt 9 has the
highest BR out of the four, with a value of 1,73; which may be considered slightly
excessive. However, the test results indicate that most participants have considered
the rooms to have warm bass and live trebles.
According to the listening test results, the assumptions that were made for optimum
acoustic conditions for TCM may be summarized as follows. Reverberation times
appear to give the best results between 1,10 and 1,30 seconds. Early decay times, being
linked directly to RT, are considered to yield successful outcomes when they are at
least 1,1 times higher than RT, in this case values between 1,20 and 1,40 is believed
to be sufficient. According to Beranek (1996), optimum clarity values for performance
spaces should be between -4 dB and +4 dB, while Barron (2009) suggests a range
between -2 dB and +2 dB. According to the test results, clarity values tend to stay
between -4 and +4 dB with the exception of Attempts 2 and 3. Hence, it is possible to
say that the same principle that Beranek had proposed may be applied to TCM, as
well. Bass ratios are observed to be the most efficient when kept between 1,10 and
1,40, while treble ratios should be maintained to be lower than 1,0. The proposed
optimum acoustic parameters can be found in Table 5.6. below.
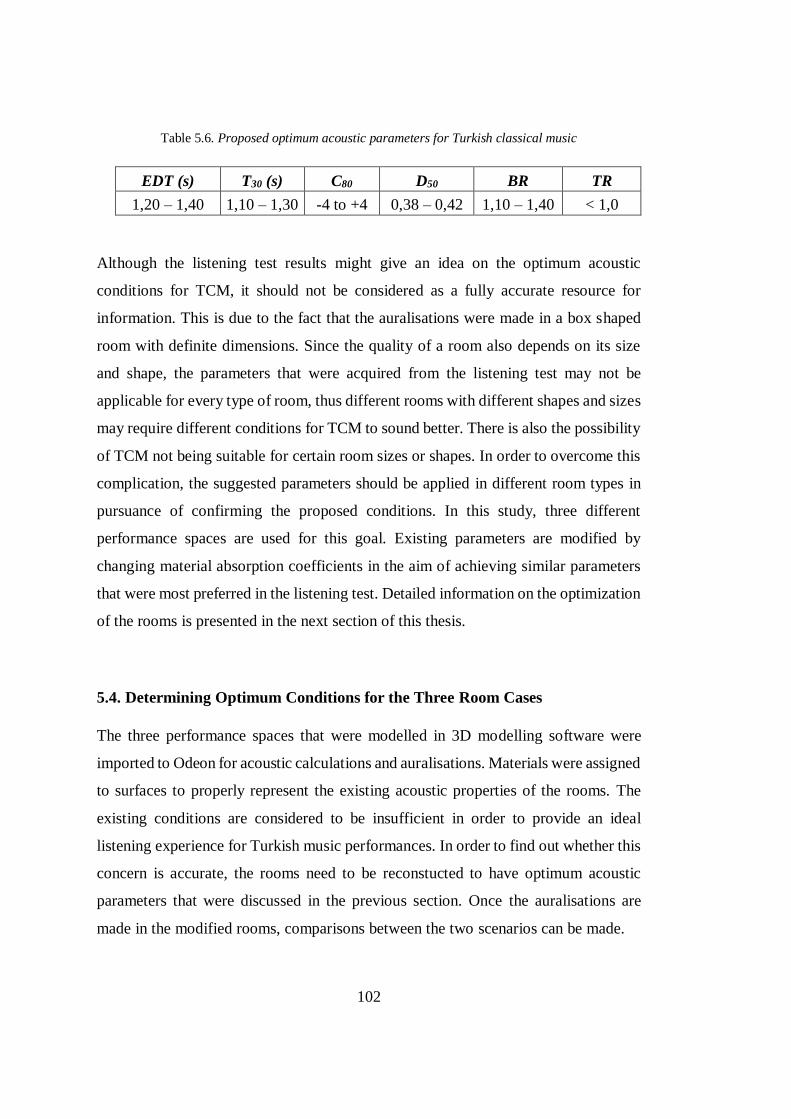
102
Table 5.6. Proposed optimum acoustic parameters for Turkish classical music
EDT (s) T30 (s) C80 D50 BR TR
1,20 – 1,40 1,10 – 1,30 -4 to +4 0,38 – 0,42 1,10 – 1,40 < 1,0
Although the listening test results might give an idea on the optimum acoustic
conditions for TCM, it should not be considered as a fully accurate resource for
information. This is due to the fact that the auralisations were made in a box shaped
room with definite dimensions. Since the quality of a room also depends on its size
and shape, the parameters that were acquired from the listening test may not be
applicable for every type of room, thus different rooms with different shapes and sizes
may require different conditions for TCM to sound better. There is also the possibility
of TCM not being suitable for certain room sizes or shapes. In order to overcome this
complication, the suggested parameters should be applied in different room types in
pursuance of confirming the proposed conditions. In this study, three different
performance spaces are used for this goal. Existing parameters are modified by
changing material absorption coefficients in the aim of achieving similar parameters
that were most preferred in the listening test. Detailed information on the optimization
of the rooms is presented in the next section of this thesis.
5.4. Determining Optimum Conditions for the Three Room Cases
The three performance spaces that were modelled in 3D modelling software were
imported to Odeon for acoustic calculations and auralisations. Materials were assigned
to surfaces to properly represent the existing acoustic properties of the rooms. The
existing conditions are considered to be insufficient in order to provide an ideal
listening experience for Turkish music performances. In order to find out whether this
concern is accurate, the rooms need to be reconstucted to have optimum acoustic
parameters that were discussed in the previous section. Once the auralisations are
made in the modified rooms, comparisons between the two scenarios can be made.
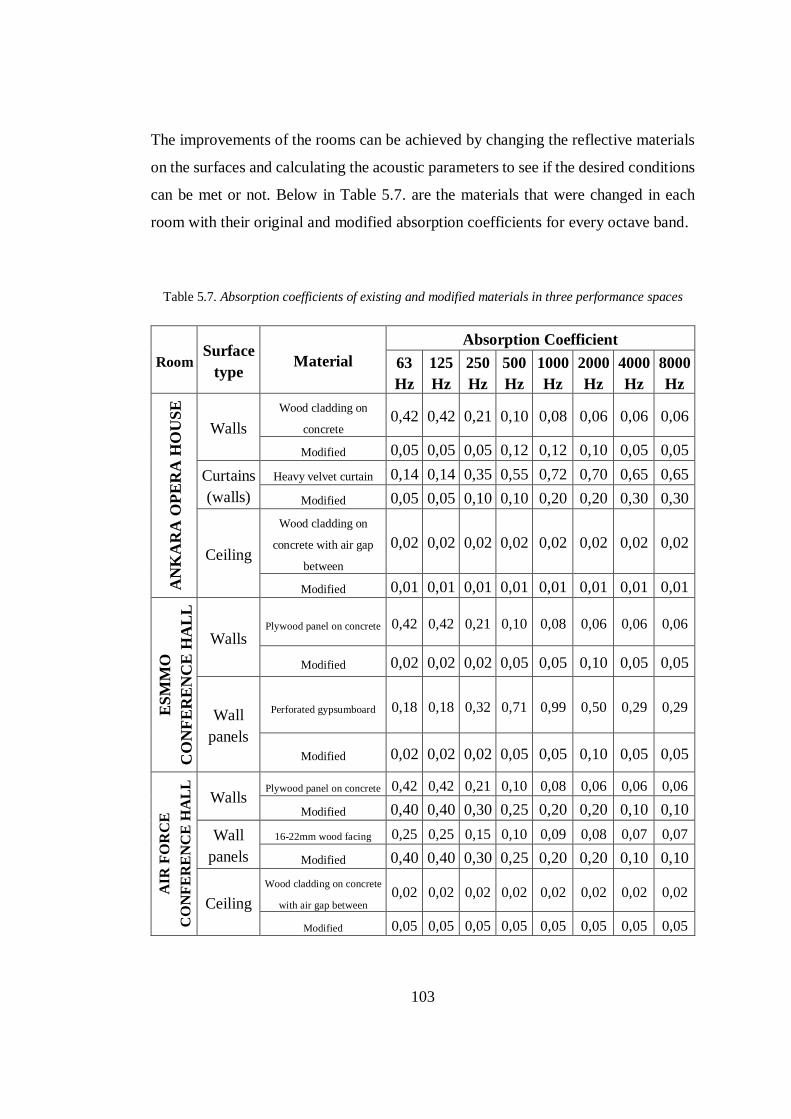
103
The improvements of the rooms can be achieved by changing the reflective materials
on the surfaces and calculating the acoustic parameters to see if the desired conditions
can be met or not. Below in Table 5.7. are the materials that were changed in each
room with their original and modified absorption coefficients for every octave band.
Table 5.7. Absorption coefficients of existing and modified materials in three performance spaces
Room Surface
type Material
Absorption Coefficient
63
Hz
125
Hz
250
Hz
500
Hz
1000
Hz
2000
Hz
4000
Hz
8000
Hz
AN
KA
RA
OP
ER
A H
OU
SE
Walls
Wood cladding on
concrete 0,42 0,42 0,21 0,10 0,08 0,06 0,06 0,06
Modified 0,05 0,05 0,05 0,12 0,12 0,10 0,05 0,05
Curtains
(walls)
Heavy velvet curtain 0,14 0,14 0,35 0,55 0,72 0,70 0,65 0,65
Modified 0,05 0,05 0,10 0,10 0,20 0,20 0,30 0,30
Ceiling
Wood cladding on
concrete with air gap
between
0,02 0,02 0,02 0,02 0,02 0,02 0,02 0,02
Modified 0,01 0,01 0,01 0,01 0,01 0,01 0,01 0,01
ES
MM
O
CO
NF
ER
EN
CE
HA
LL
Walls Plywood panel on concrete 0,42 0,42 0,21 0,10 0,08 0,06 0,06 0,06
Modified 0,02 0,02 0,02 0,05 0,05 0,10 0,05 0,05
Wall
panels
Perforated gypsumboard 0,18 0,18 0,32 0,71 0,99 0,50 0,29 0,29
Modified 0,02 0,02 0,02 0,05 0,05 0,10 0,05 0,05
AIR
FO
RC
E
CO
NF
ER
EN
CE
HA
LL
Walls Plywood panel on concrete 0,42 0,42 0,21 0,10 0,08 0,06 0,06 0,06
Modified 0,40 0,40 0,30 0,25 0,20 0,20 0,10 0,10
Wall
panels
16-22mm wood facing 0,25 0,25 0,15 0,10 0,09 0,08 0,07 0,07
Modified 0,40 0,40 0,30 0,25 0,20 0,20 0,10 0,10
Ceiling
Wood cladding on concrete
with air gap between 0,02 0,02 0,02 0,02 0,02 0,02 0,02 0,02
Modified 0,05 0,05 0,05 0,05 0,05 0,05 0,05 0,05
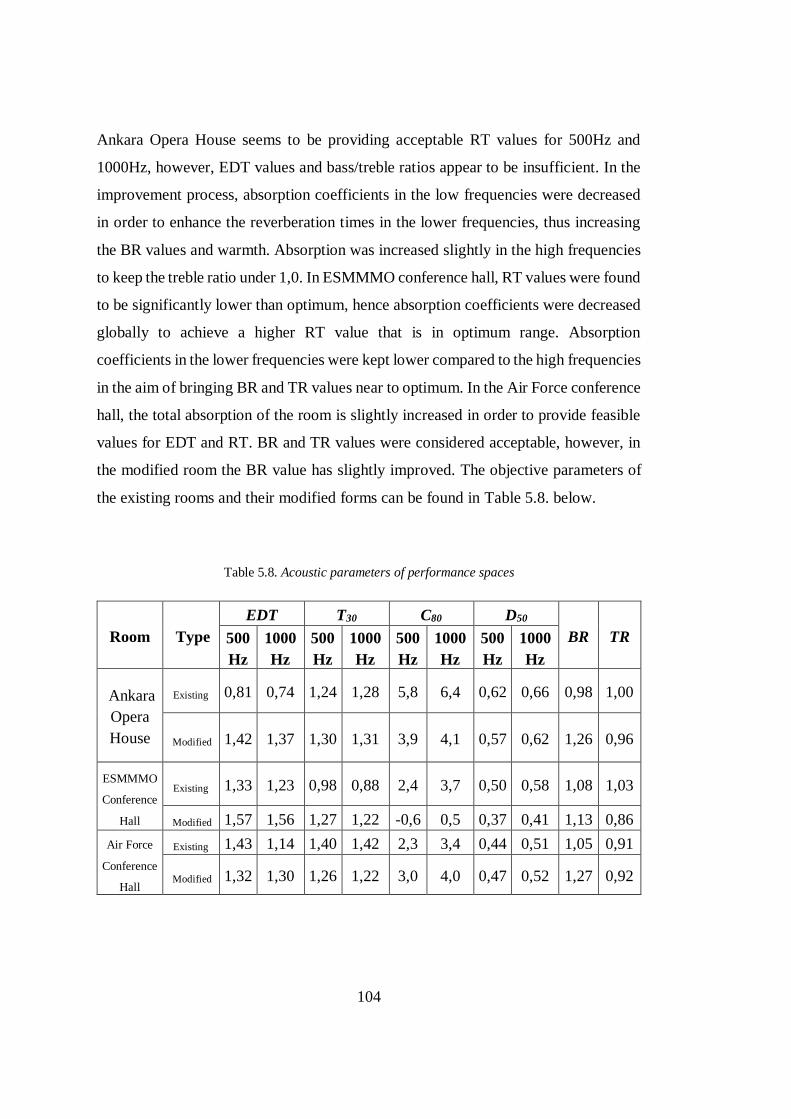
104
Ankara Opera House seems to be providing acceptable RT values for 500Hz and
1000Hz, however, EDT values and bass/treble ratios appear to be insufficient. In the
improvement process, absorption coefficients in the low frequencies were decreased
in order to enhance the reverberation times in the lower frequencies, thus increasing
the BR values and warmth. Absorption was increased slightly in the high frequencies
to keep the treble ratio under 1,0. In ESMMMO conference hall, RT values were found
to be significantly lower than optimum, hence absorption coefficients were decreased
globally to achieve a higher RT value that is in optimum range. Absorption
coefficients in the lower frequencies were kept lower compared to the high frequencies
in the aim of bringing BR and TR values near to optimum. In the Air Force conference
hall, the total absorption of the room is slightly increased in order to provide feasible
values for EDT and RT. BR and TR values were considered acceptable, however, in
the modified room the BR value has slightly improved. The objective parameters of
the existing rooms and their modified forms can be found in Table 5.8. below.
Table 5.8. Acoustic parameters of performance spaces
Room Type
EDT T30 C80 D50
BR TR 500
Hz
1000
Hz
500
Hz
1000
Hz
500
Hz
1000
Hz
500
Hz
1000
Hz
Ankara
Opera
House
Existing 0,81 0,74 1,24 1,28 5,8 6,4 0,62 0,66 0,98 1,00
Modified 1,42 1,37 1,30 1,31 3,9 4,1 0,57 0,62 1,26 0,96
ESMMMO
Conference
Hall
Existing 1,33 1,23 0,98 0,88 2,4 3,7 0,50 0,58 1,08 1,03
Modified 1,57 1,56 1,27 1,22 -0,6 0,5 0,37 0,41 1,13 0,86
Air Force
Conference
Hall
Existing 1,43 1,14 1,40 1,42 2,3 3,4 0,44 0,51 1,05 0,91
Modified 1,32 1,30 1,26 1,22 3,0 4,0 0,47 0,52 1,27 0,92
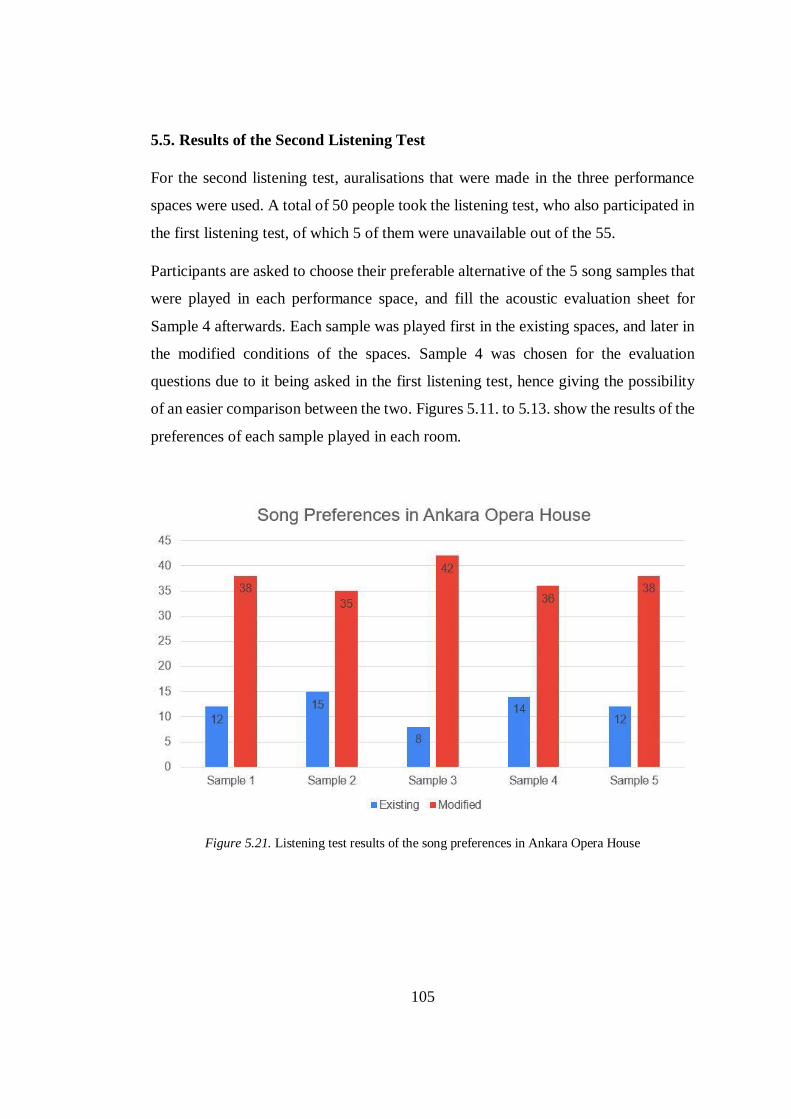
105
5.5. Results of the Second Listening Test
For the second listening test, auralisations that were made in the three performance
spaces were used. A total of 50 people took the listening test, who also participated in
the first listening test, of which 5 of them were unavailable out of the 55.
Participants are asked to choose their preferable alternative of the 5 song samples that
were played in each performance space, and fill the acoustic evaluation sheet for
Sample 4 afterwards. Each sample was played first in the existing spaces, and later in
the modified conditions of the spaces. Sample 4 was chosen for the evaluation
questions due to it being asked in the first listening test, hence giving the possibility
of an easier comparison between the two. Figures 5.11. to 5.13. show the results of the
preferences of each sample played in each room.
Figure 5.21. Listening test results of the song preferences in Ankara Opera House
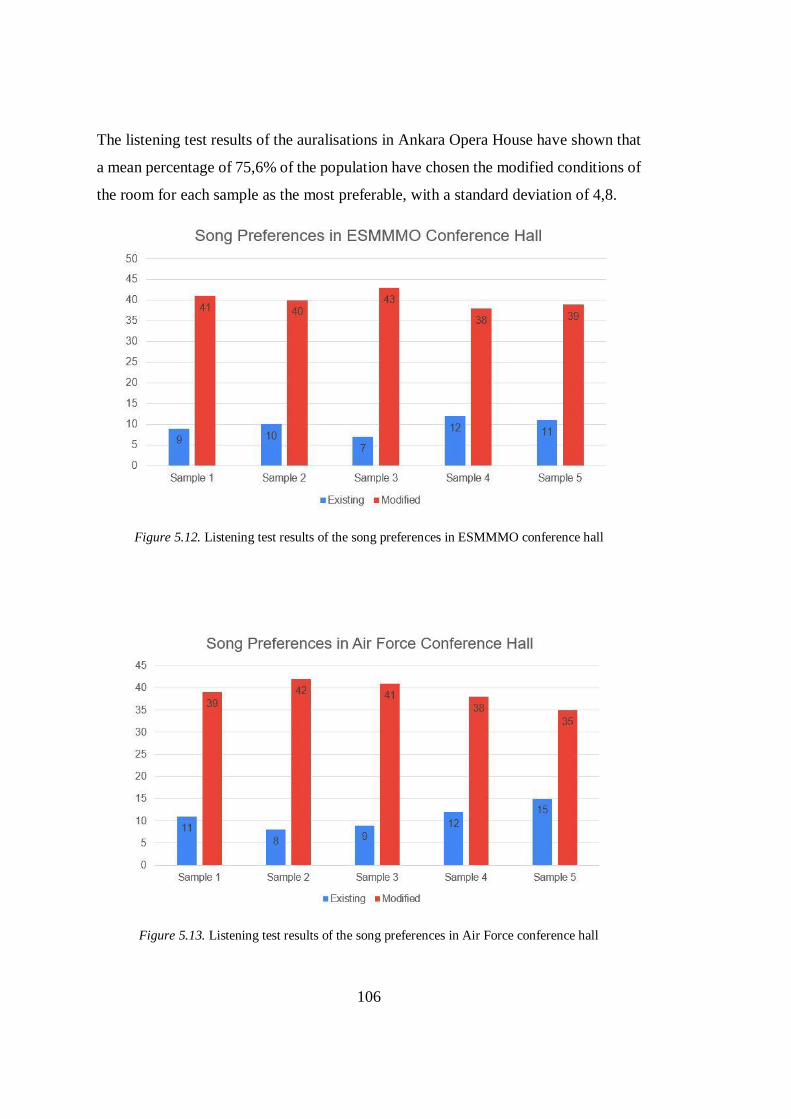
106
The listening test results of the auralisations in Ankara Opera House have shown that
a mean percentage of 75,6% of the population have chosen the modified conditions of
the room for each sample as the most preferable, with a standard deviation of 4,8.
Figure 5.12. Listening test results of the song preferences in ESMMMO conference hall
Figure 5.13. Listening test results of the song preferences in Air Force conference hall
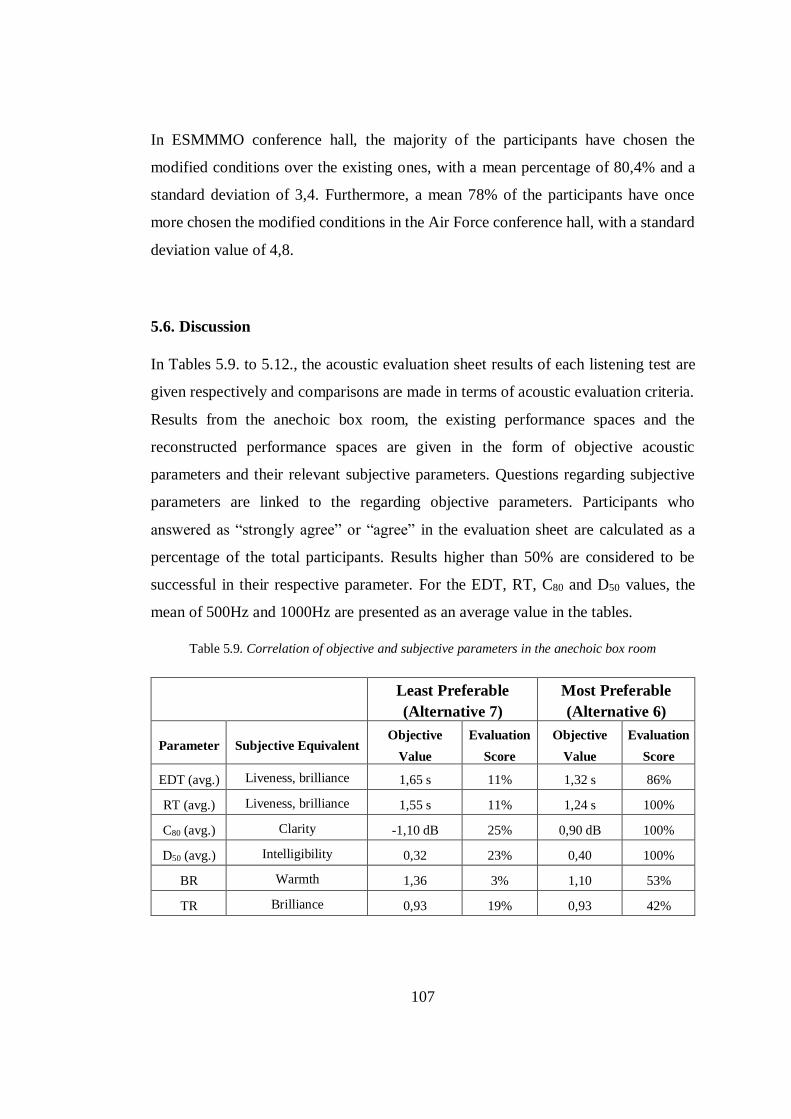
107
In ESMMMO conference hall, the majority of the participants have chosen the
modified conditions over the existing ones, with a mean percentage of 80,4% and a
standard deviation of 3,4. Furthermore, a mean 78% of the participants have once
more chosen the modified conditions in the Air Force conference hall, with a standard
deviation value of 4,8.
5.6. Discussion
In Tables 5.9. to 5.12., the acoustic evaluation sheet results of each listening test are
given respectively and comparisons are made in terms of acoustic evaluation criteria.
Results from the anechoic box room, the existing performance spaces and the
reconstructed performance spaces are given in the form of objective acoustic
parameters and their relevant subjective parameters. Questions regarding subjective
parameters are linked to the regarding objective parameters. Participants who
answered as “strongly agree” or “agree” in the evaluation sheet are calculated as a
percentage of the total participants. Results higher than 50% are considered to be
successful in their respective parameter. For the EDT, RT, C80 and D50 values, the
mean of 500Hz and 1000Hz are presented as an average value in the tables.
Table 5.9. Correlation of objective and subjective parameters in the anechoic box room
Least Preferable
(Alternative 7)
Most Preferable
(Alternative 6)
Parameter Subjective Equivalent Objective
Value
Evaluation
Score
Objective
Value
Evaluation
Score
EDT (avg.) Liveness, brilliance 1,65 s 11% 1,32 s 86%
RT (avg.) Liveness, brilliance 1,55 s 11% 1,24 s 100%
C80 (avg.) Clarity -1,10 dB 25% 0,90 dB 100%
D50 (avg.) Intelligibility 0,32 23% 0,40 100%
BR Warmth 1,36 3% 1,10 53%
TR Brilliance 0,93 19% 0,93 42%
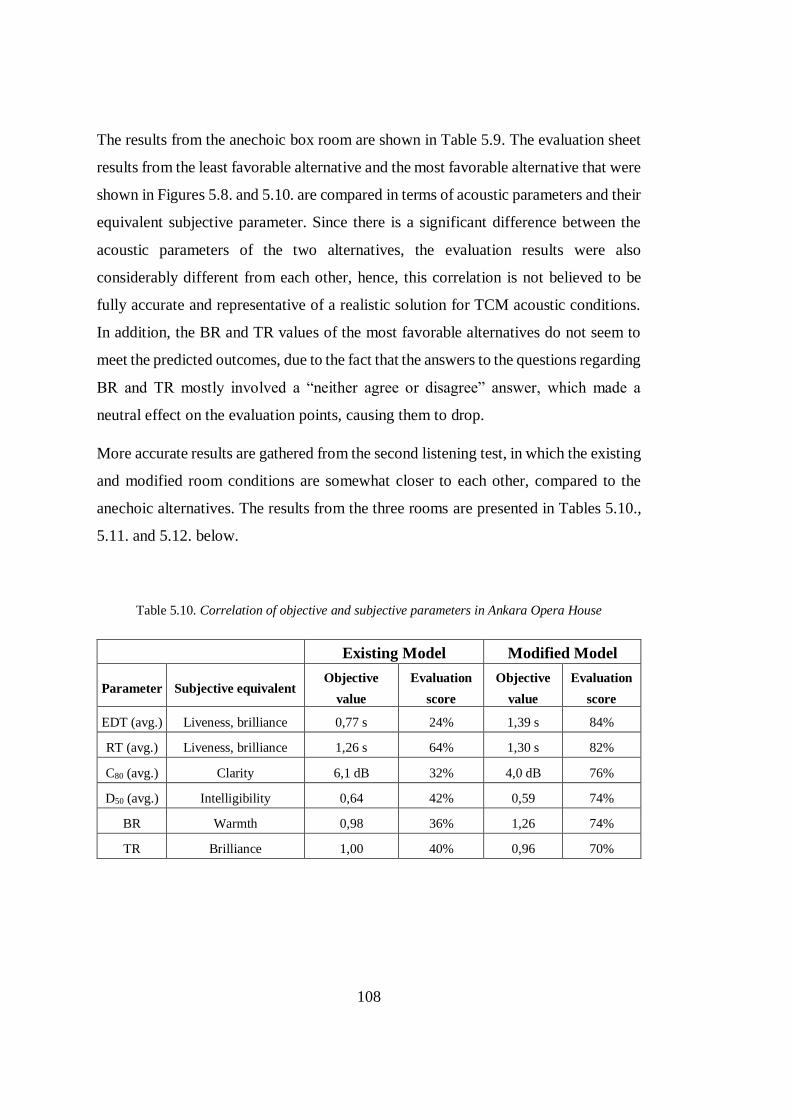
108
The results from the anechoic box room are shown in Table 5.9. The evaluation sheet
results from the least favorable alternative and the most favorable alternative that were
shown in Figures 5.8. and 5.10. are compared in terms of acoustic parameters and their
equivalent subjective parameter. Since there is a significant difference between the
acoustic parameters of the two alternatives, the evaluation results were also
considerably different from each other, hence, this correlation is not believed to be
fully accurate and representative of a realistic solution for TCM acoustic conditions.
In addition, the BR and TR values of the most favorable alternatives do not seem to
meet the predicted outcomes, due to the fact that the answers to the questions regarding
BR and TR mostly involved a “neither agree or disagree” answer, which made a
neutral effect on the evaluation points, causing them to drop.
More accurate results are gathered from the second listening test, in which the existing
and modified room conditions are somewhat closer to each other, compared to the
anechoic alternatives. The results from the three rooms are presented in Tables 5.10.,
5.11. and 5.12. below.
Table 5.10. Correlation of objective and subjective parameters in Ankara Opera House
Existing Model Modified Model
Parameter Subjective equivalent Objective
value
Evaluation
score
Objective
value
Evaluation
score
EDT (avg.) Liveness, brilliance 0,77 s 24% 1,39 s 84%
RT (avg.) Liveness, brilliance 1,26 s 64% 1,30 s 82%
C80 (avg.) Clarity 6,1 dB 32% 4,0 dB 76%
D50 (avg.) Intelligibility 0,64 42% 0,59 74%
BR Warmth 0,98 36% 1,26 74%
TR Brilliance 1,00 40% 0,96 70%
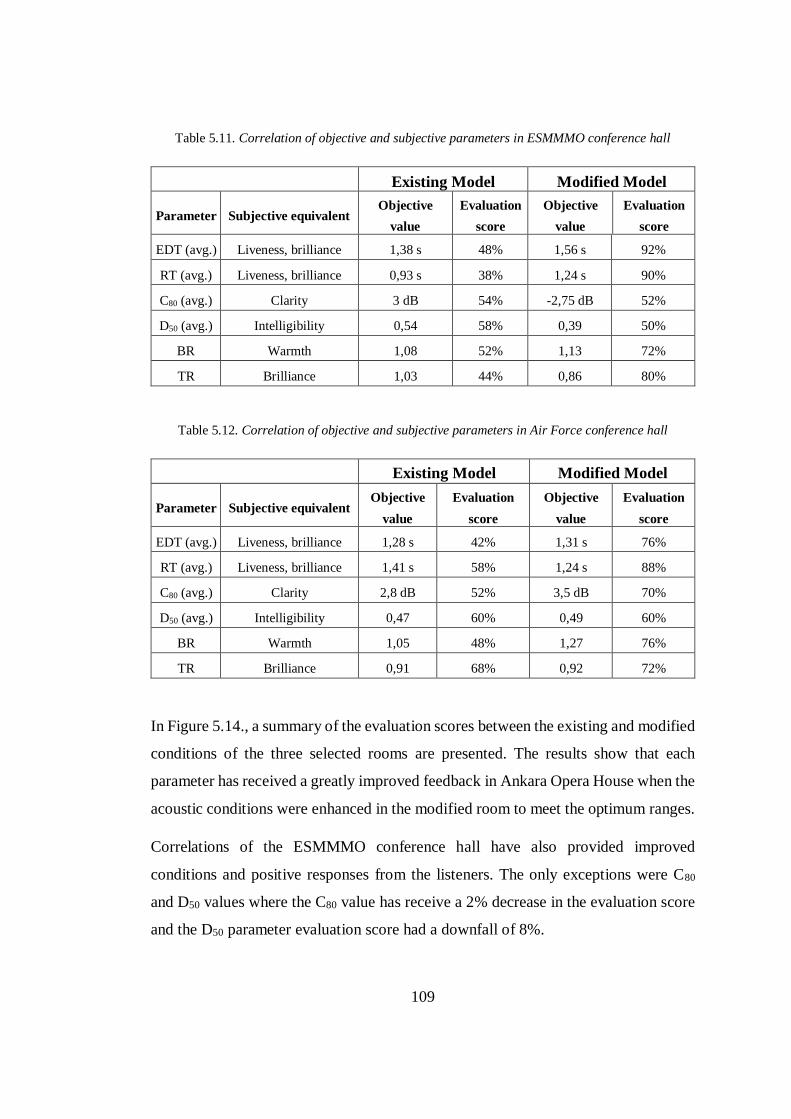
109
Table 5.11. Correlation of objective and subjective parameters in ESMMMO conference hall
Existing Model Modified Model
Parameter Subjective equivalent Objective
value
Evaluation
score
Objective
value
Evaluation
score
EDT (avg.) Liveness, brilliance 1,38 s 48% 1,56 s 92%
RT (avg.) Liveness, brilliance 0,93 s 38% 1,24 s 90%
C80 (avg.) Clarity 3 dB 54% -2,75 dB 52%
D50 (avg.) Intelligibility 0,54 58% 0,39 50%
BR Warmth 1,08 52% 1,13 72%
TR Brilliance 1,03 44% 0,86 80%
Table 5.12. Correlation of objective and subjective parameters in Air Force conference hall
Existing Model Modified Model
Parameter Subjective equivalent Objective
value
Evaluation
score
Objective
value
Evaluation
score
EDT (avg.) Liveness, brilliance 1,28 s 42% 1,31 s 76%
RT (avg.) Liveness, brilliance 1,41 s 58% 1,24 s 88%
C80 (avg.) Clarity 2,8 dB 52% 3,5 dB 70%
D50 (avg.) Intelligibility 0,47 60% 0,49 60%
BR Warmth 1,05 48% 1,27 76%
TR Brilliance 0,91 68% 0,92 72%
In Figure 5.14., a summary of the evaluation scores between the existing and modified
conditions of the three selected rooms are presented. The results show that each
parameter has received a greatly improved feedback in Ankara Opera House when the
acoustic conditions were enhanced in the modified room to meet the optimum ranges.
Correlations of the ESMMMO conference hall have also provided improved
conditions and positive responses from the listeners. The only exceptions were C80
and D50 values where the C80 value has receive a 2% decrease in the evaluation score
and the D50 parameter evaluation score had a downfall of 8%.
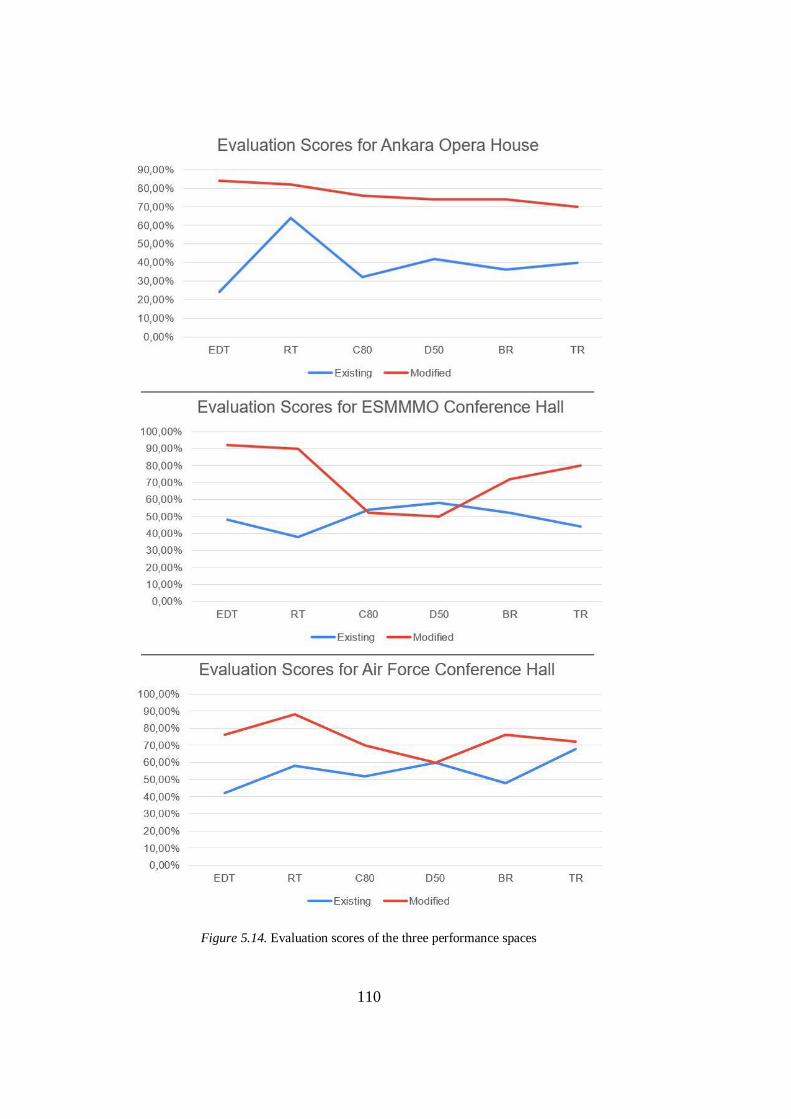
110
Figure 5.14. Evaluation scores of the three performance spaces
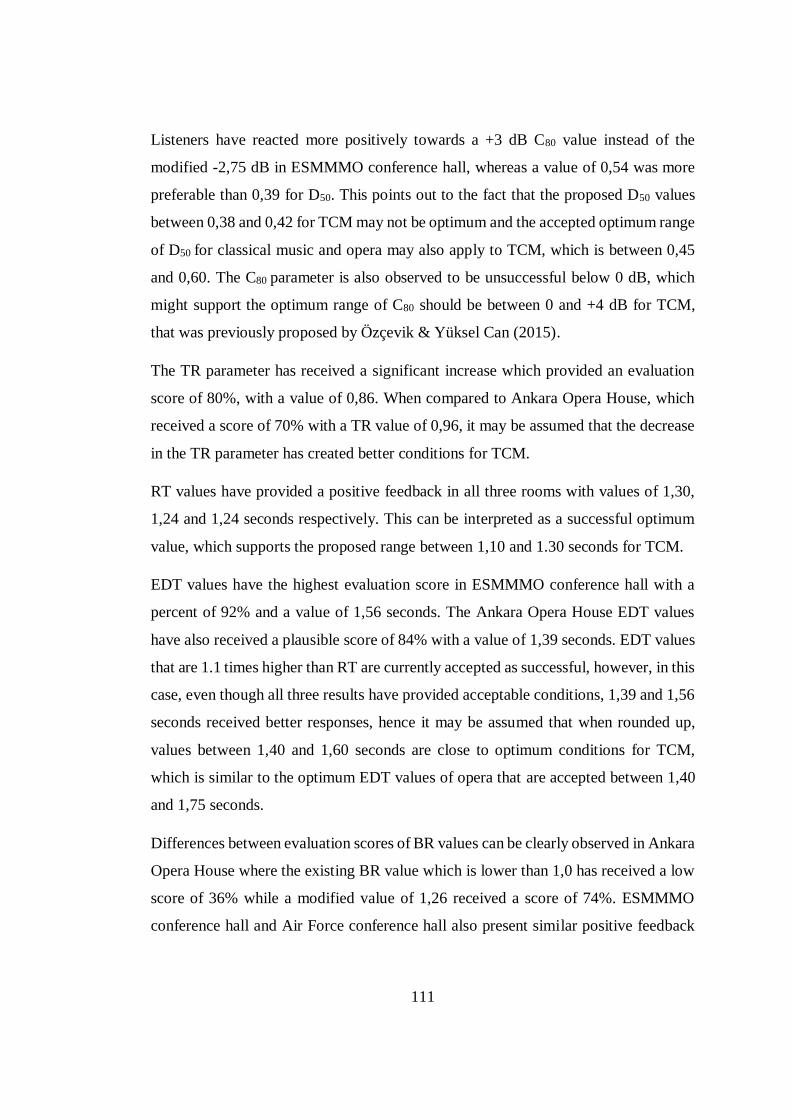
111
Listeners have reacted more positively towards a +3 dB C80 value instead of the
modified -2,75 dB in ESMMMO conference hall, whereas a value of 0,54 was more
preferable than 0,39 for D50. This points out to the fact that the proposed D50 values
between 0,38 and 0,42 for TCM may not be optimum and the accepted optimum range
of D50 for classical music and opera may also apply to TCM, which is between 0,45
and 0,60. The C80 parameter is also observed to be unsuccessful below 0 dB, which
might support the optimum range of C80 should be between 0 and +4 dB for TCM,
that was previously proposed by Özçevik & Yüksel Can (2015).
The TR parameter has received a significant increase which provided an evaluation
score of 80%, with a value of 0,86. When compared to Ankara Opera House, which
received a score of 70% with a TR value of 0,96, it may be assumed that the decrease
in the TR parameter has created better conditions for TCM.
RT values have provided a positive feedback in all three rooms with values of 1,30,
1,24 and 1,24 seconds respectively. This can be interpreted as a successful optimum
value, which supports the proposed range between 1,10 and 1.30 seconds for TCM.
EDT values have the highest evaluation score in ESMMMO conference hall with a
percent of 92% and a value of 1,56 seconds. The Ankara Opera House EDT values
have also received a plausible score of 84% with a value of 1,39 seconds. EDT values
that are 1.1 times higher than RT are currently accepted as successful, however, in this
case, even though all three results have provided acceptable conditions, 1,39 and 1,56
seconds received better responses, hence it may be assumed that when rounded up,
values between 1,40 and 1,60 seconds are close to optimum conditions for TCM,
which is similar to the optimum EDT values of opera that are accepted between 1,40
and 1,75 seconds.
Differences between evaluation scores of BR values can be clearly observed in Ankara
Opera House where the existing BR value which is lower than 1,0 has received a low
score of 36% while a modified value of 1,26 received a score of 74%. ESMMMO
conference hall and Air Force conference hall also present similar positive feedback
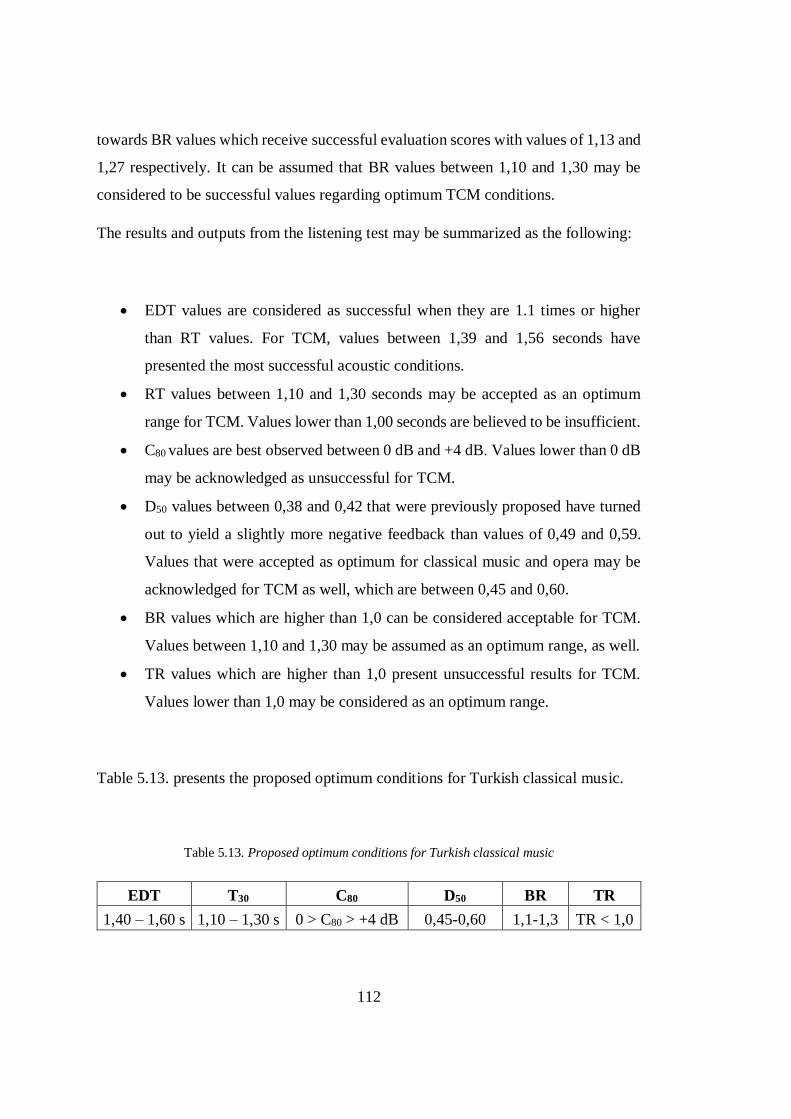
112
towards BR values which receive successful evaluation scores with values of 1,13 and
1,27 respectively. It can be assumed that BR values between 1,10 and 1,30 may be
considered to be successful values regarding optimum TCM conditions.
The results and outputs from the listening test may be summarized as the following:
EDT values are considered as successful when they are 1.1 times or higher
than RT values. For TCM, values between 1,39 and 1,56 seconds have
presented the most successful acoustic conditions.
RT values between 1,10 and 1,30 seconds may be accepted as an optimum
range for TCM. Values lower than 1,00 seconds are believed to be insufficient.
C80 values are best observed between 0 dB and +4 dB. Values lower than 0 dB
may be acknowledged as unsuccessful for TCM.
D50 values between 0,38 and 0,42 that were previously proposed have turned
out to yield a slightly more negative feedback than values of 0,49 and 0,59.
Values that were accepted as optimum for classical music and opera may be
acknowledged for TCM as well, which are between 0,45 and 0,60.
BR values which are higher than 1,0 can be considered acceptable for TCM.
Values between 1,10 and 1,30 may be assumed as an optimum range, as well.
TR values which are higher than 1,0 present unsuccessful results for TCM.
Values lower than 1,0 may be considered as an optimum range.
Table 5.13. presents the proposed optimum conditions for Turkish classical music.
Table 5.13. Proposed optimum conditions for Turkish classical music
EDT T30 C80 D50 BR TR
1,40 – 1,60 s 1,10 – 1,30 s 0 > C80 > +4 dB 0,45-0,60 1,1-1,3 TR < 1,0
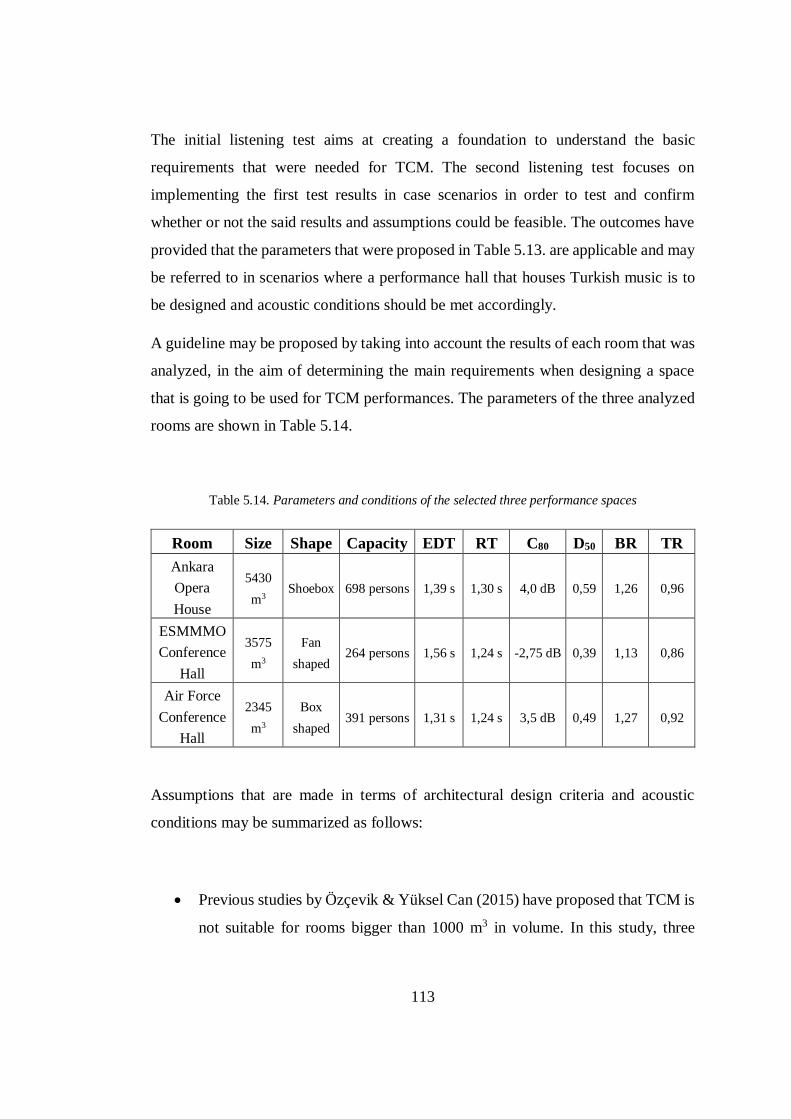
113
The initial listening test aims at creating a foundation to understand the basic
requirements that were needed for TCM. The second listening test focuses on
implementing the first test results in case scenarios in order to test and confirm
whether or not the said results and assumptions could be feasible. The outcomes have
provided that the parameters that were proposed in Table 5.13. are applicable and may
be referred to in scenarios where a performance hall that houses Turkish music is to
be designed and acoustic conditions should be met accordingly.
A guideline may be proposed by taking into account the results of each room that was
analyzed, in the aim of determining the main requirements when designing a space
that is going to be used for TCM performances. The parameters of the three analyzed
rooms are shown in Table 5.14.
Table 5.14. Parameters and conditions of the selected three performance spaces
Room Size Shape Capacity EDT RT C80 D50 BR TR
Ankara
Opera
House
5430
m3 Shoebox 698 persons 1,39 s 1,30 s 4,0 dB 0,59 1,26 0,96
ESMMMO
Conference
Hall
3575
m3
Fan
shaped 264 persons 1,56 s 1,24 s -2,75 dB 0,39 1,13 0,86
Air Force
Conference
Hall
2345
m3
Box
shaped 391 persons 1,31 s 1,24 s 3,5 dB 0,49 1,27 0,92
Assumptions that are made in terms of architectural design criteria and acoustic
conditions may be summarized as follows:
Previous studies by Özçevik & Yüksel Can (2015) have proposed that TCM is
not suitable for rooms bigger than 1000 m3 in volume. In this study, three
114
rooms that have a large volume have been analyzed and outputs have presented
that when required conditions are met, TCM may be performed in large
volumes without the need of additional amplification.
In Ankara Opera House, parameters that are shown in the previous tables are
found to be plausible for TCM performances. The shoebox type room can be
considered as successful for TCM, which supports the objective parameter
values and complements rooms designed for music.
C80 and D50 values in ESMMMO conference hall were found to be insufficient.
This may be due to the fan shaped room type, which affects the late reflections
of the sound coming from its source. The behavior of reflected sounds need to
be analyzed before designing a room for TCM in order to eliminate
unfavorable conditions regarding clarity, due to the presence of vocals.
Similar to Ankara Opera House, objective parameters are found to be
acceptable for Air Force conference hall, as well. This room is almost half the
size of Ankara Opera House in volume, which may make it easier to achieve
optimum conditions. The box shape is found to be a successful room type.
Even though TCM has similar elements with opera, the characteristics of TCM
are different. This points out to the fact that traditional opera houses with
horseshoe plan types might not be acceptable for TCM, and room shapes
similar to rooms for music may be considered more feasible for TCM
performances. Further investigation is necessary regarding this matter.
In all three cases, materials that are used in reflective surfaces need to be
chosen in the aim of acquiring the proposed parameters. Highly reflective
materials should be used in large volumes to be able to reach the desired EDT
and RT values. Materials that have a relatively low absorption coefficient in
low frequencies, such as plates and flat surfaces, should be preferred in side
walls and ceilings order to achieve an optimum BR value. For optimizing C80
and D50 values, materials should be assigned symmetrically to side walls to
avoid unbalanced reflections.
115
This study was aimed to serve as a guideline for creating satisfactory conditions when
designing a room that specifically serves for Turkish classical music. It is considered
that this study may be the first step towards reaching a standard layout for performance
spaces dedicated to TCM. The case rooms were selected randomly as to reflect
different room types and behaviors. When modifying the existing spaces, room sizes
were not changed as this matter would complicate the outcome process and could have
resulted in a high number of evaluation necessities. Hence, the only modifications
were made in the materials of the rooms, in order to keep the comparisons of each
space in a more controlled environment.
Future studies may have a chance of further examination on the subject by following
the same process that was presented in this thesis. Nevertheless, a more extensive
assessment various rooms with different conditions is required to achieve an
acknowledged definition of the acoustic conditions needed for TCM. Previous studies
on the matter have analyzed traditional spaces where Turkish music used to be
performed in the Ottoman period and have made assumptions on whether said spaces
were suitable for TCM or not. However, these studies have only included a limited
number of cases, where some were found to be acceptable and some were not, even
though Turkish music used to be performed traditionally in all the examined cases.
Turkish music is considered a comprehensive type of music that has different styles
according to its purpose, such as Turkish classical music, religious Turkish music, or
Turkish folk music. All of these styles are performed in different spaces. For instance,
religious music is usually played in religious building such as mosques or dervish
lodges, while folk music may be played in residential spaces or even outdoors. This
brings out the question of further examinations regarding the future of Turkish music
acoustics. In this study, only a portion of aforementioned styles were analyzed in terms
of room acoustic requirements. Further studies regarding different Turkish music
styles and different rooms may be conducted in the aim of broadening the area of
interest in the field of Turkish music acoustics.

117
CHAPTER 6
6. CONCLUSION
In this chapter, a brief summary of the study is presented and suggestions for possible
future studies have been made. Any limitations throughout the study is also discussed
in detail throughout the chapter.
6.1. Summary
Since the end of the 19th century and the beginning of the 20th century, the field of
acoustics had become a science and a considerable amount of research has been done
in various branches, such as mechanical engineering, psychology, music and
architecture. In the field of architecture, room acoustics has been studied in the aim of
improving acoustic quality and creating more successful performance spaces, which
were a part of the environment throughout centuries, continuing to develop from the
early Greek period up to this day. Along with western classical music, opera, drama
and speech, Turkish classical music is being performed for centuries as well, and yet
acoustic studies are very limited in this particular type of performance. This study
aims to provide a closer look to TCM and to be of guidance for TCM to be studied in
the field of acoustics, apart from its musical research area.
The first step for this study to be carried out is to investigate the attributes of Turkish
music and find similarities and differences between other performance types. An
extensive review of literature has been conducted concerning the history of Turkish
music and its characteristics. It was found that Turkish music had gone through
changes throughout history regarding its purpose, teaching methods and performing
styles. One main aspect that differentiates TCM from western music is the presence
of makams. While western music uses an 8-note system, a total of 52 makams are
present in TCM. Another aspect is the size of a TCM orchestra, which is smaller than
118
a symphony orchestra, thus TCM was commonly practiced and performed in smaller
rooms. Instruments of TCM differ from western music as well, and an important
distinguishing element is the fact that TCM is monophonic, whereas western music is
polyphonic. While western music is taught and performed with a note system, TCM
is most commonly taught by the “meşk” method which involves a teacher and a
student where learning is done by listening and repeating.
The basic acoustic qualities a performance space depend on its acoustic parameters.
Acoustic parameters can be analyzed as objective parameters and subjective
parameters. The quality of a room relies on its shape and size, regarding of its function
the shape and size of the room differs. Western classical music is best listened on
rectangular halls while opera requires horseshoe rooms. The dimensions of a room
also affect objective parameters, which directly affect subjective parameters. A
comprehensive investigation has been done regarding room acoustic parameters,
where definitions and explanations have been made for objective parameters which
are reverberation time (RT), early decay time (EDT), clarity (C80), definition (D50),
early lateral energy fraction (LF80), late arriving lateral energy (LG80) and bass and
treble ratios (BR, TR). Subjective parameters such as reverberance, clarity, warmth,
intimacy, listener envelopment and balance were examined.
Apart from the examination of TCM with its history, main characteristics and
differences from other performance types, additional analyses were carried out
concerning the acoustic properties of TCM. Frequency spectrum analyses were made
for western classical music, opera and TCM, where 100 samples of music regarding
each type of performance were examined in terms of frequency spectra. It was found
that low frequencies tend to be more dominant in TCM, percussions and vocals are
commonly the main assertive elements and TCM songs usually follow a homogenous
pattern, where songs are more dynamic and versatile.
Deriving from the information that was gathered throughout the study, experiments
were made using auralisations of Turkish music recordings, in the aim of getting closer
119
to determining optimum acoustic conditions. Four reference auralisations were made
in a box shaped room that has similar conditions to an anechoic chamber. Afterwards,
ten alternatives which have different acoustic parameters were created and
auralisations were made for each alternative.
The auralisations were used for a listening test to try to discover which alternatives
were the most successful in terms of acoustic quality regarding TCM. The listening
test was aimed to link objective parameters to subjective parameters of the listeners.
Results have shown that references 5, 6, 9 and 10 had the most preferable conditions.
Acquiring from the results, assumptions were made regarding optimum acoustic
parameters for TCM. Reverberation time was found to be most successful between
1,10 and 1,30 seconds, where early decay times are best observed between 1,20 and
1,40 seconds. C80 values have yielded the best results when they are between -4 dB
and +4 dB, while the most acceptable D50 values are between 0,38 and 0,42. Bass
ratios between 1,10 and 1,40 together with treble ratios that are lower than 1,0 provide
warm bass and live treble experiences.
The results of the listening test have provided optimum conditions for TCM, however,
since they were made in a box shaped room, they merely qualified as assumptions. A
second listening test was conducted using auralisations made in three different
existing performance spaces. The performance spaces were improved in terms of
acoustic quality and conditions similar or close to optimum were achieved. Listeners
are asked to choose between the existing conditions and the improved conditions by
listening to samples that were played in each scenario. Results have shown that the
majority of the participants preferred the improved conditions over the existing ones.
Correlations were made from the results of the second listening test, where the
evaluation scores of each room is compared between the existing and improved
conditions. The results showed that the improved conditions received a more positive
feedback compared to the existing conditions. Following the correlations,
improvements were made in the earlier proposed conditions for TCM. RT values are
120
accepted optimum between 1,10 and 1,30 seconds, where EDT values between 1,40
and 1,60 seconds are considered to be successful. C80 values provide the best results
between 0 dB and +4 dB and D50 values between 0,45 and 0,60 are accepted as
optimum, which are the same accepted values for classical music and opera. BR values
between 1,1 and 1,3 along with TR values that are lower than 1,0 are acknowledged
to give successful results regarding conditions for TCM.
When designing a space for TCM, rectangular box shaped rooms should be preferred
in order to achieve better acoustic conditions. Late reflections should be taken into
account to provide better results for C80 and D50 values. Reflective materials that have
low absorption coefficients in low frequencies should be used in walls and ceilings to
keep the BR values in optimum range and achieve plausible RT and EDT values.
6.2. Limitations and Recommendations
This study was done as a master’s thesis, and due to limited facilities and time, it is
believed that the subject has a much bigger potential and can be focused more in-depth
in the future. Anechoic recordings were difficult to obtain, which led to the necessity
of support from previous researchers.
In a more intensive study, recordings may be taken in order to reflect various different
styles of TCM, such as the presence of a choir or a bigger orchestra. Experiments and
listening tests may be done in other performance spaces as to bring out even more
accurate results, getting one step closer to determine a standard for acoustic conditions
regarding TCM. This study is believed to be the first step among the many steps into
achieving that goal.
121
REFERENCES
Ak, A. Ş. (2014). Türk Musikisi Tarihi. Ankara: Akçağ Yayınları.
Akkoç, C. (2002). Non-Deterministic Scales Used in Traditional Turkish Music.
Journal of New Music Research, 285-293.
Aletta, F., Botteldooren, D., Thomas, P., Vander Mynsbrugge, T., De Vriendt, P.,
Van de Velde, D., & Devos, P. (2017). Exploring the soundscape quality of
five nursing homes in Flanders (Belgium): preliminary results from the
AcustiCare project. Internoise (s. 31-40). Hong Kong: Internoise.
Aşıroğlu, S. C. (2009). Klasik Türk Müziğinde Stratejik Pazarlamanın Rolü.
İstanbul: Haliç University, Graduate School of Social Sciences, master's
thesis.
Aybars, B. (2008). Türk Musikisi Temel Bilgileri. İstanbul: İkinci Adam Yayınları.
Bahalı, S., & Tamer-Bayazıt, N. (2017). Soundscape research on the Gezi Park –
Tunel Square Route. Applied Acoustics, 260-270.
Barron, M. (1993). Auditorium Acoustics and Architectural Design. London: Taylor
& Francis.
Behar, C. (1993). Zaman-Mekan- Müzik. İstanbul: AFA Yayıncılık.
Behar, C. (1998). Aşk Olmayınca Meşk Olmaz. İstanbul: Yapı Kredi Yayınları.
Behar, C. (2015). Osmanlı/Türk Musikisinin Kısa Tarihi. İstanbul: Yapı Kredi
Yayınları.
Beranek, L. (1996). Concert and Opera Halls: How They Sound. New York, USA:
Acoustical Society of America.
Beranek, L. (2004). Concert Halls and Opera Houses: Music, Acoustics, and
Architecture. New York, USA: Springer - Verlag.
122
Bingöl, E. (1999). Türk Musikisinde Makamlar ve Seyir Örnekleri. İstanbul:
Bakırköy Musiki Vakfı Yayınları.
Bissinger, G., & Mores, R. (2015). Model-based auralizations of violin sound trends
accompanying plate-bridge tuning or holding. JASA Express Letters, 293-
299.
Bozkurt, B. (2008). An Automatic Pitch Analysis Method for Turkish Maqam
Music. Journal of New Music Research, 1-13.
Bradley, J. S., & Soulodre, G. A. (1995). Objective measures of listener
envelopment. Journal of Acoustical Society of America, 98.
Can, M. C. (2001). Orta Asya Türk Topluluklarında Müzik. Ankara: "History of
music" lecture notes.
Can, M. C. (2001). XV. Yüzyıl Türk Musıkisi Nazariyatı (Ses Sistemi). İstanbul:
University of Marmara, Graduate School of Social Sciences, PhD. Thesis.
Can, M. C., & Levedoğlu, N. O. (2002). Geleneksel Türk Sanat Müziği
Terminolojisinde Çok Kültürlü Unsurlar. Gazi Eğitim Fakültesi Dergisi, 239-
245.
Cannam, C., Landone, C., & Sandler, M. (2010). Sonic Visualiser: An Open Source
Application for Viewing, Analysing, and Annotating Music Audio Files.
Proceedings of the ACM Multimedia 2010 International Conference.
Firenze: MM '10 ACM Multimedia Conference. https://sonicvisualiser.org/.
adresinden alındı
Cavanaugh, W., & Wilkes, J. (1999). Architectural Acoustics. New Jersey: John
Wiley & Sons.
Cerwén, G. (2016). Urban soundscapes: a quasi-experiment in landscape
architecture. Landscape Research, 1-14.
123
Costa, Y. M., Oliveira, L. S., Koericb, A. L., & Gouyon, F. (2011). Music genre
recognition using spectrograms. 18th International Conference on Systems,
Signals and Image Processing. Sarajevo, Bosnia: IEEE.
Egan, D. (2007). Architectural Acoustics. New York, USA: Mc Graw Hill.
Elson, A. (1921). Architectural Acoustics. The Musical Quarterly, 469-482.
Everest, F. A., & Pohlamann, K. C. (2009). Master Handbook of Acoustics. New
York, USA: The McGraw-Hill Companies.
Gade, A. C. (1989). Investigations of Musicians Room Acoustic Conditions in
Concert Halls, II: Field Experiments and Synthesis Results. Acoustica, 249-
262.
Gade, A. C. (2007). Acoutics in Halls for Speech and Music Springer Handbook of
Acoustics. New York: Springer Science+Business Media.
Gedik, A. C., & Bozkurt, B. (2009). Evaluation of the Makam Scale Theory of Arel
for Music Information Retrieval on Traditional Turkish Art Music. Journal
of New Music Research, 103-116.
Gürbüz, H. (2010). Meşk Sistemi, Türk Musikisine Katkıları Ve Günümüze. İstanbul:
Haliç University, Graduate School of Social Sciences, master's thesis.
Haan, C. H. (1993). Geometry As a Measure of Acoustical Quality of Auditoria.
Sydney, Australia: University of Sydney, PhD.
Harriet, S., & Murphy, D. (2015). Auralisation of an Urban Soundscape. Acta
Acustica United with Acustica, 798-810.
Hawkes, R. J., & Douglas, H. (1970). Subjective Acoustic Experience in Concert
Auditoria. Architectural Research and Teaching, 34-45.
124
Johnson, K. (2011). Acoustic and Auditory Phonetics. Hoboken, NJ: Wiley -
Blackwell.
Kara, E. (2009). Valensiya Santa Anna Şapeli’nin Restorasyon Sonrası Akustik
Değerlendirmesi. İstanbul: Yıldız Technical University, Graduate School of
Natural and Applied Sciences, master's thesis.
Karamahmutoğlu, G. (2014). Tanzimat Dönemi’nde Müzik, Dönem Padişahları ve
Müzik Anlayışları. Yeni Türkiye Dergisi Türk Musikisi Özel Sayı, 563.
Kartal, E. (2012). Türk Müziği Enstrümanlarının Frekans Aralıkları. İstanbul: Özgür
Yayınları.
Kaygusuz, N. (2014). 19. Yüzyıldan 21. Yüzyıla Türk Müziğinin Kısa Bir Hikayesi.
Yeni Türkiye Dergisi Türk Musikisi Özel Sayı, 11-13.
Kleiner, M. (2012). Acoustics and Audio Technology. Ft. Lauderdale: J. Ross
Publications.
Kuttruff, H. (1991). Room Acoustics, Third Edition. London, UK: Elsevier Applied
Science.
Kuttruff, H. (2006). Acoustics, an Introduction. Florida: CRC Press.
Kwon, Y., & Siebein, G. (2007). Chronological Analysis of Architectural and
Acoustical Indices in Music Performance Halls. Journal of Acoustic Society
of America, 2691-2699.
Ladefoged, P. (1995). Elements of Acoustic Phonetics. Chicago: The University of
Chicago Press.
Ladefoged, P., & Johnson, K. (2010). A Course in Phonetics. Wadsworth: Michael
Rosenberg.
Lewis, B. (1968). The Arabs in History. London: Hutchinson University.
125
Long, M. (2006). Architectural Acoustics. Burlington, MA: Elsevier Academic
Press.
Maekawa, Z., & Lord, P. (1994). Environmental and Architectural Acoustics.
London, UK: E & FN Spon Press.
Malecki, P. (2015). Spatial Impulse Response Assessment in Room Acoustics
Auralization. Acta Physica Polonica A, 17-21.
Malm, W. P. (1967). Music Cultures of the Pacific, The Near East, and Asia. New
Jersey: Prentice-Hall.
Mehta, M., Johnson, J. A., & Rocafort, J. (1999). Architectural Acoustics: Principles
and Design. New Jersey, USA: Prentice Hall.
Mommertz, E. (2009). Acoustics and Sound Insulation. Regensburg: Aumüller
Druck.
Morales, A. R. (2013). A new method for auralisation of airborne sound insulation.
Applied Acoustics, 116-121.
Örün, G. (2011). ACOUSTICAL ANALYSIS AND TAXONOMY OF
PERFORMANCE HALLS IN EARLY REPUBLICAN PERIOD IN ANKARA:
RESIM HEYKEL MÜZESİ, KÜÇÜK TİYATRO AND OPERA. Ankara:
Middle East Technical University, Graduate School of Natural and Applied
Sciences, Ms. thesis.
Özcan, N. (2014). Türk Musikisinin Abide Şahsiyetlerinden Hamamizade İsmail
Dede Efendi. Yeni Türkiye Dergisi Türk Musikisi Özel Sayı, 433.
Özçevik, A., & Yüksel Can, Z. (2012). A field study on the subjective evaluation of
soundscape. Nantes, France: Société Française d'Acoustique.
Özçevik, A., & Yüksel Can, Z. (2015). An Evaluation of Room Acoustics in Rooms
Used for Turkish Melodic Music. Megaron, 195-204.

126
Özgür, Ü., & Aydoğan, S. (2015). Gelenekten Geleceğe Makamsal Türk Müziği.
İstanbul: Arkadaş Yayınları.
Özkan, H. Ö. (2013). Türk Musikisi ve Nazariyatı ve Usülleri Kudüm Velveleleri.
İstanbul: Ötüken Neşriyat.
Paçacı, G. (1999). Cumhuriyet’in Sesleri. İstanbul: Tarih Vakfı Yurt Yayınları.
Say, A. (2002). Müziğin Kitabı. Ankara: Müzik Ansiklopedisi Yayınları.
Sezgin, B. S. (1982). Düşündüklerimiz. Sanat ve Kültürde Kök, Issue 14.
Songar, A. (1988). Türk Müziği İle Batı Müziğinin Ses Sistemlerinin İnformatif
Değer Bakımından Karşılaştırılması. İstanbul: 1. Müzik Kongresi.
Stevens, K. N. (1999). Acoustic Phonetics. Cambridge, Mass.: MIT Press.
Tanrıkorur, C. (2011). Osmanlı Dönemi Türk Musikisi. İstanbul: Dergah Yayınları.
Tura, Y. (1988). Türk Musikisinin Meseleleri. İstanbul: Pan Yayıncılık.
Turabi, A. H. (2004). İbn-i Sina Musiki. İstanbul: Litera Yayıncılık.
Türk, E. (2011). İstanbul’daki Salonların Akustik Kalitesinin İncelenmesi ve
Değerlendirilmesi. İstanbul: Yıldız Technical University, Graduate School of
Natural and Applied Sciences, master's thesis.
Uçan, A. (2000). Türk Müziği Kültürü. İstanbul: Müzik Ansiklopedisi Yayınları.
Ugan, K. Z. (1988). Mukaddime (translation). İstanbul: Şark İslam Klasikleri.
Yavaşça, A. (1981). Türk Müziğinde Tavır. Sanat ve Kültürde Kök, Issue 1.
Yener, S. (2014). Türk Müziğinin Tarihi Gelişimi ve Müziksel Kimlik. Yeni Türkiye,
11-13.
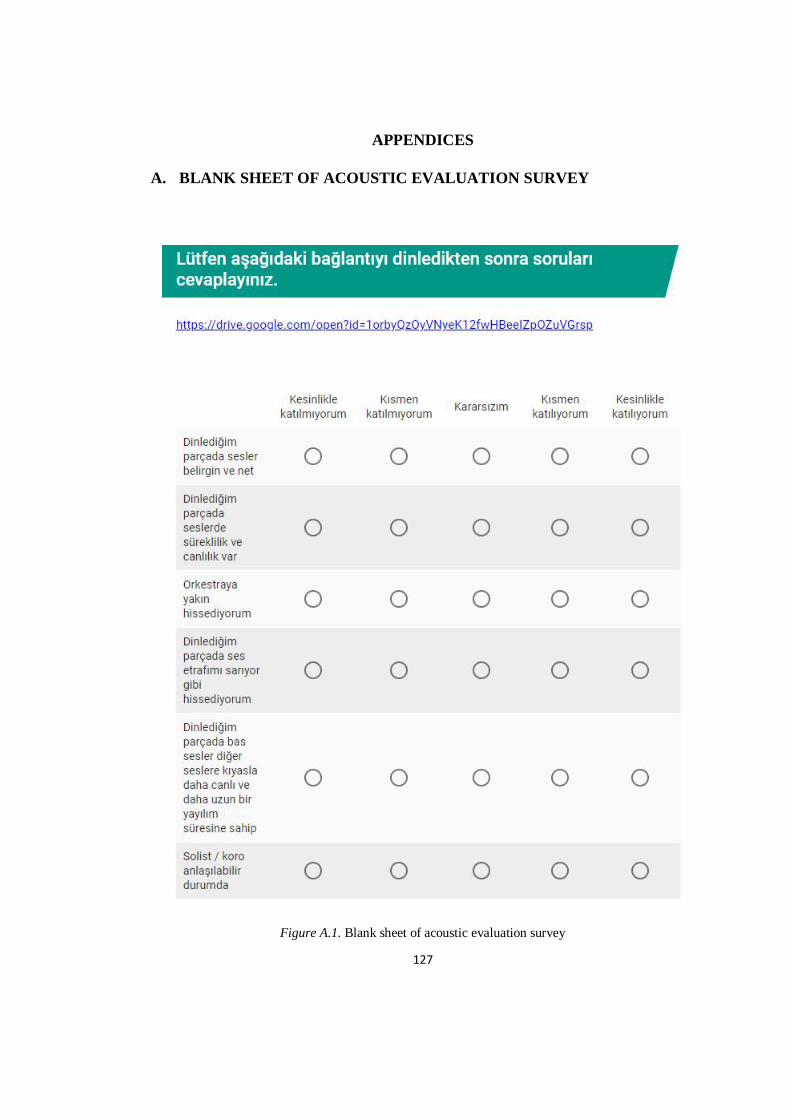
127
APPENDICES
A. BLANK SHEET OF ACOUSTIC EVALUATION SURVEY
Figure A.1. Blank sheet of acoustic evaluation survey
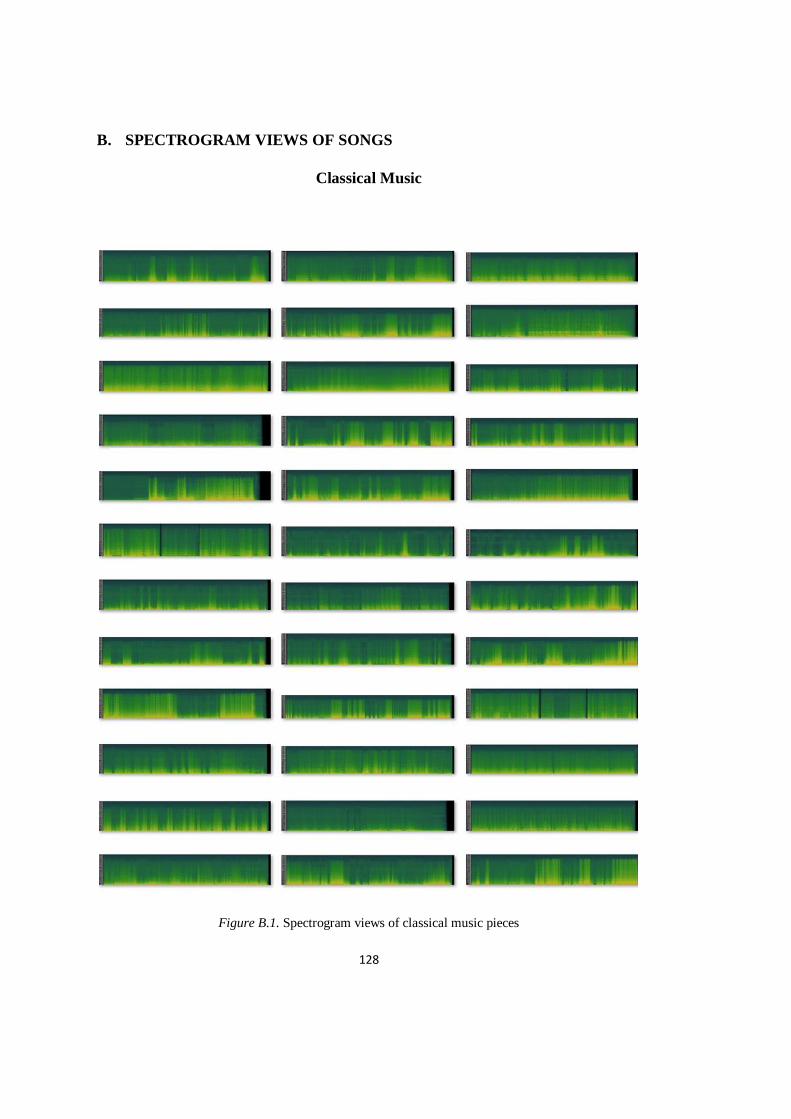
128
B. SPECTROGRAM VIEWS OF SONGS
Classical Music
Figure B.1. Spectrogram views of classical music pieces
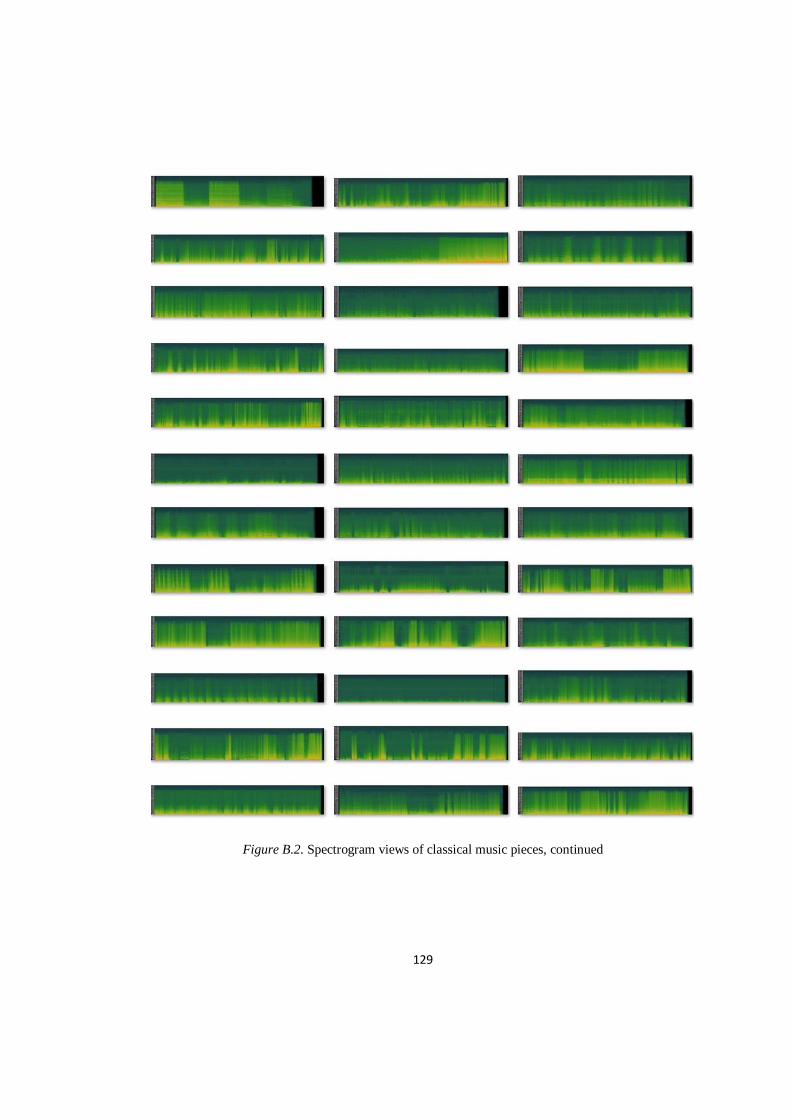
129
Figure B.2. Spectrogram views of classical music pieces, continued
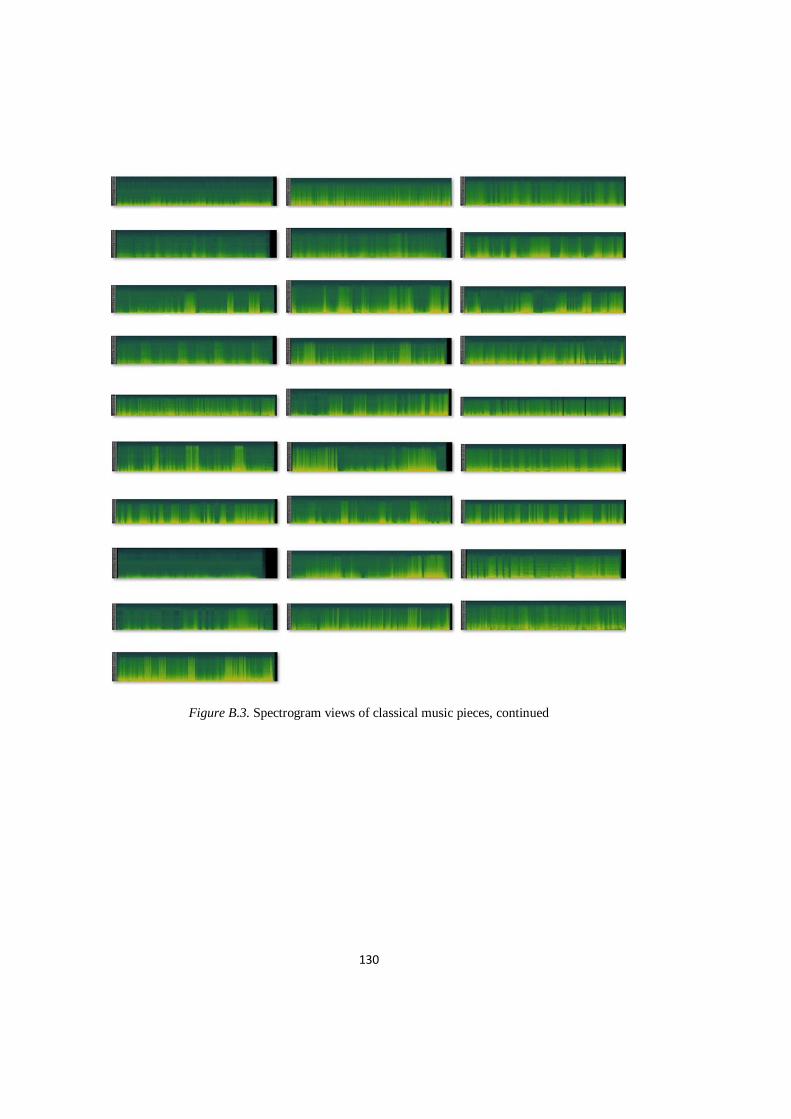
130
Figure B.3. Spectrogram views of classical music pieces, continued
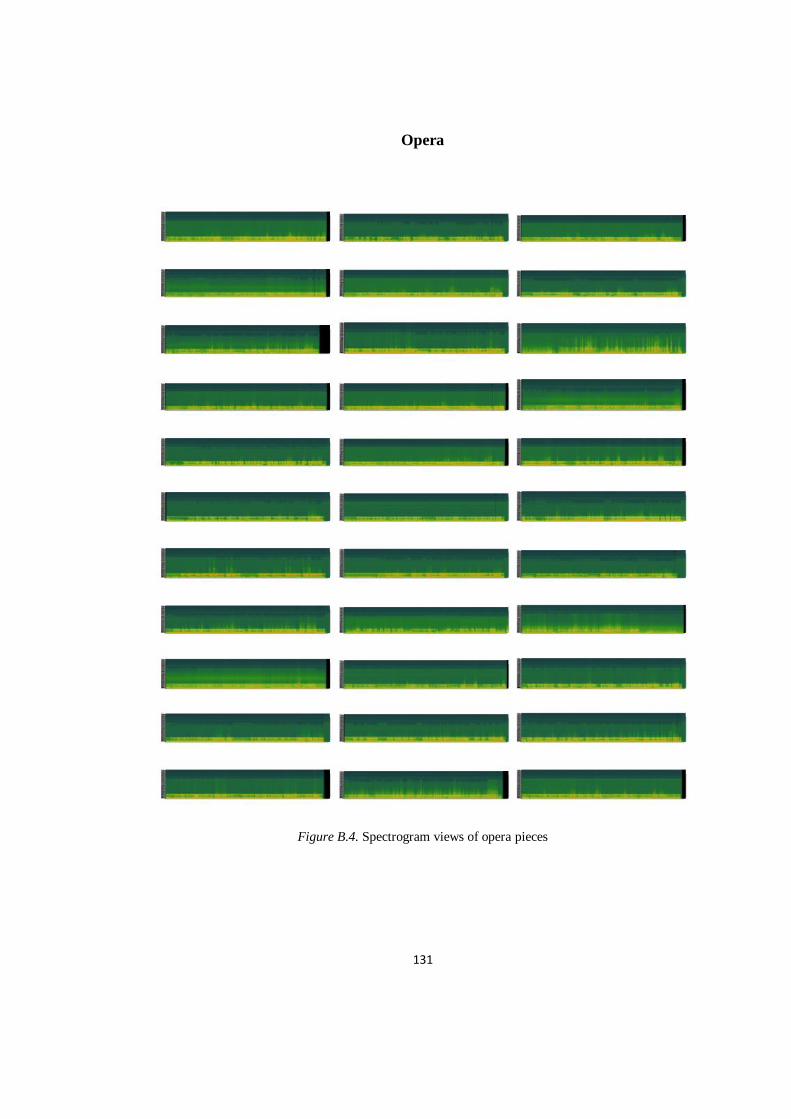
131
Opera
Figure B.4. Spectrogram views of opera pieces

132
Figure B.5. Spectrogram views of opera pieces, continued
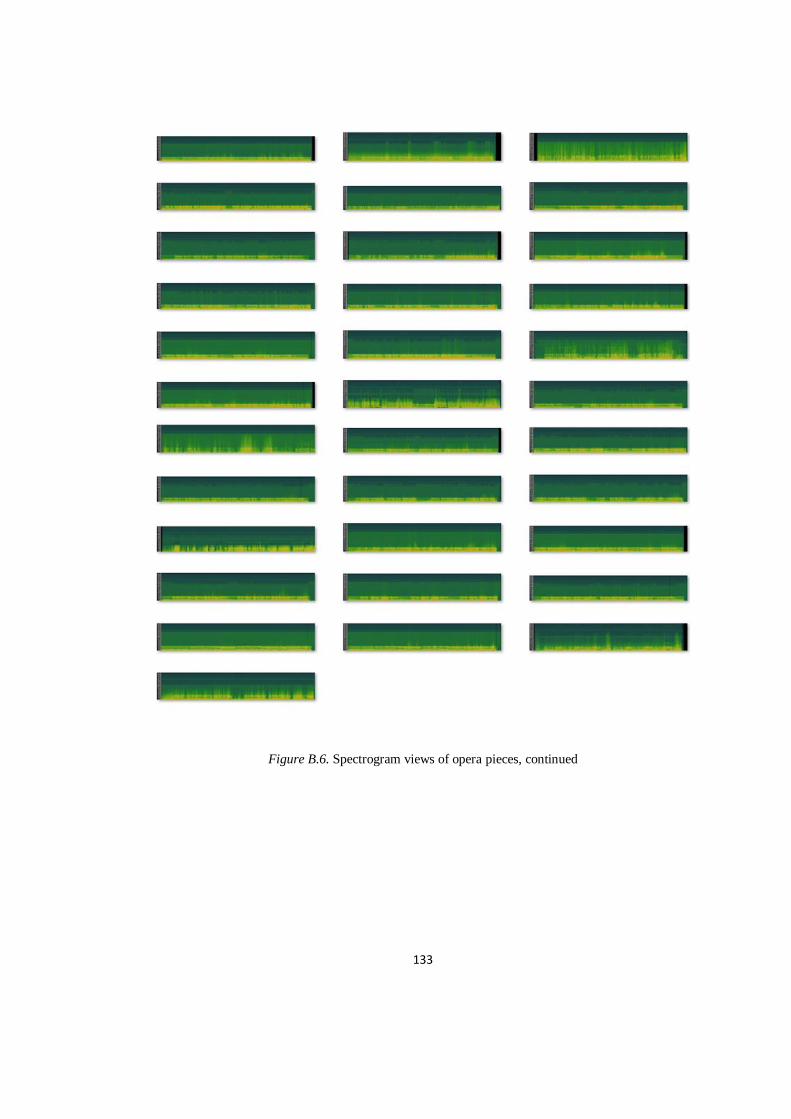
133
Figure B.6. Spectrogram views of opera pieces, continued
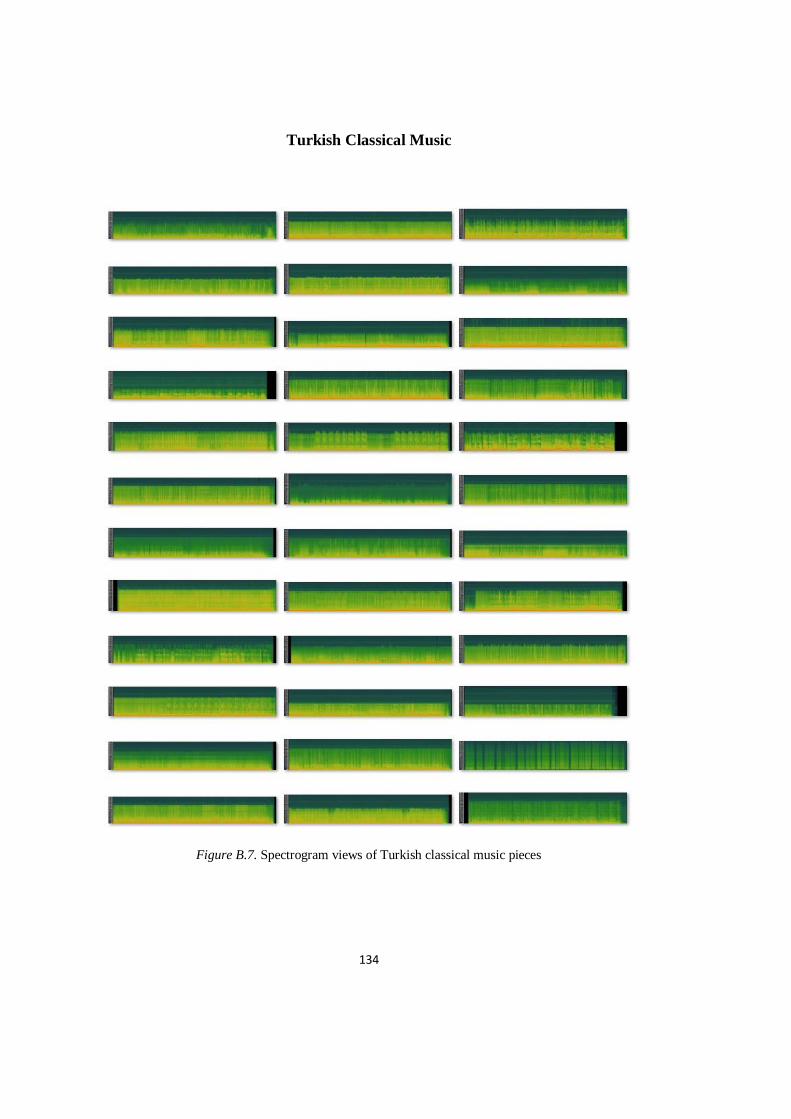
134
Turkish Classical Music
Figure B.7. Spectrogram views of Turkish classical music pieces
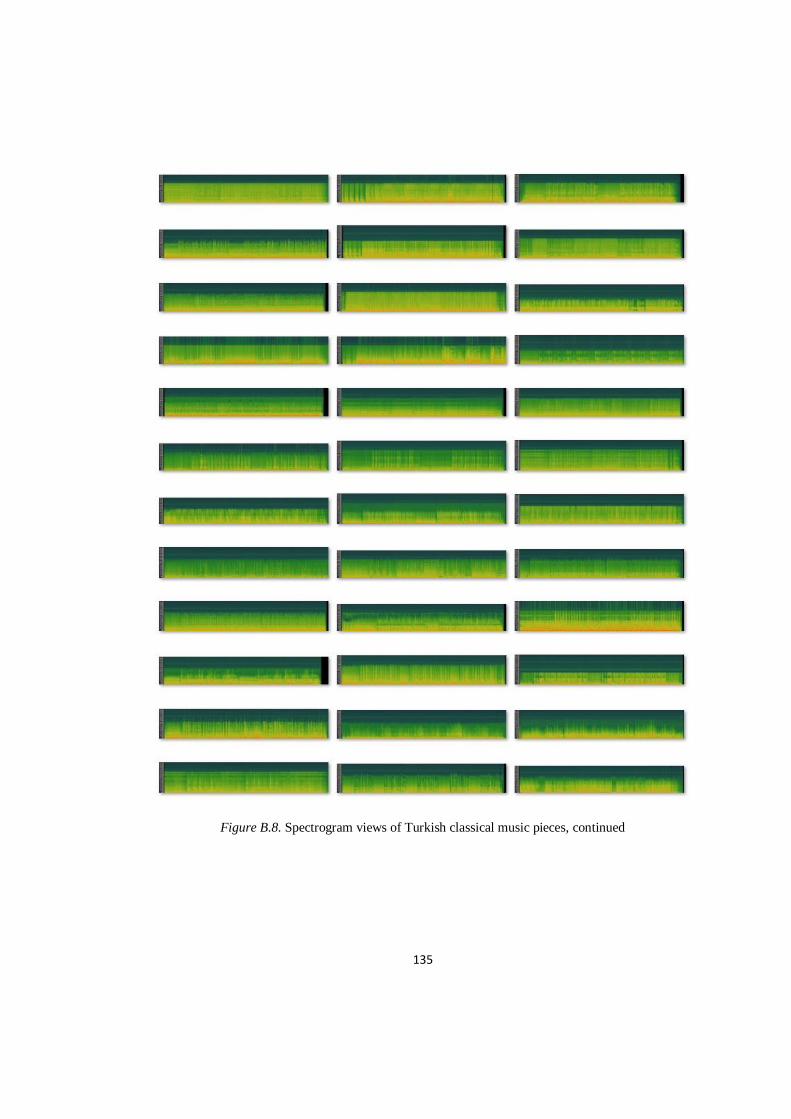
135
Figure B.8. Spectrogram views of Turkish classical music pieces, continued
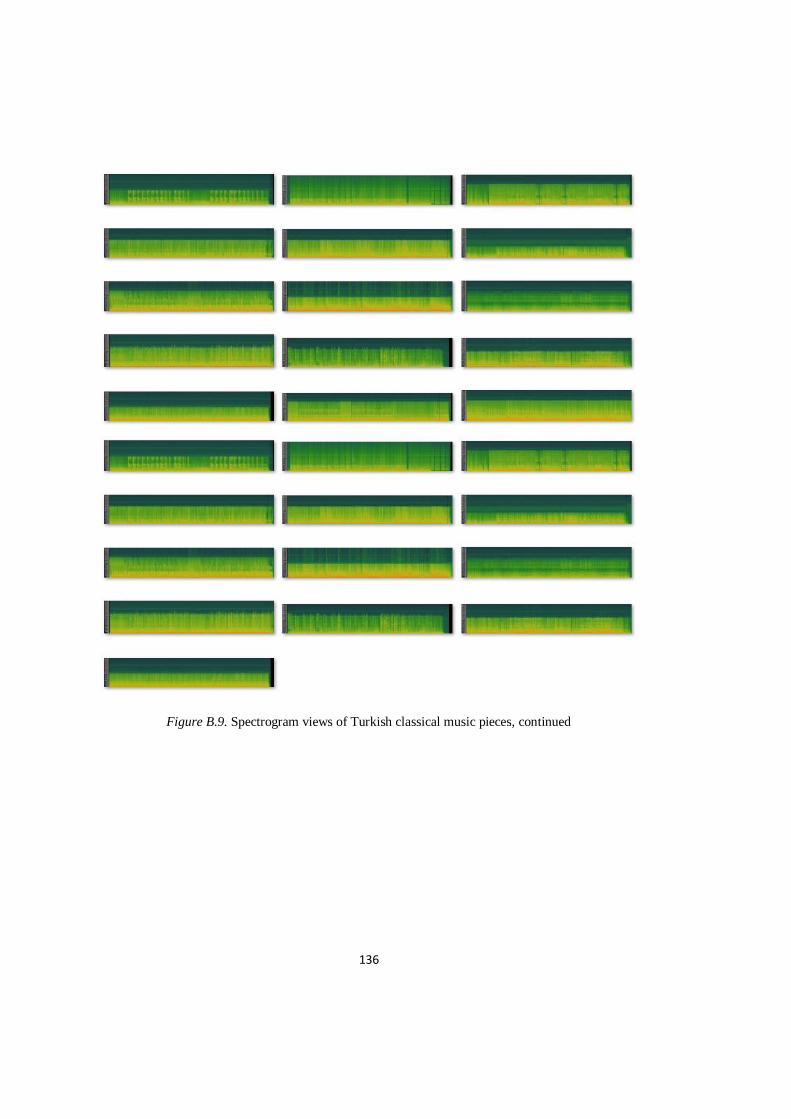
136
Figure B.9. Spectrogram views of Turkish classical music pieces, continued
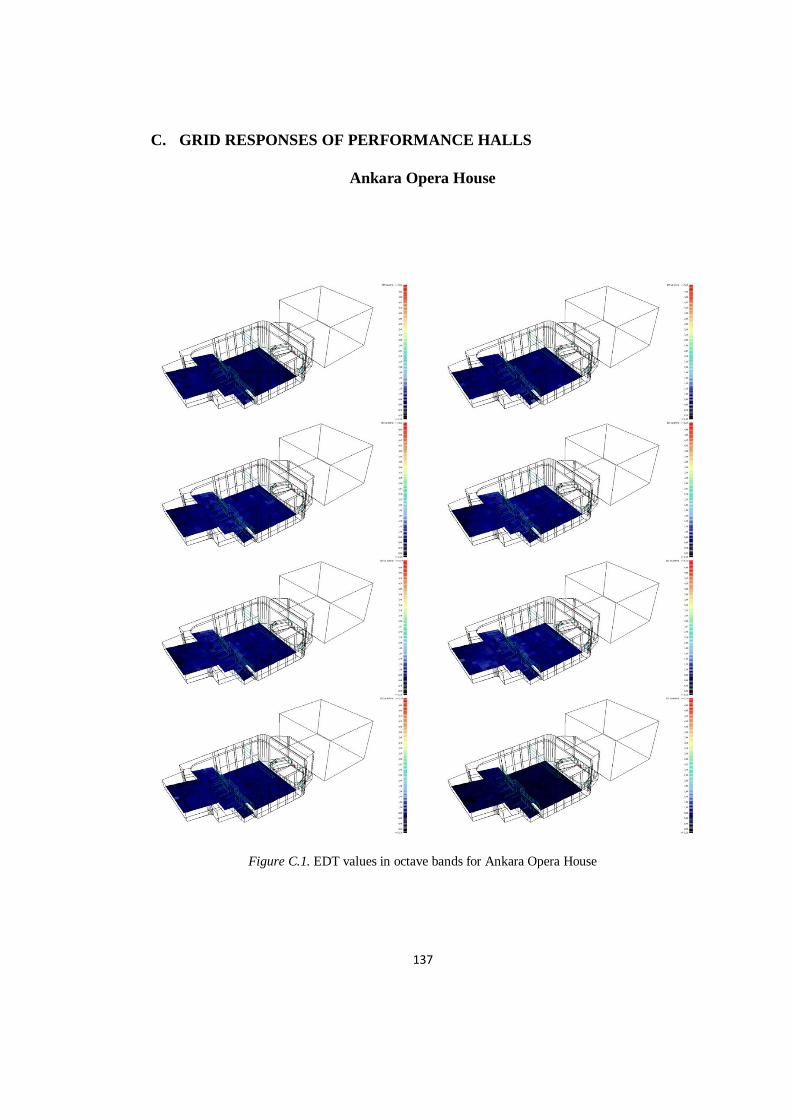
137
C. GRID RESPONSES OF PERFORMANCE HALLS
Ankara Opera House
Figure C.1. EDT values in octave bands for Ankara Opera House
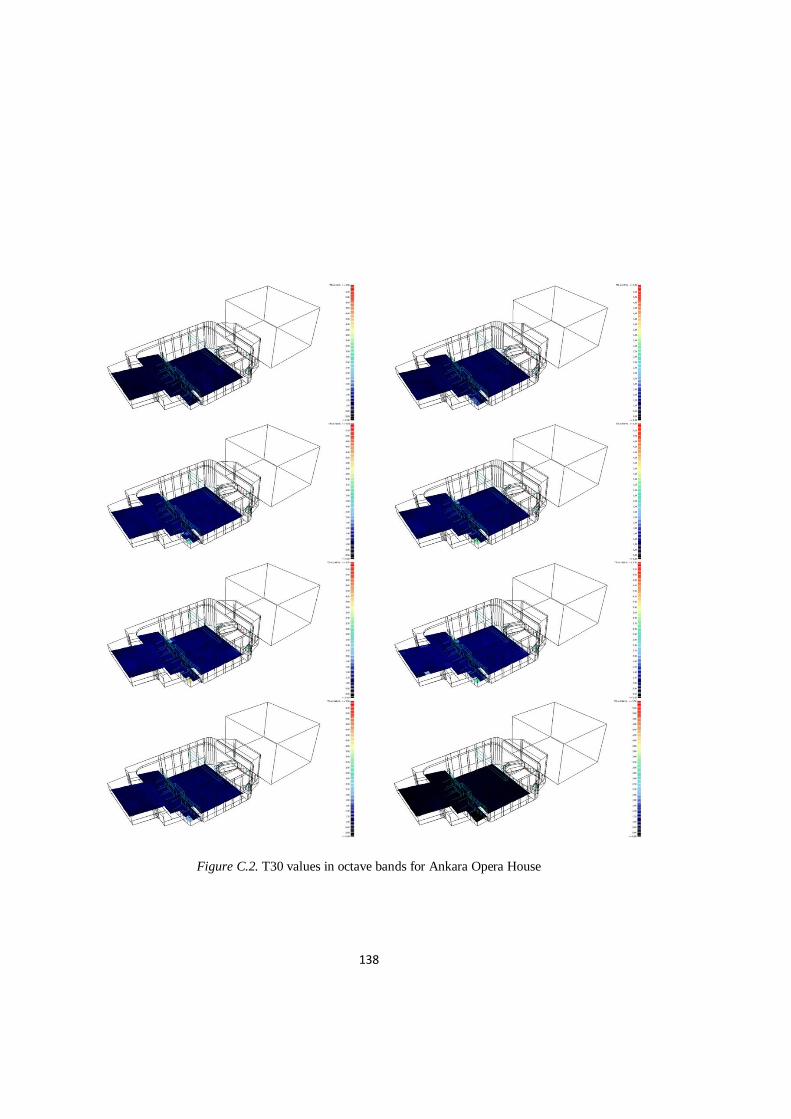
138
Figure C.2. T30 values in octave bands for Ankara Opera House
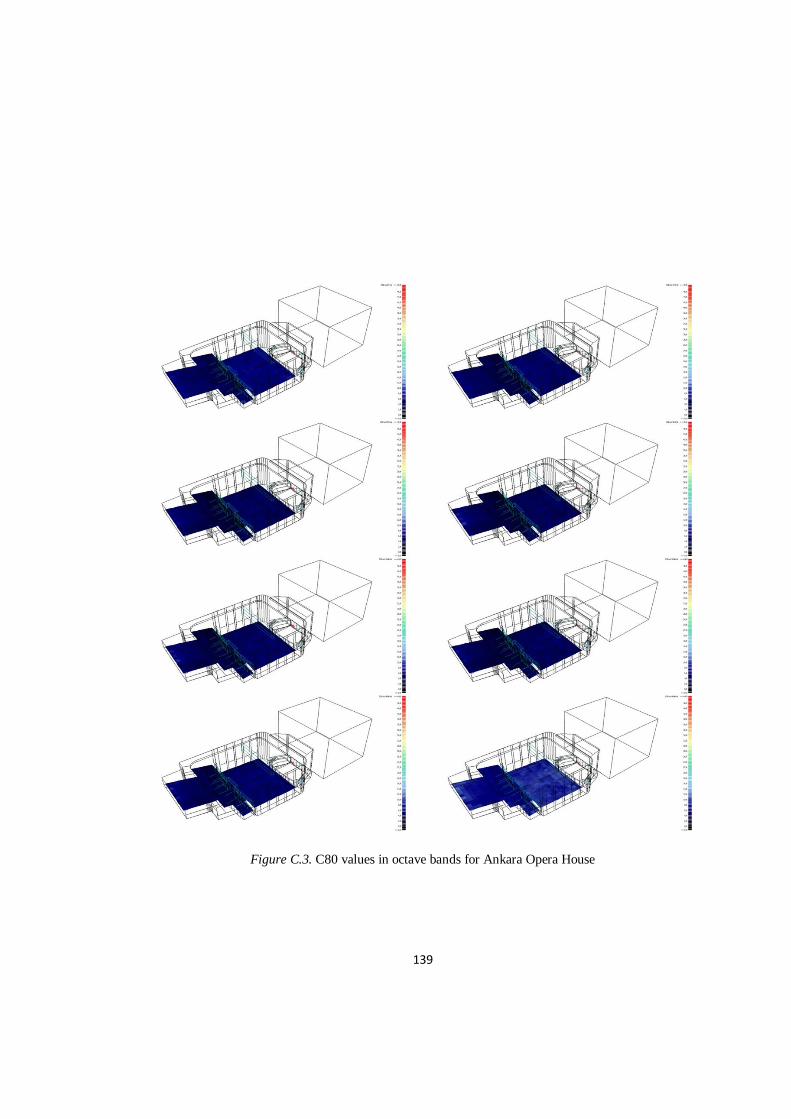
139
Figure C.3. C80 values in octave bands for Ankara Opera House
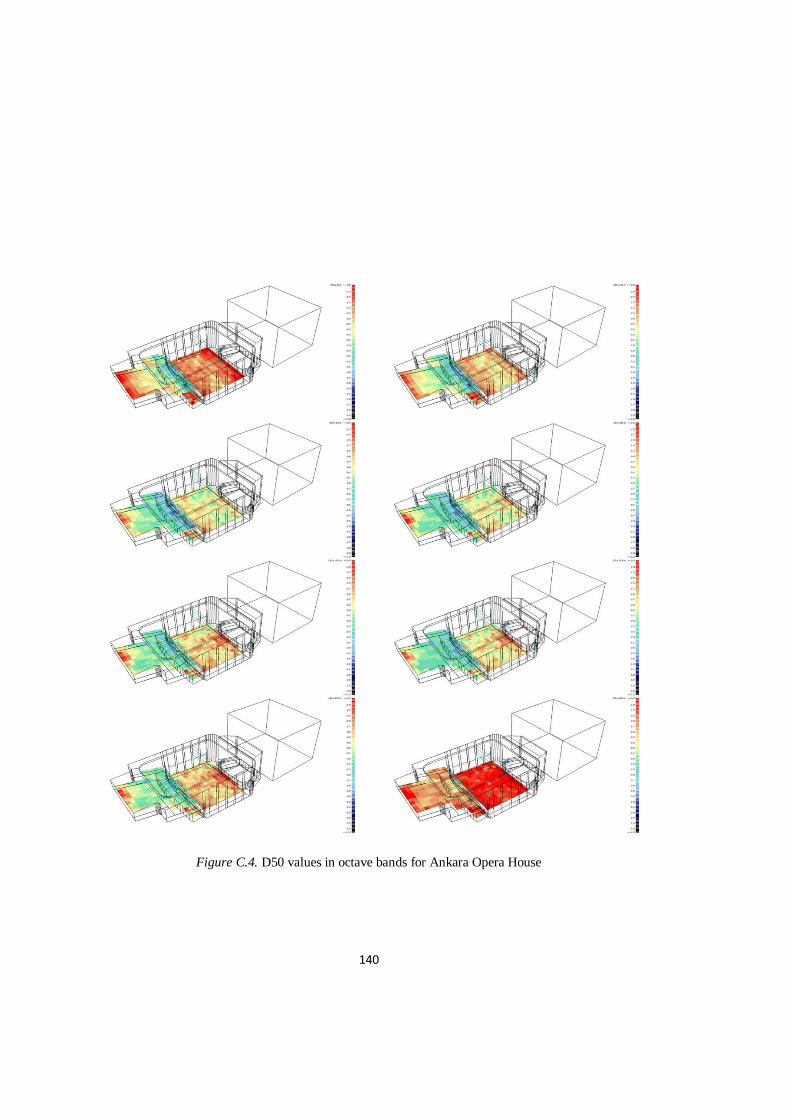
140
Figure C.4. D50 values in octave bands for Ankara Opera House
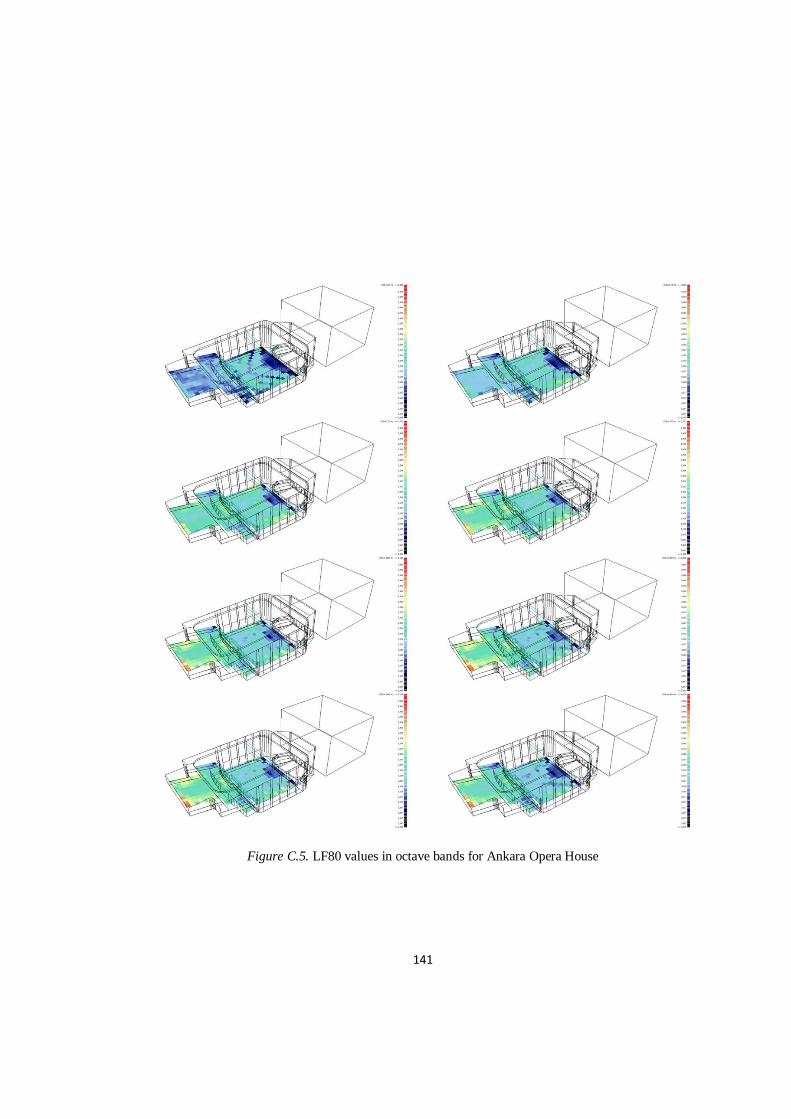
141
Figure C.5. LF80 values in octave bands for Ankara Opera House
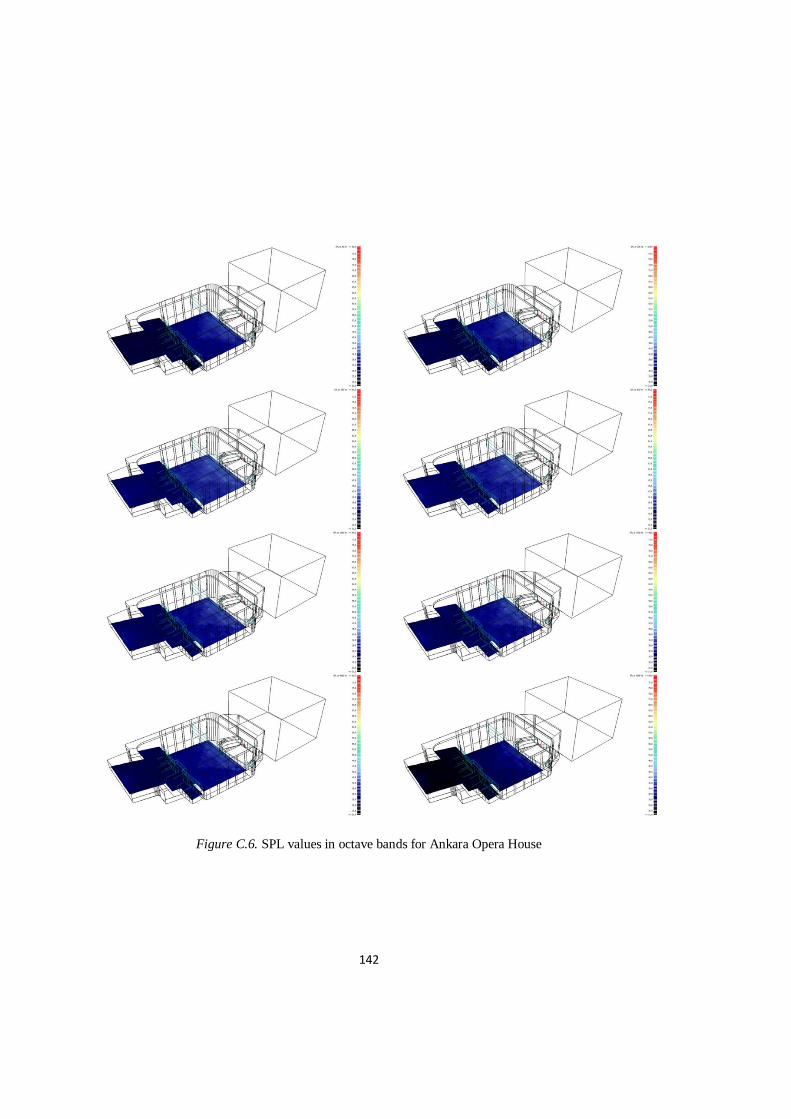
142
Figure C.6. SPL values in octave bands for Ankara Opera House
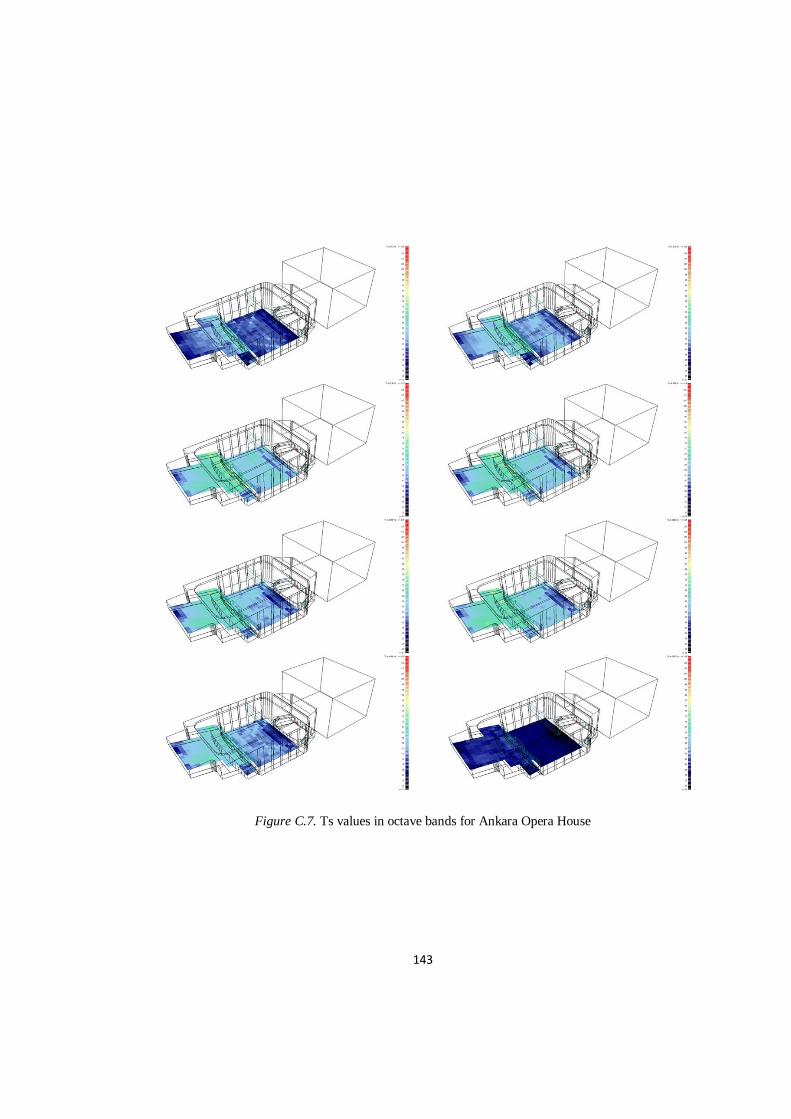
143
Figure C.7. Ts values in octave bands for Ankara Opera House
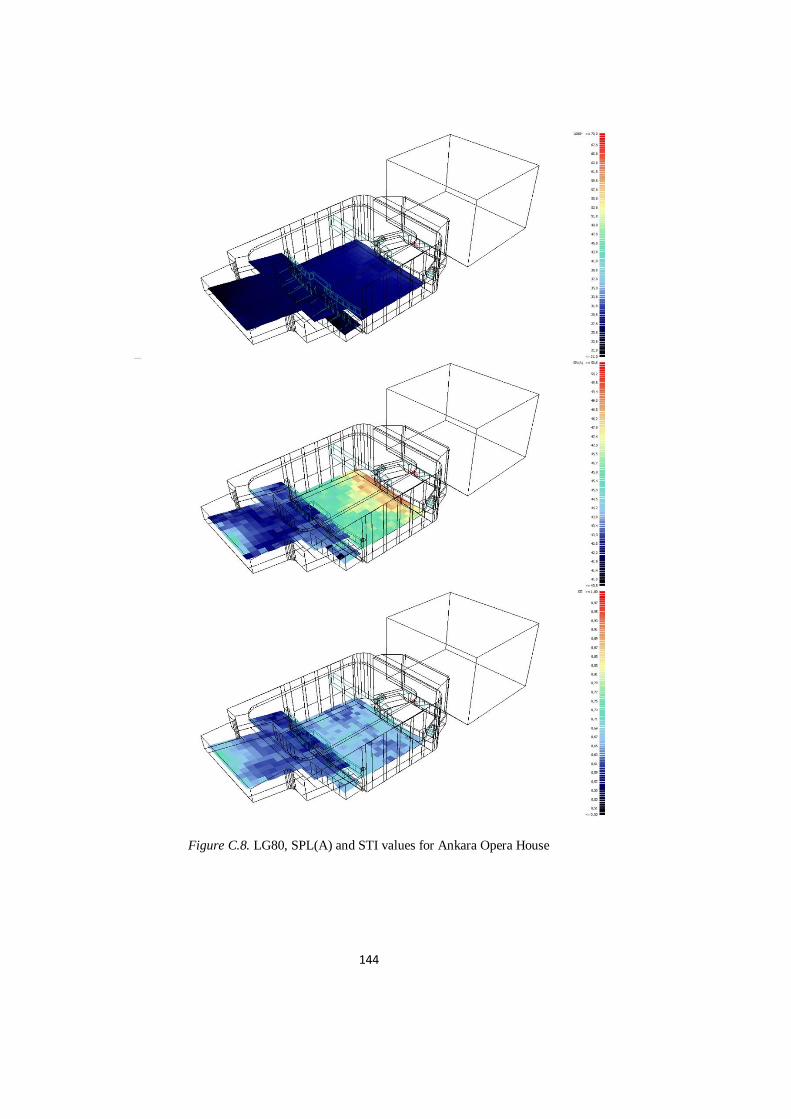
144
Figure C.8. LG80, SPL(A) and STI values for Ankara Opera House
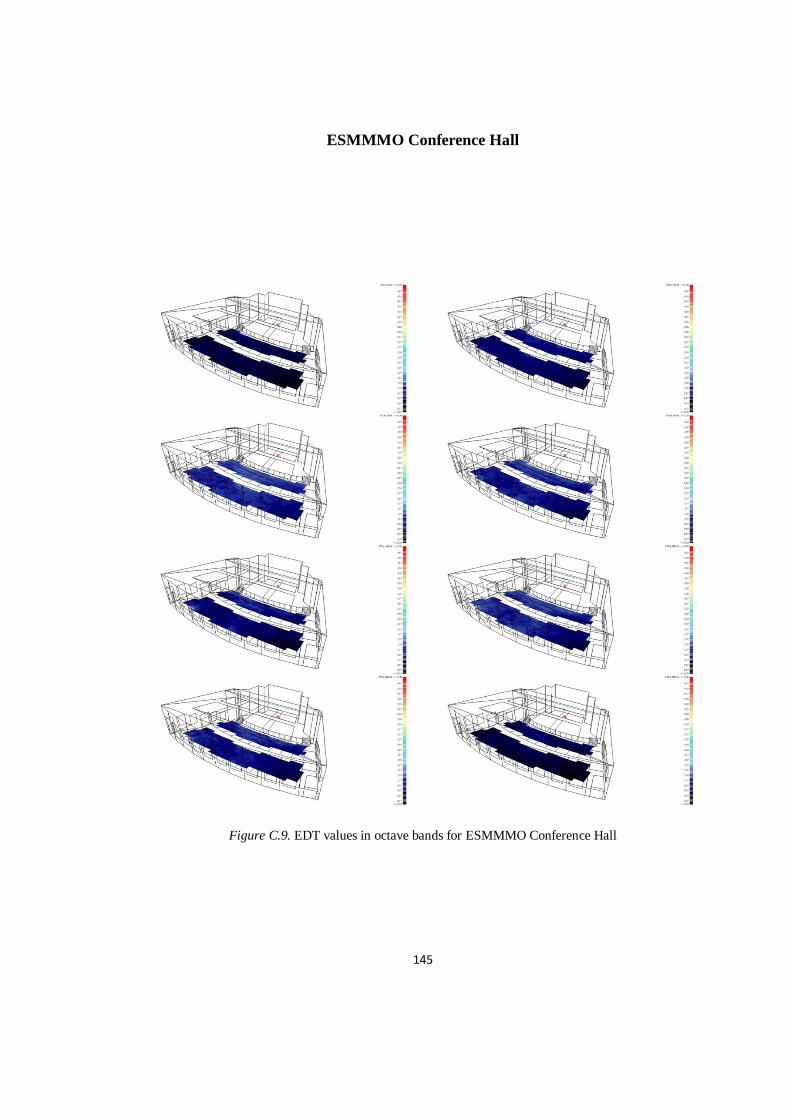
145
ESMMMO Conference Hall
Figure C.9. EDT values in octave bands for ESMMMO Conference Hall
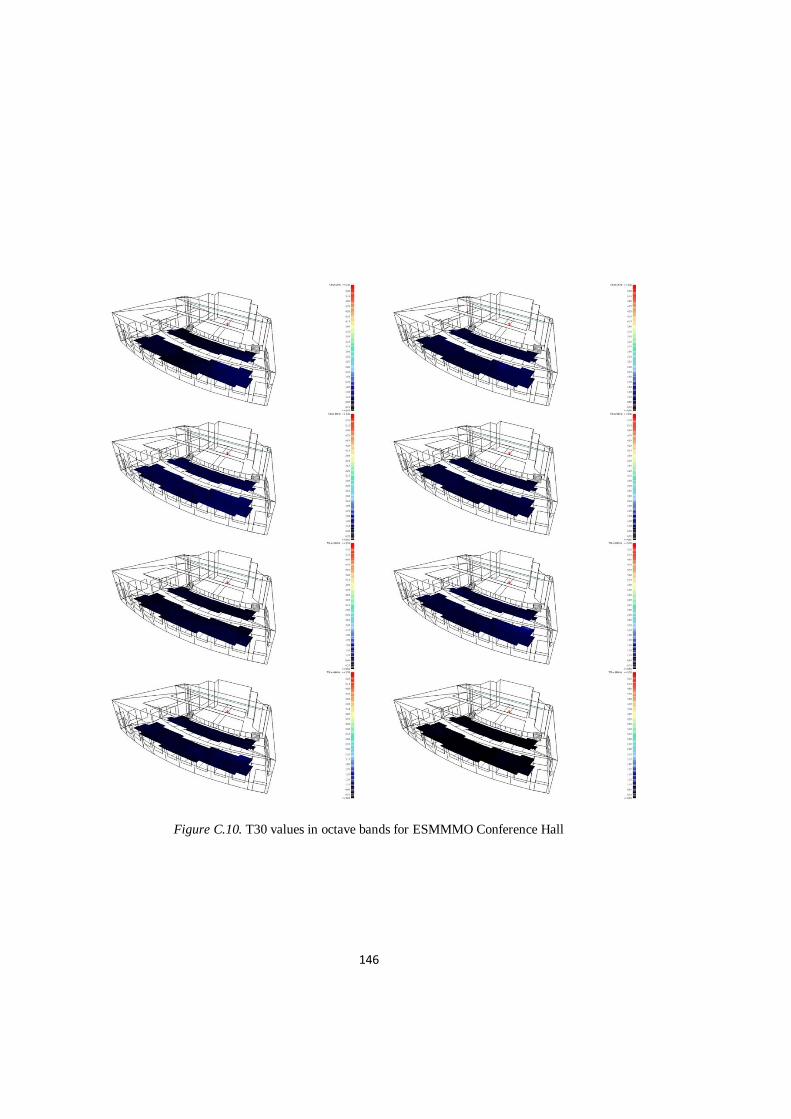
146
Figure C.10. T30 values in octave bands for ESMMMO Conference Hall
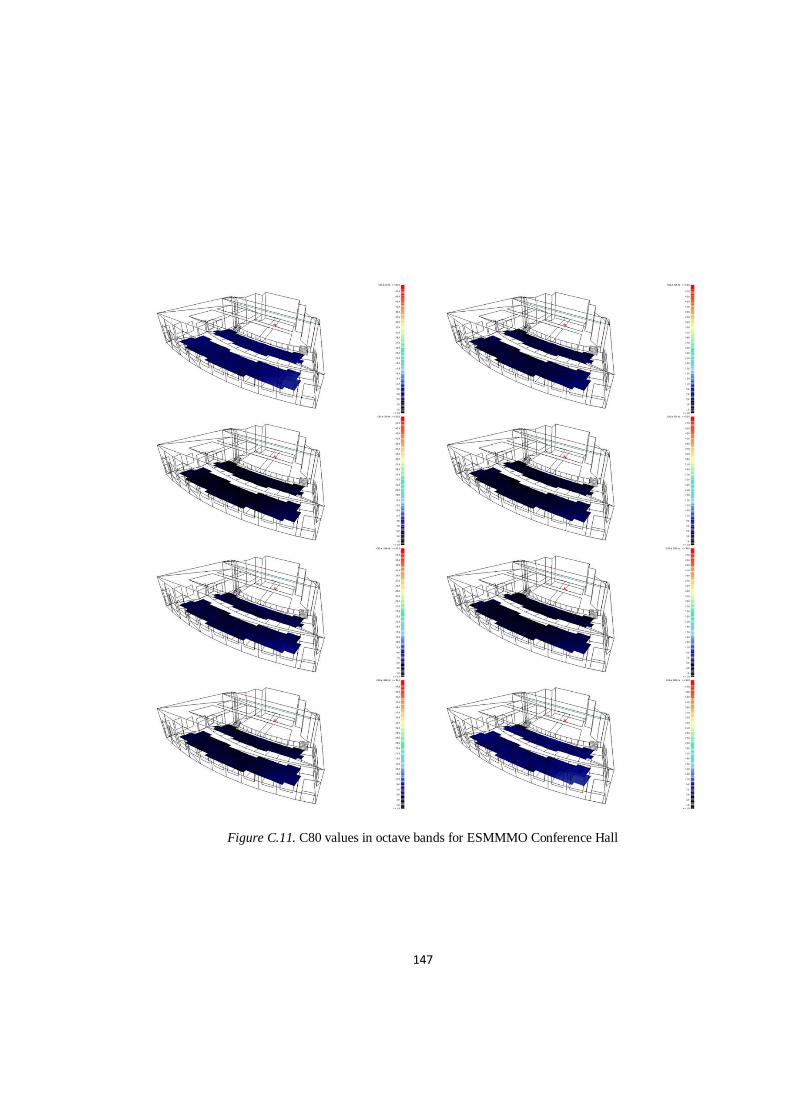
147
Figure C.11. C80 values in octave bands for ESMMMO Conference Hall
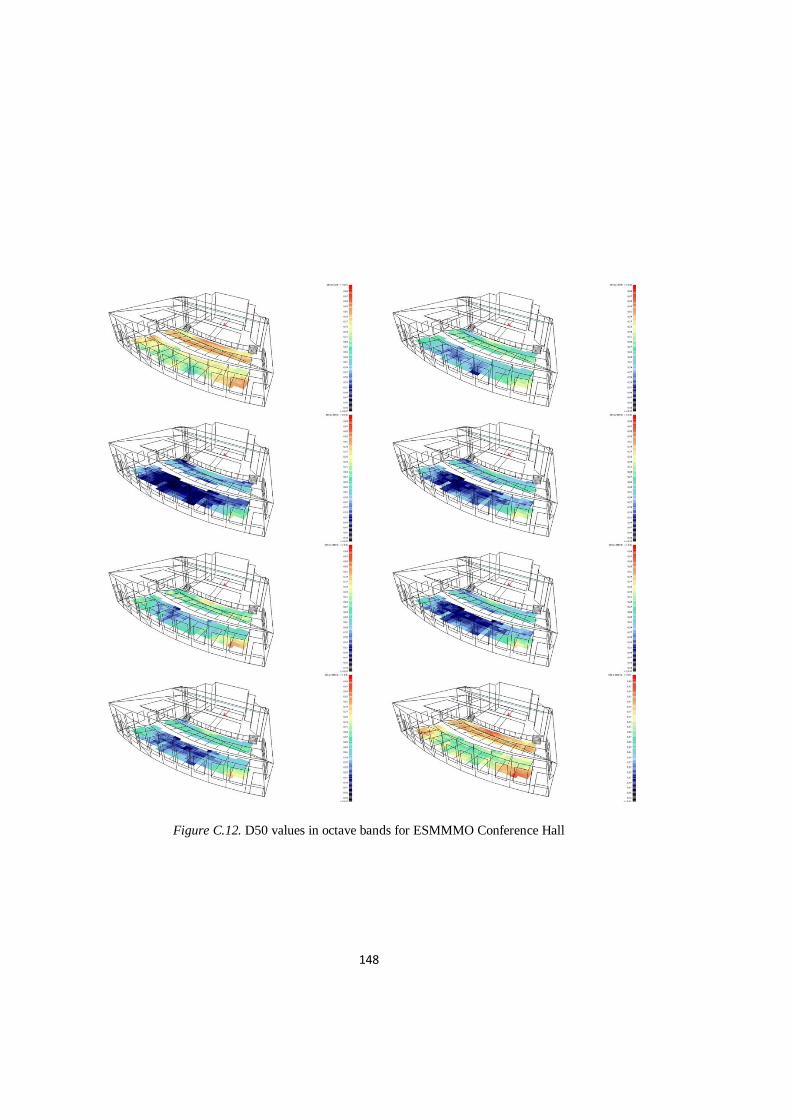
148
Figure C.12. D50 values in octave bands for ESMMMO Conference Hall
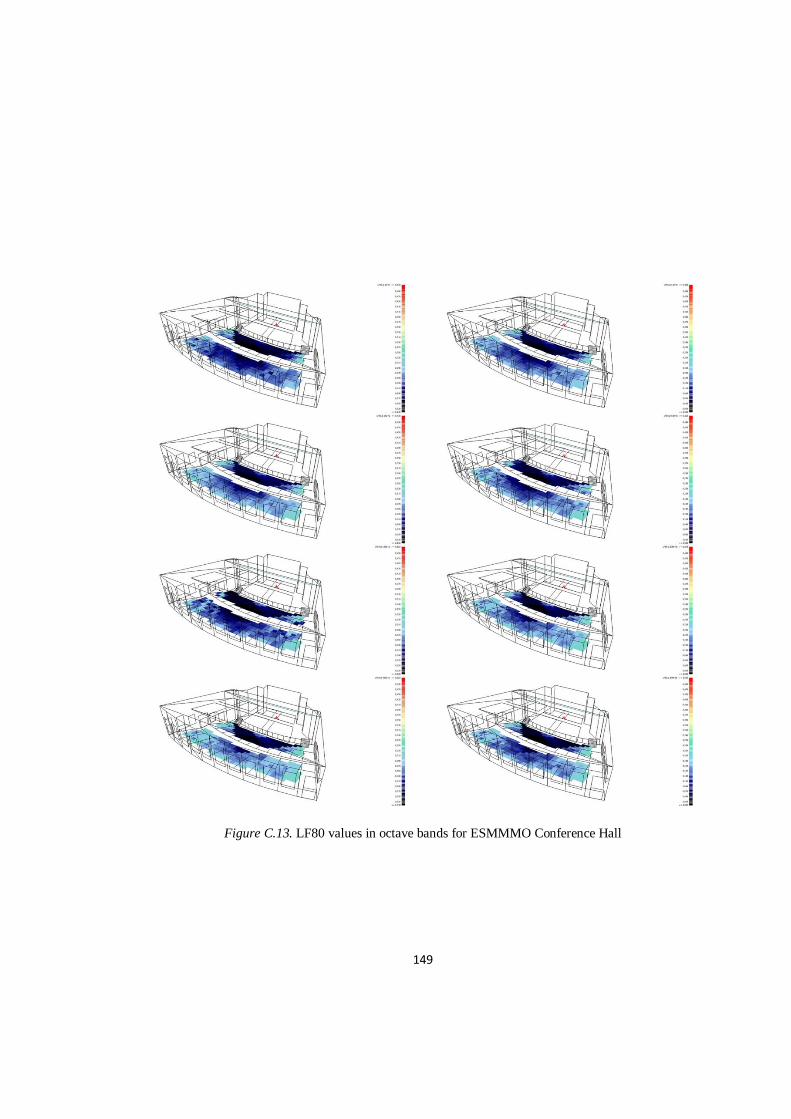
149
Figure C.13. LF80 values in octave bands for ESMMMO Conference Hall
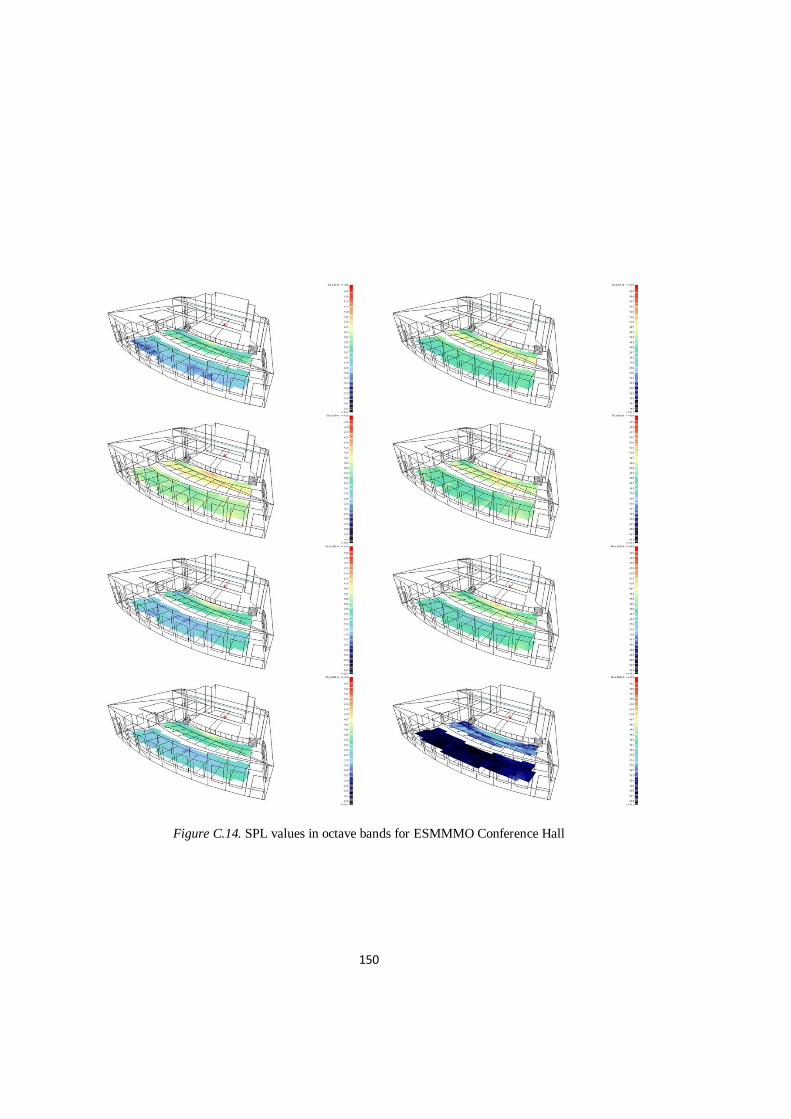
150
Figure C.14. SPL values in octave bands for ESMMMO Conference Hall
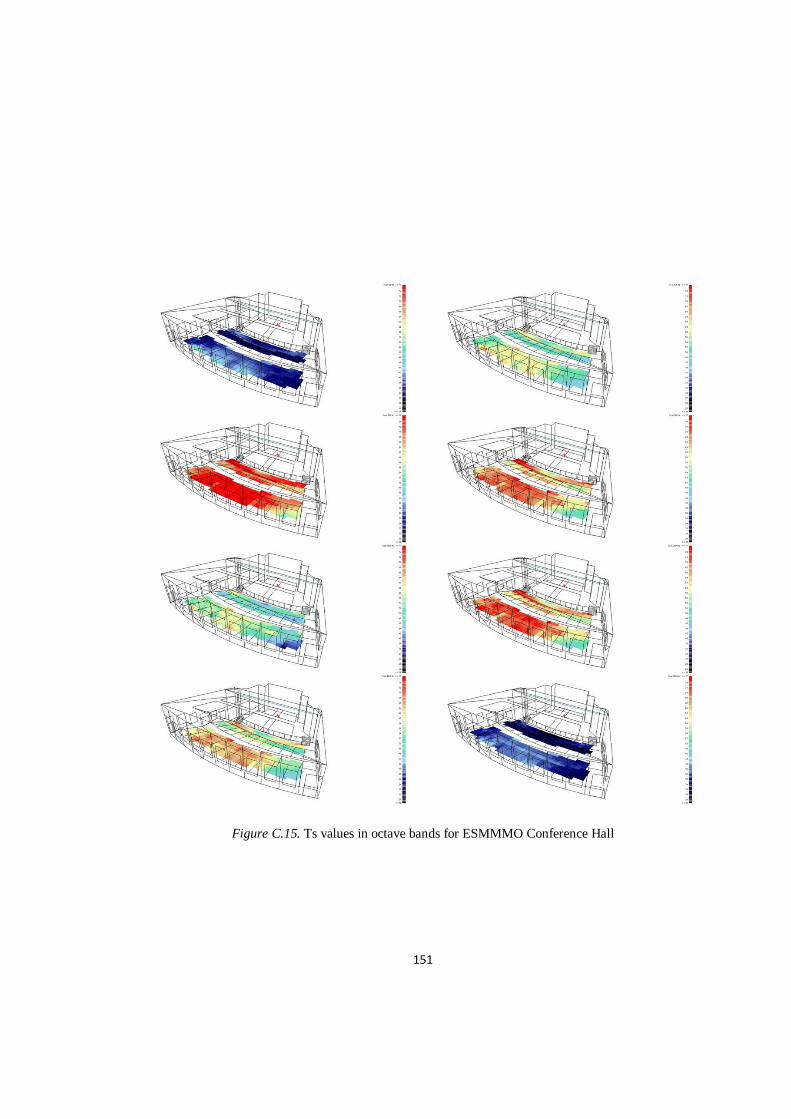
151
Figure C.15. Ts values in octave bands for ESMMMO Conference Hall
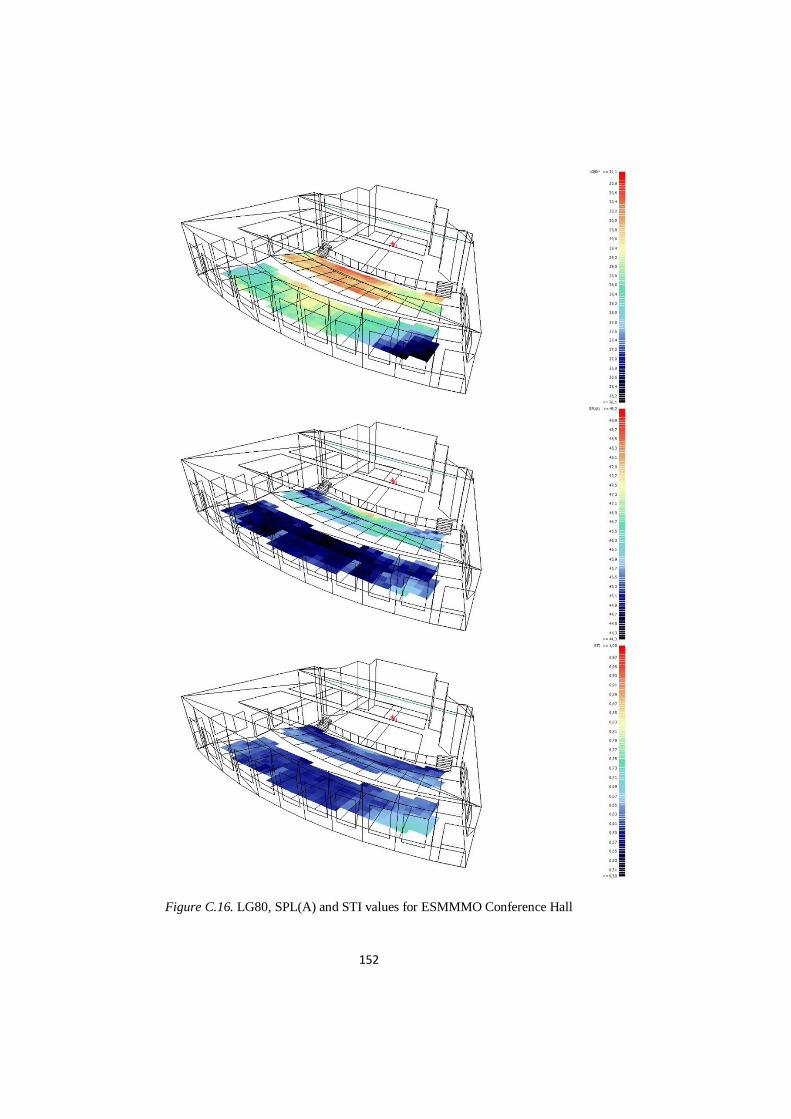
152
Figure C.16. LG80, SPL(A) and STI values for ESMMMO Conference Hall
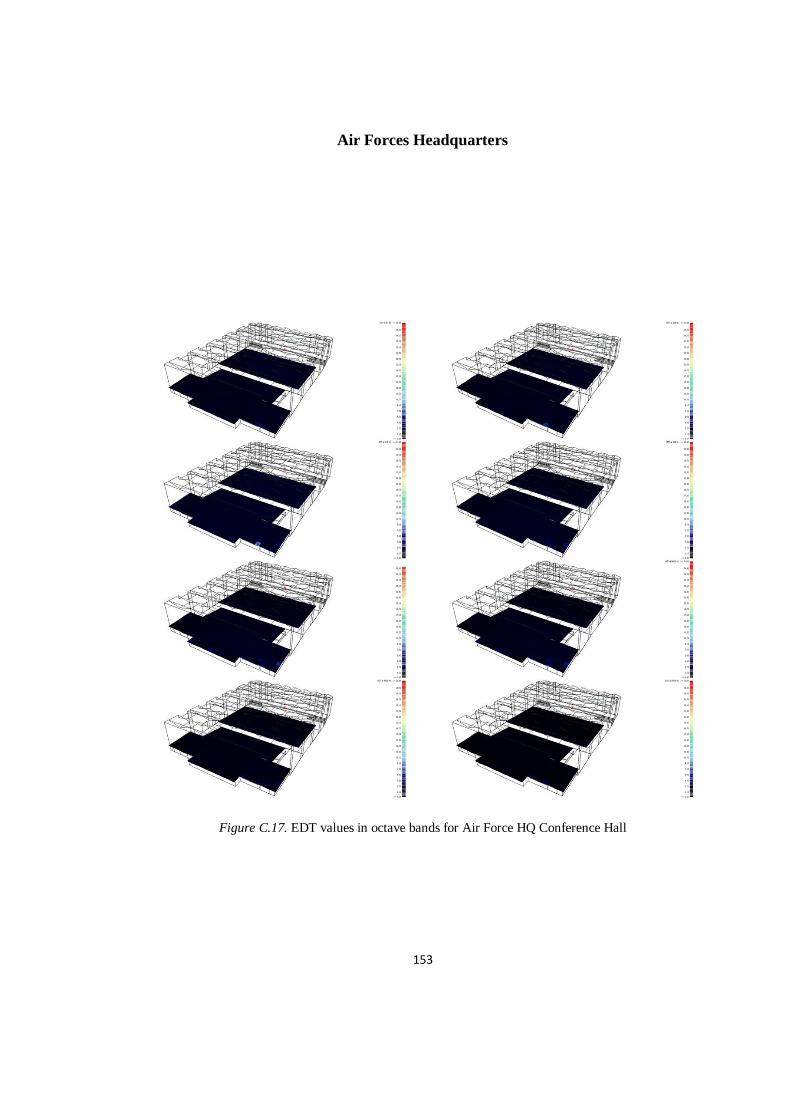
153
Air Forces Headquarters
Figure C.17. EDT values in octave bands for Air Force HQ Conference Hall
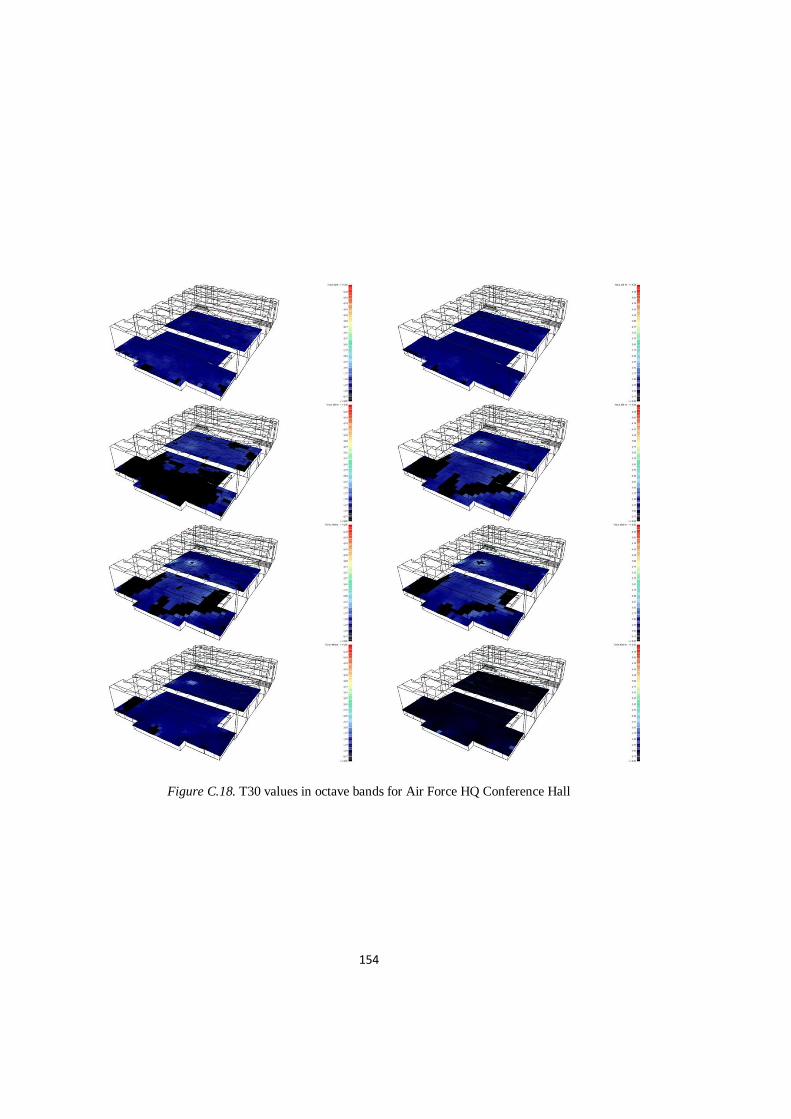
154
Figure C.18. T30 values in octave bands for Air Force HQ Conference Hall
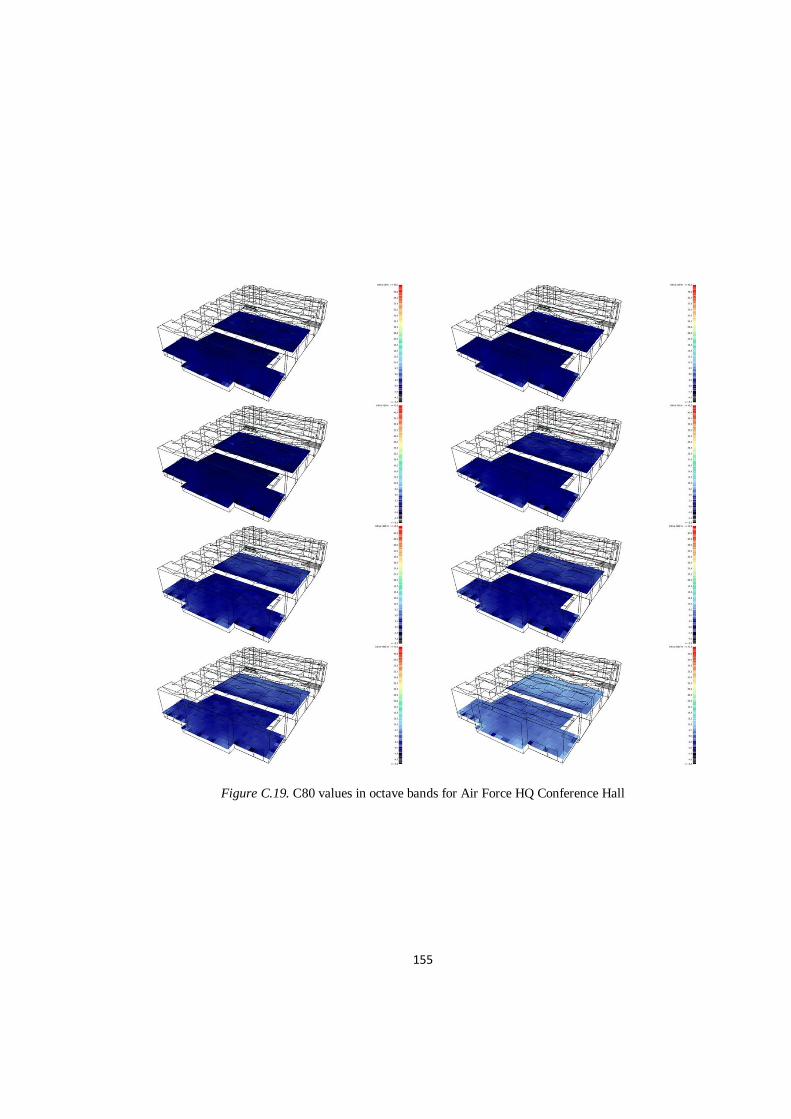
155
Figure C.19. C80 values in octave bands for Air Force HQ Conference Hall
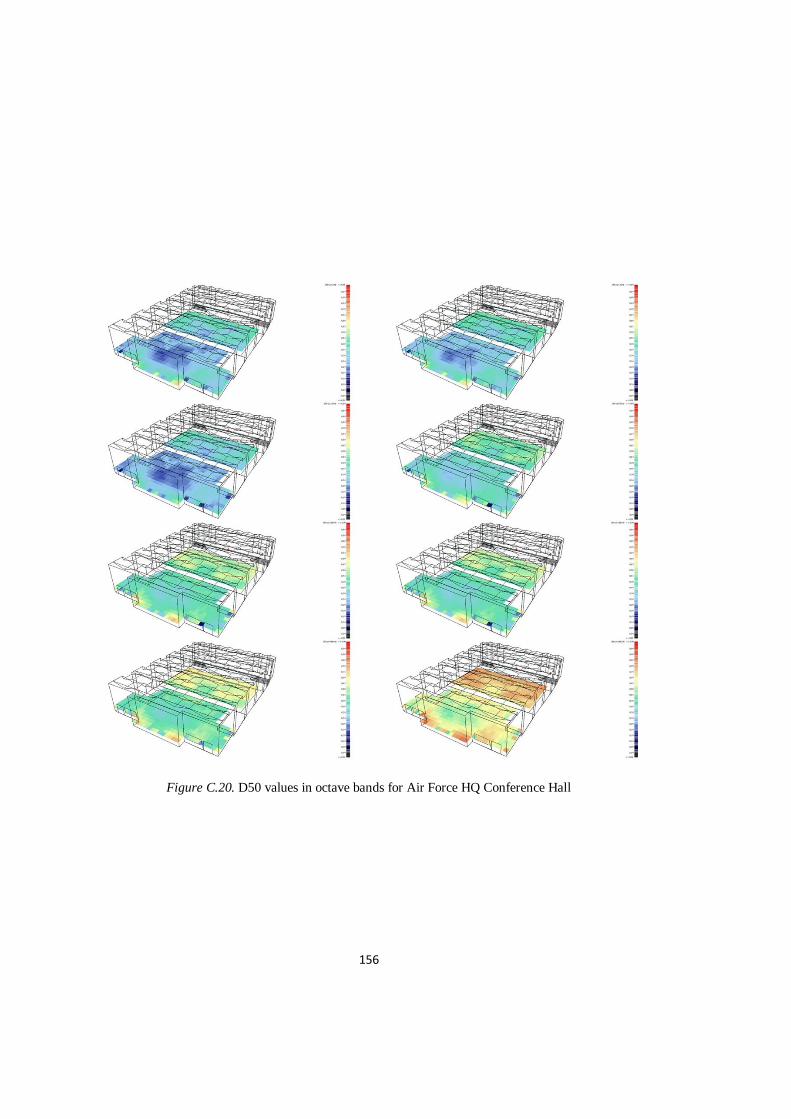
156
Figure C.20. D50 values in octave bands for Air Force HQ Conference Hall
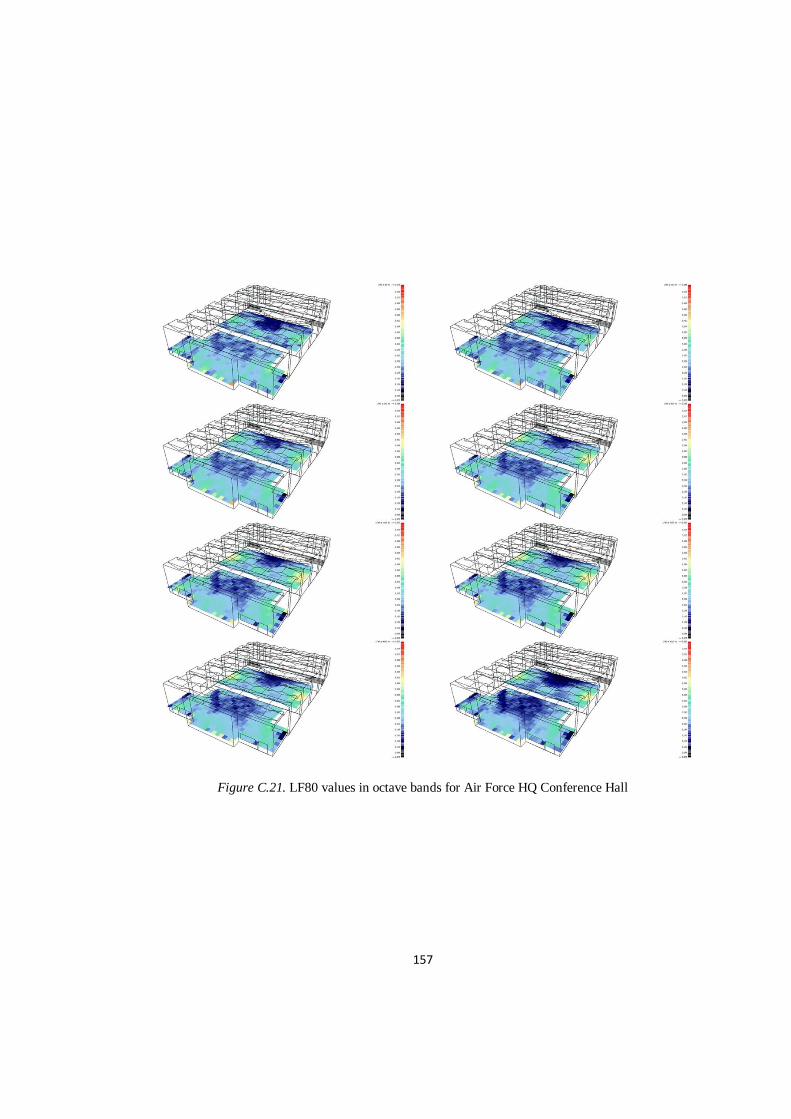
157
Figure C.21. LF80 values in octave bands for Air Force HQ Conference Hall
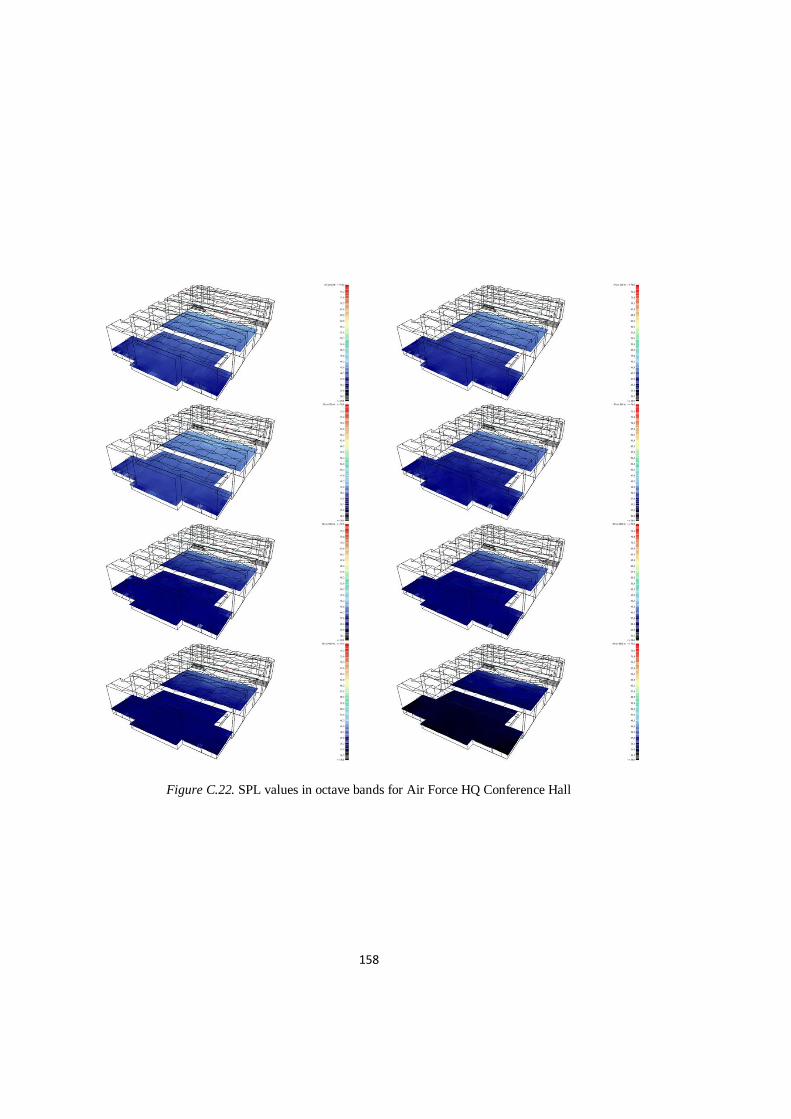
158
Figure C.22. SPL values in octave bands for Air Force HQ Conference Hall
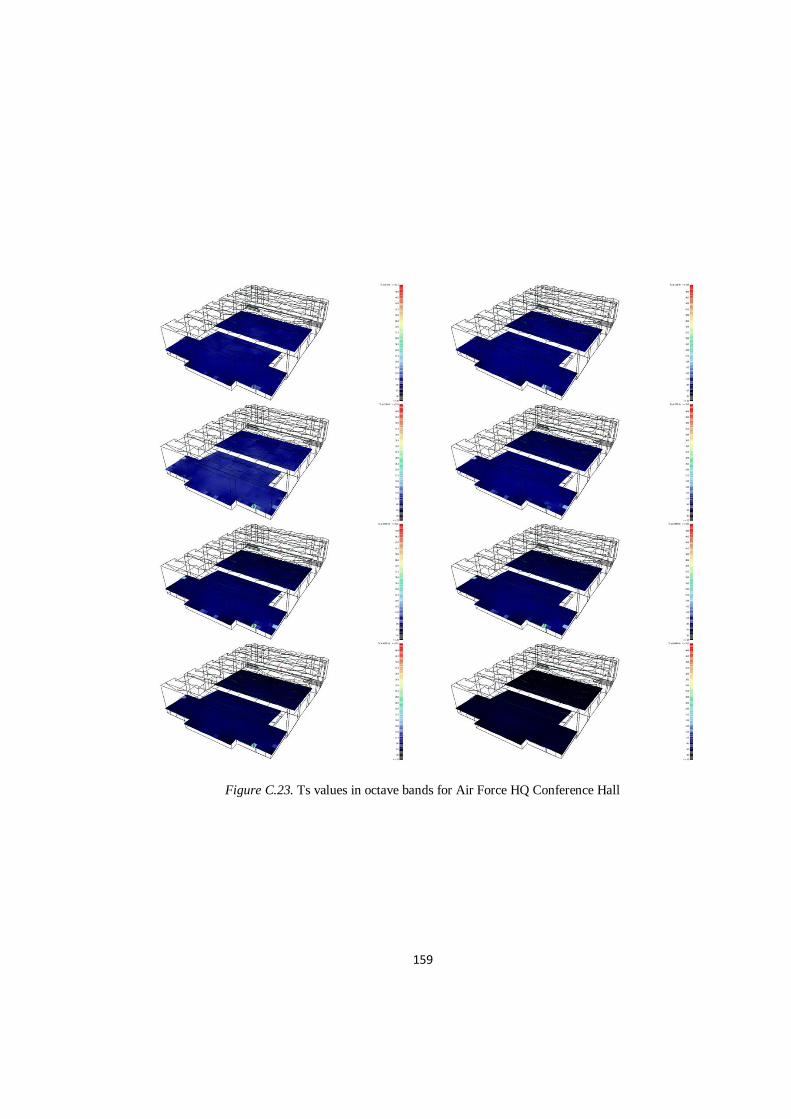
159
Figure C.23. Ts values in octave bands for Air Force HQ Conference Hall

160
Figure C.24. LG80, SPL(A) AND STI values for Air Force HQ Conference Hall

![Design of Optimum Filament Wound Pressure Vessel with ... · Paper: ASAT-16-082-ST Fukunaga et al. [3] presented two methods for determining the optimum shapes of filament-wound domes](https://img.pdfslide.us/doc/110x75/5b4614d07f8b9a114c8b5bf4/design-of-optimum-filament-wound-pressure-vessel-with-paper-asat-16-082-st.jpg)


![Experimental substantiation of acoustic method for determination of “coal … · acoustic methods of mine geophysics [12, 13]. In the present work, the method for determining contact](https://img.pdfslide.us/doc/110x75/5fa6d3539251bb3574619f60/experimental-substantiation-of-acoustic-method-for-determination-of-aoecoal-acoustic.jpg)